gbe factory - guide
DESCRIPTION
GBE Factory partnership is working on the development of the GBE Factory Guide in order to make aware the investors, policy-makers, users, promoters, general public including the energy experts about business models of using technologies for producing energies from RES. We are identifying best technologies and innovative approaches employed in the industries and commercial areas.TRANSCRIPT


GREEN BLUE ENERGY FACTORY
GUIDE
Verona, July 2012

This publication has been developed in the framework of the Project Green Blue Energy Factory,
financed within the Intelligent Energy Europe Programme
(CIP Framework Programme) of the European Commission.
The sole responsibility for the content of this publication lies with the authors.
It does not necessarily reflect the opinion of the European Communities. The European Commission is not responsible for any use that may
be made of the information contained therein.

Coordinator: Unioncamere del Veneto (Italy) Forgreen Spa (Italy)
Clusterland Upper Austria Ltd (Austria) S.O.L.I.D. company for Installation of Solar and Design (Austria)
Bulgarian Industrial Association (Bulgaria) Erato Holding (Bulgaria)
Italian-Slovak Chamber of Commerce (Slovak) NBank (Germany)
Italian Chamber of Commerce for Germany (Germany)

INDEX
GENERAL FOREWORD p. 1
PROJECT FOREWORD p. 3
Executive Summary p. 5
1. Business Models p. 6
1.1. “One by one” p. 6
1.1.1. Solar thermal and solar photovoltaic plant p. 6
1.2. “One by one plus” p. 17
1.2.1. Photovoltaic plant with pipe network to sell energy’s
overproduction to other SMEs p. 19
1.3. “One to many” p. 25
1.3.1. Biomass power plant with pipe network p. 25
1.3.2. Renewable trigeneration based on wood chips or
waste wood p. 36
1.3.3. Biomass energy boiler using wood biomass as fuel and
heat pump using electricity p. 46
1.3.4. Biofuel- biogas CHP plant p. 55

1.4. “Many to one” p. 64
1.4.1. Open self-energy production consortium p.65
2. Best practices: the existing GBE FACTORIES in Europe p. 74
2.1. “One by one” p. 74
2.1.1. KVK Koerner Chemieanlagen GesmbH p. 74
Description of the project
Quick Facts
Design and construction
FIT and additional benefits
Economic Basics
Environmental & Economic Sustainability
Lessons Learnt
2.1.2. Caixa Geral de Depositos p. 80
Description of the project
Quick Facts
Design and construction
FIT and additional benefits
Economic Basics
Environmental & Economic Sustainability
Lessons Learnt
2.1.3. Orgachim p. 86
Description of the project

Quick Facts
Design and construction
FIT and additional benefits
Economic Basics
Environmental & Economic Sustainability
Lessons Learnt
2.1.4. Mega Engineering Ltd. p. 91
Description of the project
Quick Facts
Design and construction
FIT and additional benefits
Economic Basics
Environmental & Economic Sustainability
Lessons Learnt
2.1.5. Ecotherm Project Ltd. P. 99
Description of the project
Quick Facts
Design and construction
FIT and additional benefits
Economic Basics
Environmental & Economic Sustainability
Lessons Learnt

2.1.6. Rodopi Kardjali Plc. p. 107
Description of the project
Quick Facts
Design and construction
FIT and additional benefits
Economic Basics
Environmental & Economic Sustainability
Lessons Learnt
2.1.7. Ebm-papst Mulfingen GmbH & Co. p. 115
Description of the project
Quick Facts
Design and construction
FIT and additional benefits
Economic Basics
Environmental & Economic Sustainability
Lessons Learnt
2.1.8. Solon Corporate Headquarter p. 118
Description of the project
Quick Facts
Design and construction
FIT and additional benefits
Economic Basics
Environmental & Economic Sustainability
Lessons Learnt
2.1.9. SMA Solar Technology AG p. 125
Description of the project
Quick Facts
Design and construction
FIT and additional benefits
Economic Basics
Environmental & Economic Sustainability
Lessons Learnt
2.1.10. Best Western Premier Hotel Victoria p. 131
Description of the project
Quick Facts
Design and construction
FIT and additional benefits
Economic Basics
Environmental & Economic Sustainability
Lessons Learnt
2.1.11. Heineken Brewery p. 139
Description of the project
Quick Facts
Design and construction
FIT and additional benefits

Economic Basics
Environmental & Economic Sustainability
Lessons Learnt
2.1.12. AMS Engineering GmbH p.143
Description of the project
Quick Facts
Design and construction
FIT and additional benefits
Economic Basics
Environmental & Economic Sustainability
Lessons Learnt
2.1.13. Va.lu.va. Srl p. 147
Description of the project
Quick Facts
Design and construction
FIT and additional benefits
Economic Basics
Environmental & Economic Sustainability
Lessons Learnt
2.1.14. Carrera Spa p. 152
Description of the project
Quick Facts

Design and construction
FIT and additional benefits
Economic Basics
Environmental & Economic Sustainability
Lessons Learnt
2.1.15. Johann Pengg AG P. 158
Description of the project
Quick Facts
Design and construction
FIT and additional benefits
Economic Basics
Environmental & Economic Sustainability
Lessons Learnt
2.1.16. Sunny Energy Building P. 162
Description of the project
Quick Facts
Design and construction
FIT and additional benefits
Economic Basics
Environmental & Economic Sustainability
Lessons Learnt
2.1.17. Nuncas Spa P. 168
Description of the project
Quick Facts
Design and construction
FIT and additional benefits
Economic Basics
Environmental & Economic Sustainability
Lessons Learnt
2.1.18. Zerocenter P. 175
Description of the project
Quick Facts
Design and construction
FIT and additional benefits
Economic Basics
Environmental & Economic Sustainability
Lessons Learnt
2.1.19. Schüco Italia P. 183
Description of the project
Quick Facts
Design and construction
FIT and additional benefits
Economic Basics
Environmental & Economic Sustainability

Lessons Learnt
2.2. “One by one plus” P. 189
2.2.1. Sofiyska Voda Ad, City of Sofia P. 189
Description of the project
Quick Facts
Design and construction
FIT and additional benefits
Economic Basics
Environmental & Economic Sustainability
Lessons Learnt
2.2.2. Leiber GmbH P. 196
Description of the project
Quick Facts
Design and construction
FIT and additional benefits
Economic Basics
Environmental & Economic Sustainability
Lessons Learnt
2.2.3. Zimmerei Sieverke GmbH P. 199
Description of the project
Quick Facts
Design and construction

FIT and additional benefits
Economic Basics
Environmental & Economic Sustainability
Lessons Learnt
2.3. “One to many” P. 203
2.3.1. Solar.nahwaerme Energiecontracting GmbH P. 203
Description of the project
Quick Facts
Design and construction
FIT and additional benefits
Economic Basics
Environmental & Economic Sustainability
Lessons Learnt
2.3.2. HTMAS P. 210
Description of the project
Quick Facts
Design and construction
FIT and additional benefits
Economic Basics
Environmental & Economic Sustainability
Lessons Learnt

2.4. “Many to one” P. 213
2.4.1. Paderno Network p. 213
Description of the project
Quick Facts
Design and construction
FIT and additional benefits
Economic Basics
Environmental & Economic Sustainability
Lessons Learnt
3. Market Analysis P. 217
3.1. Austria P. 217
3.2. Bulgaria P. 221
3.3. Germany P. 226
3.4. Italy P. 233
3.5. Slovakia P. 244
Conclusion P. 252
1
GENERAL FOREWORD
Over the last few years, environment has become a priority area for the
European Union.
On 16th December 2008 the European Council published the “Climate
Energy Measures 20-20-20”. These measures are designed to:
- reduce by 20% the emissions of CO2 ;
- increase by 20% the energy saving;
- enhance by 20% the consumption of energy by RES.
In addition the document “EUROPE 2020: A strategy for smart, sustainable
and inclusive growth” states that the fulfillment of these objectives of
energy policy would bring a saving of about 60 billion euros for the gas and
petrol imports by 2020.
Others improvements in the European energy markets integration should
produce an increase of 0,6 - 0,8% of EU GDP. The intention to achieve
around 20% of consumption by RES could create 600.000 new jobs that
would become one million by adding the 20% efficiency target.
This 20-20-20 Strategy is the beginning of a plan to rationalize electrical
consumption and to reduce CO2 emissions. In 1997, in fact, the European
Commission published the “White book” about new policies to increase the
percentage of RES’s use by up to 12% of the total energy mix amount.
As of now this strategy is the first element that will produce economic
growth.
Often we hear about the miraculous “Green Economy”.

2
“Greening the economy” means mainstreaming practices that use energy
efficiently. It also means developing renewable, sustainable sources of
energy. In a green economy, renewable energy is easy to access and
technology can be powered by these new sources. Setting up entire systems
based on new energy sources requires significant time and outlay. But once
this infrastructure is in place, a green economy will save money year after
year, illustrating why it's a wise and forward thinking idea for countries to
start the greening process now.
It is well known that a wide range of technologies and methods exist to
improve energy efficiency, turn renewables into viable energy sources and
reduce emissions. However, market conditions prevent them from reaching
their full potential: for this reason the contribution of the European’s
project is very important. Indeed the plans allow us to promote energy
efficiency and encourage the rational use of energy sources, increasing the
use of new and renewable energy sources as well as encouraging energy
diversification and stimulating energy efficiency and renewables.

3
PROJECT FOREWORD
The project GREEN BLUE ENERGY FACTORY promotes the installation of
industrial and commercial buildings with single or combined renewable
energy sources, able to provide electricity and heating and cooling for the
air conditioning of premises, and/or for the business activities taking place
within.
GBE FACTORY will represent the transition from fossil fuel warehouses to
second generation industrial or commercial buildings. Many residential
buildings are already equipped with new technologies which allow for
electricity and heating/cooling without the use of fossil fuels. Now the time
has come to extend this trend to the industrial sectors, starting from the
countries of the project’s partners (public bodies, organizations and ESCOs
from Italy, Germany, Austria, Slovakia and Bulgaria), and aiming at
extending the project’s effects to the rest of the EU. A GBE Factory can be a
single industrial or commercial building working with “zero carbon
emissions”, or one or more buildings equipped with plants producing
renewable energy, which can be distributed to the surrounding companies
in the same industrial or commercial area. In this way, abandoned
industrial or commercial buildings can become local plants for the
production of renewable energy, favouring new business and employment.
With this vision, the project will help companies to identify investment
plans integrating renewable energies with their productive activities, with
the aim of making direct profit through the existing RES financial support
schemes, and indirect profit through the reduction of electricity and

4
heating/cooling costs as well as through the increase in value of the re-
used industrial/commercial sites.
To increase interest in this field, the project has identified business models
and best practices from all over Europe. The most advanced ones will be
promoted through the spread of information. Indeed, the project will
support the development of organizations which will make GBE FACTORY
their Business Model and will enhance the framework policy and financial
conditions.
The forms of intervention will be RES installation in existing, re-used or
newly built industrial or commercial warehouses, which display also good
energy saving features. GBE FACTORY dedicated buildings will pursue the
maximization of efficiency and effectiveness of the investments, optimizing
the combination of RES technologies and their integration, achieving
economies of scale. In this way GBE FACTORIES can not only be self-
sufficient industrial/commercial energy buildings, leading to zero
emissions, but also real RES generation plants, that can share renewable
electricity and thermal energy with the surrounding industrial or
commercial area.

5
EXECUTIVE SUMMARY
To make this work useful for a practical understanding of the advantages
of RES use in industrial and commercial warehouses or factories, we have
brought together existing cases in Europe that we’ve called “Best
practices”.
Obviously, different countries mean different BEST PRACTICES since
different primary materials suit different geographic areas.
On the basis of partner’s technical skills and of the examples, four types of
GBE FACTORY BUSINESS MODELS can be replicated all over Europe have
been identified, in spite of differences between countries.
This Guide will show, in the easiest way possible, different business models
matching them with practical examples. Of course existing cases may not
have all the elements described as components of the pure business
models.
The aim of the project is not only to show how others have integrated RES
technologies in their commercial or industrial activity, but also to stimulate
the economic and environmental opportunities for an upgrade.
The publication is divided in two sections:
1. BUSINESS MODELS, where four typologies of business models are
described;
2. BEST PRACTICES, where we have matched best practices with the
business model in order to demonstrate a practical idea about the
possible implementation of such Business Models.

6
1. BUSINESS MODELS
1.1. “One by one”
THE GBE FACTORY IS LOCATED INTO THE FIRM SATISFYING THE
FIRM’S ENERGY NEEDS
1.1.1. Solar thermal and solar photovoltaic plants
Executive Summary
This simple business model investigates the possibility of achieving
sustainable supply of cooling, heat and power for a company or SME
through a solar thermal and/or solar photovoltaic plant. According to this
Business Models, an ESCO sets up a RES plant, which sells the generated
energy to the SME. The RES plant is located in the same building, which

7
becomes a GBE Factory. Through the GBE factory energy costs will be
saved. Surplus energy can be sold back to the grid.
Quick Facts
GBE FACTORY MODEL
On the roof or free surfaces of a SME building a solar thermal and/or
photovoltaic plant is built. The generated RES energy (heat/cooling/power)
partially covers the local energy demand.
TYPE OF INVESTMENTS
A Solar thermal and/or solar photovoltaic plant provides heat, cooling and
power to meet the needs of heating, cooling and power demand of a
company/SME.
CUSTOMERS AND TARGET GROUPS
The main target groups are the owners of companies and SMEs with
suitable areas for the installation of solar panels, particularly in urban
Centers (usually only roofs available). The entrepreneur should have strong
demand for air conditioning and heating (e.g. for a shopping Centre, large
office building, chemical storage warehouse, agrifood company, etc.) with
particularly high energy costs.
RANGE OF THE EXPECTED ECONOMIC INDICATORS (creating and running
the GBE FACTORY investment)
EBIT: 54 % (in the 5th year)
8
EBITDA: 89% (in the 5th year)
ROI: 36.3% (after 25 years)
ROE: 120% (after 25 years)
IRR: 13.5 % (after 25 years)
REFERENCES
• http://www.solid.at
• http://www.biosolesco.org
Strategic Vision at the base of the investment
The GBE factory covers a substantial part of the energy consumption of
the building. The investment cost and energy price for the customer will be
lower compared to conventional energy systems.
The value perceived (by the users)
The company/SME can benefit from an increased independence from
fossil fuels, greater security of energy supply and lower energy prices
which are based on a performance guarantee contract. In addition, the
company can reinforce its corporate image selling a new environmentally-
friendly face.
Key Activities, Key Partners, Key Resources
The main key activities are:
• Inquiry of an operating ESCOs in the field of solar energy;
• Energy Audit of the building;

9
• Scaling of the system;
• Preparation of a business plan;
• Contract signature between ESCO and company/SME.
KEY PARTNERS GENERALLY ARE: the company/SME owner and the ESCO
KEY RESOURCES FOR FINANCING ARE:
• ESCO;
• Company/SME;
• Bank institutions or private Investors.
Customers and target groups
The main customer is the owner of the company/SME.
The company/SME should have:
• A long-term location solution;
• Specific data in regard to energy consumption;
• An ongoing expensive energy supply;
• Obsolete H/C system;
• Suitable areas for the collector field;
Operation
The solar thermal plant should not be oversized, which would result in a
stagnation of the system. Therefore, the design criterion is the summer
load of the building. It will produce heating and cooling.

10
The solar thermal cooling plant (incl. absorption chiller) works more
efficiently when it covers the base cooling load of the building (investment
compared with the output). The peak of solar radiation and the peak
demand of cooling match perfectly and save electricity. Through an
intelligent storage management with heat and cold storage, the solar
percentage could be increased significantly.
In the autumn, spring and winter cooling is not necessary but due to the
solar thermal system it will be possible to cover a high portion of the
required heat (DHW, reheating, etc.) of the building.
The photovoltaic plant is able to provide a significant proportion of
electricity.
After the commissioning phase the plant runs independently and is
controlled via online monitoring.
If there is not 100% RES coverage possible, a centralized or decentralized
back up source is necessary.
Cost structure ratios
The main operating costs are electricity (for the operating of pumps and
heat rejection of the chiller) and the maintenance of the system, attention
should be given to the following points:
1. Through the selection of different components high attention to
quality has to be paid, in order to ensure an error-free and
profitable operation;
2. The engineering has to be done by an experienced company;
3. Insurance costs must be considered;

11
4. Ordinary and extraordinary maintenance costs must be
considered;
5. Control and monitoring costs must be considered;
6. Costs of administration and management must be considered.
In the following graph, you can see the price trend of electricity in Europe:
Price trend of European electricity prices €/MWh
As demonstrated in the chart above, electricity has had a strong price
increase over the few last years. This plant saves (through solar cooling)
and produces (PV) electricity. The consumption of H/C in an office building
is approx. 50%.

12
Revenue Stream
SOURCES
From RES energy sales:
• Thermal energy supply (variable income depending on heat
production -> climate conditions);
• Refrigeration energy supply (variable income depending on heat
production -> climate conditions);
• Generated electricity can be feed into the public grid or sold to
the SME (variable income depending on climate conditions).
From peak reduction
• By reducing the thermal (if connected with a district heating grid)
and electrical peak demand, the charge for the connection power
can be reduced.
From RES incentivizing system:
• RES incentives are recognized by state environment and energy
authorities or related organizations (Green certificates or FIT,
usually defined in advance for a fixed number of years);

13
• Different public grants.
From company/SME status
• In case of an early termination of the performance guarantee
contract (the company/SME should sign safety measures.
Therefore, for variety of costs (reinstallation of the system, loss of
profit, etc.) a deposit of app. 30% of the investment is paid by the
company/SME. This charge will be returned in the form of lower
energy prices or at a future maturity date.
Investment model and financial structure
The main investments are:
• Solar thermal, solar cooling and PV plant;
• Additionally required technical parts to feed into the distribution
system;
Principal operating costs will include:
• Electricity;
• The remote controlled supply system;
• The maintenance service;
The solar thermal, solar cooling and PV plant are owned by the GBE
factory, through an energy service company (ESCO).
For the distribution system the company/SME is responsible. The
renewable energy must be fed primarily into the distribution system. A
minimum energy demand of the SMEs has to be stipulated in the contract.
In case of decreasing this minimum energy demand, the company/SME has

14
to pay a penalty to compensate for the decreased energy supply. On the
other hand the ESCO ensures a minimum of energy supply.
The project is funded by the ESCO, with approx. 30 % deposit from the
company/SME.
The investment is carried out by a financial institution or investor through
the ESCO.
Equity from the ESCO
The ESCO is responsible for the construction and operation of the plant.
The repayment of the investment is possible through the monthly
consumption charge of the SME.
It is desirable that the engineering, procurement and construction
companies have shares of the ESCO (Investors). This should/can achieve
better efforts in the planning, construction and operational phase.

15
ESCO Barriers:
• Size limitation of solar plants;
• Low energy price of conventional energy sources;
• Public procurement;
• Lack of trust in energy savings/supply;
• No qualified staff for operation and maintenance (O&M) training;
• Late detected faults in the solar plant;
Business Plan main indicators
From the study of the main aspects of a business plan applied to this type
of GBE FACTORY, one should consider:
1. Economic gain;
2. Positive SWOT analysis;
3. Environmental benefits;
4. Safety with advanced technology;
5. Legal framework;
6. Authorization process;
7. Expertise of the people involved;
8. Support of key-stakeholders;
9. Social benefits;
10. Tax framework.
The economic indicators below are predicted:
EBIT: 54 % (in the 5th year)
EBITDA: 89% (in the 5th year)

16
ROI: 36.3% (after 25 years)
ROE: 120% (after 25 years)
IRR: 13.5 % (after 25 years)
Environmental and economic sustainability
Solar plants (thermal and PV) are one of the most environmentally friendly
RES. The installation on roofs prevents the spoiling of valuable ground
areas. This RES system saves or generates valuable energy avoiding the use
of fossil fuels (electricity, gas, oil, etc.).
The solar fraction of the total energy needs depends on the base load of
the building and available areas for the erection of the solar plant. Because
of intelligent management storage of cold and heat the solar fraction can
be increased significantly.
The main sustainability from an economic point of view is a predictable
constant energy supply and cost savings for the future.
This can be achieved by:
• State-of-the-art design, implementation and maintenance from
one hand-long life time of the solar plant of app. 25 years;
• Financing by experienced partners;
• Cost effectiveness by short pay-back time, positive cash flow,
stable energy rates, low operating cost; reliable product quality;
• Precise invoicing of produced heat (heat meter);
• Guaranteed energy supply and monitoring of savings;
• Training program for local partners (O&M).

17
Furthermore, it is possible for companies/SMEs to stay more competitive
through greater independence from energy supply and energy cost
savings.
To be able to ensure economic sustainability, a long-term performance
guarantee of supply contract and a safe financing scheme can be signed.

18
1.2. “One by one plus”
THE GBE FACTORY IS LOCATED IN THE BUSINESS SATISFYING THE
BUSINESS ENERGY NEEDS AND SELLING OUT THE SURPLUS
In this particular situation the GBE FIRM not only satisfies its own energy needs but also has an overproduction that could be sold back to the grid, if there isn’t any kind of pipe-network. This model is interesting because it could be used in particular areas where, for many reasons there isn’t gas or a distribution network that provides sufficient energy for local energy and H/C needs.

19
1.2.1. Photovoltaic plant with pipe network
Executive Summary
This simple business model investigates the possibility of achieving
sustainable electricity supply not only for one single company through a
photovoltaic plant, but also for others nearby SMEs. According to this
Business Model, an EPC&M contractor sets up a PV plant, which sells the
generated energy to the SME. In addiction you could install a pipe network
to connect to other SMEs. In this way, overproduction of energy can be
sold to the grid or onto other SMEs.
Quick Facts
GBE FACTORY MODEL
The RES plant is located in the same building, which therefore becomes a
GBE Factory. Through the GBE factory energy costs will be saved. Surplus
energy is sold back to the grid or used by other SMEs located close to the
GBE Factory and connected by a pipe network.
TYPE OF INVESTMENTS
First, a photovoltaic plant provides energy to meet the needs of power
demand of a company/SME. Besides, energy overproduced can be sold to
the grid or, if a pipe network exists, can be sold to other SMEs nearby.
CUSTOMERS AND TARGET GROUPS
The principal target groups are the owners of companies and SMEs with
suitable space for the installation of solar panels, particularly in industrial

20
areas. It could be simply connected to all SMEs in the same area as the GBE
Factory.
RANGE OF THE EXPECTED ECONOMIC INDICATORS (creating and running
the GBE FACTORY investment)
EBIT: 42 % (in the 5th year)
EBITDA: 72% (in the 5th year)
ROI: 23% (after 25 years)
ROE: 105% (after 25 years)
IRR: 7% (after 25 years)
REFERENCES
http://www.forgreen.it
Strategic Vision at the base of the investment
The GBE factory covers all the required energy consumption of the
building. Furthermore eventually energy surplus isn’t lost but is sold to the
grid or used by others connected to the SMEs.
The value perceived (by the users)
Companies/SMEs involved, can benefit from an increased independence
from fossil fuels, greater security of energy supply and lower energy prices.
In addition, this type of investment can reinforce the environmentally-
friendly image of single SMEs.

21
Key Activities, Key Partners, Key Resources
THE MAIN KEY ACTIVITIES ARE:
• Energy Audit of buildings;
• Arrangement of the system and eventually the pipe network;
• Preparation of a business plan;
• Contract signature between EPC&M contractor and
company/SME;
• Plant and pipe network’s installation.
KEY PARTNERS GENERALLY ARE: the company/SME owner, EPC&M
contractor and others SMEs
KEY RESOURCES FOR FINANCING ARE:
• Companies/SMEs
• Bank institutions or private Investors
Customers and target groups
The main customer the company/SME that become GBE Factory. Others
stakeholders are SMEs connected with the pipe network.
The company/SME that become GBE Factory should have:
• A long-term location solution;
• Specific data in regard to its energy consumption;
• Suitable areas for the collector field.
Others Companies that buy energy should have:
• A long-term location solution;
• Specific data in regard to their energy consumption;

22
• Pipe line network;
• High energy needs.
Operation
The photovoltaic plant is able to provide all the electricity need of the GBE
Factory and also for others SME nearby.
After the commissioning phase the plant runs independently and is
controlled via online monitoring.
Cost structure ratios
The main operating cost is the maintenance of the system. Attention
should be paid to the following points:
1. Through the selection of different components high attention to
quality has to be paid, in order to ensure an trouble-free and
profitable operation;
2. The engineering has to be done by an experienced company.
3. Insurance costs need to be taken into account;
4. Ordinary and extraordinary maintenance costs must be
considered;
5. Control and monitoring costs must be considered;
6. Costs of administration and management must be considered.
Revenue Stream
REVENUE SOURCES ARE:
• From cost energy saving;

23
• From RES energy sales (to the grid or to connected SMEs);
• From RES incentivizing system.
Investment model and financial structure
The main investments are:
• PV plant;
• Pipe network;
• Additionally required technical parts to feed into the distribution
system.
Principal operating costs will include:
• Electricity;
• The remote controlled supply system;
• The maintenance service.
The EPC&M contractor can be responsible for the construction and
operation of the plant. The repayment of the investment is possible
through the monthly consumption both of the GBE Factory and others
SMEs nearby (or from sales to the grid).
Business Plan main indicators
From the study of the main aspects of a business plan applied to this type
of GBE FACTORY, one should consider:
1. Economic gain;
2. Positive SWOT analysis;
3. Environmental benefits;
4. Safety with advanced technology;
24
5. Legal framework;
6. Authorization process;
7. Expertise of the people involved;
8. Support of key-stakeholders;
9. Social benefits;
10. Tax framework.
Environmental and economic sustainability
Photovoltaic plants are one of the most environmentally friendly RES. The
installation on roofs prevents the waste of valuable ground areas. This RES
system saves or generates valuable energy avoiding the use of fossil fuels
(electricity, gas, oil, etc.).
The main sustainability from an economic point of view is a predictable
and constant energy supply, cost savings for the future and revenue from
excess energy produced.
To be able to ensure economic sustainability, a long-term performance
guarantee supply contract and a secure financing scheme can be signed.

25
1.3. “One to many”
A GBE FACTORY IS LOCATED IN AN INDUSTRIAL AREA AND SUPPLIES TO
VARIOUS FIRMS HEATING/COOLING AND ELECTRICITY
1.3.1. Biomass power plant with pipe network
Executive Summary
The business model foresees a biomass energy fully completed project
cycle utilization for customers in residential, public and industrial sectors.
In the industrial sector the proposed business model provides for a
consortium among users, production, engineering and logistic companies,
designers, suppliers, subcontractors and ESCO companies.
26
Quick Facts
GBE FACTORY MODEL
Industrial buildings are supplied with thermal energy by biomass energy
facilities which are built on user’s sites or in the area near to the
customers. The ESCO uses highly efficient and quality technologies such as
automatic biomass boilers and auxiliary process equipment, wood
chippers, specialized trucks for biomass logistic, subcontractors and
servicing companies.
TYPE OF INVESTMENTS
Investments in a Biomass power plant (BPP) construction and pipe network
to satisfy the complete actual heating and domestic hot water (DHW) need
of a group of industrial buildings.
CUSTOMERS AND TARGET GROUPS
The main target customer groups are the owners of the following industrial
facilities: SME’s, industrial warehouses, Logistic centers, Shopping Centers,
Greenhouses and Hotels
The main target groups are:
• ESCOs;
• Public sector-central, regional and local levels;
• Public Housing companies/Associations;
• Manufacturers and installers in the biomass industry;
• Entrepreneurs;
• Energy agencies;

27
• Utilities.
Strategic Vision at the base of the investment
BPP construction using renewable energy in the type of wood biomass for
heating and DHW supplying of a group of industrial buildings at attractive
prices and high quality service level, in comparison with the existing
conventional solutions for heating and DHW (project base line). Specific
objectives of the business model implementation:
• Support the transfer and adoption of technology and/or know-
how, technology upgrading, the development of research facilities
and the updating of the facilities;
• Investment in the upgrading of production technology and
equipment;
• Raises the ability of Small and Medium Enterprises to cope with
competitive pressure within the European market;
• Improving the working conditions of the employers in industrial
buildings;
• Significant decrease of energy carriers costs for industrial sectors;
• Sustainable growth established;
• Reduction of GHG emission and environmental impact.
The value perceived (by users)
By virtue of modern investment, high productivity and value added to the
enterprises would be achieved, and the owners’ factory would be fully
competitive in relation to other EU companies and be capable of providing

28
sustainable future growth. Providing the enterprises with the opportunity
to use high efficiency, environment-friendly products and technologies for
the generation of thermal energy, through the utilization of wood biomass
at attractive prices. Increasing productivity and high level of
competitiveness according to EU requirements are also to be anticipated.
Ecological advantages of production by the use of green energy are
achieved.
Key Activities, Key Partners, Key Resources
The main KEY ACTIVITIES for the business model implementation are as
follows:
• Biomass collection;
• Production of Chips & Pellets machinery;
• Production of Biomass Boilers and Process Equipment;
• Biomass Fuel Production & Logistics;
• Biomass Information Centers and CHSM;
• Biomass Energy Efficiency Projects Implementation.
The main KEY PARTNERS are: owners, commercial banks, funds,
subcontractors, independent experts and clusters.
KEY RESOURCES ARE:
• Timber industry;
• State forestry;
• Private forestry owner co-operation;

29
• Municipalities owners of forestry;
• Woodworking enterprises.
Customers and target group
ESCO KEY ACTIVITIES
The main ESCO activities are:
• An energy audit – to establish the potential for saving energy;
• A detailed investigation of the energy to set the base for the
projections, the current consumption of energy and the base
scenario for one process, one building or a group of buildings;
• The preparation of a project task;
• Finding a technical solution and creating a working project;
• Securing the financing of the project;
• Setting up the systems and the realization of complete
engineering;
• Full preparation of the site “to the key”;
• Training of the customer’s personnel on the use and maintenance
of the appliances;
• Maintenance of the installation for the period of the contract’s
validity;
• Monitoring and comparison with the purpose of calculating the
actual savings compared to the initial energy consumption and
the base scenario.
The proposed business model has compliance with National and EU
environmental, health and safety standards and norms.

30
Operation
It is very important during the project implementation in the industry and
after its completion to have good collaboration between the ESCo and the
business partners such as owners, subcontractors, suppliers, local
authorities, installers, service organizations, designers and biomass and
logistic companies.
The proposed business model uses clean technology using the wood
biomass combustion for thermal energy generation in the industrial
sectors. In many cases the project includes replacement of the existing
light fuel oil and diesel fuel consumption for heating and domestic hot
water with ecologically, cheaply and easily available wood biomass fuel.
The implemented supply system for heating and domestic hot water has to
be completely controlled. In the beginning of the project an energy audit,
business plan including risks and sensitivity analyses and SWOT analyses
has to be prepared.
In defining the project results, the annual quantity of thermal energy used
for heating per consumer is calculated. A balance of the wood biomass
quantities is made and the quantity of thermal energy produced by the
boilers is defined. The influence of boilers efficiency on the wood biomass
combustion process has also to be considered. The electricity consumption
of the boiler’s own needs, operational and maintenance costs is not taken
into account.
The ESCO should do monitoring and verification of the expected results
and control of the investment and project schedule and in some cases to
change parameters in order to achieve high performance.
31
Cost structure ratios
The main operational and maintenance costs are due to the wood biomass
production and its logistics, servicing of the energy facilities, salary costs of
the operational personnel and electricity costs for the boiler plants own
requirements.
The cost structure has the following characteristics:
1. The planned cost for wood biomass based on mid to long term
supply contracts including biomass logistics, in order to manage
and control the biomass supply chain;
2. Contracted agreements with designers, subcontractors and
suppliers for the different stages of project implementation;
3. The costs for acquiring long-term tangible assets;
4. Costs for system and equipment insurance;
5. Maintenance costs (plant and network);
6. Costs for electricity for own needs;
7. Safety costs;
8. Costs for purchasing spare parts;
9. Monitoring and control costs;
10. Transportation, office maintenance and account servicing costs;
11. The costs for training and equipping of the operational personnel;
12. Service staff salaries cost.
The allocation annual operation and maintenance cost for the example
biomass power plant is shown below.

32
Revenue Stream
The project revenues include the following sources:
1. Thermal energy sold to customers:
• Income from selling of thermal energy. It is dependent upon
the thermal energy consumption;
• Fixed price for thermal energy and effective and controlled O
& M Costs.
2. Selling of GHG emissions reductions:
Income from selling of CO2 emissions. Is dependent on the quantities of
the saved conventional fuels and methods for calculation of the reduced
emissions.
Investment model and financial structure
The following investment and financial models are used:
1. Energy Performance Contracting (EPC)
It is a contract scheme between three partners:
• ESCO;
• the Customer;
• Financial Institution - Bank.
The Customer is required to pay the project costs as typically, it borrows
from a third party, which more often than not is a bank or a leasing
company and due to the energy savings guaranteed by the ESCO, repays
the cost of the borrowed capital. The ESCO undertakes responsibility for
ensuring a minimum energy saving and if a certain minimum level turns
out to be exceeded by the Customer, then the former compensates the
33
latter for the surplus margin. In case the opposite happens, i.e., the
Customer additional extra economies in comparison with the initial
projections, then it pays to the ESCO the sum of the difference. Thus, the
ESCO takes on the risks relating to the project fulfillment instead of the
Customer. However the funding institution evaluates the credit risk with
the Customer. This type of Contract is appropriate for Customers, which
have greater opportunities to borrow than the ESCO.
2. Energy Contracting (EC)
These Contracts have two parties:
• Company for energy services (the Investor);
• Customer.
The investor funds the project implementation and the customer repays it
by means of monthly installments, which includes the cost of the
consumed energy. This energy is measured through certified equipment.
Once the purchasing price is repaid, the customer owns the contracted
equipment.
Software tools are available in the following areas:
• Solar and Biomass plants simulation and monitoring –evaluation;
• Economic evaluation tools;
• Flexible optimization tools.
ESCO managed measurement and verification activities typically apply to
small scale energy service contract projects. The ESCO and participant will
often enter into contractual agreements that include expected energy

34
savings, how savings are to be measured, who is responsible for short-
term and long-term project management, and compensation procedures.
These projects may have long development and construction cycles.
Business Plan main indicators
The main technical, judicial, financial and environmental indicators in the
business plan applied to the proposed business model are as follows:
1. Proven technical solutions, know-how and advanced technology;
2. Mid to long term agreement with key participants;
3. Net economic profit;
4. Rational SWOT analysis;
5. Finance plan;
6. Project cash flow analysis;
7. Ecological benefits;
8. Risk and sensitivity analysis,
9. Legal requirements;
10. Completed authorization cycle;
11. Compliance with National and EU environmental, health and
safety standards and norms;
12. Actual project calendar schedule;
13. Proven social benefits.
The main performance economic indicators that are generally to be
expected:
EBIT: > 25%

35
EBITDA: > 22%
IRR: > 15%
PBP: up to 5 year
Environmental and economic sustainability
The ESCO Business model includes establishing and managing of
Consolidation centers for the validation of GHG emissions. The
implementation of biomass energy projects will lead to a significant
reduction of greenhouse gas emissions.
The protocol of Kyoto and new EU emissions rules have created a market
in which companies and governments that reduce GHG gas levels can sell
the resulting emissions credits. These can be purchased by businesses and
governments by developing biomass energy projects
Determination of the annual emissions of CO2 and other harmful gases is
according to the Commission decision of 21.01.2004 establishing
guidelines for the monitoring and reporting of Greenhouse gas emissions
pursuant to Directive 2003/87/EC of the European Parliament and of the
Council. The emissions factors extolled by the MOEW (Methodology for
calculation of emissions of noxious substances (pollutants) released into
the environment based on balance methods) have been used for the CO2
emissions assessment.
The calculation of the emissions of CO2 and other noxious substances are
based on the following assumptions:
• The emissions from biomass combustion are zero;

36
• The decrease of harmful gas emissions equals the emissions,
obtained from the combustion of an alternative fuel (electricity,
heavy fuel oil, light fuel oil);
• The increase of harmful gases emissions is due to transportation
costs, which emit gases when light fuel oil is used;
• The increase of harmful gases emissions is also due to electricity
usage for the needs of the boiler facilities.
The economic sustainability is expected through utilizing of potential
resources to best advantages.
These resources can be efficient and responsible, and are likely to provide
long-term benefits. In the case of this business model, economic
sustainability leads to rational using of resources so that the business
model continues to function over a number of years, while consistently
returning a profit.

37
1.3.2. Renewable trigeneration based on wood chips or waste wood
Executive Summary
This business model shows a possibility of sustainable supply of cooling,
heating and power to an industry area through a trigeneration [CCHP
(combined cooling, heat and power)] plant, based on biomass (woodchips
and/or waste wood). Local different SMEs set up together a GBE factory,
and use the generated energy in their company buildings.
Quick Facts
GBE FACTORY MODEL
For an industrial area a trigeneration plant based on wood (wood chips &
waste wood) is established. It supplies RES energy to enterprises of the
industrial area.
TYPE OF INVESTMENTS
Renewable trigeneration power plants (woodchips and/or waste wood) to
meet the needs (complete or partial) of heating and cooling of a cluster of
industrial buildings in an industry area.
CUSTOMERS AND TARGET GROUPS
The main target groups are local companies with consistent and
predictable energy consumption for their buildings and processes.
RANGE OF THE EXPECTED ECONOMIC INDICATORS (creating and running
GBE FACTORY investments)

38
EBIT: 37.4 % (in the 5th year)
EBITDA: 47.8 % (in the 5th year)
ROI: 75.28 % (after 25 years)
ROE: 130 % (after 25 years)
IRR: 17.6 % (after 25 years)
REFERENCES
1. http://www.energytech.at/pdf/lustenau_bios trom.pdf
2. http://www.econtrol.at/portal/page/portal/medienbibliothek/oek
oenergie/dokumente/pdfs/Einspeisetarife%202
010%20und%202011_0.pdf
Strategic Vision at the base of the investment
Establishment of a biomass combined heat, cooling and power plant based
on wood chips and / or used wood. By establishing a GBE factory financing
and execution of the system is performed. The energy prices and
guaranteed lower price increases compared to conventional energy
sources for the future are the main strategy and the reason of the
investment.
The value perceived (by users)
The economics of such a project is the most important parameter for the
investors (energy consumer). In addition, the SMEs can benefit from an
increased independence from fossil fuels, greater security of energy supply
and from a market value. Furthermore, operating and maintenance savings
39
can be achieved in the internal supply systems of the various participating
SMEs.
Key Activities, Key Partners, Key Resources
THE MAIN KEY ACTIVITIES ARE:
• Inquiry of EPC (Engineering, Procurements, Construction);
• Energy Audit;
• Scaling of the system;
• Tender process;
• Preparation of a business plan;
• Contract signature by all parties.
KEY PARTNERS GENERALLY ARE: factory’s owners (GBE factory members),
investment banks, energy consultants and engineering companies.
KEY RESOURCES OF FINANCING are bank institutions, private Investors
(e.g.: EPC) and factory’s owner (with their own equity). For the purchase of
RES (wood chips & used wood) long term supply contracts should be
agreed, in order to obtain price stability.
Customers and target group
The main customers are the companies themselves near to the planned
distribution grid.
The companies should have:
• A long-term location choice;
• Constant/predictable energy consumption;
• Central heat/cold supply.

40
Possible extensions of single factories and the industry area should be
considered in advance, and taken into account in the planning phase.
Industrial areas which are not yet connected to a heating and cooling
network are preferred. Otherwise the competitive pressure from the
current energy supplier could be too great.
Operation
Due to the complexity of the plant, a new building is the most practical
solution.
As the ORC process uses a pressurized boiler operation, no steam boiler
attendant is necessary. Thus, the plant can be operated with reduced staff
costs.
Waste wood is a cheap energy source (depending on market conditions:
payment for the removal), but before using it has to be treated.
Power purchase contracts with minimum purchasing quantity (otherwise
penalties will be incurred) between the GBE factory and SME are important
for the economic success of the project.
Cost structure ratios
The main operating costs are wood chips or the treating of waste wood
and secondly maintenance of the system, attention should be given to the
following points:
1. The cost structure should be based on a planned mid to long term
supply agreement for wood chips and waste wood in order to
obtain price stability;

41
2. It is necessary to have reliable suppliers of wood so as not to
suffer from a lack of supply;
3. Waste wood treating costs;
4. Insurance costs;
5. Planned and extraordinary maintenance costs;
6. Safety costs;
7. Control and monitoring costs;
8. Costs of administration and management.
In the following graph, you can see the price trend of wood chips
compared to other heat sources:
Price trend of wood chips in € - Cent per 10 kWh.
As demonstrated in the graph above, wood chips are a cheap heat source
with a fairly consistent price level. The long term price increase is about
3%. By using this raw material, greater price stability can be anticipated.
42
Revenue Stream
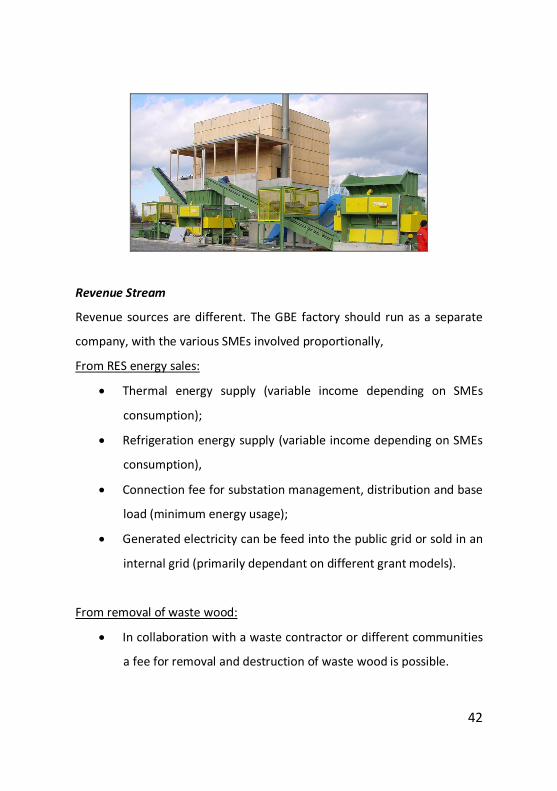
Revenue sources are different. The GBE factory should run as a separate
company, with the various SMEs involved proportionally,
From RES energy sales:
• Thermal energy supply (variable income depending on SMEs
consumption);
• Refrigeration energy supply (variable income depending on SMEs
consumption),
• Connection fee for substation management, distribution and base
load (minimum energy usage);
• Generated electricity can be feed into the public grid or sold in an
internal grid (primarily dependant on different grant models).
From removal of waste wood:
• In collaboration with a waste contractor or different communities
a fee for removal and destruction of waste wood is possible.

43
From RES incentivizing system:
• RES incentives are recognized by public authorities and energy
authorities or related organizations ( Green certificates or FIT,
usually defined in advance for a fixed number of years);
• Different public grants.
From membership status:
• To join the network offered by the GBE FACTORY, an entry fee
must be requested to cover part of the initial investment
(Investment of equity).
Investment model and financial structure
The main investments are:
• CCHP plant;
• The heat- and refrigeration distribution grid;
• Local energy sub-stations (internal single unit distribution should
be the responsibility of the end user);
Principal operating costs are:
• Wood chips and/or waste wood;
• The remote control supply system;
• Maintenance service.
The local energy coverage depends strongly on the base load and energy
consumption profile of the SMEs. In regard to the profitability of the
dimensions of the plant (high workload) of the GBE factory is of great
importance.

44
Through an intelligent storage management with heat and cold storage,
coverage of parts of the peak loads can also be achieved. If there is not a
possibility of 100% coverage by RES, a centralized or decentralized back up
source is necessary.
GBE factory members fund the project. There are several approaches
possible:
The GBE factory is fully funded by their member’s equity (energy users).
Additional to the GBE member’s equity a bank loan could also be
necessary.
It is desirable that the engineering-, procurement and construction
companies have shares of the GBE factory. This should/can achieve better
efforts in the planning, construction and operational phases.
Business Plan main indicators
From the examination of the main aspects of a business plan applied to
this type of GBE FACTORY, the following parameters should be considered:
• Economic gain;
• Positive SWOT analysis;
• Environmental benefits;
• Safety with advanced technology;
• Legal framework;
• Authorization process;
• Expertise of the people involved;
• Support of key-stakeholders;
• Social benefits;

45
• Fiscal framework.
Economic indicators as below are to be expected:
EBIT: 37.4 % (in the 5th year)
EBITDA: 47.8 % (in the 5th year)
ROI: 75,28 % (after 25 years)
ROE: 130 % (after 25 years)
IRR: 17.6 % (after 25 years
Environmental and economic sustainability
Because of the used renewable resource “wood chips and waste wood”,
the biomass plant is CO2 neutral. Depending on the energy consumption
profile and energy mix, it should be possible to cover most of the required
energy. Due to flue gas cleaning the emission of air pollutants is kept to a
minimum. With sufficient resources in surrounding areas, the
transportation costs and linked environmental impacts can also be kept
low.
The main viability from an economic point of view is a predictable constant
energy price for the future and greater independence from energy
suppliers. Through energy cost savings SMEs can remain more competitive.
To be able to provide economical sustainability, long-term supply contracts
and a safe financing scheme are vital.

46
4.3.2. Biomass energy boiler using wood biomass as fuel and heat pump
using electricity
Executive Summary
The proposed business model includes the implementation of RES projects
for heating, domestic hot water and cooling of office buildings, small
warehouses and premises in the industry. In the industrial sector the
business model includes processes and schemes among owners, designers,
manufacturers of systems and equipment, engineering and logistic
companies, suppliers and subcontractors.
Quick Facts
GBE FACTORY MODEL
The small scale buildings in industry are supplied with hot water for
heating and every day use by biomass energy boilers which are
constructed on user’s side. The heat pumps are used for cooling of the
separate offices, small warehouses and premises of industrial buildings.
47
TYPE OF INVESTMENTS
Investment in installation which includes combination of a biomass energy
boiler using wood biomass as fuel and heat pump using electricity. This
installation meets the owners need for heating, DHW and cooling of theirs
office buildings, small warehouses and premises.
CUSTOMERS AND TARGET GROUPS
The main target customers and target groups are the owners of the
following industrial facilities: small and middle office buildings, small and
middle industrial warehouses, Shopping Centres and hotels. Offices and
warehouses in industrial areas and business parks are also potential target
groups.
Strategic Vision at the base of the investment
Combined installation of biomass boiler and heat pump using renewable
energy sources for heating, DHW and cooling supplied complete or partial
individual or a group of industrial office buildings, Shopping Centers, hotels
and small warehouses at an attractive price and a high quality service level,
in comparison with existing conventional solutions.
The investment will improve the working conditions in the industrial
buildings. A reduction in energy costs will be also achieved. The proposed
business model will also lead to the reduction of CO2 emission to the
atmosphere.
48
The value perceived (by users)
Providing to the industry the opportunity to use high-efficiency and
environment-friendly technologies for the generation of hot water for
heating and every day needs by utilization of wood biomass at attractive
prices. Possibility for cooling of the buildings is also to be expected.
Key Activities, Key Partners, Key Resources
Main KEY ACTIVITIES connected to the proposed business model
implementation are as follows:
1. An energy audit – to establish the potential for saving energy;
2. A detailed exploration of the energy sets the base for the
projecting, the current consumption of energy and the base
scenario for one process, one building or a group of buildings;
3. The preparation of a project tender/bids;
4. Finding a technical solution and a creating a working project;
5. Setting up the systems and installation;
6. Full preparation of the site “to the key”;
7. Training of the customer’s personnel on the use and maintenance
of the equipment;
8. Maintenance of the installation;
9. The proposed business model has compliance with National and
EU environmental, health and safety standards and norms.
KEY PARTNERS are: owners; designers, manufacturers, subcontractors,
suppliers, engineering companies and logistic services.

49
KEY RESOURCES are provided by the owners of small and middle industrial
office buildings, small warehouses, shopping centers and hotels. In the
case of new office buildings, hotels, shopping Centers and warehouses in
industrial areas or business parks the target group can be real estate or
facility management companies or group of participants for outsourcing
the project.
Customers and target group
The main customers are the companies themselves near to the proposed
distribution grid.
The companies should have:
• A long-term location choice.
• Constant/predictable energy consumption
• Central heat/cold supply
Possible extensions of single factories and the industry area should be
considered in advance, and taken into account in the planning phase.
Industrial areas which are not yet connected to a heating and cooling
network are preferred. Otherwise the competitive pressure from the
current energy supplier could be too great.
Operation
The proposed technology provides hot water, heating, and cooling for the
office buildings, shopping center, hotels and houses through a combination
of biomass energy boiler using wood waste as fuel and heat pump using

50
electricity. The proposed technology has been selected because it offers
the following advantages:
• Relatively low investment costs;
• High efficiency;
• Wood waste availability;
• Internal microclimate improvement;
• Contribution to the reduction of greenhouse gas emissions.
In defining the project results, the annual quantity of thermal and
electricity energy used for heating and cooling per customer is calculated.
A balance of the wood biomass quantities is made and the quantity of
thermal energy produced by the boilers is defined. The electricity
consumption for heat pump is also calculated. The influence of boilers
efficiency on the wood biomass combustion process and COP for heat
pump operation is considered.
The electricity consumption for the boiler’s and heat pump own needs and
operational and maintenance costs is not taken into account.

51
The proposed technology is a combination of biomass energy boiler for
heating and heat pump for hot water and cooling. The main components
of the selected technology are:
automatic hot water energy boiler fuelled by biomass, heat accumulator,
internal boiler installation including distribution/returned water collectors,
circulating pump, valves and insulation pipes, air water heat pump, and
C&I including LCD controller It is very important during the project
completion in the industrial buildings to have very good partnership
between the project provider, owners, subcontractors, suppliers, local
authorities, installers, service organizations, designers and logistic
companies.
Cost structure ratios
The main O & M costs (operational and maintenance costs) are due to the
consumption of wood biomass and electricity. There are also servicing and
salary costs of the operational staff.
The cost structure has the following features:
• Professional contracts designers, manufacturers, subcontractors
and suppliers for the different stages of the project
implementation;
• Costs for system and equipment insurance;
• Maintenance costs;
• Costs for electricity for own needs;
• Safety costs;
• Costs for purchasing spare parts;

52
• Transportation costs, office maintenance costs and accounting
servicing costs;
• The costs for training and equipping of the operational personnel.
• Service staff salaries cost;
The allocation annual O&M cost for the exemplar installation is shown
below.
Revenue Stream
Project savings include the following sources:
• Energy efficiency savings as a result of replacement of old
inefficient conventional heating boilers with automatic biomass
boilers;
• Using efficient heat pump for cooling with minimal electricity
costs;
• Control and monitoring of the expected O&M Costs;
• Income from selling of CO2 emissions. This is dependent on the
quantities of the saved conventional fuels and methods for
calculation of the reduced emissions.

53
Investment model and financial structure
Software tools available in the following areas:
• Heat pump and biomass boiler facilities simulation and monitoring
tools;
• Economic evaluation tools;
• Flexible optimization tools.
The Financial Structure should be shown as two different options:
• Total costs by one participant who will implement and manage
the project. The investors profit will be from the savings of the
energy;
• Costs by all of the users, who will be part of the industrial area, or
Business Park, primarily to cut the energy costs. In this case the
partners will invest by themselves (own capital).
Business Plan main indicators
The main indicators in the business plan applied to the proposed business
model are as follows:
• Proven technical solutions and appropriate technology and
equipment;
• Net economical profit;
• Rational SWOT analysis;
• Financing plan;
• Project cash flow analysis;
• Ecological benefits;

54
• Risk and sensitive analysis;
• Legal legislations;
• Completed authorization cycle;
• Compliance with National and EU environmental, health and
safety standards and norms;
• Actual project calendar schedule.
Environmental and economic sustainability
The proposed business model includes establishing and managing of
Consolidation center for validation of GHG emissions. The implementation
of biomass energy projects will lead to the significant reduction of
greenhouse gas emissions. The protocol of Kyoto and new EU emissions
rules have created a market in which companies and governments that
reduce GHG gas levels can sell the ensuing emissions credits.
Determination of the annual emissions of CO2 and of other noxious gases
is according to Commission decision of 21.01.2004 establishing guidelines
for the monitoring and reporting of Greenhouse gas emissions pursuant to
Directive 2003/87/EC of the European Parliament and of the Council. The
emissions factors elaborated by the MOEW (Methodology for calculation
of emissions of noxious substances (pollutants) released into the
environment based on balance methods) have been used for the CO2
emissions assessment. The economic sustainability is expected through
utilizing of potential resources to best advantages. These resources can be
efficient and responsible, and likely to provide long-term benefits. In the
case of this business model, economic sustainability leads to rational using

55
of resources so that the business model continues to function over a
number of years, while consistently returning a profit.

56
1.3.3. Biofuel- biogas CHP plant
Executive Summary
The model proposed allows sustainable supply to a whole industry area
through an industrial building hosting a biofuel-biogas CHP plant, meeting
partially or totally the H/C needs of the other companies. Organized as an
ESCO or consortium among users and suppliers, it can allow users to
achieve control over the energy streams of the area and achieve a better
planning and price for the biofuel-biogas supply.
Quick Facts
GBE FACTORY MODEL
Industrial building hosting a biofuel-biogas CHP plant supplying RES energy
to other buildings in the same industrial area
TYPE OF INVESTMENTS
Renewable energy power plant (Biofuel-Biogas CHP) to meet the needs
(complete or partial) of heating and cooling of clusters of industrial
buildings
CUSTOMERS AND TARGET GROUPS
The main target customers are the owners of the warehouses of the
industrial area, especially those who have high demand for air conditioning
for their premises (e.g. units used for food processing and pharmaceutical
activities).

57
RANGE OF THE EXPECTED ECONOMIC INDICATORS (creating and running
GBE FACTORY investments)
EBIT: 28%
EBITDA: 27.06%
ROI: 23.83%
ROE: 11.00%
REFERENCES
http//www.binariospa.com
http//www.escoeurope.it
Strategic Vision at the base of the investment
Developing a local renewable energy power plant (Biofuel-Biogas CHP) to
meet the needs (completely or partially) of heating and cooling of clusters
of industrial buildings at competitive price and service level when
compared to old conventional H/C solutions.
The value perceived (by users)
The value perceived by the owners of the warehouses fuelled by
renewable energy (users) is that of gaining control (both in terms of costs
and physically close availability) over an important factor (energy) which
influences the costs of property management. In addition there is the
perception that this value will contribute to increase the intrinsic value of
the property in the future.

58
Key Activities, Key Partners, Key Resources
THE MAIN KEY ACTIVITIES for carrying out the investment consists in a
survey in the industrial area supported by local energy audits in order to
consider the feasibility constraints and to calculate the realization costs
that will affect the price of Renewable Energy offered (services after
commissioning included).
KEY PARTNERS generally are: factory’s owners; ESCO; investment banks
and sometimes users themselves.
KEY RESOURCES may be supplied both directly by private investors or
retrieved through a financial operation governed by agreements with
banks or finance companies.
Customers and target group
The main customers are the owners of the warehouses, especially those
who have high needs for air conditioning (controlled and adjustable H/C)
for their premises (e.g. units used for food processing and pharmaceutical
activities).
In the case of new buildings (such as the case of expansion of industrial
areas) the target becomes real estate companies and / or groups of
operators who act as developers in these areas.
Operation
Particular attention must be given to the renovation of the building that
will host the RES plant and the building of the heating and air conditioning

59
remote supply systems that should be compatible with the “already built”
situation.
The H/C supply system must be locally and remotely monitored and
controlled.
There will be an “energy balance” to establish the return of the
investment, and in some cases, change some parameters to get the best
performance.
The relationship between the management organization of the real estates
and the outsource partners (such as suppliers, authorities, and
stakeholders) will be very important.
Cost structure ratios
Given that the main operative costs are due mainly to biofuel or biogas
and secondly to the maintenance of the system working 24 hours a day,
attention should be given to the following points:
• The cost structure should be based on a planned mid-long term
supply agreement for biofuel-biogas, in order to have main
operating costs under control;
• It is vital to chose reliable suppliers of commodities so as not to
incur heavy penalties due to the unreliable delivery of energy;
• Insurance costs;
• Ordinary and extraordinary maintenance costs;
• Safety costs;
• Control and monitoring costs;
• Costs of administration and management;
60
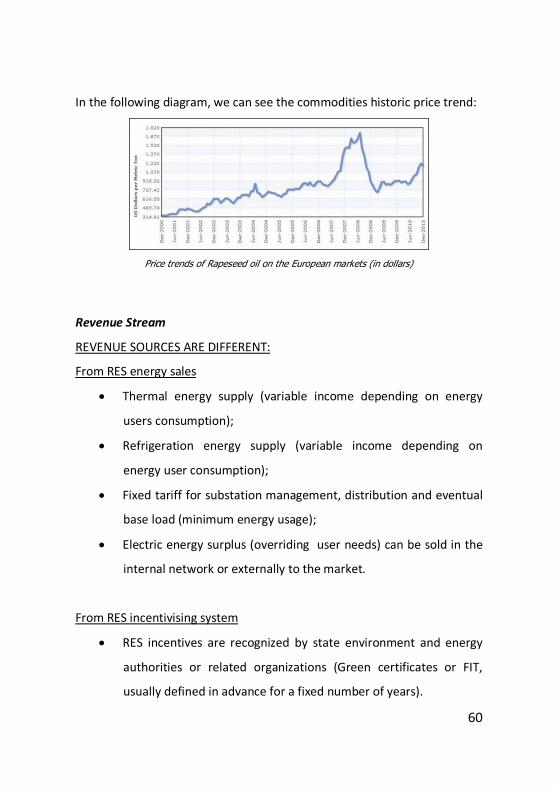
In the following diagram, we can see the commodities historic price trend:
Price trends of Rapeseed oil on the European markets (in dollars)
Revenue Stream
REVENUE SOURCES ARE DIFFERENT:
From RES energy sales
• Thermal energy supply (variable income depending on energy
users consumption);
• Refrigeration energy supply (variable income depending on
energy user consumption);
• Fixed tariff for substation management, distribution and eventual
base load (minimum energy usage);
• Electric energy surplus (overriding user needs) can be sold in the
internal network or externally to the market.
From RES incentivising system
• RES incentives are recognized by state environment and energy
authorities or related organizations (Green certificates or FIT,
usually defined in advance for a fixed number of years).

61
From membership status
• To join the network offered by the GBE FACTORY, an entrance fee
can be requested to cover part of the initial investment,
distribution and substations costs.
Investment model and financial structure
The hardware investment required is:
• A power centre with an intensive technology RES energy
production plant;
• The pipe line (sometimes pipe lines investment can be shared
between the GBE FACTORY and the building constructor);
• Local energy sub-stations (internal single unit distribution should
be responsibility of the end user);
Operational main costs should include:
• The primary energy plant (RES combined or totally RES);
• Remote controlled supply system;
• Maintenance and repair services;
The building of the power plant and its technology should be owned by the
GBE FACTORY in the form of an Energy Service Company (ESCO).
Distribution and local energy substations should be exclusively used by the
GBE factory due to the importance of the energy stream control.
Another possible investment model can be that the entire system (GBE
FACTORY plus the other buildings and the surrounding area) are owned by
a consortium, where both producer and end user have shares.
62
The Financial Structure would be shown as two different options:
• Total investment by one participant who will implement and
manage all of the GBE FACTORY. The investors gain will be from
the selling of the energy in and out of the local district (energy
produced that exceeds local consumption), and also by the
incentives and other fees. This revenue will pay for the interest
charges of a bank loan;
• Investment by all of the users, who will be part of the GBE
FACTORY, primarily to cut the energy costs. They will be allowed to
use the RES energy produced, to save on the cost and also to
benefit from the renewable energy's incentives currently in place.
In such case the partners will finance by themselves (own capital)
the investments required.
Business Plan main indicators
From the examination of the main aspects of a business plan applied to
this type of GBE FACTORY, one should consider:
• Economic gain;
• Positive SWOT analysis;
• Environmental benefits;
• Safety with advanced technology;
• Legal framework;
• Authorization process;
• Expertise of the people involved;
• Support of key-stakeholders;

63
• Social benefits;
• Fiscal framework.
The following ranges for economic indicators are generally to be expected:
EBIT: > 25%
EBITDA: > 24%
ROI: > 20%
ROE: > 10.00%
These indicators are provable when the company is fully operational (after
5 years).
Environmental and economic sustainability
Satisfactory environmental sustainability can be considered achieved if the
energy generated from RES in the GBE FACTORY is equal - or superior – to
'80% of the total energy produced by the GBE FCATORY. This value may be
optimal with respect to a trade-off that takes into account the costs to get
a 100% RES GBE Factory and those necessary to have a GBE Factory with
80% RES and 20% fossil fuel. The 20% from traditional sources could in fact
function to ensure back-up in case of inefficiency of the generation and
distribution of renewable energy.
Sustainability from an economic point of view should be based on a
portfolio of contracts of local supplies, which initially covers the cost of the
system running well below its full capacity. The increase in supplies to
reach the full capacity should ensure the achievement of necessary room
for business activities. This makes sense if the costs of biofuels-biogas are

64
well-planned and are tiered in case of turbulence in the commodities
market.

65
1.4. “Many to one”
PARTNERS TOGETHER WITH THEIR CUSTOMER CAN JOIN INTO A
NETWORK EACH ONE PROVIDING PRODUCTION, CONSUMPTION AND
RESOURCES NEEDS. THE EXTRA ENERGY PRODUCTION CAN BE SOLD TO
OTHER PARTICIPANTS APART FROM THE NETWORK

66
1.4.1. Open self-energy production consortium
Executive Summary
The target of this project is to promote the replacement of the old
asbestos roof present in the roofs of almost all the companies in a
territory, while benefiting from the special government incentives
currently in place.
It is well known, that most of the industrial warehouses constructed up to
1992 are roofed using asbestos, and this model develops the plan to invest
in disposing of the old roofs , replacing them with new solar panels (PV or
solar thermic).
This project will increase the quality of life in the area and bring new jobs,
as well as producing renewable green power that can been used by both
the industrial processing plants and the local inhabitants.
Quick Facts
MINIMUM RES ELECTRICITY PRODUCTION: 80%
MINIMUM RES ELECTRICITY LOCALLY CONSUMED: 80%
MINIMUM HEATING AND COOLING ENERGY NEEDED: /
MINIMUM RES HEATING AND COOLING ENERGY: /
ELECTRIC OPEN SYSTEM: YES
HEATING AND COOLING OPEN SYSTEM: YES
FIT: YES

67
Strategic Vision at the base of the investment
The consumption and emission of greenhouse gases is the priority of the
European administration which is working on meeting the targets of the
Kyoto Protocol.
It’s a “win-win” project because the administrations are able to achieve the
Kyoto standards and at the same time the companies gain work
opportunities. Also the local inhabitants are protected by the disposing of
the asbestos from their environment.
All of the above will help to safeguard the environment by producing new
renewable green power.
The value perceived (by users)
This project has numerous benefits such as:
• Disposing of dangerous substances;
• Dissemination of renewable energy;
• Awareness of citizenship;
• Creation of new jobs;
• Improvements to the Environment;
• Contribution to the achievement of the targets 20 20 20;
• Support of government incentives.

68
Key Activities, Key Partners, Key Resources
KEY ACTIVITIES
Analysis and supervision of the territory; promotion of the project;
creation of a network of businesses and stakeholders; implementation of
project.
KEY PARTNERS
The project involves the council and local authorities, companies which
have to remove the old asbestos present in their roofs, companies grouped
in the network that perform the work, and the local inhabitants.
Customers and target group
The project involves different partners such as: the local authorities, the
owners of the warehouses that will be reclaimed, the companies which will
remove the asbestos and the companies which will install the new solar
panels. Also the inhabitants that will benefit from a better quality of life.
Furthermore they will be able to make use of the green power generated.
Operation
The Project will be divided into 4 parts:
1. ANALYSIS and SUPERVISION of the the TERRITORY CONCERNED
At this stage it will be important to conduct a census of the agricultural and
industrial buildings (especially poultry buildings) to find where the roofs
are covered by asbestos, followed by an evaluation of the circumstances.

69
2. PROMOTION of the PROJECT in the TERRITORY
At this stage the project owners will meet the potentials users, such as the
owners of the warehouses that will be upgraded, explaining to them the
benefits that they could gain by signing up to the project.
3. CREATION a NETWORK of COMPANIES and STAKEHOLDERS
It will be important to create a network of companies which aims to
implement the project. The achievements of the network coupled with a
strong approach from the stakeholders will guarantee maximum success
for the project.
4. Implementation of the PROJECT
The last stage will be to remove the old asbestos roofs and replace them
with new solar panels, all of this it will be carried out by the established
network of companies.
Cost structure ratios
Direct operational costs:
• Removal and disposal of the asbestos roofs : 10-25 €/m
• Cost of the new roofs : 20-45 €/m (*)
• FV system installation : 3.000-3.400 €/KWp (**) (*) It depends on the functional requirements; such are adjustment of/to the structure, as well at the local
regulations, etc.
(**) From 100-200 KWp to up than 1 MWp .That depends on the building, geographic location, technology
option and so on.

70
Quantity Price TotalNEW ROOF (Worehouse) 1.600 mq 35€ 56.000,00€
Disposal of dangerous substances (asbestos) and replacement with PV panels
PV IMPLANT of 100 kWp (800 mq) 100 kWp 2.400,00€ 240.000,00€
CONNECTION to the GRID 7.500,00€
TOTAL 303.500,00€
In addition to the directs costs, we have to consider the cost and times of
the general activities such:
• Evaluation of the technical and economic feasibility
• Administrative assistance
• Financial assistance
Example of costs substitution
Revenue Stream
Law 19 February 2007 introduces an incentive mechanism that supports
the replacement of asbestos roofs with PV or solar thermal implants.
This type of benefit was reconfirmed in the “Fourth Energy Law”
(05.05.2011).
This extra benefit permits:
• In the worst case, to ask to warehouse owners to pay a part of the
operating costs;
• Normally, to cover the total costs of disposing the asbestos and
replacing it with the new “renewable” roof;
• In the best case, to produce extras revenue (if we consider that
the owners could receive a fee for the rent of his roof).

71
Investment model and financial structure
Investments required are:
• Study of the territory. It is necessary to check all industrial or
commercial roof that have the asbestos above;
• Dismantling of asbestos’ roofs;
• Replacement with PV or solar thermic implants.
Principal operating costs are:
• The construction of energy plants;
• The remote controlled supply system;
• The maintenance and repair services.
The building of the power plant and its technology should be owned by the
GBE FACTORY in the form of capital company. It is constituted by a
financial structure that is the team leader of the entire project.
The Financial Structure should be shown as follows: total investment by
one participant who will implement the GBE FACTORY system. The
investors gain will be from the selling of the energy in and out of the
warehouses, and also by the incentives and other fees. This revenue will
pay the annual interest charges of a bank loan.
It is possible that the investment could be met by other users, who will be
part of the GBE FACTORY, primarily to cut the energy costs. They will be
allowed to use the RES energy produced, to save on the cost of it and also
to benefit from the renewable energy's incentives currently in place. In
such case the partners will finance by themselves (own capital) the
investments required.

72
Business Plan main indicators
The main indicators of a good business plan are:
1. Economic gain;
2. Positive SWOT analysis;
3. Environmental benefits;
4. Safety with advanced technology;
5. Legal framework;
6. Authorization process;
7. Expertise of the people involved;
8. Support of key-stakeholders;
9. Social benefits;
10. Fiscal framework.
Environmental and economic sustainability
From the Environment’s point of view this is a winning model because: it’s
going to be eliminate a dangerous and noxious material such as asbestos,
meanwhile replacing them with solar panels which produce energy and
also hot water.
That energy will be exploited by the warehouse and any excess, will be sold
to the network, increasing the economic advantage of the operation.
From the economical point of view, the financial cost is going to sustain the
requalification building’s costs, and it’s going to get the direct economic
benefits of the operation.
The energy produced, instead, would be either used in the warehouse or
sold elsewhere.

73
The warehouse owners get the monthly income from the rent of their
roof’s surfaces used. (So they will essentially receive a guaranteed income.)

74
2. BEST PRACTICES: THE EXISTING GBE FACTORY IN EUROPE
2.1. “ONE BY ONE”
2.1.1. KVK Koerner Chemieanlagen GesmbH
Description of the project
The company KVK Körner manufactures pickling tanks for galvanizing
processes and also for hot dip galvanizing of metal parts. The production of
these plates happens on a “production table”, which is heated by heating
coils with hot water. The working surface of the table is always kept at a
temperature of 30 °C and therefore requires a high energy consumption of
natural gas. The installed solar thermal plant covers a significant part of the
needed heat energy, saves natural gas thus reducing the CO2 impact.
Sales & Purchase Agreement
The solar thermal collectors are mounted on the south facing façade of the
production plant.
This plant is an example for a cost - effective installation of RES in SMEs,
with considerable savings. The simple design allows an easy transferability

75
of the concept to other SMEs. Thanks to the system 49.4 % of the heat
demand of this process is covered by solar energy.
Quick Facts
LOCATION: Am Bahnhof 26, Eibiswald - Austria
PLANT SIZE: 85.8 sqm
TECHNOLOGY/RES: Solar thermal GS collectors
SITE OWNERSHIP: KVK Koerner GesmbH
INVESTOR: KVK Koerner GesmbH GmbH
PROJECT COST: 35,440 €
State grants: 30 %
KEY PARTNERS: S.O.L.I.D. GmbH (Design & Installation)
CURRENT STATUS: Operational
Design and construction
The solar plant feeds in over a heat exchanger into a storage tank with
approx. 10 m³. The storage tank supplies the production line with heat.
Due to the size of the storage tank and the continuous and ongoing
operation of the production table, overheating is not possible. Thus, an
optimum solar yield can be reached from the collectors.
TECHNICAL DETAILS:
TOTAL SURFACE: 85.8 sqm
NUMBER of thermal collectors: 6 (each 14.3 m ²)
HEAT STORAGE: 10 m³

76
TOTAL solar yield: 41.5 MWh/year
SPECIFIC solar yield: 485 kWh/m²BRUTTO*a
PARAMETERS OF INSTALLATION
Installation: 1nd QT 2007
Capacity [kWtherm]: 43.5
MONTHLY TOTAL ENERGY GENERATED
ENERGY DISTRIBUTION
The total produced solar thermal energy is used locally in production.
Local energy consumption = 100% (41.5 MWh/a)
SUBSTITUTED ENERGY
Form of conventional energy source: natural gas
Price, natural gas: 47.45 €/MWh net
Total heat consumption: 84 MWh/year
Solar thermal production: 41.5 MWh/year

77
SOLAR COVERAGE
Economic Basics
PARAMETERS OF ECONOMIC’S SIMULATION SALE
INTEREST RATE: 4.0 %
GRANTS: 10,632 €
MAINTENANCE AND INSURANCE COST: app. 100 €/year
INSURANCE COST: app. 20 €/year
DEPRECIATION PERIOD: 25 years
SYSTEM’S DEPRECIATION CHARGE: 4 %
COST INCREASE FUEL: 8%

78
Environmental & Economic Sustainability
The measured total solar yield is shown in the table below.
TOTAL MONTHLY TREND ANALYSIS OVER THE YEAR:
Solar thermal energy is CO2-free and therefore environmentally friendly. In
determining the CO2 savings following substituted heat source are

79
considered: natural gas. The impact of natural gas amounts to 205 kg
CO2/MWh.
Through this investment the company is less dependent on gas and
unexpected fuel price increase.
Lessons Learnt
This solar thermal system demonstrates to us the following points:
• High efficiency of small solar thermal applications;
• The solar yield depends strongly on the required temperature
level of the process heat application;
• Good economics;
• Easy transferability to other SMEs.
This example shows the successful use of small solar thermal plants for
industrial process heat application. Due to the easy transferability to other
SMEs and possible duplication significant CO2 savings can be achieved.

80
2.1.2. Caixa Geral de Depositos
Description of the project
In Lisbon a large office building of the bank Caixa Geral de Depósitos (CGD)
are supported by solar heat and cold. The collector area is installed on the
roof of the office building. The office building has 17 floors with an office
space of 100,000 m². During the working day 6,000 employees are
permanently in the building. The generated energy is used to power an
absorption chiller. Furthermore, the energy is used for the reheating
system of the ventilation appliances as well as contributing to the heating
of hot water.
Sales & Purchase Agreement
On the one side CGD wished to install an economical RES to save energy,
on the other side the architecture and appearance of the building had to
be considered. Because of the location the only available useful area is the
roof of the building. The design of the collectors could be optimal
combined with the existing blue tile roof. With the integration of the
system the existing energy distribution system has been optimized, and
further energy savings achieved.
Thanks to the system app. 45% of the domestic hot water demand, 15 % of
reheating and 8% of the cold demand can be covered with this solar
thermal system.
Quick Facts
LOCATION: Rua Arco do Cego, Piso 1; Lisbon Portugal

81
PLANT SIZE: 1,579 sqm
TECHNOLOGY/RES: Solar thermal HT collectors
SITE OWNERSHIP: Caixa Geral de Depósitos
INVESTOR: Caixa Geral de Depósitos
PROJECT COST: 1,040,000 €
State grants: 0 %
KEY PARTNERS: S.O.L.I.D. GmbH (Design & Installation), Energia de Portugal
(EdP)
CURRENT STATUS: Operational
Design and construction
The solar energy is for building cooling and air conditioning in the CGD
building, in the months of April to September. Extra thermal energy from
the plant may also be used to heat up the water coming from the existing
100 m³ tanks in the basement and to replace the electric energy used by
the heat pumps to cover the heat needs for
DHW and reheating the air. The solar energy is used for heating purposes
mainly in the months of October to March. The energy output and current
system data can be displayed on a monitor in the CGD offices as well as
online, adding visibility and control of the energy output to the solar
solution.

82
PRIORITY: 1. DHW, 2. reheating, 3. Cooling
TECHNICAL DETAILS:
TOTAL SURFACE: 1,579 sqm
NUMBER OF THERMAL COLLECTORS: app. 112
SOLAR HEAT STORAGE: 10 m³
TOTAL SOLAR YIELD HOT: 978.2 MWh/year
SOLAR YIELD COLD (COOLING): 263 MWh/year
SOLAR YIELD REHEATING: 202.6 MWh/year
SOLAR YIELD DHW: 400 MWh/year
SPECIFIC SOLAR YIELD HOT: ~ 619.5 kWh/m²BRUTTO*a
PARAMETERS OF INSTALLATION
TYPOLOGY AND PROFITABILITY OF EQUIPMENT:
INSTALLATION: 1th QT 2008
CAPACITY [kWtherm]: 845
CAPACITY ABSORPTION CHILLER: 545 kW

83
MONTHLY TOTAL ENERGY GENERATED
ENERGY DISTRIBUTION
THE TOTAL PRODUCED SOLAR THERMAL ENERGY IS USED LOCALLY.
SUBSTITUTED ENERGY
FORM OF ENERGY: electricity (heat pump and compression chiller)
PRICE ELECTRICITY: 68 [€/MWh]
SOLAR THERMAL PRODUCTION: 978,2 [MWh/year]
SOLAR COVERAGE
The exact total consumption of the building is not known. Thus, the solar
coverage can be roughly estimated.
SOLAR COVERAGE
Cold: 8 %
DHW: 40 %
Reheating: 15 %

84
Economic Basics
PARAMETERS OF ECONOMIC’S SIMULATION SALE
INTEREST RATE: 6.0%
GRANTS: 0 €
MAINTENANCE AND INSURANCE COST: € 6000/year
DEPRECIATION PERIOD: 25 years
SYSTEM’S DEPRECIATION CHARGE: 4 %
COST INCREASE FUEL: 6 %
PAYBACK TIME: 10.8 years
IRR after 25 years: 13.1 %
A comparison of the two cash flows for solar system (expenses) and
electric energy savings results in the “Total net cash flow”.
TOTAL ELECTRICITY SAVINGS: 1,252 MWh/year

85
Lessons Learnt
Solar thermal system shows us following points:
• Efficiency of a combined solar thermal system - cooling & heating;
• The peak of solar radiation and the peak demand of solar cooling
match perfectly;
• The solar yield depends strongly on the required temperature
level of the application;
• Provided energy is often limited by available collector area;
• Often, a optimization of the existing system is possible by the
integration of RES;
• Solar cooling cuts off electricity peaks and saves the most
expensive electricity;
• Absorption Chillers have a long life (> 25 years);
• Cooling load reduction (external loads) because of the mounted
collectors on the roof;
• Good economy also without grants;
• Easy transferability to other office buildings.

86
2.1.3. Orgachim
Description of the project
Orgachim Jsc is situated within the territory of the town of Russe.
Orgachim SC is the biggest Bulgarian producer of paints, lacquers,
dispersions, alkyd resins, epoxy resins, unsaturated and saturated
polyester resins, amino resins, water based resins, maleic anhydride,
plasticizers, pigments and other chemicals for machine-building,
construction, furniture industry, electronics, processing plastics and other
industrial branches. At present, the personnel of the company amount to
515 people. In 2008-2009 and energy efficiency project was developed and
implemented with the support of EBRD European Union Energy Efficiency
Finance Facility (EUEEFF). The EBRD provides a credit line to Unicredit
Bulbank for qualifying projects, according to an Agreement between
Unicredit Bulbank and the EBRD. One of the implemented energy saving
measures is installation of solar system for domestic hot water (DHW)
preparation.
GBE Factory Model
The project envisages a solar water heating installation replacing the
existing gas fired boilers. The installation includes: 62 solar collectors with
selective roofing of 133.3 m2, the heat exchanger of 150 kW, the pump
unit, the pipeline and the auxiliary equipment. The choice of the solar
collectors with selective absorbers allows for the solar installation
continuous operation, even during cloudy weather conditions, which

87
increases its overall efficiency. The solar installation is installed on the
building’s Southern roof slopes.
Quick Facts
LOCATION: 21 Bul. Treti Mart, Russe, Bulgaria
PLANT SIZE (W/C0): 471
TECHNOLOGY/IES: Solar collectors
SITE OWNERSHIP: Orgachim JSC
INVESTOR: Orgachim JSC
PROJECT COST: 31 440 €
KEY PARTNERS: Unicredit Bulbank
CURRENT STATUS: Realized
Design and construction
System Characteristics and Estimated Annual Production of DHW by Solar
Collectors
SITE CONDITIONS VALUE UNIT
PROJECT NAME: Installation of a solar system
PROJECT LOCATION: Town of Russe
NEAREST LOCATION FOR WEATHER DATA RUSSE
ANNUAL SOLAR RADIATION (tilted surface): 1.32 MWh/m²
ANNUAL AVERAGE TEMPERATURE: 12.1 °C
ANNUAL AVERAGE WIND SPEED: 4.9 m/s
NUMBER OF MONTHS ANALYSED: 12.0 month
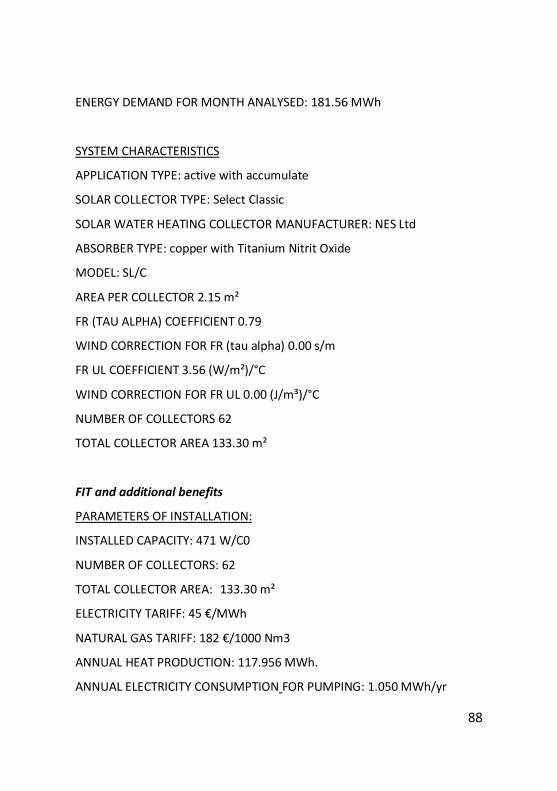
88
ENERGY DEMAND FOR MONTH ANALYSED: 181.56 MWh
SYSTEM CHARACTERISTICS
APPLICATION TYPE: active with accumulate
SOLAR COLLECTOR TYPE: Select Classic
SOLAR WATER HEATING COLLECTOR MANUFACTURER: NES Ltd
ABSORBER TYPE: copper with Titanium Nitrit Oxide
MODEL: SL/C
AREA PER COLLECTOR 2.15 m²
FR (TAU ALPHA) COEFFICIENT 0.79
WIND CORRECTION FOR FR (tau alpha) 0.00 s/m
FR UL COEFFICIENT 3.56 (W/m²)/°C
WIND CORRECTION FOR FR UL 0.00 (J/m³)/°C
NUMBER OF COLLECTORS 62
TOTAL COLLECTOR AREA 133.30 m²
FIT and additional benefits
PARAMETERS OF INSTALLATION:
INSTALLED CAPACITY: 471 W/C0
NUMBER OF COLLECTORS: 62
TOTAL COLLECTOR AREA: 133.30 m²
ELECTRICITY TARIFF: 45 €/MWh
NATURAL GAS TARIFF: 182 €/1000 Nm3
ANNUAL HEAT PRODUCTION: 117.956 MWh.
ANNUAL ELECTRICITY CONSUMPTION FOR PUMPING: 1.050 MWh/yr

89
ANNUAL NATURAL GAS SAVINGS: 24,000 Nm3/yr
ANNUAL MONETARY SAVINGS: 4 263 €/yr
Economic Basics
CONSUMPTION PARAMETERS
ANNUAL NATURAL GAS CONSUMPTION FOR DOMESTIC HOT WATER -
24,000 Nm3/yr.
ANNUAL NATURAL GAS SAVINGS ANNUAL NATURAL GAS CONSUMPTION
FOR DOMESTIC HOT WATER - 24,000 Nm3/yr. (100%).
FINANCING SCHEME
Support of EBRD European Union Energy Efficiency Finance Facility
(EUEEFF) – loan from Unicredit Bulbank
Environmental & Economic Sustainability
CARBON EMISSION REDUCTION
From Natural Gas Savings: 44 (tCO2/yr)
COST BENEFIT ANALYSIS
INVESTMENT: 31 440 €
ANNUAL MONETARY SAVINGS: 4 263 €/yr
INTEREST RATE: 8%
INFLATION RATE: 3.5%
PROJECT LIFE: 10 years
PAYBACK PERIOD: 7,4 yr

90
NPV: 2292
IRR: 6%
COST BENEFIT ANALYSIS WITH 15% GRANT
PAYBACK PERIOD: 6,3 years
NPV: 7008
IRR: 10%
Lessons Learnt
The results of the completed project implementation are:
• Reduction of consumption of natural gas by 24,000 Nm3/yr;
• Reduction of carbon emission by 44 t/yr.
Use of solar panels for production of DHW is an economically sustainable
project. Integration of this kind of projects with other energy saving and
renewable energy projects increases their total environmental impact and
financial results of the company.

91
2.1.4. MEGA Engineering Ltd.
Description of the project
Mega Engineering Ltd. specializes in the areas of design, development,
implementation, maintenance/service/; complex engineering devices and
systems for automation. Since its establishment in 1993 company
constantly develops and implements the latest advances in electronics,
microprocessors, and automation. Automation systems, implemented by
the company comply with European standards and requirements relating
to the implementation of the standards of Good Manufacturing Practices
"GMP".
GBE Factory Model
The company is a systems integrator that implemented control systems
instrumentation – SKIU. Before the project implementation the buildings at
MEGA Engineering Ltd are heated with hot water generated by a hot water
boiler using light fuel oil as a fuel. The hot water is delivered by circulation
pumps via the existing pipelines. The condition of the temperature regimes
in the production premises where concentrate workers are is not
satisfactory. ERATO Holding Plc has signed a HDC (Heating delivery
contract) for thermal energy sales. As a result of the project
implementation (fuel switch project) MEGA Engineering Ltd will save 17
tons of light fuel oil or EUR 21,570 annually.
Quick Facts
LOCATION: 52 Makedonia Str., Haskovo (Bulgaria)

92
HEATED SPACE (m3): 3,300 m3
TECHNOLOGY/IES: Biomass heating
SITE OWNERSHIP: MEGA Engineering Ltd.
INVESTOR: ERATO Holding Plc. (ESCO provider)
PROJECT COST: 35,400 €
KEY PARTNERS: MEGA Engineering Ltd.
CURRENT STATUS: Implemented
Design and construction
The project included production and installation of biomass boiler facilities,
including biomass hot water boiler, wood chips warehouse, system for
feeding of chips into the boiler chamber, ash cleaning system, exhausted
gases cleaning system and PLC control system. Commissioning test and
start-up were also implemented. The hot water is transported through
pipe network with diameter 100 mm to the local substation. From the
substation the hot water is transported to the radiators in the plant’s
premises.
TECHNICAL DETAILS:
TOTAL SURFACE (m2): 1,222
BOILER CAPACITY (kWth): 80
TOTAL ANNUAL ENERGY (kWhth/yr.) 77,440
BOILER EFFICIENCY (%): 92
HOT WATER TEMPERATURE (oC): 80
WOOD CHIPS CONSUMPTION (t/yr.): 33
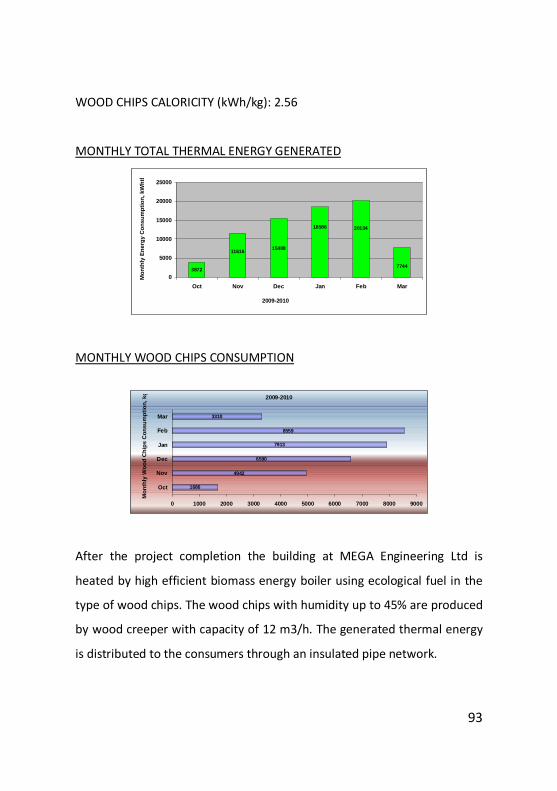
93
WOOD CHIPS CALORICITY (kWh/kg): 2.56
MONTHLY TOTAL THERMAL ENERGY GENERATED
2009-2010
3872
11616 15488
18586 20134
7744
0
5000
10000
15000
20000
25000
Oct Nov Dec Jan Feb Mar
Mon
thly
Ene
rgy
Con
sum
ptio
n, k
Wht
h
MONTHLY WOOD CHIPS CONSUMPTION
2009-2010
1686
4942
6590
7913
8559
3310
0 1000 2000 3000 4000 5000 6000 7000 8000 9000
Oct
Nov
Dec
Jan
Feb
Mar
Mon
thly
Woo
d C
hips
Con
sum
ptio
n, k
g
After the project completion the building at MEGA Engineering Ltd is
heated by high efficient biomass energy boiler using ecological fuel in the
type of wood chips. The wood chips with humidity up to 45% are produced
by wood creeper with capacity of 12 m3/h. The generated thermal energy
is distributed to the consumers through an insulated pipe network.

94
FIT and additional benefits
PARAMETERS OF INSTALLATION:
PROJECT DESIGN PREPARATION: February, 2009
DELIVERY AND INSTALLATION OF EQUIPMENT: April, 2009
BOILER HOUSE CONSTRUCTION: May, 2009
COMMISSIONING TEST AND START UP: July, 2009
PROJECT COMPLETION: August, 2009
THERMAL POWER (KWTH): 80
THERMAL ENERGY PRICES (€/KWTH): 0.142
Economic Basics
An energy audit and business plan were prepared. The technical and
financial calculation of ESCo operation has been made. The ERATO Holding
Plc offers to the management of MEGA Engineering Ltd ESCo operation
through energy contracting for selling of thermal energy. This energy is
measured through a certified gauge.
CONSUMPTION PARAMETERS
COSTUMER’S ENERGY COST (€/KWHTH): 0.142
THERMAL POWER (KWTH): 80
CONSUMPTION TE (KWHTH/YR.): 71,245
ANNUAL PROJECT REVENUES

95
THERMAL ENERGY SOLD TO CUSTOMERS (€/yr.): 10,127
WOOD CHIPS COSTS (€/YR.): 1,155
O&M COSTS (€/YR.): 1,636 approx.
CASH REVENUES (€/YR.): 7,336
10,127 ЕUR
-1,636 ЕUR-1,155 ЕUR-4,000 ЕUR
-2,000 ЕUR
0 ЕUR
2,000 ЕUR
4,000 ЕUR
6,000 ЕUR
8,000 ЕUR
10,000 ЕUR
12,000 ЕUR
Thermal Energy Soldto Costumer
Wood chips Costs O&M Costs
Ann
ual P
roje
ct R
even
ue (E
UR
/yr.) Thermal Energy
Sold to Costumer
Wood chips Costs
O&M Costs
FINANCIAL SCHEME
BASE PROJECT COSTS (€): 35,400
DEBT (€): 31,860
EQUITY (€): 3,540
INFLATION INDEX (%): 4.5
FIXED DISCOUNT RATE (%): 7
IRR (%): 18.3
NPV (EUR): 46,020
PAYBACK PERIOD (YR.): 5.45
BIOMASS BOILER
The biomass energy boiler with thermal capacity of 80kW and the auxiliary
process equipment are installed into boiler room. The fuel feeding system
and used biomass fuel are situated in the feel storage. The biomass hot
water boiler is compact one, made of steel, panel with control devices, and

96
is equipped with an automated fuel feeding device for wood chips or wood
pellets and fire safety system.
TECHNICAL PARAMETERS:
A system for automated regulation of the heat supply is also installed. The
installation into the energy cabin includes also circulating pumps,
expander, multicyclone, isolated pipes, valves, thermostats and C&I.
Furthermore, a chimney for the separation of the exhausted gases will be
constructed.
The hot water biomass boiler is using for burning of wood chips and wood
pellets. These biomass energy boilers are suitable for heating and DHW
preparation in the public building, industrial facilities, hotels and
greenhouses.
Nominal Thermal Power Efficiency Diameter of
chimneyHopper capacity Weight Length High Width
kW % mm l kg mm mm mm
80 92 200 450 550 2200 1330 700
Environmental & Economic Sustainability
Determination of the annual emissions of CO2 and of other noxious gases
is according to Commission Decision of 21.01.2004 establishing guidelines
for the monitoring and reporting of Greenhouse gas emissions pursuant to
Directive 2003/87/EC of the European Parliament and of the Council. The
emissions factors elaborated by the MOEW (Methodology for calculation
of emissions of noxious substances (pollutants) released into the

97
environment based on balance methods) have been used for the CO2 and
other noxious gases emissions assessment.
The CO2 emissions will decrease by 47 tons in 2010 and for the period
2010 - 2014 they will decrease by 234 tons, as a result of the project
implementation.
Emissions Characteristics 2010 2011 2012 2013 2014 Total
Light Fuel Oil Sav ings t/yr 17 17 17 17 17 85Light Fuel Oil Sav ings GJ/yr. 676 676 676 676 676 3381CO2 emissions factor for LFO tCO2/GJ 0.0702 0.0702 0.0702 0.0702 0.0702CO2 emissions reduct ion from LFO sav ings 47 47 47 47 47 237LFO for biomass transportation t/yr. 0.20 0.20 0.20 0.20 0.20 1CO2 emissions factor for transportat ion tCO2/t 3.14 3.14 3.14 3.14 3.14CO2 emission Reduction from transportation tCO2/yr. -0.6 -0.6 -0.6 -0.6 -0.6 -3
Carbon emissions reduction tCO2/yr. 47 47 47 47 47 234 The project is characterized with economical sustainability.
PROJECT REVENUES:
2010 2011 2012 2013 2014EnergyThermal Energy Sold to customers kWh/yr. 71,245 71,245 71,245 71,245 71,245Wood chips t/yr. 33 33 33 33 33O&M Costs EUR/yr. 1,072 1,072 1,072 1,072 1,072
TariffsThermal Energy Sold to customers EUR/kWh 0.142 0.142 0.142 0.142 0.142Wood chips EUR/t 35 35 35 35 35
Total Project RevenuesThermal Energy Sold to customers EUR/yr. 10,127 10,127 10,127 10,127 10,127Wood chips EUR/yr. -1,155 -1,155 -1,155 -1,155 -1,155O&M Costs EUR/yr. -1,636 -1,636 -1,636 -1,636 -1,636
Gross Profit EUR/yr. 7,336 7,336 7,336 7,336 7,336
The construction of the biomass energy facilities will improve the working
conditions of the operating personnel in MEGA Engineering Ltd. The
operation is characterized by a lower noise level, better hygiene and
decreased risks of failure.

98
Lessons Learnt
The proposed ESCO business scheme of ERATO Holding Plc will lead to the
proven economic and ecological benefits to MEGA Engineering Ltd. The
implemented fuel switch project is very efficient; the generated thermal
energy is high quality and this energy is sold to the customer at an
appropriate price.
The data analysis shown that this project is bankable with a very good
investment return.

99
2.1.5. ECOTHERM Project Ltd.
Description of the project
ECOTHERM Project Ltd is research and development organization with
core business activities connected with the development of prototypes,
testing and measurement of heating equipment and implementation of
new products in the market in Bulgaria and EU. ECOTHERM Project Ltd has
a large building in which is situated biomass training center with offices
and conference room for the training of salespeople and installers of
biomass heating equipment. There is also heating laboratory and large
warehouse in the biomass training center.
GBE Factory Model
The biomass training center was constructed in 2008. The separate
premises and warehouse of ECOTHERM Project Ltd are heated with hot
water generated by a hot water boiler with thermal capacity of 300kW,
using light fuel oil as a fuel. The condition of the temperature regimes in
the production premises where concentrate expert, operational staff and
trainees was not satisfactory.
ERATO Holding Plc has signed a HDC (Heating delivery contract) for
thermal energy sales. As a result of the project implementation (fuel switch
project) ECOTHERM Project Ltd will save 33 tons of light fuel oil or EUR
45,215 annually.
Quick Facts

100
LOCATION: Ring-road, Haskovo (Bulgaria)
HEATED SPACE (m3): 7,290 m3
TECHNOLOGY/IES: Biomass heating
SITE OWNERSHIP: ECOTHERM Project Ltd.
INVESTOR: ERATO Holding Plc. (ESCO provider)
PROJECT COST: 108,120 €
KEY PARTNERS: ECOTHERM Project Ltd.
CURRENT STATUS: Implemented
Design and construction
The project included construction of biomass boiler plant, including
biomass hot water boiler, wood chips warehouse, system for feeding of
chips into the boiler chamber, ash cleaning system, exhausted gases
cleaning system and PLC control system. Commissioning test and start-up
were also implemented. The hot water is transported through a pipe
network with length of 400 m and diameter of 150 mm to the local
substation. From the substation the hot water is transported to the
radiators and convertors in the biomass training center.
TECHNICAL DETAILS:
TOTAL SURFACE (m2): 2,700
BOILER CAPACITY (kWth): 300
TOTAL ANNUAL ENERGY (kWhth/yr.) 290,400
BOILER EFFICIENCY (%): 88
HOT WATER TEMPERATURE (oC): 90

101
WOOD CHIPS CONSUMPTION (t/yr.): 123
WOOD CHIPS CALORICITY (kWh/kg): 2.56
MONTHLY TOTAL THERMAL ENERGY GENERATED
0
10000
20000
30000
40000
50000
60000
70000
80000
Mon
thly
Ene
rgy
Con
sum
ptio
n,
kWht
h
2009-2010
2009-2010 14520 43560 58080 69696 75504 29040
Oct Nov Dec Jan Feb Mar
MONTHLY WOOD CHIPS CONSUMPTION
05000
100001500020000250003000035000
Mon
thly
Woo
d C
hips
C
onsu
mpt
ion,
kg
2009-2010
2009-2010 6207 18505 24674 29614 32068 12352
Oct Nov Dec Jan Feb Mar
After the project implementation the building of ECOTHERM Project Ltd is
supplied by hot water for heating through automatic biomass energy boiler
using wood chips. The wood chips with humidity up to 45% are produced
by wood creeper with capacity up to 15 m3/h. The generated thermal
energy is distributed to the consumers through constructed pipe network.

102
FIT and additional benefits
PARAMETERS OF INSTALLATION:
PROJECT DESIGN PREPARATION: January, 2009
DELIVERY AND INSTALLATION OF EQUIPMENT: March, 2009
BOILER HOUSE CONSTRUCTION: May, 2009
COMMISSIONING TEST AND START UP: July, 2009
PROJECT COMPLETION: August, 2009
THERMAL POWER (kWth): 300
THERMAL ENERGY PRICES (€/kWth): 0.142
Economic Basics
ERATO’s staff has a prepared business plan. The technical and financial
calculation of ESCO operation has been made. The ERATO Holding Plc
offers to the management of ECOTHERM Project Ltd ESCO operation
through energy contracting for selling of thermal energy. This energy is
measured through a certified gauge.
CONSUMPTION PARAMETERS
COSTUMER’S ENERGY COST (€/kWhth): 0.142
THERMAL POWER (kWth): 300
CONSUMPTION TE (Kwhth/yr.): 255,552
ANNUAL PROJECT REVENUES

103
THERMAL ENERGY SOLD TO CUSTOMERS (€/yr.): 36,324
WOOD CHIPS COSTS (€/yr.): 4,320
O&M COSTS (€/yr.): 4,100 approx.
CASH REVENUES (€/yr.): 27,905
ЕUR 36,324
ЕUR 4,100-
ЕUR 4,320-
-10,000ЕUR
-5,000 ЕUR 0 ЕUR 5,000 ЕUR 10,000ЕUR
15,000ЕUR
20,000ЕUR
25,000ЕUR
30,000ЕUR
35,000ЕUR
40,000ЕUR
Thermal Energy Sold toCostumer
Wood chips Costs
O&M Costs
FINANCIAL SCHEME
BASE PROJECT COSTS (€): 108,120
DEBT (€): 97,308
EQUITY (€): 10,812
INFLATION INDEX (%): 4.5
FIXED DISCOUNT RATE (%): 7
IRR (%): 25.4
NPV (EUR): 151,368
PAYBACK PERIOD (YR.): 4.4
BIOMASS PLANT
The biomass boiler plant use wood chips as a fuel. The wood chips are
stored in a separate warehouse, located next to the biomass boilers. The

104
wood chips are fed automatically from the warehouse to the Boiler hopper
by screw conveyor with length of 4 m.
From the boiler hopper the biomass is transported in the boiler chamber
by internal screws. The combustion of wood chips takes place in the
burning chamber. On the display of the control panel it is Possible to read
the current boiler output, load and all other relevant parameters. The
control panel is fitted with PLC control.
The hot water by the heat accumulator with a temperature of 90С is
transported to the distributing water collector by means of circulating
pump. The heating units in the rooms are supplied with hot water from the
distributing water collector. A returned water collector collects the water
used by the heating units that has a temperature of 70 С. The water is fed
from the returned collector into the water heating boiler by means of a
circulating pump.
TECHNICAL PARAMETERS
Nominal Thermal Power
Fuel Consumption
Maximum Fuel
Humidity
Maximum Water
Temperature
Maximum Water
Pressure
Water Capacity Length Height Width
(kW) (kg/h) (%) (оС) (МPа) (l) (mm) (mm) (mm)
300 132 45 90 0.25 1,310 5,100 3,150 1,500
All facilities of the boiler station are equipped with control and safety
valves as well as with control, measuring and automated devices.

105
Environmental & Economic Sustainability
Determination of the annual emissions of CO2 and of other noxious gases
is according to Commission Decision of 21.01.2004 establishing guidelines
for the monitoring and reporting of Greenhouse gas emissions pursuant to
Directive 2003/87/EC of the European Parliament and of the Council. The
emissions factors elaborated by the MOEW (Methodology for calculation
of emissions of noxious substances (pollutants) released into the
environment based on balance methods) have been used for the CO2 and
other noxious gases emissions assessment.
The CO2 emissions will decrease by 87 tons in 2010 and for the period
2010 - 2014 they will decrease by 436 tons, as a result of the project
implementation.
Emissions Characteristics 2010 2011 2012 2013 2014 Total
Light Fuel Oil Savings t/yr 33 33 33 33 33 165Light Fuel Oil Savings GJ/yr. 1313 1313 1313 1313 1313 6564CO2 emissions factor for LFO tCO2/GJ 0.0702 0.0702 0.0702 0.0702 0.0702CO2 emissions reduction from LFO savings 92 92 92 92 92 461LFO for biomass transportation t/yr. 1.55 1.55 1.55 1.55 1.55 8CO2 emissions factor for transportation tCO2/t 3.14 3.14 3.14 3.14 3.14CO2 emission Reduction from transportation tCO2/yr. -4.9 -4.9 -4.9 -4.9 -4.9 -24
Carbon emissions reduction tCO2/yr. 87 87 87 87 87 436
The ESCO project is characterized with economical sustainability.

106
PROJECT REVENUES:
2010 2011 2012 2013 2014EnergyThermal Energy Sold to customers kWh/yr. 255,552 255,552 255,552 255,552 255,552Wood chips t/yr. 123 123 123 123 123O&M Costs EUR/yr. 4,100 4,100 4,100 4,100 4,100
TariffsThermal Energy Sold to customers EUR/kWh 0.142 0.142 0.142 0.142 0.142Wood chips EUR/t 35 35 35 35 35
Total Project RevenuesThermal Energy Sold to customers EUR/yr. 36,324 36,324 36,324 36,324 36,324Wood chips EUR/yr. -4,320 -4,320 -4,320 -4,320 -4,320O&M Costs EUR/yr. -4,100 -4,100 -4,100 -4,100 -4,100
Gross Profit EUR/yr. 27,905 27,905 27,905 27,905 27,905
The construction of the biomass energy facilities will improve the comfort
conditions of the operating personnel in ECOTHERM Project Ltd. The
operation is characterized with a lower noise level, better hygiene and
decreased risks of failure.
Lessons Learnt
The proposed ESCO business model of ERATO Holding Plc will lead to the
proved economic and ecological benefits to ECOTHERM Project Ltd. The
implemented fuel switch project is very efficient; the generated thermal
energy is with high quality and this energy is sold to the customer on
appropriate price. The data analysis shown that this project is bankable
with very good returning of investment cost.
107
2.1.6. RODOPI Kardjali Plc.
Description of the project
RODOPI Kardjali Plc was founded in 1959 first as "Rodop" printing house
and has been bringing the traditions since that time of "mettre-en-page"
and typesetting. The company has the capacity to provide collared printing
of brochures, catalogues, leaflets, calendars, paper and cardboard
packaging. RODOPI Kardjali Plc works with a wide range of paper for the
requirements of its customers. The factory uses new computer
technologies and they have recently started in the polygraph business the
printing house started working with computers for the preparation of the
printer’s activity and they also bought large-format six-color printer.
GBE Factory model
The production workshops of RODOPI Kardjali Plc are located in a two-
storey brick building with a total heating volume of 3,800 m3. Cast-iron
radiators, connected to two service pipes are mounted in the workshops.
The boiler heating facility uses wood waste as a fuel for the production of
thermal energy. ERATO Holding Plc has signed a HDC (Heating delivery
contract) for thermal energy sales. As a result of the project
implementation RODOPI Kardjali Plc will save 11 tons of light fuel oil or
EUR 15,350 per year.
Quick Facts
LOCATION: 50 Republikanska Str., Kardjali (Bulgaria)

108
HEATED SPACE (m3): 3,800 m3
TECHNOLOGY/IES: Biomass heating
SITE OWNERSHIP: RODOPI Kardjali Plc.
INVESTOR: ERATO Holding Plc. (ESCO provider)
PROJECT COST: 25,800 €
KEY PARTNERS: RODOPI Kardjali Plc.
CURRENT STATUS: Implemented
Design and construction
The heating boiler facility uses wood logs with a humidity of 20% as fuel for
the production of thermal energy. A water heating boiler Atmos DC 100
with a unit heat capacity of 99 kW is mounted in the boiler room. The
boiler is designed for pyrolysis burning of wood logs with a high efficiency
in the combustion process - 80%. The hot water produced by the boiler
with a temperature of 80 С is supplied to the production workshops by
means of a circulating pump Grundfos UPS 32/80. The return water from
workshops with a temperature of 60 С is fed into the water heating boiler.
All facilities of the boiler room are equipped with control and safety valves
as well as with control, measuring and automated devices.
TECHNICAL DETAILS:
TOTAL SURFACE (m2): 1,407
BOILER CAPACITY (kWth): 99
TOTAL ANNUAL ENERGY (kWhth/yr.) 95,832
BOILER EFFICIENCY (%): 80

109
HOT WATER TEMPERATURE (oC): 80
WOOD LOGS CONSUMPTION (t/yr.): 41
WOOD LOGS CALORICITY (kWh/kg): 3.00
MONTHLY TOTAL THERMAL ENERGY GENERATED
2008-2009
4792
14375
19166
23000 24916
9583
0
5000
10000
15000
20000
25000
30000
Oct Nov Dec Jan Feb Mar
Mon
thly
Ene
rgy
Con
sum
ptio
n, k
Wht
h
MONTHLY WOOD LOGS CONSUMPTION
0
2
4
6
8
10
12
Mon
thly
Woo
d Lo
gs
Con
sum
ptio
n, t
2008-2009 2 6 8 10 11 4
Oct Nov Dec Jan Feb Mar
After the project implementation the production workshops of RODOPI
Kardjali Plc is supplied by hot water for heating through boiler using wood
logs. The wood logs with humidity up to 20% are delivered to the boiler
warehouse.

110
FIT and additional benefits
PARAMETERS OF INSTALLATION:
PROJECT DESIGN PREPARATION: March, 2008
DELIVERY AND INSTALLATION OF EQUIPMENT: April, 2008
BOILER ROOM RECONSTRUCTION: May, 2008
COMMISSIONING TEST AND START UP: June, 2008
PROJECT COMPLETION: August, 2008
THERMAL POWER (kWth): 99
THERMAL ENERGY PRICES (€/kWth): 0.123
Economic Basics
ERATO has prepared an energy audit and business plan. The technical and
financial calculation of ESCO operation has been made. The ERATO Holding
Plc offers to the RODOPI Kardjali Plc ESCO operation through energy
contracting for the selling of thermal energy. This energy is measured
through a certified gauge.
CONSUMPTION PARAMETERS
CUSTOMER’S ENERGY COST (€/kWhth): 0.123
THERMAL POWER (kWth): 99
CONSUMPTION TE (kWhth/yr.): 76,666
ANNUAL PROJECT REVENUES
THERMAL ENERGY SOLD TO CUSTOMERS (€/yr.): 9,408
WOOD LOGS COSTS (€/yr.): 2,250

111
O&M COSTS (€/yr.): 1,250 approx.
CASH REVENUES (€/yr.): 5,908
9,408 ЕUR
-1,250 ЕUR-2,250 ЕUR
-4,000 ЕUR
-2,000 ЕUR
0 ЕUR
2,000 ЕUR
4,000 ЕUR
6,000 ЕUR
8,000 ЕUR
10,000 ЕUR
Thermal EnergySold to Costumer
Wood Logs Costs O&M Costs
Ann
ual P
roje
ct R
even
ue (E
UR
/yr.) Thermal Energy
Sold to CostumerWood Logs Costs
O&M Costs
FINANCIAL SCHEME
BASE PROJECT COSTS (€): 25,800
DEBT (€): 23,220
EQUITY (€): 2,580
INFLATION INDEX (%): 4.5
FIXED DISCOUNT RATE (%): 7
IRR (%): 20.1
NPV (EUR): 33,540
PAYBACK PERIOD (YR.): 4.9
BOILER ROOM
The biomass boiler uses wood logs as a fuel. The wood logs are stored in a
separate warehouse, located next to the boiler room. RODOPI Kardjali Plc
has bought the produced thermal energy for heating of the production
workshops by the seller company – ERATO Holding Plc. The preparation of
the total invoice for the users is done based on the actual

112
consumed amount of thermal energy, measured by certified technical
devise.
TECHNICAL PARAMETERS
Nominal Thermal Power Efficiency Fuel
ConsumptionChamber capacity Weight Length High Width
kW % kg/h dm3 kg mm mm mm
99 80 26 400 780 1,120 1,530 980
All facilities of the boiler room are equipped with control and safety valves
as well as with control, measuring and automated devices.
11
11
11Hot Water
7
6
78 8
5
7
6 1 Heating Boiler10 2 Basin
7 3 Colector Feed Water4 Colector Return Water5 Mixing Valve6 Pump7 Valve
Biomass 8 Thermometer9 Control System
10 Safety Valve11 Consumers
1
2
9
3 4

113
Environmental & Economic Sustainability
Determination of the annual emissions of CO2 and of other noxious gases
is according to Commission Decision of 21.01.2004 establishing guidelines
for the monitoring and reporting of Greenhouse gas emissions pursuant to
Directive 2003/87/EC of the European Parliament and of the Council. The
emissions factors elaborated by the MOEW (Methodology for calculation
of emissions of noxious substances (pollutants) released into the
environment based on balance methods) have been used for the CO2 and
other noxious gases emissions assessment.
The CO2 emissions will decrease by 8 tons in 2010 and for the period 2010-
2014 they will decrease by 39 tons, as a result of the project
implementation.
Emissions Characteristics 2010 2011 2012 2013 2014 Total
Light Fuel Oil Savings t/yr 11 11 11 11 11 55Light Fuel Oil Savings GJ/yr. 116 116 116 116 116 578CO2 emissions factor for LFO tCO2/GJ 0.0702 0.0702 0.0702 0.0702 0.0702CO2 emissions reduction from LFO savings 8 8 8 8 8 41LFO for biomass transportation t/yr. 0.12 0.12 0.12 0.12 0.12 1CO2 emissions factor for transportation tCO2/t 3.14 3.14 3.14 3.14 3.14CO2 emission Reduction from transportation tCO2/yr. -0.4 -0.4 -0.4 -0.4 -0.4 -2
Carbon emissions reduction tCO2/yr. 8 8 8 8 8 39
The implemented ESCO project is characterized with economical
sustainability.

114
PROJECT REVENUES:
2010 2011 2012 2013 2014EnergyThermal Energy Sold to customers kWh/yr. 76,666 76,666 76,666 76,666 76,666Wood logs t/yr. 41 41 41 41 41O&M Costs EUR/yr. 1,250 1,250 1,250 1,250 1,250
TariffsThermal Energy Sold to customers EUR/kWh 0.123 0.123 0.123 0.123 0.123Wood logs EUR/t 55 55 55 55 55
Total Project RevenuesThermal Energy Sold to customers EUR/yr. 9,408 9,408 9,408 9,408 9,408Wood logs EUR/yr. -2,250 -2,250 -2,250 -2,250 -2,250O&M Costs EUR/yr. -1,250 -1,250 -1,250 -1,250 -1,250
Gross Profit EUR/yr. 5,908 5,908 5,908 5,908 5,908
The construction of the biomass energy facilities will improve the waking
conditions of the company staff in RODOPI Kardjali Plc. The operation is
characterized by a lower noise level, better hygiene and decreased risks of
failure.
Lessons Learnt
The proposed Heating Delivering Contract (HDC) through ESCO business
scheme of ERATO
Company will lead to the proved economic and ecological benefits to
RODOPI Kardjali Plc. The implemented fuel switch project is very efficient;
the generated thermal energy is of a high quality and this energy is sold to
the customer at a proportional price.
The data analysis shown that this project is viable with very good return on
the cost of the original investment.

115
2.1.7. Ebm-papst Mulfingen GmbH & Co.
Description of the project
The Ebm-papst Mulfingen GmbH & Co. KG is a producer of fans and
motors, blowers and pumps. When they planned a new branch in
Mulfingen, they took issues like RES, energy efficiency and climate
protection into consideration right from the beginning.
The company addressed different questions concerning renewable energy
sources, climate protection and the use of waste-heat.
The company installed solar panels, a heat pump, an innovative ventilation
system and took measures to utilize the waste heat. The company also
installed a storage system for heat that is coupled with the heat pump.
The heat pump is also used to cool the building if the outside-temperature
is above 24 degree.
Quick Facts
LOCATION: Hollenbach/ Germany
PLANT SIZE (kwe;kwt): photovoltaic: 153 kWp
TECHNOLOGY/IES: heat pump, photovoltaic panels, utilization of waste
heat, innovative ventilation system with EC fans.
SITE OWNERSHIP: Ebm-papst Mulfingen GmbH & Co. KG.
INVESTOR: Ebm-papst Mulfingen GmbH & Co. KG
PROJECT COST: 1 m Euro
KEY PARTNERS: N/ A
CURRENT STATUS: Realized

116
Design and construction
• Installation of a heat pump with a coefficient of performance
(COP) > 4;
• Utilization of industrial waste heat of the machinery;
• Installation of a 153 kWp-solar power-plant;
• Optimization of the heat distribution;
• Installation of pumps heating and cooling pumps of the energy-
efficiency class A, utilization of energy-saving ventilation systems.
FIT and additional benefits
ENERGY COSTS SAVED PER YEAR: 87. 485 Euro
ENERGY SAVED TOTAL: 91 %
ELECTRICITY SAVED: 19 %
THERMAL ENERGY SAVED: 99 %
ROI ON THE ADDITIONAL COSTS FOR EFFICIENCY MEASURES: 146 %
(estimation on the basis of fixed prices on energy (oil/ electricity))
Environmental & Economic Sustainability
When the company decided to build a new production facility in
Hollenbach, the aim was to cover the complete heating needs of the
facility (750.000 kWh/ year for the five separate buildings, 13600 m2
altogether).
One key element was to use the industrial waste heat that is emitted by
the machinery, robots and compressors.

117
A suppression ventilation system was installed that uses the waste heat/
high temperatures under the roof of the hall. This heat/ warm air can be
used to heat the other buildings (e. g. buildings with not so much heat-
emitting machinery like the canteen or the incoming goods department).
Excess heat is stored in an 11.000 hl sprinkler tank. This tank is also used as
a heat sink for the heat pump. If the outside temperature is above 24
degree, the buildings are cooled with the heat pump.
In comparison to a conventional system the consumption of electricity
decreased by 19% and that of thermal energy by 99 %.
Lessons Learnt
This is a very interesting solution for a manufacturing company because
different renewable energy sources and energy efficiency measures are
combined, with a clear focus on heating issues.
This model also includes obvious RES like photovoltaic or heat-pumps with
energy sources that are less common like the well thought out use of
industrial waste heat and the possibility to store the heat on a large scale
with the sprinkler tank.
Another interesting feature is the combination of the different needs and
possibilities of the buildings and their interconnection.
CO2 emissions were reduced from 340 tons to 43 tons a year.
118
2.1.8. SOLON Corporate Headquarter
Description of the project
SOLON is a leading producer of Solar PV systems, and dedicated to the
principles of sustainable production and consumption and consequent use
of renewable energy sources. The company’s newly constructed corporate
headquarters, joining administration and production under one roof, is a
display of those principles as well as the company’s constant striving for
innovation. Architects and designers have worked closely together to
create a smart, efficient, and highly productive building with a flexible,
positive, and energizing environment for the people within.
Gbe Factory Model
Reducing energy demand to ¼ of that in similar buildings was a key
demand as was to maximize generation on-site while the users’ comfort is
central. An integrated design and implementation process results in a
positive energy balance where total production exceeds consumption.
Quick Facts
LOCATION: Am Studio 16, 12489 Berlin (Germany)
PLANT SIZE (kwe;kwt): PV: 210 kWp
BIOGAS COGENERATION UNIT: 530 kWth, 230 kWel

119
TECHNOLOGY/IES: Biogas Cogeneration, Solar PV, wireless communication
technology, monitoring
SITE OWNERSHIP: SOLON SE
INVESTOR: SOLON SE
PROJECT COST: 47.000.000 €
KEY PARTNERS: EGS Plan GmbH Stuttgart
Design and construction
Design was guided by the goals of achieving a low heat load and primary
energy demand, high energy production and flexible working space.
ENERGY EFFICIENCY
For the façade, pre-manufactured panels were developed. Triple glazing
provides powerful insulation. Optimal sun protection is achieved by means
of external shading devices and radiation control glazing. Great attention
was paid to the possibility of natural ventilation via windows. Further,
small radiators are part of the panel. The high-tech envelope has excellent
insulating qualities, is made of quality and durable materials. (main: glass,
wood and steel).
Electricity needs are supported by a building-integrated photovoltaic
system with 210 kWp while a biogas cogeneration unit provides base loads
of both heat and electricity, including supply for an absorption cooling
machine in the summer. The demand for heating and cooling across the
building is achieved with a simple but effective technology, concrete core
activation: water pipes are integrated into the concrete ceilings/floors. In

120
this manner 80% of the heating demand of ca. 25 kWh/m2 net floor area
and 85% of the cooling demand (ca 30kWh/m2 net floor area) are covered.
The remaining part is covered via convectors. The positioning of the
building allows optimum use of natural lighting, but it is complimented by
low general and targeted work space lighting.
Building Automation. The building is equipped with innovative control
system. Users control their work space comfort via touchpad and PC, while
a system of wireless sensors monitor overall conditions, ensuring
operations optimization.
E-mobility: A special feature and showing the integral approach are the
eight company-owned electric scooters, fuelled by the PV system.

121
FIT and additional benefits
PARAMETERS:
POWER (kWp):
SOLAR PV 210 kWp
BIOMASS COGENERATION: 530 kWth, 230 kWel
FEED-IN-TARIFF PV (€/kWh): 0.4398
FEED-IN-TARIFF ELECTRICITY FROM BIOMASS CO-GENERATION (€/kWh):
0.0967
Economic Basics
The decision on following an integral concept is a display of the company’s
values and striving for innovation, a statement and demonstration of
possibilities for future workspace organization today. The building is also
part of an RTD project, a living laboratory for further progress and
innovation for tomorrow’s buildings.
FEATURES BUILDING ENVELOPE
U-value of exterior walls 1.20
U-value window (including frame) 1.20
U-value roof 0.23
U-value roof lights (including frame) 1.60
U-value of basement ceiling / floor plate 0.30
Average U-value of the building envelope 0.75
Construction: Hybrid medium-duty construction

122
NETWORK INFRASTRUCTURE AND ENERGY
Electricity network infrastructure, local district heating network, Building
integrated Solar PV system.
SOLUTION STRATEGIES AREAS CONCEPT
Integrated planning, mechanical ventilation, vacuum insulation, combined
heat and power using biogas, district heating network, own power supply,
investment in biogas plant, Photovoltaic, quality assurance and operational
optimization.
CONSUMPTION CHARACTERISTICS (2009) In kWh/m2
Heat energy consumption/demand measured 26, 60
Water heating /demand 13.40
Final energy heat (incl. hot water) 69.09 / (40.00)
Electricity consumption / demand 42.91
Primary energy consumption total 98.36
Primary energy feed-in 83.06

123
The dark green dot shows the overall energy balance is positive, providing
more energy than is consumed.
MONTHLY ENERGY BALANCE
Environmental & Economic Sustainability
LOCATION PARAMETRES
LOCATION: Berlin, Germany
ANNUAL GLOBAL RADIATION: 1050 kWh/m2a
ANNUAL MEAN TEMPERATURE: 9,3 °C
ENVIRONMENT: urban

124
ENVIRONMENTAL PARAMETERS
The solar PV produces approximately 258.000 kWh of electricity per
annum, the biogas co-generation unit with its 530 kWth contributes 100%
district heating based on renewable sources.
The total amount of CO2 avoided ranges between 600.000 and one million
tons per year.
Lessons Learnt
With the early set up of an interdisciplinary planning team and a careful
analysis of the design, functional and organizational and technical
possibilities, an optimal concept was developed. After nearly one year of
intensive fine tuning and adjustments, the building is now under normal
operation. It displays its qualities in terms of comfort and energy efficiency
not only through test measurements, but also from the employees’
feedback.

125
2.1.9. SMA Solar Technology AG
Description of the project
The SMA Solar Technology AG, a leading solar inverter producer, has in
2009 inaugurated the Solar Plant 1, a new production hall with a CO2-
neutral energy concept. Every day up to 4000 solar inverters of different
sizes and types can be produced, making it the currently largest factory of
its kind. While not a fully self-sufficient energy supply, the model of the
factory is linking regional availability of renewable energy sources with its
own production in a highly efficient and symbiotic manner.
A four-gigawatt production capacity spread over 18,000 square meters of
floor space based on a CO2 neutral concept with:
• PV system of 1,2 MW peak;
• Biogas co-generation unit;
• Heat recovery (compressed air);
• District heating, 98,5 % via co-generation;
• 100 % renewable energy use.
Quick Facts
LOCATION: Sonnenallee 1, 34266 Niestetal, Germany
PLANT SIZE (kwe;kwt): 1,2 MW (PV)
TECHNOLOGY/IES: Photovoltaic, Co-generation
SITE OWNERSHIP: SMA Solar Technology AG
INVESTOR: SMA Solar Technology AG
PROJECT COST: 9.500.000 €
KEY PARTNERS: EGS Plan GmbH Stuttgart

126
CURRENT STATUS: Realized
Design and construction
Design was guided by the principles of minimizing the energy demand and
CO2 neutralization via full use of renewable energy sources. High flexibility
for the production was another demand. Assembly lines can be changed
within hours. The energy and building technology follows suit equally open
to various uses.
The building shell of the factory conforms to low-energy-building standards
while cutting-edge technology ensures the optimum use of locally supplied
biogas for heating and electric generation. PV generated electricity is fed
on the low wastage side of the grid, and either used in-house or fed into
the grid.

127
CO2 neutralization involves drawing renewable electricity from the public
utility and combining the heat and power of the neighboring waste
incineration plant with the refined biogas obtained from two regional
installations in the internal co-generation unit. Another source of heat is an
electric compressor, whose waste heat is recycled into the ventilation
system, for example in cases of maintenance of other systems. A
condensing boiler is only used as a back-up.
Cooling is generated in two ways. An absorption cooling machine uses the
perpetual heat of the biogas plant to drive its cooling system. A vapor-
compression system is powered by electricity and functions in the same
way as a commercial air conditioning unit. The high lux needs (1000) were
responded to by using particularly efficient technologies and control for
lighting.
FIT and additional benefits
PARAMETERS OF PV INSTALLATION:
POWER (kWp): 1,2 MW
FEED-IN-TARIFF (€/kWh): 0.3448
(Installation larger than 1 MW and operational since 2009)
Economic Basics
The decision on the new factory with a climate neutral energy concept is to
demonstrate the company’s climate stewardship, and is more than an
investment in a new production site.

128
INVESTMENT AND ROE
ENERGY & BUILDING TECHNOLOGY COSTS:
• Ca. €9.500.000 ;
• Total Investments ca €10.200.000;
• Return on capital employed more to achieve efficiency levels:
21%.
GENERATION PARAMETERS
• Heat load 670 kW;
• Cooling load 1525 kW;
• Biogas-Co-generation 350 kWth, 225 kWel;
• Heat recovery compressed air 105 kW;
• District Heating 1600 kW;
• Gas-condensing boiler (back-up) 310 kW;
• Absorption cooling machine 270 kW;
• Vapor-compression system 2x 670 kW.
ENERGY DEMAND & CONSUMPTION
• Heat load 670 kW;
• Cooling load 1525 kW;
Annual energy costs: ca. 536.000 €.
Annual Electricity consumption: 5.200.000 kWh
Annual fuel consumption (biogas needed for the cogeneration unit):
1.700.000 kWh

129
BUILDING AUTOMATION & ENERGY MANAGEMENT
For heating, cooling and ventilation, some 3500 data points have been
installed, building control overall has 4300 data points. Communication via
BACnet ensures an optimal operation, flexible to react to current needs
and situations.
Measurement data points for production relevant consumption further on
enable monitoring and targeting via separate software, the modern way of
efficient and sufficient use of energy resources.
Environmental & Economic Sustainability
SOLAR INPUT: Global solar radiation in the region is about 1030 kWh/2
CLIMATE CONDITIONS: The climate diagram for the location.

130
GREENHOUSE GAS EMISSIONS
The amount of CO2 avoided per year (calculation based on GEMIS) is 1.700
tons/an M&T.
The integration of a large number of measurement points not only for
building automation, but also for energy consumption is on its own a
practical step for long term achievement of efficient operations in the solar
plant under various conditions.
Lessons Learnt
The key lesson is that a clever combination of possibilities for local on-site
and regional energy sources (renewable) allows a CO2 neutral industrial
application to be successful, and set standards for other industrial
applications.
131
2.1.10. Best Western Premier Hotel Victoria
Description of the project
The Best Western Premier Hotel Victoria is a 4 star city hotel with 69
rooms, a breakfast room and two cocktail bars, situated in Freiburg,
Germany.
They started their environmental project in 1985 but a big improvement
was done during spring of 2002 when they replaced old oil-based heating
system by a modern wood-pellet heating system with an exhaust-gas
cleaning system.
Afterwards, during the spring of 2007, eco-friendly air-conditioning for the
historic main house was put into operation putting further milestones on
the way to zero-emission hotel applying efficiency technologies helping
them saving electricity and money.
The Victoria Hotel has won numerous awards for its commitment for the
environment.
The environmental protection project in Hotel Victoria started in 1985. But
it was in 2002 when the hotel developed into a zero-emissions building,
referred to the CO2 emission value. The protection and care of its shared
environment and acting according to solid ecological principles, such as
environmental awareness, modernity and sustainability are the
preconditions for this hotel to operate.
Quick Facts
LOCATION: Am Colombipark, Eisenbahnstraße 54
79098 Freiburg, Germany

132
PLANT SIZE: Photov. panels =200m²
4 wind turbines (with 2 kW produced Power each)
ENERGY PRODUCED: Solar Energy: 21 000 kWh per year
Wind Energy: 70 000 kWh per year
TECHNOLOGY/IES: Photovoltaics and aeolics (wind)
SITE OWNERSHIP: Astrid & Bertram Späth
INVESTOR: Best Western
CURRENT STATUS: Realized
Design and construction
After starting with its environmental protection project and since 2002 the
hotel became a zero-emissions building (based on the CO2 value), due to
the constant and continuous application of modern solar, eolic and many
other environmental friendly technologies.
Its environmental performance is continuously improving thanks to its
environmental management system EMAS.
The optimum insulation of the building is a requirement for low energy
needs, therefore, 3 heat insulating panels were built in the windows of the
entire building. The rear building was completely insulated in 2009 and an
impressive primary energy requirement of 82 kWh/m² was reached, which
undershoots the set point of a new building by 70%. Intelligent air supply
units, through which an inflow of temperate air is possible, were
integrated in the face of the building. The inflowing air is adjusted to the
room size and number of guests in the room.

133
The heat for warm water and heating is up to 100% produced by only
renewable energy: a wood-pellet heater combined with a thermal solar
collector.
Oil heating was replaced by a modern wood pellet heater with exhaust gas
treatment. The heater has a maximum performance of 300 kW. This means
that about 100 tons of wood from natural finish saw dust are spent every
year. Wood, when burnt, produces the same amount of the gas carbon
dioxide (CO²) as it absorbed from the atmosphere during its growth. The
latter guaranties a closed CO2 circuit that is beneficial for the greenhouse
effect.
The thermal-solar energy plant with a collector area of 30 m² supports the
warm water production. During sunny days, the required amount of heat
for washing and showering is produced solely by the solar plant.
The environmentally friendly ground water cooling system was built in
2007 for the climate control of the hotel rooms. A pump furnishes 10 to 13
degrees (Celsius) cold water from a depth of about 16 to 20 meters from
the water well located in the hotel courtyard and supplies the heat
exchanger system. In the hotel rooms, the guests can adjust the requested
room temperature with convector ventilators. The cool water circulates
through a pipe system into the room before being then released back to
the ground (well) with a maximum temperature of 16 degrees Celsius
through an injection pipe, where it drains away and cools down.
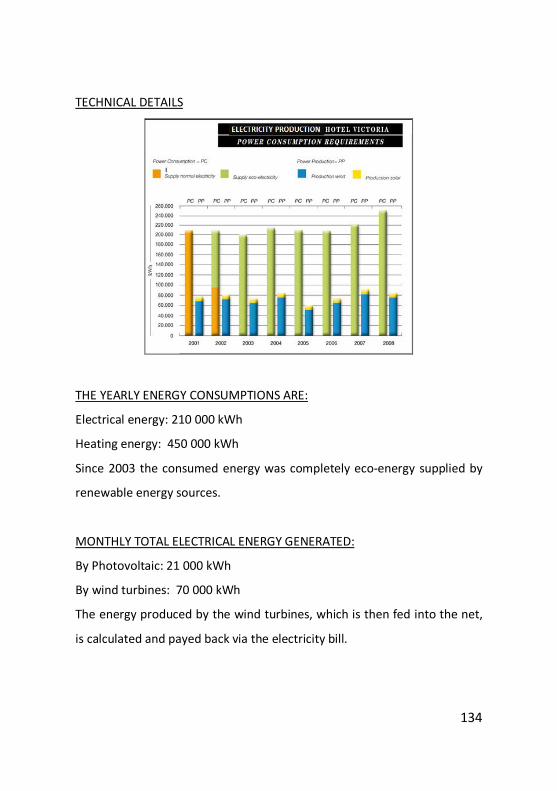
134
TECHNICAL DETAILS
THE YEARLY ENERGY CONSUMPTIONS ARE:
Electrical energy: 210 000 kWh
Heating energy: 450 000 kWh
Since 2003 the consumed energy was completely eco-energy supplied by
renewable energy sources.
MONTHLY TOTAL ELECTRICAL ENERGY GENERATED:
By Photovoltaic: 21 000 kWh
By wind turbines: 70 000 kWh
The energy produced by the wind turbines, which is then fed into the net,
is calculated and payed back via the electricity bill.

135
FIT and additional benefits
Its solar energy plant on the roof garden produces 21.000 kWh solar
energy per year. The four wind turbines also installed have a nominal
power of 2 kW.
Consequently almost all hotel rooms can be supplied with electricity. A
display panel at the reception desk illustrates the production of solar and
wind power.
The roof can be visited by guests and interested parties.
With its investment in the wind power station Ettenheim it produces about
70.000 kWh environmentally friendly wind power, which is a credit to its
consumption. In 2002 the hotel shifted to green electricity, which it
actually buys for a small surcharge from its power supply company EWS in
Schönau. With that surplus, the EWS arranges the installation of further
regenerative current generators in the region.
Economic Basics
The Best Western Premier Hotel Victoria is a major energy consumer. 210
000 kWh electricity and 450,000 kWh of heat energy are annually
consumed.
Each guest consumes about 30 kWh of energy per overnight stay. It saves
energy through smart technology applications without losing the comfort
standard required by its guests. The Hotel uses energy sources such as
sun, wind, water and wood coming from local production.

136
The solar power plant on the roof has a production capacity of 7,600 W per
year, which means 7,000 kWh of solar electricity. Thus, about one-quarter
of all rooms are supplied with electricity.
Through its participation in the wind power plant Ettenheim the hotel
contributes to the production of environmentally friendly wind power. Its
share in the 1.3 megawatt plant produces every year around 70,000 kWh
which are then calculated as bonus pay-back in the electricity bill.
Environmental & Economic Sustainability
The concept involves co-workers and guests actively in their approach to
the environment, criticism and suggestions are recorded, the will to try
something new and to maintain the achieved goals is also promoted.
As an exemplary environmental hotel, it wants to encourage others to
imitate their successful model. This applies to hotels, suppliers, guests,
partners, neighbors and businesses.
The energy consumption (electricity, warm water) is monitored and
entered into the monthly energy accounting. These out of plan fluctuations
are detected immediately. The accounting department also serves as a
basis for benchmarking and as a basis for a further saving measures. The
acquisition and systematization of the company from running up and the
energy and material flow, as for example, the purchase of regional and
organic products is planned in advance. Ideally, this leads not only to
improve the ecological, but also the economic and ecological performance
of its operations.
137
Through the use of durable, high-quality materials, it strives to avoid
superfluous renovation and construction waste.
When reconstructing or rebuilding the hotel pays particular attention to
environmentally friendly materials and uses water-soluble paints and
varnishes. Its environmental protection plans are continuing to develop. It
follows the guidelines that are given from the European Union under the
EMAS environment policy.
The combustion of pellets produces as much greenhouse carbon dioxide
gas as the wood has absorbed during its growth from the atmosphere. The
sustainable forest management of the Black Forest guarantees
furthermore that the CO2-circle is closed and no greenhouse effect is built.
The reduction of CO2 emissions annually is about 154 tons compared to
the old oil heating-system.
The hotel thus achieves the following value:
CO2 Emission-values:
Pellets = 0.025 kg/kWh
Natural gas = 0.224 kg/kWh
Eco-energy (EZWS)=0.051kg/kWh
Lessons Learnt
All key suppliers, guests and stakeholders are informed about
environmental protection and their business philosophy. In this way, the
hotel arranges meetings and guided tours for international groups,
environmental and medical journals and also for interested tourists.

138
A monitoring program was developed jointly with the Energy Agency of the
Freiburg Region, to be supervised on a monthly basis consumption of all
values. These results are accessible for all interested parties. The reduction
of annual CO2 emissions values thanks to its modern wood pellet heating
system, in comparison to the old oil heating system, is impressive.

139
2.1.11. Heineken Brewery
Description of the project
Heineken Slovensko has been the leader on the Slovak beer market for
over 11 years, with an ever increasing market share of approximately 45 %.
Heineken Slovensko has a strong brand portfolio with the famous
international brand Heineken, the most valuable Slovak brand Zlatý Bažant,
strong Slovak brands Corgo and Kelt, regional brands Martiner and Gemer
as well as popular foreign brands Krušovice, Starobrno and Desperados.
Heineken Slovensko brews its brands in Hurbanovo, the largest brewery in
Slovakia, established in 1969.
Quick Facts
Heineken Slovensko performance in energy consumption has been very
positive over the past year and the brewery managed to decrease the total
energy consumption from 153.1 MJ/hl in 2009 to 149.6 MJ/hl in 2010,
reaching the target of 155.2 MJ/hl.
The Heineken Slovensko brewery has met targets of 15% energy reduction
between 2002 and 2010 within the global “Aware of Energy” Programme,
which is aimed specifically at the reduction of thermal energy and
electricity use in production.
Design and construction
Renovated wastewater treatment plant, supplemented by anaerobic
treatment, which resulted in both increased capacity of waste water, but
also the production of renewable energy source (biogas).

140
In the construction of biogas plants provide:
Phase 1 - Project part:
• The study site (feasibility study)
• Connectivity Study - Request for mount point
• Project (spatial, construction, enforcement)
Phase 2 - construction part:
• From a foundation - the supply of construction work
• Delivery of the cogeneration unit
• Delivery of the biogas process
• Project start
Phase 3 - use / processing of waste heat from biogas plants:
• Secondary heat recovery operation
• Sales of heat to the surrounding buildings (heat pipes)
• Treatment of secondary heat for electricity generation
Phase 4 - servicing after starting the operation:
• Biogas Technology Service
• Providing running biogas plant - management protects
The cost structure needs to be based on a planned mid-long term supply
agreement for biofuel-biogas, in order to keep the principal operating
costs under control.
It is necessary to have chosen reliable suppliers of commodities not to
incur heavy penalties due to the unstable delivery of energy, insurance
costs, ordinary and extraordinary maintenance costs, safety costs, control
and monitoring costs…

141
FIT and additional benefits
Electricity used for own purposes. Brings benefits concerning the decrease
the external purchase of power, decreases operational costs.
Economic Basics Actually, brewery in Hurbanov has managed a 42% improvement since
2002. The thermal energy consumption decreased from 85.2 MJ/hl in 2009
to 82.9 MJ/hl in 2010, reaching the target of 85 MJ/hl set for 2010.
However, its future goal, which corresponds to the technical state of the
brewery, is to reduce thermal energy consumption by up to 77 MJ/hl or
even less.
Obviously, additional investments will be required. In the first stage they
plan to invest in heat recuperation from brew house vapors. In terms of
electricity consumption they achieved a decrease from 7.5 kWh/hl in 2009
to 7.4 kWh/hl in 2010, reaching the target of 7.8 kWh/hl.

142
Environmental & Economic Sustainability In 2011 the brewery starts using biogas from a wastewater treatment plant
for the co-generation of electric energy, increase OPI lines to optimize the
energy consumption and these changes to run alongside more simple
measures such as turning off lights when rooms or areas are not in use.
Lessons Learnt Utilization of the waste products in the food and distillery sector could
provide additional free sources for operating costs, or covering human
resources costs. The model of an energy self-sufficient firm allows for a
total reduction in the negative impact on the environment and a decrease
of the negative effect of CO2 emissions.

143
2.1.12. AMS Engineering GmbH
Description of the project
AMSEC building is a modern office building and computing center housing
more than 300 high end servers. The waste heat of the servers and the
floor distribution racks is used for heating the building. Cooling is
performed by heat pumps using groundwater. Compared to a conventional
office building 70% of the heating and cooling costs and 40% of electricity
costs can be reduced.
GBE Factory Model
Heating using waste heat of servers and the floor distribution racks.
Cooling is covered by heat pumps using groundwater, alternative re-
cooling systems implemented as architectural elements. The building has
6.500 m² office space, including event center, server rooms, laboratories
and workshops.
Quick Facts
LOCATION: Softwarepark 37, Hagenberg (Austria)
BUILDING SIZE (m2): 6.500 m2
30 kW CONTINOUS SERVER CAPACITY
TECHNOLOGY/IES HEAT: server waste heat using

144
SITE OWNERSHIP: AMS Engineering GmbH
INVESTOR: STIWA Group
PROJECT COST: not known
CURRENT STATUS: Realized
Design and construction
• Building automation (intelligent systems for: lightning,
ventilation, heating, cooling, software);
• "Software heats - Soil cools”;
• IT-technology;
• Integrated planning process;
• Planning of heating, cooling, ventilation, electrical
installation and control center.
ENERGY CONCEPT
• 100% of the heat for the building is supplied from waste
heat generated by the servers.
RECOOLING SYSTEM FOR SERVER HEAT
• alternative recooling systems in summer.

145
Building recoolingsystem in summer
Temporary storage of 300 m3 water in building basement for recooling
Serverhousing recooling in summer
ENERGY EFFICIENCY MEASURES
• Optimized building envelope;
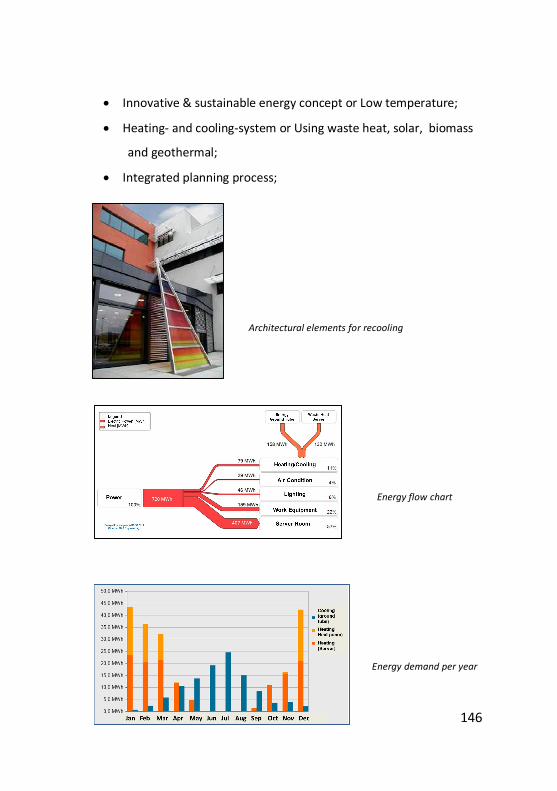
146
• Innovative & sustainable energy concept or Low temperature;
• Heating- and cooling-system or Using waste heat, solar, biomass
and geothermal;
• Integrated planning process;
Architectural elements for recooling
Energy flow chart
Energy demand per year

147
2.1.13. Va.lu.va. Srl
Description of the project
Va.lu.va Frutta s.r.l. deals with trade and production in the fruit processing
(pears, apples, cherries, Persimmons). This case study relates to the new
warehouse situated in Via Torricelli, 52 (Verona, Italy).
GBE Factory Model
Here, there is a large and efficient store, which is equipped with many big
fridges used to conserve the fruit. The warehouse roof has been covered
with Photovoltaic panels after the old asbestos roof panels were removed.
Thanks to the new solar energy’s system, the warehouse produces about
75% of the energy it requires.
Quick Facts
LOCATION: Via Torricelli, 52 - Verona (Italy)
PLANT SIZE (kwe;kwt): 1.147,47 mq
TECHNOLOGY/IES: Photovoltaic panel
SITE OWNERSHIP: Va.lu.va. S.r.l.
INVESTOR: Va.lu.va. S.r.l.
PROJECT COST: 500.000 €
KEY PARTNERS: Va.lu.va. S.r.l.
CURRENT STATUS: Realized
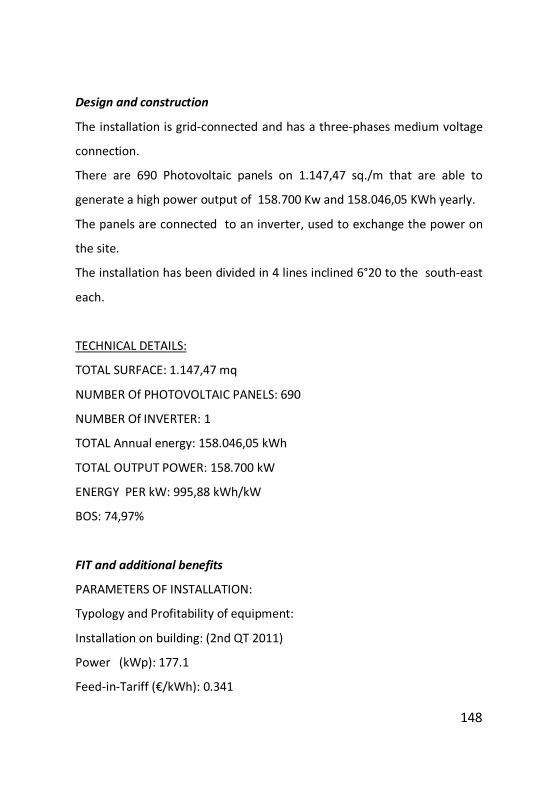
148
Design and construction
The installation is grid-connected and has a three-phases medium voltage
connection.
There are 690 Photovoltaic panels on 1.147,47 sq./m that are able to
generate a high power output of 158.700 Kw and 158.046,05 KWh yearly.
The panels are connected to an inverter, used to exchange the power on
the site.
The installation has been divided in 4 lines inclined 6°20 to the south-east
each.
TECHNICAL DETAILS:
TOTAL SURFACE: 1.147,47 mq
NUMBER Of PHOTOVOLTAIC PANELS: 690
NUMBER Of INVERTER: 1
TOTAL Annual energy: 158.046,05 kWh
TOTAL OUTPUT POWER: 158.700 kW
ENERGY PER kW: 995,88 kWh/kW
BOS: 74,97%
FIT and additional benefits
PARAMETERS OF INSTALLATION:
Typology and Profitability of equipment:
Installation on building: (2nd QT 2011)
Power (kWp): 177.1
Feed-in-Tariff (€/kWh): 0.341

149
Tariff’s bonus (€/kWh): asbestos+ 10%: 0.034
Feed-in-Tariff + bonus (€/kWh): 0.375
Economic Basics
The economic rationale was to install a photovoltaic system to reduce the
buildings carbon footprint and reduce energy costs.
CONSUMPTION PARAMETERS
Costumer’s energy cost (€/kWh): 0.15
Power: MT (200 kW)
Consumption EE (kWh/annual): 204.000
PARAMETERS OF ECONOMIC’S SIMULATION SALE
Inflation EE: 4.0%
Maintenance and insurance cost: € 9.000 approx.
System’s Depreciation charge: 9%
Discount Rate: 3.0%
IRAP (TAX): 3.90%
IRES (TAX): 27.50 %
SIMULATION’S TECNICALS PARAMETERS
Self-consumption: 100 %
Annual performance degradation: 0.8 %
% Requirements covered by photovoltaic energy: 74.97%

150
Environmental & Economic Sustainability
In accordance with the area and its related solar belt, the average monthly
production is set out in the table below (amount per KWp installed). The
database used is tab UNI10349 which produces the optimal productivity.
Gen 31 1,16 36 6.376Feb 28 1,82 51 9.032Mar 31 2,52 78 13.814Apr 30 3,00 90 15.939May 31 3,58 111 19.658Jun 30 3,83 115 20.367Jul 31 4,10 127 22.492Aug 31 3,87 120 21.252Sep 30 3,37 101 17.887Oct 31 2,55 79 13.991Nov 30 1,47 44 7.792Dec 31 1,35 42 7.438
994 176.0372,72 481,71
Average daily producibility (kWh/kWp)
Annual average daily
Total monthly production (kWh7kWp)
Total
MonthTotal monthly
producibility (kWh/kWp)
Day
Va.lu.va.
TOTAL MONTHLY TREND ANALYSIS OFF THE YEAR:
The totally energy production from this kind of system is green-energy;
therefore this is a highly environmentally friendly system.
CO2 saved: 88.0 ton/Year
Also the system allows us to reduce our dependency on petrol and
carbon fuel.
PETROL saved: 5.788 barrel/year

151
Lessons Learnt
This is a very efficiently and interesting solar system model because it
allowed a big company with a high energy request such as VA.LU.VA S.r.l.
to generate its own energy’s requirements.
Besides, looking at the data, the economic feasibility of this investment is
clear.
152
2.1.14. Carrera Spa
Description of the project
Carrera is an Italian company, located in Verona, which has developed and
maintains the secret of its success – namely, the ability to combine cutting-
edge technology with craftsmanship, to transform a delicate flower like
cotton into beautiful and tough products in the meantime while respecting
the environment.
GBE Factory Model
The building roof has been covered with Photovoltaic panels in all areas.
The logistic hub’ roof has been covered with Photovoltaic panels after the
old asbestos roof panels were removed. Thanks to the new solar energy’s
system, the warehouse produces about 100% of the energy it needs.
Quick Facts
LOCATION HQ: Via Sant’Irene - Caldiero - Verona (Italy)
LOCATION PV SYSTEMS: Warehouse in Stallavena (Verona) and Logistic hub
in Povegliano Veronese (Verona)
TOTALE PLANT PV SIZE: 3.500 sq/m
TECHNOLOGY/IES: Photovoltaic panel
PV SYSTEMS NUMBERS: 3 (19.8, 110, 215)
SITE OWNERSHIP: Carrera Spa
INVESTOR: Carrera Spa
PROJECT COST: €1,000,000
KEY PARTNERS: Carrera Spa
CURRENT STATUS: Realized

153
Design and construction
Installation type is grid-connected and has a three-phase medium voltage
connection.
The installation has been divided into 3 photovoltaic systems: 2 warehouse
and plain roof in Warehouse Site and 1 warehouse roof in the Logistics hub
Site.
There are 1.590 Photovoltaic panels on 5.580 sq/m that are able to
generate a high output power in the region of 344,8 kWp and 357.902
kWh annualy.
The panels are connected to an inverter used to exchange the power on
the site.
TECHNICAL DETAILS
TOTAL SURFACE: 1.590 sq/m
NUMBER OF PHOTOVOLTAIC PANELS: 1.590
NUMBER OF INVERTER: 6
TOTAL Annual energy: 357.902 kWh
TOTAL OUTPUT POWER: 344,8 kWp
ENERGY PER kW: 1.038 kWh/kWp
BOS: 74,97%
TOTAL ANNUAL ENERGY CONSUMPTION
Annual energy consumption 435.000,00 KWh
154
FIT and additional benefits
PARAMETERS OF INSTALLATION:
TYPOLOGY AND PROFITABILITY OF EQUIPMENT: Installation on building
(2009-2010)
POWER (KWP): 344,8
AVERAGE FEED-IN-TARIFF (€/KWH): 0,421
Economic Basics
The economic rationale was to install a photovoltaic system to reduce the
buildings carbon footprint and reduce energy costs.
CONSUMPTION PARAMETERS
COSTUMER’S ENERGY COST (€/KWH): 0,16
POWER: MT (300)
CONSUMPTION EE (KWH/ANNUAL): 435.000
PARAMETERS OF ECONOMIC’S SIMULATION SALE
Inflation EE: 3%
Operations & Maintenance and insurance cost: € 8,000 approx.
SYSTEM’S DEPRECIATION CHARGE: 9%
DISCOUNT RATE: 3%
IRAP (TAX): 3,9%
IRES (TAX): 27.5 %

155
FINANCIAL DATA
Financial Index 100% equity
IRR 20 years 14,07%
IRR 25 years 14,27%
Revenues 20 years € 1.968.383
Revenues 25 years € 2.208.672
Payback Period 6,41
Financial Index
30% equity
70% bank financing
IRR 20 years 30,83%
IRR 25 years 30,88%
Revenues 20 years € 1.695.766
Revenues 25 years € 1.936.054
Payback Period 3,21
Environmental & Economic Sustainability
In accordance to the area and its related solar belt, the average monthly
production is set out in the table below (amount per KWp installed).
The database used is table UNI10349 with respect to the optimal
productivity.

156
Gen 31 1,19 37 12.758Feb 28 1,93 54 18.619Mar 31 2,61 81 27.929Apr 30 3,13 94 32.411May 31 3,74 116 39.997Jun 30 4,00 120 41.376Jul 31 4,29 133 45.858Aug 31 4,03 125 43.100Sep 30 3,50 105 36.204Oct 31 2,68 83 28.618Nov 30 1,53 46 15.861Dec 31 1,42 44 15.171
1.038 357.9022,84 979,23
A verage daily
p r oducib il it y ( kWh/ kWp)
Annual average daily
T o tal mo nthly
pro ductio n (kWh7kWp)
Total
MonthT o tal
mo nt hly p roducib il it y (kWh/ kWp)
Day
Carrera Spa
TOTAL MONTHLY TREND ANALYSIS OVER THE YEAR:
The totally energy production from this kind of system is green-
energy, therefore this is an extremely environmental friendly system.
179,0
Contribution to the environmentCO2 emissions avoided (tons/year)

157
Also the system allows Carrera to reduce their dependency on petrol and
carbon fuel.
11.767
Compsumption of oil avoidedOil saved (barrel/years)
Lessons Learnt
This is a very efficient and interesting solar system model because it has
allowed a big company with a high energy requirement such as Carrera to
generate its own energy’s needs.

158
2.1.15 Johann Pengg AG
Description of the project
As the only Austrian manufacturer of oil tempered sprung steel wire, the
Joh. Pengg AG in Thörl/Styria, has specialized its product line for
applications in the automotive, electrical and machinery sectors.
Manufacturing oil tempered sprung steel wire is an highly energy intensive
process with several heating and cooling steps.
GBE Factory Model
The Project shows the potential of using renewable resources and the
energy amounts that could be saved through more efficiency in the
production process.
Using a hydro-electric power plant for electricity and a biomass plant for
heat and hot water.
SPECIFIC PROJECT GOALS:
1. Analyze the current energy flow (Sankey diagram), to assess
the potential savings;
2. Increase the energy conversion efficiency;
3. Investigate the possibilities to increase the use of renewable
energy sources.
Quick Facts
LOCATION: 8621 Thörl (Stmk)

159
ELECTRICITY TECHNOLOGY: Hydro-electric power plant
TECHNOLOGY/IES HEAT: Biomass, Heat recovery
SITE OWNERSHIP: Joh. Pengg AG
INVESTOR: Joh. Pengg AG
PROJECT COST: not known
KEY PARTNERS: Johanneum Research
Design and construction
CURRENT ENERGY FLOW
Total energy consumption of 45,35 MWh/a
• 26% Electricity;
• 74% Natural Gas.
What is Electricity used for:
• 58% is used for mechanical energy to operate the manufacturing
lines;
• 32% is used for creating heat;
• 6% is used for lighting;
• 4% is used for pressurized air.

160
What is Natural Gas used for?
• 60% is used for creating the direct process heat in the tempering
process;
• 29% is used for the production of hot water process heat and to
heat production buildings;
• 5% to operate the gas radiators;
• 3% for heating offices and hot water production;
• 3% or auxiliary power and the exomat.

161
ENERGY CONVERSION EFFICIENCY
During the productions steps where a high consumption of energy is
required, new ways of using waste heat were established.
To increase the use of renewable energy it was suggested to replace the
natural gas boiler by a biomass fired boiler for the production of the hot
water process heat thus reducing the use of natural gas by 9,9 MWh/a.
In addition production waste can be incinerated in the boiler. The
increased use of hydroelectricity was not recommended for economic
reasons.
ENERGY REDUCTION POTENTIAL
The analysis of the energy conversion processes identified measures
leading to a reduction of 5,70 Mio kWh/a of natural gas and 1,13 Mio
kWh/a of electricity per annum.
The biggest potential saving can be seen in the use of waste heat for the
gas burners, heating the wire at the beginning of the tempering process.

162
2.1.16 Sunny Energy Building
Description of the project
This highly energy-efficient office building is a reference project to increase
the popularity of highly energy-efficient construction projects. The
“ENERGY base” office building was planned and put together by architects,
scientists and specialist consultants in an integrated planning process. It is
an outstanding building due to its innovative architecture, advanced
building technologies and the highest possible level of user comfort. The
particularly low, cost-saving energy consumption is in line with the passive
house standard is completely covered by renewable, ecologically
sustainable energy sources. The building is exemplary in its ability to
harmonize economic and ecological considerations in the construction of a
state-of-the-art office and economically viable commercial real estate.
GBE Factory Model
The building concept is based on three core qualities:
• Energy efficiency (high developed energy- and facility-
management);
• Application of renewable energy sources (geothermal energy,
solar power);
• Highest level of comfort for occupants.
By the use of different solutions an energy reduction of 80% can be
achieved, this means a reduction of 200t/a CO2, has been reached.

163
Quick Facts
LOCATION: Vienna (Austria)
BUILDING SIZE (m2): 7.500m2
TECHNOLOGY/IES: Passive house office building
SITE OWNERSHIP: WWFF
PROJECT COST: €14. Mio.
KEY PARTNERS: POS Architects; Schneider, U.
CURRENT STATUS: In operation since 2008
Design and construction
Three main principles serve as the underlying basis for the passive house
concept:
• insulation against the loss of heat;
• air-tightness (sealed construction);
• controlled ventilation with heat recovery.
One of the innovative features of ENERGY base is the exclusive use of
renewable energies. The passive house standard makes it possible to keep
energy requirements at a particularly low level.

164
The passive application of solar energy will also be implemented at
ENERGY base.
ENERGY CONCEPT
The generated geothermal energy completely covers all heating and
cooling needs.
Furthermore, a 400m² photovoltaic facility located on the south facade of
the building will also supply part of the total electricity requirements.
HEATING AND COOLING BY GEOTHERMAL ENERGY:
An innovative ventilation concept enables the integration of solar energy in
summer by means of solar cooling (solar absorption supported air
conditioning), as well as the use of plants to ensure ecologically-friendly,
controlled humidification in winter.

165
FIT and additional benefits
PARAMETERS OF INSTALLATION:
Heating Energy: <11 kWh/a/m2
Cooling Energy: <15 kWh/a/m2
=>Certified passive building
Thermal insulation 26 cm, 75% heat and moisture recycling#
400 m2 Photovoltaic with 46 kW peak (on south building side. 37.000 kWh
solar energy
Environmental & Economic Sustainability
ACTIVE AND PASSIVE USE OF SUN ENERGY
The passive thermal sun energy benefits are directly used on south facing
rooms and transferred to use the energy indirectly for north facing rooms.
In winter the building frontage traps the energy from the sun while in
summer the frontage shades itself automatically.

166
On the south building side is a 400 m2 Photovoltaic sun energy plant where
around 37.000 kWh solar energy can be produced in one year.
For solar Cooling there is a 285 m2 thermal collector for cooling and
dehumidifying air.
The passive house standard makes it possible to keep energy requirements
at a particularly low level. The generated geothermal energy completely
covers all the heating and cooling requirements. Furthermore, a 400m²
photovoltaic facility located on the south facade of the building also
supplies part of the buildings total electricity requirements.
Lessons Learnt
The building is exemplary in its ability to harmonize both economic and
ecological considerations in its construction.
This highly energy-efficient office building is a point of reference to
increase the popularity of highly energy-efficient construction projects.

167
An innovative ventilation concept enables the integration of solar energy in
summer by means of solar cooling (solar absorption supporting air
conditioning), as well as the use of plants to ensure ecologically-friendly,
controlled humidification in winter.

168
2.1.17 NUNCAS Spa
Description of the project
The Nuncas company manufactures products for home cleaning and care,
and has always been very concerned about renewable energy sources
innovation. In 2009 it won the award “Ecotech 2009-11 edition-4TH
Category” for enterprises that display excellence in their eco-values.
The new building was commissioned in 2005 and represents a clear signal
of the awareness of the company to take care both of health and
environmental impacts. For these reasons Nuncas developed a low- energy
consumption building with zero emissions, combining many renewable
energy sources, as for example a photovoltaic plant composed by 264
modules of 135KW power that is able to supply the energy required by the
entire building.
The finished plant is totally automatic with the possibility to check and
manage in real time the use of renewable energy. Radiant tube feeds were
installed over the roof covering with well water in order to avoid thermal
accumulation in the summer and the sudden change of temperature
between the seasons.
GBE Factory Model
The model is “passive building” – these kind of plants are designed for a
low energy consumption, to be covered by renewable energy sources. The
building is equipped with several renewable energy systems:
• the photovoltaic plant is composed of 264 modules of about 135
kw of power and is able to provide energy to the entire building;

169
• There is no heating pump;
• The entire plant is completely automatic, and it is equipped with a
system that is able to check and monitor the use of renewable
energy for the production of electricity, heating and cooling;
• Electric light is regulated by a presence detector, while natural
lighting is the primary source of light;
• Adjustable “skylights” serve to focus natural daylight for all the
principal rooms.
Quick facts
LOCATION: Settimo Milanese (Milano)
BUILDING SIZE: Warehouse surface: 5.000 sq m;
Warehouse volume: 70.000 m3; Office surface: 2.500 m2; Office volume:
10.000 m3
RENEWABLE ENERGY INSTALLED (kwe; kwth): PV plant 134,16 kwe;
Heating pump 54-296 KW
TECHNOLOGY/IES: Heat pump, Circulation of well water on the roof of the
building, automatic curtain/blinds adjustment, Solar panels for the
production hot water, photovoltaic panels, Lighting (adjustable skylights).
SITE OWNERSHIP: Nuncas Italia
INVESTOR: Nuncas Italia

170
Design and construction
The demand for heating and cooling across the building is achieved with a
heat pump that permits the heating and cooling of the water.
However the warehouse is heated with a system of radiating panels
powered by boilers, recovering the latent heat of vapor.
Natural ventilation is achieved by several openings realized in the lateral
walls and all windows are equipped with thermal glasses and sunshade
curtains.
Electricity needs are supported by a photovoltaic plant composed of 624
solar panels made of monocrystal silicon; every single panel is able to
produce around 215W, with a total power production of 134,16 kw.
The entire plant is completely automatic, and is equipped with a system
that is able to check and monitor the employment of energy sources for
the production of electricity, heating and cooling. In addition electric light
is regulated by a presence detector, and it is takes into account natural
daylight light..
The plant is also equipped with a supervision system and a pc controller
that allows a central operator to monitor and adjust the system on a 24/7
basis.
Warehouse surface: 5.000 mq
Warehouse volume: 70.000 m3
Office surface: 2.500 mq
Office volume: 10.000 m

171
FIT and additional benefits
The principles of economic sustainability of investment on RES is based on
incentive tariff for photovoltaic system (with the rate granted in case of
consumption of the energy produced on the spot: 0,36 cent*KWh, in 2007)
and on credit taxation for the heating pump (55% for three years).
Furthermore the energy savings will pay for the increased costs of the
original build and for the control system. The actual real final market value
of the building has been enhanced by the installation of these energy
saving devices.
COSTS OF THE FACTORY BUILDING
The construction cost difference between the Nuncas building, compared
with an equivalent traditional one built without all of these
environmentally friendly measures, is about 30% more.

172
Economic Basis
However an economic return was not the primary reason that prompted
the company to build such a building. Instead the owner of Nuncas wanted
to emphasize his commitment to environmentally friendly behaviour and a
comfortable working environment, that puts employees at their ease.
Nevertheless, the additional investment in PV has a payback period
estimated at 8-10 years, while the heat pump in less than five.
Environmental & Economic Sustainability
One of the most important results is the CO2 emissions avoided with the
use of the integrated plant.
Overall, the amount of CO2 emissions reduced from the design of this
building is around 302 tons per annum.
The building obtained in 2009 the certificate of a Class A Building from
Region Lombardy.
CO2 SAVINGS
Summary of CO2 savings
Description Annual savings
(project data)
Actual savings (from January
2008 to the end of 2011)
Condensing boiler 18.4 80.6
Heating pump 178.0 1247.66
Circulation of well
water on the roof
2.5 7.61

173
of the building
Automatic curtains
adjustment
6.5 12.52
Solar panels for
hot water
production
0.7 2.86
Photovoltaic
panels
82.1 286.33
Lighting (sky lights) 14.7 140.54
TOTAL CO2 302.9 t 1778.12 t
The actual saving values are checked and verified by electronic heat-
meters supplied from Siemens for the heating pump, solar panels for hot
water production and circulation of well water. The value from the
instruments (Siemens) are compared with a standard installation and the
results are shown in a table on our web-site.
As regards the lighting, every electrical panel is provided with multi-meters
which check the electrical consumption of the lights compared with
standard lighting.
As has been already said, the decision to build the new building by Nuncas
with their vision of efficiency and energy sustainability goes way beyond
only pure economic reasoning. We can say however, that for all companies
with the spirit and foresight of Nuncas it has proven economically
profitable for the direct effects of the savings achieved, the economic

174
incentives obtained, boost to their corporate image, improvement of the
working environment and the positive involvement of the workers
Lessons Learnt
The building of Settimo Milanese, started in March 2007, hosts both the
directors offices and the warehouse for the storage of finished products.
It’s important because it is one of the first examples of totally sustainable
and self-sufficient buildings created in Lombardy. The plants have been
constructed with the most advanced renewable energy sources
technologies and represent a great example of a green blue energy factory.
Through this project the company management wanted to emphasize the
centrality of employees in corporate life and the importance of the work
environment, with an important enhancement to the in companies
reputation.
The building was designed with climate parameters that go back about a
decade ago and that now have changed, the summer air conditioning
system struggles when the outside temperatures are at their highest. This
shows that even a modern high-tech innovative building must be designed
so that it can adapt its functionality to future climate change and
environmental modifications.

175
2.1.18 ZEROCENTER
Description of the project
Starting from the initial idea to invest in the building of a new commercial
centre (Zero Centre), the investors considered the building of a new
structure using the very best energy efficiency and heat saving solutions, in
conjunction with renewable sources. The result was a commercial building
of both high-tech and low power consumption with the added advantage
of using as its power renewable energy.
GBE Factory Model
The Shopping Centre is equipped with a centralized plant for the supply of
heating and cooling. The plant is characterized by a co/tri/generation
system based both on methane and on renewable energy sources (the
energy which comes from renewable energy sources is superior or equal to
10% of the total energy produced).
Thanks to the wood pellet boilers and cogeneration solutions it is possible
to avoid C02 emission equal to approximately 25-30% per year, and that

176
has allowed the building to obtain many Energy Efficiency Titles (TEE). An
ESCO (Energy Service Company) built the centralized plant through project
financing, together with an area “developer” (75% ESCO 25% developer).
Following this ESCO started managing the plant and provides the user with
both heating and cooling. The GBE factory model is “one to many”, that
means the management of a small local grid for the electric and thermal
energy production. The chosen model creates a value chain that maintains
“in balance” all the stakeholders.
Such a balance takes into account different time schedules:
1. Developer: the developer obtained immediate cost savings on the
investment;
2. ESCO: the ESCO intervened only marginally during the
management phase of the energy business;
3. Users: the users achieved savings on management costs.
Quick facts
LOCATION: Zero Branco (TV) Italy
FACTORY SIZE: 24,000 square meters
124,000 cubic meters (gross)
CENTRAL ENERGY PLANT:
- Heat (Hot water) 2,990 kw (t)
- Refrigeration 4,840 kw (f)
- Electricity 200 kw (e)
TECHNOLOGY/IES: Co- Tri-generation (methane gas)
Renewable energy sources (pellets boiler)

177
ENERGY SALE TARIFF: <10% than traditional solutions
SITE OWNERSHIP: Real Estate Solution S.P.A
INVESTOR: Real Estate Solution S.P.A
ENERGY PLANT COST: around €2.7 ML
KEY PARTNERS (E.S.CO.) ASTRIM S.P.A.
CURRENT STATUS: Operative (May 2011)
SHORT RES INVESTMENT DESCRIPTION: High temperature heating
generator fed by pellet boiler with a power of 300 kW(t) and a yield of
93%.
Design and construction
Starting from the initial idea to invest in the building of a new commercial
centre, the best energy solutions have been used, in order to create a high-
tec building based on renewable energy sources. The best model to supply
the anticipated demand for heating and cooling across the building has
been chosen. Particular attention was paid to primary energy
transformation, hence the plant is composed of:
• Hot water heater powered through a battery;
• Water refrigerator system with EER value >6,0;
• Evaporative tower with fluent temperature;
• Electric/ thermal tri- generation;
• Renewable energy sources (pellet boiler);
Plants Solution used:
• Maximization of primary energy transformation process: natural
gas and electricity;

178
• Distribution of heat transfer fluids with a 4-pipe system;
• Adoption of thermal jumps to reduce the fluid mass;
Plants Solution employed:
• Maximization of primary energy transformation process: natural
gas and electricity;
• Distribution of heat transfer fluids with a 4-pipe system;
• Adoption of thermal jumps to reduce the fluid mass;
The technology core is composed of:
• Thermal power plant gas based: equipped with 3 hot water
heaters (fed through methane) - Total power: 2.800 kw;
• Thermal power plant based on renewable energy source:
equipped with 1 hot water heater (fed through pellet) - Total
power: 300kw(t);
• Cogeneration plant: Equipped with 1 co-generator with high
performance (fed through methane gas);
• Total power: 200kw;
• Total power (recoverable): 290kw;
• Central cooling equipped with 3 group.
EXPECTED ENERGY PRODUCTION
Thermal energy: 900.00kwh/year
Cooling energy: 2.400.000kwh/year
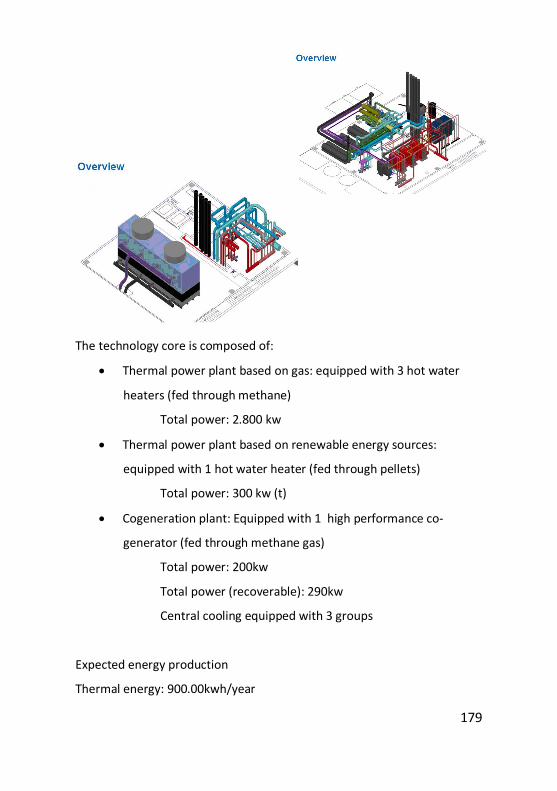
179
The technology core is composed of:
• Thermal power plant based on gas: equipped with 3 hot water
heaters (fed through methane)
Total power: 2.800 kw
• Thermal power plant based on renewable energy sources:
equipped with 1 hot water heater (fed through pellets)
Total power: 300 kw (t)
• Cogeneration plant: Equipped with 1 high performance co-
generator (fed through methane gas)
Total power: 200kw
Total power (recoverable): 290kw
Central cooling equipped with 3 groups
Expected energy production
Thermal energy: 900.00kwh/year

180
Cooling energy: 2.400.000kwh/year
FIT and additional benefits
Thanks to the high efficiency co-generation plant it was possible to obtain
Energy Efficiency Titles (TEE) which consist of 100 Tep per year (around
12,000 Euros per year), and a tax break on natural gas supply.
Economic Basis
The initial investment is higher than traditional build by about 10%/15%,
and is estimated to be in the region of 2.7 million Euros. In regard to the
supply of energy for the shopping centre, the investment delivers savings
of 30% more than a traditional solution. In addition the signing of a long-
term contract by the users, allows ESCO to deliver energy bills 10% lower
than standard ones.
The business plan is highly planned, and includes several phases:
• Architectural sizing;
• Energetic sizing;
• Necessary technical power sizing;
• Production technological model, regulation, and energy
vectors distribution;
• Definition of a business model shared by the participating
partners (developers and ESCO)
• Definition of a business plan.

181
Environmental & Economic Sustainability
The technological solutions chosen are some of the best mixes existing.
The total amount of CO2 emissions saved is around 400 Tons per year.
Economic sustainability is based on the following considerations.
The initial investment for the energy production and distribution network,
that achieves the metering equipment at the users (of approximately € 2.7
ml cost), is higher by 10% to 15% compared to conventional distributed
solutions with small utility bills. This additional cost is outweighed by the
fact that the solutions adopted will, as regards the energy supplied to the
users of the Zero Center by the ESCO, deliver a cost saving of
approximately 30% compared to what would have been expected with
conventional solutions. This fact, coupled with the signing of contracts for
deferred delivery of energy by the end user, enables the ESCO to pay the
investment made in a reasonable time and to charge tenants of the Zero
Center with rates for the sale of heat and refrigeration less than 10%
those resulting from traditional technological solutions.
Lessons Learnt
The results both from a technological and environmental point of view
show that it is possible to merge different kinds of energy sources,
traditional and renewable ones, in order to create elegant solutions both
for users and the environment.
Some pearls of wisdom:
"The best energy savings are from energy not consumed ..."

182
"Following a modification to improve efficiency, if there are economic
savings, there is definitely at its foundations energy savings, but the
opposite is not always true".
"It is necessary to get specific knowledge (experience required) on how to
combine energy efficiency solutions with renewable energy sources, in
order to reach the goal of zero emissions.”

183
2.1.19 SCHÜCO ITALIA
Description of the project
For its new headquarters in Padua, Schüco Italia, a leader in the field of
envelope construction and energy efficient solutions for the exploitation of
solar energy, has changed an obsolete and energy-intensive building into a
facility that has obtained the "CLASS A" award, using Schüco systems. With
avant-garde architecture the building is a real life example of successful
industrial '80s building conversion and recovery. The new Schüco
headquarters saves over 50% in terms of energy requirements through
heating and cooling, approximately 440,000 kWh (170 tons of CO2 avoided
every year). The building also produces energy thanks to a 540 kWp
photovoltaic system and other "Schüco Made" solutions like the" solar
cooling", a cooling system that uses hot water produced by high efficiency
solar panels, a geothermal system made by 7 drills 80 meters deep and
supported by solar thermal collectors, as well as a photovoltaic system on
the roof able to meet the energy needs of the entire building (offices and
warehouses) with a production of about 630,000 kWh/year. Schüco used
the patented E2facade to provide an efficient building ventilation and
solar shading solution with a high energy performance. On the other face
of the façade architectural photovoltaic panels using micro-crystalline
silicon thin film have been adopted.

184
GBE Factory Model
Schüco shows how the new building architecture, when implementing
solutions oriented to thermal insulation, efficient ventilation and careful
management of the light, leads to energy savings of more than 50%,
paying for the extra investment in the medium term, evaluable in +20%
cost with respect to the adoption of conventional building solutions.
In addittion if you look over the 20 year life span of the building, the
investment will pay back with good returns, partially thanks to the tariffs
set in Italy in 2010, thanks to the techniques adopted.
Furthermore, the application of a control and communication system for
the management of external heat sources (sun and soil), the light (internal
and external) and internal energy use, allows to achieve high average
levels of comfort and to further reduce the energy consumption with the
result being able to sell back to the public grid surplus electricity
generated from the renewable energy sources installed.
Quick facts
LOCATION: Padova - Italy
TOTAL AREA: 31.401 sqm
OVERALL FLOOR AREA: 20.962 sqm
OFFICE FLOOR AREA: approx 4.200 sqm
BUILDING ENVELOPE: Façade E2 (double skin, ventilation, solar shading,
integration of thin photovoltaic film);
SOLAR THERMAL ROOF PANELS: 10 KWp (for geothermal plant);
SOLAR THERMAL ROOF PANELS: 36 KWp (for solar cooling system)

185
PHOTOVOLTAIC ROOF PANELS: 540KWp (providing energy to offices and
warehouse)
ENERGETIC AWARD: Class A
Design and construction
Architectural concept: Unity despite differences. The structure consists of
two parts: a new building housing offices and showrooms and the
renovated warehouse. The new building is based on the existing column
grid and runs parallel to the existing structure.
The façade performs important functions for the building: ideal thermal
insulation, optimum natural light illumination, protection from excessive
solar radiation, and other functions such as electricity generation (For the
east and south façades of the new building, the multifunctional Schüco E2
Façade including the thin-film photovoltaic module ProSol TF was used).
Opening, solar-shading, and thin-film photovoltaic units, as well as
decentralized air-conditioning modules, are integrated into the interior.
Parallel opening windows ensure optimum ventilation. The photovoltaic
installation on the roof of the new building and the warehouse covers a

186
total area of 4,550 m² with 3,570 monocrystalline modules and a total
output of 540 kWp. To integrate the on-roof system into the architecture,
the modules were mounted with a horizontal inclination of 6°. The on-roof
system and the window and façade modules ProSol TF integrated into the
façade guarantee solar energy generation on the south façades. The thin-
film photovoltaic system in the south façade is characterized by an
optimum utilization of diffuse light and therefore is functional to the
vertical arrangement of the façade. Geothermal energy is produced
through a heat pump extracting low-temperature heat from the ground via
80 meter-deep earth sources and transfers heat to the ground, thus
reducing heating and cooling energy consumption. The Schüco heat pump
HPSol 17, which has an output of 17 kW, is operated by five solar thermal
collectors. These collectors heat a combination cylinder that is used to
produce hot water and control the thermal cycle.
187
FIT and additional benefits
Photovoltaic energy: YES
Thermal energy: NO.
Geothermal energy: NO
Energy efficiency: NO
Feed-in-Tariff: (€/kWh): 0.422
Tariff’s bonus: (€/kWh): 0.021
Since connecting the company has produced more than 1.200.000 kWh of
clean energy, avoiding more than 340.000 kg of CO2 and earning more
than 550,000 Euros thanks to this PV plant .
Economic Basis
Production parameters:
Photovoltaic energy
• PBT: 7 years
• IRR: 12 %
Thermal energy
• PBT: 9 years
• IRR: 8 %
Geothermal energy
• PBT: 11 years
• IRR : 6%
Energy efficiency
• PBT: 9 years
• IRR: 8 %

188
Environmental & Economic Sustainability
To visibly demonstrate Schüco’s corporate mission, “Energy2 – Saving
Energy and Generating Energy” to every visitor, a display in the new
building’s entrance area shows the energy generated and the energy saved
by the system in real time. The energy concept of the complex is based on
photovoltaic, solar and geothermal energy, a solar cooling system,
intelligent façades, and a heat pump. Another important element that
reduces energy consumption is the building automation developed for
system control.
Lessons Learnt
The innovative refurbishment project impressively shows how a former
industrial building can be transformed into a sustainable, resource-
conserving, comfortable office building. This is the future for energy-
efficient construction.
By combining sustainable photovoltaic thin-film technology with tried-and-
tested Schüco façade systems, Schüco opens up new possibilities for solar
architecture, and sets new standards of efficiency and design.

189
2.2 “One by one plus”
2.2.1 SOFIYSKA VODA AD, City of Sofia
Description of the project
Sofiyska Voda JSC provides for the services water supply, sewerage and
wastewater treatment in the territory of the Municipality of Sofia.
The company provides water supply and sewerage services to around
1,400,000 people in the capital city of Bulgaria. Our responsibilities
comprises the operation, maintenance and management of hundreds of
facilities and thousands of kilometres of water and sewerage network. Our
team consists of responsible and high-qualified employees who are
customer-oriented and generate investments worth millions of Euros every
year for the development and future of the city.
Sofiyska Voda JSC was established in October 2000 under a 25-year
Concession Agreement. Under it, the Municipality of Sofia grants under
concession to the company the operation and maintenance of the water
supply and sewerage system in Sofia.
Our share capital is held by the Municipality of Sofia (22.9%) and the
French company Veolia Voda S.А. ( 77.1% of the shares).
Sofiyska Voda is not the owner but a concessionaire of the water supply
and sewerage assets – they are a public municipal property. All new
facilities constructed with company investments are also public municipal
property.

190
GBE Factory Model
The wastewater treatment plant (WWTP) for Sofia, treats domestic
industrial and storm water coming from the city’s sewerage network. The
plant was commissioned in 1984 and it is currently the largest one on the
Balkan Peninsula. The plant has operated continuously for over a quarter
of a century and over the years it has undergone partial reconstructions
and improvements, financed partly from EU funds and through the capital
programme of Sofiyska Voda.
The plant is located in the lowest northern part of Sofia – Kubratovo – and
covers a total area of 6,000 acres. Its designed capacity is 480,000 cubic
metres of wastewater per day. Today, the average daily volume of
wastewater treated at Kubratovo WWTP is around 400,000 cubic metres.
In October 2000, Sofiyska Voda JSC took over the activity of providing
water supply and sewage services to the territory of the Municipality of
Sofia and the WWTP Kibratovo, became part of the assets managed by the
company.
At the beginning of December 2009, Sofiyska Voda JSC commissioned the
largest co-generation installation in the Bulgarian water supply and sewage
sector for production of electricity and thermal energy from biogas. In
order to achieve this Sofiyska Voda JSC implemented an extensive
investment project to modernize and renovate the current facilities and
gas management in order to capture this biogas. Three co-generation units

191
have been installed. Each of them has a capacity of 1,063 kW electrical
energy and 1,088 kW thermal energy.
Quick Facts
LOCATION: Benkovski area, Sofia
PLANT SIZE (kWe;kWt): 3,189 KWe electrical energy
3,264 KWt thermal energy
TECHNOLOGY: Biogas co-generators
SITE OWNER: Sofiyska Voda
INVESTOR: Sofiyska Voda
PROJECT COST: € 2.6 million
KEY PARTNERS: European Bank for Reconstruction and Development and
the United Bulgarian Bank
CURRENT STATUS: In operation
Design and construction
TECHNICAL DETAILS:
No. of Co-Generators: 3
Output of each co-generator:
Electrical energy - 1063 kW
Thermal energy - 1088 kW
TOTAL ELECTRICAL ENERGY GENERATED
2010 (January - December) – 1,117,160.3 kWh – average per month
2011 (January - September) – 999 090 kWh – average per month

192
TOTAL ANNUAL ENERGY CONSUMPTION
2010 (Jan - Dec) – 18,034,237 kWh
2011 (Jan - Sep) – 15,975,532 kWh
FIT and additional benefits
PARAMETERS OF INSTALLATION:
Typology and Profitability of equipment: Co-Generators with 83 %
coefficient of efficiency
Installation building:
Power (kWp): 3189 kWe electrical energy
3264 kWt thermal energy
Feed-in Tariff (€/kWh): 61.02
Economic Basics
€0.8 million of the project cost has been covered under the BEERCL credit
line (Bulgarian Energy Efficiency and Renewable Energy Credit Line) with
funds contributed by the EBRD and the international fund for
decommissioning Kozloduy nuclear power plant through the local bank
partner on this credit line – United Bulgarian Bank AD. According to the
mandatory procedures of BEERCL, and together with the technical project
consultant Encon Services Ltd, we have developed a Rational Energy
Utilization Plan. The project was finally approved by the financing bodies.
CONSUMPTION PARAMETERS

193
Consumer’s energy cost (€/kWh) & internal consumption
Power: 3х 1,063 KW electrical energy and
3х1,088 KW thermal energy
Consumption EE (kWh/annual):
2010 (Jan - Dec) – 18,034,237 kWh
2011 (Jan - Sep) – 15,975,532 kWh
PARAMETERS OF THE INSTALLATION
Inflation on an annual basis: 3.5%
Maintenance and insurance cost: 130 K €/year
System’s Depreciation charge: 10 %/year
Discount Rate: 0 %
IRAP (TAX): 10 % nominal
IRES (TAX): 17.21 % (effective for 2010)
• Pay-back period - 5 years
• Net present value – NPV - € 2 858k @ 10%
• Saved emissions of СО2/year
SAVED EMISSIONS OF СО2/YEAR
Year tCO2e
2007 36,213
2008 68,321
2009 100,474
2010 116,026
2011 124,700

194
2012 139,200
Environmental & Economic Sustainability
The co-generation turns around 83% of the energy content into efficient
energy, which is about twice as much as compared to conventional plants.
This means higher efficiency, hence lower price and lower pollution. The
commissioning of the co-generation installation has provided
environmental, economic and social effects:
• Considerable reduction in costs for fuel and energy
• Utilization of the waste product - biogas generated in the
process of residues purification;
• Reduction of the release of methane and carbon dioxide into the
atmosphere, which contributes to improving the environment;
• The reduction of harmful emissions brings benefits not only to
the capital’s inhabitants but also contributes to environmental
protection on a national and global scale;
• Contribution to fulfillment of the State’s obligation to reduce
harmful emissions into the atmosphere in conformity with the
Kyoto Protocol.
This plant carries out part of the project activities to reduce the carbon
emissions according to the Reduced Carbon Emissions Sales Agreement
between Sofiyska Voda JSC, the Carbon Fund of the EBRD and the
Government of the Netherlands.
195
Lessons Learnt
The co-generation in Kubratovo WWTP is an important project for Sofiyska
Voda JSC because it is further confirmation of our commitment to protect
the environment. The treated wastewater of Sofia flowing into the Iskar
River, the stabilized residues which are used in agriculture and the green
energy generated on site contribute to the protection of natural resources.
The total benefits amount to 0.75 million Euros of saved costs of electric
energy and a substantial contribution to the positive image of the
company.

196
2.2.3 LEIBER GmbH
Description of the project
The Leiber GmbH is a modern biotech company and one of the leading
producers of yeast for the food and feed sector. The company develops,
produces and distributes dried brewer’s yeast and yeast extract and is
currently developing products for the health and cosmetics sector.
GBE Factory Model
The company installed a new waste-water treatment plant which also
produces biogas. The biogas fuels a Combined Heat and Power Plant (CHP)
which produces electricity and heat (CHP output: 190 kW electrical power/
240 kW thermal power).
The company cannot not only meet its own heating needs but also sells
part of the heat produced to a neighboring company.
Quick Facts
LOCATION: Bramsche/ Germany
PLANT SIZE (kwe;kwt): CHP output: 190 kW electrical power/ 240 kW
thermal power
TECHNOLOGY/IES: Biogas CHP
SITE OWNERSHIP: Leiber GmbH, Hafenstraße 24
49565 Bramsche

197
INVESTOR: Leiber GmbH
PROJECT COST: 850,000 Euros
CURRENT STATUS: In operation
Design and construction
ELECTRICAL POWER: 1.115.000 kWh/ year
THERMAL POWER: 641.000 kWh/ year
ECONOMIC PROFITS AND ASSOCIATED COST REDUCTIONS:
FEED-IN-TARIFF: 147.000 €/ year
HEAT USED (OWN CONSUMPTION AND DELIVERED): 22.000 €/ year
SAVINGS DUE TO EFFICIENCY MEASURES: 26.000 €/Jahr
FURTHER SAVINGS (LESS CHEMICALS USED, LESS WASTED PRODUCED):
81.000 €/Jahr
ELECTRICITY SAVED: 363.000 kWh/Jahr
ELECTRICITY SAVED: 72 %
REDUCTION OF CO2 EMMISSIONS: 1.109 t/Jahr
INVESTMENT: 850.000 €
RETURN ON CAPITAL: 33 %
Fit and additional benefits
Feed-in-tariff: 147.000 €/ year
Environmental & Economic Sustainability
The company has a fully integrated approach in order to address the
issues, not only focusing on renewable energy sources but also addressing

198
the topics of waste management and the use of chemicals in the
production process:
• Integrated innovative waste-water treatment with lower energy
consumption, less waste and therefore reduced need to use
chemicals;
• Utilization of the biogas produced during the waste-water
treatment in a Combined Heat and Power Plant (CHP);
• Return of the electricity produced into the public grid in accordance
with the regulations on the feed-in tariffs;
• Utilization of the heat produced by the CHP plant in the company’s
own production as well as in a neighbouring plant.
Lessons Learnt
This is a good example of how different needs within a company can be
dealt with: the need for a new waste-water treatment plant led to the
increased use of renewable energies not only to generate electric power
but also to meet the demand for heat.

199
2.2.4 Zimmerei Sieverke GmbH
Description of the project
Sieverke was founded in 1912 and deals in all aspects of specialised
carpentery. The company employs about 40 people, mostly engineers,
master carpenters and carpenters. The company develops and produces
wooden products like roof structures, wooden walls, window frames and
wooden bungalows. Wooden parts are produced in the workshop with
CAD/ CNC assistance and are assembled on the construction site by the
company’s own staff.
The company installed a warm-air heating system fueled with the waste-
wood produced as part of the manufacturing process.
The company cannot only meet its own heating requirements to heat the
workshop, but also the commercial and residential building next to it
including tap water.
The wood used as a fuel does not have to be bought, but is waste from the
production process.
Quick Facts
LOCATION: Lohne/ Germany
PLANT SIZE: 400 kW/ 32.000 m³/h
TECHNOLOGY/IES: hot-air heating system fueled with renewables
(briquette)

200
SITE OWNERSHIP: Zimmerei Sieveke GmbH, Ing.-Holzbau, Bakumer Str. 24,
49393 Lohne
INVESTOR: Sieveke GmbH
PROJECT COST: Euro
CURRENT STATUS: In operation
Design and construction
THERMAL POWER OF THE SYSTEM: 400 kW/ 16.000 m³/h
HEAT PRODUCED FOR THE WORKSHOP: 320 kW
HEAT FOR THE COMMERCIAL AND RESIDENTIAL BUILDING: 80 kW
HEATING EFFICIENCY: about 90 %
SAVINGS DUE TO THE NEW HOT-AIR HEATING SYSTEM WITH WOOD
BRIQUET: about 20.000 €/Jahr
HEATING OIL SAVED: about 25.000 liters/Jahr
REDUCTION OF CO2 EMMISSIONS: about 70.000 kg/ year
FIT and additional benefits
Feed-in-tariff: N/A
Environmental & Economic Sustainability
Pellet and woodchip heating systems are fairly common in the housing
sector but not in the commercial sector with large halls and workshops. In
most cases hot-air heating systems are used instead of heating elements.
The company had an oil-fueled hot-air system for the workshop and gas

201
heating for the adjacent commercial/ residential building. Both were
relatively expensive.
During this time the business was growing and with this growth there was
ever more wooden waste. This waste was being disposed of in containers.
The company decided to address the different problems with an all-
embracing approach. They contacted a local company that specializes in
hot-air heating systems and that company was able to construct a wood-
fueled system to meet their requirements.
To ensure clean burning, the waste wood from the production process is
chaffed and mixed to produce a homogenous fuel. At the end of this
process, the briquettes produced have a moisture of between 15% – 20 %
and a heat value of 4 kWh/ kilo. An automatic conveyor screw with
adjustable speed transports the wooden fuel constantly from the silo to
the furnace.
The air is taken in and filtered via an air-channel system before it is piped
to a heat exchanger. The heating efficiency is about 90 % as air can be
heated easier than water and air can be used directly for heating purposes
with hardly any loss. This saves both on fuel and other costs.
Excess heat is also stored in a water-storage system that is connected with
the commercial and residential building with a long-distance heating line.
In one year, the wood-working creates about 500 m³ wood-chips (30 to 40
tons). This is equal to about 30,000 liters of heating oil.
Lessons Learnt

202
This example demonstrates that with careful planning, and co-operation
with an external consultant – in this case the specialist on hot-air heating
systems – and the will to develop new, innovative systems can help to
tackle different problems with one solution. The solution leads to the
tailor-made utilization of RES, helps to cut costs and is also a contribution
to climate protection. It is a rewarding solution though there are no
permanent benefits like for example feed-in tariffs.
The development of the innovative hot-air system was supported by the
federal state of Lower-Saxony.

203
2.3 “One to many”
2.3.1 Solar.nahwaerme Energiecontracting GmbH
Description of the project
Solar.nahwaerme Energiecontracting Gmbh is a subsidiary company of
nahwaerme.at Energiecontracting GmbH, which is an Energy services
company. It was established and operates in collaboration with local
partners, and developers systems based on renewable energy sources. In
the project “Wasserwerk Andritz” a large scale solar thermal plant was
erected in the grounds of the local water supplier. The system supports the
local heating system (LH) of the office buildings of the local water utility.
The surplus heat is fed into the district heating grid (DH) of the city of Graz.
With the installation of high temperature (HT) flat plate collectors, the
required temperatures for district heating supply can be achieved. In the
local water conservation area, enough space was available for construction
of the plant.
The installed solar thermal system covers about 40 % of the heating energy
requirements of the local office buildings. The largest part of the heat
production however is fed into the district heating grid.
Quick Facts
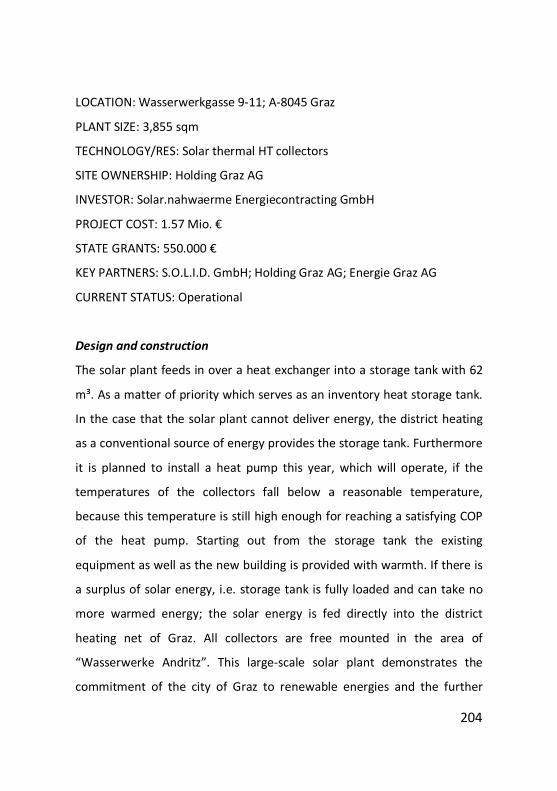
204
LOCATION: Wasserwerkgasse 9-11; A-8045 Graz
PLANT SIZE: 3,855 sqm
TECHNOLOGY/RES: Solar thermal HT collectors
SITE OWNERSHIP: Holding Graz AG
INVESTOR: Solar.nahwaerme Energiecontracting GmbH
PROJECT COST: 1.57 Mio. €
STATE GRANTS: 550.000 €
KEY PARTNERS: S.O.L.I.D. GmbH; Holding Graz AG; Energie Graz AG
CURRENT STATUS: Operational
Design and construction
The solar plant feeds in over a heat exchanger into a storage tank with 62
m³. As a matter of priority which serves as an inventory heat storage tank.
In the case that the solar plant cannot deliver energy, the district heating
as a conventional source of energy provides the storage tank. Furthermore
it is planned to install a heat pump this year, which will operate, if the
temperatures of the collectors fall below a reasonable temperature,
because this temperature is still high enough for reaching a satisfying COP
of the heat pump. Starting out from the storage tank the existing
equipment as well as the new building is provided with warmth. If there is
a surplus of solar energy, i.e. storage tank is fully loaded and can take no
more warmed energy; the solar energy is fed directly into the district
heating net of Graz. All collectors are free mounted in the area of
“Wasserwerke Andritz”. This large-scale solar plant demonstrates the
commitment of the city of Graz to renewable energies and the further

205
protection of the environment. This plant is the 4th solar system which has
been integrated into the district heating system of Graz.
TECHNICAL DETAILS
TOTAL SURFACE: 3,855 sqm
NUMBER of thermal collectors: 270
HEAT STORAGE: 62 m³
TOTAL solar yield: 1,657 MWh/year
SPECIFIC solar yield: 430 kWh/m²BRUTTO*a
MONTHLY TOTAL ENERGY GENERATED
ENERGY DISTRIBUTION
Local energy consumption = 654 MWh/a
Local energy distribution = 262.3 MWh/a
Grid energy distribution = 1,394.6 MWh/a

206
FIT and additional benefits
PARAMETERS OF INSTALLATION
Installation: 2nd QT 2009
Capacity [kWtherm]: 2,062.4
FEED-IN-TARIFF
LH: 54,352 €/MWh
• Demand rate LH: 204,6 €/month
• Winter tariff: 31,51 €/MWh
• Summer tariff: 26,74 €/MWh
Economic Basics
PARAMETERS
See feed -in-tariffs.
PARAMETERS OF ECONOMIC’S SIMULATION SALE
Interest rate: 4.0%
Grants: 550,000 €
Maintenance and insurance cost: app. € 1.000
Depreciation period: 25 years
System’s Depreciation charge: 4 %

207
Discount Rate:
LH: 0%
DH: 17.3 % (based on the winter tariff)
Income tax: 25 %
SIMULATION’S TECHNICALS PARAMETERS
District heating net: 84.2 % of total solar energy produced
Local heating demand: 15.8 of total solar energy produced
Solar fraction: 40 % of the local heat demand
Payback period: 19.6 years
IRR after 25 years: 8.7 %

208
Environmental & Economic Sustainability
The measured total solar yields are shown in the table below.
TOTAL MONTHLY TREND ANALYSIS OVER THE YEAR

209
Solar thermal energy is CO2-free and therefore environmentally friendly. In
determining the CO2 savings the following substitute heat sources were
considered: Coal power plant, natural gas power plant, gas heating plant,
industrial surplus heat. The impact of the district heat amounts to 99.206
kg CO2/MWh.
Lessons Learnt
This solar thermal system illustrates to us the following points:
• Efficiency of large solar thermal applications;
• Application of an ESCO model in this field of RES;
• Existing economy (also with a 17.3% lower feed in tariff compared
to conventional heat sources, which feed into the district heating
grid);
• Possibility of solar district heating supply.
This example demonstrates the possible use of large solar thermal plants.
Due to higher feed-in tariffs in an industrial area, the payback time could
be significantly reduced.

210
2.3.3 HTMAS
Description of the project
HTMAS is a Slovak Industrial Park, located between Banska Bystrica and
Zvolen in the village of Vlkanova. It has been developed to host local and
foreign companies, both for logistics and manufacturing. The Industrial
Park has been designed to fully protect the environment.
Quick Facts
The HTMAS industrial park in Vlkonova opened in 2008, it invested in green
energy and installed sun collectors on the rooftops of the industrial park
buildings with a total power output of 855 MW/H it officially started
producing electricity as of February 2010.
The Industrial park hosts in total 7 companies of various SME investors and
manufacturing lines and it produces 92% of the required power.
Design and construction
The owners of HTMAS have established a local grid with 3 power supply
transformers.
LOCATION OF PHOTOVOLTAIC POWERPLANT: Vlkanova, district Banska
Bystrica, middle Slovakia (altitude 315 metres above sea level)

211
EFFECTIVE AREA OF MODULES: 6.036,87 m²
INSTALLED POWER: 855,02 kWp
TYPE OF SOLAR MODULES: Yingli solar polycrystalline silicone (YL230P-29b)
NUMBER OF SOLAR MODULES: 3.716 pieces
INVERTORS OF ELECTRIC CURRENT: DELTA Electronics (7 x central invertor
Delta CI 100; 9 x string invertor Delta SI 5000)
POSITION OF THE MODULES: 500 pieces, ground installation, orientation -
5°; 716 pieces, roof installation, orientation -20°; 2.500 pieces, roof
installation, orientation -5°
The owner of the solar panels is selling the majority of the power to the
companies located in the park.
Economic Basics
The principal investor and owner of the park, uses the local grid to
distribute electricity to all end-users in the park and 4 additional
companies from the old industrial park of Vlkanova.
This year the park produced 920 MW. In 2012 the park will be constructing
a new water power plant with a total installed power of 0,45 MW for the
needs of the companies in the industrial park. This further investment will
be repaid within 7 years.
The investor is transferring the same business model to Bulgaria and
Romania in 2012.
Environmental & Economic Sustainability

212
CO2 reduction per year: 495.144 kg CO2.
Increased sustainability of the companies in the industrial park by
minimizing the risks that could derive from the national grid.
Lessons Learnt
Installation of the roof-topped solar panels in industrial parks promotes
development of self-sustaining model for the use of power from the grid.
The companies in the industrial park are not dependant on any possible
shortage from the national grid as well as weather changes or any other
external factors that could cause any drop-offs in the utility system.
Using the local grid enables the investors shorten the period of return of
the investment from 15 to 7 years.
Decrease of C2O achieved.
Developed a model of one providing power to others in a closed grid
system.

213
2.4. “Many to one”
2.4.1. Paderno Network
Description of the project
Paderno Network is not the only example of a “many to one” GBE
FACTORY. In fact here there are 5 factory owners positioned in the same
area that decided to install 5 PV plants and to join them in a single grid.
This structure is installed in an industrial area near Milan where
consumption of energy is particularly high.
Quick Facts
LOCATION: Paderno Dugnano (MI)
PLANT SIZE: 2.000 mq

214
TECHNOLOGY/RES: Photovoltaic Panel
SITE OWNERSHIP: Every single factory
INVESTOR: Every single factory
PROJECT COST: € 890.190,00
KEY PARTNERS: ForGreen Spa
CURRENT STATUS: Operational
Design and construction
After a specific study, over single roofs were installed 5 singular
photovoltaic implant that produce energy not only for the production of
single factory but also, thanks to a “smart grid” between factories, for the
others (obviously when they need more energy than what they need).
The type installation is grid-connected and has a three-phase medium
voltage connection. The panels are connected to an inverter used to
exchange the power on the site.
TECHNICAL DETAILS:
SURFACE: 1.800 mq
NUMBER of thermal collectors: 1.135
SECTION SINGLE PV PLANT POWER (kWp) kWh/Year kWh/kWp 1 RDM 106,4 99.500 938 2 VISMARA 36,34 34.000 936 3 BI.ESSE 19,32 18.000 932 4 SCHIAREA 57,27 54.000 943 5 NIMA ERRE 37,26 36.000 966

215
TOTAL PADERNO DUGNANO 256,23 241.500 943
FIT and additional benefits
Installation: 1nd QT 2011
Feed-in-tariff: 0.355 (€/kWh)
Economic Basics
Deciding to install a photovoltaic system, from an economic point of view,
is deciding to carry out a financial investment at all of effect. This is the
case where there is equity of 30% and the other 70% is from bank
financing.
Economic Basics
TIR 25 years 15,81%Revenues 20 years
5,94Payback Period
TIR 20 years 15,49%
€ 673.251Revenues 25 years € 808.098
Environmental & Economic Sustainability
The totally energy production from thin network is green-energy;
therefore this is a really environmental friendly system.
Contribution to the environment
CO2 emissions avoided (ton/year) 120,2

216
Also the system reducing the dependency on petrol and carbon fuel.
Consumption of oil avoided Oil saved (barrel/year) 7.902
Lessons Learnt
This is a very interesting solar system model because it allowed the energy
needs of all the factories to be met and any surplus produced to be sold
back to the national grid and the resultant profit distributed to all partners
in the project.

217
3. MARKET ANALYSIS
3.1. Austria
Description of the domain-area of intervention and reasons for this choice
The market analysis is based on four parts. The first part is an overview of
the actual energy figures in Austria and Upper Austria based on official
statistical data, and gives an overview about the status quo. The second
part is a questionnaire that was circulated to partners of Clusterland Upper
Austria and to participants of events, like business lunches and plant visits.
The third part is based on information gathered from personal interviews
during our regular contacts with local authorities and companies over the
last year (73 interviews in total). In the fourth and final part the building of
2 focus groups is planned to concentrate on two sectors.
The questionnaire and the interviews were carried out in the sectors of
food, machinery, plastics, paper and wood, chemistry and construction,
because these are dominant in Upper Austria.
The two focus groups will concentrate on food and plastics, because these
are industries which make intensive use of heating and cooling.
Analysis of energy consumption in domain-area

218
a. Based on yearly data issued by energy distributors (gas and
electricity)
We can see that, with about 49,000 TJ of electricity, Upper Austria is
Austria’s biggest electricity consumer. Upper Austria is a very strong
economic region with a very low unemployment rate. Gas consumption is
very similar to electricity consumption. Here Upper Austria is on the
second level with a consumption of round 39,500 TJ gas a year. When we
look at the sectors which are the largest electricity consumers, we see the
manufacturing sector on the first level with requirements for 96,150 TJ
electricity, followed by private households with an electricity demand of
nearly 61,500 TJ. Gas consumption is nearly the same as electricity. The
greatest gas consumer is the manufacturing sector followed on the second
level by private households. These two consumers need more than 80% of
the entire gas consumption in Austria.
b. Responses to the survey questionnaire sent to sample SMEs
Gas and electricity are the main energy forms used, RE, where used, forms
only a minor part of the energy mix.
Indicators of energy consumption

219
The four tables give a detailed view of oil, gas, renewables and electricity
for Austria and Upper Austria.
Existence and willingness of SMEs to invest in GBEFACTORY
The very interesting result of the interviews with local authorities (which
give a relatively valid representation of the willingness of SMEs) was that
local authorities identify a lot of potential for renewable energy. An
overview of the answers can be seen in the following graphic.
Considerations on the potential and possible early GBEFACTORY
interventions of the companies, more than a third expect renewable
energy as a basis for a notable part of the necessary energy supply. The
technical solutions for using renewable energy were supposed to be
photovoltaic, wind-energy, biomass and biogas. Energy recovery and
energy efficiency will also be important.

220
Looking at this graphic we can summarize and see that:
• Many companies plan projects dealing directly or indirectly with
energy supplies (85 energy supply projects out of 128 projects
planned in the next three years);
• 9 projects deal directly with the production of renewable energy;
• Energy efficiency in buildings and in production are the absolute
leaders;
• Many projects, like lighting optimization, heat recovery or
recycling management, are basis projects for implementing
renewable energy in the future.
The final result of the market analysis for companies so far, is an extremely
high interest and demand for technical solutions for using energy efficiency
and renewable energy in production buildings as well as in the production
process itself.
Final conclusion
The demand for technical solutions is high and the variety of technical
solutions is even higher.
221
This market analysis is now the basis for the creation of 2 focus groups of
representative people, each focus group having a minimum of 7
participants. The goal of the focus groups are the comparisons and the
conclusions that are drawn from the data collected from questionnaires
and personal interviews, addressed to identifying key perceptions and
awareness of the issues of GEB Factory.
3.2. Bulgaria
PRICES OF RES ENERGY CARRIERS
The preferential prices for electric energy buy-out, from the different types
of plants using RES, are considerably higher than the electric energy
obtained from the final supplier:
• Photovoltaic electric stations – about 5.5 times higher;
• Wind electric stations – about 1.7 times higher.
With this ratio the producers’ motivation, for these types of RES, is to sell
the electric energy at preferential prices instead of consuming it in situ or
in regions. At the same time, there is a policy of systematically reducing
the price differences.
FUNDING OPPORTUNITIES
Relatively good opportunities exist in Bulgaria for funding RES projects.
• The credit line along the EBRD on energy efficiency and renewable
sources – grant up to 20%;
• Bulgarian fund of energy efficiency and RES – preferential rate of
interest;

222
• Credit lines operated by banks with grant opportunities up to 15%;
• Programs under the Operational program “Development of the
competitiveness of the Bulgarian economy 2007-2013” with grant
opportunities up to 50%;
• ESCO companies, etc.
Description of the domain-area of intervention and reasons for this choice
As a result of the preliminary analysis of the state of the RES sector in
Bulgaria, the market survey is directed with priority to the following areas:
By types of RES – biomass, solar collectors for heating energy, biogas of
recycled waste, thermal sources – with the greatest potential.
• Sectors – chemistry, chain stores, hotels in the cross-country
section – with significant energy intensity, importance in Bulgarian
economy and suitable for the project purposes;
• Regions – national scope and Stara Zagora of broad scope of
surveyed entities;
The results of the market surveys in 2 aggregated focus groups are shown
in the next sections:
• Industry Focus Group (chemical and processing industries - 45
enterprises - 9625 employees);
• Commercial buildings & Hotels (24 buildings - 1550 employees).
Analysis of energy consumption in the domain-area
INDUSTRY FOCUS GROUP

223
• Around 22% of the companies have considerable energy
consumption – over 20% of the overall production costs and the
application of RES to cover these costs, or part of them, would
contribute to increasing the share of green energy in Bulgarian
industry;
• Around 40% of the total energy consumption is electricity, and
around 14 % of liquid fuels – high impacting energy carriers on
greenhouse gas emissions. Enterprises using liquid fuels are
serious potential candidates for GBE factories;
• Heating and domestic hot water in SMEs use in the range of 38-
44% of the total consumption of heat energy – types of consumers
with special priority for the GBE Factory project;
• Around 24% of the total consumption of electricity is used for
heating and cooling – types of consumers with special priority for
the GBE Factory project;
• Only 2 of the surveyed companies have been using RES as a
measure for saving energy, resources and environmental impact
over the last three years. The assessments of the introduction of
RES are positive. A further 7 companies (about 15%) are planning
to introduce RES and could be considered as potential GBE;
• As a whole, the companies positively evaluate the extent of their
awareness as well as the services offered by suppliers of RES;
• Among the impediments, the most mentioned obstacle is the lack
of specific information (technical, expert best practice related,

224
etc). The tasks of the GBE Factory project are meant to mainly
overcome these barriers;
• All companies show interest and willingness to participate in the
activities organized under the project.
COMMERCIAL BUILDINGS & HOTELS FOCUS GROUP
• The average heating area of the commercial buildings is over 5000
m2;
• The commercial centers are significant consumers of electricity –
around 78% of the total energy consumption;
• Heating, ventilation and domestic hot water form a considerable
share – around 23% of the total energy consumption;
• The commercial centers are serious potential candidates for the
GBE Factory;
• 14 hotels have indicated interest in implementing biomass boilers
for heating and DHW. The total expected cost savings are about
1,780 thousand BGN and the average payback period is about 3.6
years. The projects could contribute to a CO2 reduction of about
7590 t/year.
Existence and willingness of SMEs to invest in GBEFACTORY
The indicators of energy consumption for the 2 focus groups are shown in
the following tables (market analysis report tips 18-4-2012).

225

226
3.3. Germany
Description of the domain-area of intervention and reasons for this choice
For the purposes of the GBE Factory market analysis, high-energy
consumption sectors have been analyzed among the main sectors that
represent the industrial structure of the German Region of Brandenburg.
The market analysis covers the Bundesland Brandenburg area.
Brandenburg measures 29,478.61 sq.km with a population of 2.497 million.
Brandenburg surrounds the German Capital Berlin (another 3.5 million
inhabitants).
The market analysis should discover suitable sectors to be chosen for
further GBE-factory activities; meet the needs and interests of the
stakeholders and lead to 2 focus groups covering 7 companies.
In particular, the focus was put on Hotels/SPA centers and on food-
processing companies as very appropriate for GBE-FACTORY interventions.
Stakeholders in these branches have already shown interest in being
approached by the GBE-factory project. Other representative sectors that
are also characterized by very high energy consumption (i.e. Metal,
Chemistry, Paper production) have not been selected however, either
because they are already provided with similar solutions or because they
are already well structured internally and do not need external
consultation.
Analysis of energy consumption in domain-area

227
a. From yearly data issued by energy distributors (gas and electricity)
Energy consumption and intensity in Germany are split into different
sectors, Metal, Chemistry but also Paper, which, in absolute figures,
dominate energy consumption in Germany and Brandenburg
(Frauenhofer/Statistische Bundesamt/Amt für Statistik Berlin-
Brandenburg).
Better data for Brandenburg were not available. Therefore three local
experts (Clustermanager Energy, Energy Technology Initiative and
Bioenergy Promotion) were interviewed in order to identify which sectors
could be most suitable in Brandenburg.
It turned out that the Metal, Chemistry and Paper sectors were NOT
recommended because either they have extensively investigated the issue
in the past and have already implemented solutions or are rather too big
for asking / demanding external advice.
Source: Amt für Statistik Berlin-Brandenburg

228
The recommendation was to focus on the Food Industry (characterized by
high energy intensity with absolutely high figures of energy consumption) –
some companies have already shown an interest, and Tourism - in terms of
Spa baths and hotels (a hot topic in this sector).
b. Responses to the survey questionnaire sent to sample SMEs
FOOD INDUSTRY
General optimization potential, mostly in cross-section techniques: i.e.
compressed air, refrigeration, air-conditioning, lighting, cleaning.
Higher energy efficiency through waste recycling (such as a biogas plant).
TOURISM INDUSTRY
Primary energy demand in Spas. High heat demand in the sauna, in
swimming pools (continuous evaporation of the water surface), hot water
for showers. Power consumption and hot water requirements during
summer months. Possible Improvement: relatively simple measures can
generate 50% energy savings (i.e. pool cover, demand controlled
ventilation, energy saving circuits, insulation, etc.). Possible measures in
almost all the areas: electrical engineering, heating, ventilation, water, the
building itself.
Indicators of energy consumption

229
TOURISM INDUSTRY (WELLNESS+SPA CENTERS)
Spa distributed evenly over Brandenburg Adventure and water parks primarily near Berlin and in South Brandenburg
Adventure and Leisure
Thermal/Thermal brine bath
Both
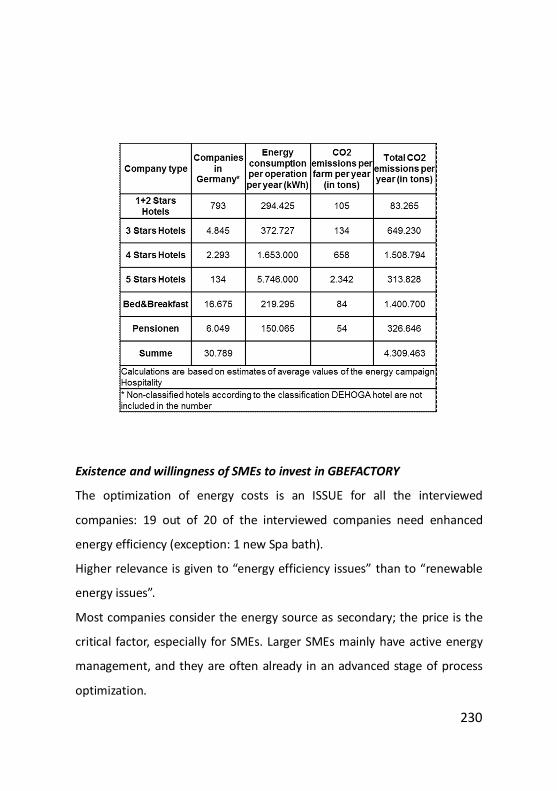
230
Existence and willingness of SMEs to invest in GBEFACTORY
The optimization of energy costs is an ISSUE for all the interviewed
companies: 19 out of 20 of the interviewed companies need enhanced
energy efficiency (exception: 1 new Spa bath).
Higher relevance is given to “energy efficiency issues” than to “renewable
energy issues”.
Most companies consider the energy source as secondary; the price is the
critical factor, especially for SMEs. Larger SMEs mainly have active energy
management, and they are often already in an advanced stage of process
optimization.

231
Many Food Processing companies are involved in cluster and network
activities, therefore they already receive multifaceted advice and
information.
The production process in manufacturing companies is often very complex,
therefore specialized and technical solutions are more important than
standard advice.
Final conclusion
Energy-saving measures can easily lead to considerable improvements,
especially for Hotels/SPA facilities and for food processing companies. In
the first case, the public image is also a concern. Going green is very
important for this kind of activity.
The analysis produced 4 categories of investigated firms:
Category 1: Companies/Spas without urgent needs (satisfactory energy-
situation in the company, energy advice and support already secured,
implementation of optimization measures in the near future unlikely,
efficiency measures to be carried out without external help).
Category 2: Companies/Spas: measures for energy-optimization have
already been designed, financial support needed to implement them (need
for advice on subsidies, i.e. local specialists ZAB, Zukunft Agentur
Brandenburg).
Category 3: Companies/Spas: measures for energy optimization have
already been planned but not yet decided in terms of time and specific
measures. Companies are reluctant to implement Res solutions; difficulty in
finding individual appropriate technical and legal advice. Through the
232
mediation of ad hoc specialists for each company’s need, the
implementation process could be promoted.
Category 4: Firms that have recognized the need for energy optimization of
their business for a long time, however the practical ideas for solving the
problem are only just in the initial stage.
Companies in this category expressed the highest need for support.
In particular, 9 companies were recommended for assistance.

233
3.4. Italy
Description of the domain-area of intervention and reasons for this choice
The wood and furniture sector has been selected because of its historical
openness in Italy to reusing waste materials and by-products of their
productive process. In this sector moreover there are some companies in
which the cost of energy consumption on turnover is highly relevant.
In Friuli Venezia Giulia the cluster count 750 companies and other 600
companies are located in the Veneto region.
The wood and furniture cluster of Livenza (covering an area between the
Veneto region and the Friuli-Venezia Giulia region in North East Italy),
stands out for its attention to environmental aspects and the certification
of raw materials according to various standards (FSC, PEFC and other), as
well as the management of by-products. The Livenza cluster has been one
of the first to receive an EMAS certification in Italy. This analysis builds
upon a Map of the environmental situation and of the energy consumption
carried out in 2010 by ASDI (Industrial Development Agency of the cluster),
Federlegno Arredo (sectorial association of wood and furniture),
Green&CO2 e SPIN 360 (to ESCO companies), on a panel of 88 companies
representing the productive mix of the cluster with 21 directly audited
companies.
Analysis of energy consumption in domain-area
The 88 companies analysed overall account for the following figures:

234
Considering that the quotas of kWh of energy produced by different
energy sources calculated by ASDI are the following:
• electrical energy 45%
• natural gas 10%
• heating oil 7%
• wood powder 38%
The importance of electrical energy is evident, used by companies both for
productive processes and general services (lighting, aspiration, compressed
air,). The quota of consumption of wood powder coming from waste
materials is also relevant, and is used mainly for heating the production
departments. It is probable that the quota of energy produced by burning
BTZ oil will decrease in time, in an inverse proportion to the expansion of
the natural gas network.
When analysing the costs coming from the energy consumption of the 88
companies, we see instead that the weight of electrical energy is the most
relevant, while the costs linked to wood powder are irrelevant (a by-
product available any way from the companies’ activities):
• electrical energy 88%
• natural gas 6%
• heating oil 6%

235
• wood powder 0%
Considering the new rates of incidence of the cost of the various forms of
energy, it seems that it is the electric power which determines energy
costs, and therefore interventions for energy saving and for the installation
of renewable energy sources should be promoted in this direction.
Indicators of energy consumption
Given the data of paragraph 2), it is possible to calculate the following
absolute values regarding the energy sources used:
Using the data shown in TABLES 1 and 2, it is possible to calculate the
following indicators:
236
While the indicator N.1 (KWh/year per employee) can be considered as
meaningful also for heterogeneous companies, the indicators per unit of
turnover are more representative when considering homogeneous
companies.
From an analytical calculation, ASDI has detected that the weight of energy
costs per unit of turnover decreases with the increase of the company’s
overall turnover. This is determined by:
• the reduction of the specific energy costs (for bigger amounts of
energy purchased, lower is the price per kWh);
• optimization of the use of energy (big machineries usually have
better performances than smaller ones).
ASDI has pointed out two kinds of observations:
• a high indicator n°3 corresponds to companies with particularly
energy intensive processes like varnishing or plastic processing;
• a low indicator n°3 corresponds to companies with low energy
consuming processes like trading or stump processing.
Considering then the different incidence of thermal and electrical energy,
ASDI highlights how the expenditure for electrical supply is comparable to
the one for thermal supply for the companies which have a lower turnover,
while when the turnover grows the incidence of expenditure for the
electrical supply grows in respect to the latter. This confirms the relevance
of the cost of electrical energy for companies with higher consumption, in
particular for those which process furniture components and hence have
thermoplastic processes which are energy-intensive.

237
As mentioned the FACTORY TEAM GBE then proceeded to examine the 88
questionnaires and to calculate the surfaces of the roofs of the companies
in order to calculate a useful indicator to assess any possibility of installing
photovoltaic on the roof. In TABLE 4 the calculated covered surfaces are
reported by type:
The coverage indicators expressed in "square meters per firm" can then be
calculated.
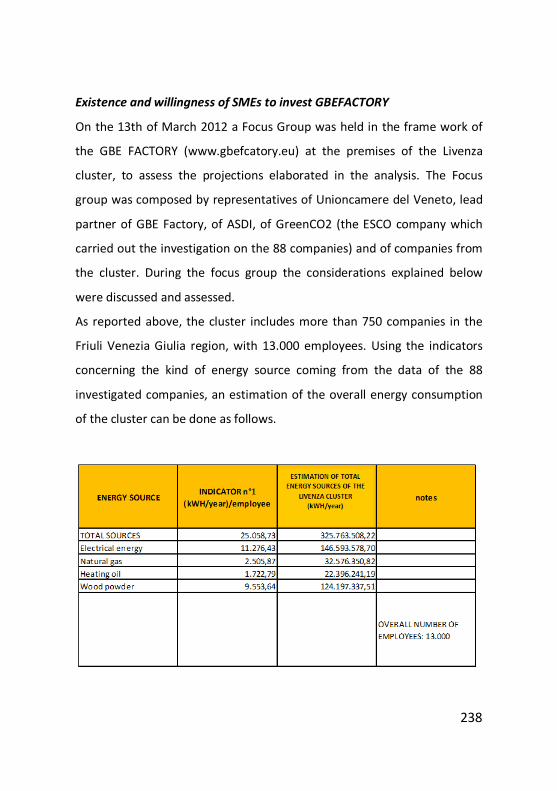
238
Existence and willingness of SMEs to invest GBEFACTORY
On the 13th of March 2012 a Focus Group was held in the frame work of
the GBE FACTORY (www.gbefcatory.eu) at the premises of the Livenza
cluster, to assess the projections elaborated in the analysis. The Focus
group was composed by representatives of Unioncamere del Veneto, lead
partner of GBE Factory, of ASDI, of GreenCO2 (the ESCO company which
carried out the investigation on the 88 companies) and of companies from
the cluster. During the focus group the considerations explained below
were discussed and assessed.
As reported above, the cluster includes more than 750 companies in the
Friuli Venezia Giulia region, with 13.000 employees. Using the indicators
concerning the kind of energy source coming from the data of the 88
investigated companies, an estimation of the overall energy consumption
of the cluster can be done as follows.

239
Considering that on average a kW of installed electrical power in
companies of the cluster may correspond to 2.500 kWh consumed each
year, and calculating a 20% overpower, the average installed electrical
power in the cluster can be estimated in 70 MW, for an average value of
about 100 KWe per company.
Bearing in mind that many companies use wood powder for heating the
buildings and for some phases of the industrial process, de facto
generating renewable energy, an area of potential development for
passing from fossil fuel to less impacting sources of energy is the one that
currently is covered by heating oil. Heating oil is used in the companies of
the cluster is mainly used for the same scope of wood powder, that is air
conditioning of the offices and hot water, as well as during the summer
when the boilers remain turned off. If we assume that we substitute all the
thermal energy produced currently through heating oil with heat pump
systems (air, water, geothermal) instead of 1.510.000 kg of low sulphur oil
5.510.000 KWH would be used, with consequent reduction of CO2 and
relevant expenditure savings. The hypothesis made by ASDI is that by
substituting the all the boilers of 82 companies, we would obtain the
following figures:
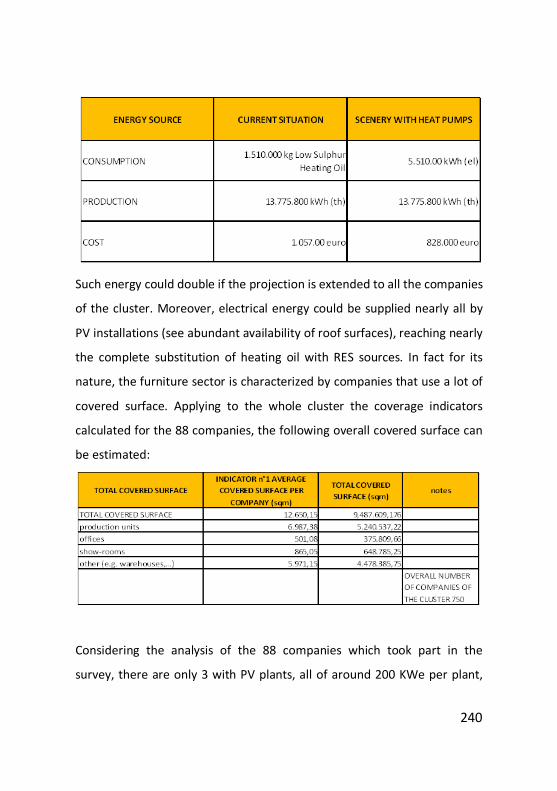
240
Such energy could double if the projection is extended to all the companies
of the cluster. Moreover, electrical energy could be supplied nearly all by
PV installations (see abundant availability of roof surfaces), reaching nearly
the complete substitution of heating oil with RES sources. In fact for its
nature, the furniture sector is characterized by companies that use a lot of
covered surface. Applying to the whole cluster the coverage indicators
calculated for the 88 companies, the following overall covered surface can
be estimated:
Considering the analysis of the 88 companies which took part in the
survey, there are only 3 with PV plants, all of around 200 KWe per plant,

241
notwithstanding the fact that on the cluster’s buildings surface there are
more than 9 million free square meters.
If only 10% of the covered surface were used for installing PV plants, it is
possible to estimate a potentiality for new installations of about 90 MWe.
This installed capacity could cover all the demand of electrical energy of
the sector, which we estimated in 70 MWe.
The fact that there is so much available surface and so few PV installations
is also due to the fact that the buildings are usually old and would require
very expensive reinforcing interventions in order to host polycrystalline PV
panels. Many roofs are moreover irregular and not looking South, resulting
from an increase in the volumes of the buildings carried out gradually in
time, without particular attention to the development of surfaces.
Solar thermal plants are not present among the 88 companies, but this is
explainable because the companies use wood powder for producing heat.
In all the considerations made above, the following real costs of energy for
the Livenza cluster have been taken into account:
Energy source: €/kWh
• Electrical energy: 0.15
• Natural gas: 0.05
• Heating oil: 0.06
• Wood powder: 0
Finally it must be highlighted that the study carried out by ASDI took in
consideration especially the potentialities for energy efficiency with
reference to production and air ventilation, showing how interventions on

242
the motors and on the alternators can lead to relevant savings with returns
in terms of PBT of a few years.
Final conclusion
The conclusions regarding the potentiality for GBE FACTORY interventions
are the following:
• A part from the energy efficiency interventions, there is space in
the cluster companies for further increasing the use of
“production by-products”, mainly wood powder, in order to
produce both hot water and energy for air conditioning and
electrical energy through ORC boilers;
• The cluster could network a group of small entrepreneurs
producers of wood powder and make them part of an
organization for managing a centralized co-generation plant, fed
by wood powder produced by the members or by external actors,
located in the same industrial area, so to produce electrical
energy to be fed in the grid and heat to be used on the companies
located nearby the co-generator;
• Substituting heating oil with heat pump systems could bring to
relevant economic and environmental benefits (such practice is
partially already started by some companies that installed high
performance gas boilers and also heat pumps);
• Solar PV should be taken more in consideration given the
abundance of roof surface available, and often 100% disused.
Solar PV could be used in some kind of companies which are

243
particularly energy consuming (printing/processing of plastic or
materials) with the mixed formula of on the place consumption
and giving to the grid the exceeding energy;
• Small PV plants could also be considered in combination with heat
pumps.
Concluding, the Livenza cluster could avail itself of a mix of technologies
that include:
• plants for the production of thermal and electrical energy fed by
wood powder (boilers, co-generators,…);
• heat pumps (air, water, geothermal) generally matched with the
plants at point 1) above;
• roof PV plants of medium dimensions (<1 MWe connected to the
grid) and of small dimensions (inferior to 200 KWe ) also
combined with heat pumps.

244
3.5. Slovakia
Description of the domain-area of intervention and reasons for this choice
These strategic analyses are processed on the basis of existing data from
distribution companies, the national statistical office, the national energy
efficiency agency, the national energy regulation authority, interviews and
focus group meetings with experts in the field of energy
services/distribution and production, questionnaires from companies
experienced in the installation of RES technology.
The major sources of RES in industry are in the timber and wood processing
sector, including pulp factories and thermal power plants, replacing fossil
fuel boilers with new ones run on wood chips/sawdust. However, natural
RES sources with great potential in all the sectors of industry, services and
trade are the following: solar, geothermal energy and biomass, as well as
hydraulic. Therefore the largest energy producers/distributors (thermal
plants) and energy utility companies are the biggest investors in RES
technology, however mostly based on biomass or biogas. Greater
quantities of vapour gas waste in the metallurgy and refinery sectors are
the subject of cogeneration units for the production of heat and power.
Biomass used as a source of power in the food and beverage sector,
however these initiatives are random and there is not a model for the
sector in question. Solar collectors have been introduced as an additional
source of electricity, mainly in one-two hotels and two industrial parks,
however large companies and commercial zones are not focused on this
type of RES. Most factories in heavy industry are trying to install modern
co-generation units running on vapour gas or new boilers using biomass. So

245
far, commercial and logistic parks are not making advantage of these types
of energy and power sources.
Analysis of energy consumption in domain-area
Energy intensity of the technologies used
In terms of energy consumption by conversion to electricity consumption
turnover compared with Slovakia, the technologies used in the BBSK
economy are, on average, very outdated. As the table below shows, energy
consumption in the last five years is approximately the same, but compared
to the national average is almost threefold. The diameter of the SR
worsens, especially on the high consumption bulletin board.
Power consumption (by agriculture, forestry, transport, industry and
construction) of MWh / 1 million Sk per year turnover Slovakia 10.2%, BB
27.7%.
Economic geography of the region
Regional seat: Banska Bystrica
Total Area: 9,455 km2
Number of Towns: 24
Number of municipalities: 516
Population: 660,000 inhabitants
Number of districts and their administrative centers: 13.
The region of Banská Bystrica lies in the center of the country and it
borders on Hungary in the south. Part of this border coincides with the

246
River Ipel. The natural symbol of the region is the River Hron. Presently,
the most relevant business activities in the region of Banská Bystrica are
the mining, engineering, food, dairy, pharmaceutical, wood-processing,
glass and ceramic industries. In relation to industrial production, the region
of Banská Bystrica can be divided into the more industrialized northern
part (comprising the districts of Banská Bystrica, Zvolen, Ziar nad Hronom
and Detva), where the engineering, wood-processing, chemical and
pharmaceutical industries are, and the agricultural southern part (the
districts of Rimavska Sobota, Lucenec, Velky Krtis, Krupina, Revuca)
focused on dairy products, crops and the food industry. The economic
structure of Banská Bystrica has been following a steady shift from the
industrial to the service sector over the past 15 years. Presently, the most
relevant sectors in the region of Banská Bystrica are the mining,
engineering, food, pharmaceutical, wood-processing, glass and ceramic
industries.
In relation to industrial production, the region of Banská Bystrica can be
divided into the more industrialized northern part (comprising the districts
of Banská Bystrica, Zvolen, Žiar nad Hronom and Detva), where the
engineering, wood-processing, chemical and pharmaceutical industries and
mining prevail, and the agriculturally-focused southern part (the of districts
Rimavská Sobota, Lucenec, Velký Krtíš, Krupina and Revúca).
According to the National Statistical Office, at the end of 2010 there were
on average 135,015 actively employed people with a prevailing occupation
in industry (28.2 %), public authorities and social services (14.5 %) and
education (12.3 %). Industrial firms employ 38,071 employees, most of

247
them occupied in the metallurgy – manufacturing of metal and
construction materials.
Industrial consumption of electricity a year 3143134 MWh, heat –
2560152 GJ
Examination of the consumption of natural gas for industrial sector at
regional and provincial level
Total consumption of natural gas by all industries of BB region – 278418
m2, 9560390 GJ, biogas – 2930 m2 or 60854 GJ

248
Indicators of energy consumption
Existence and willingness of SMEs to invest GBEFACTORY
In the process of developing the market analysis, the Italian-Slovak
Chamber of Commerce identified major sectors of economic activities in

249
the region of Banska Bystrica using energy-demanding technology and
representing traditional industrial sectors in the region:
• Food production and distilleries/beverages;
• Chemical industry;
• Manufacturing of metal and construction materials.
We have studied the energy-demands of 15 major producers in Banska
Bystrica, representing almost 100% of the aforementioned sectors, and we
have examined the energy performance of three firms using RES
technology for the production of power and heat for their own use and for
neighbouring companies.
The selected sectors are the highest consumers of electrical power with a
share of 85% and heat consumption of 20%, therefore investments in
energy production technology based on RES are of great importance.
However further investments of RES in industry shall be properly analysed
and audited in terms of financial efficiency, economy of scale and legal
environment.
Apart from the major industrial sectors, the region of Banska Bystrica is
populated by dozens of industrial parks hosting suppliers for the
aforementioned sectors. Amongst the most active are the Vlkanova
Industrial Park and the Ziar Industrial Park, both entities use solar
collectors for producing electricity.
The Banska Bystrica region is in first place in the production of solar power,
is a second major producer of biogas power, as well as a leader in installed
capacity of hydraulic power plants and amongst the first 3 top regions of
Slovakia using CHP on RES.

250
Banska Bystrica region is on first place in production of sun power, a
second major producer of power on biogas as well as a leader in inastalled
capacity of water power plants and amongst first 3 top regions of Slovaia
using CHP on RES.
Final conclusion
• Potential for installing CHP Technology on RES, due to the fact that
there are many companies with large capacities and heavy

251
electricity consumption, see the table below of the 20 largest
companies;
• Potential for using waste from the production;
• Potential for installing proper Technology;
• Large chemical and metallurgical players;
• A lot of thermal and mineral Spas in the leisure industry;
• A lot of wood waste and wasted lands that could be used for
producing biomass (plots used to be part of the mine industry in
the region);
• Potential for developing and testing new Technology – discussed
models of dust waste from wood;
• Existing models of all types of RES – hydraulic, solar, biomass,
biogas, vapor gas cycle;
• Strong economic parameters;
• Strong potential for research and development capacities –
specialized universities in forestry, chemical engineering and
electrical subjects.
252
Conclusion
The outlined Business Models offers the general vision on the ways in which
it is possible to organize and implement a GBE FACTORY. The collected best
practices show real examples of how these models can be implemented in
different countries and geographical conditions. Finally, the market
analysis allows us to take into consideration specific market situations in
the five member countries of the Project.
This market analysis is ongoing and will continue to be carried out in
accordance with strategic market requirements and its impact for regional
or national economies. We hope that this complete Guide will offer the
information and stimulus required for a wide-range of similar examples
throughout Europe’s many markets.
