gb gas security of supply and options for improvement
TRANSCRIPT
GB GAS SECURITY OF SUPPLY ANDOPTIONS FOR IMPROVEMENT
A report to Department of Energy and ClimateChange
March 2010
GB G
AS S
ECUR
ITY
OF S
UPPL
Y AN
D OP
TION
S FO
R IM
PROV
EMEN
T

GB GAS SECURITY OF SUPPLY AND OPTIONS FOR IMPROVEMENT
March 2010114_GBGasSecurityOfSupply_200910_v4_0.doc
PÖYRY ENERGY CONSULTING
Contact details
Name Email Telephone
Richard Sarsfield-Hall [email protected] +44 (0)1865 812266
Pöyry Energy Consulting is Europe's leading energy consultancy providing strategic,commercial, regulatory and policy advice to Europe's energy markets. The team of 250energy specialists, located across 15 European offices in 12 countries, offersunparalleled expertise in the rapidly changing energy sector.
Pöyry is a global consulting and engineering firm. Our in-depth expertise extends to thefields of energy, industry, urban & mobility and water & environment, with over 7,000 staffoperating from offices in 50 countries.
Copyright © 2010 Pöyry Energy (Oxford) Ltd
All rights reserved
No part of this publication may be reproduced, stored in a retrieval system or transmitted in anyform or by any means electronic, mechanical, photocopying, recording or otherwise without theprior written permission of Pöyry Energy (Oxford) Ltd.
Important
This document contains confidential and commercially sensitive information. Should anyrequests for disclosure of information contained in this document be received (whetherpursuant to; the Freedom of Information Act 2000, the Freedom of Information Act 2003(Ireland), the Freedom of Information Act 2000 (Northern Ireland), or otherwise), we requestthat we be notified in writing of the details of such request and that we be consulted andour comments taken into account before any action is taken.
Disclaimer
While Pöyry Energy (Oxford) Ltd (“Pöyry”) considers that the information and opinions given inthis work are sound, all parties must rely upon their own skill and judgement when making use ofit. Pöyry does not make any representation or warranty, expressed or implied, as to the accuracyor completeness of the information contained in this report and assumes no responsibility for theaccuracy or completeness of such information. Pöyry will not assume any liability to anyone forany loss or damage arising out of the provision of this report.
The report contains projections that are based on assumptions that are subject to uncertaintiesand contingencies. Because of the subjective judgements and inherent uncertainties ofprojections, and because events frequently do not occur as expected, there can be no assurancethat the projections contained herein will be realised and actual results may be different fromprojected results. Hence the projections supplied are not to be regarded as firm predictions of thefuture, but rather as illustrations of what might happen. Parties are advised to base their actionson an awareness of the range of such projections, and to note that the range necessarilybroadens in the latter years of the projections.

GB GAS SECURITY OF SUPPLY AND OPTIONS FOR IMPROVEMENT
March 2010114_GBGasSecurityOfSupply_200910_v4_0.doc
PÖYRY ENERGY CONSULTING
TABLE OF CONTENTS
EXECUTIVE SUMMARY 1
1. INTRODUCTION AND BACKGROUND 51.1 Gas security of supply background 51.2 Wicks review 61.3 Project Discovery 71.4 Report structure 81.5 Report conventions 10
2. CURRENT MARKET POSITION 112.1 Security of supply 112.2 Indigenous production 152.3 Gas storage 162.4 Pipelines and interconnectors 202.5 LNG facilities 222.6 Annual and peak demand 292.7 Demand Side Response 342.8 Distillate backup at power generation 352.9 Industrial & commercial interruptible load 382.10 Economic impact of unserved energy 402.11 January 2010 review 42
3. INVESTMENT DRIVERS AND BARRIERS 453.1 Infrastructure investment Drivers 453.2 Gas storage investment 473.3 Distillate backup investment 51
4. MODELLING GB GAS SECURITY OF SUPPLY 574.1 Deterministic supply shock analysis 584.2 Deterministic sensitivity analysis 714.3 Probabilistic analysis 764.4 Modelling conclusions 84
5. ALTERNATIVE POLICY OPTIONS 875.1 Identification of policy options 875.2 Responsibility for delivery 885.3 Security of supply in other countries 895.4 Potential additional policy options 905.5 Evaluation of shortlisted policy options 925.6 Policy options cost/benefit comparisons 1005.7 Policy option conclusions 101

GB GAS SECURITY OF SUPPLY AND OPTIONS FOR IMPROVEMENT
March 2010114_GBGasSecurityOfSupply_200910_v4_0.doc
PÖYRY ENERGY CONSULTING
ANNEX A – MODELLING 103A.1 Pegasus 103A.2 Prometheus 105
ANNEX B – OTHER ASSUMPTIONS AND PÖYRY’S CENTRAL SCENARIO 111B.1 Other assumptions 111B.2 Pöyry’s central demand scenario 112
ANNEX C – GAS SECURITY OF SUPPLY STANDARDS ACROSS EUROPE 117
ANNEX D – POLICY OPTION DETAILED REVIEW 125D.1 Physical gas storage 125D.2 Backup fuels for power generation 134D.3 Demand side response (DSR) 138D.4 Other direct security policies 142D.5 Fiscal incentives 144D.6 Indirect policies and regulatory incentives 145
ANNEX E – ILEX ENERGY REPORTS 149
QUALITY AND DOCUMENT CONTROL 151

GB GAS SECURITY OF SUPPLY AND OPTIONS FOR IMPROVEMENT
March 2010114_GBGasSecurityOfSupply_200910_v4_0.doc
1
PÖYRY ENERGY CONSULTING
EXECUTIVE SUMMARY
Concerns regarding security of Great Britain’s (GB) gas supply have increased overrecent years. There are many reasons behind these concerns including; the increasingimport dependency, the failure to fully liberalise the energy market in Continental Europe,the developing role of Liquid Natural Gas (LNG), high and volatile wholesale prices and aquestion mark as to whether the commercial market can provide for low probability highimpact events.
DECC commissioned Pöyry Energy Consulting to examine the security of GB’s gassupply between 2010 and 2025, and advise as to whether Government needed tointroduce any additional measures, including storage and demand side response, toprotect consumers.
It is our opinion that the GB gas market will be sufficiently resilient to security of supplyrisks and able to withstand most foreseeable problems, and that no major changes tocurrent policies are required.
Security of gas supply background
Gas security of supply was recently the subject of both the Wicks Review and Ofgem’sProject Discovery, with both raising concerns about the GB market, particularly in thelatter’s scenario of rapidly increasing gas demand.
In addition, gas security of supply has been recently tested by the weather this currentwinter, which has so far been the worst in 31 years. This sustained period of lowtemperatures, with the week beginning 4 January 2010 having 7 of the 16 coldest days inthe last 14 years, led to a new highest recorded demand of 465mcm/d on 8 January. Atthe same time the market also experienced shocks on the supply-side with significantlyreduced flows from Norway. Yet, the market responded well. Prices throughout theperiod remained largely unaffected and at relatively low levels compared to recent winters.
Supply and demand shock tests and probability analysis
Looking to the future we modelled a range of supply shock tests for the years 2010, 2015,2020 and 2025 to investigate whether supply and demand will balance and to estimate theimpact on wholesale gas prices. These supply shocks covered a major outage lasting thewhole of the gas year; and included losing the Rough gas storage facility, a major importterminal (Bacton or Milford Haven) or gas supplies from a major source (Russian gas viaUkraine or Qatari LNG). We then combined the two worst cases to further stress test thesystem.
Our results show that GB has sufficient diversity and capacity to receive gas from LNGterminals, Norwegian pipelines, storage and interconnectors to meet all but the mostextreme demands.
Capacity to receive gas is not, of course, sufficient in itself and we further examinedwhether there would be sufficient gas in store, pipeline gas and also LNG around theworld to meet demand in these extreme circumstances.
The results show that, including projects already believed committed as at April 2009,there will be sufficient storage capacity available to the GB market. Any commercial newbuild from the proposed 18 bcm of storage projects will further improve this position. AsEurope moves to a more liberalised gas market it will become increasingly possible to

GB GAS SECURITY OF SUPPLY AND OPTIONS FOR IMPROVEMENT
March 2010114_GBGasSecurityOfSupply_200910_v4_0.doc
2
PÖYRY ENERGY CONSULTING
directly access European storage over and above their strategic stocks through theinterconnectors. It is also possible to indirectly access US storage through the integrationof energy supplies by LNG arbitrage and cargo diversions as the global LNG gas marketdevelops.
Our analysis is based on gas moving around Europe based on commercial price signals,subject to existing physical direction restrictions. This is supported by strong existingcommercial positions, established EU political mechanisms and recent EU proposals toinvest in West to East and cross-border pipelines.
Sensitivity to demand levels has been tested against different reduction achievements(100% and 50% of GB 2020 renewable and efficiency targets) and severe weather (1 in50 winter and 1 in 20 peak demand). We found that demand side response (DSR) shouldonly be needed when there was extreme supply disruption combined with very high peakdemand circumstances, and even then most DSR can be met by gas-fired powergeneration (CCGT) distillate backup or very occasionally by invoking interruptiblecontracts at appropriate industrial and commercial (I&C) sites.
The likelihood of particular supply events happening was also analysed using aprobabilistic simulation approach against a wide range of demands, including a worst caseannual demand of 123bcm and peak of 700mcm/d. Assuming a reasonable mix ofuncertainties pertaining to demand, supply shocks and oil prices, and no additionalinfrastructure other than that already committed, the probability of the market needing touse:
existing CCGT distillate backup is once in every 3 years;
I&C interruption due to supply/demand balancing1 is once in every 15 years; and
any interruption of gas supply to firm customers (unserved energy) is about once inevery 19 years.
We calculate that the amount of this unserved energy would be relatively small in theseevents and could be covered completely by an additional 500mcm of storage over andabove that already committed with deliverability of around 25mcm/d.
Pricing impacts
We found a minimal impact on monthly wholesale prices arising from our range of shocktests. When a major disruption occurs there are a number of short-term price spikes anda few instances of higher absolute levels for extended supply outages. Whilst the marketmay respond with higher prices in the short-term than the prices seen in this report, webelieve that volatility will be dampened and prices pushed back to a marginal basis by thediversity of supplies and excess capacity.
Our probabilistic analysis, which takes into account risks across many failure events,supports the observation from the shock analysis that any individual major supply shockhas a small impact on monthly prices, and shows that very high prices are expected to beextremely rare.
1 This does not include the probability of using interruption to manage local constraints, aswas seen in January 2010.
GB GAS SECURITY OF SUPPLY AND OPTIONS FOR IMPROVEMENT
March 2010114_GBGasSecurityOfSupply_200910_v4_0.doc
3
PÖYRY ENERGY CONSULTING
Policy options
We then investigated whether there are any additional policy options that might improvethe security of gas supply, either through delivering additional physical gas to GB, orimproving the flexibility of gas demand relative to that which is forthcoming throughexisting commercial and regulatory arrangements.
Further improvements to security of supply might be found from two broad areas: long-term, large strategic facilities designed to provide significant volumes over a longer period;and shorter-term, rapidly available facilities designed to overcome periods of short termdistress.
We examined 24 potential policy options targeted at improving security of supply, butfound only two options which may provide a net benefit under the scenarios investigated.These were restoring I&C interruptible volumes to historic levels and an obligation onexisting CCGTs with backup capability and on new CCGTs to maintain a minimumdistillate level (reflecting their significant contribution to protecting other gas consumers).These would have the effect of halving any risk of unserved energy. However, both wouldrequire regulatory changes so that the costs borne by I&C and CCGT sites can beappropriately recovered.
The policy option of investing in strategic storage to cover the relatively small level ofunserved energy identified under the probabilistic analysis would be expensive, and isunlikely to provide sufficient benefit in improving security of supply to justify its costs.
Conclusion
Our opinion that the GB gas market is becoming more resilient to security of supply risksand able to withstand most foreseeable problems, and that no major changes to currentpolicies are required, is dependent on a number of key assumptions.
Existing Government policies of increasing energy efficiency and the 2020 renewabletargets provide a significant contribution to improving gas security of supply.
GB has completed its move from a position of potential supply constraints to one ofexcess supply capacity and diverse sources. Much of GB’s future supply will come fromthe global LNG market. This has the benefit of interconnecting the world’s energymarkets, making each individual market much more resilient to any local problems, anddrives a convergence of gas prices globally. LNG supplies are both geopolitically andcommercially diverse. Whilst LNG has traditional been traded via fixed long-termcontracts there has been an expanding spot market in the last few years, which has beena key contributor to the supplies experienced in the recent cold winter. This must continueto develop to ensure that LNG moves in response to demand and prices, and policymakers should keep this progress under review.
GB will have access to sufficient gas storage, including European facilities and indirectlyUS storage through LNG arbitrage. Current policies to promote the liberalisation andinteroperability of the European markets, and storage in particular, through the ThirdEnergy Package and Madrid Forum will assist in allowing parties in one jurisdiction accessto facilities in another. There are a significant number of potential storage projects beingconsidered in GB. Any commercial new build will further improve the level of GB’ssecurity of supply and more than cover the potential unserved energy shortfall we found inour modelling.

GB GAS SECURITY OF SUPPLY AND OPTIONS FOR IMPROVEMENT
March 2010114_GBGasSecurityOfSupply_200910_v4_0.doc
4
PÖYRY ENERGY CONSULTING
Policy makers should monitor whether recent market changes to the treatment ofinterruption mean that existing CCGT and I&C sites are decommissioning distillate backupfacilities and/or insufficient capability is being built at new sites. Should this be the caseand it is determined that further levels of protection are deemed necessary then the mostcost reflective solution (out of the options considered in this report) would be to implementone or both of these policy options; to introduce a new mechanism to restore I&Cinterruptible volumes to their historic levels, and a new obligation on some CCGTs tomaintain and/or install backup fuel facilities and stocks. However, there are also otherqualitative considerations with these options too.
We believe that the policy option of directly investing in strategic gas storage would beexpensive and would not, based on the analysis in this report, provide sufficient benefit inimproving security of supply to justify its costs.

GB GAS SECURITY OF SUPPLY AND OPTIONS FOR IMPROVEMENT
March 2010114_GBGasSecurityOfSupply_200910_v4_0.doc
5
PÖYRY ENERGY CONSULTING
1. INTRODUCTION AND BACKGROUND
1.1 Gas security of supply background
The issue of security of gas supply is ever-present. The move from self-sufficiency tobecoming dependent on imported gas, limited liberalisation in Continental Europe,potentially tight LNG markets, high and volatile wholesale prices, and potentially limitedmarket coverage for high impact low probability events add to these concerns.
Gas is crucial to GB’s energy mix. We rely on it to heat our homes and businesses, aswell as to generate electricity, and provide process heat and feedstock for industry.Ensuring that our gas supplies continue to be secure, while we move to a low carboneconomy, is one of the most important obligations for the Government.
However, while the GB gas market has been delivering the infrastructure we need to date,even a fully functioning market can be undermined by factors beyond its control, such asmajor supply disruptions or extreme weather. There is a greater degree of uncertainty thefurther ahead we look into the future.
Gas security of supply has recently been examined by:
The Wicks Review2 – an independent review on ‘Energy Security: a nationalchallenge in a changing world’, which looks in detail at a range of energy securityissues, including gas market issues.
Project Discovery3 – a report by Ofgem which considers amongst other things gassecurity of supply.
DECC’s and Ofgem’s annual publication regarding security of supply ‘Energy MarketOutlook’4. This document published a range of gas demand projections, which werebased on a range of different assumptions and considered scenarios where thedemand for gas increased as well as fell.
National Grid’s annual ‘Ten Year Statement’5.
Both the Wicks Review and Project Discovery raised concerns regarding gas security ofsupply, particularly in scenarios where the demand for gas increases. The key messagesfrom these and the implications for this study are considered in Sections 1.2 and 1.3below.
The GB’s gas security of supply has been recently tested. Low temperatures inDecember and January led to a period of sustained high demand for gas. On twooccasions this led to the highest demand for gas in a day that has been recorded. Addedto these demand side pressures, the market also experienced shocks on the supply-sidewhich significantly reduced the flows of gas to the GB market from Norway. Despite thesepressures, the market responded well and as expected. Prices only briefly responded to
2 http://decc.gov.uk/en/content/cms/what_we_do/change_energy/int_energy/security/security.aspx
3 http://www.ofgem.gov.uk/Markets/WhlMkts/Discovery/Pages/ProjectDiscovery.aspx4 http://www.decc.gov.uk/en/content/cms/what_we_do/uk_supply/markets/outlook/
outlook.aspx5 http://www.nationalgrid.com/uk/Gas/TYS/current/TYS2009.htm

GB GAS SECURITY OF SUPPLY AND OPTIONS FOR IMPROVEMENT
March 2010114_GBGasSecurityOfSupply_200910_v4_0.doc
6
PÖYRY ENERGY CONSULTING
these very high demands before returning to previous levels, which have been generallylow compared to recent winter prices. Overall the market was able to balance supply anddemand, with only some limited transportation interruption. The recent winter experienceis discussed further in Section 2.11.
A key issue, when considering the GB’s gas security of supply, is the increasingdependence on imported supplies and crucially the trade in gas between GB andcontinental Europe including Norway. Governments, international bodies and marketplayers are already working to address European security of supply problems includingthe implementation of the third energy directive, the EU Regulation on Gas Security ofSupply6 and major new infrastructure projects, including new pipelines from Russia,Algeria, the Caspian region, LNG terminals, interconnectors and storage. It is worthnoting that the original draft EU Regulation on Gas Security of Supply published inNovember 20087 looked at a range of options including the possibility of requiringstrategic storage and backup distillate at gas-fired power stations, although the currentversion does not have either as a compulsory option.
DECC commissioned Pöyry Energy Consulting in 2009 to carry out this study, to estimatethe size of a variety of gas security of supply provisions, identify a range of security ofsupply policy instruments, focusing on storage, distillate back-up and demand sideresponse, and determine their costs and the degree to which they could work successfullyin a non-distortionary manner, in GB’s liberalised market-based regime.
1.2 Wicks review
Malcolm Wicks MP, a former energy minister and in his role as the Prime Minister’sspecial representative on international energy, was asked to carry out a review ofinternational energy security and how developments internationally are likely to affectGB’s own energy security in the coming decades.
In his report published in August 2009 he stated that “an energy policy must aim atachieving:
physical security: avoiding involuntary interruptions of supply;
price security: providing energy at reasonable prices to consumers; and
geopolitical security: ensuring the UK retains independence in its foreign policythrough avoiding dependence on particular nations”.
He also references that according to the Centre for Strategic and International Studies, “asecure energy system will tend to be characterised by:
a) A diverse mix of different energy sources and fuels, with the capability to switchbetween these when necessary.
6 It has suggested a so-called ‘N-1 rule’ for gas supply security, whereby European MemberStates must provide that they are able to withstand the loss of their major gas import routeand continue to provide gas supply to domestic (or, otherwise-defined, high priority)customers. The details of the Regulation are expected to be finalised in spring 2010.
7 Communication from the Commission to the European Parliament, the Council, theEuropean Economic and Social Committee and the Committee of the Regions – SecondStrategic Energy Review : an EU energy security and solidarity action plan {SEC(2008)2870} {SEC(2008) 2871} {SEC(2008) 2872}

GB GAS SECURITY OF SUPPLY AND OPTIONS FOR IMPROVEMENT
March 2010114_GBGasSecurityOfSupply_200910_v4_0.doc
7
PÖYRY ENERGY CONSULTING
b) Diversity of suppliers of energy, without excessive reliance on imported supplies,which have a risk of disruption beyond the host country’s control.
c) Diverse routes of imported supply, avoiding excessive reliance on particular ‘supplycorridors’.
d) Reducing ‘energy intensity’: the amount of energy required to produce a unit ofnational output.
e) Reliable and well-managed physical infrastructure.
f) Stable and affordable energy prices.
g) Feasible and commercially-viable plans for technological improvement for thefuture”.
The report made various recommendations, including for gas that the Government shouldensure that we maximise economic production from the UK’s own still considerablereserves and this requires continuing attention to the tax and regulatory regimes forproducers. It identified the need for more gas storage to enable demand to be met shouldthere be a supply disruption or a prolonged period of high demand, such as in a very coldwinter, and said consideration should be given to providing strategic gas storage facilitiesas an insurance policy to help improve the country’s energy security. It also said thatbetter arrangements were needed to enable effective moderation of demand at times ofsupply difficulty.
This study will further review the above in terms of the ability of the GB gas system tomeet security of supply standards against some extreme stress tests and to what levelmore gas storage, including any strategic facilities, and demand side response is required.
1.3 Project Discovery
Project Discovery was launched by Ofgem in March 2009. In October 2009 it set out itsviews on the risks and challenges facing the gas and electricity industries in GB over thenext 10–15 years through its energy scenarios document8. This identified four possiblescenarios, summarised as follows:
1. Green Transition – GB demand reduces from 95bcm and peak of 506mcm/d in 2010to 77bcm and peak of 478mcm/d by 2020. Renewable targets met. LNG acts asthe source of ‘swing’ with terminal utilisation rate assumed at 20%.
2. Green Stimulus – GB demand reduces from 96bcm and peak of 507mcm/d in 2010to 81bcm and peak of 472mcm/d by 2020. Renewable targets met. LNG acts as thesource of ‘swing’ with terminal utilisation rate assumed at 25%.
3. Dash for Energy – Global economies bounce back strongly but security of supplyconcerns prevail over environmental concerns. Generation build dominated byCCGTs and renewables target is not met. GB demand increase from 94bcm andpeak of 500mcm/d to 113bcm and peak of 584mcm/d by 2020. Gas supply is tightwith high prices and planning delays push back storage investments resulting in ashortage coinciding with peak prices in 2015. Global demand from LNG trebleseven with very limited requirement from the US because of continued expansion ofunconventional sources. LNG terminal utilisation assumed to be 70%.
8 Ofgem’s analysis was updated in February 2010, with slightly lower demands, but as therewere no published data tables the original reference has been retained.

GB GAS SECURITY OF SUPPLY AND OPTIONS FOR IMPROVEMENT
March 2010114_GBGasSecurityOfSupply_200910_v4_0.doc
8
PÖYRY ENERGY CONSULTING
4. Slow Growth – Impact of recession and credit crisis continues resulting in low levelsof investment. Increasing dependence upon CCGT generation and renewablestarget is not met. GB demand increases from 90bcm and peak of 488mcm/d to103bcm and peak of 527mcm/d by 2020. LNG terminal utilisation assumed to be60%.
This study uses a similar Average annual and peak demand case to Ofgem’s GreenTransition and Green Stimulus scenarios, reflecting the base assumption of achieving the2020 renewable targets, but uses a higher Severe demand case to reflect a 1 in 50 wintercompared to Ofgem’s 1 in 20 winter, see Section 2.6. In addition we have undertaken aVery High demand sensitivity which has a similar annual and peak demand level toOfgem’s Slow Growth scenario, see Section 4.2.1.
However, this study does not consider a specific case with a significant increase in gasdemand growth envisaged in Ofgem’s Dash for Energy scenario. Instead we haveperformed a probability analysis, see Section 4.3, which includes a worst case of anannual demand of 123bcm and peak demand of over 700mcm/d (including Irish exports)in order to determine the likelihood of there being some unserved energy.
In addition, throughout the deterministic modelling we have restricted the supply side bysaying there will be no new GB infrastructure (apart from those already committed whenthis study was commissioned). Should demand increase across the next decade asprojected in Dash for Energy we would fully expect various new infrastructures projects tobe built, with the potential addition of up to 18bcm of gas storage and 35bcm of LNGregasification terminals plus new gas supplies from West of Shetland and Norway.
We also note that the peak demands projected in the Dash for Energy scenario is another59 mcm/d compared to the NGG 2009 TYS estimate and such an increase would morethan likely require further investment in the NTS, which will depend on the CCGT location(as well as addition investment in the high transmission electricity network) or the addedCCGTs will have to have an interruptible supply contract (and this may not provide thelevel of security required by the electricity supply).
Ofgem also performed some stress tests, including re-direction of LNG supplies (40%reduction in a 1 in 20 winter period), a Russia-Ukraine dispute (50% IUK export, 0% BBLimport over 1 in 20 winter period), and an outage at Bacton (zero supplies on a 1 in 20peak day). As will be seen in Section 4.1 a similar but more extreme set of stress tests isconsidered as part of this study.
1.4 Report structure
Section 2 of this report sets out our assessment of current levels of physical supplyinfrastructure, gas storage, gas-fired power generation distillate backup and demand sideresponse through interruption of industrial and commercial customer. We then forecastfuture levels of these (without further government intervention) for gas years 2010, 2015,2020 and 2025. A gas year runs from 1 October to 30 September the following year, sothroughout this report 2010 means from 1 October 2010 to 30 September 2011 and thesame for the other years analysed.
We also present three GB demand scenarios to be used in testing the security of supply:Average (to achieve DECC’s 2020 targets); Severe (1 in 50 representation of the Averageacross North-West Europe); and Central (partial achievement of 2020 targets). For eachyear a 1 in 20 peak day is included so that achieving the peak demand is appropriatelyconsidered.

GB GAS SECURITY OF SUPPLY AND OPTIONS FOR IMPROVEMENT
March 2010114_GBGasSecurityOfSupply_200910_v4_0.doc
9
PÖYRY ENERGY CONSULTING
In addition to this, Pöyry’s assumptions regarding infrastructure build, as well asassumptions regarding the market’s potential for demand side response measures arelaid out within this section. Using a combination of publicly and privately availableinformation, we developed, in conjunction with DECC, a set of inputs that will serve toinform the modelling within later sections. These not only include technical inputs(capacities, production rates etc.) but also economic inputs, such as the costs associatedwith storage and distillate backup usage.
In Section 3 we identify the drivers for investment decisions as well as the significantbarriers to the provision of commercial gas storage and distillate backup, which is used toprevent gas supply interruptions to firm users. This section explores the main driversbehind investment decisions, based upon Pöyry’s assumptions formed from historicaldata. A look is also taken at the main stages in constructing a storage facility, with theattendant issues and milestones inherent in doing so. In addition to this, the section alsosets out the barriers that exist both now and into the future for creating additionalinvestment within storage, distillate backup and demand side response. These barriersencompass environmental, financial, practical and technical issues, and where possiblewe have used examples based upon currently existing facilities for clarity.
Section 4 aims to quantify any potential shortfall in gas supply to GB, for the years 2010,2015, 2020 and 2025, due to low probability, high impact events. For this section, weassume that no further government intervention occurs, and within this case the volumesof gas available or which can be freed up for other use, or the volume of demandreduction, is observed. Against the demand scenario assumptions we model first a seriesof supply shocks and then consider the security of supply risks from a probabilisticanalytical approach.
The first stage of analysis was to review the impact of specific predefined supply shocks.We developed, in conjunction with DECC, shocks that might have the greatest impactduring the time period being modelled. To further stress test the analysis we havecombined the two cases with the biggest impact on potential energy unserved and pricesto form a combined shock case. These shock combinations would thus vary over thedifferent years.
The next stage of our analysis was to consider the supply risks to GB on a probabilisticbasis. The aim of this analysis is to produce probability distributions for likely wholesaleprice distributions, energy unserved, and annual demand flows. It will then be possible tocalculate appropriate summary statistics to describe the data and to draw broadconclusions.
In Section 5 we have identified a number of potential policy instruments for increasing theprovision of gas storage and distillate backup, for increasing demand side response, andreview these against a set of selection criteria. This serves to outline the various optionswhich have the potential to mitigate any effects of unserved energy and who would havethe responsibility for its delivery. We have reviewed security supply policies currently inplace within other European countries and selected examples from across the world.Then using the probabilistic analysis results from Section 4 we have evaluated whetherthe selected policy options provide a net benefit compared to any costs, risks andunintended consequences (e.g. displacement, distortions, etc.) and recommend which, ifany, policy options should be considered for adoption.

GB GAS SECURITY OF SUPPLY AND OPTIONS FOR IMPROVEMENT
March 2010114_GBGasSecurityOfSupply_200910_v4_0.doc
10
PÖYRY ENERGY CONSULTING
1.5 Report conventions
1.5.1 Sources
Where tables, figures and charts are not specifically sourced they should be attributed toPöyry Energy Consulting.

GB GAS SECURITY OF SUPPLY AND OPTIONS FOR IMPROVEMENT
March 2010114_GBGasSecurityOfSupply_200910_v4_0.doc
11
PÖYRY ENERGY CONSULTING
2. CURRENT MARKET POSITION
The first part of this study is to review the current market situation in GB in terms of itsphysical supply infrastructure and how much potential distillate backup and industrial andcommercial demand side response (‘DSR’) could be utilised in the event of a nationalshortage. In addition to this, our assumptions regarding infrastructure build, as well asassumptions regarding the market’s potential for demand side response measures arelaid out within this section. Using a combination of publicly and privately availableinformation, we have developed in conjunction with DECC a set of inputs that will serve toinform the modelling within later sections. These not only include technical inputs(capacities, production rates etc) but also economic inputs, such as the costs associatedwith storage and distillate backup usage.
2.1 Security of supply
First we will identify the various factors to consider when defining gas security of supply,such as 1 in 50 annual demand, 1 in 20 peak day demand, the gas balancing alertmechanism, storage monitors, emergency rules, etc.
The basic requirement of a secure gas supply is that it is sufficient to balance most gasdemands in all but the most extreme circumstances. The system should be able to copeduring severe cold weather, or when an event has physically interrupted some of thesupply to the system. Within the GB gas industry, it is traditional to consider this at a dailyand annual resolution. Daily resolution is considered as it is reflective of the physicalbalancing needs of the network, which are also embodied in the prevailing commercialarrangements in place in the GB gas market. Annual resolution is considered as itcaptures seasonal variation in an aggregate figure, enabling comparisons andgrowth/decline rates to be considered.
Within this definition of security, it is necessary to examine the market drivers andelasticity of the elements of total demand and total supply, to understand where theremight be crossover and where demand might be sensitive to price.
2.1.1 Demand
Demand can be categorised according to end use purposes, as:
domestic – supplying homes and small commercial premises for primarily space andwater heating purposes;
industrial and commercial – again providing primarily space heating;
feedstock – providing natural gas as a feedstock to the chemical industry (i.e. not as aheating fuel), especially in the manufacture of nitrogen fertilisers;
combined heat & power;
power generation; and
other uses (e.g. gas transportation).
2.1.1.1 Weather sensitivity
As the majority of gas demand is used for space heating purposes it is very sensitive toweather. A study of weather sensitivity, the relationship between demand and weather,

GB GAS SECURITY OF SUPPLY AND OPTIONS FOR IMPROVEMENT
March 2010114_GBGasSecurityOfSupply_200910_v4_0.doc
12
PÖYRY ENERGY CONSULTING
and the extremities of weather is beyond the scope of this document. However,understanding that GB demand is related to weather and therefore that very high demandlevels are driven by extreme weather conditions is a crucial element in understanding thatvery high demand levels are very rare. Further information on the precise relationshipbetween demand and weather may be found in publications from National Grid Gas plc(NGG).
2.1.1.2 Security standards
The gas transportation licence contains provisions that define certain demand levels assecurity levels9. These are the 1-in-20 peak day – the level of daily demand that could beexpected to be exceeded only once in 20 years (1:20); and the 1-in-50 winter – the levelof demand over a winter period (October to April) that could be expected to be exceededonly once in 50 years (1:50).
The 1:20 demand level is used to specify the capability of the network and therefore actsas the main driver of investment in the pipeline network. The 1:20 demand level used byNGG for the purposes of identifying investment is a summation of the weather sensitiveforecasts of individual regional 1:20 forecasts and large loads at contractual levels (i.e. itis undiversified). It therefore overstates what could be considered a national (ordiversified) 1:20 demand level quite significantly. The appropriateness of the 1:20demand level is outside the scope of this study but we have used this level as a 95th
percentile for our modelling.
The 1:50 demand level used to form part of the gas supply licence and provided anobligation on suppliers in respect of their domestic customers. However, it had becomeeffectively toothless through the concept that purchases at the National Balancing Point(procured via a shipper) were sufficient to meet the condition. The supply licencecondition was removed from the supply licence during 2007; however it was necessary toinclude a similar concept in the network code conditions of the gas transporter. A national(diversified) 1:50 demand curve is usually published by NGG as part of its Ten YearStatement (TYS).
2.1.1.3 Price sensitivity
Since the introduction of supply competition in the 1990s a traded wholesale gas price hasevolved within the daily balancing regime and some consumers, especially largeconsumers are now considered as price sensitive.
These price sensitive consumers offer some scope for reducing their demand in responseto pricing signals. An alternative way of viewing this ability is to treat it as a source ofsupply, and to consider the complete original demand as demand. Price sensitivedemands are discussed further in Sections 2.8 and 2.9.
2.1.2 Supply
The supplies of gas available over a period can also be categorised according toupstream source:
United Kingdom Continental Shelf (UKCS), comprising;associated gas, being gas produced as a by-product of oil production;dry gas, being gas produced in it’s own right;
9 http://epr.ofgem.gov.uk/index.php?pk=folder132658

GB GAS SECURITY OF SUPPLY AND OPTIONS FOR IMPROVEMENT
March 2010114_GBGasSecurityOfSupply_200910_v4_0.doc
13
PÖYRY ENERGY CONSULTING
Gas storage, being gas held in gas storage facilities;
Continental European imports, via the two interconnectors (from Belgium and theNetherlands); and
LNG imports.
We discuss each of these in Sections 2.2, 2.3, 2.4 and 2.5.
2.1.3 Storage monitors, operating margins, and the Gas Balancing Alertmechanism
Various mechanisms have been used since the inception of the Network Code to enablethe gas transporter to help ensure that suppliers and shippers are able to meet demandthrough the winter.
2.1.3.1 Storage monitors
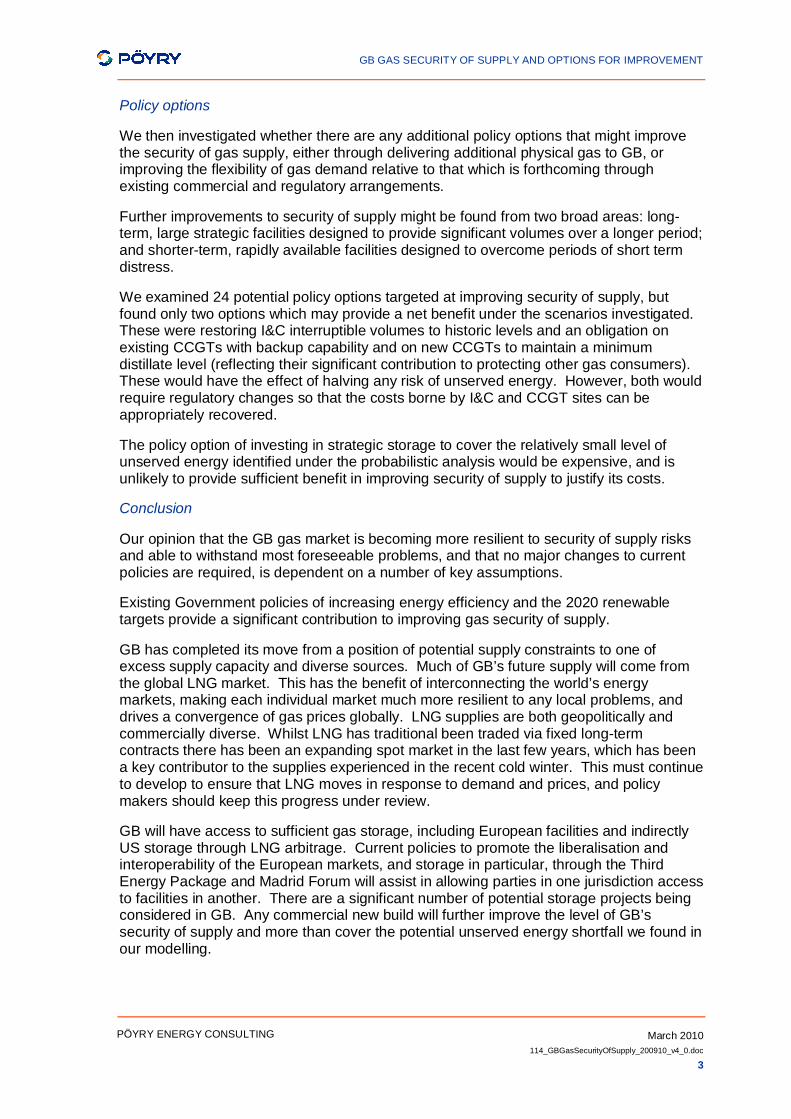
Storage monitor curves describe minimum volumes of gas that need to be held in storagethrough the winter period to ensure that certain demands can continue to be met if theremainder of the winter was to suffer a particular weather severity. There are two monitorcurves used: the safety monitor and the firm monitor.
The safety monitor is the curve that ensures the safety of the gas pipeline network, andenables ‘the preservation of supplies to domestic customers, other non-daily metered(‘NDM’) customers and certain other customers who could not safely be isolated from thegas system if necessary in order to achieve a supply-demand balance and therebymaintain sufficient pressures in the network.’10 As such, the safety monitor represents anelement of the safety case of NGG, and use of this gas in store would only be consideredin the event of a gas supply emergency.
The firm monitor is published by NGG for information purposes only, and represents itsview of the level of gas in store required to ensure that all ‘firm’ gas demand can be met ina 1:50 winter.
The volumes of gas in store, and the storage monitor curves are published by NGG. Thepicture in respect of the winter 2009/10 to date is shown in Figure 1 overleaf.
2.1.3.2 Operating margins
Operating margins (‘OM’) are options to procure volumes of gas, held by NGG (following atender process), that could be exercised for a variety of reasons. These reasons are splitinto three groups:
Group 1 – events that are rarely expected to occur e.g. a loss of supply or loss ofinfrastructure;
Group 2 – events that are expected to occur e.g. a loss of compression on thenetwork, routine forecasting errors, or a significant supply loss; and
Group 3 – a declared gas network emergency, for the orderly rundown of the system.
The volumes required by each group are calculated independently by NGG. Group 1events examined include a major loss of UKCS production due to the loss of the Fortiesoffshore liquid pipeline system, loss of St. Fergus beach terminal, and the loss of the main
10 NGG, ‘Safety Monitor and Firm Gas Monitor Requirements’, September 2008
GB GAS SECURITY OF SUPPLY AND OPTIONS FOR IMPROVEMENT
March 2010114_GBGasSecurityOfSupply_200910_v4_0.doc
14
PÖYRY ENERGY CONSULTING
sub-terminal at each of the beach terminals. Group 2 events are calculated with the useof summary statistics on compressor reliability, etc.
OM were historically provided by LNG peak facilities, however due to a number of reasons(primarily licence changes introduced by Ofgem, but also a decreasing need for locationalOM services), NGG now tenders for these services from a variety of sources, includingdemand-side sources.
Figure 1 – GB Storage monitor curves and stocks
0
10,000
20,000
30,000
40,000
50,000
60,000
Oct-2009 Dec-2009 Feb-2010
GW
h
Actual LRS stockActual MRS stockActual SRS stockActual total stockFirm monitorSafety monitor
Source: National Grid
2.1.3.3 Gas Balancing Alert
The Gas Balancing Alert (‘GBA’) mechanism has been introduced to indicate to themarket when NGG considers it likely that some form of demand-side response oradditional supplies might be required to ensure the physical balance of, and the futuresafety of the network. NGG publishes a demand level that it considers can be met, basedon the current capability and recent reliability of supplies to the market. A basic triggerlevel is set based on assumptions that are consistent with the assumptions used tocalculate safety monitor, and the trigger level is revised to reflect actual supplyperformance during the winter and if storage stocks get within two days of the safetymonitor. A GBA is issued if tomorrow’s forecast demand is above the trigger level.
Since its introduction, the GBA has only been issued on five occasions. The first was onMonday 13 March 2006, when Rough storage facility was unavailable, there were acouple of planned outages, and there was a forecast of cold weather and therefore highdemand. The market reacted, with day ahead wholesale prices rising from the previousFriday’s forward price of approximately 60p/th, opening at 190p/th and peaking within dayat 255p/th. During the day the weather was less severe than forecast and the forecastdemand did not materialise. The following day the market opened in a long position

GB GAS SECURITY OF SUPPLY AND OPTIONS FOR IMPROVEMENT
March 2010114_GBGasSecurityOfSupply_200910_v4_0.doc
15
PÖYRY ENERGY CONSULTING
(where forecast supplies were greater than forecast demand). Prices gradually returnedto their previous position.
Pöyry understands that NGG came close to issuing a GBA during the Ukrainian transitcrisis of January 2009, but did not actually do so. Prices during this period remainedmostly stable, averaging 60p/th and fluctuating between 53p/th and 70p/th.
The other four occasions happened in January 2010 during the coldest winter in 30 yearsso far. Further details are included in Section 2.11 on page 42.
2.2 Indigenous production
GB has historically been mostly self-sufficient in gas with supplies coming from the UKcontinental shelf (UKCS). This gas entered GB through a geographically diverse numberof reception terminals at St. Fergus, Easington, Bacton, and Barrow. The offshore gasfields were developed with certain levels of swing, which provided the suppliers withhigher output in the winter and lower output in the summer. However, these have been indecline from their peak production in 2003 and this is forecast to continue during the nextdecade.
This was then supported by the Rough depleted gas storage facility to provide long-termsupport during the winter, Hornsea salt cavity storage for medium-term storage and fiveLNG peak storage facilities for short-term transportation support at specific locationsacross the country.
The current and projected levels of UKCS production for the time period of this study isshown in Figure 2 below.
Figure 2 – UKCS gross gas production (bcm)
0
10
20
30
40
50
60
2010 2015 2020 2025
Ann
ual p
rodu
ctio
n (b
cm/y
ear)
Associated gas production Dry gas production

GB GAS SECURITY OF SUPPLY AND OPTIONS FOR IMPROVEMENT
March 2010114_GBGasSecurityOfSupply_200910_v4_0.doc
16
PÖYRY ENERGY CONSULTING
We have estimated the future levels of annual production using projected depletion rates,based on the relationship between the original recoverable reserves, the 2009 values forthe recoverable reserves from DECC, the peak and historical flow rate and whether thefields are associated with oil production (generally a longer depletion period) or not. Wehave checked this against data from the TYS published in 2009, and extended to 2025based on our database of fields, reserves and production rates. We have not includedany supplies from potential new areas, such as West of Shetland, although we note therecent tax changes aimed at assisting such developments. Should these new fields beforthcoming it will have the affect of reducing the rate of decline in UKCS production.
2.3 Gas storage
2.3.1 Gas storage in GB
There are currently just six underground storage facilities in GB (Rough offshore depletedfield, Humbly Grove and Hatfield Moor, both onshore depleted fields, and Hornsea, HoleHouse and Aldbrough salt caverns). In addition, there are three peak LNG storagefacilities (Avonmouth, Partington and Glenmavis).
It is interesting to note from the figures presented in Figure 1 that only about 60% ofavailable storage capacity has been used during 2009/10 to 11 February 2010, during awinter that has been the coldest in the last 30 years so far.
Previous years have utilisation rates as set out in Table 1 below, where the utilisation ratein 2006/07 is explained by mild weather and in 2005/06 by the Rough outage. In 2008/09,which saw a major interruption of Russian gas through the Ukrainian transit routes at thesame time as a colder than average January, the utilisation rate was only around 75%.
Long-, mid- and short-range storage are defined in the ‘Safety & Firm Gas MonitorMethodology’ December 2006, National Grid. They can be loosely considered torepresent Rough & other depleted field facilities, salt caverns and some faster cycledepleted field facilities, and LNG storage, respectively.
Table 1 – Storage space utilisation rates
Gas Year Long range (%) Mid range (%) Short range (%) Overall (%)
2005/06 49 77 75 552006/07 42 55 40 452007/08 78 70 42 752008/09 77 64 74 74
2009/10 (to 11/2) 63 61 50 62Source: National Grid
For the purposes of the modelling part of this study we have assumed that only projectsthat have received financial approval will be built. These figures have been gathered fromthe GSE and Platts. We have delayed Humbly Grove’s expansion to 2011, as this is stillunder construction by Star Energy (it was originally forecast to be complete in 2008)11.
11 Platts European Gas Daily 09 February 2009.

GB GAS SECURITY OF SUPPLY AND OPTIONS FOR IMPROVEMENT
March 2010114_GBGasSecurityOfSupply_200910_v4_0.doc
17
PÖYRY ENERGY CONSULTING
Table 2 shows each of the existing GB gas storage facilities and those assumed to beavailable as part of the later modelling.
Table 2 – Assumed GB Storage Facilities (mcm)
2010 2015 2020 2025Albury Depleted 0 170 170 170Caythorpe Depleted 0 210 210 210Hatfield Moor Depleted 116 116 116 116Humbly Grove Depleted 280 340 340 340Rough Depleted 3,340 3,340 3,340 3,340Avonmouth LNG 81 81 81 81Glenmavis LNG 47 47 47 47Partington LNG 52 52 52 52Aldbrough Salt 420 840 840 840Hole House Salt 55 55 55 55Holford (Byley) Salt 0 165 165 165Hornsea Salt 325 325 325 325Stublach Salt 0 203 406 406Total 4,716 5,944 6,147 6,147
There is a range of potential gas storage projects at various stages of projectdevelopment and these are listed in Table 3 below. These facilities, however, are still inthe conceptual stage, and therefore for the purposes of the modelling in Section 4 theyhave not been included.
Table 3 – Proposed storage facilities within GB
Facility Type Capacity (mcm)Bains Depleted 570Baird Depleted 1,700Esmond, Forbes & Gordon Depleted 4,200Hewett Depleted 5,000Saltfleetby Depleted 400Welton Depleted 450British Salt Salt 1,000Fleetwood Salt 1,200Gateway Salt 1,500Isle of Portland Salt 1,500White Hill Farm Salt 420Total 17,940
Source: GSE, Platts
As can be seen in Figure 3 should they all be built then there would be a significantincrease in available capacity to GB gas security of supply especially when consideredagainst an expected normal conditions peak demand of 400mcm/d. In addition thevolumes shown do not take into account how much cycling could be achieved over a year.Whether all or any of these are required in the future will be informed through themodelling results in Section 4.

GB GAS SECURITY OF SUPPLY AND OPTIONS FOR IMPROVEMENT
March 2010114_GBGasSecurityOfSupply_200910_v4_0.doc
18
PÖYRY ENERGY CONSULTING
For comparison Figure 3 also shows the current storage capacity in Germany. Whilst thelevel of storage is more than GB, and German expected normal conditions peak demandis higher at c.580mcm/d, they have historically needed a higher ratio of storage cover toreflect the limited number of its supply sources.
Figure 3 – Potential growth in GB Gas Storage
Source: GSE
GB peak shaving LNG storage
At the beginning of 2009 GB had four peak shaving LNG storage facilities which had beenbuilt in the 1970s. Their objective was to be situated in strategic locations close to areasof high demand or at the extremities of the network. Their key feature has been theirlocation and their ability to rapidly revaporise the natural gas and so provide highdeliverability and short term support to the NTS. As a result, LNG storage is able toprovide a peak gas supply to shippers and supplement NGG's network capacity. Inaddition, LNG Storage has been used as a contingency against the risk of emergenciessuch as system constraints, failures in supply or failures in end user interruption.
In November 2008 NGG proposed disposing of its peak shaving LNG storage facilities atDynevor Arms which was previously at an extremity of the NTS and provided locationaloperating margin services. The local need had been superseded by the development ofthe Milford Haven pipeline and the two new LNG entry terminals in South Wales.However, after receiving insufficient interest in a sale the site was closed from the end ofApril 2009.
On 18 August 2009 NGG then announced a review of the remaining three facilitiesreflecting the consequences of the development and expansion in gas storage and

GB GAS SECURITY OF SUPPLY AND OPTIONS FOR IMPROVEMENT
March 2010114_GBGasSecurityOfSupply_200910_v4_0.doc
19
PÖYRY ENERGY CONSULTING
changes to the pattern of gas flows within the NTS. It again asked for expressions ofinterest in long term capacity, up to 20 years, from shippers.
Since the modelling analysis was completed NGG announced on 21 December 200912
that it had again found insufficient interest to justify the required investments. It said thenext stage would be a risk and economic review and no commercial liquefaction will takeplace during the summer of 2010 and customers might wish to plan their stock positionsbased on the potential reduction in storage services from May 2011.
This review will also need to consider that 80mcm was required to flow in January 2010and although we have included the three sites in our assumed storage facilities, as shownin Table 2, the results in Section 4.1 show no use is made of the three LNG peak storagefacilities in the main scenarios from 2015 due to cheaper available sources compared tothe cost of summer refilling.
2.3.2 Strategic storage across Europe
Various countries have either explicitly defined levels of strategic storage or mechanismsthat could be considered as ‘de-facto’ strategic storage. Countries that have beenidentified as having this are Italy, France, Hungary, Poland, Portugal, Slovakia, Belgium,Spain, Denmark, and Romania. We look at these in more detail in Section 5.3.
We do not explicitly consider ‘de-facto’ strategic storage in the model, because, whilst werecognise its presence, the model is trying to determine the economic dispatch of themarkets. The model is free to use ‘strategic storage’, which is set at a very high price,where it is economic to do so, however, it is rarely economic compared with other options(e.g. UKCS swing, or the US storage/LNG flexibility observations) and therefore remainsunused in normal conditions.
2.3.3 Gas storage in the United States and Europe
When considering the level of storage any country may need, it is important to considerhow much storage there maybe available in other nearby countries.
The linkage of GB with continental Europe means it has the potential to access largeamounts of storage providing it is open to third parties to access and there are notransportation constraints in bringing the gas across Europe to GB.
In addition, the expansion of LNG around the world means that Europe and GB canaccess storage in the US by acquiring LNG cargoes destined for the US in the winter,which can supplement this supply with its own large quantities of gas storage.
The potentially available capacity of gas storage in the US, Europe and GB shown inFigure 4 highlights how much storage there is in the major western gas markets, althoughnot all will be available due to competing demands and constraints.
12 http://www.nationalgrid.com/uk/Media+Centre/PressReleases/18.12.09.htm

GB GAS SECURITY OF SUPPLY AND OPTIONS FOR IMPROVEMENT
March 2010114_GBGasSecurityOfSupply_200910_v4_0.doc
20
PÖYRY ENERGY CONSULTING
Figure 4 – US storage levels compared to Europe and GB
0
50
100
150
200
250
2010 2015 2020 2025
bcm
US Continental Europe UK
2.4 Pipelines and interconnectors
As the level of gas supply from the UKCS has declined in recent years various newinfrastructure projects have been built to increase the capacity of imported gas, whetherthough LNG or pipeline from Norway and continental Europe. We have an infrastructuredatabase which is updated regularly with information from trade publications and industrysources. Table 4 shows the capacity assumptions we believe will be in operation from2010 to 2025.
We have assumed that the Netherlands to GB Interconnector, the BBL pipeline, will havephysical reverse flow by 2015 and have commercial ‘virtual’ reverse flow in 2010, with thelatest news being that virtual reverse flow might be available in Q2 2010.
The Tampen Link connects Norwegian gas fields, including Statfjord late-life gas, to the StFergus terminal via the FLAGS pipeline system. This allows more Norwegian gas to takethe place of declining UKCS supplies into St Fergus. The Tampen link has a capacity of10bcm/yr but exactly how much additional Norwegian gas will flow in the direction of GB isunclear. We have reflected this by adding 1bcm/yr of Norwegian gas from the gas year2007/08, for 5 years.
We also holds details on the capacities of pipelines across Europe as the ability of gas toflow across countries will assist in allowing gas to flow to where it is needed most andespecially when there is a severe supply disruption. We take existing trans-Europeinterconnection capacities from GIE. As a simplifying assumption we ignore internalcapacity constraints within each demand zone, see Annex A for details of the demandzones.

GB GAS SECURITY OF SUPPLY AND OPTIONS FOR IMPROVEMENT
March 2010114_GBGasSecurityOfSupply_200910_v4_0.doc
21
PÖYRY ENERGY CONSULTING
Table 4 – Pipelines and interconnectors to GB (bcm/yr)
2010 2015 2020 2025GB to Neth 0.0 17.0 17.0 17.0Neth to GB 17.0 17.0 17.0 17.0GB to Belgium 20.0 20.0 20.0 20.0Belgium to GB 23.7 23.7 23.7 23.7GB to Island of Ireland 11.3 11.3 11.3 11.3Island of Ireland to GB 0.0 0.0 0.0 0.0Langeled 23.0 23.0 23.0 23.0Vesterled 10.0 10.0 10.0 10.0Additional Norwegian capacityto St. Fergus
3.0 5.0 5.0 5.0
Growth in interconnection across Europe occurs with new major pipelines. For this studywe have forecast that Nordstream is online by 2012 with a capacity increase for phase 2in 2016. We are assuming Southstream is not constructed but that Nabucco is introducedover the period 2016 to 2018, on a phased basis. Nabucco is filled by dedicated supplieswhich come on stream at the same time as pipeline capacity (probably fromCommonwealth of Independent States (CIS) and Middle East, but possibly also Russia).With regards to major developments in Russian supplies, we have forecasted theShtokman field to come online in 2015, reaching its maximum capacity in 2018, andYamal fields to come online in 2014. The expected Russian gas flows from existing andassumed new fields is shown in Figure 5 below and further detail can be found in thePöyry report ‘Russian Gas: will there be enough to go around, April 2009’ (see Annex E).
Figure 5 – Existing and assumed Russian gas flows into Europe
0
100
200
300
400
500
600
700
800
900
1,000
2005 2010 2015 2020 2025
bcm
/yea
r
Central AsianImports
Shtokman
Yamal
East Siber ia & RussFarE
Reducedflaring/Increasedproduction from IGCs
West Siberia
Orenburg andCaspian (Russ)
Russian plus transitcountry consumption(optimistic)

GB GAS SECURITY OF SUPPLY AND OPTIONS FOR IMPROVEMENT
March 2010114_GBGasSecurityOfSupply_200910_v4_0.doc
22
PÖYRY ENERGY CONSULTING
We have also increased French/Iberian interconnection, German/Austrian interconnectionand Hungarian/Romanian interconnection (in both directions in all cases) prior to 2015, inline with proposed projects. We assume a far greater east to west capacity than west toeast. For example capacities (in mcm/d) from Slovakia into Czech Republic andAustria/Hungary are 144 and 145 respectively, but their counter-directional capacities are12.4 and 0.0 respectively. There are similar asymmetries across Europe.
2.5 LNG facilities
This section not only looks at the development of regasification facilities in GB, but givenits global nature also takes a wider perspective and discusses the development ofinternational facilities for liquefaction and regasification and trading based on internationalprice signals.
2.5.1 GB regasification
Table 5 shows our assumptions for GB’s LNG re-gasification terminals in 2010. For thepurpose of the modelling in Section 4 we have assumed that no more LNG regasificationfacilities will be constructed, apart from Isle of Grain phase III to be operational by 2010and South Hook phase II by 2011. There is a notional 4 bcm capacity at the ExcelerateEnergy LNG gas port at Teesside but it has no permanent re-gasification terminal and sono ability to respond to within day and short term needs.
Table 5 – Current LNG terminals within GB (bcm)
2010 2015 2020 2025Dragon 6.00 6.00 6.00 6.00South Hook 10.50 21.00 21.00 21.00Isle of Grain 20.28 20.28 20.28 20.28Teesside 4.00 4.00 4.00 4.00
Into the future there is the possibility that there will be the various expansions and newregasification terminals built and these are shown in Table 6. Whilst this shows apotential for another 35 bcm of capacity it is our view that there are some challenges inbringing these to commercial operation, with the most likely to proceed being Dragonphase 2. In addition, Isle of Grain announced in August 2009 that it was seekingexpressions of interest in developing phase IV but no potential capacity was proposed.To be conservative none of these have been included in the modelling in Section 4.
Table 6 – Potential LNG expansion within GB
Facility Capacity (bcm)Canvey Island 5.4Gateway LNG 2.7Port Talbot 4.1Anglesey LNG 20.0Dragon phase 2 3.0
Source: Pöyry Energy Consulting, Platts

GB GAS SECURITY OF SUPPLY AND OPTIONS FOR IMPROVEMENT
March 2010114_GBGasSecurityOfSupply_200910_v4_0.doc
23
PÖYRY ENERGY CONSULTING
2.5.2 Global liquefaction & regasification
There are many projects proceeding and being planned for new LNG liquefaction plantsthroughout the period, significantly in Australia, Algeria, Brunei, Egypt, Iran, Nigeria, Qatarand Trinidad and Tobago. We have also assumed that there is some decline in olderliquefaction capacity. Most of the growth is assumed to be from now until 2016 with onlyRussian supplies increasing after that. We assume that capacity available in 2000declines from 2015 at a rate or 5% per annum, as seen in Figure 6, below.
The major source for LNG export to GB and Europe will be Qatar, throughout the period2010 to 2025. Nigeria significantly increases production over the same period to reach asimilar level to Qatar by 2025. It can be seen that liquefaction capacity increases by 57%from 2010 to 2020.
Figure 6 also highlights that global regasification capacity is significantly higher thanglobal liquefaction capacity. This is discussed in more detail in Section 2.5.3.
Figure 6 – Global LNG liquefaction and regasification capacity
0
200
400
600
800
1,000
1,200
2010 2015 2020 2025
bcm
YemenVenezuelaUSATrinTobagoRussiaQatarPeruOmanNorwayNigeriaMalaysiaLibyaIranIndonesiaArcticEquGuineaEgyptBruneiAustraliaAngolaAlgeriaAbuDhabiRegas capacity
Demand for LNG can only be considered as part of the wider global gas industry, andLNG liquefaction capacity can only really be considered in this global context againstother global supplies, which we show in Figure 7. This shows that under both theAverage demand and the Severe weather demand across GB and North-West Europeand colder than average demand in the US scenarios, as described in Section 2.6, thereis a growing and then slight shrinking of global supply margins, which means there issufficient LNG supplies across this period to those markets seeking supplies.

GB GAS SECURITY OF SUPPLY AND OPTIONS FOR IMPROVEMENT
March 2010114_GBGasSecurityOfSupply_200910_v4_0.doc
24
PÖYRY ENERGY CONSULTING
We expect that the following LNG re-gasification terminals will be commissioned inEurope: Rovigo (also known as Adriatic LNG; Italy) and Aliaga13 (Turkey) come online in2009; Sagunto and Sines have additional capacity by 2011; various generic Italianregasification capacity come online by 2012, along with Lion Gas, Le Verdon, Gate,Dunkirk, Eemshaven. Shannon is due to come online in by 2017, reflecting the continuinguncertainty over its construction.
Figure 7 – Global supply and demand
0
200
400
600
800
1,000
1,200
1,400
1,600
1,800
2010 2015 2020 2025
bcm
/yr
Average Central Demand Severe Central Demand Supply
2.5.3 LNG value chain
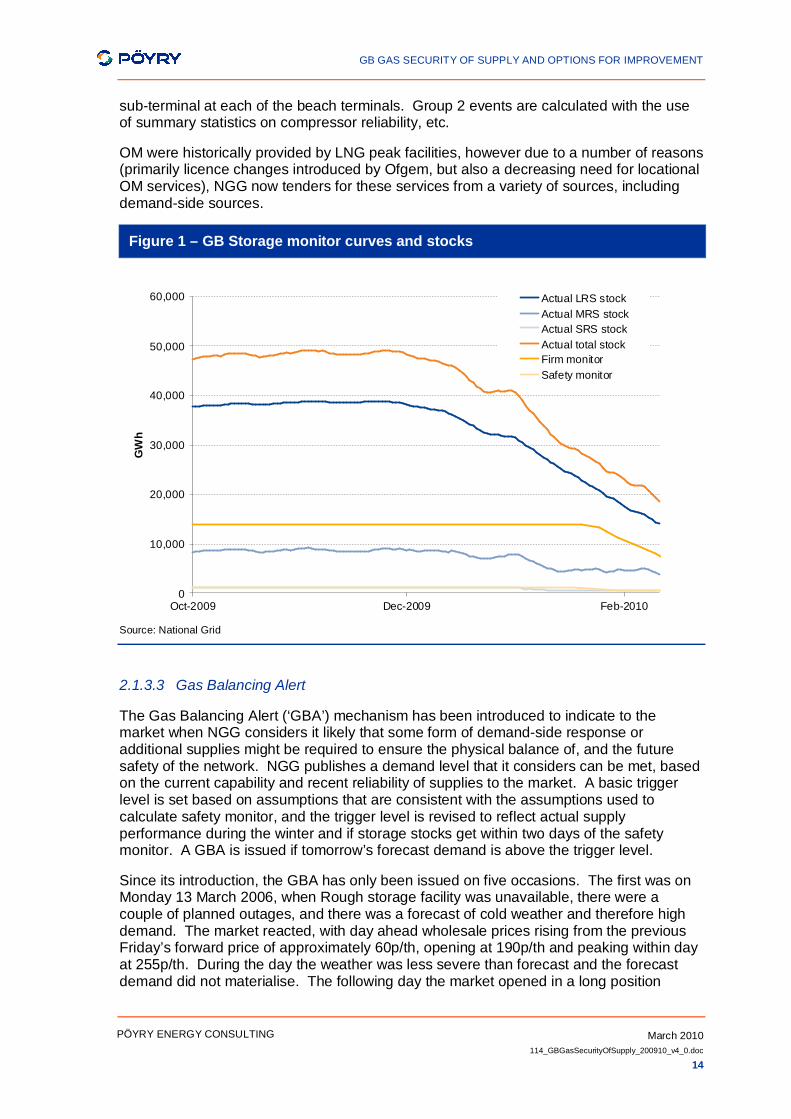
It is also important to understand how the market sees regasification as part of the LNGvalue chain. As can be seen in Table 7, it typically represents about 10% of the totalcapital expenditure and as seen in Figure 6 there is a significant excess of regasificationcompared to liquefaction.
This is vital to the LNG industry as it provides it with the ability to supply differentgeographical markets based on price variations and seasonal demand patterns whilstallowing production to continue throughout the year at steady levels. So, regasificationfacilities are considered for their option value and more are built than strictly needed tojust cover the liquefaction output.
13 Whilst Aliaga was officially completed in 2003, it has yet to be put into operation due to it notbeing connected to the Turkish national grid and the operator, Egegaz, is also awaiting theprovision of an operating licence from the Turkish government.
GB GAS SECURITY OF SUPPLY AND OPTIONS FOR IMPROVEMENT
March 2010114_GBGasSecurityOfSupply_200910_v4_0.doc
25
PÖYRY ENERGY CONSULTING
Table 7 – Typical LNG value chain
Capex $/mtpa
Production 150 – 500
Liquefaction 200 – 275
Shipping 150 – 200
Regasification 75
Note: Illustrative numbers, which do not represent a realchain/contract
2.5.4 LNG source diversity
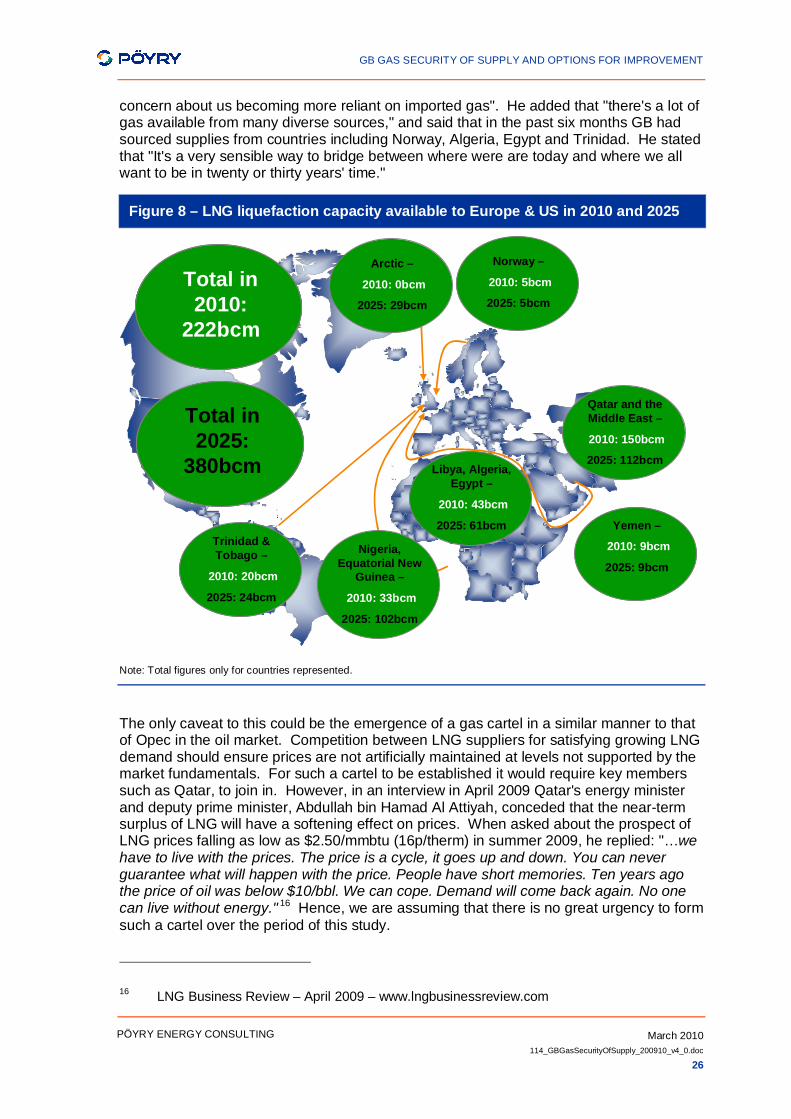
Potential LNG supplies to GB are both geopolitically and commercially diverse as shownoverleaf in Figure 8, with GB being ideally located to sources such as Nigeria, the MiddleEast, Trinidad and Tobago and now Norway. Supplies to Asia have been excluded fromthe total supplies available in Figure 8 as they would not normally be available toEuropean buyers due to the extra shipping costs and the potential knock-on to steady-state liquefaction train production.
Traditionally, LNG has been traded via fixed long-term contracts, but there have beenrecent changes to this behaviour, as noted above, and across all LNG supplies, with asignificant expansion in spot cargo trades. In a discussion paper presented at the MadridXV follow-up forum held in Bilbao on 12th and 13th March 2009, DG TREN stated:
“Traditionally, LNG-production was sold in long-term contracts, but as more LNG comeson stream, projects optimise their output, and demand for LNG increases, there is atendency to sell some LNG in contracts of intermediate or short-term duration. It isestimated that 13% of global gas supply is 'flexible' and that by the end of 2009 this sharecan grow to 21%. Of the new supplies becoming operational worldwide in 2008-2009,nearly 40% can be considered as 'flexible', more than half of which is situated in theMiddle East and with easy access to all LNG markets.
As LNG markets develop, short-term trading is also developing. In 2007 it accounted for20% of global LNG sales compared to 16% in 2006. As these percentages do not showthe arbitrage opportunities taken by integrated companies that can divert flows within theiroverall portfolio, these numbers are likely to underestimate the flexibility of LNG-trading.Moreover, there is a tendency for LNG producers to contract less of the output in fixedlong-term contracts in order to profit from market opportunities.”14
So the expansion of available LNG supplies taken together with the growth of Russian gassupplies, see Figure 5, into Europe provides a healthy picture of competition betweenexpanding supply sources.
This is supported by comments from Tony Haywood, Chief Executive of BP, in aninterview in February 2010 with the BBC15 in which he says there is “unreasonableparanoia about gas supplies to the UK” and it was "curious as to why there is so much
14 ‘LNG Discussion Paper by DG-TREN’, published at http://www.gie.eu.com/workshop/15 http://news.bbc.co.uk/today/hi/today/newsid_8497000/8497578.stm
GB GAS SECURITY OF SUPPLY AND OPTIONS FOR IMPROVEMENT
March 2010114_GBGasSecurityOfSupply_200910_v4_0.doc
26
PÖYRY ENERGY CONSULTING
concern about us becoming more reliant on imported gas". He added that "there's a lot ofgas available from many diverse sources," and said that in the past six months GB hadsourced supplies from countries including Norway, Algeria, Egypt and Trinidad. He statedthat "It's a very sensible way to bridge between where were are today and where we allwant to be in twenty or thirty years' time."
Figure 8 – LNG liquefaction capacity available to Europe & US in 2010 and 2025
Norway –
2010: 5bcm
2025: 5bcm
Total in2010:
222bcm
Total in2010:
222bcm
Total in2025:
380bcm
Total in2025:
380bcm
Arctic –
2010: 0bcm
2025: 29bcm
Qatar and theMiddle East –
2010: 150bcm
2025: 112bcm
Yemen –
2010: 9bcm
2025: 9bcm
Libya, Algeria,Egypt –
2010: 43bcm
2025: 61bcm
Nigeria,Equatorial New
Guinea –
2010: 33bcm
2025: 102bcm
Trinidad &Tobago –
2010: 20bcm
2025: 24bcm
Note: Total figures only for countries represented.
The only caveat to this could be the emergence of a gas cartel in a similar manner to thatof Opec in the oil market. Competition between LNG suppliers for satisfying growing LNGdemand should ensure prices are not artificially maintained at levels not supported by themarket fundamentals. For such a cartel to be established it would require key memberssuch as Qatar, to join in. However, in an interview in April 2009 Qatar's energy ministerand deputy prime minister, Abdullah bin Hamad Al Attiyah, conceded that the near-termsurplus of LNG will have a softening effect on prices. When asked about the prospect ofLNG prices falling as low as $2.50/mmbtu (16p/therm) in summer 2009, he replied: "…wehave to live with the prices. The price is a cycle, it goes up and down. You can neverguarantee what will happen with the price. People have short memories. Ten years agothe price of oil was below $10/bbl. We can cope. Demand will come back again. No onecan live without energy." 16 Hence, we are assuming that there is no great urgency to formsuch a cartel over the period of this study.
16 LNG Business Review – April 2009 – www.lngbusinessreview.com

GB GAS SECURITY OF SUPPLY AND OPTIONS FOR IMPROVEMENT
March 2010114_GBGasSecurityOfSupply_200910_v4_0.doc
27
PÖYRY ENERGY CONSULTING
2.5.5 LNG price signals
Figure 9 below shows the recent evolution of global LNG prices. The big rise in Japaneseprices started in 2007 following an earthquake that was outside its design tolerance at theKashiwazaki-Kariwa nuclear power station. This meant that the whole 8GW of capacitywas shutdown and significant additional supplies of LNG (approximately 5% to 10% ofCCGT usage) were needed at CCGTs to supplement this missing generation.
As the majority of Japanese LNG imports are priced on the Japanese customs-clearedcrude oil price basket (also known as Japan Crude Cocktail or ‘JCC’), it provides anobvious marker for pricing spot LNG trades. If demand for LNG outweighs the JCC basedsupplies, the JCC prices are generally a much more attractive price signal than Europeanor US oil-indexed prices and any opportunity to divert cargoes from west to east will beexploited.
As the recession took hold, Japanese demand fell allowing increased flows of LNG towestern markets. Kashiwazaki-Kariwa returned to operation in late May 2009 whichfurther depressed Japanese demand for LNG. We expect that spare or spot LNG will flowto the markets that value it the most, and that LNG should be considered as a reliablesource of supply if the price signals are right, as it has been for Japan during 2007 and2008.
Figure 9 – International gas prices
0.00
5.00
10.00
15.00
20.00
25.00
30.00
Feb
200
7
May
200
7
Jul
200
7
Oct
200
7
Jan
200
8
Apr
200
8
Jul
200
8
Oct
200
8
Jan
200
9
Apr
200
9
Jul
200
9
Oct
200
9
Jan
201
0
Apr
201
0
$/m
mBt
u
US (Henry Hub) Germany (EOn) UK (NBP) Japan
Recession hitsJapanese prices
more than Europe orUS
Kashiwazaki-Kariwa outagedue to earthquake, adds
approx. 10% to Japanese
Kashiwazaki-Kariwa back on-line
Source: Pöyry analysis of Platts data
2.5.6 LNG supplies to GB 2009
Whether sufficient levels of LNG supplies materialise in the GB market still remains to beproven in the long-term. However, we have the experience of 2009 to see the impact ofthe recent capacity increases at Milford Haven and Isle of Grain phase 2 and how this haschanged the attractiveness of GB to LNG suppliers. We believe this is consistent with the

GB GAS SECURITY OF SUPPLY AND OPTIONS FOR IMPROVEMENT
March 2010114_GBGasSecurityOfSupply_200910_v4_0.doc
28
PÖYRY ENERGY CONSULTING
rapidly growing body of evidence that suggests that LNG will flow when the price signalsare right.
As can be seen in Figure 1017 below GB has seen a significant increase in LNG flows.This reflects the recent increase in global LNG liquefaction, lower LNG demand levels inAsia, steady flows from Qatar to South Hook and very cold period in January/February2009 and December 2009.
Figure 10 – LNG flows into GB 2009
0
20
40
60
80
100
120
140
160
01/0
1/20
09
01/0
2/20
09
04/0
3/20
09
04/0
4/20
09
05/0
5/20
09
05/0
6/20
09
06/0
7/20
09
06/0
8/20
09
06/0
9/20
09
07/1
0/20
09
07/1
1/20
09
08/1
2/20
09
LNG
term
inal
flow
s (m
cm/d
ay)
Dragon
South Hook
Isle of Grain
Source: National Grid
It is worth noting some specific activities relating to the expansion in the flows shown inFigure 10:
On 6 April 200918 the Isle of Grain LNG terminal had taken delivery of its 100th cargo.
On 10 April 2009, Isle of Grain LNG took first delivery of Norwegian LNG, which hadbeen purchased by Centrica through its import rights at the facility.
South Hook received its first commissioning cargo on 20 March 2009, withsubsequent cargoes at the end of April and early May. Since then a fairly consistentflow had been delivered reflecting the linkage with the Qatar liquefaction plant.
Dragon, the other Milford Haven regasification terminal, received its firstcommissioning cargo on 14 July 2009.
17 excludes the Teesport cargo in April 2009.18 www.nationalgrid.com/NR/exeres/4E880BCE-1D60-4C6C-821F-34E3AB1D4445.htm
GB GAS SECURITY OF SUPPLY AND OPTIONS FOR IMPROVEMENT
March 2010114_GBGasSecurityOfSupply_200910_v4_0.doc
29
PÖYRY ENERGY CONSULTING
2.6 Annual and peak demand
This section outlines our demand assumptions for GB, all-island of Ireland and the otherkey markets contained in our Pegasus model, both in terms of overall annual demand butalso daily demand. For the deterministic modelling in Section 4.1 we have developedthree demand scenarios based on a combination of Pöyry’s own views of future demandand DECC’s forecasts, which we have called ‘Average’, ‘Severe’ and ‘Central’. Theprobabilistic approach in Section 4.3 takes the Average and Severe annual demandforecasts and applies these as 50th and 98th percentiles of the Gumbel-Jenkinsondistribution to generate a range of demand figures, as described in Section A.2.1.
2.6.1 GB gas demand forecasts to 2025
We have used three demand scenarios for Great Britain. It should be noted that exportsthrough interconnectors to the all-island of Ireland and the Continent are derived from themodel and are based on the economics of supplying the markets and gas flows in themost efficient way to satisfy demands.
2.6.1.1 Average
The Average case annual demand is based on a combination of Pöyry’s Central demandprojection taking into account the expected impact of the current recession and switch toCCGTs as coal and nuclear power stations are decommissioned and DECC’s forecastsfor achieving the 2020 renewables, energy efficiency and carbon targets, which isconsistent with the Government’s policies.
Supporting this is the expected benefits that will arise from the on-going expenditure fromthe Carbon Emissions Reduction Target (‘CERT’) programme. The purpose of CERT is tohelp electricity and gas consumers in the GB household sector to reduce the carbonimpact of their home through promoting measures which improve the energy efficiency ofthe fabric of the property, use energy more efficiently, reduce energy consumption andassist in using energy from micro-generation sources. In its 21 December 200919
consultation and impact assessment DECC reports that the current and proposedenhancements will mean an average domestic customer will be contributing £52 perannum, representing c.4.5% of their total bill.
The reduction in demand caused by the economic slowdown has been reported for boththe winter 2008/09 and for summer of 2009. In its 2009 summer outlook20, NGG predictedthat the impact of the recession is anticipated to reduce NDM demand by 6%, in line withtheir winter experience. Previous experience in other markets, such as the US andJapan, indicates that not all of this demand will return and so there is some permanentdemand destruction from the economic slowdown.
2.6.1.2 Severe
The Severe scenario takes the Average scenario annual demand and inflates it byapproximately 13% to replicate the effects of the increased consumption in a severewinter. It also seeks to replicate the curvature of the 1 in 50 load duration curve publishedfrom time to time by NGG, which has the effect of increasing the ‘spikiness’ of demand.
19 http://www.decc.gov.uk/en/content/cms/consultations/cert_ext/cert_ext.aspx20 www.nationalgrid.com/NR/rdonlyres/491E346E-49F4-40A1-98D0-
7D0C0075E75B/33228/Summer_Outlook_Report_Final1.pdf

GB GAS SECURITY OF SUPPLY AND OPTIONS FOR IMPROVEMENT
March 2010114_GBGasSecurityOfSupply_200910_v4_0.doc
30
PÖYRY ENERGY CONSULTING
2.6.1.3 Central
We have also included a scenario whereby the 2020 targets encourage more renewablesand energy efficiency but the targets are not met until 2030 and there is a higher gasdemand accordingly. For this ‘Central’ case we use Pöyry’s Central Case demandprojections from its ILEX Energy report on the GB gas market. Further details on theassumptions can be found in Annex B.
2.6.1.4 Summary of GB gas demand forecasts to 2025
The annual GB only demands used in the modelling are outlined in Table 8 below. TheAverage case is 2.5 mcm higher in 2010 than that shown in the NGG 2009 TYS but islower than the 87mcm in 2015, although this higher demand level is covered by thedemand assumptions in the Central case. The Average case is in line with DECC’sexpectation of what is required in order to deliver the 2020 renewable targets.
Table 8 – GB only annual demand cases
Annual demand, bcm Average Central Severe
2010 86.0 90.5 97.2
2015 80.2 88.2 90.6
2020 79.0 86.9 89.3
2025 77.3 84.9 87.3
2.6.2 Republic of Ireland and Northern Ireland gas demand
We use Pöyry’s Central Case demand projections for all three scenarios in this all-islandof Ireland (including both the Republic and Northern Ireland markets which are due to becombined in a single market in the next few years). This assumes that the market makesprogress towards the 2020 targets but does not fully meet them and is based on seasonalnormal demand. Table 9 shows the projection for the all-island of Ireland gas demand.We assume Corrib production starts in 2011, Shannon LNG from 2017 and new saltcavern storage in Northern Ireland from 2016. The balance of gas demand will continueto be met from the Moffat interconnector.
Table 9 – All-island of Ireland gas demand (mcm)
Power gen.(ex CHP)
CHP Industrial Commercial Residential Other Total
2010 4,298 0 933 545 981 334 7,0912015 4,090 0 987 576 1,038 354 7,0452020 4,228 0 1,038 606 1,092 372 7,3362025 4,495 0 1,115 651 1,172 400 7,832
2.6.3 North-West Europe gas demand
The integrated nature of the Pegasus model and the linkages between GB and continentalEurope mean that we also need to estimate the growth rates for the large demand

GB GAS SECURITY OF SUPPLY AND OPTIONS FOR IMPROVEMENT
March 2010114_GBGasSecurityOfSupply_200910_v4_0.doc
31
PÖYRY ENERGY CONSULTING
countries in North-West Europe and these are shown in Table 10. These are aggregatefigures, and are inclusive of power generation demand and consideration of renewables,etc. We assume that the effects of the current recession will continue into 2010 before areturn to economic growth.
Table 10 – Pöyry Central case demand growth rates (compound annual)
Period Belguim &Luxembourg Germany Island of
Ireland Netherlands France Denmark
2009-2015 0.47% -1.20% -0.26% -2.50% 0.25% 0.96%2015-2020 3.80% 1.40% 1.10% 0.58% 0.42% 1.60%2020-2025 8.20% 0.95% 0.31% 2.50% 1.00% 0.75%
For the Severe scenario, gas markets in Germany, Belgium, Netherlands andLuxembourg are based on annual demands inflated by 11%, replicating the effects of asevere winter in these countries at the same time as one in GB.
2.6.4 Demand in United States of America
Again the integrated nature of Pegasus means that LNG can flow to markets in Europe,Asia and North America. The size of the United States market means that the extent towhich LNG is required to meet its annual demand will have an interface with LNG supplyto Europe and GB. We have used the 2008 EIA (Energy Information Administration)reference case as the source of US demand forecasts, as shown in Figure 11. In this, USdemand varies between 635 and 665bcm/yr over the period. We have taken this centralprojection for all three of our scenarios. The 2009 EIA report indicates up to 9% lowerdemand from 2010 to 2020, but 3% higher demand in 2025. This means the numbersused in the modelling is more akin to colder than seasonal weather at the same time assevere weather in GB and North-West Europe.

GB GAS SECURITY OF SUPPLY AND OPTIONS FOR IMPROVEMENT
March 2010114_GBGasSecurityOfSupply_200910_v4_0.doc
32
PÖYRY ENERGY CONSULTING
Figure 11 – US annual demand
590
600
610
620
630
640
650
660
670
2005 2010 2015 2020 2025
bcm
/yea
r
Source: Energy Information Administration
2.6.5 Daily demand profiles
The annual demands for GB are modelled at a daily resolution by scaling to the actualpattern of consumption experienced in 2006/07 and are shown in Figure 12. In theSevere case this means a peak daily demand of 508 mcm/d in 2010 including Irishexports, of which 486mcm/d is GB demand only. As a comparison, this is 5% higher thanthe highest recorded daily NTS throughput recorded by NGG of 465mcm/d on 8 January2010.
Daily demand in gas markets in other parts of the world are applied at a daily resolutionusing unmodified Fourier series analysis. Demand patterns for both the Average andSevere demands for the US, Germany & Benelux and GB & all-island of Ireland areshown in Figure 13 below, which highlights their relative sizes.

GB GAS SECURITY OF SUPPLY AND OPTIONS FOR IMPROVEMENT
March 2010114_GBGasSecurityOfSupply_200910_v4_0.doc
33
PÖYRY ENERGY CONSULTING
Figure 12 – GB daily demand profile
0
100
200
300
400
500
600O
ct-2
010
Oct
-201
5
Oct
-202
0
Oct
-202
5
Dem
and
(mcm
d)
Average GB (+ exports to Ireland)
Central GB (+ exports to Ireland)
Severe GB (+ exports to Ireland)
Figure 13 – Selected other demand patterns
0
200
400
600
800
1000
1200
1400
1600
1800
2000
2200
2400
2600
2800
3000
3200
Oct
-201
0
Oct
-201
5
Oct
-202
0
Oct
-202
5
Dem
and
(mcm
d)
Average Germany + Benelux
Severe Germany + Benelux
Average (& Severe) US
Severe GB (+ exports to Ireland)

GB GAS SECURITY OF SUPPLY AND OPTIONS FOR IMPROVEMENT
March 2010114_GBGasSecurityOfSupply_200910_v4_0.doc
34
PÖYRY ENERGY CONSULTING
Peak days
The resultant peak day demands are shown below in Table 11.
Table 11 – Peak day demand in selected markets (mcm/d)
2010 2015 2020 2025
GB – Average 353 328 324 317
GB – Severe 486 452 446 437
GB – Central 371 361 357 349
Irish exports – Average, Central & Severe 22 22 24 25
Germany & Benelux – Average & Central 656 614 646 703
Germany & Benelux – Severe 722 675 711 773
US – Average, Central & Severe 2490 2524 2500 2463
2.7 Demand Side Response
In addition to gas storage and a diverse source of supplies, security of supply to firmconsumers can also be provided by a demand side response. This can be categorised into the following groupings:
Power generation – where some gas fired power stations can switch to distillate inorder to keep generating. Further details are discussed in Section 2.8 below.
Industrial and commercial (I&C) interruptible load – where gas consumers acceptcessation of the gas supply from time to time, and keep alternative means ofmaintaining the majority of their economic output (e.g. alternative/backup fuels) orlimit production and utilise stock management, albeit at a marginally reduced level.Further details are discussed in Section 2.9 below.
Unserved energy, where commercial and/or domestic gas consumers involuntarilycease consuming gas in order to match supply to demand, thereby significantlyimpacting the value created in the wider economy. Further details are discussed inSection 2.10 below.
It should be recognised that there is more than one type of demand side response‘backup’ product available to the market; there are at least three types:
a) Transportation insurance – this is the traditional product whereby the site investsin backup capability as insurance against lack of transportation capacity, havinggenerally chosen interruptible transportation.
b) Demand side response – this is where the site has chosen to install backupcapability, even though it has firm transportation, for the upside of when spot gasprices are higher that the backup fuel price and there is still a positive fuel/electricityspread. This is generally limited to large NTS connected power stations.
c) Demand side insurance – in the event of a major disruption to the gas supplyinfrastructure sites that can switch to backup capability or cease consumption andso aid the provision of firm gas supply to NTS and DN loads (particularly domesticcustomers).

GB GAS SECURITY OF SUPPLY AND OPTIONS FOR IMPROVEMENT
March 2010114_GBGasSecurityOfSupply_200910_v4_0.doc
35
PÖYRY ENERGY CONSULTING
Traditionally (c) has been a ‘free’ by-product of (a) and/or (b). The NTS and DNinterruption contracts allowed the supply and demand to match by in effect providing anadditional gas source when the sites ceased using gas. For the cost of the transportationdiscount both the gas and electricity security of supply benefit by reducing the likelihood ofunserved energy occurring, although there is a cross-subsidy occurring from firm tointerruptible consumers in terms of normal operations.
For the purposes of the modelling, and using the analysis in Sections 2.8, 2.9 and 2.10below, we have calculated the levels of all demand side response available forsupply/demand matching and tranches of firm customers, as represented in Table 12: Forthe avoidance of doubt any required use of CCGT distillate backup or I&C interruption fortransportation constraints is not modelled in our analysis.
Table 12 – Demand side response categories & assumptions
Name Cost(£/th)
mcm/d mcm/mth bcm/yr Notes
CCGTDistillate 0.90 24 114 0.57 Restocking constrains
monthly and annual volume
I&Cinterruptibles 2.00 10 310 3.72
UnservedEnergyTranche 1
12.00 5 155 1.86
UnservedEnergyTranche 2
23.00 15 465 5.58
Monthly/annual volumeswould be further constrained
by load factors
UnservedEnergyTranche 3
51.28 1000 31000 372 Nominal costs/volumes formodelling purposes
2.8 Distillate backup at power generation
2.8.1 Current distillate backup capacity at power stations
Table 13 below shows the gas-fired power generation stations that have distillate backupand typical levels of on-site storage. The total capacity of distillate backup at CCGTs is39mcm/d. Table 14 shows the remaining CCGTs which do not have distillate backup.

GB GAS SECURITY OF SUPPLY AND OPTIONS FOR IMPROVEMENT
March 2010114_GBGasSecurityOfSupply_200910_v4_0.doc
36
PÖYRY ENERGY CONSULTING
Table 13 – Existing CCGT distillate backup in GB
Name Efficency Capacity (MW) Commission Gas use(mcm/day) Gas connection Oil back-up
Days oilstorage
capacity Barking 0.46 1,000.00 1994 4.88 NTS Yes 10.0 Brigg 0.45 257.00 1993 1.28 NTS Yes 6.0 Corby 0.45 401.00 1993 2.00 NTS Yes 10.0 Cottam 0.50 395.00 2000 1.76 NTS Yes N/A Derwent 0.46 228.00 1994 1.11 DNO Yes 7.0 Fawley 138.00 DNO Yes 2.0
Immingham 0.48 734.00 2004 3.40 NTS/Theddlethorpe Yes 14.0
Keadby 1 0.46 735.00 1994 3.59 NTS Yes 3.5 Little Barford 0.46 665.00 1994 3.25 NTS Yes 4.0 Medway 0.46 690.00 1995 3.37 NTS Yes 8.5 Peterborough 0.45 380.00 1993 1.90 NTS Yes 10.0 Roosecote 0.45 229.00 1991 1.14 NTS Yes 14.5 Sellafield 0.42 168.00 1993 0.89 NTS Yes 14.0 Shotton Paper 0.45 207.00 2001 1.02 NTS Yes 5.0 Teesside 0.45 1,876.00 1992 9.37 NTS/Teesside Yes 3.0
Subtotal: 38.96 Average: 7.96
Table 14 – CCGTs without distillate backup in GB
Name Efficency Capacity (MW) Commission Gas use(mcm/day) Gas connection Oil back-up
Days oilstorage
capacity Grangemouth 0.40 120.00 1999 0.67 NTS No - Baglan Bay 0.53 552.00 2002 2.31 NTS No - Barry 0.50 245.00 1998 1.10 DNO No - Brimsdown/Enfield 0.50 390.00 1999 1.73 NTS No - Connahs Quay 0.46 1,380.00 1996 6.74 NTS/Pt of Ayr No - Coryton 0.50 743.00 2000 3.30 NTS No - Damhead Creek 0.50 805.00 2000 3.58 NTS No - Deeside 0.46 495.00 1994 2.42 NTS No - Didcot B 0.50 1,462.00 1996/2007 6.56 NTS No - Great Yarmouth 0.50 420.00 2000 1.89 NTS No - Humber 1 0.46 769.00 1996 3.75 NTS No - Humber 2 0.49 516.00 1998 2.34 NTS No -
Killingholme (Centrica) 0.45 665.00 1993 3.32 NTS/Theddlethorpe No -
Killingholme (EOn) 0.45 900.00 2003 4.44 NTS/Theddlethorpe No -
Kings Lynn A 0.46 340.00 1996 1.66 NTS No - Peterhead 2 0.48 790.00 2000 3.66 NTS No - Rocksavage 0.49 754.00 1997 3.42 NTS No - Rye House 0.45 715.00 1993 3.57 NTS No - Saltend 0.50 1,215.00 1999 5.40 NTS No - Seabank 0.50 1,222.00 1998 5.43 NTS No - Shoreham 0.51 400.00 2001 1.74 DNO No - Spalding 0.51 880.00 2005 3.81 NTS No - Sutton Bridge 0.50 800.00 1998 3.59 NTS No -
Subtotal: 76.43
2.8.2 Future distillate backup at power stations
Table 15 below shows that of the nine committed CCGTs in GB only two are proposingdistillate backup, of which one is an extension to an existing CCGT situated next to an oilrefinery and the other also provides local electricity black-start services.

GB GAS SECURITY OF SUPPLY AND OPTIONS FOR IMPROVEMENT
March 2010114_GBGasSecurityOfSupply_200910_v4_0.doc
37
PÖYRY ENERGY CONSULTING
Table 15 – Proposed CCGT distillate backup in GB
Name Efficency Capacity (MW) Commission Gas use(mcm/day) Gas connection Oil back-up
Days OilStorage
Capacity
Immingham CHP 2 0.49 450.00 2011 2.04 NTS/Theddlethorpe Yes Notavailable
Langage 0.51 885.00 2009 3.86 NTS Yes Notavailable
Carrington 0.52 860.00 2013 3.65 NTS No - Marchwood 0.51 842.00 2010 3.64 NTS No - Pembroke 0.52 2,000.00 2015 8.55 NTS No - Severn Power (DONG) 0.52 800.00 2011 3.44 NTS No - Staythorpe 0.51 1,600.00 2011 6.92 NTS No - West Burton CCGT 0.52 1,200.00 2011 5.16 NTS No - Grain 0.49 1,275.00 2010 5.78 NTS N/A -
Subtotal: 112.20
2.8.3 NTS interruptible transportation changes
Modification (Mod) 0195AV to the Uniform Network Code (UNC), will introduce a newtransportation regime for exit capacity from the NTS from October 2012. This introduces anew ‘off peak’ transportation product, largely designed to replace the current interruptibleproduct. However, the new product has to be bid for in an auction process on a dailybasis, at the day ahead stage, and NGG has some discretion on the levels made availableto the market on a daily basis. There are a number of issues about the new process:
The mechanics of applying for the 'firm' product are clearly laid out in Mod 0195AV,but the mechanism for applying for the 'off peak' product still has to be defined;
Pricing mechanisms are still subject to consultation, but propose that the dailyinterruptible capacity auctions will have a reserve price set to zero.
Both firm and interruptible sites will have to pay for the SO and TO exit commoditycharges, where as currently NTS interruptible sites don’t have to pay the latter.
Will NGG offer contracts to buy-back firm capacity?
Capacity remains on a nodal basis, although there has been speculation that it maychange to a zonal basis at some time in the future.
The process for obtaining the new ‘off peak’ product is currently considered to be morerisky, complex and time intensive than the present interruptible product (which hasguaranteed availability and pricing discount). It could be expected that NTS sites thathave interruptible transportation at present and who have the option of converting underMod 195AV to convert to firm transportation in the new regime will do so, with theconsequence that they will decommission their backup capability, and once it has beenremoved it will prove very hard to reinstate.
Also many older CCGTs that have distillate backup may be decommissioned over thenext 15 years as they become less competitive and need to upgrade due to environmentallegislation.
Table 13 and Table 15 indicate that there is potentially over 40mcm/d of demand from gasfired generation that could potentially be switched to oil. However, for the reasonsmentioned above, including decommissioning, we have taken a more conservativeposition, with 24 mcm/d of distillate power generation being available from 2010 onwards.

GB GAS SECURITY OF SUPPLY AND OPTIONS FOR IMPROVEMENT
March 2010114_GBGasSecurityOfSupply_200910_v4_0.doc
38
PÖYRY ENERGY CONSULTING
2.8.4 Distillate cost
These will cover tanks, bunds, delivery facilities and fire protection, estimates of whichhave been provided in Section 3.3.1.1. This gives a cost of £313/tonne, equivalent toaround 74p/th. We then factor in the reduced efficiency, shut-down time to switchbetween fuels and increased maintenance costs of running on distillate, which means thatthere would only be worth switching when the gas price is in excess of about 90p/th.
2.9 Industrial & commercial interruptible load
In addition to the CCGT distillate backup potential discussed in Section 2.8 the othersource of interruptible load is predominantly from industrial and commercial sites.
2.9.1 DN connected I&C interruptible sites
The largest sites connected to the Distribution Networks (DNs) include a few CCGTstations (Derwent, Barry and Fawley Cogen, as indicated in Table 13). However, the bulkof these are industrial and commercial sites, which have been interruptible for manyyears. The majority of this load is used for steam raising for process and heatingpurposes in large boiler plant, and this plant is most amenable to dual fuel firing. Thesesites have traditionally almost always had backup capability with distillate for their boilerplant, and hence the value of lost load (VOLL) is the cost of this fuel.
It is important to note that where gas is used directly in process applications, such asfurnaces, metal smelting, heat treatment, ceramics firing, etc, there are practical andtechnical difficulties to convert to duel fuel. This means that for a process load site, VOLLis always the cost of loss of production and is in general very high in comparison tohistorical gas prices; there are very few sites where interruption would be economicallyviable.
There has been much debate in the industry about the development of additional demandside response products to encourage smaller DN connected sites to provide such aservice, but success has been very limited. The reasons for this include:
for medium and smaller sites, the perceived value of the fuel switching upside hassimply not been great enough to encourage DN sites to take part; and
sites cannot contract to provide this product directly either to NGG or the DN Operator(DNO), but must do it through their suppliers. This makes the process much morecumbersome, particularly in a competitive environment where the site might changeits supplier every year.
2.9.2 Current I&C interruptible capacity position
There are currently about 1200 customers on the DNs with interruptible transportation. Ithas been difficult to find out exactly what interruptible capacity this amounts to since thisdoes not seem to appear in any of the Mod 90 consultations, nor in the TYS, nor in theDNO Long Term Development Statements. However, the 2008 TYS does state that therewere 86 TWh of gas used by interruptible consumers in 2007 (out of a total of 623 TWh).We have assumed that the interruptible sites continue to operate at their historical loadfactor of about 60%, which gives a maximum daily interruptible gas capacity of about390GWh/d (about 36mcm/d).

GB GAS SECURITY OF SUPPLY AND OPTIONS FOR IMPROVEMENT
March 2010114_GBGasSecurityOfSupply_200910_v4_0.doc
39
PÖYRY ENERGY CONSULTING
2.9.3 I&C interruptible transportation changes
However, the commercial regime for these DN connected sites has recently changed withthe introduction of UNC modification (Mod) 90. This removes the interruptible status of allsites from October 2011, and hence their rights to discounted transportation charges (I&Cinterruptible sites previously did not pay either NTS or LDZ Exit Capacity charges). Mod90 introduces a new ‘universal firm’ regime on the DNs, but does provide for a mechanismwhereby the DNOs could specify their interruption requirements in each zone of their DNareas, and then provides for an annual auction mechanism whereby the sites could bid intheir interruption capability in annual blocks from October 2011 onwards.
So whilst the transportation interruption status and physical constraints are being removedthe contribution I&C interruptible sites make to demand side insurance mentioned inSection 2.7 is not being replaced. This reduction in available demand side response frominterruptible consumers will have an impact on security of supply and may make it morelikely that emergency actions will be called into play earlier than otherwise might havebeen the position before these changes, unless new mechanisms are forthcoming toprovide additional peak supply or a demand side insurance incentive.
2.9.4 I&C interruption capacity changes
The result of the 2008 auctions for 2011/12 was a stated DN interruption requirement of252GWh/d (23mcm/d) but with only 13GWh/d (1.2mcm/d) contracted. Of the original1200 sites about 200 participated with only 27 bids accepted.
The 2009 auctions stated a DN interruption requirement of 77.6GWh/d (7.2mcm/d) for2012/13 but with only 7.1GWh/d (0.66mcm/d) contracted. The consequence of this hadbeen a commitment from the DNOs to make new reinforcement investments to removetransportation constraints before the new regime starts in 2011 and all are reporting theyremain on track to deliver these on time.
Many sites that have interruptible transportation at present are considering moving to firmtransportation in the new regime and consequently decommissioning their backupcapability, and once it has been removed it will prove very hard to reinstate.
So, of the current 36mcm/d of I&C interruptible capacity the future requirement for2012/13 has been reduced by 80% and only 2% of current levels has been contracted for.However, not all these sites will decommission their backup facilities as the riskassociated with any firm load shedding from a gas supply emergency may be too highwhen compared to the capital expenditure from any damage to processing plant ordisruption to the company’s product sales. Thus we have assumed that 72% of currentbackup facilities will be decommissioned and that the equivalent of 10mcm/day will byavailable for demand side response.
It will be important that the actual level of interruption available to meet supply anddemand balancing over and above that contracted for transportation needs is kept underreview as shippers and sites negotiate new contracts for October 2011 onwards. It is notclear that I&C interruptible consumers are fully aware of the extra costs they will facewhen being offered ‘firm’ supplies and it is likely that will recover some of this bedecommissioning their current backup capability.

GB GAS SECURITY OF SUPPLY AND OPTIONS FOR IMPROVEMENT
March 2010114_GBGasSecurityOfSupply_200910_v4_0.doc
40
PÖYRY ENERGY CONSULTING
We have used a price of 200p/th, which corresponds approximately to historical highs inthe GB NBP day-ahead price21, as the point where I&C interruptible load would voluntarilyswitch to alternative/backup fuel or undertake other measures to cease burning naturalgas.
2.10 Economic impact of unserved energy
Previous analysis undertaken by Pöyry Energy Consulting22 (an approach that was thenused in subsequent analysis by Oxera23) sought to estimate the economic costs ofunserved energy. We have replicated parts of the analysis, updating the data from thelatest Office of National Statistics (ONS) and Digest of UK Energy Statistics (DUKES)sources as appropriate.
Within this analysis, it is assumed that the loss of Gross Value Added24 (GVA) provides aproxy for the effect of unserved energy – i.e. the economic impact of a loss of load. Thisis the approach previously used by Pöyry and Oxera. The main features of this approachare that:
interruptions are assumed to follow a ranking of industries by GVA/mcm (adjusted sothat energy intensive industries are interrupted first); and
indirect or knock-on effects on upstream and downstream industries are alsoincluded.
Figure 14 overleaf shows the analysis. We have also included an adaptation of theoriginal Pöyry analysis undertaken in 2006 as a comparator in Figure 15, which showssimilar patterns of increasing impact and overall effects broadly reflective of inflation. Thecharts show that even for modest losses of firm load, measured in tens of mcm/d, thereare some significant impacts to the economy, measured in hundreds of £m/day.
The analysis assumes a simple, proportionate relationship between gas use in a sectorand its GVA potential, with similar relationships across the supply chain. In general, theseestimates are likely to represent an upper bound on the GVA impact as they do notaccount for the impact of stocks or flexibility in delivery profile that may mitigate some ofthese effects. The analysis does not account for the consequential reduction of electricitydemand and therefore gas-fired generation. However, the GVA analysis does give anindication of the orders of magnitude involved when there is an involuntary curtailment ofsupplies.
21 On 13 March 2006 the day-ahead price rose to 195p/th.22 ‘Strategic storage and other options to ensure long-term gas security’; ILEX, 2006
http://www.berr.gov.uk/files/file31788.pdf23 ‘An assessment of the potential measures to improve gas security of supply’; Oxera, 2007
http://www.berr.gov.uk/files/file38980.pdf24 ONS definition: GVA (value of goods and services less the value of the products used to
make them) + taxes on products – subsidies on products = Gross Domestic Product. GVA istherefore a measure of the commercial value added to the whole economy.

GB GAS SECURITY OF SUPPLY AND OPTIONS FOR IMPROVEMENT
March 2010114_GBGasSecurityOfSupply_200910_v4_0.doc
41
PÖYRY ENERGY CONSULTING
Figure 14 – Updated GVA impact of demand curtailment
0
100
200
300
400
500
600
700
800
0 5 10 15 20 25 30 35 40
Unserved energy (mcm/d)
Cos
t (£m
/day
)
Direct & indirect costs, ranked by direct cost only
Direct costs, ranked by direct cost only
Direct & indirect costs, ranked by direct & indirect costs
Source: Pöyry Energy Consulting from ONS and DUKES; costs shown are at 2007 prices.
Figure 15 – Original GVA impact of demand curtailment
0
100
200
300
400
500
600
700
0 5 10 15 20 25 30 35 40
Unserved energy (mcm/d)
GVA
(£m
) per
day
Direct costs, ranked by direct cost only
Direct & indirect costs, ranked by direct & indirect costs
Direct & indirect costs, ranked by direct cost only
Source: adapted from Ilex Energy Consulting after ONS, DUKES (2006); costs shown are at 2004 prices.

GB GAS SECURITY OF SUPPLY AND OPTIONS FOR IMPROVEMENT
March 2010114_GBGasSecurityOfSupply_200910_v4_0.doc
42
PÖYRY ENERGY CONSULTING
From the work examining Gross Value Added (GVA) and distillate and interruptiblecapabilities in Sections 2.8 and 2.9, we have generated raw prices that represent the GVAcreated by gas consumption for each sector, as shown in Figure 16. We have convertedGVA figures into a value of lost load (VOLL) for ease of comparison with historical gasprices.
The orange line shows the direct VOLL for each industry, ranked by each industry’sindividual energy intensity – it does not consider the consequential impact on relatedindustries. The dark blue line shows the actual VOLL that might be expected if theindividual energy intensity ranking is followed, and the light blue line shows the VOLL thatmight be expected if aggregate intensity rankings are followed.
Figure 16 also shows the modelling assumptions for the prices at which we would expectto see unserved energy, identified as the green line/area. We have assumed threeseparate tranches – broadly in line with the above VOLL considerations – thoughrecognising the potential for efficiencies to be discovered during any gas supplycurtailment. These unserved energy tranches are included with the CCGT and I&Cinterruptible backup fuel prices the summary Table 12 on page 35.
Figure 16 – Unserved energy analysis and assumptions
0
20
40
60
80
100
120
140
160
180
200
0 5 10 15 20 25 30 35 40
Unserved energy (mcm/d)
VO
LL (£
/th)
Cascaded costs, direct cost rankingUncascaded costs, direct cost rankingCascaded costs & rankingModelling assumptions
>£850/th
Tranche 1 Tranche 2 Tranche 3
Source: Pöyry Energy Consulting after GI, ONS and DUKES
2.11 January 2010 review
Since the study analysis was completed GB has experienced a very cold period duringDecember 2009 and January 2010, with the week beginning 4 January 2010 having 7 outof 16 coldest days in the last 14 years.

GB GAS SECURITY OF SUPPLY AND OPTIONS FOR IMPROVEMENT
March 2010114_GBGasSecurityOfSupply_200910_v4_0.doc
43
PÖYRY ENERGY CONSULTING
Despite the press headlines of major gas shortages, the GB gas market reacted asplanned and without any major volume or price disruption. As shown in Figure 17 therewas sufficient supply to meet demand, although it is worth noting the following points:
GBAs were issued for gas days 4, 7, 9 and 11 January 2010, due to Norwegiansupply disruptions and linked to very high demand, but expired at the end of the dayas more than adequate supplies were forthcoming from alternative supplies.
Record demand of 465mcm/d occurred on 8 January, which is 35% higher thanseasonal norms.
Despite there being no long term fixed destination contracts into GB, LNG providedsignificant volumes over the whole period requiring regular delivery of cargoes. Thiscapability will further expand with the forthcoming completion of South Hook phase 2and Isle of Grain phase III in 2010.
National Grid DNOs (East Anglia, East Midlands and North West) undertook bothlocalised constraint and volume interruption for 7 I&C interruptible consumers on 4January rising to 107 on 7 January and with all supply returned on 10 January25. On7 January 2010 they interrupted 4.15mcm/d which compares with the 0.4mcm/d theyhave contracted for in 2011/12.
80mcm of LNG peak storage was used during January 2010.
Figure 17 – GB gas supply & demand in December 2009 & January 2010
0
100
200
300
400
500
600
30/11
/2009
07/12
/2009
14/12
/2009
21/12
/2009
28/12
/2009
04/01
/2010
11/01
/2010
18/01
/2010
25/01
/2010
mcm
UKCS NorwayBBL NL? GB IUK Bel? GBGrain LNG Hook LNGDragon LNG Depleted FieldSalt Cavern LNG PeakerNTS Actual Demand NTS Seasonal Normal Demand
Source: Pöyry analysis of National Grid data
Market prices, as shown in Figure 18, underline the points raised in Section 2.5 that GB isa sufficiently attractive market for both pipeline and LNG imports. Although there was a
25 National Grid presentation to GCF on 25 January 2010.

GB GAS SECURITY OF SUPPLY AND OPTIONS FOR IMPROVEMENT
March 2010114_GBGasSecurityOfSupply_200910_v4_0.doc
44
PÖYRY ENERGY CONSULTING
very brief price spike in early January, NBP prices remained in line with continental spotmarkets. This also supports the findings in Section 2.3 and 2.4 that Europe currently hasmore than sufficient gas supply and storage.
Figure 18 – Market prices in December 2009 & January 2010
0
10
20
30
40
50
60
70
01/1
2/09
15/1
2/09
29/1
2/09
12/0
1/10
26/0
1/10
p/th
erm
UK OCMZeebruggeTTFUK NBP
Source: Pöyry analysis of Platts data
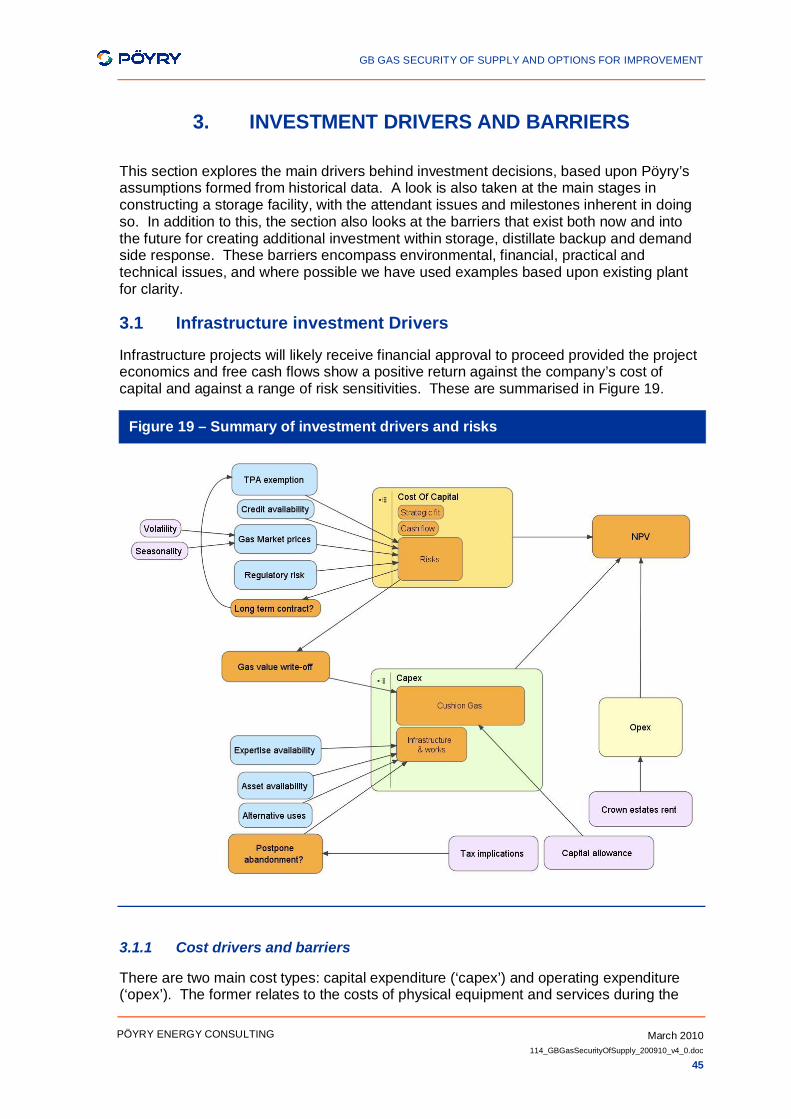
GB GAS SECURITY OF SUPPLY AND OPTIONS FOR IMPROVEMENT
March 2010114_GBGasSecurityOfSupply_200910_v4_0.doc
45
PÖYRY ENERGY CONSULTING
3. INVESTMENT DRIVERS AND BARRIERS
This section explores the main drivers behind investment decisions, based upon Pöyry’sassumptions formed from historical data. A look is also taken at the main stages inconstructing a storage facility, with the attendant issues and milestones inherent in doingso. In addition to this, the section also looks at the barriers that exist both now and intothe future for creating additional investment within storage, distillate backup and demandside response. These barriers encompass environmental, financial, practical andtechnical issues, and where possible we have used examples based upon existing plantfor clarity.
3.1 Infrastructure investment Drivers
Infrastructure projects will likely receive financial approval to proceed provided the projecteconomics and free cash flows show a positive return against the company’s cost ofcapital and against a range of risk sensitivities. These are summarised in Figure 19.
Figure 19 – Summary of investment drivers and risks
3.1.1 Cost drivers and barriers
There are two main cost types: capital expenditure (‘capex’) and operating expenditure(‘opex’). The former relates to the costs of physical equipment and services during the

GB GAS SECURITY OF SUPPLY AND OPTIONS FOR IMPROVEMENT
March 2010114_GBGasSecurityOfSupply_200910_v4_0.doc
46
PÖYRY ENERGY CONSULTING
construction phase and any major plant refurbishments during the lifetime of an asset.The latter relates to the on-going costs of running the facility such as staff, minormaintenance, and consumables, including any gas compression costs.
3.1.1.1 Capex
Key influences for capex will include the planning application process and imposedconstraints, lead time for development, expected asset life, any new technical innovationbeing used, need for cushion gas in gas storage facilities, brine disposal method for saltcavities, complexity of the supply chain, expected abandonment costs, and environmentalimpact assessment and mitigations. The barriers that will influence the level of capex willinclude:
the planning process and the level of uncertainty it introduces for project developers;
supply chain and limited number of key equipment suppliers e.g. there are only fourmain CCGT suppliers around the world and only two offshore wind turbinemanufacturers;
new technology will increasing the risk of construction delays;
the level of capital allowance that can be claimed for different capital items;
tax treatment for future expenditure, such as abandonment provisions; and
environmental restrictions either from regulatory or planning obligations e.g.limitations on brine disposal when leaching salt cavities.
3.1.1.2 Opex
The main drivers here will be the asset life and its availability. This will influence howmuch maintenance will be required and to what extent major capital items will need to bereplaced during the full asset lifecycle. The barriers that will influence the level of opexwill include:
lack of available skilled staff;
gas costs for compressor running;
fees, if required, to the Crown Estates;
environmental restrictions, such as noise levels and emission limits; and
health and safety hazards, such as dangerous and flammable materials.
3.1.2 Revenue drivers and barriers
Revenues for gas facilities will come from the selling price for the gas, either into a spotmarket, traded exchange or through long-term contracts and the asset availability. Forstorage facilities providing swing to gas suppliers with flat supply profiles the revenuedrivers will be the seasonal winter-summer spread and the amount of daily and within-dayvolatility. The more flexible the facility the more it is able to capture revenues from thelatter and the greater the amount of space available the more it can capture the former.
The main barrier will be if the market mechanisms fail to provide the correct or sufficientpricing signals for both the seasonal spread and the volatility. Long-term contractsprovide a hedge against such a situation, which is why they are often required to underpininvestment in major new infrastructure developments. For example the gas contractssigned by Centrica assisted in underpinning the required investment in the Langeled and

GB GAS SECURITY OF SUPPLY AND OPTIONS FOR IMPROVEMENT
March 2010114_GBGasSecurityOfSupply_200910_v4_0.doc
47
PÖYRY ENERGY CONSULTING
BBL import pipelines from Norway and the Netherlands respectively. They are alsonormally required when new gas liquefaction trains are built.
3.1.3 Project hurdle rate
When discounting future cash flows the project will need to pass a hurdle rate which isdetermined initially by the cost of capital for the company. It is then modified to reflect therisks or benefits associated with the project.
Drivers that will improve a project’s position will include whether it is able to obtain anexemption to Third Party Access26 (‘TPA’) or whether the company is investing in a certaingeography or market for strategic reasons. Hurdle rates will also be better if the companyhas the expertise, competence, and experience of developing and operating similarfacilities.
Barriers that will impact a project hurdle rate will include the cost of financing theinvestment, whether that is because of a low credit rating of the company or because of alack of available credit, especially since the recent credit crunch. Another barrier can beon the regulatory regime and its expectations on the cost of capital for such a project. Forexample in some countries storage is treated as being a ‘utility service’ and will have atypical cost of capital c.5-7% where in other more market orientated regulatory regimesstorage may be seen as a commercial venture with higher cost of capital of greater than10-15%.
3.2 Gas storage investment
Gas storage will be developed to provide a service to gas suppliers that cannot readily beprovided by alternative means or where it is the cheapest of various options.
Gas suppliers in Great Britain have to balance their supply with their customers’ demandon a daily basis, and face imbalance charges which provide a financial incentive toachieve this balanced position.
Typically, gas storage has been developed to meet long-range, medium-range and short-range flexibility requirements.
Long-range storage has been developed to provide large scale infrastructure that allowsgas to be stored in the summer for use in the winter. With demand higher in the winter toreflect consumers’ space heating needs the gas supply also needs to be higher in thewinter than the summer. However, many gas supplies can only provide gas on a flat evensupply across the year. Long-range storage allows the suppliers to still meet their dailybalancing obligations without having to pay additional costs for ‘swing’ from the actual gassupply. The difference between winter and summer gas prices is a key driver in settingthe value of long-range storage. Depleted gas fields have typically provided this type ofgas storage.
Medium-range storage is there to provide a more flexible service. It has faster injectionand withdrawal rates than for long-range storage. This helps suppliers handle largedemand variations driven by weather variation over a number of days, as well as within-day demand variation, as the demand volatility will feed into spot gas prices which can in-turn be mitigated through the use of medium-range storage. Salt cavity storage has
26 Some regulatory regimes require infrastructure providers to provide access to other partiesthrough Third Party Access rights.

GB GAS SECURITY OF SUPPLY AND OPTIONS FOR IMPROVEMENT
March 2010114_GBGasSecurityOfSupply_200910_v4_0.doc
48
PÖYRY ENERGY CONSULTING
typically provided medium-range storage in the GB market, but is usually smaller thandepleted field storage and more expensive per unit of storage.
Short-range storage is there to provide very large quantities over a very short timeframe.It has traditionally been used in the GB market to provide emergency safeguards, andcommercially as an insurance against a few days’ worth of very high prices.
In even shorter timescales both line-pack27 within the higher pressure gas networks, andlocal diurnal storage ‘gas holders’ within a local distribution network might be consideredas another form of gas storage, however they are very short lived, and primarilyconsidered as a within-day tool for the use of the network operators.
Gas storage projects may also provide a benefit to suppliers if they are located at key hubpoints. In GB this is not a significant factor as the NBP covers the whole of GB, but atphysical hubs such as the CEGH at Baumgarten it provides critical flexibility for trades.
Alternatives to gas storage include: swing production from gas fields; LNG imports fromthe global LNG market; and demand reductions from interruptible agreements (i.e. DSR).The development of storage has to be measured against the ability and efficiency of thealternatives to provide the level of flexibility required by the market.
3.2.1 Phases of a gas storage project
To track the development of storage projects we will describe the different developmentphases in terms of what approvals/decisions have been taken, as shown in Figure 20.
3.2.1.1 Conceptual phase
A perception of need for storage usually grows from observations regarding physicalsupply and demand balance, price seasonality and/or price volatility. The significantnumber of planned GB storage projects shown in Table 3 on page 17 might, for example,stem from the observation of UKCS decline coupled with stationary or growing demand.The developmental opportunity of a storage facility relies to a large extent on thegeological potential of proposed sites (in GB this is predominantly depleted fields or saltstrata). The concept of a storage project results from these initial conditions.
The high-level engineering and initial design of the storage facility is considered,producing both estimation of the total project cost and possible storage performancecharacteristics (injection and withdrawal rates). Land and access negotiations (ifnecessary) are concluded, such that formal Environmental Impact Assessments can beundertaken. During the conceptual phase an application for planning permission will bemade to the appropriate authority. Before the project can move on to the constructionphase two critical milestones must both be passed:
the project must receive approval from the planning authority; and
a final investment decision (FID) must be made to commit capital to the project.
A project with planning approval is more likely to eventually be built. However, it is notuntil the FID has been taken that we can be confident of a project being delivered. As wecan see in a number of examples in Section 3.2.2, obtaining planning approval can be avery length and costly process, and can lead to significant project delays.
27 A volume of gas contained within a pipeline by virtue of the fact that the gas is underpressure.

GB GAS SECURITY OF SUPPLY AND OPTIONS FOR IMPROVEMENT
March 2010114_GBGasSecurityOfSupply_200910_v4_0.doc
49
PÖYRY ENERGY CONSULTING
Figure 20 – Phases in the development of a storage project
3.2.1.2 Construction and operation phases
During the construction phase, work begins on site to install machinery, connect thenecessary services including a connection to the relevant transportation network (usuallythe NTS), carry out subsurface work, leach the caverns (for salt cavern storage) and injectthe cushion gas.
The operational phase will begin towards the end of the construction phase (but notnecessarily at the very end) with the commissioning of the facility. The available storagecapacity may increase over a period of time, for example as more caverns are leached.Once the full operational capacity is available the construction phase will cease and theoperational phase will continue for the life of the project.
Some projects will subsequently be expanded and, to the extent that the permissions andservices in the initial project are sufficient for the expansion, the development of a secondstage or an enhancement to a project can be relatively quick compared to thedevelopment times for the original project.
3.2.2 Examples of storage projects
Table 16 below gives a list of the storage projects that were listed in the TYS published in2005. The table then gives the status of the same projects as reported in the 2008 TYS.The project status is classified according to the phases shown in Figure 20: that is aproject is conceptual until it has been granted planning permission28. Table 16 gives thedates at which planning permission was granted.
28 In the 2008 TYS, National Grid separately identifies those conceptual projects that areawaiting a planning decision i.e. planning potentially imminent. Given the uncertainty of theplanning process (a project may have its application refused) we only show when a projecthas planning approved.

GB GAS SECURITY OF SUPPLY AND OPTIONS FOR IMPROVEMENT
March 2010114_GBGasSecurityOfSupply_200910_v4_0.doc
50
PÖYRY ENERGY CONSULTING
Table 16 – Storage Projects in Ten Year Statements
Project PlanningGranted
TYS 2005Status1
Projectedoperationdate 2005
TYS 2008Status1
Projectedoperationdate 2008
Slippage
Aldbrough Feb 2000 Construction 2007/08 Construction 2008/09 1+ years
Holford May 2004 Awaiting FID 2008/09 Construction 2010/11 2 years
Stublach Jun 2006 Conceptual 2009 Construction 2013/14 4 years
Caythorpe Feb 2008 Conceptual 2007 Construction 2011/12 4 years
Portland May 2008 Conceptual 2008 Awaiting FID >4 years
Albury I Conceptual 2008/09 Conceptual >4 years
Saltfleetby Conceptual 2009 Conceptual >4 years
Albury II Conceptual 2010 Conceptual >3 years
Fleetwood Conceptual 2009/10 Conceptual >4 years
Welton Conceptual 2008/09 Conceptual > 4 years
Bletchingley Conceptual 2009 Not listed -
1. Status based on the terminology shown in Figure 1
Source: National Grid Ten Year Statements 2005 and 2008
The most noticeable feature of the projects listed in Table 16 is that by 2008 none of theprojects had met the timescales quoted in 2005. Instead, of the eleven projects listed in2005:
one already under construction in 2005 had slipped by a year;
one with planning permission but awaiting a final investment decision in 2005 wasnow under construction but had slipped by two years;
two projects that subsequently obtained planning permission had moved to theconstruction phase but the timescales had slipped by 4 years (and since the TYS2008, Caythorpe has returned to awaiting final investment decision29);
one project had obtained planning in 2008 but was awaiting a final investmentdecision due to the credit crunch and lack of available credit; and
of the remaining six projects five had not yet received planning and one was nolonger listed as a project.
In every case the development times anticipated in 2005 proved to be overly optimistic.
The planning application process can be protracted. For example, Caythorpe submitted aplanning application in December 2005, had its application refused by the Local Authorityin June 2006; a public enquiry took place in April 2007, and it was finally approvedFebruary 2008. Other projects have been unsuccessful in getting planning approval. Forexample, Welton submitted in November 2003 and had planning refused by the Local
29 Centrica presentation to analysts, 9 December 2009 – status awaiting FID, due in Q3 2010
GB GAS SECURITY OF SUPPLY AND OPTIONS FOR IMPROVEMENT
March 2010114_GBGasSecurityOfSupply_200910_v4_0.doc
51
PÖYRY ENERGY CONSULTING
Authority in February 2006. We also note the process being followed by the Fleetwoodproposal, which has resubmitted a planning application following a failed appeal to theSecretary of State.
The main barrier to the prompt development of storage facilities appears to be planningdelays. This has been addressed in the past year with the new strategic planning processand it remains to be seen how this will improve the situation. We have also seenfinancing as a barrier recently. In the future, potential barriers may include the risk ofdiminished revenues due to over capacity of flexibility from storage, LNG andinterconnection, with reduced gas demand due to efficiency improvements and morerenewables. However, more renewables could lead to more volatility and greater need forshort- and medium-term storage.
3.3 Distillate backup investment
The drivers for investing in distillate backup will vary depending on whether this is beingconsidered for new plant or as retrofitting at an existing station. In this section weconsider both situations.
3.3.1 New gas fired power station
The issues for a new gas fired CCGT when considering whether to install distillate backup capability can be divided into the following:
3.3.1.1 Cost of installation
The cost of distillate includes three main elements, the wholesale price, the cost ofdelivery and duty. The current price of distillate is about $500/tonne30 CIF North WestEurope for prompt delivery, or about £313/tonne at £1=$1.60. To this must be addedtransport and duty costs. We estimates that transport by rail from a refinery to be in theorder of £10/tonne. With regard to duty, on 1 December 2005 the government announceda 100% rebate on distillate used for power generation, such that the duty is now zero.The total delivered cost to fill two 5000 m3 tanks (or 8,400 tonnes) is therefore in theregion of £2.7 million.
We have assumed costs for a 10,000 m3 ‘module’ of distillate storage with a single raildelivery siding adjacent to a Network Rail line, with a single fire protection system. Wehave then multiplied this up to give indicative costs for higher volumes of storage. Clearlythis is a simplified approach, since there will be economies of scale for both bunding andtanks. However, bearing in mind the fact that the costs will also be dependent on siteconditions, contracting market conditions and other site-specific issues, we still believethat they are a reasonable approximation of the cost of distillate backup. A 400MW ‘F’class CCGT module (i.e. a single gas turbine and single steam turbine/HRSGcombination) that is often used in GB will burn approximately 1500 tonnes per day at 50%efficiency.
3.3.1.2 Transportation issues
In considering distillate as a form of gas security of supply during a severe supplydisruption it must be recognised that replenishing stocks at power stations will be a
30 Source: Reuters ‘ICE GAS OIL Future Front Month Continuation’ – average from January toOctober 2009

GB GAS SECURITY OF SUPPLY AND OPTIONS FOR IMPROVEMENT
March 2010114_GBGasSecurityOfSupply_200910_v4_0.doc
52
PÖYRY ENERGY CONSULTING
significant logistic exercise and the volumes required will place a substantial strain on theexisting distillate production capacity and distribution network.
Using figures from DUKES31, UK production of distillate is about 26 million tonnes a year,with another 8 million tonnes imported, and about 6 million tonnes exported, leaving a netUK capacity of about 27 million tonnes. Current stock levels are about 3 million tonnes.
Of this 27 million tonnes, about 21 million tonnes is used in motor vehicles as diesel(DERV), about 3 million tonnes in industry (including power generation), and the rest forother uses including domestic heating, railways etc.
A key practical problem is the white/red issue, with motor duty exempt gasoil dyed red,which means that generally tankers are used for one or the other, but not both, as it is avery difficult job to clean out a gasoil tanker for use as a DERV tanker.
We estimate that a 400MW CCGT module will consume about 1500 tonnes a day at fullload, so with about 5.4GW of plant with distillate backup, this will require about 20,000tonnes a day to refill, which compares to the current supply of red gasoil of about 8,000tonnes a day, and the total supply of gasoil/DERV combined of about 70,000 tonnes aday. For a prolonged outage, and taking the worst case scenario of all stations beingsupplied by road, Pöyry estimates that about one third of GB distillate tanker fleet wouldbe needed, and probably a higher proportion of the drivers.
From data made available to Pöyry, the mean storage capacity at power stations is about8 days of consumption, or a total of about 160,000 tonnes. To fill this 5 times a year willtherefore require 800,000 tonnes of gasoil. This volume needs to be seen in the contextof the total volume of UK consumption of distillate of about 27 million tonnes a year, andalso in the context that there is a highly liquid market for this product at the North WestEurope, Amsterdam/Rotterdam/Antwerp (ARA) hub. UK prices are in fact NWE ARAprices, and in effect distillate is sourced as a product in a Europe wide market of about200 million tonnes per year. As an example of the liquidity of this market, the ICE futuresmarket for NWE ARA distillate trades about 100,000 tonnes a day for prompt delivery. Inour opinion therefore, this additional volume of distillate could be sourced without difficultyin the current distillate market.
An additional problem for generators is the summer/winter issue, because distillate is notgenerally treated with anti-waxing chemicals in the summer, and therefore it is very riskyfor a generator to buy since, if it is not burnt before the winter, it will freeze in the tankswhen the temperature gets low and when it is needed. Alternatively it will need to pay theadditional costs associated with adding the anti-waxing chemicals.
Taking all of the above into account the total distillate backup costs have beensummarised into Table 17 overleaf.
31 www.berr.gov.uk/energy/statistics/publications/dukes/page45537.html

GB GAS SECURITY OF SUPPLY AND OPTIONS FOR IMPROVEMENT
March 2010114_GBGasSecurityOfSupply_200910_v4_0.doc
53
PÖYRY ENERGY CONSULTING
Table 17 – Costs for higher volumes for a 400MW CCGT
Oil Storage(m3)
Days Tanks Distillate Bund Fire/Siding Total(millions)
10,000 0 £1,100,000 Zero £300,000 £400,000 £1.8
10,000 6 £1,100,000 £2,700,000 £300,000 £400,000 £4.5
50,000 30 £5,500,000 £13,500,000 £1,300,000 £700,000 £21
150,000 90 £15,000,000 £40,600,000 £4,000,000 £1,000,000 £60.6
3.3.1.3 Gas transportation charges
In the early 1990s, British Gas Transco (now National Grid Gas) operated a ‘deepconnection policy’ where any new connection to the network that required firm capacitywould be required to pay for all the investment necessary to support its load on thenetwork as an upfront, capital lump-sum. Most of the CCGTs at the time opted forinterruptible capacity which avoided the liability for these costs (it was cheaper for them toinvest in backup facilities and hold the appropriate stocks), and lowered ongoingtransportation charges. In the late 1990s, the policy changed to a ‘shallow connectionpolicy’ where the investment recharge was calculated to cover only local investment(deeper system investment was absorbed into Transco’s general cost base), although thediscounted transportation charges remained. The decreased transportation chargesalone were not sufficient to maintain the incentive to invest in backup facilities, so mostCCGTs built in the second ‘dash for gas’ had firm connections.
NTS-connected interruptible sites currently benefit from cheaper transportation charges,although this will likely change following the approval of Mod 0195AV, as described inSection 2.8. This modification means there is less incentives for new CCGTs to invest inbackup capability, so we consider that there will be very little or no investment in backupcapability, unless electricity incentives for a range of auxiliary services are required ateither the local level or for national security of supply.
3.3.1.4 Gas/Distillate arbitrage
The installation of distillate capability clearly enables the operator to benefit when gasprices are higher than equivalent distillate prices, and there is still a positive electricity/fuelspread. This will also depend on the accounting system used by the operator to price thedistillate, and the level of storage. This is because the price of distillate will tend to belinked to that of gas, and if the distillate is priced at replacement cost, rather than actualcost, then the electricity/fuel spread value will of course be reduced. This effect is limitedthe greater the storage level, and therefore the greater the flexibility the operator has tochoose the time (and hence price) at which the tanks are refilled.
This is further affected by the fact that distillate is supplied in bulk either in ‘winter grade’or ‘summer grade’ depending on the time of year that it is produced and delivered. This inturn means that the ability of a station to refill the tanks in the summer, when prices aregenerally lowest is limited due to the risk of ‘waxing’ in the winter.

GB GAS SECURITY OF SUPPLY AND OPTIONS FOR IMPROVEMENT
March 2010114_GBGasSecurityOfSupply_200910_v4_0.doc
54
PÖYRY ENERGY CONSULTING
Historically, there have been very few days over the past 10 years or more that gas hasbeen more expensive than distillate, so this would not normally be a key factor in decidingto build distillate tanks.
3.3.1.5 Reduced efficiency
All CCGTs in GB are designed to fire on natural gas as the primary fuel. This means thatthe Heat Recovery Steam Generators (HRSGs) are optimised for gas firing such that thedesign exhaust temperature from the HRSG into the stack is minimised, while maintainingsufficient stack buoyancy. When firing on distillate, there is a risk that the flue productswill condense in the stack leading to corrosion as a result of the fact that distillate containssulphur, such that it is usual practice to run the HRSG with the final feed heater sectionisolated. This therefore increases the exhaust temperature from the HRSG to minimisecondensation risk, but at the penalty of reduced HRSG efficiency. This reduction is in theorder of 2% of overall cycle efficiency. Clearly this reduction will need to be taken intoaccount in the calculation of any potential gas/distillate arbitrage upside above.
3.3.1.6 Electricity imbalance risk
It is our understanding that the reliability of gas turbines, and in particular the higherefficiency ‘F’ class machines, is lower on distillate than on gas. This means that there is ahigher tripping risk, and therefore a higher imbalance risk. Bearing in mind that distillate islikely to be burned when both the gas and electricity systems are under stress, theelectricity imbalance cash out price is likely to be high, and therefore this risk significant.
3.3.1.7 Practical issues
The primary practical issues to tackle are to ensure that there is sufficient land availablefor the distillate tankage and bunding, and there is a suitable delivery mechanism. Theland issues can be very significant if large volumes of distillate are envisaged to provide aprolonged backup capability prior to further deliveries being organised. It is our view thatroad tanker delivery is impractical in most circumstances, due to the inability to sourcelarge numbers of tankers and drivers in the event of a prolonged distillate requirement.This means that the site must be adjacent to: a large distillate facility, such as a refinery orstorage depot; a rail line or siding; or a suitable river, canal or coastal facility.
3.3.1.8 Environmental Issues
There are significant regulatory and environmental issues involved with the storage andburning of distillate. The Control of Major Accident Hazards Regulations 1999 (asamended by the Control of Major Accident Hazards (Amendment) Regulations 2005)(COMAH) lay out the safety systems required for large hazardous industrial sites.Although it applies mainly to the chemical industry, it also applies to other industrieswhere certain threshold quantities of dangerous substances are stored. It thereforeapplies to power station sites that store distillate in quantities in excess of 2500 tonnes,which therefore includes virtually all oil backup facilities at CCGTs. Another importantfeature of COMAH is that it lays out two levels of hazard management systems required,depending on the amount of the hazardous substance stored, ‘lower tier (LT)’ and ‘top tier(TT)’. The regulatory requirements for top tier are obviously much more onerous than forlower tier, and are triggered at storage levels above 25,000 tonnes. Although all CCGTsites with oil backup are caught by the regulations, they will be in lower tier, since we arenot aware that any CCGT site in GB stores more than 25,000 tonnes of distillate.However, if there is to be a significant expansion of storage to meet prolonged gas

GB GAS SECURITY OF SUPPLY AND OPTIONS FOR IMPROVEMENT
March 2010114_GBGasSecurityOfSupply_200910_v4_0.doc
55
PÖYRY ENERGY CONSULTING
interruptions, then the site will become top tier, with a significantly increased regulatoryand hence cost burden on the site.
3.3.1.9 Technical issues
It is our understanding that virtually all new CCGT installations under consideration in GBare to be built using ‘F’ class technology. Most of the existing stations with backupcapability use the more established lower temperature ‘E’ class technology. It is also ourunderstanding that the experience of running on distillate for extended periods of time onmodels of ‘F’ class gas turbine is very limited. In addition, there will be an additionalmaintenance penalty for running on distillate. We also understand that water injectionmay be required for NOx control while running on distillate, and this will require significantvolumes of demineralised water which may not be available without appropriate watertreatment plant and storage.
3.3.2 Existing Plant Retrofit Issues
Of the issues raised above, the key ones for an existing plant are likely to be the following:
3.3.2.1 Space
A new site is very likely to have additional space available adjacent to the site for thestation itself, since it is unlikely to be constrained precisely to that required. However, anexisting site is much less likely to have additional space available for the installation of thetankage and bunding required. Clearly, if the space is not available, then the installationof backup will not be possible.
3.3.2.2 Access to delivery mechanism
Again, a new site will have some flexibility as to its precise location, and hence itsproximity to a pipeline connection, a rail connection or a barge terminal. However, this willclearly not be the case for an existing site, and if there are no such connectionpossibilities, then the installation of distillate backup is in our view impractical due to thedifficulties identified with road delivery. For example, the nearest distillate supply for aCCGT power station in Devon is in Southampton, making road delivery and even raildeliveries not feasible because of the distance and poor transport connections.
3.3.2.3 Technical Issues
An existing station is likely to have a lower risk profile for the installation of distillatebackup than a new station. This is because it is likely to have older gas turbinetechnology, which will have been proven over a number of years, and is also likely to havesome form of experience running on distillate somewhere in the world. However, therewould be significant down time to re-configure the fuel systems.
Indeed, the Institute of Mechanical Engineers has stated that most old ‘E’ class CCGTscould be retrofitted to run on distillate32. They recommend pursuing this strategy inpreference to the compulsory installation of dual firing to new CCGT units. The suggestionis that retrofitted old CCGTs could form a standing reserve similar to that provided bycurrent oil firing plants such as Grain and Littlebrook. However, as noted in Section 3.3.2
32 Institution of Mechanical Engineers, response to consultation into effectiveness of currentgas security of supply arrangements, January 2007.

GB GAS SECURITY OF SUPPLY AND OPTIONS FOR IMPROVEMENT
March 2010114_GBGasSecurityOfSupply_200910_v4_0.doc
56
PÖYRY ENERGY CONSULTING
there would be many financial and practical barriers to be overcome in order to achievesuch a retrofit.
3.3.2.4 Financial
A number of financial issues that apply to new facilities, (e.g. cost of installation, reducedefficiency, imbalance risk, etc.) apply to retrofitting existing CCGTs.
Overall, we consider it impractical to globally retrofit distillate backup to all existing powerstations. However, those that do currently have backup facilities could be encouraged tokeep and maintain them, even though Mod 0195AV encourages them to become firm.This increases their transportation costs and reduces the benefit from having backupfacilities. As these facilities have ongoing costs many may wish to decommission them.

GB GAS SECURITY OF SUPPLY AND OPTIONS FOR IMPROVEMENT
March 2010114_GBGasSecurityOfSupply_200910_v4_0.doc
57
PÖYRY ENERGY CONSULTING
4. MODELLING GB GAS SECURITY OF SUPPLY
In this section, we aim to quantify any potential shortfall in gas supply in Great Britain, inthe timeframe 2010 to 2025 due to low probability, high impact events. We attempt toassess both the annual volume shortfall and the number of days in the year during whichthe shortfall pertains. This section is largely concerned with likelihood, so for each level ofshortfall we attempt to assign a probability of its occurrence.
We need first to define what we mean by ‘shortfall’, or – another word that we usesynonymously – ‘gap’. This is the extent to which the market will not meet firm customerdemand and is the measure of unserved energy, as defined and discussed in Section2.10. The shortfall or gap does not include interruption of interruptible consumersprovided through alternative fuel backup, nor does it include self-curtailment by gasconsumers in response to price, which are included as measures to provide security ofsupply33.
We have adopted two approaches to modelling the security of gas supply. Firstly, in adeterministic way, creating low probability scenarios to assess the extent to which GB andother countries would meet the tight conditions and how much firm demand might be lost.For the deterministic modelling we have used our pan-European and US gas model,Pegasus (‘Pan-European GAS + US’). The model examines the interaction of supply anddemand on a daily basis in the GB, all-island of Ireland, Iberia, France, Belgium &Luxembourg, the Netherlands, Germany, Denmark & Sweden, Czech Republic, Slovakia,Austria & Hungary, Romania, SE Europe34, Italy & Switzerland, the US and the Far East.Examining daily demand and supply across these markets gives a high degree ofresolution, allowing the model to examine weekday/weekend differences, flows of theInterconnectors and gas flows in and out of storage in detail.
The second is a probabilistic approach, where we have attributed probabilities to differentparameters, such as demand and supply shocks. Pöyry has developed the ‘Prometheus’model for examining the effects of unexpected and/or extreme events on the GB gasmarket. At its core, Prometheus uses the same optimisation criteria as our deterministicgas model, Pegasus, however Prometheus is notably different in two ways. Firstly, itincludes a stochastic model of the GB gas market that captures the likelihood andmagnitude of a variety of natural, technical and political events. Secondly, to avoid amassive computation problem, we have simplified the level of interconnection bydecreasing the number of zones from 17 in the deterministic modelling to four in thestochastic modelling. In effect, Prometheus models a simple four-zone Atlantic gasmarket, and drives thousands of slightly different scenarios though the Pegasus engine.
Further details on Pegasus and Prometheus can be found in Annex A.
33 This gap is not synonymous with a requirement for provision of strategic storage or othermeasures (although it does show the potential requirement). The economics of thesemeasures depend on several factors that we address in later sections, including the costs ofits provision, the economic damage caused by a gas supply shortfall, and unintendedconsequences of its provision. The economics also depend on the extent to which the gapmay be reduced, because the success or otherwise of a policy in covering a loss in supplydepends on the characteristics (volume and rate of supply in particular) of the measures andwhether it can cover the magnitude and duration of the interruption.
34 In our model, SE Europe includes Bulgaria, Greece, Albania, Macedonia, Montenegro,Serbia, Bosnia, Kosovo and Croatia.

GB GAS SECURITY OF SUPPLY AND OPTIONS FOR IMPROVEMENT
March 2010114_GBGasSecurityOfSupply_200910_v4_0.doc
58
PÖYRY ENERGY CONSULTING
This section has therefore been divided into two main sections – deterministic andprobabilistic analyses.
Assumptions summary
As shown in Section 2 throughout the period indigenous supplies in GB, the rest ofEurope and the US are in decline and Europe will be importing more gas by pipeline fromNorway, Russia, the Caspian Region and North Africa. It should be noted that in order toprovide conservative modelling scenarios we have not assumed any additional new buildfor new gas supply infrastructure within GB over and above that which is alreadycommitted. In addition we have applied a 5% reduction in available supplies acrossindigenous, pipeline and LNG sources to reflect unavailability due to planned andunplanned maintenance.
We have three GB demand scenarios: Average (to achieve DECC’s 2020 targets), Severe(1 in 50 representation of the Average across North-West Europe) and Central (partialachievement of 2020 targets). For each year a 1 in 20 peak day is included so thatachieving the peak demand is appropriately considered.
If gas demand was to increase significantly above these figures we would expect anumber of potential projects to be developed. Our forecasts for gas imports into the restof Europe do include projects that have yet to be confirmed, but the start dates aregenerally on the pessimistic side.
We also include the two types of demand side response in the form of distillate back uprelated to oil prices and I&C interruptible load as extra supplies, as it has the same effectas a reduction in demand. Any firm demand not being met would be identified asunserved energy.
4.1 Deterministic supply shock analysis
The main aspect of the deterministic approach was to analyse the impact of specificpredefined supply shocks against the supply/demand scenarios described above.Following discussions with DECC, the supply shocks outlined in Table 18 below wereselected as being those that might have the greatest impact during the time period beingmodelled – although they are at the very extreme level of plausible assumptions. Theshock combinations vary over the different years. To further stress test the analysis wehave combined the two cases with the biggest impact on potential energy unserved andprices to form a Combined shock case.
These supply shocks are assumed to last for the duration of the gas year being modelled.In addition, Pegasus assumes perfect foresight so it believes that alternative supplies areavailable when required, e.g. LNG is available on the day it is required and that thestorage facilities are full at the start of the gas year. We look separately in Section 4.2.2at whether there is sufficient supplies and storage available to cater for any major supplyshock before any further LNG supplies can reach GB.

GB GAS SECURITY OF SUPPLY AND OPTIONS FOR IMPROVEMENT
March 2010114_GBGasSecurityOfSupply_200910_v4_0.doc
59
PÖYRY ENERGY CONSULTING
Table 18 – Supply shock cases
Case 2010 2015 2020 2025No loss Base Base Base Base
No Rough No Rough capacityavailable to GBmarket for year
No Rough capacityavailable to GBmarket for year
No Rough capacityavailable to GBmarket for year
No Rough capacityavailable to GBmarket for year
TerminalLoss
Loss of in-flowfacilities at Bacton,
affecting UKCSproduction and
European imports
Loss of Sleipnerplatform, affectingNorwegian imports
to GB and tomainland Europe
Loss of MilfordHaven terminals
Loss of MilfordHaven terminals
ImportLoss
Loss of allUkrainian transit
gas
Loss of allUkrainian transit
gas
Loss of all Qatariliquefaction
capacity
Loss of all Qatariliquefaction
capacity
Combinedshock
Bacton (import &export) + Ukraine
losses
Sleipner + Ukrainelosses
Milford Haven +Qatari losses
Milford Haven +Qatari losses
4.1.1 Capacity and demand
The charts in Figure 21 to Figure 24 below show the capacity capable of providingphysical gas into the GB market and compare it to assumed peak GB demand plusexports to all-island of Ireland to reflect their dependence on supplies from GB, under theAverage, Central and Severe demand cases identified in Section 2.6.1 and 2.6.2. Thesefigures do not show the potential demand side response capability, which can be seen asadditional supply capacity.
The following charts also show the position in 2005, using the actual peak demand day (1February 2006, 411 mcm/d) as a reference point. The tightness of the system can beclearly seen and was a major factor behind the high prices seen that winter. The figuresclearly show the enhancement in supply capacity since 2005 due to the new LNGterminals, Norwegian import pipelines, interconnectors with the continent and storagefacilities.
In all supply shock cases, including the Severe demand, there is sufficient capacity tomeet peak daily demand using the existing and committed infrastructure and storage.The tightest supply capacity to demand occurs in the terminal loss case of losing Bactonin 2010, as shown in Figure 24.

GB GAS SECURITY OF SUPPLY AND OPTIONS FOR IMPROVEMENT
March 2010114_GBGasSecurityOfSupply_200910_v4_0.doc
60
PÖYRY ENERGY CONSULTING
Figure 21 – Supply capacity against peak demand; no supply loss (mcm/d)
0
100
200
300
400
500
600
700
800
2005 2010 2015 2020 2025
mcm
/dLNG Peaker
Salt Cavern
Depleted Field
LNG Import
European Import
Norway
UKCS
GB Demand + Irish Export;Central
GB Demand + Irish Export;Average
GB Demand + Irish Export;Severe
Source: Pöyry Energy Consulting, National Grid, Bord Gais
Figure 22 – Supply capacity against peak demand; import loss case (mcm/d)
0
100
200
300
400
500
600
700
800
2005 2010 2015 2020 2025
mcm
/d
LNG Peaker
Salt Cavern
Depleted Field
LNG Import
European Import
Norway
UKCS
GB Demand + Irish Export;Central
GB Demand + Irish Export;Average
GB Demand + Irish Export;Severe
Source: Pöyry Energy Consulting, National Grid, Bord Gais

GB GAS SECURITY OF SUPPLY AND OPTIONS FOR IMPROVEMENT
March 2010114_GBGasSecurityOfSupply_200910_v4_0.doc
61
PÖYRY ENERGY CONSULTING
Figure 23 – Supply capacity against peak demand; no Rough stress test (mcm/d)
0
100
200
300
400
500
600
700
800
2005 2010 2015 2020 2025
mcm
/dLNG Peaker
Salt Cavern
Depleted Field
LNG Import
European Import
Norway
UKCS
GB Demand + IrishExport; Central
GB Demand + IrishExport; Average
GB Demand + IrishExport; Severe
Source: Pöyry Energy Consulting, National Grid, Bord Gais
Figure 24 – Supply capacity against peak demand; terminal loss case (mcm/d)
0
100
200
300
400
500
600
700
800
2005 2010 2015 2020 2025
mcm
/d
LNG Peaker
Salt Cavern
Depleted Field
LNG Import
European Import
Norway
UKCS
GB Demand + IrishExport; Central
GB Demand + IrishExport; Average
GB Demand + IrishExport; Severe
Source: Pöyry Energy Consulting, National Grid, Bord Gais

GB GAS SECURITY OF SUPPLY AND OPTIONS FOR IMPROVEMENT
March 2010114_GBGasSecurityOfSupply_200910_v4_0.doc
62
PÖYRY ENERGY CONSULTING
It is also interesting to consider the annual supply capability. Figure 25 shows the annualcapacity of GB supplies against the Severe demand level based on there being nodisruption. It uses the UKCS flows as per Section 2.2 and assumes that import pipelinesfrom Norway, interconnectors and LNG flow to their maximum capacity across the year.Storage facilities are full at the start of the year but do not cycle to provide any additionalsupplies within year. It shows that there is sufficient supply capacity and availabilityacross the diverse sources such as Norwegian, European interconnection, LNG andexisting storage facilities.
Figure 25 – Annual capacity and demand in the Severe Central case
0
20
40
60
80
100
120
140
160
180
200
2010 2015 2020 2025
bcm
UKCS Norwegian gas Interconnectors Dragon
Isle of Grain South Hook Storage Demand
4.1.2 Supply and demand
Our deterministic modelling looks at the supply/demand situation over the whole gas yearand optimises the flows to match supplies with demand subject to physical andcontractual constraints at lowest cost.
The charts in Figure 26 show the monthly demand and supply from each source in eachof the scenarios. The supplies in excess of the demand line indicate exports to all-islandof Ireland and to the Continent, and/or filling of storage. The Import Loss case in 2010(loss of Ukrainian supplies to Europe) shows a large increase in LNG imports which istranslated into exports through the Interconnector to satisfy the loss of Ukrainian supply inEurope.
In the Terminal loss supply case in 2015 to 2025 (loss of Sleipner in 2015 and MilfordHaven in 2020 and 2025) there are significant imports from the Continent through theinterconnectors to compensate for the Norwegian and LNG supply losses.

GB GAS SECURITY OF SUPPLY AND OPTIONS FOR IMPROVEMENT
March 2010114_GBGasSecurityOfSupply_200910_v4_0.doc
63
PÖYRY ENERGY CONSULTING
The results indicate that demand side response is generally not required in GB apart fromunder the following two situations:
the Major Import Loss case with Severe demand in 2010 (loss of Ukraine) and 2025(loss of Qatari liquefaction) – note it also shows that GB is exporting in suchcircumstances to support the loss of demand on the Continent; and
the Combined case with Severe demand (loss of Milford Haven and Qatarliquefaction) in 2025.
Figure 26 – Supply and demand balances for supply stress tests (mcm/mth)
Cen
tral
Sup
ply
Cas
eN
o R
ough
Sup
ply
Cas
e

GB GAS SECURITY OF SUPPLY AND OPTIONS FOR IMPROVEMENT
March 2010114_GBGasSecurityOfSupply_200910_v4_0.doc
64
PÖYRY ENERGY CONSULTING
Impo
rt L
oss
Supp
ly C
ase
Term
inal
Los
s Su
pply
Cas
eC
ombi
ned
Cas
e (Im
port
& T
erm
inal
)

GB GAS SECURITY OF SUPPLY AND OPTIONS FOR IMPROVEMENT
March 2010114_GBGasSecurityOfSupply_200910_v4_0.doc
65
PÖYRY ENERGY CONSULTING
Although our results indicate that there would not be a supply gap in GB in thesecircumstances, there would be a need for demand side response and a risk of unservedenergy in other markets under severe weather conditions, such as south-east Europe withthe loss of supplies through Ukraine. Whilst some of the countries in the more affectedregion such as Italy, Greece and Turkey do have LNG terminals and strategic storage tohelp support the region, their capacities in 2010 are not sufficient to support Severedemand levels in Hungary, Czech Republic, Slovakia, Romania and the rest of South-EastEurope with loss of supplies through Ukraine for a whole year. This is demonstrated inFigure 27, which also shows that Italy and Germany would also be affected in theCombined loss case, where supplies from GB through the interconnectors are alsounavailable for a year, as the high demand in North-West Europe is met before movinggas further south and east.
Greater interconnections, new routes for Russian gas and increased LNG supplies willhelp to overcome this by 2015.
Figure 27 – Severe demand, Combined & Import Loss: European DSR
0
10,000
20,000
30,000
40,000
50,000
60,000
70,000
2010 2010
SevereImportLoss SevereCombinedCaseA
Ann
ual v
olum
e (m
cm)
AusHun BelLux Czech
France GerDen Italy
Neth Rom SEE
Slovak Spain
4.1.3 Storage usage
Storage usage is an important indicator on whether unserved energy will potentially be theoutcome from a major supply disruption. Figure 28 shows that, even in the Severedemand case, the levels of storage utilisation are still well within the amount of storagecapacity available across Europe. Whilst France has gas storage stocking obligations inplace which require suppliers of domestic consumers, on any day, to maintain specificstocks of gas in store, the minima and maxima are profiled throughout the year, therebyforcing the utilisation of storage – it is therefore questionable as to whether this constitutesstrategic storage so we have shown French storage separately. We have also separatedthe quantities of ‘strategic storage’ identified in the analysis in Annex C.

GB GAS SECURITY OF SUPPLY AND OPTIONS FOR IMPROVEMENT
March 2010114_GBGasSecurityOfSupply_200910_v4_0.doc
66
PÖYRY ENERGY CONSULTING
In the Combined supply disruption case (Import Loss and GB Terminal Loss), there is anincrease in European storage usage of over 4bcm compared to Figure 28, in 2010. Inaddition, there is an increase of 25bcm in total storage capacity by 2015. This expansionis mainly coming from the Netherlands, Germany, Italy and Romania.
This means that even in a severe supply disruption and demand case there still remainsplenty of storage notionally available to the market.
Figure 28 – European storage usage in the Severe demand, Central supply case
0
20
40
60
80
100
120
140
160
2010 2015 2020 2025
bcm
Usage Unused Capacity France storage Strategic storage
4.1.4 LNG regasification usage
As shown in Figure 26 LNG often provides the swing required to meet GB demand,especially under the Severe demand case. Table 19 shows the actual level of LNGutilisation resulting from the modelling optimisation – and the capacity has already beenconstrained by 5% from the total published capacity throughout. Not surprisingly thisreaches 100% in the most extreme supply disruption shock tests, for example in 2010Import Loss of Ukrainian transit routes for the year. Similarly, in the Terminal Loss casefor 2020 and 2025, where there are no Milford Haven terminals for the year, the remainingLNG capacity is 100% utilised. Again we see increased LNG utilisation, as would beexpected, in the 2015 Terminal Loss case (no Sleipner platform) which again underpinsthe fact that LNG will be a significant provider of swing in the future.
Under normal supply conditions and the Severe weather case it is typically in the range of65–75%, which is similar to that assumed in the Ofgem’s Project Discovery ‘Dash forEnergy’ scenario.

GB GAS SECURITY OF SUPPLY AND OPTIONS FOR IMPROVEMENT
March 2010114_GBGasSecurityOfSupply_200910_v4_0.doc
67
PÖYRY ENERGY CONSULTING
Table 19 – GB LNG regasification usage
Central Average Central Severe2010 24.9% 31.9% 66.1%2015 12.0% 22.8% 34.1%2020 44.3% 60.1% 63.6%2025 53.4% 69.2% 74.2%
No Rough2010 24.9% 31.9% 66.1%2015 11.9% 22.8% 34.1%2020 44.3% 59.8% 62.7%2025 53.3% 67.7% 70.2%Import Loss2010 76.3% 83.5% 100.0%2015 16.2% 33.2% 38.7%2020 38.0% 54.1% 61.0%2025 53.2% 69.2% 73.3%
Terminal Loss2010 9.9% 21.4% 39.4%2015 52.5% 66.3% 75.4%2020 85.1% 99.7% 100.0%2025 98.3% 100.0% 100.0%Combined Case2010 9.9% 21.4% 39.4%2015 64.7% 77.9% 81.9%2020 76.6% 96.8% 99.1%2025 98.3% 100.0% 100.0%
Note: Above utilisation excludes the assumed 5% reduction to total published capacity.
4.1.5 Demand side response
Using the available DSR, both distillate backup at power stations and I&C interruptibleload) shown in Table 12 the amount of demand side response required is zero in almostall cases, as shown in Table 20 below35. It can be seen that in the Severe demand andImport Loss supply case of 2010 (loss of Ukraine) there is 1146mcm per annum of I&Cinterruption, whilst in the other three supply cases there is none. All four scenarios havedistillate switching occurring at CCGTs, with distillate cycles constrained and reflecting theissues raised in Section 3.3.
35 This does not include any requirement of using interruption to manage local constraints.

GB GAS SECURITY OF SUPPLY AND OPTIONS FOR IMPROVEMENT
March 2010114_GBGasSecurityOfSupply_200910_v4_0.doc
68
PÖYRY ENERGY CONSULTING
Table 20 – Demand side responses in Severe demand, supply stress tests
Supplycase
I&C Interruptibledemand side
response
CCGTdistillate
switching
Supply casedescription
Year
(mcm) (mcm)
Import Loss Loss of Ukraine transit 2010 1944 570
Import Loss Loss of Qatarliquefaction
2025 0 570
Combined Loss of Ukraine transit& Bacton in-flows
2010 0 11
Combined Loss of Qatarliquefaction & MilfordHaven
2025 0 570
This data is shown graphically in Figure 29 and Figure 30 below at a monthly resolution.As can be seen in Figure 29, in December 2010 there would be 105mcm of CCGTswitching and 310mcm of I&C Interruption demand side response, whereas for the sametime period in Figure 30, there is only 11mcm of CCGT switching on the peak day andthere would be increased demand side response and unserved energy on the Continent,as indicated in Figure 27 on page 65.
Figure 29 – Severe Demand, Import Loss Supply stress test
-
50.00
100.00
150.00
200.00
250.00
300.00
350.00
400.00
450.00
Oct
-10
Nov
-10
Dec
-10
Jan-
11Fe
b-11
Mar
-11
Apr
-11
May
-11
Jun-
11Ju
l-11
Aug
-11
Sep
-11
Oct
-25
Nov
-25
Dec
-25
Jan-
26Fe
b-26
Mar
-26
Apr
-26
May
-26
Jun-
26Ju
l-26
Aug
-26
Sep
-26
mcm
/mon
th
I&C Interruption DSRCCGT distillate DSR

GB GAS SECURITY OF SUPPLY AND OPTIONS FOR IMPROVEMENT
March 2010114_GBGasSecurityOfSupply_200910_v4_0.doc
69
PÖYRY ENERGY CONSULTING
Figure 30 – Severe Demand, Combined stress test
-
20.00
40.00
60.00
80.00
100.00
120.00
140.00
160.00
180.00
200.00
Oct
-10
Nov
-10
Dec
-10
Jan-
11Fe
b-11
Mar
-11
Apr
-11
May
-11
Jun-
11Ju
l-11
Aug
-11
Sep
-11
Oct
-25
Nov
-25
Dec
-25
Jan-
26Fe
b-26
Mar
-26
Apr
-26
May
-26
Jun-
26Ju
l-26
Aug
-26
Sep
-26
mcm
/mon
th
CCGT distillate DSR
4.1.6 Monthly prices
In most of the cases studied there is only a relatively small impact on the wholesale GBgas price, due to an excess of import and production capacity able to serve a decliningGB gas market, coupled with an assumption of continued indexation of gas prices to oiland derivative products on the continent and in the Far East. However, the existing andcontinued surplus of LNG regasification capacity relative to liquefaction capacity ensuresa certain amount of flexibility to arbitrage between the different markets.
In the cases that examine the Combined effects of Ukrainian transit disruption and SevereGB and northern Europe gas demand (perhaps due to coincident severe weather) in2010, there is evidence that where the GB market continues to be interconnected to theEuropean market, the severe stress of losing Russian imports drives GB and Europeanprices above the point at which CCGT fuel switching might be considered to occur.Similarly for the Severe demand and Combined shock case in 2025 (loss of all Qatarliquefaction capacity for a year and Milford Haven terminal) we would expect to see pricesrise such that there would be fuel switching by CCGTs.
It should also be noted that these prices are based on a combination of oil-indexedcontracts and LRMCs described in Section B.1.4, so short-term market reactions to anysignificant supply disruption may be higher than modelled but any such ‘premium’ marketprice combined with the diverse supplies will attract additional supplies and so return themarket to LRMC costs quicker than would otherwise be the case. These observations aredemonstrated in Figure 31, Figure 32 and Figure 33 below for the Average, Central andSevere cases respectively.

GB GAS SECURITY OF SUPPLY AND OPTIONS FOR IMPROVEMENT
March 2010114_GBGasSecurityOfSupply_200910_v4_0.doc
70
PÖYRY ENERGY CONSULTING
Figure 31 – Monthly prices in the Average demand, supply stress tests
Figure 32 – Monthly prices in the Central demand, supply stress tests
0
90
180
Oct-10 Oct-15 Oct-20 Oct-25
p/th
AverageCombinedCaseAAverageNoRoughAverageImportLossAverageTermLossAverageCentral
0
90
180
Oct-10 Oct-15 Oct-20 Oct-25
p/th
CentralCombinedCaseACentralNoRoughCentralImportLossCentralTermLossCentralCentral

GB GAS SECURITY OF SUPPLY AND OPTIONS FOR IMPROVEMENT
March 2010114_GBGasSecurityOfSupply_200910_v4_0.doc
71
PÖYRY ENERGY CONSULTING
Figure 33 – Monthly prices in the Severe demand, supply stress tests
Figure 33 shows that for extreme test scenario of the Severe demand with Import Loss ofUkraine supplies case in 2010 prices reach the level assumed for I&C interruption. This isbecause GB maximises our supplies via the Interconnectors to help Continental Europe,as seen in Figure 26. In the Combined case, with the additional loss of Bacton as anexport route in 2010, GB prices are delinked from the Continent, and given the limitednumber of LNG terminals in the most affected regions cargos cannot be easily diverted.
4.2 Deterministic sensitivity analysis
To further test the results we have run sensitivities for two key assumptions: demandreflecting efficiency and renewable targets; and availability or delays of LNG.
4.2.1 Very high demand sensitivity
For the sensitivity analysis based on very high demand, we have used the Pöyry Centraldemand case and applied a severe weather pattern to it in the same manner as shown inSection 2.6.1.2. This gives a peak demand of 511mcm/d for GB only and 533mcm/dwhen including exports to all-island of Ireland in 2010, which is another 5% higher thanthe Severe demand case and it remains higher in later years (493mcm/d GB & all-islandof Ireland in 2025). The high demand sensitivity case has an annual demand of 114.5bcmin 2010, which is 28% higher that the NGG annual demand forecast from the 2009 TYS.
As was seen in Section 4.1.4 demand side response only occurs in the Import Loss casein 2010 and 2025 so we have repeated the analysis for this case. The resulting capacityand demand position is shown in Figure 34.
0
90
180
Oct-10 Oct-15 Oct-20 Oct-25
p/th
SevereCombinedCaseASevereNoRoughSevereImportLossSevereTermLossSevereCentral

GB GAS SECURITY OF SUPPLY AND OPTIONS FOR IMPROVEMENT
March 2010114_GBGasSecurityOfSupply_200910_v4_0.doc
72
PÖYRY ENERGY CONSULTING
Figure 34 – Capacity demand balance in High demand, Import Loss sensitivity
0
100
200
300
400
500
600
700
800
2010 2015 2020 2025
mcm
/dLNG Peaker
Salt Cavern
Depleted Field
LNG Import
European Import
Norway
UKCS
GB Demand + IrishExport; Central
GB Demand + IrishExport; High
In 2025, peak demand in the Average Demand with Import Loss case could be met solelyby a combination of UKCS, European imports, Norwegian imports and storage. In theHigh Demand with Import Loss sensitivity, however, significantly higher use of existingstorage is needed in order to service this peak demand.
It is also worth repeating that this is an extreme sensitivity as we have assumed no newbuild in gas storage, LNG import capacity or pipeline infrastructure over and above thatalready committed; an unlikely situation as we should expect supply to react to a return todemand growth well within the decade time period.
4.2.2 LNG delays sensitivity
We have also analysed potential supply/demand gaps in the event of LNG cargoes beingdelayed and stocks being empty at the time of the peak day in a Severe winter36. Thesedelays would limit the volumes available to meet demand. Figure 35 shows how theSevere demand peak measures up against the GB supplies in the Combined shock casewith all the LNG terminals being empty.
36 The positions shown in Figure 35 are at the most extreme and is beyond current securitystandards discussed in Section 2.1.

GB GAS SECURITY OF SUPPLY AND OPTIONS FOR IMPROVEMENT
March 2010114_GBGasSecurityOfSupply_200910_v4_0.doc
73
PÖYRY ENERGY CONSULTING
Figure 35 – Impact of LNG delays in Combined Shock under Severe peak demand
In the 2010 Combined shock case (loss of supplies through Ukraine and the loss ofBacton terminal), there is a risk of unserved energy should LNG supplies be delayed.This is because there would be no flows of European supplies through theinterconnectors. In other years there appears to be sufficient capacity to meet theCombined shock cases against the peak Severe demand, as they only assume loss ofLNG.
4.2.3 Restricted LNG sensitivity
With the supply shocks only showing limited usage of distillate backup at CCGTs and verylimited usage of interruptible industrial & commercial (I&C) contracts we have carried outan additional sensitivity to see the impact of a very remote possibility, where no LNGsupplies are available to GB for the whole year, possibly through other countries havingsignificantly increased demands and a higher capability to pay for LNG cargoes, thusoutbidding GB suppliers for the cargoes, or all GB terminals being affected by co-ordinated terrorist action.
This sensitivity assumes no LNG flows into GB for the whole gas year with all otherassumptions the same. The resulting annual flows are shown in the middle chart inFigure 36 with comparisons shown for the Average and Severe demand with no majorsupply disruption.
0
100
200
300
400
500
600
700
2010 2015 2020 2025
mcm
/d
UKCS Norway European Import AlburyAldborough Caythorpe Hatfield Moor Hole HouseHolford (Byley) Hornsea Humbly Grove RoughStublach Avonmouth Glenmavis PartingtonPeak Demand

GB GAS SECURITY OF SUPPLY AND OPTIONS FOR IMPROVEMENT
March 2010114_GBGasSecurityOfSupply_200910_v4_0.doc
74
PÖYRY ENERGY CONSULTING
Figure 36 – Supply-demand balance with no LNG to GB; Severe demand case(mcm/mth)
Under the Severe Central case with no supply disruption (right hand chart) there is a smallamount of excess supply to demand, which is being exported to the all-island of Irelandand to continental Europe through the interconnectors. There is some usage of storage,particularly in 2025, reflecting the assumption of no additional facilities being built duringthis period.
In the Severe Central with no LNG sensitivity (middle chart) we see significant usage ofthe interconnector and BBL pipeline to bring supplies into GB from Continental Europe,where LNG cargoes have been diverted and more supplies come from Russia. There isalso increased usage of GB storage across the years, but as there are no other significantoutages, demand is met without resorting to demand side response.
As we did in Section 4.1.3, we can analyse the projected level of storage usage acrossEurope in this no LNG sensitivity case. Figure 37, shows increased use of storage in aSevere demand case compared to the levels indicated in Figure 28 on page 66, but stillwith sufficient spare capacity and no use of ‘strategic storage’.
The impact on prices from this no LNG sensitivity is shown in Figure 38. It showsincreases over the time period with prices peaking in the winter close to the cost of usingdistillate backup at CCGT power stations, but the use of storage mentioned above issufficient to prevent this being required.

GB GAS SECURITY OF SUPPLY AND OPTIONS FOR IMPROVEMENT
March 2010114_GBGasSecurityOfSupply_200910_v4_0.doc
75
PÖYRY ENERGY CONSULTING
Figure 37 – EU storage usage with no LNG to GB; Severe demand case
0
20
40
60
80
100
120
140
160
2010 2015 2020 2025
BC
M
Usage Unused Capacity France storage Strategic storage
Figure 38 – Monthly prices with no LNG to GB; Severe demand case
20
70
120
170
220
Oct
-10
Oct
-15
Oct
-20
Oct
-25
p/th
SevereCentral
SevereCentralNoLNG

GB GAS SECURITY OF SUPPLY AND OPTIONS FOR IMPROVEMENT
March 2010114_GBGasSecurityOfSupply_200910_v4_0.doc
76
PÖYRY ENERGY CONSULTING
4.2.4 Conclusions from deterministic supply shock modelling
The key message that comes from the above modelling is that only in situations of veryextreme supply shocks with Severe demand does any unserved energy become apparentin GB, and only in 2010 is there any demand side response over and above use ofdistillate backup in CCGT power generation. This is summarised in Table 21.
Table 21 – Supply shock effects in Severe demand case
Supply Shock(applicable for the whole gasyear)
2010 2015 2020 2025
Rough not available Increased LNG importation – cargoes diverted fromUS where storage utilisation is increased
Negligible price impact
Import loss(international supply loss)Ukraine (2010, 2015)
Qatari LNG (2020, 2025)
CCGT andI&C DSRwith major
price impact
Unservedenergy in
SE Europe
Unservedenergy in
SE Europe
Minor GBprice
impacts
CCGTdistillateuse in
winter withprice
impact
Terminal lossBacton (2010)
Langeled/Sleipner (2015)
Milford Haven (2020, 2025)
Decreaseexports,
greater GBstorage
utilisation
GreaterLNG &
Europeanimports
Greater Europeanimports (LNG diverted toContinent) & GB storage
Combined shock(Import loss and Terminal loss)
Increased LNGimportation and some
price impacts
Greater Europeanimports and GB &European storage
CCGT distillate use
4.3 Probabilistic analysis
The second modelling approach we have used is to consider the supply risks to GB on aprobabilistic basis. The aim of this analysis is to produce probability distributions forunserved energy, and potentially also for demand flows and supply flows as well as anyshortfall between them and the impact on wholesale prices. From the resultingdistributions, it is possible to calculate appropriate summary statistics to describe the dataand to draw broad conclusions.
The probability distributions are determined from a simulation modelling approach, usinginput distributions for short-term losses in different sources of supply, and variations indemand due to weather and other factors. These random fluctuations are imposed on theAverage demand, Central supply scenario developed in Section 4, and the inputdistributions replicate the considerations that fed into the other scenarios (i.e. outage andsevere demand).

GB GAS SECURITY OF SUPPLY AND OPTIONS FOR IMPROVEMENT
March 2010114_GBGasSecurityOfSupply_200910_v4_0.doc
77
PÖYRY ENERGY CONSULTING
The probabilistic analysis therefore examines the combined effects of severe GB demand,losing LNG supplies, losing Norwegian and losing continental imports with appropriateprobabilities.
In addition, we estimate the economic impact of disruptions through a consideration of theGVA of the sectors that may experience the disruption. Disruptions may occur throughinvoluntary curtailment or from voluntary load shedding that arises from price volatility.
Pöyry has developed the ‘Prometheus’ model for examining the effects of unexpectedand/or extreme events on the GB gas market. At its core, Prometheus uses the sameoptimisation criteria as our deterministic gas model, Pegasus; however, Prometheus isnotably different in two ways. Firstly, it includes a stochastic model that captures thelikelihood and magnitude of a variety of natural, technical and political events. Secondly,to avoid a massive computation problem, we have simplified the level of interconnectionby decreasing the number of zones from 17 in the deterministic modelling to four in thestochastic modelling.
More detail of the model and the assumptions used in the model can be found in Annex A.
4.3.1 Supply outages
A supply outage (or outage) is an unplanned loss of supply. In the model an outage has arate of loss, expressed as a percentage of the supply prior to the outage, and a duration.Following an outage, supply is restored to the level of supply prior to the outage. In themodel the causes of a supply outage are grouped into two broad types:
technical failure – examples would include mechanical failure of a part, a man madeaccident or an act of God, such as a lightning strike; or
political – a dispute or unrest or an event potentially unrelated to the internal workingsof the gas industry.
The main difficulty with modelling outages is the lack of detailed or comprehensiveinformation about outage events. Indeed many outages do not ever get reported. Thismeans that the probabilities on which outages occur has to be informed by a limitedamount of experience. We are also required to take a view of the reliability of new LNGsupplies where the historical experience in GB is extremely limited.
In an earlier study on security of gas supply that was undertaken in 200622, it proved to bevery difficult to reach consensus on the probabilities of supply interruption. The outageprobabilities were set on an empirical approach and the probability estimates wereintended to broadly match observed historical events that have affected Britain’s gassupply. The outage proportions were based on the relative sizes of individual fields in theUKCS, while it was assumed that an individual LNG source or pipeline could becompletely curtailed.
Table 22 below gives a list of notable outage events that have, or could have, affected thesecurity of supply to GB since 2006. From these incidents we observe that:
in all cases the impact on GB supply was managed and the loss of supply was offsetby additional supply from other sources (possibly including a demand side response);and
interconnection between GB and Europe has benefited both GB security of supply(with imports following the Rough fire), and European security of supply (with exportsduring the Ukraine dispute).

GB GAS SECURITY OF SUPPLY AND OPTIONS FOR IMPROVEMENT
March 2010114_GBGasSecurityOfSupply_200910_v4_0.doc
78
PÖYRY ENERGY CONSULTING
Table 22 – Notable gas supply outages 2006 to 2010
Date Location Description and impact
Feb 2006 Rough storage Fire on offshore platform results in all storage servicefrom Rough being suspended. Stocks from otherstorage sites in GB drawn down and Interconnector(GB) imports. Gas Balancing Alert triggered on oneday but no enforced curtailment. Injection restored atRough in July 2006, and withdrawal restored inNovember 2006.
Jul 2007 CATS pipeline Vessel dragged its anchor damaging pipeline resultingin a 10 week shutdown.
Feb 2008 Bacton Shellterminal
Fire at terminal interrupts flows from the Sean field.Flows restarted after 3 days.
Apr 2008 Grangemouth 48-hour strike at the oil refinery leads to Fortiespipeline being closed down. Loss of gas productionfrom Forties fields amounted to up to 70mcm.
Jan 2009 Ukraine transit Dispute between Gazprom and Naftogaz leads tointerruption to transit gas flows through the Ukraine,resulting in 20% reduction in Europe’s gas supply fortwo weeks. GB supply not impacted. IUK increasesexports to Europe during the dispute.
Jan 2010 Norwegiandisruptions
On 7 January Europe’s largest gas field, Troll, trippedbut was returned to production within 2 hours. Thenon 11 January Europe’s third largest field, OrmenLange, was shut down for 2 days because of badweather in Norway.
The frequency and extent of the outages observed since 2006 could potentially beincluded within the types of outage modelled and appear to be broadly consistent with theprobabilities assumed in 200637. On the basis of the observations in the last four yearswe believe it is appropriate to not change the probabilities of outages modelled on alimited data set of ‘notable’ outages38. Therefore it appears reasonable to continue usingthe same empirical approach and probabilities used in the 2006 study, as shown in Table23.
37 In the model the probability that in any winter we observe one or more two-week outages or1-winter outages on the total of UKCS pipelines, import pipes and storage is 39% (that is 1minus the probability that no two-week or 1-winter outages occur). Over the three winterswe observed one such outage on UK infrastructure – the Rough fire (other events wereeither in the summer months or of less than two weeks duration).
38 Using the ‘notable’ outages in the last four years on their own to form our view ofprobabilities could give a skewed picture as it does not include smaller potentially morefrequent outages included in the earlier modelling.

GB GAS SECURITY OF SUPPLY AND OPTIONS FOR IMPROVEMENT
March 2010114_GBGasSecurityOfSupply_200910_v4_0.doc
79
PÖYRY ENERGY CONSULTING
Table 23 – Source outage events and probabilities
Proportion affected 1-day event 2-week event 1-winter event
Per winter Likelihood Likelihood
Technical Political Technical Political
UKCS Associated 10% 0% 3 2% 1% 0%
UKCS Dry gas 10% 0% 3 5% 1% 0%
Dragon LNG 100% 50% 6 20% 2% 2%
South Hook LNG 100% 50% 6 20% 2% 2%
Isle of Grain LNG 100% 50% 6 20% 2% 2%
Langeled (to GB) 100% 50% 3 10% 1% 2%
Ukrainian transit toEurope
100% 50% 3 10% 1% 2%
Vesterled 100% 0% 3 5% 1% 0%
GB Long RangeStorage
50% 0% 1 2% 1% 0%
Source: modification of Pöyry Energy Consulting 2006.
4.3.2 Other detailed assumptions
Various other detailed assumptions have been used within Prometheus, which aredescribed in Annex A.2. These include considerations of:
annual demand and winter severity;
peak daily demand;
oil price and long-run marginal cost uncertainties;
statistical sampling methodologies; and
sample size.
4.3.3 Results
For the probabilistic analysis Prometheus was run for 5000 iterations and created a widerange of demand and supply situations. It contemplated a situation with a maximumannual demand of 123bcm in GB, and contemplated a maximum daily demand level ofover 700mcm/d.
4.3.3.1 Demand side response and use of distillate
Based on the situation contemplated in 2010, the results indicate that we would expect:
use of distillate backup at existing CCGTs to occur once in every 3 years;
use of I&C interruption for supply/demand balancing (excludes interruption for localtransportation constraints) to occur once in every 15 years; and
unserved energy to firm customers to occur once in every 19 years.
Results for 2025 are broadly similar: very unlikely events have a smaller impact; however,there are a greater number of instances where DSR is experienced in the market. As this
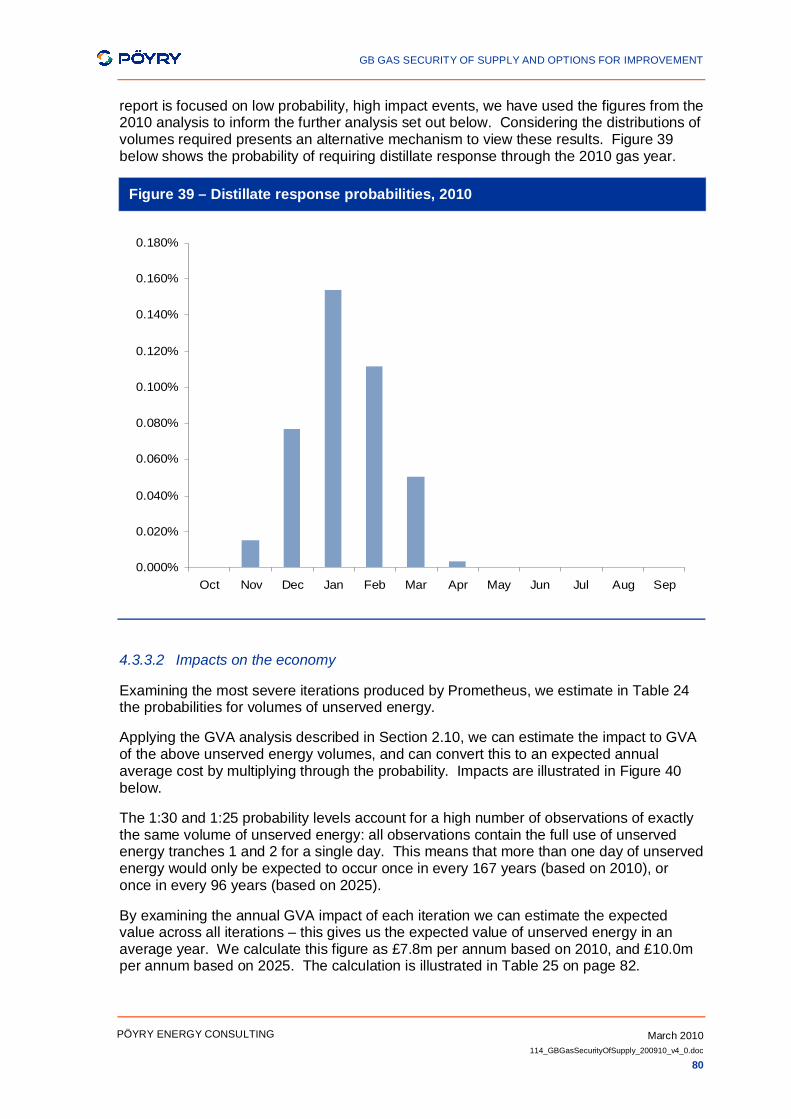
GB GAS SECURITY OF SUPPLY AND OPTIONS FOR IMPROVEMENT
March 2010114_GBGasSecurityOfSupply_200910_v4_0.doc
80
PÖYRY ENERGY CONSULTING
report is focused on low probability, high impact events, we have used the figures from the2010 analysis to inform the further analysis set out below. Considering the distributions ofvolumes required presents an alternative mechanism to view these results. Figure 39below shows the probability of requiring distillate response through the 2010 gas year.
Figure 39 – Distillate response probabilities, 2010
0.000%
0.020%
0.040%
0.060%
0.080%
0.100%
0.120%
0.140%
0.160%
0.180%
Oct Nov Dec Jan Feb Mar Apr May Jun Jul Aug Sep
4.3.3.2 Impacts on the economy
Examining the most severe iterations produced by Prometheus, we estimate in Table 24the probabilities for volumes of unserved energy.
Applying the GVA analysis described in Section 2.10, we can estimate the impact to GVAof the above unserved energy volumes, and can convert this to an expected annualaverage cost by multiplying through the probability. Impacts are illustrated in Figure 40below.
The 1:30 and 1:25 probability levels account for a high number of observations of exactlythe same volume of unserved energy: all observations contain the full use of unservedenergy tranches 1 and 2 for a single day. This means that more than one day of unservedenergy would only be expected to occur once in every 167 years (based on 2010), oronce in every 96 years (based on 2025).
By examining the annual GVA impact of each iteration we can estimate the expectedvalue across all iterations – this gives us the expected value of unserved energy in anaverage year. We calculate this figure as £7.8m per annum based on 2010, and £10.0mper annum based on 2025. The calculation is illustrated in Table 25 on page 82.

GB GAS SECURITY OF SUPPLY AND OPTIONS FOR IMPROVEMENT
March 2010114_GBGasSecurityOfSupply_200910_v4_0.doc
81
PÖYRY ENERGY CONSULTING
Table 24 – Probability of volumes of unserved energy
Probability Expected volume of unserved energy (bcm)2010 2025
1:5000 0.474 0.231
1:2500 0.089 0.196
1:1250 0.062 0.101
1:1000 0.055 0.087
1:200 0.027 0.041
1:30 0.021 -
1:25 - 0.021
1:19 0.001 -
1:15 - 0.001
Figure 40 – GVA impact of unserved energy
£0
£500
£1,000
£1,500
£2,000
£2,500
£3,000
£3,500
£4,000
0 1000 2000 3000 4000 5000 6000
1 in N probability
Impa
ct (£
m)
20102025
We observe that the values (and capacities) discussed in the preceding analysis arerelatively small compared to the investments currently being contemplated within theexisting market. These commercial investments are driven primarily by market forces: theabsolute level of wholesale prices; the seasonality and volatility of wholesale prices; therelativity to other markets (however, due perhaps to illiquidity in the wholesale market theyare also, in part, driven by their investors’ physical portfolio positions and their exposure to

GB GAS SECURITY OF SUPPLY AND OPTIONS FOR IMPROVEMENT
March 2010114_GBGasSecurityOfSupply_200910_v4_0.doc
82
PÖYRY ENERGY CONSULTING
unforeseeable, force-majeure events). We also note that commercial investmentscurrently under consideration by the industry have not been included in the above analysisand could lead to significant reductions in the potential for unserved energy.
Table 25 – Expected value of unserved energy (based on 2010)
Severity ofiteration
GVA Impact(£m)
Probability Expectedvalue of
iteration (£m)1 3476 1/5000 0.702 624 1/5000 0.123 459 1/5000 0.0924 459 1/5000 0.092··· ··· ··· ···
259 1 1/5000 0.0002260 0.3 1/5000 0.0001261 0.00 1/5000 0.0000··· ··· ··· ···
5000 0 1/5000 0.0000
7.8Total (£m)
By examining the impact and probability of any individual iteration we note that a highlevel of protection against any single extreme unserved energy event is less cost effectivethan a lower level of protection. It is guarding against single day events that presents themost cost effective opportunity for guarding against the impacts of unserved energy. Thesingle day events that lead to unserved energy are only experienced against abackground of longer outages (associated with other infrastructure) and very high demandlevels. With a background of a long-term outage and a near-term forecast of coldweather/high demand, we would expect the market to perceive this risk and increasepremiums on forward gas prices accordingly.
This price signal provides some limited forewarning to the market that alternative energysources, e.g. distillate stocks, could be of significant value in the near-term. However, it isunlikely to provide any forewarning beyond the near-term capability of forecasting coldweather/severe demand. It is therefore unlikely that significant restocking of distillate (ifnecessary and appropriate for the particular alternative source), can happen within thesetimescales.
4.3.3.3 Prices
The model also produces price distributions for each day of the year. Figure 41 shows theprice distributions for 2010 and 2025, the latter having a wider distribution reflecting thetighter supply to demand position coming from the restrictions made to any new suppliesand storage facilities.
In addition, we have aggregated these and selected monthly information in Figure 42overleaf. The price distributions show a higher probability of high prices in the winter thanof low prices in the summer – i.e. there is more certainty of winter prices. Interestingly,the model also suggests that there is a higher probability of a high or a low price (than of amid price) in shoulder month periods.

GB GAS SECURITY OF SUPPLY AND OPTIONS FOR IMPROVEMENT
March 2010114_GBGasSecurityOfSupply_200910_v4_0.doc
83
PÖYRY ENERGY CONSULTING
Figure 41 – 2010 and 2025 price distributions across the year
0%
2%
4%
6%
8%
10%
12%
14%
16%
40 50 60 70 80 90 100 110 120
Price (p/therm)
Pro
babi
lity
2010
2025
Figure 42 – 2010 price probabilities for selected months
0%
5%
10%
15%
20%
25%
40 46 51 57 62 67 73 78 84 89 94 100
105
111
116
Price (p/therm)
Prob
abilit
y
November
January
March

GB GAS SECURITY OF SUPPLY AND OPTIONS FOR IMPROVEMENT
March 2010114_GBGasSecurityOfSupply_200910_v4_0.doc
84
PÖYRY ENERGY CONSULTING
4.3.3.4 Flow data
In addition to the above outputs, the model provides interesting information regarding theprobabilities of flows through delivery points and points of interconnection. This isdemonstrated in Figure 43, which shows the probabilities for export flows from GB to theContinent. (Figure 43 does not show the instances of zero flow or import flows).
Figure 43 – GB export flow probability, 2010 Base Case
8
10
12
14
16
18
20
Oct
Nov
Dec
Jan
Feb
Mar
Apr
May
Jun
Jul
Aug
Sep
00.050.10.150.20.250.3
0.35
Probability
Flow (mcmd)
0.3-0.35
0.25-0.3
0.2-0.25
0.15-0.2
0.1-0.15
0.05-0.1
0-0.05
4.4 Modelling conclusions
The deterministic modelling suggests that security of gas supply is only potentially ofconcern in severe circumstances. It also suggests that into the future, because of existingpolicies that have the effect of reducing future gas consumption, and despite significantdecline in UKCS production, security of supplies continue to be of concern only in suchsevere circumstances.
The deterministic supply shock modelling has several main messages which weresummarised in Table 21 on page 76.
The probabilistic modelling supports these observations: it provides the conclusion thatunder current and projected supply and demand situations, and considering the potentialfor adverse supply-side events, disruptions to the demand side that result in unservedenergy not covered by CCGT distillate backup or I&C interruptible contracts can beexpected to occur less than one day in every 19 years. The expected impact to theeconomy of unserved energy is small.

GB GAS SECURITY OF SUPPLY AND OPTIONS FOR IMPROVEMENT
March 2010114_GBGasSecurityOfSupply_200910_v4_0.doc
85
PÖYRY ENERGY CONSULTING
Only in the worst case of supply disruption and severe weather is there small amounts ofenergy unserved, and this is primarily handled through distillate backup at power stations.The probability of CCGT distillate backup being required is once in 3 years.
One of the key drivers of gas security of supply supporting the analysis is that there issufficient LNG around the world and marginal volumes will react to price signals. Itassumes that the growth in LNG market trades will remain at current levels and continueto be responsive to demand and price signals and that GB prices will be adequate for GBshippers and customers to have sufficient ability to pay. This LNG market also providesintegration with the North America market and allows the GB and European markets toaccess the vast quantities of relatively cheap storage in the United States through thediversion of LNG cargos in response to appropriate price signals.
In addition, the continued interconnection of GB to Continental Europe provides it withaccess to significant quantities of flexibility in the Netherlands and Germany, and forContinental Europe and the all-island of Ireland to have access to flexibility in GB.However, this is dependent on there being no overzealous protectionism into the futurethat might limit the gas flows around Europe over and above any physical restrictions.The analysis also assumes that any proposed tightening of the EU directive on security ofsupply does not decrease the effectiveness of European storage.
It should be noted that there are some important assumptions in the modelling, such asthe base case demand assuming that the Government’s 2020 energy efficiency andrenewable energy targets are achieved. That said, the Very High demand sensitivity caseand the maximum level used in the probability analysis has annual and peak demand wellabove the highest recorded levels, and we have constrained the potential new build toonly those facilities where investment has been committed.
The analysis shows that prices are only impacted, as would be expected, in the extremecircumstances of very low probability and high impact events. The expansion in diversityof supply sources means that any market price reaction to a severe supply disruption willbe limited, and it will return to marginal prices faster than otherwise would be the case.

GB GAS SECURITY OF SUPPLY AND OPTIONS FOR IMPROVEMENT
March 2010114_GBGasSecurityOfSupply_200910_v4_0.doc
86
PÖYRY ENERGY CONSULTING
[This page is intentionally blank]

GB GAS SECURITY OF SUPPLY AND OPTIONS FOR IMPROVEMENT
March 2010114_GBGasSecurityOfSupply_200910_v4_0.doc
87
PÖYRY ENERGY CONSULTING
5. ALTERNATIVE POLICY OPTIONS
5.1 Identification of policy options
Any policy option considered must improve the security of gas supply either throughdelivering additional physical gas to GB, or improving the flexibility of gas demand relativeto that which is forthcoming through existing commercial and regulatory arrangements.
However, the additional policy must also be justified in terms of addressing specificmarket barriers or imperfections – there is generally no gain to be had if the market isconsidered to be working efficiently at present. While the analysis to date does notindicate significant concerns in terms of physical outage risk or price variability, we havequalitatively identified several potential market imperfections or barriers:
high costs to develop facilities that may have low utilisation;
limited forward market liquidity;
linkages between gas and oil prices;
the impact of the credit crunch and other capital market imperfections;
the security of supply being an externality, the full value of which is not rewarded toproviders of said security;
potential ‘public good’ aspects of insuring against extreme events, such that nobodyin the commercial market invests to insure against them;
the inability of some customers to signal their value of lost load to the market or forthis value to be recognised in the current interruption and firm capacity process;
lack of exposure of suppliers to the true costs of unserved energy;
different public and private views on the value of security and the reliability ofsources; and
unintended impacts on gas demand flexibility from regulatory changes in other areas.
Since there are several dimensions of security of supply incidents – probability, scale andduration – we have differentiated the potential impact of these failures/barriers on twotypes of security issue:
the occurrence of low probability/high impact events – commercial operators may notassess their exposure to these risks in the same way as society or policymakers; and
the availability of short-term flexibility in the market – through appropriately priceddemand side adjustments.
5.1.1 Low probability/high impact events
The review in Sections 2.8 and 2.9 has already shown the distillate backup and I&CInterruptible DSR cannot adequately manage a long duration or very severe supplydisruption. In such circumstances, in order to avoid any impact of unserved energy, someform of reliable physical supply backup is required. This can be provided either throughhaving sufficient diversity of supply sources or through accessing reserves in domesticstorage facilities. While it is not evident from our analysis that GB requires such strategicstorage to accommodate less than 1-in-19 year events – there appears to be sufficientcommercial storage already available – in some countries this is not necessarily the case.

GB GAS SECURITY OF SUPPLY AND OPTIONS FOR IMPROVEMENT
March 2010114_GBGasSecurityOfSupply_200910_v4_0.doc
88
PÖYRY ENERGY CONSULTING
Strategic storage has, in these cases, been considered and used to provide the additionalvolume required. Consequently, we would consider a policy that provides additionalphysical gas capacity to be worthy of consideration for further investigation.
5.1.2 Short-term flexibility issues
Other forms of security events may be short-lived or less dramatic in scale. Here, someshort-term flexibility in demand may be required before alternative supplies can bebrought into the market e.g. time for LNG ships to arrive from the liquefaction plants.Historically, DSR (through interruption of industrial customers on interruptible contracts)and use of fuel switching in power generation have been key contributors to providing thisshort-term flexibility, as well as the existing gas storage facilities. It is also clear from thereview in Sections 2.8 and 2.9 that the availability of distillate backup and I&C InterruptibleDSR may have been compromised by recent UNC rule changes and so have had theunintended consequence of reducing this flexibility for major supply shocks.
Other sources of short-range flexibility have included the swing in supply contracts andmedium-term storage. With the decline in UKCS supplies supply-side swing is reducing,although this can be offset by the interconnectors with the Continent responding to short-term price signals and the increased levels of LNG regasification terminals being able toprovide more cargoes within a week or so.
Thus, in addition to looking at policy options for providing longer duration cover, it isappropriate to review further policies that could maintain or improve the flexibility of GBgas demand to mitigate any adverse supply shocks.
5.2 Responsibility for delivery
The delivery of any new policy may fall to suppliers/consumers, network operators or thegovernment. This distinction may influence the cost of implementation, the effectivenessof the policy and the extent to which it is prone to unintended consequences. This isparticularly relevant in physical storage provision options, as discussed below.
5.2.1 Government
Government provision can most easily be ring-fenced from the market and currentcommercial rules, with the use of reserves defined in relation to specific events and lesssusceptible to challenge on cost recovery or reflectivity concerns from regulatoryoversight. However, any set of rules would be ‘incomplete’ and hence susceptible touncertainty and policy risk, thereby creating unintended consequences.
5.2.2 Suppliers
Providing obligations on the suppliers has the advantage of ensuring that themanagement of the provision is being done through incentives, market mechanisms andrules. However, monitoring may be problematic and minimum provisions may distortcompetition and prevent new entrants in supply/shipping. Furthermore, there may beadditional issues relating to the manner in which use of the physical gas could betriggered. For example, trigger rules such as breaching a security threshold, or offeringthe gas at a set price into the market may have unintended consequences. Marketplayers might manipulate behaviour to trigger a security threshold, whereas a set price tobid into the market may raise concerns over regulatory cost recovery conditions as well asdistortions to infra-marginal OCM bidding behaviour, thereby increasing balancing costs.

GB GAS SECURITY OF SUPPLY AND OPTIONS FOR IMPROVEMENT
March 2010114_GBGasSecurityOfSupply_200910_v4_0.doc
89
PÖYRY ENERGY CONSULTING
5.2.3 National provider
This would work in a similar way to the suppliers but would be provided by one nationalprovider, with NGG as the main transportation provider the obvious choice. There wouldbe the potential issue of cost recovery conflicting with regulatory objectives. Allowing aregulated utility to recover costs for events that are not likely to happen and identifying anacceptable rate or return will not be easy. There would need to be clear rules fordischarging the obligation and whether it had been done in the most economic manner,and achieving agreement on these between all stakeholders would not be easy.However, monitoring of the scheme may be more manageable and less costly toimplement than for a range of suppliers and would have the effect of socialising the cost ofsecurity provision across all suppliers (minimising distortions to supply competition).
5.3 Security of supply in other countries
We have investigated how security of supply is discharged in other countries to see whatlessons can be learned and considered in developing alternative policy options that couldimprove the situation in GB and these are summarised in Annex C.
There are a wide variety of arrangements that have been put in place depending on eachcountry’s perceived risk to supply failure, historical market structure, availability of suitablegas storage (i.e. geology) and the government’s market philosophy.
In some countries, such as Hungary, there are explicit strategic stocks that are onlyreleased on instructions from the relevant ministries. In others, such as Italy, there arestrong incentives39 to maintain strategic stocks, with flows being controlled by the TSO. Inmost others there are obligations on shippers and/or transmission system operators(TSOs) to maintain stocks, which are effectively strategic as their use is administered by acentral body (TSOs and/or government ministries).
In Germany, which has the largest amount of gas storage in Europe, there are no securityof supply obligations. However, there are severe penalties on shippers not supplying firmcustomers, which, with the lack of TPA in the past and good geology has arguably actedas an incentive to over build gas storage. Each major shipper has developed its ownstorage to satisfy its own worst case scenario, which in aggregate is worse than the worstcase for the market overall.
Looking further afield, Japan is a major importer of LNG as it has very little indigenousenergy supplies. It also uses nuclear power for some of its electricity generation. Duringrecent safety related shutdowns it had to significantly increase its LNG supplies. Whilstthis at first sight increased its exposure to the LNG market, when challenged on this avice-minister of Japan’s Ministry of Economy, Trade and Industry was reported in 2007 assaying ‘that the country did not need to build national strategic reserves of LNG. “LNG isbought under long-term contracts that last for 20 to 30 years. With supply committedunder such contracts, there’s no need to build national reserves,” said Takao Kitabata,glossing over the potential for unforeseen supply disruptions. He also suggested that thecountry’s position as the world’s biggest importer of LNG meant the country hadsignificant enough buying power to overcome supply shortfalls’40.
39 Stocks can be used under normal conditions, subject to a penalty. Relief from the penaltycan be given on instructions from the relevant ministry.
40 Heren LNG 23/2/07.

GB GAS SECURITY OF SUPPLY AND OPTIONS FOR IMPROVEMENT
March 2010114_GBGasSecurityOfSupply_200910_v4_0.doc
90
PÖYRY ENERGY CONSULTING
We would like to highlight some specific examples of short term measures introducedacross Europe in specific circumstances:
5.3.1 Italy
In winter 2005/2006 a combination of factors led to a gas shortage in Italy:
a cold winter which led to an increase in demand for heating (+ 3 billion cm);
an increase in demand by electricity producers (+ 13% in 2005); and
a reduction in imports (- 190 million cm), especially from Russia, via Ukraine.
The government therefore activated an emergency procedure, on 19 December 2005, andtook a number of temporary measures to face the crisis. The following provisions wereadopted:
Resolution No. 10/2006: the Authority introduced an auction mechanism to activate atemporary interruption system of the natural gas supply;
Ministerial Decree of 24 January 2006: the Ministry of Productive Activities relaxedemissions limits to the power generation plant up till 31March, in favour of the use ofoil; and
Ministerial Decree of 25 January 2006: the Ministry of Productive Activities reducedthe allowed temperature limit in residential buildings from 1 to 28 February.
Additionally, strategic storage was also used in February 2006. On 22 March 2006 theEmergency Committee declared the end of the crisis.
5.3.2 Spain
In 2005 Spain perceived that it faced a potential lack of gas supplies. As can be seen inthis press report the Spanish regulator, CNE, intervened by ordering strategic LNGstorage and tightening balancing rules in an effort to ensure that gas was not diverted tothe US or GB.
‘Raising the quantity of LNG in storage, onshore and afloat, is central to the measuresto ensure winter supply announced by the Spanish government last week. Twoloaded tankers will be chartered and held in reserve ready to unload from 1stDecember to 15th March, the industry ministry said. Levels at terminal storage tankswill be increased by an unspecified amount among a raft of measures, including dailygovernment monitoring of the supply-demand balance. The package goes furtherthan that announced for the winter of 2003-04, when one tanker was kept anchored inthe Mediterranean from December to March. It focuses mainly on storage – longidentified as a weakness in Spanish gas infrastructure and regulation’41.
5.4 Potential additional policy options
We identified a number of policy options that could potentially increase the levels ofstorage, distillate backup and demand side response, which can be categorised asfollows:
provision of physical storage;
backup fuels for power generation;
41 Heren LNG 17/11/05

GB GAS SECURITY OF SUPPLY AND OPTIONS FOR IMPROVEMENT
March 2010114_GBGasSecurityOfSupply_200910_v4_0.doc
91
PÖYRY ENERGY CONSULTING
demand side response from other users;
other direct security policies;
fiscal incentives; and
other indirect regulatory incentives.
5.4.1 Policy shortlist
The following selection criteria were identified as appropriate measures to evaluate theeffectiveness of the alternative policy options:
time for implementation;
speed of response at the time of need;
complexity;
potential volume towards annual demand;
potential volume towards peak demand;
reliability;
legality;
which failures/barriers it addresses;
industry support; and
unintended consequences.
We then assessed each of the identified policy options within the categories and againstthe above selection criteria to provide an initial view on options which may have a positivecontribution. This assessment is summarised in Table 26 below and uses a traffic lightsystem to show each option’s contribution against the criteria identified above. A moredetailed explanation against each policy option is contained in Annex D.
When considering which policy option to consider we have given extra weighting to theselection criteria for either the need to provide sufficient and reliable volumes to providecover for a serious loss of supply that may occur in a low probability high impact event orto cover short-term flexibility issues. We have then considered who would haveresponsibility for delivery and looked at a group of criteria to judge whether it is feasible toimplement (time for implementation, complexity, legality, industry support). We have alsoconsidered whether there would be any unintended consequences, and the potentialimpacts on market behaviour.
On the basis of the shortlisting exercise, we have selected the following policy options tobe taken further and analysed. These reflect a range of policies to deliver both long-termsecurity and short-term flexibility, chosen for their anticipated materiality on mitigating thetwo security aspects and their different implications for unintended consequences andmarket behaviour. The five policy options shortlisted are:
restoring I&C interruptible volumes to historic levels;
a minimum distillate obligation requirement;
investment in strategic storage;
a supplier stocking obligation; and
top-up support.

GB GAS SECURITY OF SUPPLY AND OPTIONS FOR IMPROVEMENT
March 2010114_GBGasSecurityOfSupply_200910_v4_0.doc
92
PÖYRY ENERGY CONSULTING
Table 26 – Policy option selection against criteria summary
Red signifies a negative assessment, amber signifies an ambiguous or potentially negative assessment, green signifies apositive assessment.
5.5 Evaluation of shortlisted policy options
The shortlisted policy options are described in detail, below. For each option, we discussits shortlisting criteria and, on the basis of each option’s encapsulated assumptions, weevaluate the potential benefits of each option. These benefits are then compared inSection 5.6 and the analysis is carried forward to draw the conclusions set out in Section5.7. As most of the policy options would rely on the occurrence of specific, pre-definedevents, they have proven to be difficult to model – the models either assume they are orare not available to the market, as set out below:
where the security instrument is deemed available for use at a preordained price, itsuse prevents known quantities of unserved energy;
where the security instrument is deemed available only under specific circumstanceswhich have not been met, the modelling reports no impact; and
where the security instrument is deemed available only under specific circumstanceswhich have been met, its use prevents known quantities of unserved energy.
The specific circumstances need careful definition and consideration alongside existingemergency arrangements.
Tim
efra
me
for
impl
emen
tatio
n
Spe
ed o
fre
spon
se a
t the
time
of n
eed
Com
plex
ity
Pote
ntia
l Vol
ume
Pot
entia
l Pea
kVo
lum
e
Con
trol
mec
hani
smG
ovt v
Mkt
Rel
iabi
lity
Lega
lity
Doe
s it
targ
etfa
ilure
s/ba
rrie
rs?
Indu
stry
sup
port
Un-
inte
nded
cons
eque
nces
Strategic storage Gov't
Extra LNG tanks Gov't
LNG offshore (Spain example) Gov't
Stocking obligation Ofgem
Top-Up contracts – long-term andmedium-term
Centralcontrol
Storage Capacity Buyer of last resort Centralcontrol
Capacity mechanism for gas Centralcontrol
Minimum distillate storagerequirement Ofgem
Coal plant post LCPD Market
Capacity mechanism for Power Market
Restore I&C interruptible volumes Market
End users to bid directly into OCM Market
Live price information for DSRproviders Market
Crisis price incentives e.g. doubleovernight tariff (through smart Gov't
Supplier obligation incentive (1 in 50) Ofgem
Security Obligation Certificate Market
Fiscal incentives – grants,allowances, loans, etc. (counter any Gov't
Cushion gas capital allowance Gov't
Energy efficiency to significantlyreduce demand Gov't
Smart meters Gov't
Improvements to the planningprocess Gov't
More interconnection with & within theEU Gov't
TPA Exemptions Gov't
Gas Quality Gov'tIndi
rect
pol
icie
s an
d re
gula
tory
ince
ntiv
esFi
scal
Phys
ical
sto
rage
opt
ions
Back
-up
fuel
sD
eman
d si
deR
espo
nse
Oth
erdi
rect
secu
rity
polic
ies

GB GAS SECURITY OF SUPPLY AND OPTIONS FOR IMPROVEMENT
March 2010114_GBGasSecurityOfSupply_200910_v4_0.doc
93
PÖYRY ENERGY CONSULTING
Investment appraisal assumptions and asset lives
To express annual expected values in net-present terms we have assumed a discountrate of 3.5%, consistent with HM Treasury’s Green Book.
The actual asset life of a storage facility will depend on the type of the storage facility, andthe component parts of the whole asset will depreciate at different rates. Considering asalt cavity facility as an example: part of the capitalised costs of salt cavern storage wouldinclude the costs of leeching the caverns – once leeched, the caverns will not need re-leeching, so arguably this element of the investment costs should not be depreciated orshould be depreciated over a very long time; another part is the mechanical compressionequipment which might be designed to last 10 to 20 years. Other types of geologicalfacilities – depleted fields and aquifers – have similar constituent parts and thereforerelatively long asset lives; non-geological facilities – LNG or distillate storage – are mainlymechanical in nature and would therefore have much lower asset lives. In general, longerappraisal periods would increase the attractiveness of an investment, as ongoing benefitsare counted for longer.
We have assumed an asset life of 30 years as a reasonable average, and have thereforeused 30 years as the appraisal period for analysing the strategic storage option. Toensure consistency across the evaluations of the policy options, we have assumed 30-year appraisal periods for the other policy options. We note this would be considered tobe a particularly long appraisal period for a commercial investment appraisal and it islonger than appraisal periods used by Ofgem in analysing regulatory impact, however itmight be considered to be a short period for a direct government investment.
5.5.1 Restoring I&C interruptible volumes to historic levels
This policy option seeks to maintain the levels of demand side response that hashistorically been provided by I&C interruptible consumers and so would require the marketto maintain the alternate fuel capability. As stated in Section 2.9.4, the current levels ofalternate capability have been estimated at approximately 10mcm/d; this policy optionwould restore this figure to around 36mcm/d.
Having this extra 26mcm/d of backup supply for a number of days would provide enoughcover to avoid the situation of energy unserved in the 1 in 19 and 1 in 30 probabilities, asoutlined in Section 4.3.3.
The introduction of Mod 90 has not fully taken into account the demand side insurancecontribution provided under the historical I&C interruptible contract. This policy optionwould be to encourage I&C Interruption to remain at historic levels by:
Introducing an auction to provide a demand side insurance incentive on shippers, onbehalf of I&C sites (as the UNC prevents a direct interaction with consumers), whichis independent of the transporters’ needs for capacity constraint interruption.
Allowing the SO to set the level of required volumes for a fixed period, say 5 years,based on its forecast of any gap in severe annual and peak supply and demandpositions. It would then recover any costs from the community as a whole to reflectthe benefit being provided to improve security of supply.
Encouraging I&C sites to maintain their backup supplies and enter into contracts withshippers to provide the DSR capacity to the market.
Logically, there is already a potential incentive on large I&C sites to enter into thesearrangements as these would be amongst the first consumers to be interrupted if there

GB GAS SECURITY OF SUPPLY AND OPTIONS FOR IMPROVEMENT
March 2010114_GBGasSecurityOfSupply_200910_v4_0.doc
94
PÖYRY ENERGY CONSULTING
was a gas supply emergency, for which they would receive very limited recompense.However, the current perception that the market has sufficient supplies available to itmeans that this occurrence is perceived as very rare, so the incentive is negligible.
Implementation might be difficult. All parties will need to reach agreement on the rules tobe followed on establishing any future level of I&C interruption required. Some partiesmay prefer to invest in storage directly under their control rather than accept the unknowncosts arising from an auction, believing this would provide a more appropriate contributionto improving security of supply.
Any party to the UNC could raise a new modification to introduce such a new mechanism.The procedure for raising modification proposals is well established: a high level brief asoutlined here would be sufficient to enable relevant UNC signatories and other interestedparties to collectively finesse a formal proposal, with legal text being commissioned by therelevant gas transporters at the appropriate time. It may also be necessary to modify thelicence of the system operator to establish the obligation it will need to discharge throughthis option.
There is, however, a risk to this policy option as I&C sites may already be planning todecommission and remove their backup facilities. Should it be identified that this policyoption is required then it will need to be progressed quickly, as any delays may reduce theamount of backup capacity available as it will likely be uneconomic to restore removed ordecommissioned facilities.
5.5.1.1 Selection criteria
We consider that the time for implementation would take about a year for the UNCmodification to be developed in full and receive approval, and so any required volumes ofDSR could be achieved before existing facilities are dismantled. The direct investmentcosts for this option would range from being relatively minor if no action is required by I&Csites to the potential for more substantial costs associated with maintaining or returningthe backup facilities and fuel stocks.
5.5.1.2 Evaluation
We have examined the effect of this policy option directly within Prometheus. Theprobability of unserved energy in 2010 would move from 1 in 19 years to 1 in 32 years andin 2025 from 1 in 15 years to 1 in 28 years, as a direct result of returning to historic levelsof I&C interruptible contracts. We also calculate that, with the policy option implemented,the expected value of unserved energy falls from £7.77m per annum to £3.60m perannum (based on 2010), and from £10.0m per annum to £4.56m per annum (based on2025). We therefore calculate benefits of £4.18m per annum in 2010 rising to £5.45m perannum in 2025. This provides a NPV of £95.5m (extrapolating a linear interpolationbetween 2010 and 2025 over 30 years at a discount rate of 3.5%).
If this policy option is implemented before any decommissioning in backup fuel facilitiesare made by I&C interruptible sites and stock levels have not been reduced there shouldbe only limited implementation costs. However, as noted in Section 2.9.4, it is difficult toassess whether stocks have been maintained and so this policy option may requirerestocking investment at the least. We anticipate that initial restocking will require at least125,000 tonnes of distillate stocks, i.e. an investment in stocks of £39m (at £313/tonne asper Section 2.8.4). We do consider there to be significant risk involved in this estimate,such as delivery charges, actual stock levels or reinstating mothballed equipment, so wehave therefore assumed that the investment in distillate would cost between £50m and£125m. This investment would need to be recovered by I&C sites through the auction

GB GAS SECURITY OF SUPPLY AND OPTIONS FOR IMPROVEMENT
March 2010114_GBGasSecurityOfSupply_200910_v4_0.doc
95
PÖYRY ENERGY CONSULTING
process so we would expect to see some price impact in consumer gas prices; however,the average impact to consumers would be very thinly spread and therefore negligible inp/therm.
5.5.2 Minimum distillate obligation requirement
This policy option is based around a mandate that CCGTs must hold specific levels ofdistillate at particular point in time to provide some assurance that there is some short-term flexibility available for a period following that point in time (actual timing and levelsare discussed below). This provides additional, relatively short-lived support to covershorter-term events, and potentially provides a degree of longer-term security if distillatestocks can be replenished. It is a policy that has been adopted in countries that do nothave much gas storage, such as Croatia and even New Zealand, as it is relatively smallscale and short duration.
Placing an obligation on all gas-fired generators to maintain a minimum amount of backupfuel on site would be very difficult to implement, as most existing sites and those underconstruction do not have distillate backup and retrofitting would be very expensive, timeconsuming and in some cases impossible (due to limited space, environmentalconsiderations and planning permission issues). Therefore it is our opinion that it is onlypractical to place the obligation on existing sites that have the facility and new sitescoming on stream in at least 3 or 4 years’ time.
We therefore expect to see an increase in capability implied from the current commercialstock levels of 24mcm/d by 15mcm/d to the capability of 39mcm/d (as identified in Section2.8). This option would therefore cover the energy unserved with 1 in 19 years probability,but not fully cover the occasions with lower probability.
We expect that the mandate would require that at some date prior to the winter existingfacilities will be 100% full of distillate stocks. The variation of the number of days covered,as shown in Table 4 on page 17, means that it would not be possible to have a specificnumber of days that covers all sites. Away from this date, power station operators arefree to utilise their distillate stocks as they see fit, which, given expected gas and coalprices would probably not be used unless there was an issue with gas supply. Whilstalternative options might include applying a profiled minimum stock level or a minimumlevel to apply throughout the winter, similar to the storage monitor, we consider theseoptions would increase the risk of unintended consequences without delivering additionaleffective security.
We expect that the implementation of this policy option would be more involved thanrestoring I&C interruptible volumes to historic levels. The generators with distillate backupwill require compensation for holding these stocks, which may never be used, otherwisethey will be at a disadvantage to those generators that do not have the backup facilities.This could be through the new short-term off-peak capacity product, although this is alsoavailable to all CCGTs.
Portfolio generators may also argue that they have generation at other sites, particularlyuntil 2015, which can provide backup from coal or oil. The other issue is that many of theolder CCGTs that do have backup will be coming to the end of their lives in the next tenyears or so, and may not be around to provide the backup, which is why the mandatewould need to apply to new CCGTs commissioning after 2013 or so.

GB GAS SECURITY OF SUPPLY AND OPTIONS FOR IMPROVEMENT
March 2010114_GBGasSecurityOfSupply_200910_v4_0.doc
96
PÖYRY ENERGY CONSULTING
5.5.2.1 Selection criteria
The policy option has a reasonable timeframe for implementation, and some successes (ahigher level of security) can be obtained relatively quickly. The policy does notnecessarily need to be complex; however, it would need to be considered in the context ofthe electricity market where it may decrease the attractiveness of new CCGT build, andbecause the need for it to provide black-start capability is already covered by existingelectricity market practices. Legal powers already exist to implement this option, andindustry support would very much depend on the cost recovery method.
It has the benefit of being easy to monitor but there are various practical issues to beconsidered such as replenishment capability, which would limit the number of days itwould be available, interactions between the gas and electricity codes, and on whom (i.e.which CCGTs) the obligations should fall.
The direct interaction with the electricity market means that there are potential distortionsin that market as a consequence of this policy, such as the potential for decreasing thegeneral profitability of CCGTs, and with an obligation on new facilities to install distillatebackup the costs of new entry would increase by about 2%.
5.5.2.2 Evaluation
This policy option has a similar benefit per unit volume, at each probability, as the optionto restore I&C interruptible volumes to historic levels described in Section 5.5.1.2 above,although it would provide a smaller DSR volume. This means that the policy optionpresents a benefit of approximately £2.34m per annum (based on 2010) and £3.05m(based on 2025) – a net present value of approximately £53.5m (extrapolating a linearinterpolation between 2010 and 2025 over 30 years at a discount rate of 3.5%).
Just as in restoring I&C interruptible volumes to historic levels we expect initial restockingto require about 100,000 tonnes of distillate stocks, i.e. an investment in stocks of £31m(at £313/tonne as per Section 2.8.4). However, we consider there to be significant riskinvolved in this estimate, as well as delivery charges so we have therefore assumed thatthe investment in distillate would cost between £40m and £100m. This investment wouldneed to be recovered by the generator so we would expect to see some price impact ineither gas prices or electricity prices; however, the average impact to consumers would bevery thinly spread and therefore negligible in p/therm or p/kWh terms.
5.5.3 Strategic storage
The strategic storage policy requires the provision of dedicated storage quantities that areprocured and controlled by Government and used only in specific predefinedcircumstances.
Due to the relatively low volumes of potential unserved energy implied by the analyses inSection 4, we specify this policy option to provide sufficient storage capacity to prevent allunserved energy loss. We therefore consider that a facility (or part of a facility) with acapacity of approximately 0.5bcm with adequate deliverability of around 25mcm/d. Thereare numerous potential candidate projects with known capacity, performancecharacteristics and costs that might provide such storage capacity.
We have considered a number of ways of implementing this policy – via directgovernment investment and control, or through placing an obligation on a third party, suchas National Grid. However, the choice of approaches would not materially effect any high-

GB GAS SECURITY OF SUPPLY AND OPTIONS FOR IMPROVEMENT
March 2010114_GBGasSecurityOfSupply_200910_v4_0.doc
97
PÖYRY ENERGY CONSULTING
level assessment of its costs and benefits, so, for simplicity, we have assumed that thispolicy option is implemented via direct government investment and control.
Following any decision to implement this policy option, HM Government would need toidentify and progress the necessary legal changes and procurement processes, for whichwe expect they would need specific legal advice.
Part of the legal change would be to identify both the framework for exercising the use ofthe facility and the entity with that power, e.g. Ofgem/GEMA, the Health and SafetyExecutive or the National Emergency Coordinator. That framework and entity would alsoneed to establish the precise physical conditions under which the facility could be used,e.g. at demand levels in excess of say 95% of the forecast NTS 1 in 20 peak day wherethere is a supply failure of greater than say 50mcm/d, and how this fits in with theEmergency procedures. We assume that it would be provided to the market at a setprice, reviewed from time to time based on the value of lost load – the analysis in thisdocument implies a price between £2/therm and £5/therm would be appropriate. The gaswould be released via the OCM, which would set the cash-out price and provide a strongincentive to bring gas into the market below this price.
5.5.3.1 Selection criteria
This policy option meets the criteria of providing sufficient volumes and having a clearresponsibility for delivery, but may potentially have the consequence of distorting themarket value of commercial storage and inhibiting the development of such commercialstorage, creating a moral hazard.
This option has the benefit of adding extra volumes of storage to the market, enabling it tomeet low probability/high impact events. However, the additional volumes would not beavailable for commercial use. Selecting underground storage rather than LNG tanks, ortankers offshore, which were also considered, has the benefit of providing physical gaslocated in GB which would not be impacted by external political influences.
It is likely that this option would take several years to build and to deliver security benefits.Defining the arrangements for its deployment might be complex, especially consideringhow it might interface with existing market mechanisms such as the emergency cash-outarrangements. We anticipate that it could garner some industry support; however, wethink that many market participants would be sceptical. This policy option would probablyrequire primary legislation.
Other factors that need to be considered include the costs, financing, and any costrecovery mechanisms (through taxes or a small levy on transportation charges or gasbills), as well as whether and how much the moral hazard might distort the commercialmarket, which are considered below.
5.5.3.2 Evaluation
An examination of a 0.5bcm facility to prevent the lowest probability of unserved energyvolume, would suggest a capital cost of over £0.5bn (based on the recent cost estimatesfor the proposed Baird facility). We have assumed a cost of between £400m and £600mfor such a facility. The financing of the investment might be expected to cost between£22m and £33m per annum (based on 3.5% discount rate over 30 years), which does notcompare favourably against the potential benefits – the expected value of unserved
GB GAS SECURITY OF SUPPLY AND OPTIONS FOR IMPROVEMENT
March 2010114_GBGasSecurityOfSupply_200910_v4_0.doc
98
PÖYRY ENERGY CONSULTING
energy – as estimated in Section 4.3.3.2, of £7.8m to £10m per annum42. We thereforeconclude that investing in strategic storage would be uneconomic.
Whilst this policy option contemplates that the gas would be released to the market at aset price thereby forming a price cap, we would not expect strategic storage to affectnormal market prices which are much lower than this. Therefore, day-to-day volatility,weekend/weekday differentials, seasonality, the relationship to oil prices and the absolutelevels of gas prices would remain unaffected so should therefore not impact theinvestment made by the commercial sector.
5.5.4 Supplier stocking obligation
This policy option places an obligation on each gas supplier to hold sufficient supplies tocover a certain level or proportion of its firm supply. It can be seen as an alternative wayof introducing strategic storage by removing volumes of commercial storage from themarket, so increasing the incentives to introduce more new commercial storage. The lossof existing commercial storage might be expected to increase seasonal spreads andvolatility of prices, thus creating a greater incentive for new investment.
The obligated volumes would be based on the impact of system failure and an objective tomitigate unserved energy. This policy option assumes the same volumes (and thereforemaximum benefits) as the strategic storage option, above, and would therefore place anobligation on each supplier to hold 0.5% of their supply obligations in storage.
Implementation would first need to definitively establish if there were any necessary legalchanges. We consider that Ofgem already have the necessary powers to introduce theseobligations to gas supply licences, and as such we consider that this would be thesimplest route to implementation. In this situation Ofgem would also be in the bestposition to police and audit the obligation. Ofgem may also be responsible for setting theobligatory stocking levels; these might change over time, depending on the perceived riskof a supply shortfall and may be zero for some years. In this case Ofgem would need toindicate future years’ obligation requirements, in order for shippers/developers to havetime to develop more storage facilities.
5.5.4.1 Selection criteria
This option could be implemented reasonably quickly, as obligations could be dischargedthrough the use of existing infrastructure, although the incentives to build new storage tocompensate for the ring fencing of the existing storage would take some time to workthrough. The determination of the obligatory stocking levels might be complex, especiallyif they change from year to year.
Shippers and suppliers could be expected to argue against compulsory obligations, andprimary legislation might be required.
In addition to those considered for strategic storage above, this option would more thanlikely have an unintended consequence of increasing the barrier to entry for small players.This could be overcome by some form of exemption or less onerous obligation for small ornew players.
42 Note that the cost of unserved energy in any one year would be an order of magnitudehigher, but when combined with the probabilities it results in these expected values.

GB GAS SECURITY OF SUPPLY AND OPTIONS FOR IMPROVEMENT
March 2010114_GBGasSecurityOfSupply_200910_v4_0.doc
99
PÖYRY ENERGY CONSULTING
5.5.4.2 Evaluation
We consider that similar benefits could accrue from this option than as for the strategicstorage option – we consider that there is maximum benefits of preventing all unservedenergy – i.e. £7.8m (based on 2010) and £10m (based on 2025) per annum. However,we consider that there might be risks to the benefits associated with this policy option, incomparison to strategic storage, (e.g. supplier non-compliance) and therefore consider itprudent to introduce a lower bound to the benefits of £4m per annum.
As the market-led investment (driven as a consequence of sterilising commercial storage)would take a number of years to materialise, we expect that investment costs would belower in net-present terms. Downward pressure on costs could also be introducedthrough innovation. We have estimated that the resulting investment costs would be inthe region of £500m to £300m in net-present terms.
5.5.5 Top-up support
Top-up is a method initially developed at the start of the Network Code in 1996. Thetransmission system operator would analyse the potential gap between forecastedsupplies and severe demand and procure sufficient supplies/storage to fill the gap frommarket participants. Costs were then smeared across shippers through transportationcharges. This method was set up because British Gas plc was not convinced that the restof the market would deliver gas in severe conditions since the GB market was isolatedand the market rules were relatively new and untested in relation to security of supply.
Top-up was phased out around 2004 by Ofgem because it was felt that the market shouldbe able to provide under suppliers’ 1-in-50 obligations.
Reintroducing some form of top-up support would have a similar objective to the strategicstorage and stocking obligation options, but instead introduces a market based auctionprocess to deliver the cover, which should provide the most efficient combination ofstorage and demand side response. This has the benefit over stocking obligations thatthe costs can be socialised across all suppliers as well as being more flexible in thevolumes required over time.
To satisfy the obligations for new facilities to be developed on time, the national providerwould need to analyse the market conditions and supply availability for a number of yearsahead to give time for new facilities to be built and any shortfall identified against a severedemand level can be filled through an auction process. The auction can be for differenttranches of security of supply volumes as some might be required for a longer period oftime and others might be for a small period whilst new infrastructure is being developed.
5.5.5.1 Selection criteria
This option could be implemented relatively quickly, as the framework for top-uparrangements has already existed in the UNC, although details of the regime mightrequire some industry development. Monopoly regulation issues might make this acomplex option, and we expect that industry support would depend on the resolution ofsuch detail. It is unlikely that this option would require primary legislation to enact;however, implementation would need to comply with the relevant European legislation(e.g. 2003/55/EC).
This option has the advantage of using commercial providers, can be open to variousproviders and may facilitate DSR. However, there will be barriers to overcome such asdefining an acceptable cost smearing mechanism and ensuring compatibility with the gas

GB GAS SECURITY OF SUPPLY AND OPTIONS FOR IMPROVEMENT
March 2010114_GBGasSecurityOfSupply_200910_v4_0.doc
100
PÖYRY ENERGY CONSULTING
balancing mechanism and normal cash-out arrangements. These were majorconsiderations during the removal of the previous top-up arrangements in 2004.
5.5.5.2 Evaluation
We consider that the same benefits would accrue from this option than as for the strategicstorage option, i.e. a maximum of £7.8m (based on 2010) to £10m (based on 2025) perannum. However, we consider it likely that the actual benefit is less than this figure: thegas transporter will have the ability to tailor each year’s top-up requirements to theprevailing conditions and may face regulatory incentives to be conservative in itsestimates. The actual benefit that would be realised by this policy option would thereforebe lower than that suggested by the maximum, and we consider it prudent to introduce alower bound to the benefits of £3m per annum.
Investment driven by the increase in storage capacity bookings would take a number ofyears to materialise, and therefore we expect that investment costs would be lower in net-present terms (as they are incurred later in the appraisal period). Downward pressure oncosts could also be introduced through innovation, and we consider that this policy optionwould be complimentary to the existing operating margins regime, presenting possiblefurther savings. We have estimated that the resulting investment costs would be in theregion of £400m to £200m in net-present terms.
5.6 Policy options cost/benefit comparisons
From the above considerations we have constructed the approximate costs and benefitsincluded in Table 27 below. The table captures the observations of:
reduced cost of expected demand loss – the expected average saving made due tolower probabilities and/or volumes of unserved energy;
NPV of reduced cost of expected demand loss – capturing any changes to the assetbase of the gas industry that are likely to be recovered through long-run marginal costpricing in the market between 2010 and 2025;
other benefits – other benefits that might occur (not quantified);
implementation costs – the administrative costs of implementing the particular policyoption;
investment costs – as would be driven directly or indirectly as a result of the policyoption and be required as an upfront investment;
risks – any risks that have not been quantified and included in the above; and
the net benefits or costs.

GB GAS SECURITY OF SUPPLY AND OPTIONS FOR IMPROVEMENT
March 2010114_GBGasSecurityOfSupply_200910_v4_0.doc
101
PÖYRY ENERGY CONSULTING
Table 27 – Cost/benefit comparisons (2008 prices)
Restore I&Cinterruptible volume
levels
Minimum distillateobligation
Strategicstorage
Stockingobligation
Top-upsupport
+ 26mcm/d + 24 mcm/d 500mcm &25mcm/d
0.5% supplyobligation in
storage
Auction tomeet 1 in 50
3.50% 3.50% 3.50% 3.50% 3.50%30 30 30 30 30
High 4.18 , 5.45 2.34 , 3.05 7.8 , 10 7.8 , 10 7.8 , 10Low 4.18 , 5.45 2.34 , 3.05 7.8 , 10 4.0 , 4.0 3.0 , 3.0High 95.5 53.3 175.7 175.7 175.7Low 95.5 53.3 175.7 73.6 55.2
Other Qualitative Electrical securityand gas price hedge
High 0 0 -3 0 0Low -1 -1 -5 -1 -1High -50 -40 -400 -300 -200Low -125 -100 -600 -500 -400
Risks Regulatoryintervention
Barrier to entry inelectricity market Moral hazard Moral hazard,
barrier to entryMoral
hazardHigh 45 13 -227 -124 -24Low -31 -48 -429 -427 -246Net benefits (costs) (£m)
Costs (£m)Implementation
Investment
Policy Option
NPV of reduced cost of expecteddemand loss (£m)
Benefits
Assumptions Discount rateAppraisal period (years)
Reduced cost of expected demandloss (£m in 2010, £m in 2025)
5.7 Policy option conclusions
Existing policies such as the 2020 energy efficiency and renewables targets are alreadydelivering significant security of supply benefits, primarily through reducing gas demandinto the future. As UKCS supplies decline, importation facilities that are alreadyconstructed or committed are available to meet demand – gas will flow subject to pricesignals, which is enabled through the liberal nature of the gas market. We thereforeconclude that the existing policies are positively contributing to the security of the GB gasmarket.
Our modelling indicates that, given the volume and diversity of supplies, the risk of asupply shortfall and unserved energy occurring is 1 in 19 years with 2010 supply anddemand assumptions and 1 in 15 years with 2025 assumptions, which include very littleadditional supply and storage capacity compared to what we have now. We calculate thatthe amount of unserved energy would be relatively small in these events and could becovered completely by an additional 500mcm of storage over and above that alreadycommitted with deliverability of around 25mcm/d.
Further improvements to security of supply might be found from two broad areas: long-term, large volume strategic facilities designed to provide significant volumes over alonger period; and shorter-term, rapidly available facilities designed to overcome periodsof short term stress. We have examined 24 potential policy options targeted at improvingsecurity of supply.
The major policy of HM Government directly investing in strategic gas storage would beexpensive and does not, based on the analysis in this report, provide sufficient benefit inimproving security of supply to justify its costs.
Of all the policy options examined, two options perhaps warrant further consideration:
restoring I&C interruptible volumes to historic levels and so utilising the capability ofthem using alternatives to their gas supply; and

GB GAS SECURITY OF SUPPLY AND OPTIONS FOR IMPROVEMENT
March 2010114_GBGasSecurityOfSupply_200910_v4_0.doc
102
PÖYRY ENERGY CONSULTING
introducing new obligations on some or all large gas-fired power generators to installand maintain backup fuel facilities and to keep and maintain backup fuel stocks.
Of these two policy options, restoring I&C interruptible volumes to historic levels, whilstthere would be various regulatory issues in implementing, would have the effect of halvingany risk of unserved energy.
We also believe that introducing new obligations on existing and/or new CCGTs wouldhave some challenges: there are potentially significant unintended consequences themitigation of which might lead to complexity; and it might prove much more difficult to gainsupport from industry. We note that existing market mechanisms in the electricity marketprovide some incentive to invest in alternative fuel capability, and would urge that cautionis applied to any market changes (gas or electricity) which might decrease these smallincentives. We also consider that introducing an involuntary obligation on CCGTs mightincrease the perception of regulatory risk and increase barriers in the electricity industry.
However, recognising the significant contribution to gas security of supply provided byCCGTs, should the levels of cover be reduced, either by the decommissioning of backupfacilities at existing stations, or insufficient capacity being built at new sites, policy makerswill need to consider whether there is a requirement to introduce new obligations to installand maintain backup distillate facilities and stocks.
Given that all the potential commercial storage facilities being considered are larger thanthe potential shortfall that emerges from our analysis, a number of influences – theimprovements in the planning process, the tax allowances on cushion gas already in placeand the potential increase in volatility from CCGT demand following the introduction ofmore wind generation – should provide incentives for at least one of the projects to goahead, making the need for the other options unnecessary.
We therefore recommend that no new major policies are introduced in an attempt toincrease the security of the GB gas market.
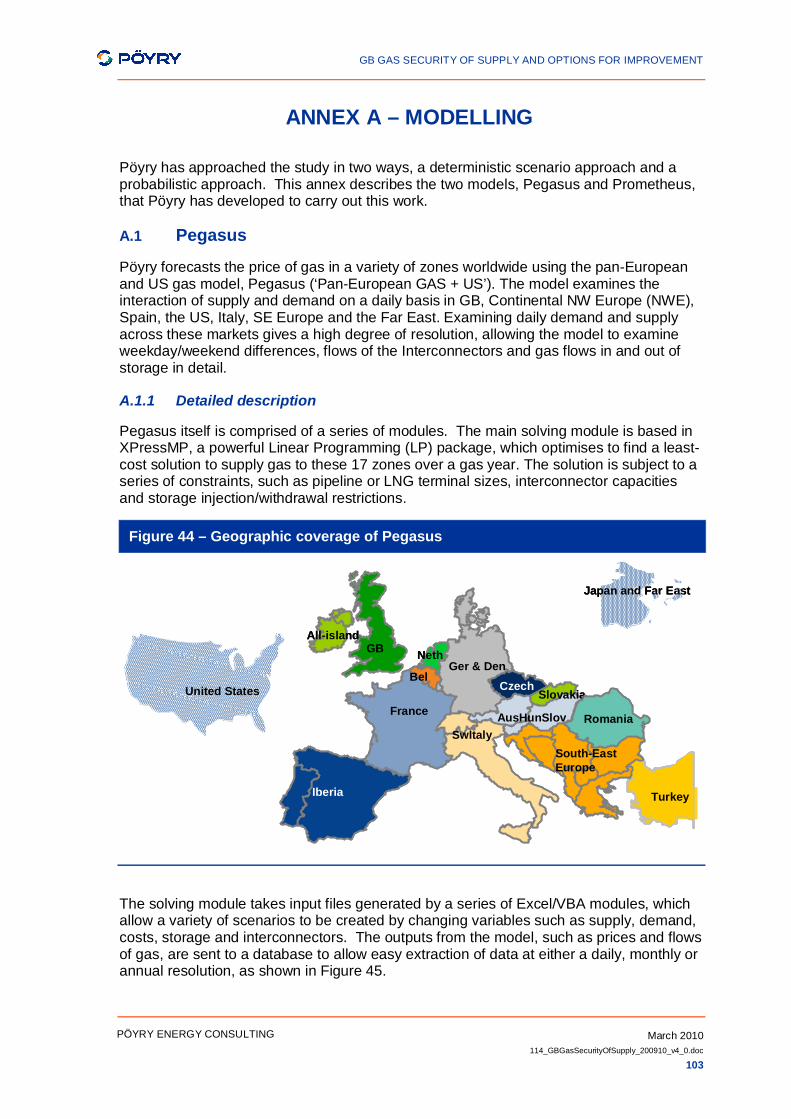
GB GAS SECURITY OF SUPPLY AND OPTIONS FOR IMPROVEMENT
March 2010114_GBGasSecurityOfSupply_200910_v4_0.doc
103
PÖYRY ENERGY CONSULTING
ANNEX A – MODELLING
Pöyry has approached the study in two ways, a deterministic scenario approach and aprobabilistic approach. This annex describes the two models, Pegasus and Prometheus,that Pöyry has developed to carry out this work.
A.1 Pegasus
Pöyry forecasts the price of gas in a variety of zones worldwide using the pan-Europeanand US gas model, Pegasus (‘Pan-European GAS + US’). The model examines theinteraction of supply and demand on a daily basis in GB, Continental NW Europe (NWE),Spain, the US, Italy, SE Europe and the Far East. Examining daily demand and supplyacross these markets gives a high degree of resolution, allowing the model to examineweekday/weekend differences, flows of the Interconnectors and gas flows in and out ofstorage in detail.
A.1.1 Detailed description
Pegasus itself is comprised of a series of modules. The main solving module is based inXPressMP, a powerful Linear Programming (LP) package, which optimises to find a least-cost solution to supply gas to these 17 zones over a gas year. The solution is subject to aseries of constraints, such as pipeline or LNG terminal sizes, interconnector capacitiesand storage injection/withdrawal restrictions.
Figure 44 – Geographic coverage of Pegasus
France
Iberia
All-island
Ger & DenNeth
Bel
SwItalyAusHunSlov
South-EastEurope
SlovakiaCzech
Romania
Turkey
Japan and Far East
United States
GB
France
Iberia
All-island
Ger & DenNeth
Bel
SwItalyAusHunSlov
South-EastEurope
SlovakiaCzech
Romania
Turkey
Japan and Far East
United States
GB
The solving module takes input files generated by a series of Excel/VBA modules, whichallow a variety of scenarios to be created by changing variables such as supply, demand,costs, storage and interconnectors. The outputs from the model, such as prices and flowsof gas, are sent to a database to allow easy extraction of data at either a daily, monthly orannual resolution, as shown in Figure 45.

GB GAS SECURITY OF SUPPLY AND OPTIONS FOR IMPROVEMENT
March 2010114_GBGasSecurityOfSupply_200910_v4_0.doc
104
PÖYRY ENERGY CONSULTING
Figure 45 – Structure of Pegasus
Interconnector sizeCost of transiting gas
InterconnectionDaily demand
Demand
CapacityInjection rate
Withdrawal rateInjection/withdrawal cost
Storage inputs
35 storage facilities
Field outputUpstream cost
Pipeline capacityTransportation cost
Pipeline inputs
59 pipelines
Liquefaction capacityLiquefaction costTerminal capacity
Transportation cost
LNG inputs
26 sources58 terminals
Solving engine
Resultsdatabase
Gas flows acrossinterconnectors
Gas flows thoughLNG terminalsand pipelines
Daily pricesGas flows in/out
of storage
Marginal cost ofstorage and
interconnection
22 interconnectors14 zones
Interconnector sizeCost of transiting gas
InterconnectionDaily demand
Demand
CapacityInjection rate
Withdrawal rateInjection/withdrawal cost
Storage inputs
35 storage facilities
Field outputUpstream cost
Pipeline capacityTransportation cost
Pipeline inputs
59 pipelines
Liquefaction capacityLiquefaction costTerminal capacity
Transportation cost
LNG inputs
26 sources58 terminals
Solving engine
Resultsdatabase
Gas flows acrossinterconnectors
Gas flows acrossinterconnectors
Gas flows thoughLNG terminalsand pipelines
Gas flows thoughLNG terminalsand pipelines
Daily pricesDaily pricesGas flows in/out
of storageGas flows in/out
of storage
Marginal cost ofstorage and
interconnection
Marginal cost ofstorage and
interconnection
22 interconnectors14 zones
A.1.2 Interconnection and storage
Interconnection through between zones is a key part of the modelling in Pegasus. Forexample, the BBL and IUK interconnectors between GB and Continental Europeanmarkets are important given the influence of oil-indexed long-term contracts. Theoptimisation algorithm in Pegasus minimises the cost of supplying gas to all market zones,subject to both the capacity and the cost of transiting gas across the interconnectors. Thistends to lead to imports into GB during winter to supply the peaky GB winter demand, andexports from GB during summer. These patterns naturally change over time with differingassumptions on gas cost and new import projects and their location. The daily resolutionin the model means that during the shoulder months, the interconnectors ‘flip-flop’ backand forth between import and export – exactly as we have seen historically.Interconnection between each of the demand zones is also modelled in the same manner.
Modelling storage accurately is key to understanding price formation in the worldwidezones, as it affects both summer and winter prices, along with weekday/weekend prices.Pegasus models each current and forecast GB gas storage field, each with its owninjection and withdrawal rates, total storage capacity and cost of injection/ withdrawal.The optimisation algorithm used not only means that gas is injected into storage duringthe summer and withdrawn during the winter, as expected, but also that injection takesplace for high cycle facilities during the winter weekends and Christmas periods due tolower demand, as seen in reality.
We also model European and US storage in three generic types – depleted field, saltcavern and LNG. This lower level of detail is sufficient for other countries storage due tothe non-commercial nature and opaqueness of use of much of the storage facilities.

GB GAS SECURITY OF SUPPLY AND OPTIONS FOR IMPROVEMENT
March 2010114_GBGasSecurityOfSupply_200910_v4_0.doc
105
PÖYRY ENERGY CONSULTING
A.1.3 LNG modelling
To model LNG accurately, gas is split into ‘LNG sources’ (e.g. Qatar, Oman, Nigeria) and‘LNG terminals’ (e.g. Isle of Grain, Dragon, South Hook). Subject to known contractualconstraints, LNG cargoes can be ‘delivered’ from any source to any LNG terminal. As aresult, LNG cargoes can be delivered to different destinations depending on which marketis most profitable for a particular cargo – for example, LNG will deliver preferentially toMontoir or Zeebrugge when prices are higher in NW Europe than in GB. Thus the NWEuropean market can be linked to GB market not just through the interconnectors but alsovia LNG arbitrage. Furthermore, the interaction with the US, Italy and Spain means thatall markets can become linked together via LNG and pipelines.
The cost of LNG transportation takes into account the distance between the points wheregas is delivered, along with assumptions on oil price (for fuel costs), and reductions inshipping costs.
A.1.4 Gas cost
Pegasus can model worlds where oil-indexation or gas-on-gas competition is the majordriving forces in the market. For oil-indexed contracts, either LNG or pipeline, althoughspecific oil-indexed contracts can be added to any given route, given the confidentialnature of most contracts, generic oil-indexation contracts reflecting knowledge of the likelymarket where gas is delivered are typically used.
For worlds where gas-on-gas competition becomes a major driver of price formation,Pöyry assesses the long-run marginal cost of different gas supplies and transportationcosts to model the prices that gas could be delivered to market.
A.1.5 Demand forecasts and profiles
As a core part of our modelling, we carry out iterations with our electricity model tounderstand the effect of changes in gas price on demand for gas, and changes in demandfor gas on price. This iteration between the two models ensures that our assumptions ongas prices and gas demand remain realistic and reflects the elasticity of gas demandgiven high gas prices.
Our daily gas demand profiles reflect the known factors in the market, including weekendand weekday differentials, Christmas and summer shutdowns, and winter demand peaksdue to space heating or summer peaks due to CCGT loads for air conditioning.
A.2 Prometheus
Pöyry has developed the ‘Prometheus’ model for examining the effects of unexpectedand/or extreme events on the GB gas market. At its core, Prometheus uses the sameoptimisation criteria as our deterministic gas model, Pegasus; however, Prometheus isnotably different in two ways. Firstly, it includes a stochastic model of the GB gas marketthat captures the likelihood and magnitude of a variety of natural, technical and politicalevents. Secondly, to avoid a massive computation problem, we have simplified the levelof interconnection by decreasing the number of zones from 17 in the deterministicmodelling to four in the stochastic modelling.
In effect, Prometheus models a simple four-zone Atlantic gas market, and drivesthousands of scenarios though the Pegasus engine.

GB GAS SECURITY OF SUPPLY AND OPTIONS FOR IMPROVEMENT
March 2010114_GBGasSecurityOfSupply_200910_v4_0.doc
106
PÖYRY ENERGY CONSULTING
This section sets out some of the detailed assumptions used within the Prometheusmodel.
A.2.1 Demand variation
We have modelled demand variations to replicate the daily weather severityconsiderations of National Grid Gas plc (NGG), who regularly publishes daily demandforecasts based on seasonal normal, warm and cold weather profiles. The warm and coldprofiles are stated by NGG as being at 1 in 20 weekly values, and are based on theGumbel-Jenkinson distribution43.
We have used the Average and Severe annual demand forecasts, as described in Section2.6.1. Within Prometheus, we apply these as 50th and 98th percentiles of the Gumbel-Jenkinson distribution to generate a range of annual demand figures. Figure 46 belowshows the cold and warm profiles used in the model (corrected for weekend/weekday).
Figure 47 shows the Gumbel-Jenkinson distribution for a sample day –17 December 2010– with the 5th, 50th, 95th and 98th percentiles highlighted.
This distribution is then used to scale each iteration of the daily demands (generated bytheir distributions). Sample annual demands at daily resolution, representing particularaverage and high samples, are presented in date order in Figure 48, and as a durationcurve in Figure 49.
Figure 46 – GB Demand profiles
0
50
100
150
200
250
300
350
400
450
500
Oct
Nov
Dec Ja
n
Feb
Mar
Apr
May Ju
n
Jul
Aug
Sep Oct
Date
Dem
and
(mcm
d)
Cold (95th percentile)Warm (5th percentile)
17th December
43 The Gumbel-Jenkinson distribution, also known as the extreme values distribution, is aprobability distribution specifically constructed to enable the examination of extreme events.

GB GAS SECURITY OF SUPPLY AND OPTIONS FOR IMPROVEMENT
March 2010114_GBGasSecurityOfSupply_200910_v4_0.doc
107
PÖYRY ENERGY CONSULTING
Figure 47 – GB Demand distribution for 17th December 2010
Warm demand 278.3 mcmd5th percentile
Cold demand 417.1 mcmd95th percentile
250 300 350 400 450 500 550 Demand (mcmd)
Prob
abili
ty
Expected demand335.6 mcmd
Very cold demand 448.9 mcmd98th percentile
Figure 48 – Sample daily demand tracks (2010)
0
100
200
300
400
500
600
Oct Nov Dec Jan Feb Mar Apr May Jun Jul Aug Sep Oct
Date
Dem
and
(mcm
d)

GB GAS SECURITY OF SUPPLY AND OPTIONS FOR IMPROVEMENT
March 2010114_GBGasSecurityOfSupply_200910_v4_0.doc
108
PÖYRY ENERGY CONSULTING
Figure 49 – Sample load duration curves (2010)
0
100
200
300
400
500
600
1 21 41 61 81 101 121 141 161 181 201 221 241 261 281 301 321 341 361
Day number
Dem
and
(mcm
d)
A.2.2 Oil
The historical variation of oil prices is very large. We expect that, if we were toaccommodate such historical variation within the Prometheus model meaningful resultsregarding security and resilience to other factors might be obscured. We have thereforeconstrained the consideration of oil prices to be uniformly distributed within the bounds of+/- $20/bbl. The oil price distribution is used within the model to drive the pricing of oil-indexed take-or-pay contracts within the supply curve.
A.2.3 Other supply curve influences
For the purposes of the probabilistic modelling used within Prometheus, we have allowedfor a small uncertainty in the long-run and short-run marginal cost assumptions byassuming they are normally distributed with 95th and 5th percentiles at +/- 10%.
We have applied a similar modest uncertainty for CCGT distillate response and otherdemand response, demonstrated in Figure 50 below. For values of lost load that havebeen determined by examining GVA we have assumed that these levels are fixed.

GB GAS SECURITY OF SUPPLY AND OPTIONS FOR IMPROVEMENT
March 2010114_GBGasSecurityOfSupply_200910_v4_0.doc
109
PÖYRY ENERGY CONSULTING
Figure 50 – Distribution of gas prices for switching to distillate
0
0.02
0.04
0.06
0.08
0.1
0.12
0.14
0.16
0.18
0.2
70 75 80 85 90 95 100 105 110 p/therm
A.2.4 Sampling methodology
Prometheus uses a Latin Hypercube approach to sampling from the input distributions.This ensures that an appropriate combination of values is sampled from each distribution,such that the ‘tails’ of resulting distributions can be analysed more effectively. Were amore traditional Monte Carlo approach to be adopted there would be no guarantee thatextreme values would be sampled, and therefore resultant statistics, especially thosedriven by rare events, could be misleading.
A.2.5 Other impacts
Pegasus models the availability of gas supply to GB on a global basis: that is to say gassupply by pipeline is available from Europe, and LNG supplies are available to be divertedfrom Europe or the US markets. One consequence of this interconnectedness is thatevents in markets outside GB could potentially have an impact on the GB market.
The biggest single event that has been identified would be for severe winter weather inthe US to increase US demand for gas and potentially divert LNG cargos away from GB.At the very least this is likely to raise the price of gas in the GB market.

GB GAS SECURITY OF SUPPLY AND OPTIONS FOR IMPROVEMENT
March 2010114_GBGasSecurityOfSupply_200910_v4_0.doc
110
PÖYRY ENERGY CONSULTING
[This page is intentionally blank]

GB GAS SECURITY OF SUPPLY AND OPTIONS FOR IMPROVEMENT
March 2010114_GBGasSecurityOfSupply_200910_v4_0.doc
111
PÖYRY ENERGY CONSULTING
ANNEX B – OTHER ASSUMPTIONS AND PÖYRY’SCENTRAL SCENARIO
B.1 Other assumptions
B.1.1 Oil Prices
We have used DECC’s 2009 price assumptions for Brent crude, as presented in Table 28.
Table 28 – Brent oil price assumptions(US$/bbl, Real 2008)
Central2010 70.002015 75.002020 80.002025 85.00
Source: DECC
B.1.2 Exchange rate assumptions
Similarly, we have used DECC 2009 exchange rate assumptions, as shown in Table 29.
Table 29 – Nominal exchange rates
€/US$ £/US$ €/£2010 1.35 1.46 0.922015 1.39 1.60 0.872020 1.39 1.60 0.872025 1.39 1.60 0.87
Source: DECC
B.1.3 Government policy assumptions
For all our scenarios, we assume that the government introduces no additional measures,other than those it has already instigated, such as: renewables, energy efficiency andcarbon targets for 2020, support for transparent third party access to pipelines acrossEurope, improved strategic planning application process, compliance with the largecombustion plant directive and introduction of smart meters.
In this ‘do nothing’ world, the commercial market is left to operate without any interferencebeyond the existing regulatory regime.
B.1.4 Costing and revenue recovery assumptions
Pöyry maintains a database of costs associated with all investments in and the operationsof physical infrastructure with the information coming from published figures and from dataprovided by clients across Europe. These include the capital costs, annual operating

GB GAS SECURITY OF SUPPLY AND OPTIONS FOR IMPROVEMENT
March 2010114_GBGasSecurityOfSupply_200910_v4_0.doc
112
PÖYRY ENERGY CONSULTING
costs, and refilling costs where appropriate. These are then projected to give a long-runmarginal cost (‘LRMC’) figure for each facility and transport route, which is then used byPegasus in identifying the least cost supply to meet demand.
We also maintain a record of publicly available details of long-term contracts, which arealso used in the model to set prices along certain routes based on oil indexation. Pricelevels in the receiving markets are then set by the marginal sources, whether it is theLRMCs or oil-index contracts, depending on the take-or-pay commitments, availableuncommitted supplies and transportation capacity.
B.2 Pöyry’s central demand scenario
This scenario uses Pöyry GB gas demand growth assumptions from our latest ILEXEnergy report ‘Study of the GB Gas Market’, with updated prices January 2009. A full listof the ILEX Energy reports available across Europe is given in Annex E.
In general this sees European demand (I&C and residential) rising and new projects comeon in a timely manner to meet new demand. Some LNG comes to Europe, but in themedium-term new competition from LNG is limited. Russia continues to provide the lion'sshare of European imports, but there is some success in Caspian states’ marketingactivities, and some pipeline import competition begins to develop, but despite sustaineddevelopment of hubs and trading, prices remain dominated by oil-indexed contractsacross Europe. There is some seasonality due to trading (which minimises take-or-pay)and storage costs.
B.2.1 GB demand projections
Pöyry use percentage growth rates to project I&C and residential demand. Across Europewe have used growth rates from the EC’s ‘European Energy and Transport – Trends to2030’ as a guide, and to model the impact of the current recession we have furtherreduced growth estimates in 2009 and 2010. CHP, and other categories of gas use,follow the same trend as I&C and residential, while offshore own use declines in line withUKCS production. The growth rates are shown in Table 30.
Table 30 – Growth factors for GB
2010-15 2015-20 2020-25
CHP 0.5% -0.5% 0.3%Industrial 0.5% -0.5% 0.3%Commercial 0.5% -0.5% 0.3%Residential 0.5% -0.5% 0.3%Offshore own use -8.0% -8.0% -8.0%Other 0.5% -0.5% 0.3%
So GB demand projections using Pöyry’s GB gas demand growth assumptions, which arealso reflective of partly meeting the 2020 renewables targets, is shown in Figure 51.

GB GAS SECURITY OF SUPPLY AND OPTIONS FOR IMPROVEMENT
March 2010114_GBGasSecurityOfSupply_200910_v4_0.doc
113
PÖYRY ENERGY CONSULTING
Figure 51 – GB demand projections
0
20,000
40,000
60,000
80,000
100,000
120,000
2005 2010 2015 2020 2025
mcm
Other
Offshore own use
Residential
Commercial
Industrial
CHP
Power gen. (ex CHP)
B.2.2 Power generation
Demand for gas in large-scale power generation is taken from Pöyry’s electricity modelEurECA as used in the ILEX Energy report ‘Projections of the Price of WholesaleElectricity in Great Britain’ February 2009 edition. The gas prices from Pegasus areiterated through EurECA to provide consistent gas demand from power generationfigures.
In the electricity central scenario we assumed carbon prices slowly rise upwards until theyreach a long-term (Phase III) price of €25/ tCO2 in 2013 and in Phase IV they rise further,driven by the economics of CCS coal, and reach €40/ tCO2 by 2030. We assume coalprices (in 2008 money) in 2010 of £2.85/GJ decreasing to £2.56/GJ, excluding anydelivery cost from the entry point to the power station, as this cost changes on a plant-by-plant basis. On average, for inland coal plants in GB we assume a delivery cost of£0.35/GJ and £0.26/GJ for coastal plants.
Electricity demand is based on average growth and reflects National Grid’s central view ofthe future from their Seven Year Statement from 2009 to 2015. Beyond 2015, we usedemand growth projections based on the ‘European Trends in Energy and Transport,Trends 2007–2030’, which presents projections of growth in electricity. The rate of growthsubsides from National Grid levels in 2015 to 0.5% p.a. by 2030. Peak electricity demandis projected using the system load factor projections by National Grid, with the systemload factor then held constant after 2015.
Figure 52 shows the generation mix within GB, which includes 17.6GW of new build by2020 of which 8.7GW is CCGT, 1.7GW is CCGT CHP, 1.6GW is coal, 1.6GW is nuclearand 3.2GW is OCGT (reflecting the peak requirements from the intermittent nature of thenew renewable generation).
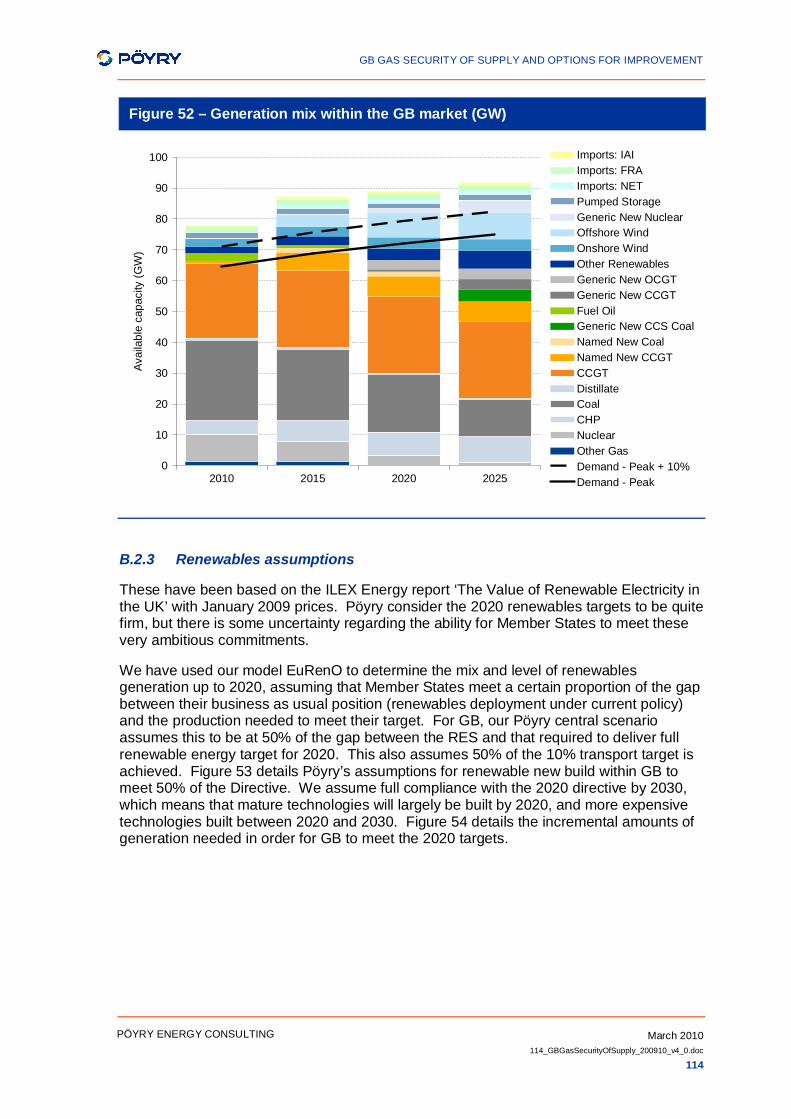
GB GAS SECURITY OF SUPPLY AND OPTIONS FOR IMPROVEMENT
March 2010114_GBGasSecurityOfSupply_200910_v4_0.doc
114
PÖYRY ENERGY CONSULTING
Figure 52 – Generation mix within the GB market (GW)
0
10
20
30
40
50
60
70
80
90
100
2010 2015 2020 2025
Avai
labl
e ca
paci
ty (G
W)
Imports: IAIImports: FRAImports: NETPumped StorageGeneric New NuclearOffshore WindOnshore WindOther RenewablesGeneric New OCGTGeneric New CCGTFuel OilGeneric New CCS CoalNamed New CoalNamed New CCGTCCGTDistillateCoalCHPNuclearOther GasDemand - Peak + 10%Demand - Peak
B.2.3 Renewables assumptions
These have been based on the ILEX Energy report ‘The Value of Renewable Electricity inthe UK’ with January 2009 prices. Pöyry consider the 2020 renewables targets to be quitefirm, but there is some uncertainty regarding the ability for Member States to meet thesevery ambitious commitments.
We have used our model EuRenO to determine the mix and level of renewablesgeneration up to 2020, assuming that Member States meet a certain proportion of the gapbetween their business as usual position (renewables deployment under current policy)and the production needed to meet their target. For GB, our Pöyry central scenarioassumes this to be at 50% of the gap between the RES and that required to deliver fullrenewable energy target for 2020. This also assumes 50% of the 10% transport target isachieved. Figure 53 details Pöyry’s assumptions for renewable new build within GB tomeet 50% of the Directive. We assume full compliance with the 2020 directive by 2030,which means that mature technologies will largely be built by 2020, and more expensivetechnologies built between 2020 and 2030. Figure 54 details the incremental amounts ofgeneration needed in order for GB to meet the 2020 targets.

GB GAS SECURITY OF SUPPLY AND OPTIONS FOR IMPROVEMENT
March 2010114_GBGasSecurityOfSupply_200910_v4_0.doc
115
PÖYRY ENERGY CONSULTING
Figure 53 – Assumed renewable new build within Pöyry central case for GB
0
20
40
60
80
100
120
140
2010 2015 2020 2025
Ann
ual T
Wh
by te
chno
logy
Tidal Stream
Wave
Small Hydro
Large Hydro
Biogas
Biowaste
Biomass
Offshore Wind
Onshore Wind
Figure 54 – Amount needed to meet the 2020 target
0
10
20
30
40
50
60
70
Ons
hore
Win
d
Offs
hore
Win
d
Bio
mas
s
Bio
was
te
Biog
as
Sola
r PV
Sol
ar T
herm
al
Larg
e H
ydro
Smal
l Hyd
ro
Geo
ther
mal
Wav
e
Tida
l Stre
am
Bio
mas
s H
eat N
on G
rid
Bio
mas
s H
eat G
ridC
onne
cted
Sola
r Hea
t
Geo
ther
mal
Hea
t
Gro
und
Sou
rce
Hea
t Pum
ps
Ren
ewab
les
depl
oym
ent (
TWh/
year
in 2
020)
Unused potentialIncremental to meet the 2020 targetBAU 2010-2020BAU 2010

GB GAS SECURITY OF SUPPLY AND OPTIONS FOR IMPROVEMENT
March 2010114_GBGasSecurityOfSupply_200910_v4_0.doc
116
PÖYRY ENERGY CONSULTING
[This page is intentionally blank]

GB GAS SECURITY OF SUPPLY AND OPTIONS FOR IMPROVEMENT
March 2010114_GBGasSecurityOfSupply_200910_v4_0.doc
117
PÖYRY ENERGY CONSULTING
ANNEX C – GAS SECURITY OF SUPPLY STANDARDS ACROSS EUROPE
GasStorageCapacity
2006(mcm)
Gas StorageDeliverability
(mcm/day)
Country Source: GSE & Pöyry
Total GasConsumpti
on 2006(mcm)
AccessType Security of Supply Standard
RelevantStatistic
Gas in Storageused for SoSas % of Total
Storage
Austria 4230 49 8,909 nTPA The Austrian transmission system is divided into3 areas, each under the control of anIndependent System Operator, one of whom isappointed Regional Control Leader (RCL). TheRCL co-ordinates across the entire transmissionsystem, and alerts the relevant governmentministry in case of a supply crisis. The ministrythen imposes instructions to the relevant systemparties (producers, transporters, storageoperators and end users) to alleviate the supplycrisis. There is no explicit storage monitoring.
Belgium 684 23 16,465 rTPA The TSO, Fluxys, has a mandated public serviceobligation (PSO) to be able to supply alluninterruptible customers in the case of severetemperatures that would occur based on thewinter of 1962/3 or 5 consecutive days withtemperature < -11ºC. For this purpose Fluxysmaintains reserved "strategic storage" (gas andcapacity), which are charged to users throughtransmission tariffs.
Uninterruptiblecustomervolume at1962/3 winterseverity or 5days with temp< -11ºC

GB GAS SECURITY OF SUPPLY AND OPTIONS FOR IMPROVEMENT
March 2010114_GBGasSecurityOfSupply_200910_v4_0.doc
118
PÖYRY ENERGY CONSULTING
GasStorageCapacity
2006(mcm)
Gas StorageDeliverability
(mcm/day)
Country Source: GSE & Pöyry
Total GasConsumpti
on 2006(mcm)
AccessType Security of Supply Standard
RelevantStatistic
Gas in Storageused for SoSas % of Total
Storage
Bulgaria 350 3.3 3,578 No TPA Similar arrangement to Belgium and Denmarkwhereby the TSO has an obligation to acquirestorage capacity and gas to meet a PSO relatedto customer demand under defined temperaturescenarios.
Croatia 550 2,785 No TPA Backup HFO and LFO stocks made available toindustrial users in emergency and regular stocksfrom public utilities, as defined by governmentregulation. Storage capacity comprises0.55bcm and 4.8mcm/d.
CzechRepublic
2321 36 9,325 nTPA Similar arrangement to Belgium and Denmarkwhereby the TSO has an obligation to acquirestorage capacity and gas to meet a PSO relatedto customer demand under defined temperaturescenarios.
Denmark 1001 16 5,933 nTPA TSO is obliged to procure storage capacity tomeet demand of non-interruptible customers at60-days at normal winter temps, 3-days at -14ºC(equivalent to 1 in 50 peak day). Shippersrequired to keep a certain % of gas storageduring winter months. Shippers are required toprocure sufficient storage capacity to meetdemands of non-interruptible customers
60-days firm atnormal wintertemps, 3-daysat -14 ºC(equivalent to 1in 50 peak day)

GB GAS SECURITY OF SUPPLY AND OPTIONS FOR IMPROVEMENT
March 2010114_GBGasSecurityOfSupply_200910_v4_0.doc
119
PÖYRY ENERGY CONSULTING
GasStorageCapacity
2006(mcm)
Gas StorageDeliverability
(mcm/day)
Country Source: GSE & Pöyry
Total GasConsumpti
on 2006(mcm)
AccessType Security of Supply Standard
RelevantStatistic
Gas in Storageused for SoSas % of Total
Storage
France 12255 266 44,644 nTPA Shippers supplying domestic & public interestcustomers are required to withstand a loss ofmain supply for a 6-month period under normalweather conditions, to ensure supplies for both a1-in-50 winter and an extremely cold period – a3-day 1-in-50 period. Ensure availability toalternative sources (storage, short-termcontracts, LNG, etc.)
1-in-50 winterand 1-in-503-day period.
85% of theircapacity rightsin store
Germany 19993 331 102,990 nTPA Suppliers have a legal requirement to takereasonable steps as prudent operators to ensuresecurity of supply for their customers undernormal and exceptional conditions, with severepenalties for failure. This obligation isdischarged via contracts with TSOs and storageoperators/providers.
None None

GB GAS SECURITY OF SUPPLY AND OPTIONS FOR IMPROVEMENT
March 2010114_GBGasSecurityOfSupply_200910_v4_0.doc
120
PÖYRY ENERGY CONSULTING
GasStorageCapacity
2006(mcm)
Gas StorageDeliverability
(mcm/day)
Country Source: GSE & Pöyry
Total GasConsumpti
on 2006(mcm)
AccessType Security of Supply Standard
RelevantStatistic
Gas in Storageused for SoSas % of Total
Storage
Hungary 3720 51 14,202 rTPA Both concepts of PSO storage (currently 76% oftotal storage is reserved for this purpose) andstrategic storage (in 2008, 5% of storage or 0.2bcm). It is planned that the strategic storagevolume will be increased to 1.2 bcm by January2010, with daily withdrawal capacity of 20 mcmavailable for at least 45 consecutive days(corresponding to the average winter residentialdemand). The Hungarian government isplanning for the strategic storage to be operatedby an association established specifically for thispurpose comprising all the major industryplayers, who will pay a fee based on theirsystem throughput. The use of the strategicstorage is authorised by the government basedon notification by the TSO or energy ministry.
Total strategicdeliverability of20 mcm/d.Total PSOstorage of 76%total storage(2.82 bcm in2008)
0.2 bcm (5% of2008 totalstorage) –increasing to1.2 bcm inJanuary 2010
Italy 14335 253 84,484 rTPA Approx 40% of storage is reserved for StrategicStorage, whose release is controlled by theministry. Additionally there is a legal obligationon each importer to maintain 10% of its importrequirements in storage (minimum quantityspecified by Ministry for Industry each year).Also there a number of short-term measures.
~40% ofstoragereserved forstrategicstorage

GB GAS SECURITY OF SUPPLY AND OPTIONS FOR IMPROVEMENT
March 2010114_GBGasSecurityOfSupply_200910_v4_0.doc
121
PÖYRY ENERGY CONSULTING
GasStorageCapacity
2006(mcm)
Gas StorageDeliverability
(mcm/day)
Country Source: GSE & Pöyry
Total GasConsumpti
on 2006(mcm)
AccessType Security of Supply Standard
RelevantStatistic
Gas in Storageused for SoSas % of Total
Storage
Netherlands 5078 177 47,804 nTPA Shippers must have contracts in place to meetdemand of small customers down to -9ºC. TheTSO, GTS, is required to protect supplies tosmall customers during extremely cold winters. Itprocures storage gas to meet their increaseddemand when temperatures drop below -9ºC(down to -17ºC). Shippers pay for the abovearrangements through a PSO tariff.
Requiredstorage volumedown to -17ºC t
Requiredstorage volumeis temperaturedependent
Poland 1,575 34 16,336 No TPA As from 2012, parties importing gas into Polandwill be obliged to keep 30 days worth of theiraverage daily import in store. This totalobligatory storage must be stored in facilitieswhich allow the total export of the gas to thesystem within 40 days. The regulator overseesthe volumes and costs of this storage. The TSOmust ensure that the storage utilises technicallyacceptable facilities (as defined in law).
30 days worthof average dailyimports
Average dailyimports = 25mcm30 x 25 = 750mcm (45% oftotal storage)

GB GAS SECURITY OF SUPPLY AND OPTIONS FOR IMPROVEMENT
March 2010114_GBGasSecurityOfSupply_200910_v4_0.doc
122
PÖYRY ENERGY CONSULTING
GasStorageCapacity
2006(mcm)
Gas StorageDeliverability
(mcm/day)
Country Source: GSE & Pöyry
Total GasConsumpti
on 2006(mcm)
AccessType Security of Supply Standard
RelevantStatistic
Gas in Storageused for SoSas % of Total
Storage
Slovakia 2750 34 6,575 nTPA Recent change to the law (February 2009)provides the Slovakian government with newpowers to preferentially access both gas fieldsand storage facilities that may be exporting gasto foreign countries, during the period of anemergency. The law requires that the main gassupplier (SPP) must maintain gas storagereserves to cover 30 days of average nationaldaily demand during the period October toMarch. The regulator will also now regulate theprices of storage by setting them in comparisonto EU storage prices. The government has alsoestablished a framework for fining parties whobreach supply security standards (fines in therange €170K to €1.7m).
30 days ofaverage dailynationaldemand (Oct-Mar period)
30 daysaveragenationaldemand (Oct-Mar period) =800 mcm(29% of totalstorage)
Spain 4140 172 32,889 rTPA Shippers cannot source >60% of portfolio fromany one country. Shippers to gas distributorsmust maintain 35-days supply
35 days non-power sectordemand
Non-powersector demand= 21 bcm35 daysdemand =2.014 bcm(49% of totalstorage)

GB GAS SECURITY OF SUPPLY AND OPTIONS FOR IMPROVEMENT
March 2010114_GBGasSecurityOfSupply_200910_v4_0.doc
123
PÖYRY ENERGY CONSULTING
GasStorageCapacity
2006(mcm)
Gas StorageDeliverability
(mcm/day)
Country Source: GSE & Pöyry
Total GasConsumpti
on 2006(mcm)
AccessType Security of Supply Standard
RelevantStatistic
Gas in Storageused for SoSas % of Total
Storage
Turkey 3035 31,183 rTPA Legal obligation on each importer to maintain10% of its import requirements in storage for aperiod of 5 years
10 % of importvolume
2006 imports =30.741 bcm10% imports =3.074 bcm=> 100%availablestorage
GB 4364 96 94,469 nTPA Minimum level of storage required to ensuresafe operation of system, shippers cannotreduce storage below Monitor level.Shipper licence obligation to contract forsufficient gas to meet domestic portfolio demandduring a 1-in-50 Winter. Difficult to enforce –shippers are deemed compliant if they sign up toNetwork Code and have access to NBP.
Safety monitorfor 1-in-50winter

GB GAS SECURITY OF SUPPLY AND OPTIONS FOR IMPROVEMENT
March 2010114_GBGasSecurityOfSupply_200910_v4_0.doc
124
PÖYRY ENERGY CONSULTING
[This page is intentionally blank]
GB GAS SECURITY OF SUPPLY AND OPTIONS FOR IMPROVEMENT
March 2010114_GBGasSecurityOfSupply_200910_v4_0.doc
125
PÖYRY ENERGY CONSULTING
ANNEX D – POLICY OPTION DETAILED REVIEW
D.1 Physical gas storage
Strategicstorage
This is the provision of dedicated storage quantities that are controlled byGovernment and used only in specific predefined circumstances. The strategicstorage could be either newly built via central funding or through an obligationon a central body, such as NGG, to contract for such services.
Strategic storage is generally thought to be long-range or mid-range storage,which gives a steady output for a sustained period of supply shortage. Thesemeasures are used explicitly in Italy and Hungary. It appears that in these twocountries there is a certain amount of discretion by the Ministries regardingwhen to trigger the use of strategic storage, but they seem to depend onphysical system constraints, rather than price.
The investment costs would be £100m’s, but the volume that could beprovided could be significant.
Timeframe forimplementation
We estimate that it would take at least five years to implement a new strategicstore, so would not be implementable quickly.
Speed ofresponse at timeof need
Potentially a quick speed of response to cover any potential shortfall in supply,depending on whether there are rules put in place to trigger its use or whetherit is at the Government’s discretion.
Complexity Defining the rules for when it would be used could be problematic. The ruleswould need to consider what type of events would be included, and how itmight interface with market mechanisms such as a gas balancing alert, andpost-market emergency arrangements. We would suggest that it perhapscould be included as part of the Emergency procedures, to avoid undulyinfluencing normal market operation.
Alternatively, the principle of auctioning the gas in store to the market could beadopted, although this, too, might be complex.
Potential volume This option has the obvious benefit of being sized to provide sufficient andreliable volumes. However, once built it might be difficult to increase thevolume.
Potentialdeliverability
Depending on the site chosen, facilities could be sized to provide sufficientdeliverability to cover significant events.
Control This facility would be under Government control, either under the rulesestablished or by its discretion.
Reliability Design specifications could be designed to ensure that the infrastructure isreliable. Unless there were capacity constraints at the delivery location (long-term firm NTS entry capacity bookings would prevent this), overall reliabilityshould be relatively good.

GB GAS SECURITY OF SUPPLY AND OPTIONS FOR IMPROVEMENT
March 2010114_GBGasSecurityOfSupply_200910_v4_0.doc
126
PÖYRY ENERGY CONSULTING
Legality Primary legislation would probably be needed, although there is a possibility tomake use of regulations under Section 2(2) of the European Communities Act,based on the requirements of 2004/67/EC (security of gas supply directive).
Industry support Many industry participants would be concerned that it might be used to covershort-term price spikes rather than genuine provision of strategic storage in anextreme supply shortage, or for political reasons to keep energy prices low toconsumers.
The EU, some Governments and regulators have promoted this as the bestoption to provide secure and reliable supplies in the case of a supply crisis.
Barriersaddressed
Government/socialised funding overcomes many of the storage investmentbarriers for private companies.
Unintendedconsequences
Many parties and previous reports show the danger of unintendedconsequences of preventing new commercial storage being developedbecause the presence of strategic storage volumes removes any incentive toinvest.
This policy option has the potential to significantly distort the value of otherstorage/flexibility assets, but it may also affect the market price on days ofsystem stress. This is a general problem for all the physical storage options(including top-up), leading to a moral hazard. Resolving such a moral hazardwould require the Strategic Storage to be an absolute last resort.
If in the future others develop commercial storage or demand decreases, itcould become a stranded asset. If the excess capacity is sold into the marketthen this could raise issues of subsidies.
Extra strategicLNG tanks
Although strategic storage is normally considered as underground storage thatgives both a deliverability and volume dimension, LNG storage can also beconsidered for strategic storage to provide a short duration supply to support asystem that has run into difficulties. This can be in the form of the LNG peakshaving facilities, (some of which NGG is in the process of decommissioning),or building additional tanks at one or more of the LNG import terminals .
Gas would be regasified and released into the market upon instruction fromGovernment.
The cost of the tanks and the gas in store could either be borne by theTreasury or through a fixed element on the transportation charges. Revenuesof the LNG released could accrue to the Treasury or be used to offset thetransportation charges. The investment cost would be in the region of £10m’s.
Timeframe forimplementation
Finding the space at existing facilities may be problematic and this may needto be carried out in conjunction with a planned expansion programme.Alternatively, it could be done alongside a new development.
We therefore consider that this policy option would take a relatively long timeto have an effect.

GB GAS SECURITY OF SUPPLY AND OPTIONS FOR IMPROVEMENT
March 2010114_GBGasSecurityOfSupply_200910_v4_0.doc
127
PÖYRY ENERGY CONSULTING
Speed ofresponse at timeof need
This option has potentially a quick speed of response, and might deliver gas tothe NTS within a few hours.
Complexity Defining the rules for when it can be used, or any auction mechanism and theinteraction with the market would be complex.
Potential volume The ability to meet supply disruption throughout a winter period would dependon the number of tanks that would be procured. Notionally, it may only cover arelatively few days.
Potentialdeliverability
This option might provide significant deliverability, limited primarily by theregasification and/or NTS entry capability, however the regasification capabilitymight present a constraint if shared with normal commercial use.
Control This facility would be under Government control, either under the rulesestablished or by its discretion.
Reliability Design specifications could be designed to ensure that the infrastructure isreliable. Unless there were capacity constraints at the delivery location (long-term firm NTS entry capacity bookings would prevent this), overall reliabilityshould be relatively good.
Legality If provision was done by the Government, primary legislation would be neededfor the smearing of costs. The smearing of costs might be regarded as a tax, inwhich case it would need to be constructed in a way that complied with EU taxlaw. Also not clear whether a licence would be needed if the Governmententers into arrangements with NGG.
If provision was done by NGG, it is anticipated that this could be achievedthrough existing arrangements or licence modifications, otherwise primarylegislation would be needed to make the changes. If the provision goes beyondwhat can be described as balancing or activities relating to transmission, theremight be a need to comply with the unbundling requirements of 2003/55/EC.
Industry support Many industry participants would also be concerned that it might be used tocover short-term price spikes rather than genuine provision of strategic storagein an extreme supply shortage.
Barriersaddressed
Developing extra tanks to store LNG addresses the barriers for investing inpeak shaving, as there are little commercial incentives to develop these. It willnot address barriers for developing longer-range storage such as salt caverns.
Unintendedconsequences
The incentives to invest in new storage of a similar type will be diminished.
Moral hazard, as discussed above.
Potentially a stranded asset, but less impact than a major underground gasstorage.

GB GAS SECURITY OF SUPPLY AND OPTIONS FOR IMPROVEMENT
March 2010114_GBGasSecurityOfSupply_200910_v4_0.doc
128
PÖYRY ENERGY CONSULTING
Strategic LNGoffshore
Effectively a temporary strategic storage, the Government could procure (oroblige a central body such as NGG to procure) one or more tankers of LNG atthe start of each winter and keep it/them offshore ready for immediate supplydelivery, or for sale into the market after the worst of the winter had subsided.
This option was used by Spain in 2003/04 and 2005/06.
It depends on spare berthing and onshore tank capacity being available. Theprocess for releasing it into the market would probably be by auction to marketparticipants, who could then feed it into the OCM. The costs of tanker rentalwould be borne by the Treasury and the revenues from the sale would offsetthis. As it is temporary it will have lower capital cost, but higher variable cost,so would be cheaper in the short-term, but not as a long-term measure.Chartering a tanker would be a few £m per winter (based on current rates) plusthe difference in value of the cargo from when it is purchased to when it is sold.
Timeframe forimplementation
Provision of an LNG tanker kept offshore has the advantage of such a decisiononly being made on a year by year basis and so avoids having to commitsignificant sums into a long-term strategic gas provision.
Speed ofresponse at timeof need
A tanker moored in a suitable location offshore could move to an availableLNG terminal in less than a day.
Complexity We assume the Government would have some discretion over how many andwhen to procure, based on set guidelines and when to auction off at the end ofthe perceived gap had disappeared. The use would depend on there being anavailable spare slot at a terminal and TPA arrangements in place at theterminal.
Potential volume The volumes can be adjusted on a year by year basis, sometimes nothing,sometimes 2 or 3 tankers, depending on the perceived risks. The volumeavailable would not provide security towards a supply disruption lasting morethan a few days. Given a supply shortage, we would expect commercialtankers to arrive within a few days.
Potentialdeliverability
Deliverability would be limited by the regasification capacity at the LNGterminal. In the event that LNG terminals were inputting as much as they couldin such a situation, there would be no additional deliverability.
ControlMechanism
This facility would be under Government control, either under the guidelinesestablished or by its discretion
Reliability Unless there were no spare delivery slots, the reliability would be relativelygood.
Legality It is not clear whether a licence would be needed if the Government enters intoarrangements with NGG and it would need to comply with procurement rules,although there is some flexibility in cases of urgency.
Industry support May be acceptable as a short-term measure in specific circumstances, butmany industry participants would also be concerned that it might influence themarket if it was used when there was particularly low risk of failure.

GB GAS SECURITY OF SUPPLY AND OPTIONS FOR IMPROVEMENT
March 2010114_GBGasSecurityOfSupply_200910_v4_0.doc
129
PÖYRY ENERGY CONSULTING
Barriersaddressed
Temporary strategic LNG storage addresses the barriers for investing in peakshaving, as there are little commercial incentives to develop these. It will notaddress barriers for developing longer-range storage such as salt caverns.
Unintendedconsequences
An auction process means that shippers to other countries could purchase thecargo and it does not end up in GB.
If this was adopted by a number of Governments, tying up a number of tankersfor a few months in the winter would put a strain on LNG transportation andunduly influences the price of LNG.
Minimumstockingobligation
This option is used by a number of countries, including Belgium, France, Italyand Spain, whereby each supplier has an obligation to hold sufficient suppliesto cover a specified number of days or a proportion of its firm supply, as notedin Annex C. This option has the advantage that it can be applied to existinginfrastructure and the obligations varied over time (both within year and fromyear to year) as the potential risk of supply failure varies.
The obligation puts the onus on suppliers to ensure they have enoughcoverage in physical storage stocks in the market, putting an incentive on themto build more storage, either to meet their obligations or to meet their regularrequirements for flexibility. This option is also used in the oil markets (althoughwe note that stocks can also be held in the Netherlands rather than in GB).The capital costs would be much less under this option, but indirect costswould be borne by the market.
Timeframe forimplementation
As this option puts an obligation on shippers to utilise existing storage facilitiesthere is no physical construction, so this option could be implementedreasonably quickly. However, fast implementation might sterilise existingstorage capacity causing a price impact. The time to develop the associatedreplacement storage capacity would be at least 5 years or so.
It might therefore be more appropriate to assume a relatively long lead time forthis option, so that shippers/developers can factor in the reduced availability ofcommercial storage in their investment decisions.
Speed ofresponse at timeof need
Response time would be within a few hours, depending on the notice periodsrequired at the facilities.
Complexity Establishing the minimum levels for number days and volume and how thisvaries according to risk may become complex. If this were simplified by fixingthe levels for a number of years, there could be more or less available thandesired.
Establishing the mechanism for enabling the use of stocks might be complex,although European precedence would indicate that complexities would not beinsurmountable.
Potential volume Varying the volumes means that the appropriate amounts would be held inreserve. However, it does not affect the total storage volumes available to themarket in the short term, as mentioned above.

GB GAS SECURITY OF SUPPLY AND OPTIONS FOR IMPROVEMENT
March 2010114_GBGasSecurityOfSupply_200910_v4_0.doc
130
PÖYRY ENERGY CONSULTING
Potentialdeliverability
Potentially relatively high, depending on the release mechanism(s) adopted.
ControlMechanism
Controlled by Ofgem under the shipper licence obligations.
Reliability Potentially relatively high, depending on the release mechanism(s) adopted.As the shippers have some discretion regarding how they procure the storagecapacity, there should be more diversity of entry points compared to a singlestrategic storage facility.
Legality It is expected that primary legislation would probably be needed, althoughthere is a possibility to utilise regulations under Section 2(2) of the EuropeanCommunities Act, based on the requirements of 2004/67/EC (security of gassupply directive).
Industry support Shippers would be against compulsory obligations, and might be expected toargue that the market would supply the most efficient solution.
Barriersaddressed
Sterilising existing storage capacity is likely to increase seasonal spreads andvolatility, which increases the value of storage. This would assist proposedprojects in getting over their investment hurdles, although planning and otherbarriers would still remain.
Unintendedconsequences
It could be argued that the value of storage would increase in the short-term asthe available capacity for regular commercial flexibility would be diminished.Consequently seasonal spreads would be widened and volatility wouldincrease, not just at NBP, but across Europe.
There is the cost of monitoring, but it puts the emphasis on suppliers to providea form of supply obligation and linked explicitly to firm portfolios so mayincentivise innovative interruptible deals to reduce exposure.
Top-Upcontracts –long-term andmedium-term
This is a method initially developed at the start of the Network Code in 1996whereby, having analysed the potential gap between forecasted supplies andsevere demand, the transmission system operator procures from marketparticipants’ sufficient supplies/storage to fill the gap. Costs are then smearedacross market participants through transportation charges. This method wasset up because the GB market was isolated and the market rules wererelatively new and untested in relation to security of supply.
Top-up was phased out around 2004 by Ofgem because it was felt that themarket should be able to provide under suppliers’ 1-in-50 obligations. Priorattempts to phase it out in 1998 were blocked by the Health and SafetyExecutive.
Timeframe forimplementation
Top-up contracts have the advantage of being relatively quick and easy toestablish, given that the principles are already established, although the exactrules governing the amount to be procured and any auction process wouldtake some time to develop and seek industry agreement.

GB GAS SECURITY OF SUPPLY AND OPTIONS FOR IMPROVEMENT
March 2010114_GBGasSecurityOfSupply_200910_v4_0.doc
131
PÖYRY ENERGY CONSULTING
Speed ofresponse at timeof need
Responses times can be within a few hours, depending on the notice periodsat the various facilities.
Complexity The tender process should be relatively straightforward, but there are anumber of regulatory issues around the way in which the gap is defined, theoptions are valued and how they are paid for, e.g. through the balancingneutrality mechanism.
Potential volume The volumes can be defined annually so are flexible relative to the perceivedrisks.
Potentialdeliverability
Deliverability can also be defined annually and appropriately to the perceivedrisks.
Control This would be controlled by NGG, under the supervision of Ofgem.
Reliability It was proven to be reliable in the period in which it operated, but there were nomajor outages in that time.
Legality This would need to comply with 2003/55/EC in how costs are charged and asregards the activities that TSOs can carry out. Since it is a re-introduction of aprevious regime it could be covered through a licence obligation.
Industry support There was some support for the Top-Up mechanism when it was in place, butits reintroduction into a mature and liquid market is unlikely to receive muchsupport.
Barriersaddressed
Although not as strict as a stocking obligation, this would also have the effectof sterilising existing storage capacity or demand side response from othercommercial arrangements. This is likely to increase seasonal spreads andvolatility, which may increase the value of storage and would assist proposedprojects in getting over their investment hurdles, although planning and otherbarriers would still remain.
Unintendedconsequences
As was noted in 2004, it gives NGG other balancing options in addition to theOCM, which can distort the cash-out mechanism.
The mechanism, in effect, gives NGG a series of commercially valuableoptions. There would therefore need to be incentives on NGG to minimisecosts to industry.
It may give an unfair revenue advantage to existing facilities.
GB GAS SECURITY OF SUPPLY AND OPTIONS FOR IMPROVEMENT
March 2010114_GBGasSecurityOfSupply_200910_v4_0.doc
132
PÖYRY ENERGY CONSULTING
Storagecapacity buyerof last resort
Also part of the arrangements at the start of Network Code, this was anobligation on the TSO to buy any unsold storage capacity at a relatively lowreserve price. The TSO would then utilise as much of the storage capacity asit thought was needed to bridge the potential gap between contracted suppliesand severe demand – in the form of its own top-up gas. This policy could bereintroduced to help underwrite potential storage projects, especially where it isconsidered that TPA exemptions should not apply.
Timeframe forimplementation
As above for top-up.
Speed ofresponse at timeof need
This is based on NGG having its own gas in storage facilities that are not fullyutilised, so could be implemented within a year.
Complexity There are as number of regulatory issues that would need to be addressed,e.g. how the gap is defined, the prices that should be paid and the costrecovery mechanisms.
Potential volume This option would only deliver if there is spare capacity, otherwise it wouldhave no immediate effect although could enable NGG to provide investmentsignals.
Potentialdeliverability
As above
Control This would be controlled by NGG, under the supervision of Ofgem.
Reliability It was proven to be reliable in the period in which it operated, but there were nomajor outages in that time. In the last few years of its operation, storage wasfully booked so it was not available.
Legality This would need to comply with 2003/55/EC in how costs are charged and asregards the activities that TSOs can carry out. Since it is a re-introduction of aprevious regime it could be covered through a licence obligation.
Industry support We consider that there would be a mix of support from industry.
Barriersaddressed
Does not necessarily address many of the investment barriers, as all costs arenot covered by the low guaranteed revenues for the developer. However, itcould provide a basis for limiting the downside risk of investing and thereforelowering financial hurdle rates.
Unintendedconsequences
This would effectively give NGG the ability to provide its own Top-Up, andcould lead to a distortion of the OCM and imbalance charges. There wouldneed to be incentives on NGG to minimise costs to industry.
It may be seen to give an unfair revenue advantage to facilities with TPA,depending on the rules around usage. However, if profits increase it should bepossible to encourage more investment

GB GAS SECURITY OF SUPPLY AND OPTIONS FOR IMPROVEMENT
March 2010114_GBGasSecurityOfSupply_200910_v4_0.doc
133
PÖYRY ENERGY CONSULTING
Capacitymechanism forgas
Rather than an placing a direct obligation on suppliers/shippers, this optionprovides an additional payment to shippers for making specific suppliesavailable to the market. These supplies may include, for example: a supplycontract from a UKCS production facility; stored gas with the appropriatewithdrawal rights; and tested/active DSR contracts (capturing any backupfacilities). The pricing mechanism could be tailored to incentivise differenttypes of supply, (e.g. as it might be considered more reliable, stored gas mightbe rewarded more than smaller DSR contracts), and could reference OCM orimbalance charges to ensure the incentive remains.
Such a mechanism might add significant costs to shippers (which might beasymmetrically distributed, depending on portfolios and positions). These costsmight be under- or over-recovered through the capacity mechanism dependingon both its design and day-to-day environmental factors, which might beexpected to affect wholesale prices.
Timeframe forimplementation
This option might require significant legal changes and would requiresignificant regulatory consultation. We therefore consider that this would takea few years to be implemented.
Speed ofresponse at timeof need
Theoretically, this should be available instantly, as it is based on incentivisingshippers to permanently have locational bids on the OCM.
Complexity The potential complexity of this option rules it out on its own. Firstly, it isimpossible to establish how much undelivered gas (including gas in Norway,Netherlands and Belgium) was actually available. Secondly, gas balancingand trading functions at a daily resolution and rely on a degree of flexibility inthe system to accommodate instantaneous imbalance (this enables self-dispatch by shippers/suppliers) – a compatible capacity mechanism wouldneed careful design to capture within-day security risks.
Capacity mechanisms can (and do) work in electricity markets because thedispatch of generation is undertaken by the transporter, not by the supplier,(the transporter must keep the system in balance instantaneously). There isfar greater certainty over availability through incentives built into the biddingmechanism, and proven/evidenced maximum generation capacities.
Potential volume This may not provide any more volume than is already available, given theexisting capacity margin, shown in Figure 35.
Potentialdeliverability
Depends on the detail of the mechanism.
Control This would be controlled by Ofgem under the shipper and/or transporterlicences.
Reliability Relying on shippers to always have a volume on the OCM would bequestionable in severe circumstances.
Legality Primary legislation might be needed and State aid approval might be required,depending on the exact nature and design of the mechanism.

GB GAS SECURITY OF SUPPLY AND OPTIONS FOR IMPROVEMENT
March 2010114_GBGasSecurityOfSupply_200910_v4_0.doc
134
PÖYRY ENERGY CONSULTING
Industry support This option is unlikely to gain industry support as the entry shippers maybenefit at the expense of the exit shippers.
Barriersaddressed
Depending on the incentives and the design of the mechanism, this would mayaddress some of the barriers, e.g. by providing a more secure stream ofrevenue to storage facilities.
Unintendedconsequences
Any mechanism is likely to create opportunities for gaming, particularly on dayswhen the bids are mot likely to be called.
The mechanism would redistribute cash flows within the industry away fromthe wholesale pricing mechanism, which may effect liquidity and commercialmarket signals to provide new capacity. At worst, a capacity mechanism coulddestroy many of the benefits of free-trade within the market.
D.2 Backup fuels for power generation
Minimumdistillatestoragerequirement
This is a mandate that CCGTs must hold sufficient distillate to cover apredetermined number of days, or volume, of generation. The additional costof this would come from a central source, either Government funded or from alevy on the other CCGTs, through the electricity market, or through the gasmarket arrangements.
Using distillate as an alternative to natural gas is already a commercial optionto those CCGT power stations that have the capability, but since it is used solittle and the reform to the exit arrangements are discouraging, significantvolumes of capability may be decommissioned in the near future.Implementing this policy quickly may prevent the loss of this capacity.
Distillate backup can also used for black-start – the mechanism to power-upthe electricity network.
The incentive placed on CCGTs is stronger than the Top-Up or other DSR-typeoptions, which are dependent on a contractual chain, and are subject togenerators’ willingness to provide.
Timeframe forimplementation
Relatively quickly, as it can be implemented under existing legislation.
Speed ofresponse at timeof need
At a few hours’ notice, although it has the potential to be instantaneouslyavailable.
Complexity Cost recovery mechanisms could be particularly complex.
Potential volume Setting a minimum distillate requirement would provide volume in the short-term but may have restocking limitations.
Potential peak Depending on the number of CCGTs operating at the time, it could represent areasonable amount of daily volume, although when there are few CCGTsoperating there is lower volume available.
GB GAS SECURITY OF SUPPLY AND OPTIONS FOR IMPROVEMENT
March 2010114_GBGasSecurityOfSupply_200910_v4_0.doc
135
PÖYRY ENERGY CONSULTING
Control Monitoring the stock obligations would be the responsibility of Ofgem.Decisions on when to switch to distillate would be made by the individualgenerators, based on price.
Reliability Unused backup facilities can fall into disrepair – annual maintenance andtesting would be required, potentially increasing costs.
Legality Powers to put such a requirement in place already exist under s.34 and 35 ofthe Electricity Act 1989. There may be environmental limits at certain sites thatfurther limit volumes available.
Industry support Depending on the cost recovery mechanism, might be supported by the maindual-market utilities and independent generators, however it might be seen asunnecessary. Gas and electricity transporters might be negative.
Barriersaddressed
Payments for holding backup would override the lack of incentives to invest insuch facilities.
Unintendedconsequences
Restocking large volumes of replacement distillate could put strain on thedistillate distribution chain, as the stock of barges and road/rail tankers doesnot have the spare capacity to maintain flows for more than a few days withoutaffecting the distribution of heating oil and distillate. Identifying measures toimprove the distillate supply chain might ensure gas security during a severesupply disruption, as explained in Section 2.8, although this would increase thecosts of this option.
If it is an obligation on new facilities it will have possible impacts on new powergeneration investment through marginally higher costs and lower efficiencies.If existing sites are not obliged to build tanks (many would be physically unabledue to land and technology issues) it could lead to distortions in the market.
If this option is applied to existing or committed power generation it might beseen as being interventionist which increases the perception of regulatory riskand increases the barriers to entry in the electricity market.
Coal plantpost LCPD
The amount of coal-fired generation will decrease dramatically in 2015, as partof the obligations under the large combustion plant directive (LCPD). Thisproposal is to keep some of these coal stations to enable coal to run instead ofCCGTs when needed for gas security. This would have a number of impacts,including environmental. It is not clear where the cost of keeping the plantavailable would come from.
Timeframe forimplementation
There would be a large number of legislative and regulatory hurdles to getover before implementing in 2015.
Speed ofresponse at timeof need
Potentially within a few hours.
Complexity The cost allocation/recovery mechanism would be extremely complex as itwould need to operate via the electricity market.

GB GAS SECURITY OF SUPPLY AND OPTIONS FOR IMPROVEMENT
March 2010114_GBGasSecurityOfSupply_200910_v4_0.doc
136
PÖYRY ENERGY CONSULTING
Potential volume A greater overall volume of energy can be stored more cheaply as coal than asoil, but environmental limits may affect this.
Potential peak Reasonable, though capped by both CCGT and post-LCPD coal capacities.
ControlMechanism
Monitoring the stock obligations and administering the payments mechanismwould probably be the responsibility of Ofgem. Decisions on when to switch tocoal-fired generation would probably be made by the individual generatorsbased on price (though depending on cost allocation/recovery mechanisms,and subject to limits imposed by the Environment Agency.
Reliability Coal plant have been an established part of the GB’s generation mix for anumber of years, with proven technology and established maintenanceschedules.
Legality Using coal plants that have opted-out under the LCPD after 2015, or beforethen once the generating stations have exceeded their 20,000 operationalhours limit, is not an option under the LCPD directive.
There might be an opportunity to try to get some flexibility into the newdirective which is to replace the LCPD, but this indefinite.
Planning to retain non-LCPD plant for use in severe supply disruptions wouldrisk challenges in advance that the Government was planning to breach thedirective (especially from opted-in plant that has subsequently invested andcould otherwise capture upside during times of gas market stress).
The LCPD is enforced by the Environment Agency, but it may be possible tooverride this in emergencies.
Industry support Players without a financial position are unlikely to support this option, due to itscomplexities (particularly considering its effectiveness and the chain ofcommand).
Barriersaddressed
Would provide peak and annual capacity to meet extreme demands, utilisingexisting facilities.
Unintendedconsequences
Extending the life of coal plant will conflict with policy options designed to meetemissions targets and achieve the 2020 obligations.
There could be significant market distortions within and between gas andelectricity markets.
Capacitymechanism forPower
By providing a payment mechanism specifically for non-gas-fired generationcapacity this should provide sufficient incentive to generators to arrange forenough distillate stocks or other forms of generation to be made available andto keep generating through a gas supply outage.
Timeframe forimplementation
A large number of regulatory hurdles to get over before implementing, so likelyto be a number of years.

GB GAS SECURITY OF SUPPLY AND OPTIONS FOR IMPROVEMENT
March 2010114_GBGasSecurityOfSupply_200910_v4_0.doc
137
PÖYRY ENERGY CONSULTING
Speed ofresponse at timeof need
Potentially within a few hours.
Complexity The cost allocation/recovery methodology would probably need to be complexif it were to support the gas industry.
Potential volume Dependant on level of payments.
Potential peakvolume
Dependant on level of payments.
ControlMechanism
Monitoring the availability and administering the payments mechanism wouldprobably be the responsibility of NGG under the guidance of Ofgem.Decisions on when to switch to other types of generation would be made bythe individual generators, based on price, and subject to limits imposed by theEnvironment Agency.
Reliability Disuse of backup facilities could potentially have a negative impact onreliability as delays to maintenance occur. Additional costs will have to beborne by customers.
Legality It is anticipated that primary legislation would be needed and any concernsregarding State aid would have to be addressed.
Industry support Creating a support mechanism in the electricity industry would probablyreceive a mixed reception. In theory it should lower the risk for generators, butthis might encourage new entry and therefore be strategically unpopular withexiting market players. Creating a mechanism to specifically support the gassecurity of supply would likewise receive a mixed reception, although mightdepend more on portfolio and position.
We would expect the gas industry to be at best neutral or at worst sceptical.We would expect it to be argued that the value of gas security ought to be builtinto the gas price, and that investment in generation to provide a capacitymargin should take such a gas price into consideration.
Barriersaddressed
Payments for holding backup would override the lack of incentives to invest inand maintain facilities.
Unintendedconsequences
Re-introducing a capacity mechanism into the power market may mean thatadditional power station capacity is retained on the electricity grid to cater forincreased levels of intermittent generation e.g. wind power. This could havethe benefit to gas security of supply in a scenario of severe disruption, as itwould be less dependent on continued power from CCGTs running on distillateover a longer period of time.
Such a regime would first have to be justified to meet electricity security ofsupply concerns before any secondary benefit to natural gas could beconsidered.

GB GAS SECURITY OF SUPPLY AND OPTIONS FOR IMPROVEMENT
March 2010114_GBGasSecurityOfSupply_200910_v4_0.doc
138
PÖYRY ENERGY CONSULTING
D.3 Demand side response (DSR)
Restore I&Cinterruptiblevolumes tohistoric levels
End users and shippers are currently able to agree contracts where the enduser agrees to interrupt its gas supply in return for a fee or discount. However,there has been limited bids and transporter contracts under the new Mod 90auctions. The transporters are reinforcing their pipeline networks to removetransportation constraints so there will be fewer interruptible customers goingforward and there is the risk that I&C sites decommission the backup facilities.
However, Mod 90 has not fully taken into account the demand side insurancecontribution provided under the historical I&C interruptible contract. This policyoption would be to encourage I&C Interruption to remain at historic levels by:
(i) Introducing an auction to provide a demand side insuranceincentive that shippers, on behalf of I&C sites as the UNC preventsa direct interaction, which is independent of the transporters’needs for capacity constraint interruption;
(ii) The level of required volumes would be set for a fixed period, say5 years, by the SO based on its forecast severe annual and peaksupply and demand position.
(iii) Encouraging end users to maintain their backup supplies andenter into contracts with shippers to provide the DSR capacity;
Logically, there should already be an incentive on end users to enter into thesearrangements as these would be amongst the first consumers to be interruptedif there was an emergency, for which they would receive very limitedrecompense. However, the current perception that the market has sufficientsupplies available to it means that this occurrence is perceived as very rare, sothe incentive is negligible. In addition, as discussed above the implementationof exit reform has removed the small incentive to maintain backup capabilities.
In Italy in 2005/06 suppliers were given targets for having a minimum amountof their portfolios on interruptible contracts. This application was impractical,as the emergency regulation was introduced at short notice and there was notan even spread of interruptible customers between shippers.
Timeframe forimplementation
A NUC modification would need to be raised to establish the auction processand once approved the SO would need to hold an auction and notifysuccessful bidders. Such a process would take in the order of one year toimplement.
Speed ofresponse at timeof need
If the contracts and mechanisms are robust, the response could be within afew hours.
Complexity Setting up the auction rules and administering the process is not simple butshould not be that much harder than the entry and exit capacity auctions.Agreement to the process of defining the required volumes will need bothindustry and regulatory oversight.
Potential volume Potentially a return to the historic levels of 36mcm/d.

GB GAS SECURITY OF SUPPLY AND OPTIONS FOR IMPROVEMENT
March 2010114_GBGasSecurityOfSupply_200910_v4_0.doc
139
PÖYRY ENERGY CONSULTING
Potential peak As above
Control The controls would be largely market based, though there would be somediscretion to influence the level of volumes required.
Reliability Simply encouraging industrial users to maintain backup facilities will notnecessarily provide the required response, as their focus is generally on theirown markets, not the gas markets.
This also maintains the ability of the transporter to take direct control of offtakefacilities (i.e. the transporter can isolate the load where there is failure tointerrupt).
Legality Promoting DSR contracts with suppliers is possible now with no legislationneeded.
Introducing a new demand side insurance auction process will need carefulhandling through the UNC modification process.
Industry support There is potentially a high level of industry support.
Barriersaddressed
This would aid in meeting demand in extreme times without the need for newpeak facilities, say via replacement LNG storage.
Unintendedconsequences
Increasing the cost for industry for backup facilities that are rarely used.
End users tobid directlyinto the OCM
This option is designed to facilitate or force direct participation in the OCM byconsumers. Whilst in theory, consumers should be able to participate in themarket indirectly through contracting with shippers, in practice it is difficult forconsumers and shippers to agree terms. This option would require a changeto the licence regime to allow or oblige non-shippers access to the OCM, sothat they can directly offer their flexibility to turn down at any time, and not beforced to contract through their shipper. In this way the customer couldrespond to price movements in real time and offer its value, which might varyover time.
Timeframe forimplementation
We estimate that this option would require approximately one year toimplement the necessary regulatory and licence changes. If primary legislationis required this process could take longer.
Speed ofresponse at timeof need
Potentially within a few hours.
Complexity More complex to implement than shipper to end user DSR contracts as theend user would do the bidding and the shipper would be liable for anyimbalance.

GB GAS SECURITY OF SUPPLY AND OPTIONS FOR IMPROVEMENT
March 2010114_GBGasSecurityOfSupply_200910_v4_0.doc
140
PÖYRY ENERGY CONSULTING
Potential volume There will be concerns on how much volume would actually be made availablewhen it is required and whether sufficient volume would be available for a long-period of supply disruption.
Obliging customers above a certain scale to bid in would be a better way ofensuring a volume of DSR is available – although it is likely to be at pricesapproaching VOLL.
Potential peak This could theoretically be fairly high, especially if consumers are obliged tobid.
ControlMechanism
Market based, overseen by Ofgem.
Reliability We expect reliability would be fairly low.
Legality An exception to the existing requirement for a shipper licence will be requiredthough changes to the current regulations. Primary legislation might berequired to overcome any problems of direct contracting between gastransporters and consumers.
Industry support We consider this option unlikely to find much industry support (based onprevious consultations), and the take-up from industrial users is likely to besmall given the infrequent number of occasions they are likely to be used.
Barriersaddressed
Competitive barriers to entry, as well as removing the barrier to larger endusers.
Unintendedconsequences
Non-compliance with any accepted OCM bid would impact shippers, whowould have to pay any imbalance penalties. This could result in legal action.
There is a risk that consumers misunderstand their own VOLL, and bid into theOCM at a significant discount to their VOLL, causing direct and potentiallyindirect losses to the UK economy.
Additionalinformationprovision toend users toprompt DSR
Based on the desire for some end users to participate more directly, analternative to direct bidding on the OCM to improve end users’ interaction withthe market, live price information from the OCM can be fed to end users toencourage DSR actions through their shippers. In times of potential tightsupply, alerts can be sent by email/text/fax to trigger some sort of action.Ideally it should be implemented alongside the drive for more DSR contracts.
Timeframe forimplementation
Changes to the APX rules and procedures may take a few months toimplement.
Speed ofresponse at timeof need
Uncertain, but could be implemented alongside a drive for voluntary DSRcontracts which may crystallise the procedures.
Complexity Relatively simple.

GB GAS SECURITY OF SUPPLY AND OPTIONS FOR IMPROVEMENT
March 2010114_GBGasSecurityOfSupply_200910_v4_0.doc
141
PÖYRY ENERGY CONSULTING
Potential volume Provision of the price information only will not be sufficient to ensure that gasvolumes are available when required.
Potential peak Uncertain.
Control Control would be through Ofgem.
Reliability Implemented on its own this is likely to prove to be very unreliable, but theoption could be implemented alongside a drive for voluntary DSR contractswhich may crystallise the procedures.
Legality This can be achieved through existing arrangements.
Industry support The industry would probably be largely in support, and it reflects a growingtrend within the industry to improve transparency.
Barriersaddressed
Would improve the current speed of response, if implemented correctly.
Unintendedconsequences
We do not consider that there would be any unintended consequences withthis policy option.
Crisis priceincentives onfirm market
This process would target smaller users into DSR by the application of a pricelevy or tax in times of stress. A portion of the revenues raised would have tobe recycled to the fuel poor, to minimise impact on the most vulnerable. To beimplemented fully it would require the majority of customers in the country tohave smart meters. Without smart meters, it would rely on profiling andestimated readings.
Timeframe forimplementation
The implementation timetable for smart metering is 10 years, so may not beproperly effective until then.
Speed ofresponse at timeof need
Smart meters should allow the changes to be implemented technically in a fewhours; however, the Government decision process to implement an across theboard temporary tax rise may take a little longer. The speed at which millionsof consumers then modify their thermostats would probably be over a numberof days, if at all.
Complexity The process could be relatively simple to implement, but would also depend onhow the money raised is allocated. If it were based on estimates or profiles itwould be significantly more complicated for the suppliers to implement.
Potential volume If all households turned down their room thermostats by a couple of degrees, itcould lower demand quite significantly. However, the number that wouldactually act is very uncertain.
Potential peakvolume
Peak reductions would be less certain than volume reductions.
Control Government control, with implementation through the suppliers.
Reliability Not reliable

GB GAS SECURITY OF SUPPLY AND OPTIONS FOR IMPROVEMENT
March 2010114_GBGasSecurityOfSupply_200910_v4_0.doc
142
PÖYRY ENERGY CONSULTING
Legality Powers to set prices in times of emergency exist under s.2 of the Energy Act1976. But if the funds raised by the levy go to the Treasury then this would bea tax. As such it is normal for this to be done through a Finance Act. The taxwould need to comply with EU tax law, such as the Energy Products Directive.
Industry support Would enable providers to more effectively target users.
Barriersaddressed
Provides a way for firm customers to respond to pricing signals when thesystem is stressed.
Unintendedconsequences
Could be introduced without smart metering, but it is likely to have moreadverse consequences if based on estimated use/profiles.
D.4 Other direct security policies
Supplierobligation
Similar to the stocking obligation, above, this option is a regulatory/licenceobligation to say suppliers must meet a gas security of supply metric, but canmeet it from a variety of sources, including long-term contracts, storage andDSR.
It could be strengthened by the implementation of a penalty should shippersfail to deliver when required, which would be equivalent to a second tierimbalance price. It should be noted that shippers in neighbouring countriesmight have yet stronger imbalance incentives, which would mean that in acrisis they would have a greater incentive to balance in those countries ratherthan GB.
Timeframe forimplementation
Poor, if obligation is onerous; possibly good given future capacity availability.
Speed ofresponse at timeof need
Little difference to at present
Complexity Defining what would supplies would count to the obligation would be complex(especially as the GB is a net importer). This option might be very difficult toenforce, as has been evidenced with the existing 1-in-50 obligation.
Potential volume Potentially quite high, as there will be no restrictions for meeting supply,provided the incentives are at a sufficient level.
Potential peakvolume
As above.
Control Probably monitored under shipper licences by Ofgem, but the market would befree to contract as it saw fit.
Reliability May not give any greater reliability than at present.
Legality It would be a variation to the licences, and may require changes to the GasAct.

GB GAS SECURITY OF SUPPLY AND OPTIONS FOR IMPROVEMENT
March 2010114_GBGasSecurityOfSupply_200910_v4_0.doc
143
PÖYRY ENERGY CONSULTING
Industry support We consider it very unlikely that this would attract support from the industry.
BarriersAddressed
This would force a decrease in suppliers’ risk.
Unintendedconsequences
The option may reduce traded spot gas, driving suppliers to long-termcontracts in order to demonstrate compliance with the incentive.
Securityobligationcertificate
Similar to ROCs, SOCs are set to achieve the required security of supply level,with a recycle process. These can then be traded and provide a price signal toencourage provision of more supplies/storage, if required. This is effectively ameans of enforcing/monitoring a supply obligation.
Timeframe forimplementation
Poor as would require significant new legislation.
Speed ofresponse at timeof need
Poor as it reduces transporters’ ability to balance
Complexity Resolving what would count to a SOC would be problematic as havingcapacity doesn’t mean gas will flow and buying from spot markets is not thesame as having a long-term take-or-pay contract. There are also big issues onbuy-out prices and recycling terms.
Potential volume Potentially high.
Potential peak Potentially high.
Control Probably monitored under shipper licences by Ofgem, but the market would befree to contract as it saw fit.
Reliability May not give any greater reliability than at present.
Legality Can expect implementation to be similar to the process for ROCs, so wouldneed significant primary legislation and possibly State aid approval.
Industry support Possibly limited, due to complexity, and may inhibit transporters’ ability tophysically balance.
Barriersaddressed
This would force a decrease in suppliers’ risk.
Unintendedconsequences
Again this may have the un-intended consequence of reducing traded volumesin the spot market, potentially limiting competition between suppliers andacting as a significant barrier to entry for any new entrants.

GB GAS SECURITY OF SUPPLY AND OPTIONS FOR IMPROVEMENT
March 2010114_GBGasSecurityOfSupply_200910_v4_0.doc
144
PÖYRY ENERGY CONSULTING
D.5 Fiscal incentives
Grants,allowances,loans, etc.
To overcome some of the financial/economic barriers related to investing incommercial storage projects, the Government could provide grants orincentives to help the financial viability of an important project that would addsignificantly to the country’s security of gas supply. Other countries, such asPoland provide significant incentives in such circumstances. This option maybe required if significant incentives are provided to holders of depleted gasfields to use them for carbon capture & storage (‘CCS’) projects, even if theirgeology is better suited to use as a gas storage facility.
Timeframe forimplementation
Probably a long time frame given the legal issues.
Speed ofresponse at timeof need
Dependent on the selected facilities.
Complexity Would depend on the nature of the proposed grant, allowance or loan and howaccess to the funds would be applied for and allocated.
Potential volume This option may not bring forward sufficient volume unless it made a significantchange to a project’s expected rate of return.
Potential peak Dependent on the selected facilities.
Control Government.
Reliability Dependent on the selected facilities, though possibly very high.
Legality Making this change would be difficult . Funding over a period of more than 2years and of more than £1.5 million would require primary legislation. Stateaid approval would be needed and it is uncertain that such approval would beforthcoming.
Industry support Potential support from parties looking to invest in new facilities. However,existing parties may have concerns about unfair treatment.
Barriersaddressed
Would remove economic disincentives to invest in new facilities.
Unintendedconsequences
It could also have the un-intended consequence of providing a financialincentive that brings forward too much gas storage, making both existing andfuture facilities commercially unviable.

GB GAS SECURITY OF SUPPLY AND OPTIONS FOR IMPROVEMENT
March 2010114_GBGasSecurityOfSupply_200910_v4_0.doc
145
PÖYRY ENERGY CONSULTING
Cushion gascapitalallowance
Many parties are highlighting that cushion gas is a significant cost indeveloping a new facility. Treating this as other capital expenditures wouldimprove the project economics and so remove a perceived major barrier todevelopment of new storage facilities. Current position is also not aided byproject financiers assuming that the cushion gas has no terminal value in thefree cash flow value calculations.
On 22 April 2009 clarification was given to a recent decision made by HMRevenue & Customs which confirmed that cushion gas would be eligible forplant and machinery capital allowances. This decision will reduce the capitalcosts in developing depleted field storage facilities in particular.
D.6 Indirect policies and regulatory incentives
Set out below are a number of other policies and initiatives that are applicable forconsideration for improving security of supply. Some of these are already underway andwe have already assumed in our modelling that they will, to some extent, be achieved inthe timescales being considered in this project.
Energyefficiency tosignificantlyreducedemand
Reducing demand through energy efficiency will improve security of supply bylowering demand. Various policies, including the 2020 targets and otherinitiatives, are already being developed to reduce the carbon intensity ofconsumer demand, which has the effect of reducing predicted gas demand.
Our base demand scenario already includes this.
Smart meters The introduction of smart meters will support the above initiatives by allowingall consumers to better understand their actual consumption and support themin making decisions to reduce consumption, especially at times of high prices.This will especially be the case for electricity consumption which in turn willfeed into how much gas is required in power generation.
Smart meters will take a long-time to implement across all 20 million users buthave the potential to deliver significant volume reductions. However, the smartmeters will not necessarily mean that end consumers react to pricing signals,especially during a severe winter scenario.
There is also the unintended consequence that this could adversely impact thefuel poor and those members of society who are more vulnerable to reductionsin space heating.
Improvementsto the planningprocess
Many facilities have been held up by the planning process in GB and reformsto speed up the process could accelerate the development of storagefacilities. Reforms to the planning arrangements have been implementedrecently, however it is not yet clear that these changes will make a significantdifference.

GB GAS SECURITY OF SUPPLY AND OPTIONS FOR IMPROVEMENT
March 2010114_GBGasSecurityOfSupply_200910_v4_0.doc
146
PÖYRY ENERGY CONSULTING
Moreinterconnectionwith & withinthe EU
This proposes that higher levels of pipeline integration between countrieswould allow gas to more easily flow to where the supply/demand balance ismost needed. It also means each country doesn’t have to individually providestorage capacity to meet its own worst case supply scenario. Continuedpressure to liberalise and provide easy access and price transparency acrossthe EU will improve the gas security of all countries, including GB.
Various projects have already been identified and the proposed EU stimuluspackage contains support for various interconnection projects to improve gasinterconnections. In particular it provides support to address gas security ofsupply issues in central and south-eastern Europe, where flows wereparticularly restricted in the January 2009 Russian / Ukrainian gas supplydispute, and to further improve the diversity of supplies across Europe. TheUK is not deemed a priority area, as it has a good diversity of supplies andinterconnection with the Continent and Ireland.
Our modelling assumes no constraints within countries, but is limited to thestated interconnection limits, except where financially confirmed projects areto be introduced.
If there was to be a new Government funding mechanism for interconnectionprojects it is likely that it would be for a period of more than 2 years and ofmore than £1.5 million, so primary legislation would be required. There wouldalso be State aid issues. Projects within UK waters would also need variousenvironmental consents.
TPAexemptions
The second EU gas directive required that all pipeline, LNG terminal andstorage facilities should provide open access to shippers, except in certaincircumstances where new facilities can be granted exemptions.
A TPA exemption allows storage developers to contract with one or moreshippers who would underwrite the investment through long-term contracts,thus reducing the cost of capital.
Blanket TPA exemption introduces inefficiencies into the market: suppliers arenot able to fully access flexibility tools and therefore invest for themselves.Blanket TPA exemption is one of the reasons why the US and Germanydeveloped significant levels of storage in the 1980s and 90s, when there waslittle interconnection and little or no TPA.
Full TPA arrangements should ensure the most efficient allocation of storagecapacity, however it may introduce risks that become a barrier to investment.TPA exemption of individual facilities can help to overcome this barrier, butintroduces the potential for market inefficiency and over-investment.

GB GAS SECURITY OF SUPPLY AND OPTIONS FOR IMPROVEMENT
March 2010114_GBGasSecurityOfSupply_200910_v4_0.doc
147
PÖYRY ENERGY CONSULTING
Gas quality GB has a narrower range for gas quality (specifically Wobbe) than its nearneighbours on the Continent. It therefore obliges producers and importers toprocess the gas before it enters the system so that it falls within thespecification. This specifically affects LNG importers and, to a lesser extent,Norwegian imports. Reforms to the gas quality specifications are not due until2020, but this may become an increasing issue if we are to rely on importsfrom the Continent at short notice, as the average Wobbe increases due toincreased LNG and Russian gas via Nordstream reaching the Netherlandsand Belgium. DECC may therefore want to consider a review earlier than thecurrent timetable.

GB GAS SECURITY OF SUPPLY AND OPTIONS FOR IMPROVEMENT
March 2010114_GBGasSecurityOfSupply_200910_v4_0.doc
148
PÖYRY ENERGY CONSULTING
[This page is intentionally blank]
GB GAS SECURITY OF SUPPLY AND OPTIONS FOR IMPROVEMENT
March 2010114_GBGasSecurityOfSupply_200910_v4_0.doc
149
PÖYRY ENERGY CONSULTING
ANNEX E – ILEX ENERGY REPORTS
Pöyry Energy Consulting produces the renowned ILEX Energy Reports. ILEX EnergyReports provide detailed descriptions of European energy markets coupled with market-leading price projections for wholesale electricity, gas, carbon and green certificates.ILEX Energy Reports and price projections are currently available for the:
electricity and/or gas markets including the following countries markets:Belgium ItalyBulgaria the NetherlandsCyprus PolandCentral East Europe RomaniaFrance RussiaGermany South East EuropeGreat Britain SpainGreece SwitzerlandIreland Turkey
renewables markets in:IrelandItalyPolandRomaniaSpain & PortugalUnited Kingdom
the biofuels market in Europe.
ILEX Energy Reports are produced by Pöyry Energy Consulting, formerly known asILEX Energy Consulting.
In addition to ILEX Energy Reports, Pöyry also produces a number of other reports,including electricity reports for Norway, Sweden and Finland, a renewables report forSweden, and a report of the EU Emissions Trading Scheme with carbon price projections.

GB GAS SECURITY OF SUPPLY AND OPTIONS FOR IMPROVEMENT
March 2010114_GBGasSecurityOfSupply_200910_v4_0.doc
150
PÖYRY ENERGY CONSULTING
[This page is intentionally blank]

GB GAS SECURITY OF SUPPLY AND OPTIONS FOR IMPROVEMENT
March 2010114_GBGasSecurityOfSupply_200910_v4_0.doc
151
PÖYRY ENERGY CONSULTING
QUALITY AND DOCUMENT CONTROL
Quality control Report’s unique identifier: 2010/114
Role Name Signature Date
Author(s): Andrew Morris, GarethDavies, Angus Paxton,Ericson Lee, BenFarrington, RickHemmings. Liam Wall
2009-2010
Approved by: Andrew Morris 10 March 2010
QC review by: Beverly King 11 March 2010
Document control
Version no. Unique id. Principal changes Date
V1_0 Final draft for review by DECC 22 Feb 2010
V2_0 114 Final report 9 March 2010
V3_0 114 Minor amendments 25 March 2010
V4_0 114 Figure 4 correction 5 May 2010

Pöyry is a global consulting and engineering firm.Our in-depth expertise extends to the fields of energy, industry,urban & mobility and water & environment.
Pöyry has 7000 experts operating in 50 countries.Pöyry’s net sales in 2009 were EUR 674 million and thecompany’s shares are quoted on NASDAQ OMX Helsinki(Pöyry PLC: POY1V).
Pöyry Energy Consulting is Europe's leading energyconsultancy providing strategic, commercial, regulatory andpolicy advice to Europe's energy markets. The team of 250energy specialists, located across 15 European offices in 12countries, offers unparalleled expertise in the rapidly changingenergy sector.
Pöyry Energy ConsultingKing Charles House Tel: +44 (0)1865 722660Park End Street Fax: +44 (0)1865 722988Oxford, OX1 1JD www.ilexenergy.comUK E-mail: [email protected]
Pöyry Energy (Oxford) Ltd, Registered in England No. 2573801King Charles House, Park End Street, Oxford OX1 1JD, UK
ww
w.p
oyry
.com