gatwick airport limited airport limited operational and financial performance 2 record passengers of...
TRANSCRIPT

RESULTS FOR THE YEAR ENDED 31 MARCH 2015
GATWICK AIRPORT LIMITED

OPERATIONAL AND FINANCIAL PERFORMANCE
2
Record passengers of 38.7m driven by significant growth in existing airlines
Consistently high service and satisfaction levels
Capital investment programme delivering airport transformation and resilience
Increased airport efficiencies through ACDM55 and maximising the passengers per movement
Contracts and Commitments framework embedded with contracts in place with airlines accounting for 80% of passengers
+ 7.8%
TRAFFIC GROWTH
£58m
PROFIT FOR THE YEAR
+ 13.2%
EBITDA GROWTH
£181m
CAPITAL EXPENDITURE
£1,711m
SENIOR NET DEBT *
0.59x
SENIOR RAR *
* All figures are for the year ended 31 March 2015 except Senior Net Debt and Senior RAR which are shown as at 31 March 2015
HIGHLIGHTS
3.11x
SENIOR ICR
Shortlisted by the Airports Commission for a new runway in the South East

OUR AMBITION & STRATEGY, CONSISTENTLY APPLIED

HELP OUR AIRLINES GROW
4
New airlines and routes, long &
short-haul, business & leisure
Expanded service to both Istanbul airports, frequency 4 per day from April 2014.
Increased in 2014 by 66.6%, announced a second Dreamliner at Gatwick from Summer 2015, increased New York to daily and launched a new route to Orlando.
Upgraded the second of 3 daily operations to an A380 aircraft.
Grown circa 83% YOY, adding a 4th frequency to Barcelona as well as launching new routes to Rome and Bilbao and upgrading to A321s.
Launched a new twice daily service to Madrid on A320 aircraft.
Increased by 12.7% in the year, new routes to Paris, Strasbourg and Brussels from March 2014 with continued focus on business routes with a new connection to Stuttgart.
Added 3 additional short haul aircraft , launching 9 new routes to Southern Europe. Replaced older 737 aircraft with A320s with 18% more seats.
Launching Spring 2016 with daily routes to North America.

94%
95%
96%
97%
98%
99%
100%
09/10 10/11 11/12 12/13 13/14 14/15
% o
f fl
igh
ts s
ucc
ess
fully
se
rve
d
Percentage of flights last bag delivered within 55 minutes – 12 Month Moving Average Total By Month
50%
60%
70%
80%
90%
100%
08/09 09/10 10/11 11/12 12/13 13/14 14/15
% Measures Failed % Measures Passed
75%
80%
85%
90%
95%
100%
09/10 10/11 11/12 12/13 13/14 14/15
North Terminal Average <5 min South Terminal Average <5 min Target
CONSISTENTLY HIGH SERVICE LEVELS AND SATISFACTION
5
Service Quality Remains the Best in the London System
Arrivals Bags Security Clearance Continues to Beat Target
On Time Departures remains a key focus
Change of ownership
45%
55%
65%
75%
85%
95%
09/10 10/11 11/12 12/13 13/14 14/15
% o
f fl
igh
ts d
ep
arti
ng
on
tim
e)
Percentage of flights departing on time - 12 Month Moving Average Total By Month
Change of ownership
Change of ownership
Change of ownership

0.0
0.5
1.0
1.5
2.0
2.5
3.0
3.5
4.0
4.5
1 2 3 4 5 6 7 8 9 10 11 12 13 14 15 16 17 18 19 20 21 22 23
CONSISTENTLY HIGH SERVICE LEVELS AND SATISFACTION
6
Sustained Passenger Ratings at Near 12/13 Record Levels
Significant Improvements Independently Recognised
Source: The Airport Service Quality (ASQ) - an independent survey run under the auspices of Airports Council International (ACI)
0.0
0.5
1.0
1.5
2.0
2.5
3.0
3.5
4.0
4.5
1 2 3 4 5 6 7 8 9 10 11 12 13 14 15 16 17 18 19 20 21
Benchmarking Q1 2015 Benchmarking Q4 2009
LGW
LGW Avg.
Avg.
Average
Change of ownership
3.9
4.0
4.1
4.2
4.3
09/10 10/11 11/12 12/13 13/14 14/15
Overall QSM Target
4.08
4.16
4.23
4.20
4.22
4.07

Q5: DELIVERING AIRPORT TRANSFORMATION PROGAMME
7

180.7
204.9
161.2 171.1
144.1
245.6
294.6
-
50.0
100.0
150.0
200.0
250.0
300.0
350.0
14/15 15/16 16/17 17/18 18/19 19/20 20/21
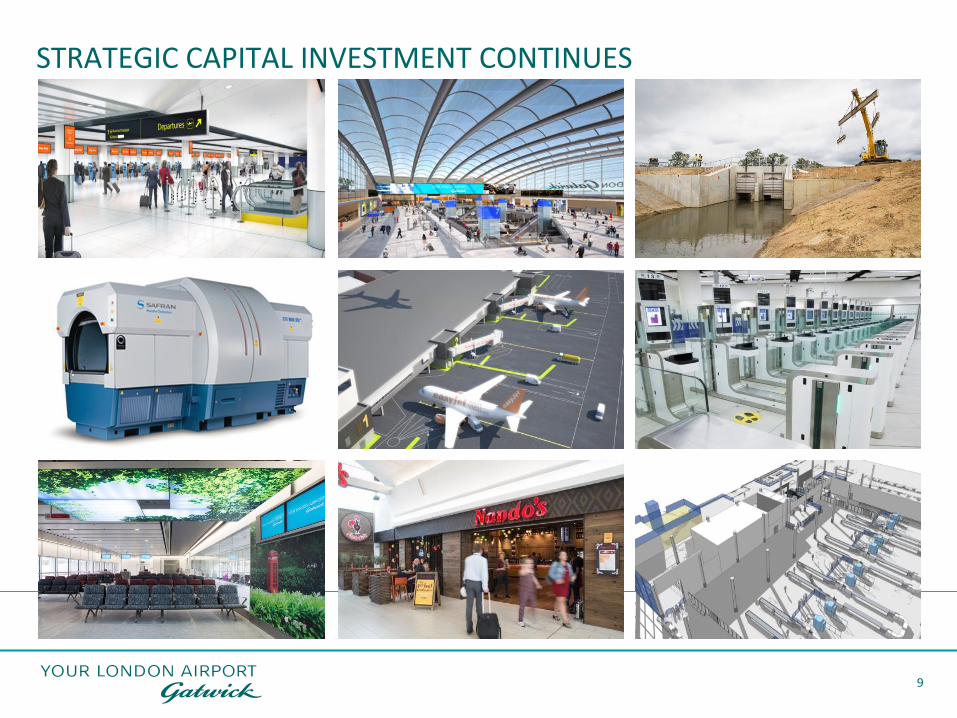
STRATEGIC CAPITAL INVESTMENT CONTINUES
• Capital investment programme of £1.4bn over 7 years delivery:
• Improved passenger experience
• Enhanced capacity allowing for growth
• Operational resilience
• Key projects delivered during the year include:
• Pier 5 phase 1 reconfiguration
• Gen II security implementation
• Fast track immigration
• Asset stewardship and operational resilience
• Selection of key projects ongoing:
• Pier 1 redevelopment (+£180m)
• Pier 5 phase 2 reconfiguration (£37m)
• North Terminal check-in, security, arrivals, and IDL (+£100m)
• Asset stewardship and operational resilience
• North Terminal immigration (£9m)
• Railway station (+£30m)
• IDL capacity expansion in both terminals (+£35m)
• HBS Standard 3 replacement (£140m)
8
Capital Expenditure (£m) - £1.4bn
Airlines Moves
• Objective is to have each airline operating from only one terminal
• British Airways moving to South terminal
• Virgin moving to North Terminal
• easyJet moving to North Terminal
Actively considering opportunities to accelerate capital investment
(depending on traffic growth)
STRATEGIC CAPITAL INVESTMENT CONTINUES
9

GATWICK’S RETAIL IS AMONG EUROPE’S BEST AND INCOME CRITICAL TO COMPETITIVENESS
10
EVER IMPROVING CUSTOMER SATISFACTION… Customer satisfaction is at an all time high across both
terminals 85% of our passengers rated the selection of food &
beverage outlets as ‘excellent’ or ‘good’ at the end of Q1 2015
84% gave the same ratings to the selection of retail outlets
Gatwick was ranked No. 1 for its provision of restaurant facilities in the ASQ survey which benchmarks Gatwick against 22 major European Airports

STRONG TRAFFIC GROWTH THROUGH EFFICIENT ASSET UTILISATION
11
• ACDM55 project enabling 55 runway movements an hour to be declared and taken up for Summer 2015
• Trend towards larger
aircraft continues (e.g easyJet acquisition of Flybe slots)
• Load factors continue to improve
2013/14 2014/15 Change %
Passengers (m) 35.9 38.7 7.8%
Seats per ATM 175.0 180.3 3.0%
Load factors 83.0% 83.9% 0.9% pts
ATMs (k) 247.9 255.8 3.2%

MARKET FOR TRAFFIC INCREASINGLY COMPETITIVE
12
GATWICK STANSTED LUTON HEATHROW
Last 12 months
+1.8% Last 12 months
+16.0% Last 12 months
+10.7%
Last 12 months
+7.8%
7.8%
1.8%
16.0%
10.7%
4.7%
3.0% 2.7%
0.9% 1.3% 0.3%
-1.8%
1.1%
6.9% 6.0%
-2.5%
8.1%
12 mths to Mar 15 12 mths to Mar 14 12 mths to Mar 13 12 mths to Mar 12

TRAFFIC GROWTH EXPECTED TO CONTINUE, BUT CONSTRAINED BY RUNWAY CAPACITY
13
30m
31m
32m
33m
34m
35m
36m
37m
38m
39m
40m
08/09 09/10 10/11 11/12 12/13 13/14 14/15
Passengers – Rolling Annual Total (millions)
Change of ownership
Latest traffic forecasts • +4.1% forecast growth for 2015/16 • Growing to over 40.0m passengers in 2015/16 • Gatwick’s traffic now a decade ahead of forecasts prepared by DfT and Airports Commission

£m YEAR ENDED
31 MARCH 2014 YEAR ENDED
31 MARCH 2015 CHANGE
Passengers (m) 35.9 38.7 7.8%
Turnover 593.7 638.0 7.5%
Operating costs (excl depreciation and amortisation) (334.3) (346.3) 3.6%
EBITDA (pre-exceptionals) 259.4 293.7 13.2%
Depreciation (112.4) (119.0) 5.9%
Exceptional costs (3.9) (17.8) 356.4%
EBIT 143.1 156.9 9.6%
Profit 57.5 58.2 1.2%
Capital expenditure 201.0 181.0 (10.0)%
Net debt* 1,507.3 1,658.9 10.1%
SOLID FINANCIAL PERFORMANCE
14
*Net debt is shown as at 31 March 2014 and 2015

7.5% INCREASE IN TURNOVER REFLECTING TRAFFIC GROWTH AND HIGHER SPEND PER PASSENGER
15
Turnover analysis
TOTAL £593.7m £638.0m +7.5%
Aeronautical revenues increased by 4.8%, due to a RPI-1% increase in the underlying yield and 7.8% rise in passengers, offset by a reduction due to 1st year of discounts under “Contracts and Commitments”
Net retail income per passenger increased by 2.4% to £3.81 • 20 new or refitted retail units opened this
year • Ranked No. 1 by passengers for catering
facilities vs. 22 major European Airports • Duty free income up 4%
Net car parking revenue per passenger increased by 1.5% to £1.37 • New premium products, improved
website and online marketing
75.6 83.8
65.6 72.4
135.1 149.1
317.4
332.7
2014 2015
Other Income Car parking Retail Aeronautical
+10.4%
+10.4%
+10.8%
+4.8%

3.6% INCREASE IN COSTS - FLAT OPERATING COSTS OFFSET BY WORK ON AIRPORTS COMMISSION AND ATC TRANSFER
16
Net staff costs flat reflecting • Reduction in headcount driven by
productivity savings. • Second year of 2 year pay deal for all staff. • Reduced bonus payments reflecting
balanced scorecard approach.
General & other expenses reflects • Increased consultancy cost to support
Airports Commission. • Costs associated with transfer of Air Traffic
Control contract. • Additional car parks costs to drive revenue
per passenger growth.
Utilities costs remained flat
Operating costs analysis
TOTAL £334.3m £346.3m +3.6%
36.7 33.7
55.8 55.3
99.7 115.3
142.1 142.0
0
50
100
150
200
250
300
350
2014 2015
Maintenance + IT Rates+Utilities
General + other expenses Staff costs
0.0%
Note: operating costs excluding depreciation and amortisation
+15.6%
-0.9%
-8.2%
Maintenance and IT reduced due to ongoing investment programme and contract efficiencies

CASHFLOW POSITIVE AFTER CAPITAL INVESTMENT AND NET INTEREST
17
290.0 182.3
75.6
133.0
44.9
5.8
1,507.3
1,658.9
1,100.0
1,200.0
1,300.0
1,400.0
1,500.0
1,600.0
1,700.0
1,800.0
Opening Capitalinvestment
Net interest Cash flow fromoperations
Restrictedpayments
Inflationaccretion
Other Closing
£m NET DEBT 31 MARCH 2014 TO 31 MARCH 2015

NEW BANK FACILITY AND TRANSITION TO TRANSFER RAB
18
FINANCIAL RATIO
YEAR ENDED 31 MARCH 2015
YEAR ENDING 31 MARCH 2016
YEAR ENDING 31 MARCH 2017
YEAR ENDING 31 MARCH 2018
Cash flow (per covenant) £234.8m £249.9m £278.8m £296.0m
Total interest (net) £75.6m £85.6m £86.5m £87.0m
Senior ICR ( trigger <1.50x) 3.11x 2.92x 3.23x 3.40x
Senior Net Debt (per covenant) £1,711.3m £1,805.4m £1,820.1m £1,825.2m
Transfer RAB £2,889.0m £3,238.0m £3,647.6m £4,051.7m
Senior RAR (trigger >0.70x) 0.59x 0.56x 0.50x 0.45x
Net Debt to EBITDA 6.00 5.62 4.92 4.53
FFO to Net Debt 12.5% 12.5% 15.3% 17.3%
DEBT MATURITY PROFILE REDUCES REFINANCING RISK
STRONG LIQUIDITY POSITION TO FUND ONGOING CAPITAL INVESTMENT PROGRAMME
£1,550m Class A Bonds – Maturities 2024-2041
£300m Bank Facilities – March 2019
Annual cash flow from operations £290.0m for the year ended 31 March 2015
Undrawn bank commitments £160m as at 31 March 2015
Restricted payments proposed £100m during 2015/2016
TRANSITION TO TRANSFER RAB
Transfer date 1 April 2014
Relevant Multiple – 11.1

REGULATORY RECAP
19
“Contracts & Commitments” framework backed by a licence from 1 April 2014.
Limitation on gross “core” yield from airport charges: RPI+1.0% p.a.
Based on published tariff over 7 years
Limitation on net “blended” yield from airport charges: RPI+0% p.a.
Based on published tariff less contract discounts
Measured over 7 year term – prices may be lower / higher than price path in a given year
Represents the yield actually received by Gatwick
CAA price monitoring: “fair price” benchmark using traditional RAB-based building block approach:
Net “blended” yield of RPI-1.6% p.a.
Forms part of the monitoring regime and is therefore a benchmark, not a licence price cap
Price Service
Based on Q5 service quality regime, but with two additional measures
Outbound baggage system performance
Security queues <30mins any measurement period on a day
Service rebates remain up to 7% of airport charges in aggregate but no bonuses are available
Other Terms
Investment & consultation commitment
Minimum capex requirements - £100m p.a. average with no capital expenditure triggers
Information commitment - no separate regulatory accounts
Operational and financial resilience commitments
No RAB
CAA review of operation of Commitments in second half of 2016
Contracts in place with airlines which accounted for 80% of passengers.

THE RUNWAY DEBATE
20
2015
2012 2013 2014
Airports Commission
Created
Dec: Interim report published
Gatwick & Heathrow plans are shortlisted to meet capacity for 2030
Commission says a further runway may be needed by 2050
May: Submissions made to AC
for Gatwick, Heathrow &
Estuary options
Sept: Estuary option ruled out
for 2030
Nov: Commission opens a
public consultation on
Gatwick & Heathrow options
Feb: public consultation closes
May: Air Quality consultation
Commission to make its
recommendation to
Government within weeks
Post Recommendation:
Government makes decision by
Christmas for subsequent
consultation
Airports Commission: “There is a clear case for one net additional runway in London and the South
East, to come into operation by 2030… the optimal approach is to continue to invest in an airport
system that caters for a range of airline business models.”

GATWICK IS THE ONLY DELIVERABLE SOLUTION
21
• Assisted by the early signs of UK economic recovery, traffic growth has continued through both incumbent and new airlines and routes allowing the airport to achieve record number of passengers. Growth is expected to continue throughout 2015/16
• Robust financial performance in line with expectations, reflecting passenger growth, new retail and car parking products delivering increased income per passenger and careful cost management
• Continued success in service quality measures with Gatwick remaining the best performing London airport
• Investment programme continuing to deliver new, improved and innovative facilities
• Contracts and Commitments proposal adopted by the CAA – tailored offerings to each airline enhancing the customer experience with contracts in place with airlines which accounted for 80% of passengers
• Continuing to make submissions to the Airports Commission supporting Gatwick’s unique opportunities in being the only deliverable solution.
CONCLUSION
22
Full details of today’s announcement at: gatwickairport.com/investor

DISCLAIMER
23
This material contains certain tables and other statistical analyses (the “Statistical Information”) which have been prepared in reliance on publicly available information and may be subject to rounding. Numerous assumptions were used in preparing the Statistical Information, which may or may not be reflected herein. Actual events may differ from those assumed and changes to any assumptions may have a material impact on the position or results shown by the Statistical Information. As such, no assurance can be given as to the Statistical Information’s accuracy, appropriateness or completeness in any particular context; nor as to whether the Statistical Information and/or the assumptions upon which it is based reflect present market conditions or future market performance. The Statistical Information should not be construed as either projections or predictions nor should any information herein be relied upon as legal, tax, financial or accounting advice. Gatwick Airport Limited (“GAL”) does not make any representation or warranty as to the accuracy or completeness of the Statistical Information.
These materials contain statements that are not purely historical in nature, but are “forward-looking statements”. These include, among other things, projections, forecasts, estimates of income, yield and return, and future performance targets. These forward-looking statements are based upon certain assumptions, not all of which are stated. Future events are difficult to predict and are beyond GAL’s control. Actual future events may differ from those assumed. All forward-looking statements are based on information available on the date hereof and neither GAL nor any of its affiliates or advisers assumes any duty to update any forward-looking statements. Accordingly, there can be no assurance that estimated returns or projections will be realised, that forward-looking statements will materialise or that actual returns or results will not be materially lower that those presented.
This material should not be construed as an offer or solicitation to buy or sell any securities, or any interest in any securities, and nothing herein should be construed as a recommendation or advice to invest in any securities.
This document has been sent to you in electronic form. You are reminded that documents transmitted via this medium may be altered or changed during the process of electronic transmission and consequently neither GAL nor any person who controls it (nor any director, officer, employee not agent of it or affiliate or adviser of such person) accepts any liability or responsibility whatsoever in respect of the difference between the document sent to you in electronic format and the hard copy version available to you upon request from GAL.
Any reference to “GAL” will include any of its affiliated associated companies and their respective directors, representatives or employees and/or any persons connected with them.

QUESTIONS