gatekeeper for targeting tumor hypoxia mesoporous … · 2017-04-19 · mesoporous nanocarriers...
TRANSCRIPT

1
Electronic Supplementary Information
Mesoporous Nanocarriers with Stimulus-Responsive Cyclodextrin Gatekeeper for Targeting Tumor Hypoxia
Jeonghun Lee, Eun-Taex Oh, Haerry Yoon, Chan Woo Kim, Yeji Han, Jaehun Song, Hyunil Jang, Heon Joo Park,* and Chulhee Kim*
Materials and instruments. Cetyltrimethylammonium bromide (CTAB),
tetraethylorthosilicate (TEOS), 3-aminopropyltriethoxysilane, copper(II) sulfate, doxorubicin
(DOX), propargyl amine, methoxy poly(ethylene glycol) (MW 2000), hexamethylene
diisocyanate, ferric acetylacetonate, NQO1, NADPH, ninhydrin, and sodium ascorbate from
Aldrich were used as received. Azobenzene-4,4'-dicarbonyl dichloride from TCI and mono-6-
azido-6-deoxy-β-cyclodextrin (N3-β-CD) from CycloLab were used as received. TEM images
were obtained using a Philips CM 200 instrument operated at an acceleration voltage of 120
kV. For the preparation of TEM samples, a drop of dispersed sample in distilled water (100
mg·L-1) was placed onto a 300-mesh copper grid coated with carbon film. About 2 min after
deposition, the grid was touched with filter paper to remove surface water. The samples were
dried before measurement. All fluorescence measurements were performed using a Shimadzu
RF-5301PC spectrofluorophotometer with an excitation wavelength of 485 nm (absorption
maximum wavelength of DOX). Emission and excitation slit widths were set at 3 nm. FT-IR
spectra were obtained using a VERTEX 80V vacuum spectrometer. All UV/Vis absorption
spectra were obtained using an Agilent 8453E UV/Vis spectrophotometer in a quartz cuvette
with a path length of 1 cm. Zeta-potential values of dispersed samples in distilled water were
obtained using an OTSUKA ELS-Z2 Particle Size Analyzer. Brunauer-Emmett-Teller (BET)
nitrogen adsorption/desorption isotherms and Barrett-Joyner-Halenda (BJH) pore size
distribution analysis were performed at 77 K on a Quantachrome instrument (ASAP 2020).
Electronic Supplementary Material (ESI) for Nanoscale.This journal is © The Royal Society of Chemistry 2017

2
Synthesis of MCM-41. MCM-41 type MSNs with a pore size of ~2.5 nm were prepared
according to a previously described procedure.1 Briefly, an aqueous solution (192 mL) of
CTAB (0.43 g) was added to a 2 M NaOH solution (1.4 mL). After stirring at 80°C for 5 min,
TEOS (2 mL) was added and the mixture was stirred for 2 h. The resulting solid was washed
thoroughly with water by centrifugation and dried in vacuo.
Synthesis of Si-NH2. 3-Aminopropyltriethoxysilane (3.5 mL) was added to an ethanol
solution (20 mL) of MCM-41 (50 mg), which was then allowed to react overnight at 60°C.
The resulting solid was washed thoroughly with ethanol and dried in vacuo.
Synthesis of Azo-alkyne. A DMF solution of azobenzene-4,4’-dicarbonyl dichloride was
allowed to react with propargyl amine for 3 h at room temperature. The resulting product was
used without purification to modify silica surfaces.
Synthesis of Si-Azo-alkyne. Si-NH2 was dispersed in DMF, after which Azo-alkyne was
added and stirred overnight at room temperature. The resulting solid was washed thoroughly
with DMF and ethanol by centrifugation to yield Si-Azo-alkyne.
Synthesis of Si-Azo-CD. Surfactant was removed from silica nanoparticles by stirring 60 mg
of ammonium nitrate into a solution of Si-Azo-alkyne (50 mg in 25 mL of EtOH) at 60°C for
30 min. The resulting solid was washed thoroughly with ethanol and dried in vacuo. For DOX
loading, surfactant-free Si-Azo-alkyne (50 mg) was soaked in a 1-mL solution of DOX (5 mg)
in DMF and stirred overnight. Then, N3-β-CD (50 mg) in 1 mL of DMF, copper (II) sulfate
(11.24 mg) in 100 μL of water, sodium ascorbate (17.83 mg) in 100 μL of water, and 500 μL
of t-butanol were added. The click reaction of silica nanoparticles was performed by stirring

3
under a microwave (150 W) at 90°C for 10 min. The resulting solid was washed thoroughly
with DMF and distilled water, then dried in vacuo.
Synthesis of Si-Azo-CD-PEG. PEG was introduced onto the surface of Si-Azo-CD by
allowing a DMF solution of methoxy poly(ethylene glycol) (MW 2000, 1 g, 0.5 mmol) to
react with hexamethylene diisocyanate (0.5 mmol) containing ferric acetylacetonate (10
μmol) for 3 h at 50°C. The resulting mixture was added to a DMF solution of Si-Azo-CD (50
mg) and stirred for 2 days. The resulting product was washed thoroughly with DMF and
distilled water by centrifugation to yield Si-Azo-CD-PEG.
Cell lines and culture conditions. A549 human lung adenocarcinoma epithelial cells and
MDA-MB-231 human breast cancer cells were cultured in Dulbecco’s Modified Eagle
Medium (DMEM) and RPMI medium, respectively. Cells were incubated at 37°C in a
humidified 5% CO2/95% air incubator. Hypoxic conditions were created by incubation of
cells in an InvivO2 500 hypoxia workstation (The Baker Company, Sanford, ME, USA).
Oxygen concentrations were fixed using a gas mixture containing 5% carbon dioxide and a
balance of nitrogen.
Antibodies. The primary antibodies included those against PARP, cleaved caspase-3 and β-
actin, obtained from Cell Signaling Technology (Beverly, MA, USA), and NQO1, from
Invitrogen (Carlsbad, CA, USA). The secondary antibodies used for immunoblotting included
horseradish peroxidase (HRP)-conjugated anti-mouse (Cell Signaling Technology) and HRP-
conjugated anti-rabbit (Santa Cruz Biotechnology, Dallas, TX, USA).
Immunoblot analysis. After lysing cells, proteins in cell lysates were separated by sodium
dodecyl sulfate- polyacrylamide gel electrophoresis (SDS-PAGE) and transferred to

4
nitrocellulose membranes. The membranes were blocked with 1% (v/v) nonfat dry milk in
Tris-buffered saline containing 0.05% Tween-20, then incubated first with primary antibodies
against the proteins of interest and then with HRP-conjugated goat anti-rabbit or anti-mouse
IgG secondary antibodies, as appropriate. Immunoreactive proteins were visualized using
enhanced chemiluminescence reagents (Pierce, Rockford, IL, USA).
Plasmids. To construct pCDNA3.1-myc-his6-NQO1 (pNQO1) and pCDNA3.1-myc-his6-
NQO1 C609T mutant (pNQO1(C609T)), total RNA was obtained from A549 cells using the
TRIzol reagent (Invitrogen) and cDNA was generated using SuperScriptTMIII Reverse
Transcriptase (Invitrogen). The open reading frame (ORFs) of NQO1 was PCR-amplified
using the appropriate primers. The primers sequences used were as follows: 5’-GGG GTA
CCA TGG TCG GCA GAA GAG CAC-3’ (forward), 5’-CCG CTC GAG TTT TCT AGC
TTT GAT CTG G-3’ (reverse), 5’-TCT TAG AAT CTC AAC TGA CA-3’ (internal C609T
forward) and 5’-TGT CAG TTG AGA ATT CTT AAG A-3’ (internal C609T reverse). The
PCR products were digested with restriction enzymes and directly ligated into the
pCDNA3.1-myc-His6 (Invitrogen). All constructs were confirmed by DNA sequencing
(Bionics, Seoul, Republic of Korea).
Construction of stable cell lines. Stable cell lines were constructed by first seeding cells at 5
× 104 cells per well in 24-well plates and then transfecting cells with 50 μL of a mixture
containing 1 μg of pCDNA3.1-myc-His6-NQO1, pCDNA3.1-myc-His6-NQO1(C609T) or
pshNQO1 (Qiagen, Valencia, CA, USA), together with TurboFect In Vitro Transfection
Reagent (Fermentas, Hanover, MD, USA). pCDNA3.1-myc-His6 and pshCont (Qiagen,
Valencia, CA, USA) were used as controls. Transfected cells were selected by culturing in the
presence of 1 mg/mL G418 (DuchefaBiochemie, Haarlem, Netherlands) for 1 week and were
maintained in DMEM or RPMI-1640 containing 0.5 mg/mL G418 during experiments.

5
Assessment of Dox release by confocal laser-scanning microscopy. The intracellular
release of DOX from Si-Azo-CD-PEG was assessed by first seeding cells in 8-well chamber
slides (Nunc, Roskilde, Denmark), and then culturing for 24 h under normoxic or hypoxic
conditions in the presence of Si-Azo-CD-PEG loaded with 5 μM DOX. Thereafter, DOX
fluorescence was imaged by obtaining single-plane confocal image sequences every 2 h using
a Nikon C1-Plus laser-scanning TE2000E confocal microscope (Nikon, Tokyo, Japan).
Assessment of localization of DOX by confocal laser scanning microscopy. Intracellular
release of DOX from Si-Azo-CD-PEG and the accumulation of DOX in nuclei were assessed
microscopically in cells seeded on coverslips coated with 0.2% gelatin. After treating with Si-
Azo-CD-PEG loaded with 5 μM DOX for 24 h, coverslip-mounted cells were fixed with 3.7%
paraformaldehyde (PFA) for 5 min. The coverslips were washed three times with PBS, and
cell nuclei were stained with DAPI (Sigma-Aldrich, St. Louis, MO, USA) for 2 min.
Coverslips were washed three times with PBS and mounted onto slides using a mounting
reagent (Invitrogen, Carlsbad, CA, USA). The fluorescence intensities of DOX and DAPI-
stained nuclei were analyzed using a laser-scanning TE2000E confocal microscope (Nikon,
Tokyo, Japan).
Clonogenic cell survival. Cells were seeded in 6-well plates and incubated overnight in a
humidified 5% CO2/95% air incubator at 37°C. Cells were treated with 5 μM DOX, Si-Azo-
CD-PEG without DOX or Si-Azo-CD-PEG loaded with 5 μM DOX, and then exposed to 20%
or 0.1% O2. After treating for 6 h, cells were gently washed three times with PBS and cultured
for an additional 14 days. Colonies formed were fixed with methanol and stained with crystal
violet (0.1% in methanol), and the number of colonies containing more than 50 cells was

6
counted. The surviving cell fractions of treated groups were calculated by expressing the
plating efficiency of treated cells relative to that of untreated control cells.
TUNEL assay. Cells were first seeded in 8-well chamber slides and incubated overnight in a
humidified 5% CO2/95% air incubator at 37°C. Cells were then treated with 5 μM DOX, Si-
Azo-CD-PEG without DOX or Si-Azo-CD-PEG loaded with 5 μM DOX, and exposed to
20% or 0.1% O2. After treating for 10 h, cells were fixed with 4% (v/v) paraformaldehyde
(PFA) for 15 min, washed with PBS containing 1% (w/v) bovine serum albumin,
permeabilized with 0.1% (v/v) Triton-X100, washed with PBS, and incubated for 1 h at 37°C
in the dark with an apoptosis detection solution (Apoptosis Detection System kit; Roche
Molecular Biochemicals, Mannheim, Germany). In situ-labeled nuclei were observed and
photographed using a Nikon C1-Plus laser-scanning TE2000E confocal microscope.
NQO1 enzymatic activity. Cells were washed twice with phenol-red–free Hank’s balanced
salt solution, resuspended in PBS (pH 7.2) containing 10 mg/mL aprotinin, sonicated four
times using 10-s pulses on ice, and centrifuged at 14,000 g for 20 minutes. The supernatants
were collected, transferred to microcentrifuge tubes, and stored at -80°C until NQO1
enzymatic activity could be assessed. NQO1 enzymatic activity was measured using an
NQO1 activity assay kit (Abcam, Cambridge, MA, USA) according to the manufacturer’s
recommendations.
Determination of cell proliferation. The proliferation rates of NQO1-null MDA-MB-231
cells and NQO1-overexpressing MDA-MB-231/pNQO1 cells were determined by counting
cells at 24, 48, and 72 h after seeding. Cell viability was assessed by trypan blue staining, and
cells were counted with a hemocytometer.

7
Tumor xenograft model. All animal studies were carried out according to an Institutional
Animal Care and Use Committee protocol (INHA 151008-383) approved for this study by
Inha University. Eight-week-old, female nude mice (BALB/c-nu) were purchased from Orient
Bio Laboratory Animal Inc. (Seoul, Korea) and maintained under specific-pathogen–free
conditions, with water and food provided ad libitum. The antitumor efficacy of free DOX, Si-
Azo-CD-PEG without DOX, and DOX-loaded Azo-Si-CD-PEG was investigated in an 8-wk
BALB/c nude mice model. For this, 2 106 MDA-MB-231 or MDA-MB-231/pNQO1 cells
were injected into the right flank of mice. Ten days after tumor implantation, MDA-MB-231
and MDA-MB-231/pNQO1 tumor-bearing mice were each randomly divided into the
following three experimental groups (n = 7 mice/group): free DOX, Si-Azo-CD-PEG without
DOX, and DOX-loaded Azo-Si-CD-PEG. Each group received intravenous administration of
180 mg/kg silica (equivalent to a DOX dose of 7.5 mg/kg) twice weekly for 3 weeks; the free
DOX group received the same drug dose (7.5 mg/kg) at the same interval. Body weight was
recorded every week. Tumor dimensions were measured by calipers, and volume was
calculated according to the formula, Tumor volume (mm3) = (length in mm) (width in
mm)2/2.
Measurement of DOX in mouse tumors and organs. DOX concentration in mouse tumors
and organs (liver, kidney, lung and spleen) was measured by DOX fluorescence as previously
described.2 Briefly, 400 μL of nuclear homogenates was added to 1.5 mL of acidified
isopropanol, 200 μL of 10% Triton X-100, and 200 μL of water. Each sample was extracted
overnight and centrifuged at 15,000 g for 20 min, and DOX fluorescence was measured at
excitation and emission wavelengths of 480 and 560 nm, respectively, using a Perkin Elmer
LS55 fluorescence spectrometer.

8
Immunofluorescence staining. Xenograft tumor tissues harvested from mice in each
treatment group were fixed in 4% buffered formalin for 24 h and then paraffin embedded
using conventional methods. After antigen retrieval with citrate buffer, tissue sections were
incubated overnight with a primary antibody against human NQO1 (Novus Biologicals)
diluted 1:100 in antibody diluent (IHC). After incubation with primary antibody, tissue
sections were washed three times with Tris-HCl buffer (pH 7.8) for 10 min each, and
incubated for 3 h with AlexaFluor 488-conjugated, affinity-purified goat-anti-rabbit IgG
(1∶200; Molecular Probes) at room temperature. DAPI (4′,6′-diamidino-2-phenylindole
dihydrochloride) was used to counterstain nuclei. Cell death in tumor xenografts was
determined by assessing apoptotic cells using a TUNEL assay (In Situ Cell Death Detection
Kit; Roche Applied Science) according to the manufacturer's instructions. Confocal images
were captured on a Zeiss LSM 510 Confocal System (Carl Zeiss Inc.) using Zeiss AIM
software. Sections were examined microscopically, and representative field were
photographed under 400 magnifications. Pimonidazole was used to generate hypoxic
adducts by intraperitoneal injection at 60 mg/kg (Hydroxyprobe) 60 min prior to sacrifice.
Hypoxia detection and pimonidazole staining was performed using a FITC conjugated
primary antibody overnight at 4°C.
Statistical Analysis. All grouped data are presented as means ± standard error of the mean
(SEM). Differences among/between groups were analyzed by analysis of variance (ANOVA)
or Student’s t-test, as appropriate, using GraphPad Prism software (GraphPad Software, Inc,
La Jolla, CA, USA). All experiments were repeated in at least duplicate with triplicate
technical replicates.

9
Fig. S1. BJH pore size distribution analysis of MCM-41.

10
Fig. S2. FT-IR spectra of Si-NH2, Si-Azo-alkyne and Si-Azo-CD.
Fig. S3. a) DLS data of Si-Azo-CD-PEG. b) Images of Si-Azo-CD and Si-Azo-CD-PEG
dispersed in PBS buffer after 1 week.

11
Fig. S4. UV/Vis absorption spectra of a ninhydrin test solution of Si-Azo-alkyne before and
after treatment with NQO1 and NADPH under normoxic or hypoxic conditions.
Fig. S5. Effect of hypoxia on NQO1 activity in MDA-MB-231 cells with NQO1 gain-of-
function. (a) Expression of NQO1 in MDA-MB-231, MDA-MB-231/pNQO1, and MDA-MB-
231/pNQO1(C609T) cells under normoxia. (b) NQO1 activity in MDA-MB-231, MDA-MB-
231/pNQO1, and MDA-MB-231/pNQO1(C609T) cells exposed to hypoxia for the indicated
times. The results from three independent experiments are expressed as means ± SEM.

12
Fig. S6. The NQO1-induced release of DOX from Si-Azo-CD-PEG in cancer cells depends
on hypoxia. MDA-MB-231, MDA-MB-231/pNQO1, and MDA-MB-231/pNQO1(C609T)
cells were treated with Si-Azo-CD-PEG loaded with 5 μM DOX for 12 h. The cells were
fixed with 3.7% PFA, washed three times with PBS, and stained with DAPI. The fluorescence
intensities of DOX and DAPI-stained nuclei were examined using a TE2000E laser-scanning
confocal microscope (Nikon, Tokyo, Japan).

13
Fig. S7. Effect of hypoxia on NQO1 activity in A549 cells with NQO1 loss-of-function. (a)
Expression of NQO1 in A549/shCont and A549/shNQO1 cells under normoxia. (b) NQO1
activity in A549/shCont and A549/shNQO1 cells exposed to hypoxia for the indicated times.
The results from three independent experiments are expressed as means ± SEM.
14
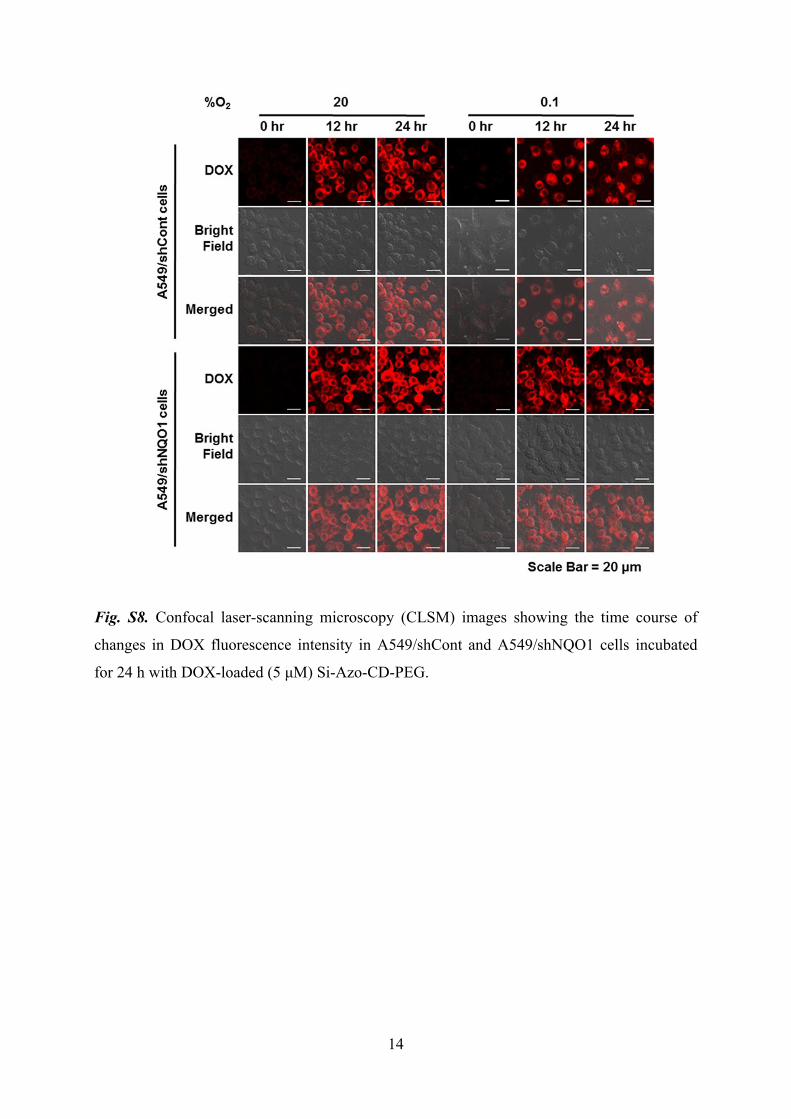
Fig. S8. Confocal laser-scanning microscopy (CLSM) images showing the time course of
changes in DOX fluorescence intensity in A549/shCont and A549/shNQO1 cells incubated
for 24 h with DOX-loaded (5 μM) Si-Azo-CD-PEG.
15
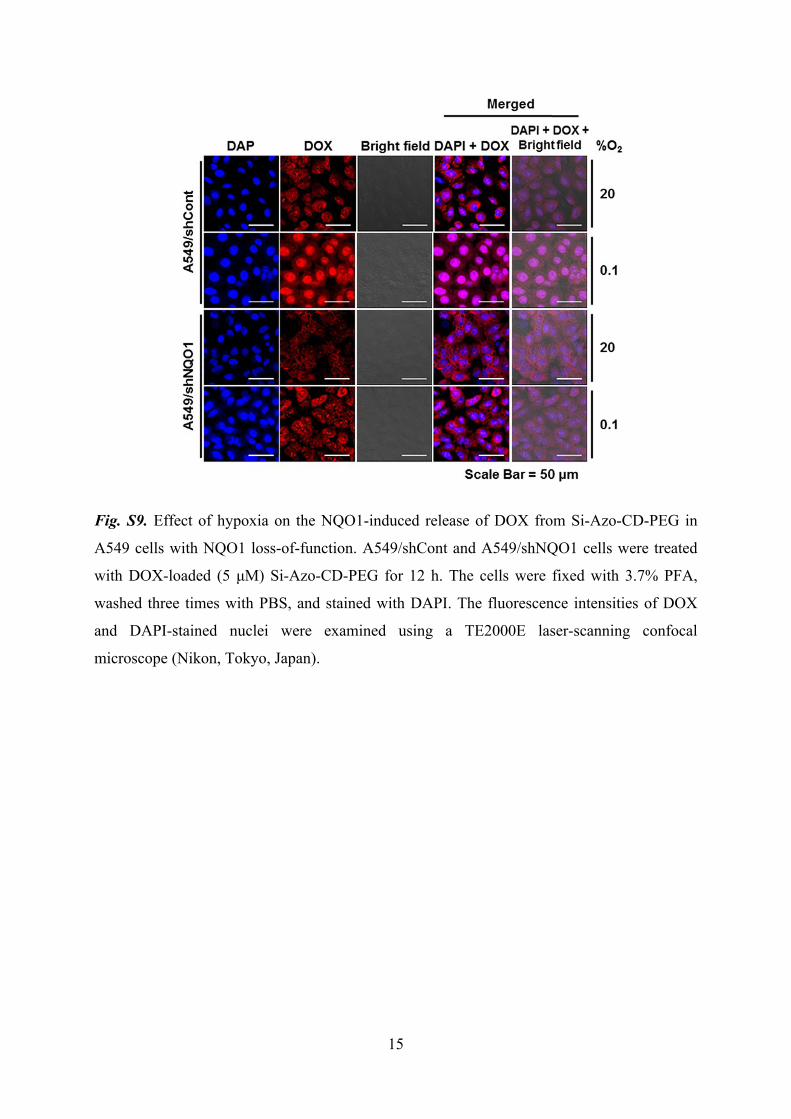
Fig. S9. Effect of hypoxia on the NQO1-induced release of DOX from Si-Azo-CD-PEG in
A549 cells with NQO1 loss-of-function. A549/shCont and A549/shNQO1 cells were treated
with DOX-loaded (5 μM) Si-Azo-CD-PEG for 12 h. The cells were fixed with 3.7% PFA,
washed three times with PBS, and stained with DAPI. The fluorescence intensities of DOX
and DAPI-stained nuclei were examined using a TE2000E laser-scanning confocal
microscope (Nikon, Tokyo, Japan).

16
Fig. S10. Clonogenic survival of A549/shCont and A549/shNQO1 cells incubated for 6 h
with 5 μM free DOX, Si-Azo-CD-PEG without DOX, or Si-Azo-CD-PEG loaded with 5 μM
DOX under normoxic and hypoxic conditions. After incubation, the cells were washed three
times with PBS and cultured for an additional 14 d; survival proportions were then calculated.
17
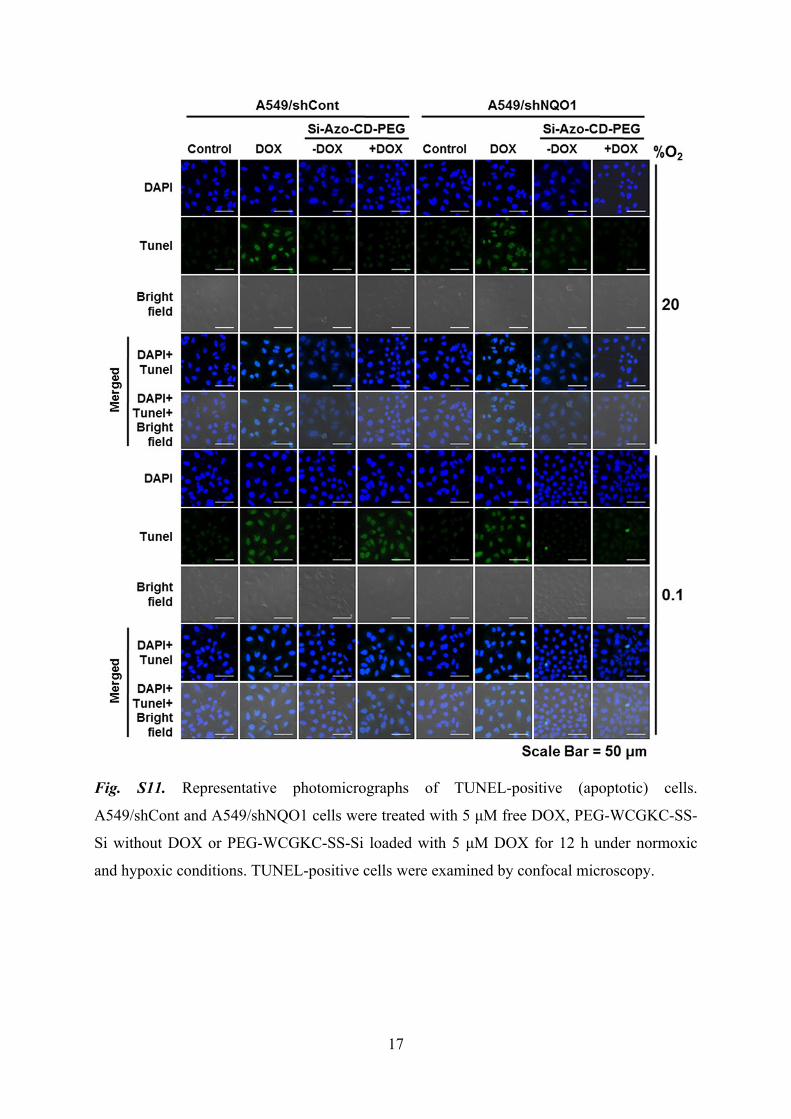
Fig. S11. Representative photomicrographs of TUNEL-positive (apoptotic) cells.
A549/shCont and A549/shNQO1 cells were treated with 5 μM free DOX, PEG-WCGKC-SS-
Si without DOX or PEG-WCGKC-SS-Si loaded with 5 μM DOX for 12 h under normoxic
and hypoxic conditions. TUNEL-positive cells were examined by confocal microscopy.

18
Fig. S12. The percentage of TUNEL-positive (apoptotic) cells was quantified and normalized
to cells stained with DAPI. Data are expressed as the means of three independent experiments
± standard deviation. Columns represent compiled data derived from three independent
experiments ± standard deviation. ****P < 0.0001.

19
Fig. S13. Effects of hypoxia-induced activation of NQO1 on the intracellular release of DOX
from Si-Azo-CD-PEG in MDA-MB-231 cells overexpressing NQO1, and on caspase activity
in cells treated with 5 μM free DOX, Si-Azo-CD-PEG without DOX, or Si-Azo-CD-PEG
loaded with 5 μM DOX for 24 h. Protein levels were determined by immunoblot analysis.

20
Fig. S14. Effect of hypoxia-induced activation of NQO1 enzyme activity on the intracellular
release of DOX from Si-Azo-CD-PEG in A549 cells with NQO1 loss-of-function and the
caspase activity in cells treated with 5 μM DOX, Si-Azo-CD-PEG w/o or Si-Azo-CD-PEG
loaded with 5 μM DOX for 24 hr. Protein levels were determined by immunoblot analysis.
Fig. S15. Cell proliferation rates in MDA-MB-231 and MDA-MB-231/pNQO1 cells under
normoxia. Cell proliferation rate was determined by cell counting after 24, 48, and 72 h
culture. Each point represents the mean ± SD.

21
Fig. S16. Average changes of body weights of MDA-MB-231 and MDA-MB-231/pNQO1
xenograft mice. Body weights of the mice were measured every 4 days for 32 days.
Fig. S17. Major organs (liver, kidney, lung and spleen) were excised from MDA-MB-231 and
MDA-MB-231/pNQO1 tumor-bearing mice after administration of free DOX, Si-Azo-CD-
PEG without DOX, or DOX-loaded Si-Azo-CD-PEG, and imaged to assess DOX
fluorescence (red); nuclei were counterstained with DAPI (blue).

22
References
1 J. Lee, H. Kim, S. Kim, H. Lee, J. Kim, N. Kim, H. J. Park, E. K. Choi, J. S. Lee and C. Kim, J. Mater. Chem., 2012, 22, 14061.
2 K. M. Laginha, S. Verwoert, G. J. R. Charrois and T. M. Allen, Clin. Cancer Res., 2005, 11, 6944.