gate: graphic approach to epidemiology - home - · pdf filethe gate frame: •graphic...
TRANSCRIPT

GATE: Graphic Approach To Epidemiology
1 picture, 2 formulas & 3 acronyms 1

The Krebs Cycle

The GATE frame:
• Graphic Appraisal Tool for Epidemiological
studies – a framework for appraising studies
• Graphic Architectural Tool for Epidemiological
studies – a framework for designing studies
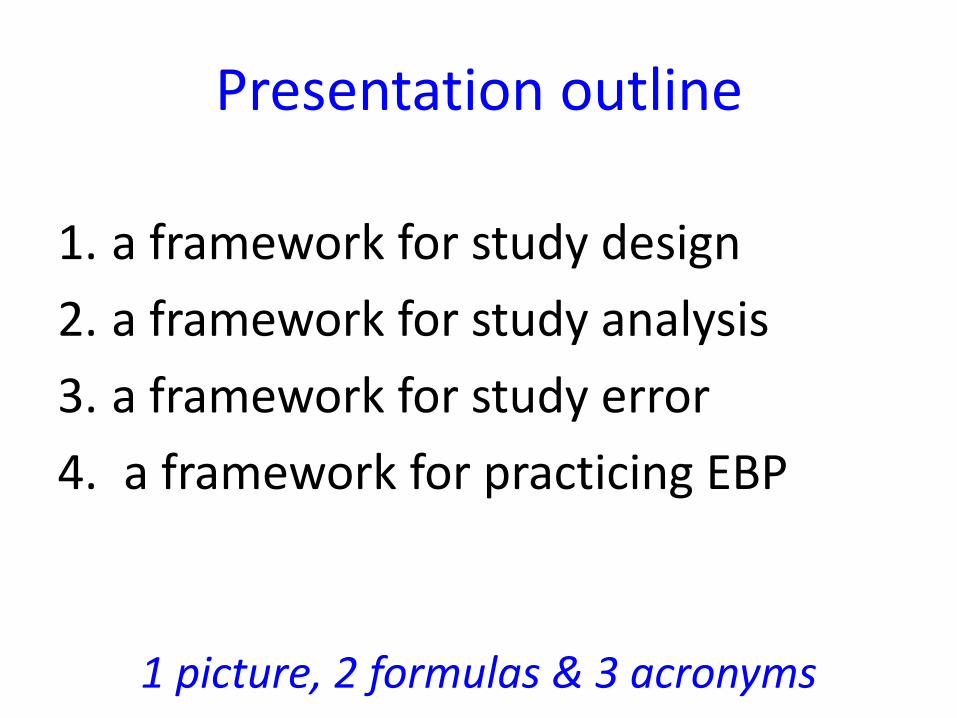
Presentation outline
1. a framework for study design
2. a framework for study analysis
3. a framework for study error
4. a framework for practicing EBP
1 picture, 2 formulas & 3 acronyms
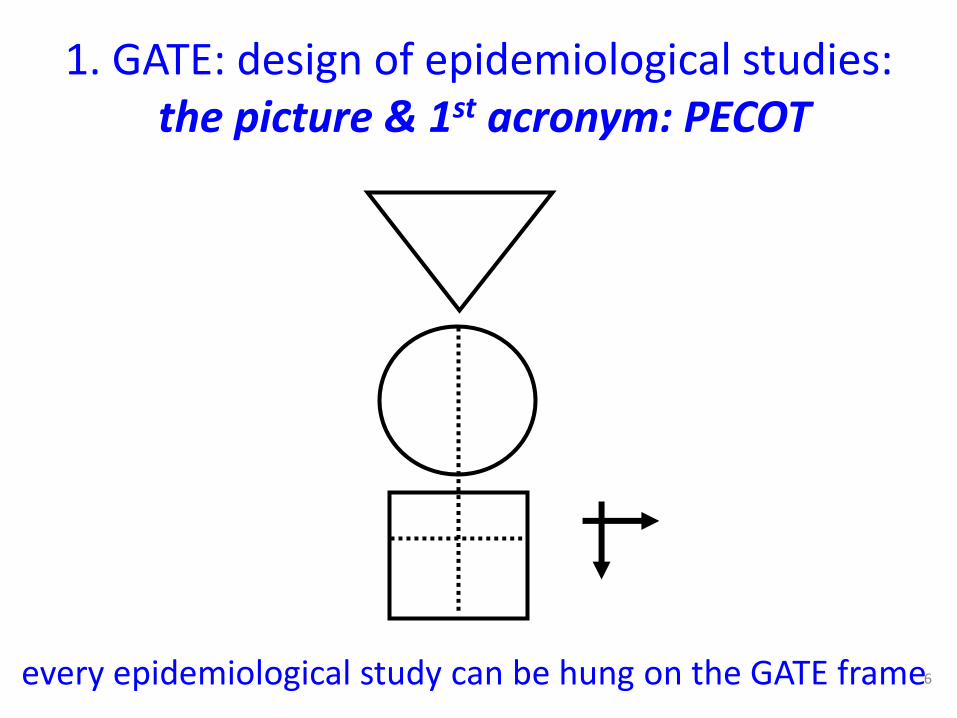
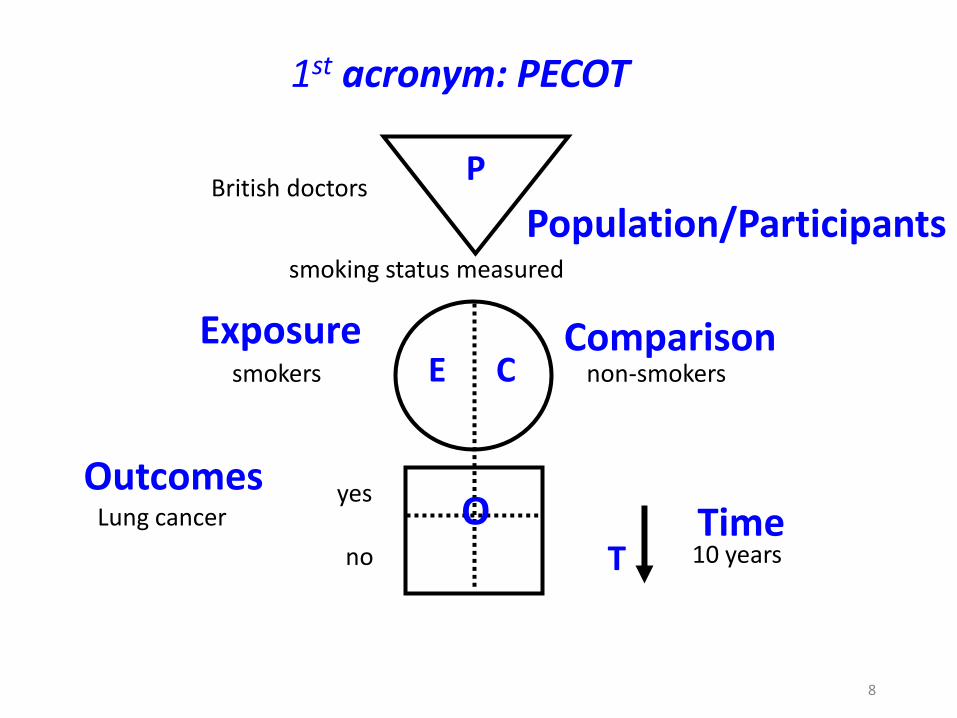
1. GATE: design of epidemiological studies: the picture & 1st acronym: PECOT
6 every epidemiological study can be hung on the GATE frame

British doctors
non-smokers smokers
Lung cancer yes
no 10 years
smoking status measured
Longitudinal (cohort) study
7
GATE Frame picture
Observational studies: allocated by measurement
British doctors
non-smokers smokers
Lung cancer yes
no 10 years
smoking status measured
8
1st acronym: PECOT
Population/Participants
Comparison Exposure
Outcomes Time
P
E C
O T
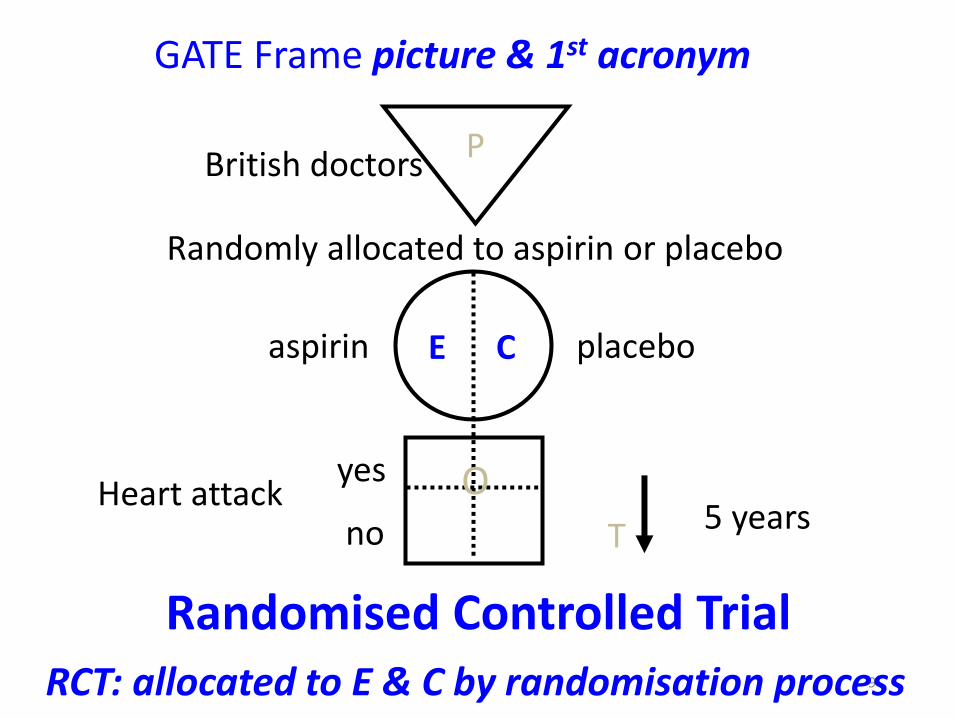
British doctors
Heart attack yes
no 5 years
Randomised Controlled Trial 9
GATE Frame picture & 1st acronym
Randomly allocated to aspirin or placebo
placebo aspirin
P
E C
O T
RCT: allocated to E & C by randomisation process

Middle-aged American women
Breast cancer
Mammogram negative
yes
no
Receive Mammogram screening Test
Diagnostic (prediction) study
Mammogram positive
10
P
E C
O T
GATE Frame picture & 1st acronym
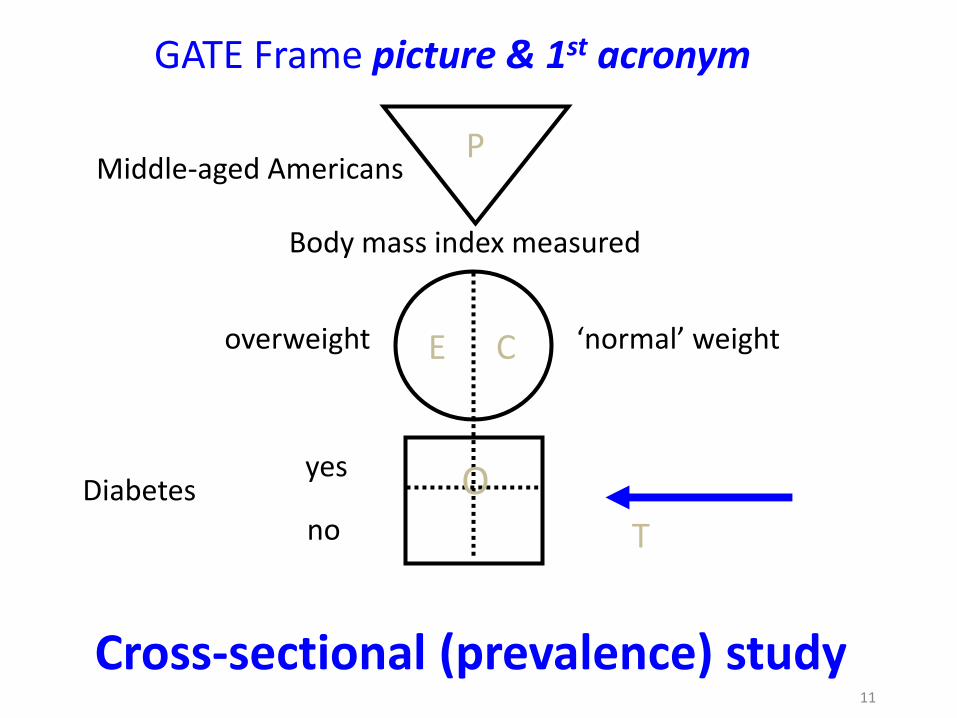
Middle-aged Americans
‘normal’ weight overweight
Diabetes yes
no
Body mass index measured
Cross-sectional (prevalence) study 11
P
E C
O T
GATE Frame picture & 1st acronym

Middle-aged Americans
‘normal’ weight obese
Diabetes yes
no
Body mass index measured
Cross-sectional study 12
overw
eight
pre-
P
E1 C
O T
E2
GATE Frame picture & 1st acronym
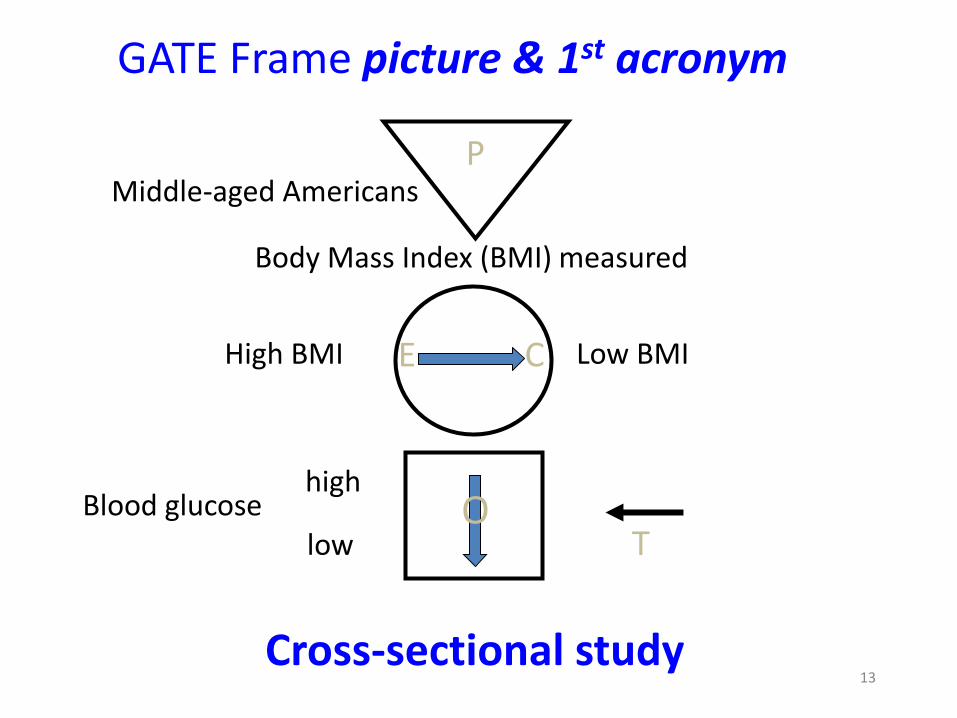
Middle-aged Americans
Low BMI High BMI
Blood glucose high
low
Body Mass Index (BMI) measured
Cross-sectional study 13
P
E C
O T
GATE Frame picture & 1st acronym
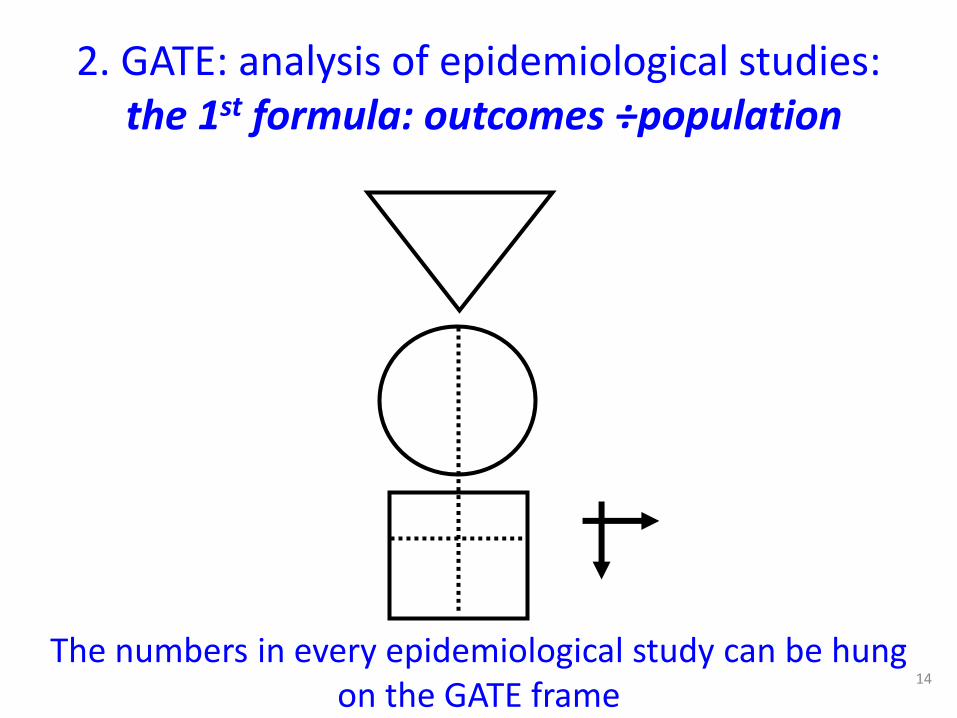
2. GATE: analysis of epidemiological studies: the 1st formula: outcomes ÷population
14
The numbers in every epidemiological study can be hung on the GATE frame

British doctors
non-smokers smokers
Lung cancer
yes
no 10 years
smoking status measured
15
1st formula: the Occurrence of outcomes =
number of outcomes ÷ number in the population
Participant Population
Comparison Group* Exposed Group*
Outcomes Time
P
EG CG
O T
* a Group is a sub-population
a b

British doctors
non-smokers smokers
Lung cancer
yes
no 10 years
smoking status measured
16
1st formula: occurrence = outcomes ÷ population
Population
Comparison Group Exposed Group
Outcomes Time
P
EG CG
O T
Exposed Group Occurrence (EGO) = a/EG = number of outcomes (a) ÷ number in exposed population (EG)
a b

British doctors
non-smokers smokers
Lung cancer
yes
no 10 years
smoking status measured
17
1st formula: occurrence = outcomes ÷ population
Population
Comparison Group Exposed Group
Outcomes Time
P
EG CG
O T
a b
Comparison Group Occurrence (CGO) = b/CG = number of outcomes (b) ÷ number in comparison population (CG)

British doctors
non-smokers smokers
Lung cancer
yes
no
10 years
smoking status measured
18
The goal of all epidemiological studies is to measure (& compare) the occurrence of outcomes in
(different) populations (EGO compared with CGO)
P
EG CG
O T
a b EGO:
Occurrence (risk) of cancer in smokers
CGO: Occurrence of cancer
in non-smokers

British doctors
yes
no
19
The goal of all epidemiological studies is to measure (& compare) the occurrence of outcomes in
(different) populations (EGO compared with CGO)
P
EG CG
O T
a b EGO:
Occurrence of MI if taking aspirin
CGO: Occurrence of MI if not taking aspirin Heart attack (MI)
5 years
Randomly allocated to aspirin or placebo
placebo aspirin

yes
no
20
The goal of all epidemiological studies is to measure (& compare) the occurrence of outcomes in
(different) populations (EGO compared with CGO)
P
EG CG
O T
a b
EGO: Occurrence of cancer if mammogram +ve
CGO: Occurrence of cancer if mammogram -ve
Middle-aged American women
Breast cancer
Mammogram negative
Receive Mammogram screening Test
Mammogram positive

Middle-aged Americans
Low BMI High BMI
EGO: Average blood glucose
in EG
high
low
Body Mass Index (BMI) measured
21
P
EG CG
O
The goal of all epidemiological studies is to measure (& compare) the occurrence of outcomes in
(different) populations (EGO compared with CGO)
CGO: Average blood glucose
in CG
EGO = sum of all glucose levels in EG ÷ number in EG
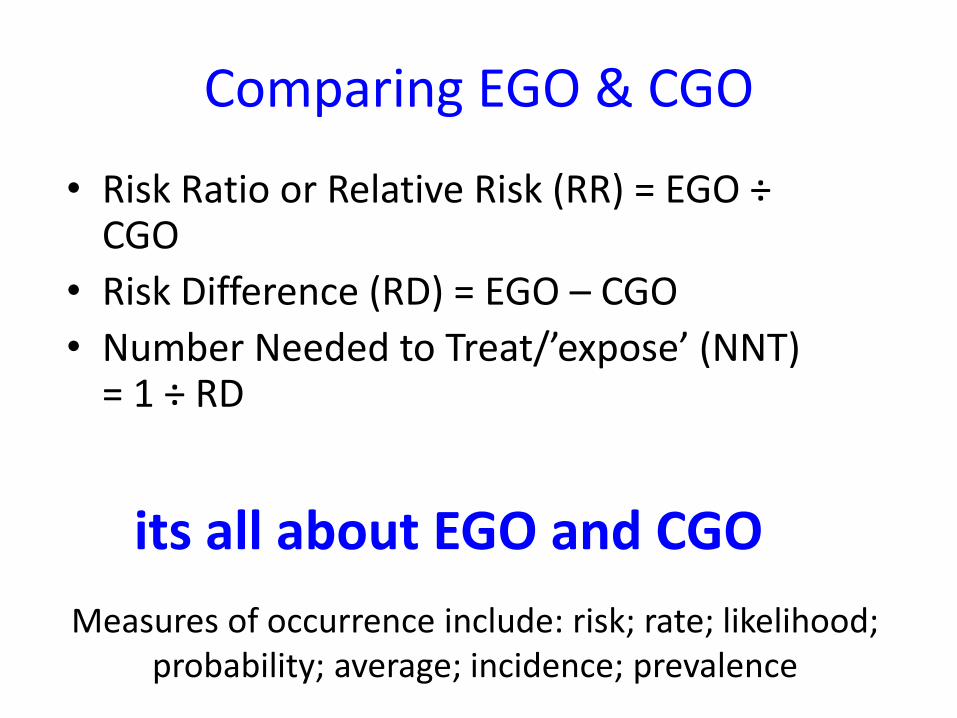
Comparing EGO & CGO
• Risk Ratio or Relative Risk (RR) = EGO ÷ CGO
• Risk Difference (RD) = EGO – CGO
• Number Needed to Treat/’expose’ (NNT) = 1 ÷ RD
its all about EGO and CGO
Measures of occurrence include: risk; rate; likelihood; probability; average; incidence; prevalence
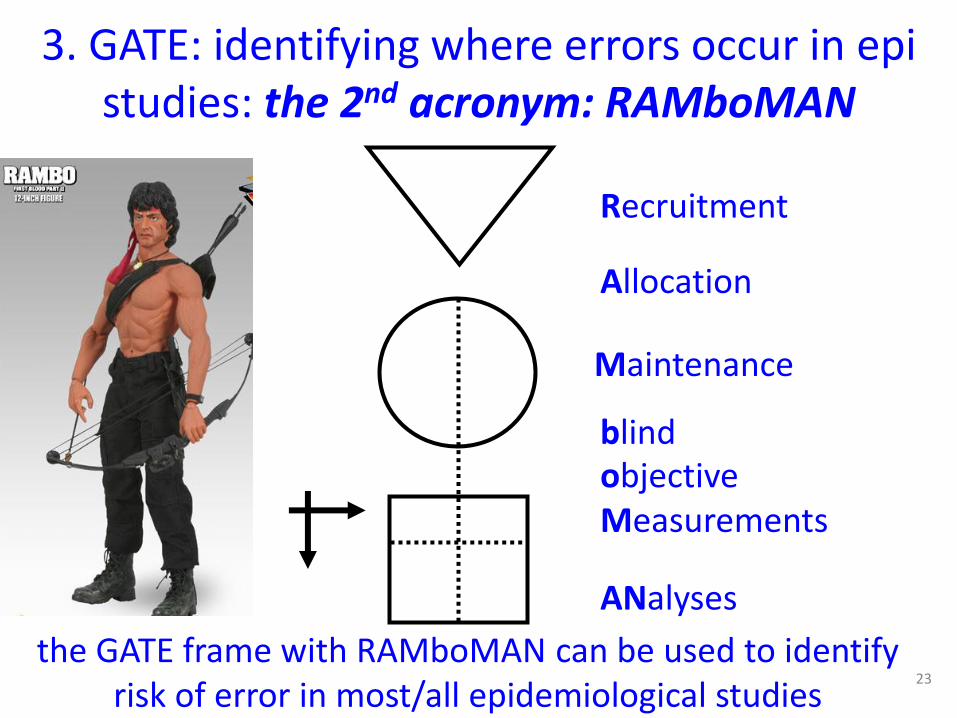
3. GATE: identifying where errors occur in epi studies: the 2nd acronym: RAMboMAN
23
the GATE frame with RAMboMAN can be used to identify risk of error in most/all epidemiological studies
Recruitment
Allocation
Maintenance
blind objective Measurements
ANalyses
RAMboMAN
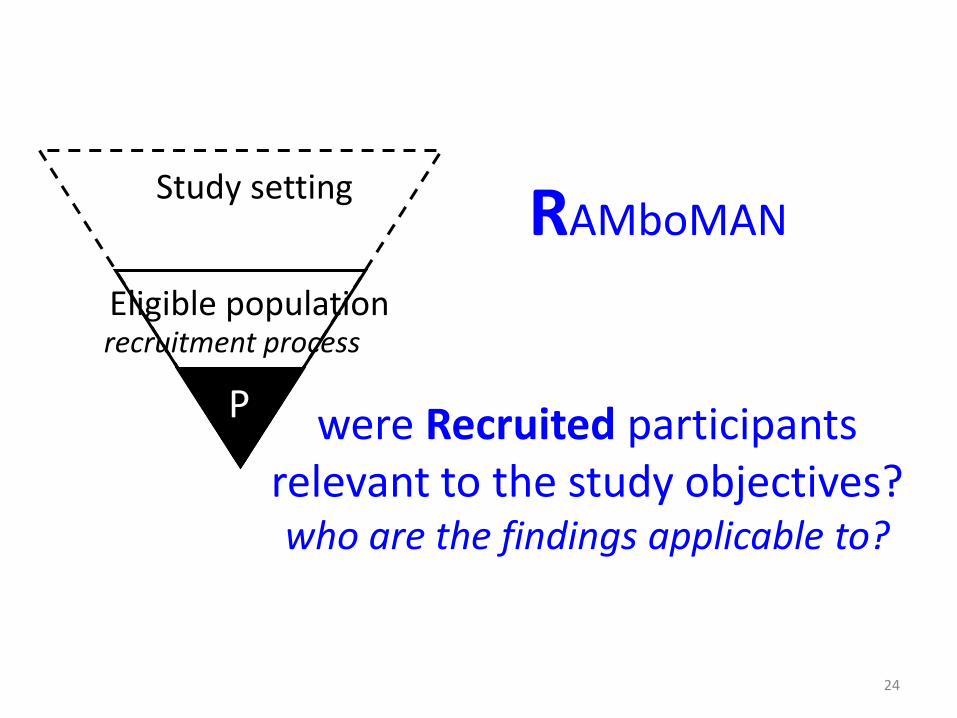
were Recruited participants relevant to the study objectives? who are the findings applicable to?
P P
Study setting
Eligible population
24
recruitment process

EG CG
O T
RCT: Allocated by randomisation (e.g to drugs)
EG CG
O T
Cohort: Allocated by measurement (e.g. smoking)
RAMboMAN: how well were participants Allocated to exposure & comparison groups?
EG & CG similar?
Was Allocation to EG & CG successful?
25
E & C measures accurate?
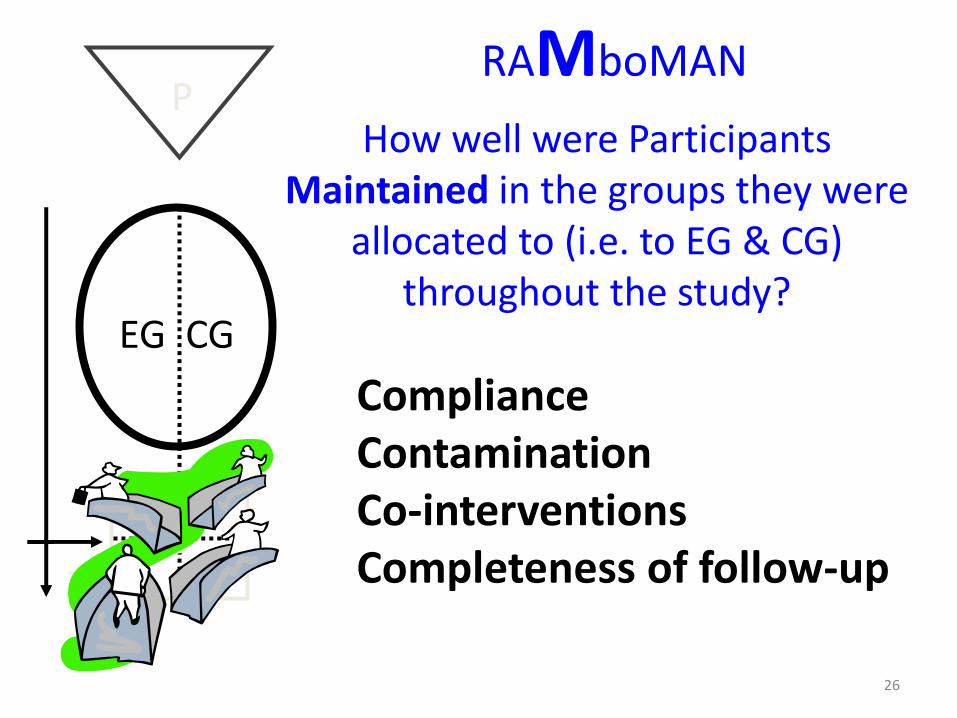
RAMboMAN
EG CG
O T
How well were Participants Maintained in the groups they were
allocated to (i.e. to EG & CG) throughout the study?
P
Compliance Contamination Co-interventions Completeness of follow-up
26
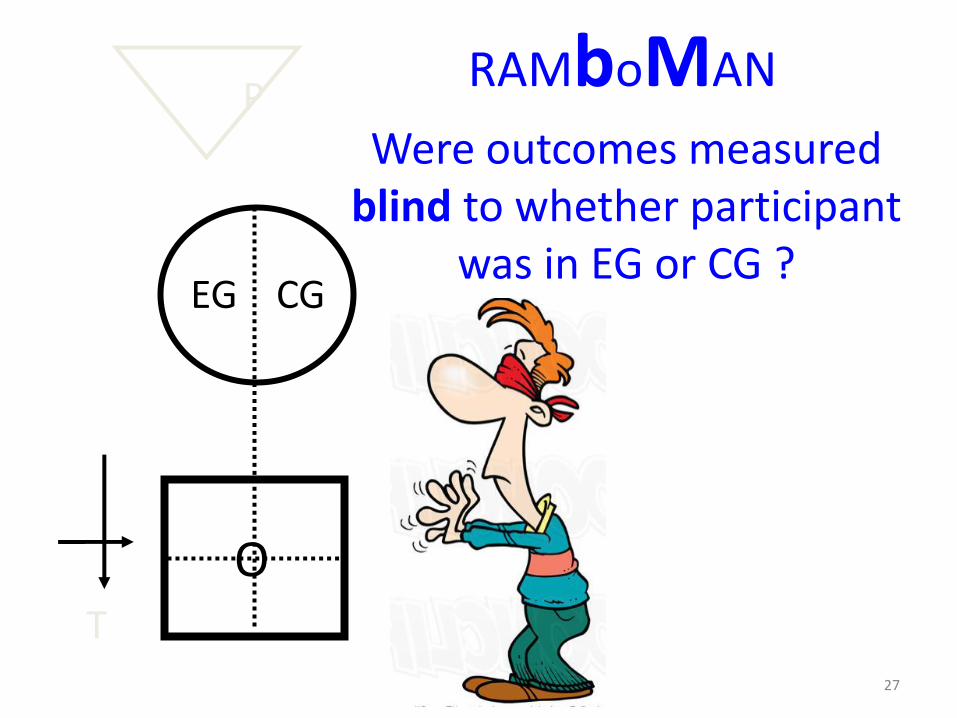
RAMboMAN
EG CG
O T
Were outcomes measured blind to whether participant
was in EG or CG ?
P
27
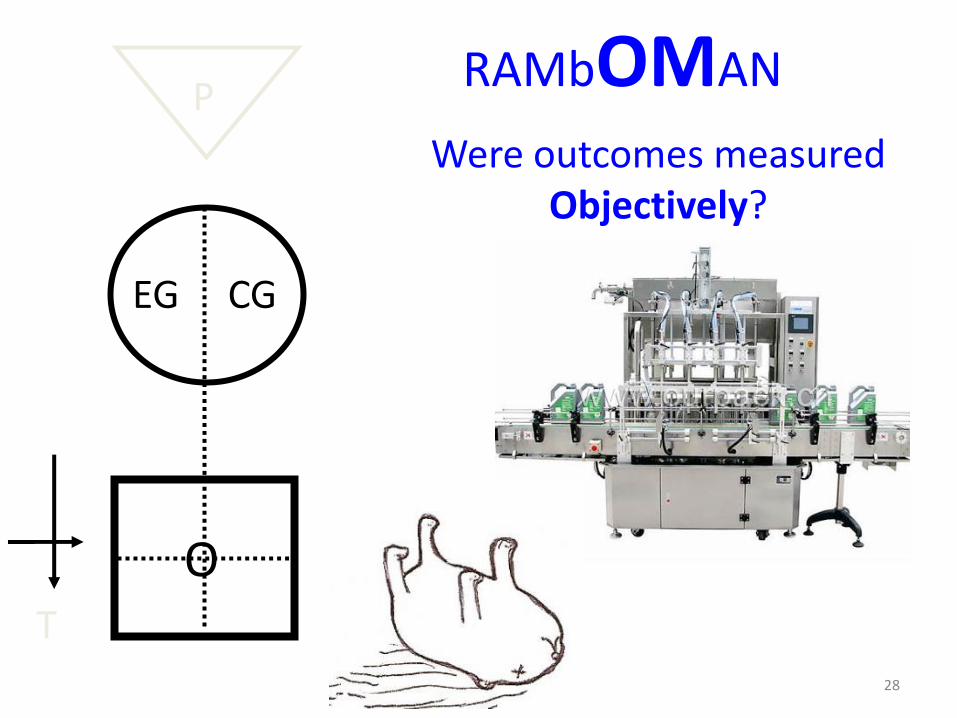
RAMbOMAN
EG CG
O T
Were outcomes measured Objectively?
P
28
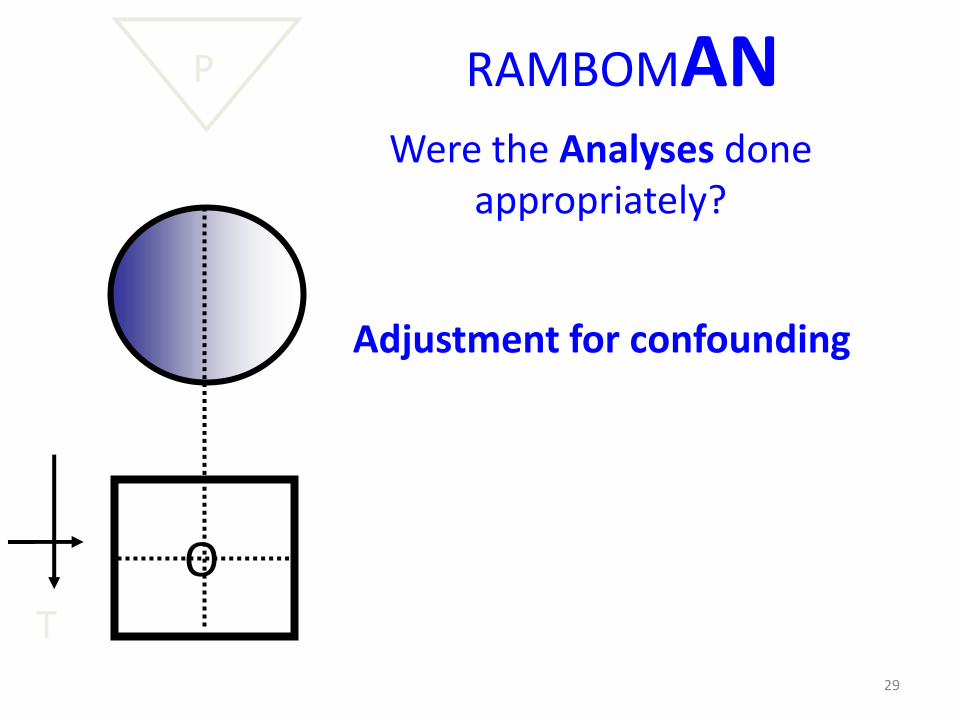
RAMBOMAN
EG CG
O T
Were the Analyses done appropriately?
P
Adjustment for confounding
29
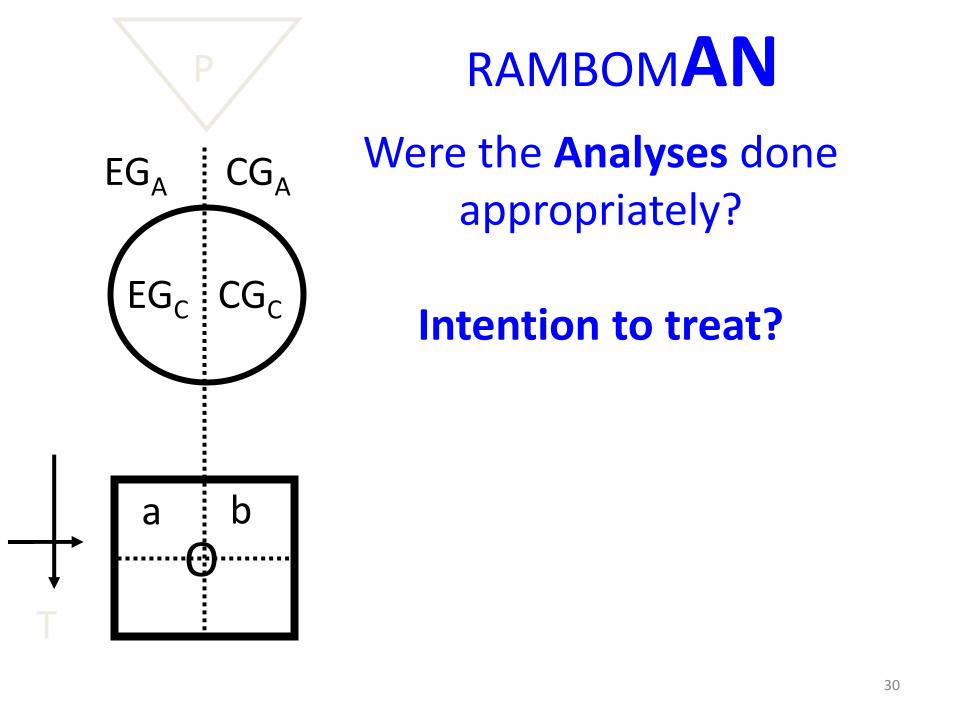
RAMBOMAN
EGC CGC
O T
Were the Analyses done appropriately?
Intention to treat?
P
30
EGA CGA
a b

the 2nd formula: random error = 95% confidence interval
31
There is about a 95% chance that the true value of EGO & CGO (in the underlying population) lies somewhere in the 95% CI (assuming no
non-random error)
EGO ± 95% CI CGO ± 95% CI
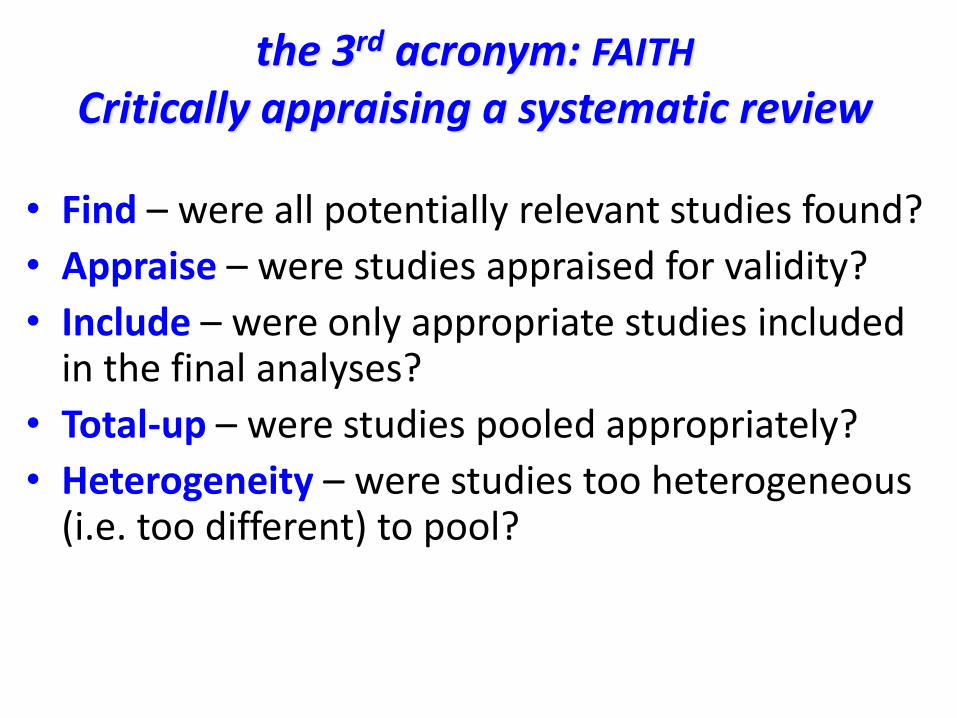
the 3rd acronym: FAITH
Critically appraising a systematic review
• Find – were all potentially relevant studies found?
• Appraise – were studies appraised for validity?
• Include – were only appropriate studies included in the final analyses?
• Total-up – were studies pooled appropriately?
• Heterogeneity – were studies too heterogeneous (i.e. too different) to pool?

4. GATE : a framework for the 4 steps of EBP

The steps of EBP:
1. Ask
2. Acquire
3. Appraise
4. Apply
[5. AUDIT your practice]

yes
no
35
1. Participants
3. Comparison 2. Exposure
4. Outcomes 5. Time
P
E C
O T
EBP Step 1: ASK - turn your question into a focused 5-part PECOT question
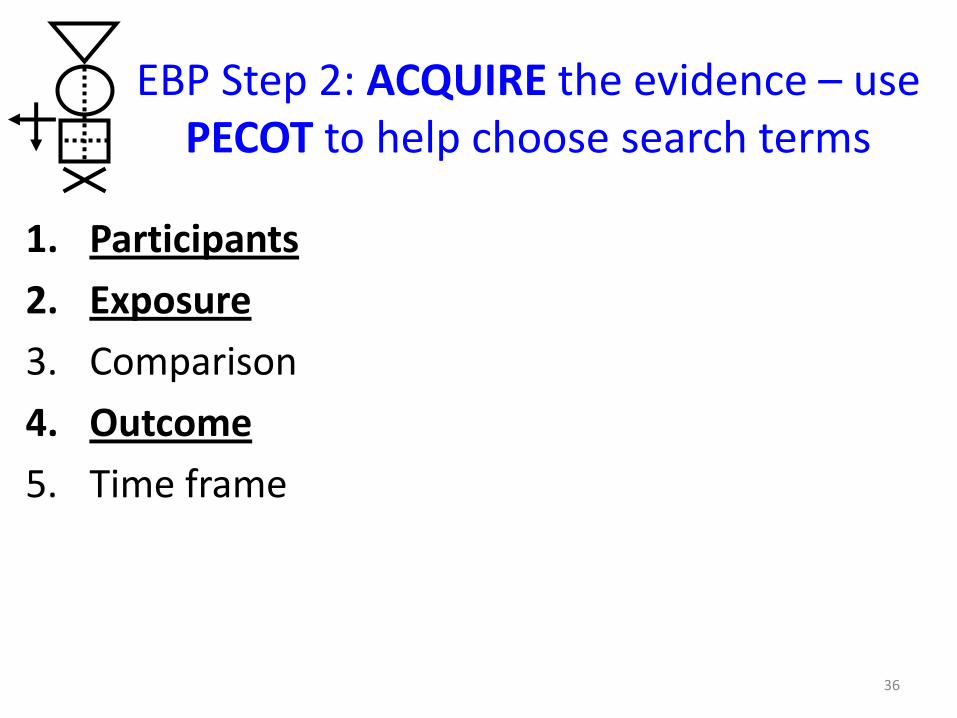
EBP Step 2: ACQUIRE the evidence – use PECOT to help choose search terms
1. Participants
2. Exposure
3. Comparison
4. Outcome
5. Time frame
36
P
E C
O
T
P
E
C
O
T
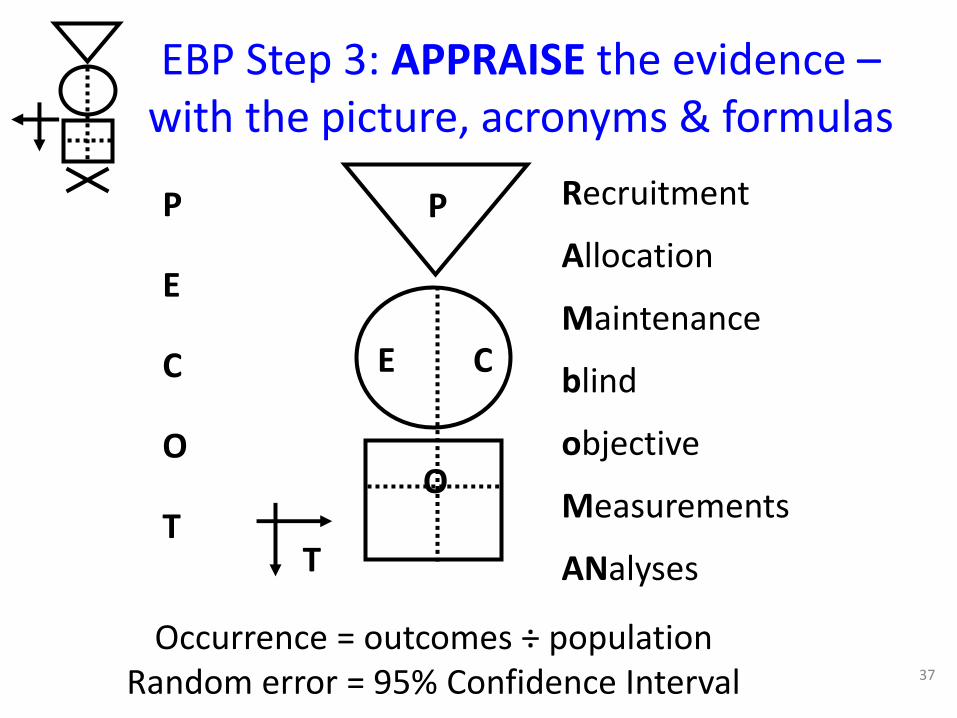
Recruitment
Allocation
Maintenance
blind
objective
Measurements
ANalyses
37
EBP Step 3: APPRAISE the evidence – with the picture, acronyms & formulas
Occurrence = outcomes ÷ population Random error = 95% Confidence Interval

EBP Step 4: APPLY the evidence by AMALGAMATING the relevant information &
making an evidence-based decision:’ the X-factor
©


Epidemiological evidence
Case circumstances
System features
Values & Preferences
X-factor: making evidence-based decisions
Practitioner eXpertise: ‘putting it all together’ - the art of practice
economic
legal
political
person
family
community
practitioner
Clinical expertise in the era of evidence-based medicine and patient choice. EBM 2002;736-8 (March/April)

Excel CATs & pdf Gate-lites
There is a GATE for every study design www.epiq.co.nz
& an on-line post-grad course in EBP 41

Extra slides

0
500000
1000000
1500000
2000000
2500000
Biomedical MEDLINE Trials Diagnostic?
Med
ical A
rtic
les p
er
Yea
r
5,000? per day
2,000 per day
75 per day
Med
ical
Art
icle
s Pe
r Ye
ar
Why do we need to use evidence efficiently?
EBP: informing decisions with the best up-to-date evidence

Bastian, Glasziou, Chalmers PLoS 2010 Vol 7 | Issue 9 | e1000326
The epidemic of evidence
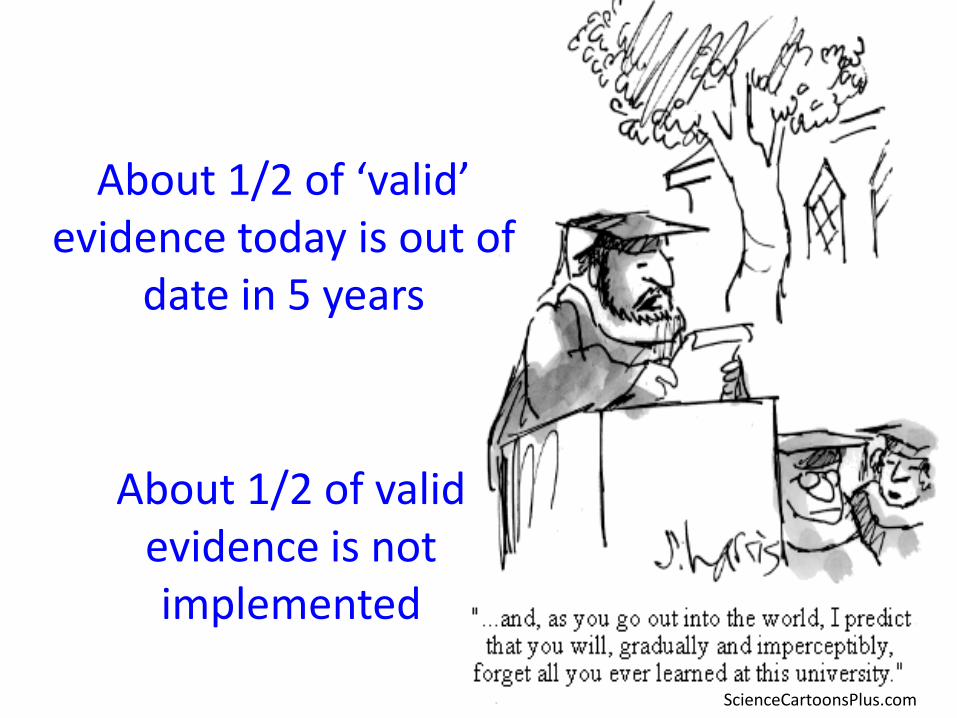
About 1/2 of ‘valid’ evidence today is out of
date in 5 years
ScienceCartoonsPlus.com
About 1/2 of valid evidence is not implemented

non-smokers smokers
Lung cancer yes
no
smoking status measured
Case-control study
47
GATE Frame picture & 1st acronym
P
E C
O T
cases
controls
Observational study: allocated by measurement

Middle-aged American women
Mammogram
Breast cancer negative
positive
negative
Measured with ‘gold standard’ for breast cancer
Diagnostic test accuracy study
Breast cancer positive
48
P
E C
O T
GATE Frame picture & 1st acronym
positive
negative
49
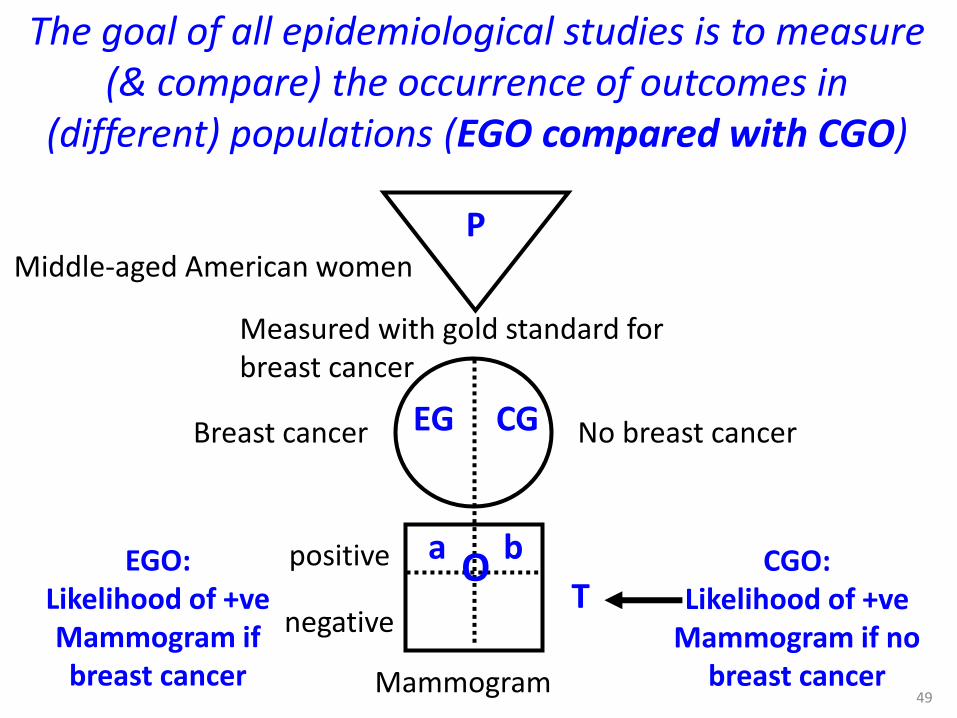
The goal of all epidemiological studies is to measure (& compare) the occurrence of outcomes in
(different) populations (EGO compared with CGO)
P
EG CG
O T
a b EGO: Likelihood of +ve Mammogram if breast cancer
Middle-aged American women
Mammogram
No breast cancer
Measured with gold standard for breast cancer
Breast cancer
CGO: Likelihood of +ve
Mammogram if no breast cancer

British doctors
non-smokers smokers
Lung cancer
yes
no 10 years
smoking status measured
50
1st formula (with time): occurrence = (outcomes ÷ population) ÷ Time
Population
Comparison Group Exposed Group
Outcomes Time
P
EG CG
O T
EGO = (a ÷ EG) during time T (a measure of cumulative incidence) EGO = (a ÷ EG) ÷ T (a measure of incidence rate)
a b

yes
no
51
P
EG CG
O T a b
EGO: Occurrence of cancer if mammogram +ve
CGO: Occurrence of cancer if mammogram -ve
Middle-aged American women
Breast cancer
Mammogram negative
Receive Mammogram screening Test
Mammogram positive
1st formula (with time): occurrence = (outcomes ÷ population) ÷ Time
EGO = (a ÷ EG) at time T (a measure of prevalence)