gasification of non-recycled plastics from municipal solid waste
TRANSCRIPT
Gasification of Non-Recycled
Plastics From Municipal Solid Waste
In the United States
Prepared for:
The American Chemistry Council
Prepared by:
Gershman, Brickner & Bratton, Inc.
8550 Arlington Boulevard
Suite 304 Fairfax, VA 22031
800-573-5801 www.gbbinc.com
August 13, 2013
Updated September 2013
Printed on recycled paper

GBB/12038-01 2 August 13, 2013
(This page intentionally left blank)

GBB 3 August 13, 2013
Contents1 Executive Summary ............................................................................................ 5
2 Introduction ....................................................................................................... 7
2.1 Definition of Non-Recycled Plastics ................................................................. 9
2.2 Overview of Conversion Technology Development and Utilization of MSW ........... 14
2.2.1 Mass Burn (Combustion) ....................................................................... 14
2.2.2 Refuse-Derived Fuel (Combustion) ......................................................... 14
2.2.3 Gasification and Pyrolysis (Partial or non-combustion) ............................... 14
3 Gasification ..................................................................................................... 16
3.1 Types of Gasification .................................................................................. 16
3.1.1 Updraft (counter‐current flow gasifying agent and feedstock) ..................... 17
3.1.2 Downdraft (co-current flow gasifying agent and feedstock) ........................ 17
3.1.3 Crossdraft ........................................................................................... 17
3.1.4 Plasma ............................................................................................... 18
3.2 System Feedstock (Inputs) – Process Feedstock Flexibility ............................... 19
3.3 Outputs .................................................................................................... 19
3.3.1 Power Generation ................................................................................ 19
3.3.2 Fuel Generation ................................................................................... 20
3.3.3 Chemical Generation ............................................................................ 20
3.4 System Economics ..................................................................................... 21
3.4.1 Estimated Costs ................................................................................... 21
3.4.2 Economic Factors ................................................................................. 21
3.5 Level of Commercialization .......................................................................... 23
4 Gasification Technology Companies ..................................................................... 24
5 Gasification Experience in the U.S. and Abroad ..................................................... 29
5.1 Examples of Gasification Development Experience .......................................... 29
5.1.1 Covanta- CLEERGASTM .......................................................................... 29
5.1.2 Enerkem ............................................................................................. 30
5.1.3 INEOS Bio ........................................................................................... 30
5.1.4 Plasco Energy Group ............................................................................ 31
5.1.5 Thermoselect ...................................................................................... 32
6 Opportunities and Barriers for Further Commercialization of the Gasification Technology in the U.S. ............................................................................................................ 33
6.1 Identified Opportunities .............................................................................. 33
6.2 Identified Barriers ...................................................................................... 34
7 Development of Gasification within a Community as Part of an Integrated Waste Management System .............................................................................................. 37
7.1 Cost/Tipping Fees of the Existing Solid Waste Management System ................... 39

GBB 4 August 13, 2013
7.2 Policy Framework ....................................................................................... 40
7.3 Public Perception ....................................................................................... 42
7.4 Markets and Infrastructure for the Final Products ............................................ 43
8 Conclusions ..................................................................................................... 44
Tables
Table 1. Plastics in Products in MSW, EPA 2010 .......................................................... 11 Table 2 Access to Plastics Recycling .......................................................................... 13 Table 3 Comparison of Gasification Options ................................................................ 19 Table 4 Estimated Capital Costs ............................................................................... 21 Table 5 Companies in North America with Demonstration or Commercial Scale Facilities Processing Mixed Waste .......................................................................................... 25 Table 6 Companies in North America With Demonstration or Commercial Scale Gasification Facilities Processing Only Biomass ............................................................................ 26 Table 7 Companies in North America with Operating Pilot Plants and/or Demonstration or Commercial Scale Facilities under Development .......................................................... 26 Table 8 Companies Worldwide with Commercial or Demonstration Gasification Facilities ... 27 Table 9 Current Facilities under Development in North America .................................... 28 Table 9 Thermoselect Facilities ................................................................................. 32
Figures
Figure 1 MSW Generation Rates, 1960-2010 ................................................................ 7 Figure 2 Waste Management Hierarchy ....................................................................... 8 Figure 3 2010 U.S. Waste Disposal and Recovery ......................................................... 8 Figure 4 MSW Recycling Rates, 1960-2020 .................................................................. 9 Figure 5 2010 Total MSW Generation (by material) ..................................................... 10 Figure 6 Energy Value of NRP Compared with Fossil Fuels Used in the US ....................... 12 Figure 7 Non-Recycled Plastic Products in the Landfilled MSW4 ...................................... 13 Figure 8 The Gasification Process ............................................................................. 15 Figure 9 Gasification System Types .......................................................................... 16 Figure 10 Plasma Gasification .................................................................................. 18 Figure 11 Gasification Output Pathways ..................................................................... 20 Figure 12: CLEERGAS Process Diagram ..................................................................... 29 Figure 13 Enerkem Process ..................................................................................... 30 Figure 14 INEOS Bio Process ................................................................................... 31 Figure 15 State Average Tipping Fees at Landfills and Other Disposal Facilities ............... 40 Figure 16 States and Territories Defining Waste-to-Energy as Renewable (as of 10/1/12) . 42

GBB 5 August 13, 2013
1 Executive Summary
Energy recovery via gasification of municipal solid waste (MSW) is an emerging conversion technology drawing increasing interest across North America for its potential dual benefits of energy recovery and landfill diversion. This report serves as an overview of gasification technologies processing municipal solid waste (MSW) that includes non-recycled plastic, and an inventory of the companies actively developing gasification technologies in the United States. The report also addresses challenges to developing gasification facilities in local communities and discusses potential solutions.
GBB compiled this report from its knowledge and experience with energy recovery and gasification facility implementation, literature review, and communication with individuals developing gasification technology. Specific technologies and economic scenarios will differ for each system and should be fully vetted. The report is intended to inform municipalities, government officials, plastics reclaimers, materials recovery facility (MRF) managers, investors, and other parties interested in the current state of gasification technology. The report evaluates how gasification may fit in community solid waste management planning, and what conditions can benefit or hinder its commercialization in North America.
Gasification technology potentially offers feedstock flexibility and customization for generating a range of desirable products. Gasification’s main product is synthesis gas (syngas) that is further processed into electricity, ethanol, diesel, or other chemicals. There are 147 companies offering gasification technologies in different stages of development worldwide, most of which market in the U.S. through licensees. In the U.S., currently 21 companies have more than 21 total pilot and demonstration facilities (presented in Tables 5 and 6), and 17 commercial-scale facilities are under development and/or under construction.
Findings presented here are based on publicly available information from existing pilot-scale or demonstration-scale facilities, as there are no full-scale commercial gasification facilities processing municipal solid waste (MSW) in the U.S. at this time, and few facilities currently operating in Europe. Several demonstration or small-scale facilities have been operated on special waste fractions such as rice hulls and wood chips.
Following are the key findings from the report:
There are 147 companies offering gasification technologies in different stages of development worldwide, most of which market in the U.S. through licensees.
Mass burn starved-air, two-stage combustion systems have a first stage gasification process. This (starved-air two-stage combustion) is a proven technology with several operating facilities in the U.S.
The high BTU value of non-recycled plastics makes them attractive feedstock components for gasification processes.
Gasification is a mature technology and is proven for applications such as in the petrochemical industry.
Gasification is attractive because of the versatility of its final marketable products such as steam, electricity, ethanol and other chemicals.
Gasification facilities processing mixed solid wastes have limited experience in scaling up from the pilot or demonstration scale to the commercial scale in North America.
No specific regulatory standard exists for gasification in all states or Canadian provinces now (as opposed to European standards that differentiate gasification from incineration, and have permitting requirements that are stringent but acceptant of

GBB 6 August 13, 2013
scientifically advanced technology); the use of solid waste as a feedstock and close association with mass burn technologies have led to gasification plants being regulated as waste-to-energy facilities.
Gasification as a disposal option may not be cost-competitive to current landfill gate fees in certain regions of the U.S.
Facility development is challenged by public acceptance, perceived risk, and the challenge of having predictable economics comparable to current costs.

GBB 7 August 13, 2013
2 Introduction
In the U.S., over 250 million tons of MSW was generated in 2010; of that, 54 percent was disposed in landfills.1 Nationwide, the amount of MSW generated annually has risen significantly over the past 20 years as shown in Figure 1. However, it decreased slightly between 2005 and the present. A significant amount of waste goes to landfills despite many robust residential recycling programs and the downturn in per-capita waste generation due to the economic crisis of 2008 - 2009. Landfilled waste presents a significant source of recyclables and energy currently destined for disposal.
Figure 1 MSW Generation Rates, 1960-20102
In the United States, solid waste management planning preferences are depicted by the U.S. Environmental Protection Agency’s (EPA) waste management hierarchy, which sequentially prefers source reduction, reuse, recycling, and energy recovery to landfill disposal. As shown in Figure 2, it is preferable to avoid waste generation or for reuse to occur. If source reduction or reuse is not possible, recycling is encouraged, followed by production of fuels, energy, and other useful products, over landfill disposal.
1 U.S.EPA, 2011. Estimates for annual MSW generation range from 250 million tons to over 340 million (BioCycle estimate) depending on the reporting source. 2 Ibid.

GBB 8 August 13, 2013
Figure 2 Waste Management Hierarchy3
Figure 3 illustrates the state of solid waste management in the U.S. The 34.1 percent of recovered waste includes 64.9 million tons of recycled materials and 20.2 million tons of composted yard trimmings, food scraps, and other organic material4. The EPA estimates that the recycling of waste in the U.S. provides an annual reduction of over 186 million metric tons of carbon dioxide equivalent emissions.3
Figure 3 2010 U.S. Waste Disposal and Recovery4
3 US Environmental Protection Agency (EPA), 2013. 4 “Municipal Solid Waste Generation, Recycling, and Disposal in the United States: Facts and Figures for 2010, U.S. Environmental Protection Agency.

GBB 9 August 13, 2013
Additionally, 11.7 percent of the waste stream (29.3 million tons in 2010) is used as a fuel for energy production at mass burn or refuse-derived fuel facilities.
The MSW recycling rate has significantly increased over the past 20 years, with the average nationwide recycling level reaching 34 percent in 2010. This is illustrated by Figure 4.
Figure 4 MSW Recycling Rates, 1960-20205
The economics of the private energy and materials markets drive recycling and energy recovery rates. Recovery rates increase when there is a profitable market for the output (recycled materials or energy). Markets tend to expand as the cost of recycling or recovery decreases. Advanced waste processing technologies can further increase materials and energy recovery rates. Funding for research on application of technologies such as gasification, pyrolysis, anaerobic digestion, and fermentation of MSW is available through many public and private sector organizations. The U.S. Department of Energy and U.S. Department of Agriculture provide support in the form of grants and loan guarantees to developers of waste to biofuels facilities. Private and corporate investments are also common practice to develop facilities6 with these technologies.
2.1 Definition of Non-Recycled Plastics
In this report, non-recycled plastics are defined as plastics not diverted for recycling that remain in MSW or in MRF residue. Non-recycled plastics are currently directed to WTE facilities or landfills. The EPA has reported that approximately 12 percent of total MSW generated is comprised of plastic materials, over 31 million tons in 2010. Certain materials in the non-recycled plastic stream can be readily recycled (e.g. PET and HDPE bottles and PP containers) in existing infrastructure, while others are not easily recycled due to their composition, as they are often made of different films and/or polymer blends.
5 Ibid. 6 Examples include: Enerkem and Plasco.
GBB 10 August 13, 2013
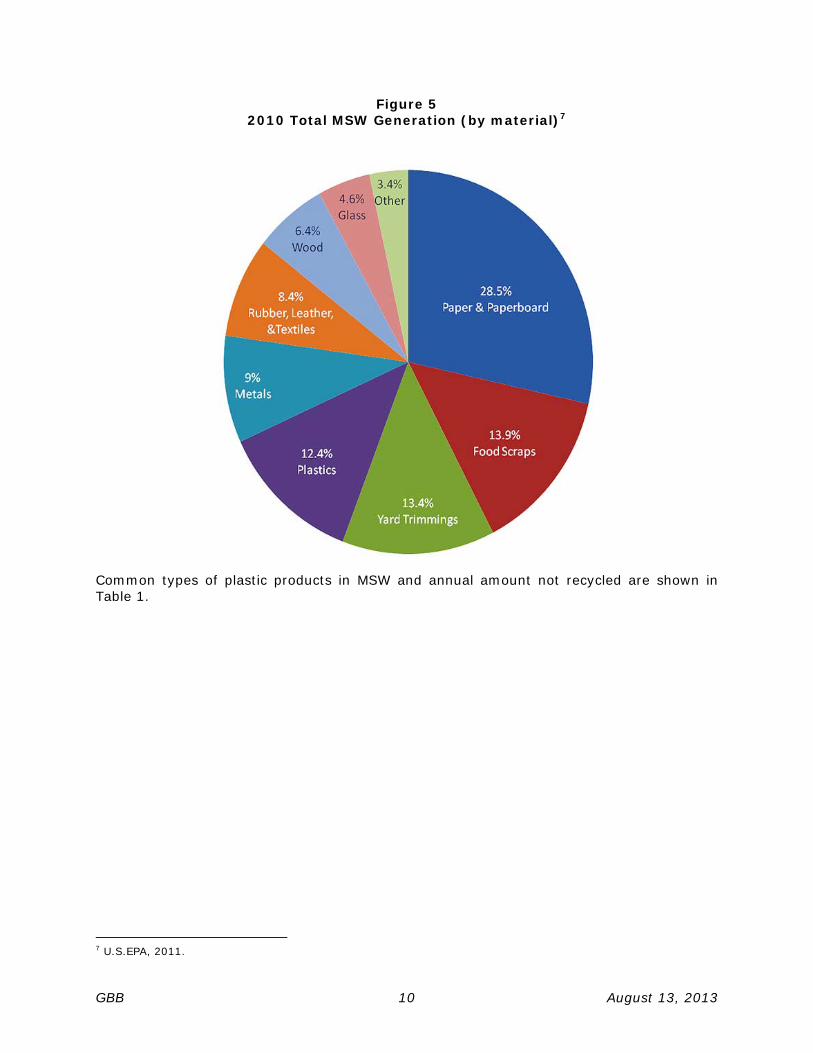
Figure 5 2010 Total MSW Generation (by material)7
Common types of plastic products in MSW and annual amount not recycled are shown in Table 1.
7 U.S.EPA, 2011.

GBB 11 August 13, 2013
Table 1. Plastics in Products in MSW, EPA 2010
Generated (Thousand
tons)
Recycled (Thousand
tons)
Discarded (Non-recycled plastic) (Thousand tons)
Recovery as Percent of Generation
Durable goods 10,960 700 10,260 6.4% Non-durable goods
Plastic plates and cups 890 Neg. 890 0.0%
Trash bags 980 980 0.0% All other non-
durables 4,530 4,530 0.0%
Total Non-durables 6,400 6,400 0.0%
Plastic containers and Packaging
Bottles and Jars/ PET 2,670 780 1,890 29.2%
Bottles and Jars/ HDPE 800 220 580 27.5%
Other containers 1,830 300 1,530 16.4% Bags, Sacks &
Wraps 3,930 450 3,480 11.5%
Other Packaging 4,450 100 4,350 2.2% Total Packaging 13,680 1,850 11,830 13.5% Total 31,040 2,550 28,490 8.2%
Non- recycled plastics (NRP) are an attractive feedstock for thermal conversion technologies because of their significant heating value. A study by the Columbia University Earth Engineering Center showed the Lower Heating Value (LHV) of non-recycled plastics is about 32 MJ/kilogram (14,000 Btu/lb)8. The calculated heating value of the NRP is higher than the average grades of coal and petroleum coke available on the U.S. market8.

GBB 12 August 13, 2013
Figure 6 Energy Value of NRP Compared with Fossil Fuels Used in the US8
In 2010, 2.5 million tons, or 8 percent, of plastics generated in the U.S. as part of the MSW were recycled. The remaining 28 million tons of plastics generated fall into the “non-recycled” category. Approximately 14 million tons of the generated plastic waste were containers and packaging; approximately 11 million tons in durable goods, including appliances; and approximately 7 million tons as non-durable goods, including plastic cups and plates.9 Over 13 percent of the 14 million tons of plastic containers and packaging generated in MSW are recycled. Several resin grades are more economically recycled than others, including those that have a strong presence in the containers and packaging category. Plastic resins PET and HDPE, and increasingly PP have markets for processing and remanufacturing in the U.S., and are therefore often targeted by municipalities and waste haulers in recycling programs, leading to higher recycling levels for these plastics.
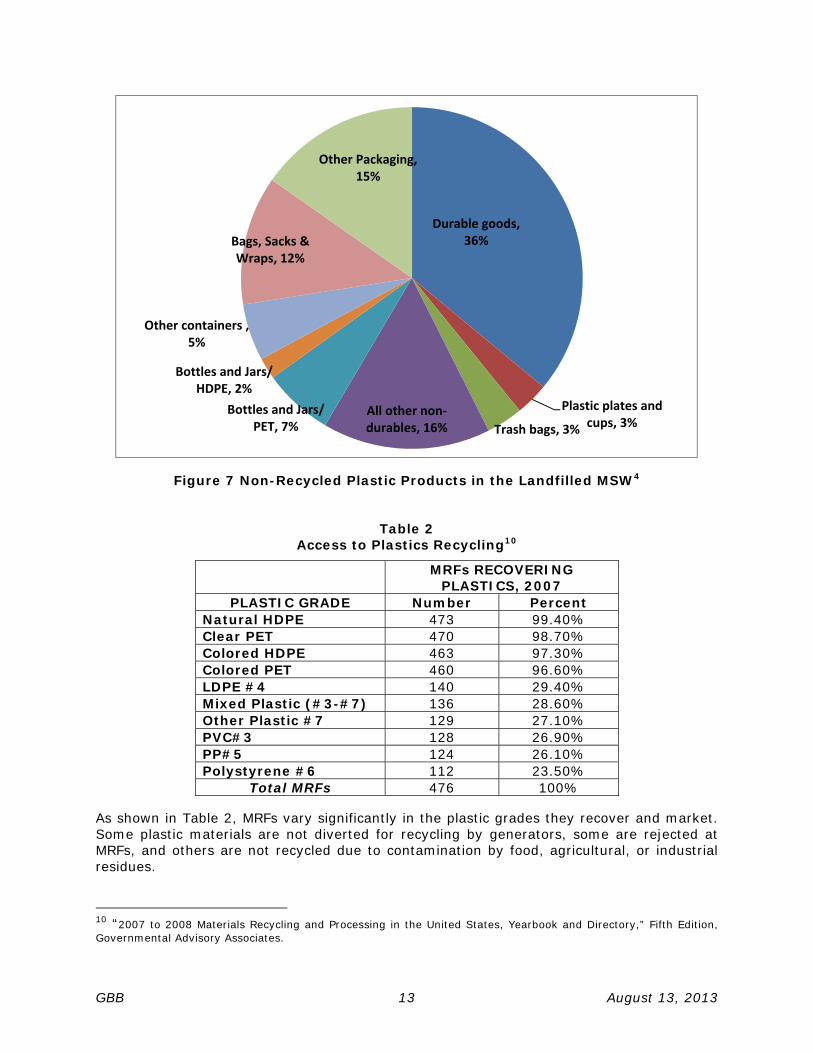
The types of products in the non-recycled plastic stream are shown in Figure 7, and are primarily classified as durable goods. Plastic bottles and jars (PET & HDPE) make up only 2 percent and 7 percent of the non-recycled plastic (Figure 7).
8 “Energy and economic value of non-recycled plastics (NRP) and municipal solid wastes (MSW) that are currently landfilled in the fifty states”- Earth Engineering Center, Columbia University, August 2011; 9 Ibid.
GBB 13 August 13, 2013
Figure 7 Non-Recycled Plastic Products in the Landfilled MSW4
Table 2 Access to Plastics Recycling10
MRFs RECOVERING PLASTICS, 2007
PLASTIC GRADE Number Percent Natural HDPE 473 99.40% Clear PET 470 98.70% Colored HDPE 463 97.30% Colored PET 460 96.60% LDPE #4 140 29.40% Mixed Plastic (#3-#7) 136 28.60% Other Plastic #7 129 27.10% PVC#3 128 26.90% PP#5 124 26.10% Polystyrene #6 112 23.50%
Total MRFs 476 100%
As shown in Table 2, MRFs vary significantly in the plastic grades they recover and market. Some plastic materials are not diverted for recycling by generators, some are rejected at MRFs, and others are not recycled due to contamination by food, agricultural, or industrial residues.
10 “2007 to 2008 Materials Recycling and Processing in the United States, Yearbook and Directory,” Fifth Edition, Governmental Advisory Associates.
Durable goods, 36%
Plastic plates and cups, 3%Trash bags, 3%
All other non‐durables, 16%
Bottles and Jars/ PET, 7%
Bottles and Jars/ HDPE, 2%
Other containers , 5%
Bags, Sacks & Wraps, 12%
Other Packaging, 15%

GBB 14 August 13, 2013
The non-recycled portion of the plastic waste will be relatively predictable and consistent unless (1) the market for recovered plastics grades expands to include currently non-recycled plastic grades; or (2) the state of plastic waste generation changes, due to major economic fluctuations or alterations in the types of packaging materials used. Even if one or more of these conditions are met, the supply of non-recycled plastics in MSW is likely to remain. In the U.S., the composition of MSW after accounting for recycling contains over 11 percent non-recycled plastics. If the U.S. were to match the highest recycling and diversion from landfill rates in the EU (in Belgium > 50 percent of plastic waste is recycled and ->24 percent is processed through WTE),11 over 25 percent of non-recycled plastics (7.75 million tons) would remain in MSW.
Until infrastructure and markets for the recovery and recycling of more materials that are plastic are in place, it is preferable to use these materials to produce energy, fuels, and chemicals, rather than to dispose of them in landfills. This report will discuss the potential of MSW containing non-recycled plastics as feedstock for gasification facilities.
2.2 Overview of Conversion Technology Development and Utilization of MSW
Waste processing technologies are applied worldwide to generate steam, power, fuels, and chemicals. Mass burn and refuse-derived fuel combustion are the most commonly applied thermal technologies for conversion of waste materials. Gasification and pyrolysis, while considered established technologies with respect to feedstock other than MSW, are considered emerging technologies with respect to MSW.
2.2.1 Mass Burn (Combustion)
Mass burn technology, commonly known as Waste-To-Energy (WTE) or Energy from Waste (EfW), involves complete combustion of unprocessed MSW. Recyclables may be removed from MSW prior to delivery to the mass burn facility, but the facility does not pre-process the MSW. At mass burn facilities, heat generated from the combustion is used to turn water into steam that can be used in district heating networks, industrial applications or to power turbine generators for electricity production. The water condensed out of the steam is cycled back and gases created by combustion of the waste are filtered through advanced air pollution control technologies before being released to the atmosphere. The combustion process and cleaning of the gases produce fly and bottom ash, further processed to remove metals for recycling. The ash can be used as alternative daily cover at landfills or as construction aggregate.
2.2.2 Refuse-Derived Fuel (Combustion)
Refuse-derived fuel (RDF) differs from mass burn because the incoming waste is processed before combustion to improve fuel performance. First, recyclable and non-combustible materials are removed from the MSW and the refuse material is shredded, dried and/or compacted into pellets or cubes, to produce a more homogenous fuel. RDF can be used as a fuel in either a dedicated or an existing boiler, alone or with other fuels. Depending on the degree of processing, RDF is considered a manufactured fuel.
2.2.3 Gasification and Pyrolysis (Partial or non-combustion)
Gasification and pyrolysis are thermal conversion technologies that happen under different amount of air present in the system. Gasification occurs in the presence of limited amounts 11 European Association of Plastics Recycling and Recovery Organisations (EPRO), January 2013.

GBB 15 August 13, 2013
of air (or oxygen) that allows partial combustion of the material. Pyrolysis occurs in the complete absence of air (or oxygen).
Gasification leads to combustible synthesis gas (syngas) as a final product. Syngas is a valuable commercial product used as an intermediate to create synthesis natural gas, methane, methanol, dimethyl ether and other chemicals. It can also be used directly to produce energy as a surrogate for natural gas.
Pyrolysis leads to synthetic liquid fuel similar to crude oil and combustible synthetic gases. Liquid product can be mixed with crude oil and further refined to gasoline and other petroleum products.
Both technologies have been successful in processing biomass and homogeneous industrial waste products. Their application in the field of MSW processing is under development. Gasification, in particular, has been applied worldwide on different feedstock and shows potential for processing MSW. The basic stages of the gasification process are shown in Figure 8.
Figure 8 The Gasification Process12
12 Gasification Technologies Council, 2011.

GBB 16 August 13, 2013
3 Gasification
3.1 Types of Gasification
Gasification is the thermal conversion of any carbon-based material with a small amount of air or oxygen in a heated chamber, into a mixture of combustible gases (hydrogen, carbon monoxide, carbon dioxide and some trace compounds) called syngas. The syngas may have a heating value of 200 to 500 Btu per cubic foot and can be either used as a fuel for energy production or further processed to a wide variety of fuels and chemicals.
In the gasifier, the feedstock is converted through several sequential processes. First, the feedstock is homogenized into smaller particles then inserted into the gasifier, followed by a controlled amount of air or oxygen (and steam for some gasifiers). Feedstock passes through several temperature zones where a sequence of reactions occurs before the syngas produced is removed from the chamber. The temperatures in a gasifier typically range from 1,100 to 1,800 degrees Fahrenheit. Solid residue is removed from the bottom of the reaction chamber.
Traditional gasification systems come in several primary variations, each with advantages for particular feedstock or product applications. The basic design of each system type is built around the reaction chamber with insertion of feedstock, but each has a different heating mechanism, air entry and syngas removal location, as illustrated in Figure 9.
Figure 9 Gasification System Types13
Other gasifier types, including plasma gasifiers do not rely on a different gasifier structure or arrangement of air inlets and syngas outlets but rather on type of heat source used.
Four different types of gasifiers are described in more details in the following sections.
13 GBB Diagram, 2012.

GBB 17 August 13, 2013
3.1.1 Updraft (counter‐current flow gasifying agent and feedstock)
An updraft gasifier has stacked zones clearly defined to dry, pyrolyze, gasify, and partial combust the feedstock.
In this type of system, the air is introduced from the bottom of the chamber and raises counter-current to the downward movement of the waste through the conversion zones. The gases produced move upwards and are removed from the top of the chamber. This upward movement of the air and gas improves the efficiency as the rising hot gases help to control temperatures, aid in drying of the feedstock, and improve the mixing of the gases in the chamber. Possible disadvantages of updraft systems is tar present in the raw gas and inefficient loading for some large or heterogeneous feedstocks.
Fluidized bed gasifiers are one type of updraft gasifier. In these gasifiers, feedstock is suspended in oxygen-rich gas (effectively creating fluid-like movement of the gas and feedstock within the chamber). The suspension improves the heat transfer rate between the gas and the feedstock and allows ash to fall out of the suspension instead of being carried up with syngas. Fluidized bed systems can gasify feedstocks with potential to form corrosive ash without damaging the chamber. In addition, they support a higher fuel throughput than other gasifier types. This type of reactor may also be referred to as a circulating fluidized bed or transport reactor.
3.1.2 Downdraft (co-current flow gasifying agent and feedstock)
In downdraft gasifiers, the air is introduced at a mid or top part of the-chamber level and the syngas is removed from the bottom part of the chamber. Heat is added from the top of the chamber, and the gas temperature increases in as it moves downward. The gas leaves the chamber at very high temperatures. This heat can be harnessed for use in heating the upper portion of the chamber. On the way out of the chamber the gas must go through the ash (in the form of char), which reduces the amount of tars in the syngas.
Entrained flow gasifiers are a type of downdraft gasifier. In these gasifiers, the feedstocks and the air (or oxygen) are introduced high in the chamber so the oxidant and the feedstock blend as they move downward. Gasifiers of this variety operate at high temperatures and are efficient for conversion of coal or other easily pulverized materials too low-tar syngas, because the reactions occur along the entire length of the chamber.
3.1.3 Crossdraft
In the cross draft gasifiers, the air inlet and the gas outlet are on the opposite sides in the middle of the-chamber. This type of gasifiers are less common as they produce high temperature syngas at a high velocity that does not have as efficient CO2 reduction as other gasifier types. The types of feedstocks for these systems are limited by the system design to low ash fuels, such as wood, petroleum coke, and charcoal.
Crossdraft gasifiers have several advantages, including high carbon monoxide, low hydrogen and low methane syngas content when used on dry fuels, and a fast startup time desirable for some applications.

GBB 18 August 13, 2013
3.1.4 Plasma
Plasma gasification is used in industries that require disposal of hazardous wastes at high temperature. The high temperature (up to 10,000 degrees Fahrenheit) is created by the plasma torch in the gasifier.
Two different plasma gasification configurations are available based on the part of the gasification process the plasma torch is applied. First type is the plasma assisted gasification and second is the plasma coupled with traditional thermal gasification.
The first type has the plasma torch (s) in the gasification chamber where the heat generated breaks apart the chemical bonds in the feedstock and forms gas. Inorganic rejected materials are collected at the bottom of the gasification chamber, as a glass-like inert material potentially suitable for construction or other aggregate applications. Most plasma torch gasifiers are arranged similar to an updraft system, where feedstock is inserted near the top of the chamber, air or oxygen inserted in the middle or bottom of the chamber, and syngas is removed from the top of the chamber. The feedstock moves downward and into the intense heating zones created by the plasma torches. This type of system helps to prevent tar formation, as the syngas remains at a very high temperature (upwards of 1000°C) as it exits the chamber.
Figure 10 Plasma Gasification14
The selection of an optimal gasifier type for a particular application depends on variables such as the size, moisture content, and calorific value of the feedstock and the desired product type and quality. Table 3 shows a comparison of these variables among gasifier types.
14 GBB Diagram, 2012.
plasma
air
gas out
air air
plasma torchheat
plasma torchheat
feedstock

GBB 19 August 13, 2013
Table 3 Comparison of Gasification Options
Gasifier Design
Tar in Syngas
Cold Gas Efficiency
Operating Energy
Requirement
Ability to handle wide
variety of waste with
varying composition
Permissible Particle
Size
Moisture Content
(maximum)
Dust Content
Downdraft Low > 80% Low Moderate < 4 in ~ 40% Medium
Updraft Very High > 80% Low Low < 2 in ~ 50% Low
Fluidized Bed High > 90% Moderate Very Low < 1/4 in ~ 10% High
Plasma Very Low > 90% High Very High NA > 50% Low
Entrained Flow
Very Low > 80% Low Low < 1/25 in ~ 10% High
Plasma Enhanced Downdraft
Very Low > 90% Moderate High < 4 in > 50% Low
3.2 System Feedstock (Inputs) – Process Feedstock Flexibility
Gasification is used worldwide for conversion of different feedstocks to electricity, fuels, and chemical products. The feedstocks vary by many characteristics, such as energy content, size, shape, chemical composition, bulk density, ash composition, and moisture content.
Most commonly used feedstocks include:
Waste Wood Wood Pellets and Chips Aluminum Wastes Plastics Industrial Wastes Municipal Solid Waste (MSW) Refuse-Derived Fuel (RDF) Auto-Shredder Residue (ASR) Coal
Petroleum Coke Agricultural Wastes Grasses Corn Stover Crop Residues Mill Waste Sewage Sludge Black Liquor
3.3 Outputs
The main output of gasification is the syngas that may be further processed to a variety of useful products, as shown in Figure 11. Some products can be used immediately without further processing, while others require simple or complex conditioning and/or processing before use in specialty applications.
3.3.1 Power Generation
The syngas can directly be combusted for recovery of the thermal energy as heat and/or steam and electricity. The heat is used to provide property- or district-heating or cooling an

GBB 20 August 13, 2013
application often used at biomass, wood waste, and industrial waste gasifiers throughout the world. Produced steam can be used for production of electricity. Facilities that produce both heat and power are commonly known as combined heat and power plants “CHP”.
3.3.2 Fuel Generation
The syngas can be converted to liquid fuel products through Fischer-Tropsch or other chemical synthesis and refinement processes. This liquid product can be further refined to different types of fuels, from crudes and diesel to kerosene.
3.3.3 Chemical Generation
Syngas can be processed to chemicals such as methanol and hydrogen. Methanol can be further transformed to different fuels or chemicals including ethanol, acetic acid, formaldehyde, methyl acetate, commonly used in industrial and commercial processes. Figure 11 shows a variety of chemical pathways and outputs for processing of the syngas.
Figure 11 Gasification Output Pathways15
15 GBB Diagram, 2012.
Methanol
Formaldehyde
Methyl Acetate
Acetic Anhydride
Acetic Acid
VAM
PVA
Ketene
Diketene & Derivatives
Ethyl Propylene
Polyolefins
Oxy Chemicals
Gasoline
Acetic Esters
DME
Fischer ‐Tropsch
Wax
Diesel/ Kerosene
Gasoline
Naptha
HydrogenRefinery Hydrotreating
Transportation Fuels
Fuel Cells
Chemicals
Fertilizers
Gasifier
Syngas
Power Generation
Steam& Power
Gas Turbine Combined Cycle
IC Engine
Fuel Cells
Boiler
GBB 21 August 13, 2013
3.4 System Economics
A significant number of pilot and demonstration-scale facilities came online in the U.S. in the last decade. Gasification technology has not yet been applied at a commercial scale on MSW in the US. Therefore, data on the economics of commercial scale gasification plants for MSW is currently not available.
Available data from pilot and demonstration-scale facilities shows that costs of gasification systems varies significantly related to the type of feedstock, the type gasification technology, the type of outputs, and the location.
3.4.1 Estimated Costs
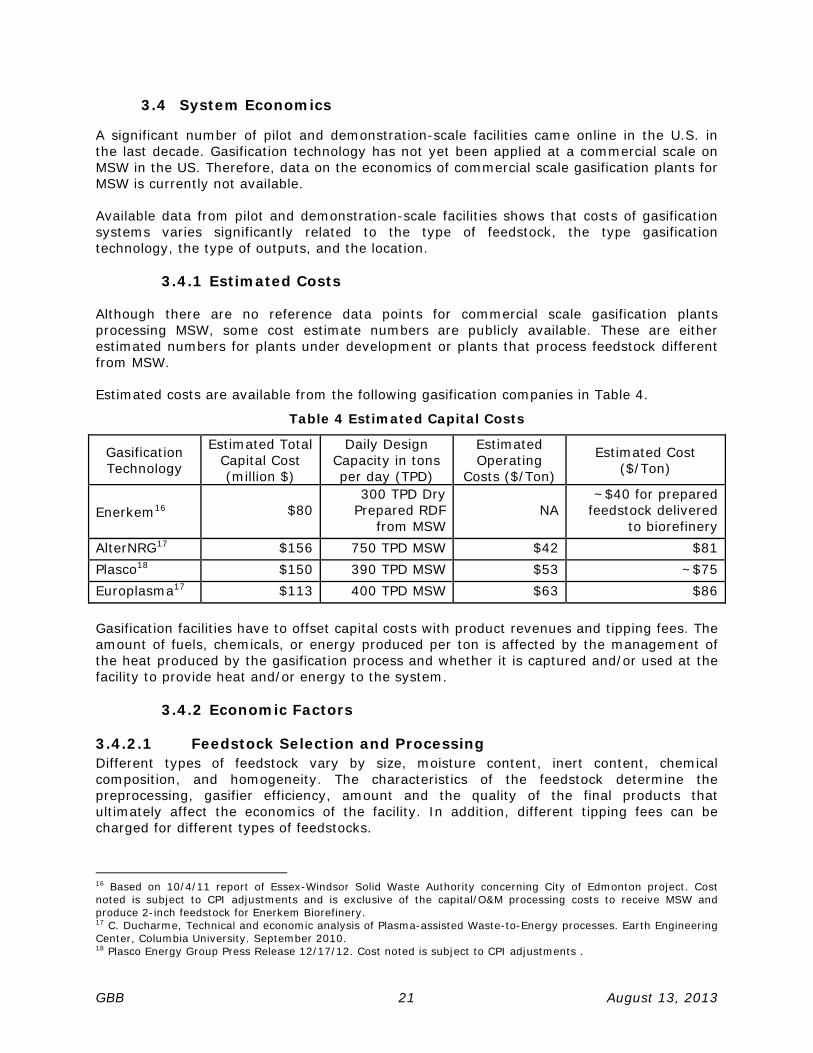
Although there are no reference data points for commercial scale gasification plants processing MSW, some cost estimate numbers are publicly available. These are either estimated numbers for plants under development or plants that process feedstock different from MSW.
Estimated costs are available from the following gasification companies in Table 4.
Table 4 Estimated Capital Costs
Gasification Technology
Estimated Total Capital Cost (million $)
Daily Design Capacity in tons per day (TPD)
Estimated Operating
Costs ($/Ton)
Estimated Cost ($/Ton)
Enerkem16 $80 300 TPD Dry
Prepared RDF from MSW
NA ~$40 for prepared
feedstock delivered to biorefinery
AlterNRG17 $156 750 TPD MSW $42 $81 Plasco18 $150 390 TPD MSW $53 ~$75 Europlasma17 $113 400 TPD MSW $63 $86
Gasification facilities have to offset capital costs with product revenues and tipping fees. The amount of fuels, chemicals, or energy produced per ton is affected by the management of the heat produced by the gasification process and whether it is captured and/or used at the facility to provide heat and/or energy to the system.
3.4.2 Economic Factors
3.4.2.1 Feedstock Selection and Processing Different types of feedstock vary by size, moisture content, inert content, chemical composition, and homogeneity. The characteristics of the feedstock determine the preprocessing, gasifier efficiency, amount and the quality of the final products that ultimately affect the economics of the facility. In addition, different tipping fees can be charged for different types of feedstocks.
16 Based on 10/4/11 report of Essex-Windsor Solid Waste Authority concerning City of Edmonton project. Cost noted is subject to CPI adjustments and is exclusive of the capital/O&M processing costs to receive MSW and produce 2-inch feedstock for Enerkem Biorefinery. 17 C. Ducharme, Technical and economic analysis of Plasma-assisted Waste-to-Energy processes. Earth Engineering Center, Columbia University. September 2010. 18 Plasco Energy Group Press Release 12/17/12. Cost noted is subject to CPI adjustments .

GBB 22 August 13, 2013
The type of feedstock determines the level of preprocessing needed based on the requirements of the particular gasifier technology. As shown in Table 3 above, most gasification technologies have specific requirements for the size and moisture content of the acceptable feedstock. This pre-processing adds both capital and operational costs to any gasification system. Proper preprocessing leads to feedstock that the gasifier may process more easily and as a result, gain higher efficiency production of syngas, which leads to larger amounts of better quality products (to bring increased revenue for the facility).
Different tipping fees can be charged for different feedstocks. For example, hazardous and medical waste tipping fees are typically higher than MSW tipping fees.
3.4.2.2 Gasification Technology As discussed in Section 3.1, the performance of different gasification technology configurations vary based on how the feedstock is processed. To optimize the technical efficiency of the plant and keep the system economics low, it is important to match the type of feedstock with the appropriate gasification technology.
Some gasification technologies also require input energy in the form of natural gas, pet coke, or electricity through plasma torches in order to reach the required operation temperature within the gasifier. This amount of input energy is significantly higher for some configurations than for others, as shown in Table 3 as Operating Energy Requirement. This also affects the economics of the system.
3.4.2.3 Facility Output The type of final gasification product determines the complexity of the gasification configuration. Each additional stage to convert the syngas to higher value fuels, energy products, or chemical adds complexity and costs.
For example, systems producing outputs other than heat or electricity on-site must install systems for containing fuels for storage and transport. Facilities processing hazardous materials are required to have more complex air pollution control equipment.
3.4.2.4 Facility Location Gasification facilities face different economic influences depending on their locations in landfill tipping fees, availability and development of the markets for the final products, siting and permitting costs, and availability of distribution infrastructure. Prices for system outputs, whether energy, fuel, or chemical products also vary by location. The costs for permitting, construction, labor, transportation of feedstocks, and interconnection with product distribution infrastructure will have significant impacts on the capital and operation costs of the gasification facility.
Landfill tipping fees are different in different parts of the U.S. A gasification facility needs to charge a per ton fee to accept MSW commensurate with local landfill tipping fees. If landfill capacity in the region is limited and costs to transport waste materials to distant disposal facilities are high, a facility may be able to charge a competitive tipping fee that is high enough to help offset its capital costs.
Strong local markets for the final products mean secure revenue streams for the gasification plant. In order to ensure economic feasibility of a gasification project, the value of the fuel or energy product produced by the facility and the cost or fee levied for its feedstock (i.e., a tipping fee if it is processing a waste material) must be high enough to offset facility costs and generate a reasonable profit. Similarly, if a facility is able to locate at a site that has

GBB 23 August 13, 2013
nearby users of its products, and/or it can charge a high premium for its products, these advantages may make the facility viable even though construction and/or operational costs may be higher on a per-ton basis than for other disposal facilities and locations.
3.5 Level of Commercialization
Gasification has been used worldwide for almost 200 years to convert carbon-based materials such as coal and other fossil fuels, biomass, and waste materials into energy, heat, fuels, and chemicals. Gasification of wood waste, wood chips and agricultural biomass is commonly performed throughout North America and Europe for electricity and heat production. The gasification of MSW has achieved different levels of commercialization in different areas of the world. These worldwide experiences, companies and facilities are highlighted in Sections 4 and 5.
In Asia, commercial scale gasification of MSW and industrial wastes has been performed over the past 20 years, particularly in Japan and South Korea.19 In Europe, MSW gasification has been a mixed experience. Several facilities constructed in Germany and Italy were shut down because of economic and operational difficulties.
In North America, currently there are no full-scale gasification facilities operating commercially on MSW. However, a number of companies have pilot and demonstration facilities, and several additional commercial facilities are in advanced levels of development. Although not yet at commercial scale in the U.S., interest in gasification has grown in the last decade.
19 http://www.netl.doe.gov/

GBB 24 August 13, 2013
4 Gasification Technology Companies
This section presents information on identified companies offering gasification technology in the North American market. It includes companies that process feedstocks other than non-recycled plastics, most of which market in the U.S. though licensees. We have identified 147 companies that offer gasification technology, including technology developers and facility developers, worldwide. This number includes all levels of development status, from laboratory scale experiments, bench-scale technology mock-ups, pilot and demonstration facilities, to fully operating commercial facilities. Out of the 147 companies, 65 have demonstration facilities and/or operational commercial scale facilities. In the U.S., 21 companies have pilot and demonstration facilities, and 17 projects to establish commercial scale facilities are under development and/or under construction. This list also includes different types of gasification technologies such as conventional thermal gasification, plasma gasification, and gasification technologies that produce syngas, liquid fuel, electricity, CHP, or chemicals.
The following tables present the companies operating in North America, organized by level of technology commercialization and by type of waste feedstock processed. Important gasification companies around the world have also been listed, including some that do not currently market in North America.
Table 5 shows technology or project development companies that have demonstration or commercial scale facilities in North America. These companies claim their facilities can or have processed different types of waste and are listed as mixed waste facilities. This mixed waste may include preprocessed or unprocessed MSW; refuse derived fuel, industrial waste, mixed biomass, construction and demolition waste, sewage sludge, and hazardous waste. Non-recycled plastic waste has been continuously processed in these facilities as a fraction of the mixed MSW, auto shredder waste, or packaging waste. The high BTU value of non-recycled plastics makes them an attractive feedstock component for gasification processes.

GBB 25 August 13, 2013
Table 5 Companies in North America with Demonstration or Commercial Scale Facilities Processing Mixed Waste20
COMPANY NAME TECHNOLOGY OR
FACILITY DEVELOPER
FACILITY LOCATION OUTPUT
Alter NRG/ Westinghouse Plasma Corporation Technology U.S., Japan syngas
Coaltec Energy U.S., Inc. Technology U.S. syngas, biochar
Coskata Technology U.S. ethanol
Covanta Energy Both U.S. electricity
Chinook Energy Both Brazil, Canada, U.S., EU syngas, electricity
Enerkem Both Canada, U.S. ethanol, chemicals
Foster Wheeler Both Poland, Russia, U.S. ethanol
Fulcrum Bioenergy Facility U.S. Syngas, ethanol
Heuristic Engineering Inc. Technology U.S. CHP
InEnTec Both U.S., Taiwan, Japan, Malaysia syngas
INEOS Bio Both U.S. ethanol
MaxWest Environmental Systems, Inc. Both U.S. hot water, steam
MSE Technology Applications Inc. Both U.S. syngas
Navitus Plasma Inc. Facility U.S., Japan, Canada syngas
Plasco Energy Group Both Canada, Spain syngas
PRM Energy Systems, Inc. Technology U.S., Australia, Costa Rica, Malaysia gas, steam, heat
Renewable Energy Management Inc. (REM) Facility U.S., Canada, Caribbean syngas
Shell Global Solutions (U.S.) Inc. Technology Worldwide syngas
Whitten Group International/ Entech Environmental Facility Malaysia, Taiwan, Poland, Korea syngas
20 GBB Database, 2013. Mixed waste may include: preprocessed or unprocessed MSW, refuse derived fuel, industrial waste, mixed biomass, construction and demolition waste, sewage sludge, and hazardous waste.

GBB 26 August 13, 2013
Table 6 lists companies in North America that process biomass exclusively; including wood waste, agricultural residues, paper mill sludge, wastewater, and other treatment sludge. Although these facilities currently process biomass exclusively, these firms have expressed interest to process MSW through future applications of their technologies.
Table 6 Companies in North America With Demonstration or Commercial Scale Gasification
Facilities Processing Only Biomass
COMPANY COMPANY TYPE REFERENCE FACILITIES
OUTPUT
Chiptec Technology developer Canada, U.S. electricity
Gulf Coast Energy Technology developer U.S. ethanol
Nexterra Energy Technology developer Canada, U.S. syngas, electricity
Primenergy, LLC Technology developer U.S. CHP
Rentech Technology developer U.S. synthetic fuels
The companies listed in Table 7 have pilot plants in North America.
Table 7 Companies in North America with Operating Pilot Plants and/or Demonstration or
Commercial Scale Facilities under Development
COMPANY NAME TECHNOLOGY EnerSol Technologies, Inc. Plasma Gasification Covanta Energy Gasification Kinectrics Plasma Gasification MPM Technologies, Inc. Plasma Gasification PEAT International, Inc. Plasma Gasification Startech Environmental Corporation Plasma Gasification TCG Global, LLC (TCG) Gasification Tekna Plasma Systems Inc. Plasma Gasification Torftech (Canada) Ltd. Gasification Waste to Energy Canada, Inc. Gasification
Many significant technology and facility vendors are present on the global gasification market. Some of these are represented on the market in North America through their licensed vendors. Companies with demonstration or fully commercial facilities worldwide are listed in Table 8.

GBB 27 August 13, 2013
Table 8 Companies Worldwide with Commercial or Demonstration Gasification Facilities
COMPANY COUNTRY
7‐Hills S.A. Switzerland
A.H.T. Pyrogas Vertriebs GmbH (AHT Pyrogas) Germany
Advanced Plasma Power (APP) United Kingdom
Aruna Electrical Works (P) LTD., India
Ascot Environmental Ltd/Scotgen Ltd. United Kingdom
B9 Energy Group Ltd Ireland
Babcock Noell GmbH Germany
Biomass Engineering Limited United Kingdom
Biossence Limited United Kingdom
BioSynergi Proces ApS Denmark
Chemrec AB Sweden
Clarke Energy Australia
CONCORD BLUE GmbH (Concord Blue Energy)* Germany, Japan, India, Mexico
Ebara Corporation Japan
Entech Australia
EnviroArc Technologies Norway
Environmental Energy Resources Ltd.(EER) Israel
GS Platech South Korea
HoSt B.V. The Netherlands
IHI Corporation Malaysia
JFE Holdings, Inc. (NKK) Japan
Kawasaki Plant Systems, Ltd. (Kawasaki Heavy Industries, Ltd.) (KHI)
Japan
Kobelco Eco‐Solutions Co., Ltd. Japan
Krupp Udhe (ThyssenKrupp AG) Germany
Lurgi GmbH Germany
Mitsui & Co. Japan
NETPRO Renewable Energy (I) Pvt. Ltd. India
OCTAGON CONSOLIDATED BERHAD Malaysia
REPOTEC ‐ Renewable Power Technologies Uwelttechnik GmbH Austria
SRL Plasma Pty Ltd (PLASCON) Australia
TechTrade International GmbH Germany
Tetronics Ltd. United Kingdom
Thermoselect (IWT is licensee in U.S.) Switzerland
Table 9 shows companies and gasification technology providers in the U.S. and Canada that are in the process of developing commercial-scale facilities.

GBB 28 August 13, 2013
Table 9 Current Facilities under Development in North America
Company Name
Facility Facility Location
Facility Size
(TPY)
Startup Date
Feedstock Output (if
stated) Cocurrent Bioenergy
West Virginia
U.S. 110,000 TBD MSW electricity
Enerkem Edmonton, Alberta
Pontotoc, Mississippi
Varennes, Québec
Canada
U.S.
Canada
100,000
100,000
100,000
2013
TBD
TBD
MSW MSW & wood
residue sorted
industrial and commercial
waste
ethanol
Entech Rainbow Disposal
Huntington Beach, CA Costa Rica
TBD TBD Organic fraction of MSW, food
Waste
syngas
Fulcrum Bioenergy
Sierra BioFuels
City of McCarran, NV U.S.
91,000 2015 MSW ethanol
InEnTech Dow Corning
Midland N/A N/A byproducts of Dow’s
industrial operations
chemicals syngas
INEOS Bio Vero Beach
Indian River
County, FL
150,000 Operating on Yard waste
MSW/Yard and
agricultural wastes
ethanol
Plasco Energy Group
City of Ottawa
Santa
Barbara
Canada U.S.
California,
U.S.
110,000
Undecided
2014-16
TBD
MSW syngas
Primoris Renewables/ Synergy Renewables
2 facilities Puerto Rico 180,000 TBD MSW syngas

GBB 29 August 13, 2013
5 Gasification Experience in the U.S. and Abroad
Experiences with gasification are diverse in different parts of the world. Europe and Asia have more extensive experience than the U.S. Gasification technology has successfully been processing biomass and petroleum feedstocks for many years in the U.S. MSW as a feedstock was introduced to the technology in the 1970s and 1980s in the U.S. but has not yet been successfully proven. At that time, MSW contained greater quantities of metal and glass as a percentage of the total waste stream than it does now, resulting in a waste stream with a heating value that is significantly lower than it is now. The waste quality introduced complexity into facility operation that was not economically supported through tipping fees and energy revenues.
In Europe and Asia, gasification of MSW has a more extensive history, but also faced setbacks in many locations due to operational challenges and high operational costs.
Recently gasification has been reintroduced as a technology for processing MSW. However, the waste stream has changed, and markets for fuels, chemicals, and energy products are different and present opportunities for further development of the technology. The following sections discuss examples of gasification development experience and several firms developing gasification facilities for MSW as feedstock.
5.1 Examples of Gasification Development Experience
5.1.1 Covanta- CLEERGASTM
Covanta Energy is a leading owner and operator of WTE facilities, and currently owns and operates more than 40 WTE facilities that process approximately 20 million tons of waste into 9 million megawatt hours of energy each year.
Recently Covanta officially announced its gasification technology, CLEERGAS™ (Covanta Low Emission Energy Recovery Gasification), and the completion of demonstration testing of the system at Unit #3 of its Tulsa, Oklahoma WTE facility. Covanta has stated that the technology has the ability to gasify unprocessed, post-recycled MSW without preprocessing required.
Figure 12: CLEERGAS Process Diagram
Currently Covanta markets this technology as a 300 ton per day modular system, has tested its technology at its Tulsa, Oklahoma WTE facility site, and has recently selected St. Lucie, Florida as a site for future system installation.

GBB 30 August 13, 2013
5.1.2 Enerkem
Headquartered in Montreal, Canada, this company has developed a proprietary thermochemical process for commercial production of ethanol. Enerkem has been ranked number 7 of 50 Hottest Companies in Bioenergy 2011-2012 by Biofuel Digest.
Enerkem’s process involves feedstock preparation, gasification, cleaning, and conditioning of syngas, and catalytic synthesis.
Figure 13 Enerkem Process21
Currently, Enerkem operates two research and development facilities:
Sherbrook, Quebec (Canada) - Pilot plant operating since 2003
Westbury, Quebec (Canada) - Demonstration facility operating since 2009 with processing capacity of 1.3 million gallons of ethanol annually.
Currently, both facilities produce ethanol and the company hopes to demonstrate the scalability of the technology in their scheduled facilities.
Enerkem has the following facilities currently under development:
Varennes, Québec (Canada) – Commercial facility planned to produce 10 million gallons of ethanol per year. The construction of this facility was completed in May 2012 and is in the process of being commissioned.
Edmonton, Alberta (Canada) – Commercial facility planned to produce 10 million gallons of ethanol per year. This facility is currently under construction and is expected to start operating in 2013.
Pontotoc, Mississippi (U.S.) – Commercial facility planned to produce 10 million gallons of ethanol per year. This facility is under development.
5.1.3 INEOS Bio
INEOS Bio is a technology developer offering proprietary technology that couples gasification to syngas with bio catalytic fermentation, to produce ethanol as a final product. This technology uses different biomass feedstocks including yard and food wastes (from MSW), organic commercial and industrial wastes, contaminated waste wood, forestry
21 Enerkem, 2011.

GBB 31 August 13, 2013
wastes, agricultural wastes, and ligno-cellulosic energy crops, all which undergo drying before entering the gasification chamber.
Figure 14 INEOS Bio Process22
INEOS Bio built its first pilot plant in Fayetteville, Arkansas and started operating in 2000. Its first commercial facility was built in Vero Beach, in Indian River County, Florida, and in early 2013, began processing yard wastes and producing ethanol. This facility has capacity to process 150,000 tons per year of MSW and agricultural wastes into eight million gallons of fuel-grade ethanol and six MW net of electric power.
5.1.4 Plasco Energy Group
Plasco Energy Group is a technology development company based in Ottawa, Canada, which offers proprietary plasma gasification technology. Its design applies the plasma torch in the cleaning and refining of the product syngas to clean and consistent quality.
Currently, Plasco operates two facilities:
Castellgali, Spain - Research and development facility – approximately 5 tons per day.
Ottawa, Canada - Demonstration facility in at the Trail Road Landfill, with annual capacity of 85 metric tons (94 short tons per day) of MSW.
Plasco has been selected by Santa Barbara, California as one of two potential firms to develop a facility in the community, and has facilities in planning and development stages in Canada and China. Additional facilities under development can be found in
. 22 INEOS Bio, 2011.

GBB 32 August 13, 2013
5.1.5 Thermoselect
One of the most storied gasification developments is the Swiss company Thermoselect, which began offering gasification technology for solid waste management applications in Japan in 1985.
Thermoselect systems are based on combining four technologies - compaction, pyrolysis, gasification and gas cleaning, and do not require any waste preparation or RDF production. The Thermoselect gasification systems can process a variety of feedstocks with heating value in the range of 3,500 - 8,000 Btu/lb (HHV).
The first Thermoselect facility was built in 1992 as a 110 TPD demonstration facility in Fondotoce, Italy. Since then nine full-scale commercial facilities were built and operated. All of the company’s currently operating facilities are in Japan with JFE (formerly Kawasaki and NKK) the Thermoselect licensee. Thermoselect is actively marketed in the U.S. through their North American licensee, Interstate Waste Technologies (IWT).
Table 10 Thermoselect Facilities
Location TPD Startup Feedstock
Italy (closed) 110 1992 MSW
Germany (closed) 792 1999 MSW; ASR
Chiba 330 1999 MSW; IW
Mutsu 154 2003 MSW
Nagasaki 330 2005 MSW
Kurashiki 612 2005 MSW; IW
Yorii 495 2005 IW
Tokushima 132 2005 MSW
Izumi 105 2005 IW
Recent information indicates that these facilities have become very expensive to operate and that several have been closed due to economic pressures (specifically the price of energy and high costs of operation) and pressures from the environmental community in Europe. IWT currently has a facility in Taunton, Massachusetts, under development, to convert MSW to a synthetic gasoline product.

GBB 33 August 13, 2013
6 Opportunities and Barriers for Further Commercialization of the Gasification Technology in the U.S.
This section discusses the opportunities and the barriers that gasification developers are facing in the U.S. market, and identifies factors that support or hinder commercialization of this technology.
It is important to note that listed opportunities and barriers are based on experiences from existing demonstration and pilot plants, and may not necessarily apply to commercially operating facilities in the future. Data and demonstrated experience regarding gasification facilities will be available once there are full-scale commercially operating facilities in the U.S.
6.1 Identified Opportunities
Primary factors determining the success of gasification of MSW as a commercially viable business include an abundant supply of MSW as a feedstock, established (and developing) markets for the final products, and supportive state and federal policies.
Markets for the final products - The markets for the final products of this process are established. Electricity, ethanol and chemicals are valuable, marketable products and are potential sources of revenue for the gasification facility operators/owners. In March of 2013, prices for ethanol ranged between $3.15 and $3.60 per gallon23, and with a conservative conversion rate of 70 gallons of ethanol produced per ton of MSW, this amounts to approximately $230 per ton of MSW processed into ethanol. If 1 ton of MSW is converted to syngas, then combusted to produce electricity, potential revenue is $45-55 per input ton of MSW. Thus, conversion to ethanol or other fuels represents a significant economic opportunity, as the Energy Information Agency (EIA) projects transportation fuel costs to remain near current levels for many more years.
Gasification technologies also have the possibility of producing chemicals, such as methanol and/or dimethyl ether (DME). In April of 2013, the price of methanol was approximately $1.60 per gallon24, a significantly lower value than the ethanol, but still higher value than electricity generated by the same amount of MSW. The value of liquid products over electricity established an opportunity for gasification that is not available to mass burn combustion and other technologies that do not have the capability to generate fuel products. Electricity can only be sold to the local grid and liquid products can be transported to areas that have stronger markets and offer higher prices for fuels. The generation of fuels also gives facilities greater flexibility in terms of uptime vs. downtime; many fuel producing facilities can operate in batch processes, as the volume of product is more important than continuous operation.
The emerging and expanding markets for these products are expected by many industry, government, and academic organizations to continue to grow in coming years, as both the demand for these fuels and products specifically as well as the total energy generation network grows.
Policy support - The U.S. EPA is responsible for developing and implementing regulations to encourage the development and expansion of the renewable fuels sector via the congressionally mandated Renewable Fuel Standard (RFS). The RFS program establishes a mandate for the volume of renewable fuel that must be blended into gasoline and diesel. 23 U.S. Energy Information Administration, March 13, 2013. 24 Methanex, April 29, 2013.

GBB 34 August 13, 2013
The volume requirement is 36 billion gallons of renewable fuels by 2022, and fuels must be created through one of the EPA’s approved generation pathways in order to be eligible to meet the mandate. Within the overall 36 billion gallon target, there are several categories of fuels broken down by fuel source, each with a specific volume requirement of its own.
In February of 2013, the EPA approved the RFS eligibility of production of renewable gasoline and renewable gasoline blendstock from cellulosic components (a component of the organic fraction) of separated yard waste, separated food waste, and separated municipal solid waste (MSW). This approval extended to processes utilizing several conversion pathways, including gasification. The impact of this approval on the marketplace has yet to be demonstrated, but it is expected to motivate the gasification technology developers and communities investigating the technology. It is projected to help improve demand and sale price of cellulosic biofuels generated through this approved pathway. 25 While this feedstock does not include plastic materials, this RFS eligibility modification may help gasification technology developers to advance development of their facilities, and gain more demonstrated experience with processing waste materials.
Feedstock flexibility - Gasification can potentially process both mixed waste and the plastic-only fraction of the waste. This makes gasification technology attractive to municipalities that have to manage mixed waste material and for commercial/industrially generated segregated materials and plastic waste.
Environmental awareness – Though yet unproven at a commercial scale, the emission profile of gasification facilities may offer some comparative benefits over other waste conversion technologies. As gasification limits the amount of oxygen present during material decomposition, it limits oxidation as a primary source of gaseous pollutants in thermal conversion. Firms offering gasification technologies also present that the use of a smaller amount of air in syngas combustion versus conventional waste combustion also results in higher energy recovery efficiency, reduced boiler fouling and corrosion, and minimal formation of pollutants such as nitrogen oxides. These claims have established gasification as an acceptable thermal treatment technology in the eyes of many individuals that are involved with environmental conservation and sustainability organizations. However, with data from commercial plants not available, we cannot yet verify these claims.
Sustainability ethic – As communities move forward with planning for future disposal, many are experiencing pressure from reduced landfill capacity within or in close proximity to their boundaries, as well as a general desire to reduce the amount of waste sent to landfill. Thermal conversion technologies, including gasification, greatly reduce the amount of material that requires disposal. This will increase the useful life of a municipal landfill and reduce the greenhouse gas emissions generated by transportation and landfilling the waste. Ambitious communities are aiming for zero waste to landfill, and thus are exploring conversion technologies to enable them to recover the non-recycled materials from the waste.
6.2 Identified Barriers
As the application of gasification technology to process MSW is a relatively new concept in North America, it is important to understand some of the barriers to commercialization. The following section discusses some of the identified barriers in the U.S. marketplace such as public acceptance, system economics, developer experience, and legislative uncertainty.
25 Final Rule to Identify Additional Fuel Pathways under the Renewable Fuel Standard Program (RFS), U.S. Environmental Protection Agency. February 2013.

GBB 35 August 13, 2013
Public acceptance - Not in My Backyard (NIMBY) is still associated with the thermal treatment of waste in some areas. Citizens identify gasification facilities with outdated waste incinerators and are hesitant to have one installed in their community. To overcome this and obtain the necessary permits and approvals, project developers must successfully engage in robust, local education and outreach efforts.
Costs are significant and uncertain - Capital investment and operating and maintenance costs are significant, and economics are a primary reason for the limited number of commercial size facilities. Several gasification facilities have overcome this challenge by seeking financing through partnership with large waste collection and disposal firms, or with municipal governments that have an interest in partial ownership of the facility.
Limited operating experience - Since MSW is a relatively new application for gasification with very few commercial scale facilities; many developers do not have years of experience developing and operating commercial size facilities. The gasification technology developers in the U.S. can be classified in two groups based on the project development experience. The first group has demonstration facilities that operate as batch processes. They have demonstrated their technology can be successfully scaled up, but they still lack experience in continuous operation of commercial scale facilities. The second group of companies have pilot plants that are naturally smaller than their targeted commercial systems. Thus, the lack of experience makes it even more challenging for investors and key stakeholders to assume the greater risk of implementing a larger commercial scale facility. Larger, established companies that own and operate multiple mass burn or RDF facilities may be more likely to overcome this perception. . For example, Covanta, which owns many mass burn facilities in the United States, is also developing its CLEERGAS technology.
Legislative/regulatory uncertainty – The regulatory classification of gasification facilities is not consistent from state to state or municipality to municipality. Most regions require facilities that handle wastes to be regulated as solid waste facilities of a specific type (e.g. recycling, processing, and transfer). Gasification facilities frequently do not have a segregated classification, and there are questions over whether they should be regulated similar to mass burn WTE or as another type of waste processing facility. Some states are now amending their solid waste plans and regulations to incorporate distinction between gasification and mass burn. For example, in May 2013, Massachusetts updated its solid waste plan to incorporate gasification and pyrolysis, but not mass burn, into its range of permissible thermal treatment technologies.
Renewable fuel requirements - For a gasification facility to be eligible for Renewable Identification Numbers (RINs), it must meet specific requirements for feedstock quality and process design. In order for the fuel product from a waste conversion facility to be eligible to produce and to be sold as a renewable fuel, the facility must certify that all recyclable materials (to a small margin of contamination) have been removed from the feedstock prior to processing. This may be a challenge to gasification facilities receiving mixed wastes, and RIN generation would necessitate extensive pre-processing to ensure recyclables are removed.
Level of preprocessing necessary - Diverse gasification technologies have different requirements for the preprocessing of the feedstock. Depending on the type feedstock, this might include removing inert (non-combustible) materials like metals and glass and shredding and/or drying of the feedstock. Additional preprocessing costs – as is the case with any cost - will naturally affect the economics of these facilities.

GBB 36 August 13, 2013
Conversion does not always mean recovery - Processing of non-recycled plastics in gasification facilities may not be recognized as a contribution to mandated recovery and recycling rates. Gasification is considered conversion technology in some states and recognized in the same category as WTE, so it is not always eligible for diversion credits.

GBB 37 August 13, 2013
7 Development of Gasification within a Community as Part of an Integrated Waste Management System
Successful development of a gasification technology project is influenced by many factors. For a project to be successful in a particular location, several conditions are of primary importance. In this section, the following local conditions will be discussed:
Quality and the quantity of the waste available, Existing waste management system, Cost of the existing waste management system, Policy framework, Public perception, and Existing markets and infrastructure for the final products.
The status of these factors in a community will have a significant impact on facility development and future changes to these factors due to policy, market, or other external pressures may influence the future growth of gasification for processing MSW in the U.S.
The quantity and the quality of feedstock available in the community are very important for the success of the project. They determine the size of the facility and the gasification technology type. The best option for a gasification facility is to secure a sufficient amount of homogeneous feedstock with consistent quality. An ideal site for facility development is a community where there is a sufficient amount of feedstock to sustain at least the smallest economically feasible sized gasification facility. Some examples of locations that fulfill these criteria include:
A transfer station or landfill site where waste is already hauled, A MRF (or several MRFs) large enough to generate a substantial amount of residue
for conversion, An industrial facility that generates a substantial amount of process wastes A remote or secure location that generates waste materials, yet cannot landfill to a
great extent, and may have high transportation costs to other disposal sites (e.g. islands, military installations)
A long-term waste supply needs to be secured for any waste management project to be successful. If the gasification facility is entering into an agreement with a community, the community must have control of the waste stream through its own collection services, contracting for collection, or through economic means (e.g. charging for waste services through property or utility bills). This will direct the waste generated within the community to its designated facilities. If the facility is in agreement with a private company, the private company needs to have significant historical flows much greater than what is needed since contract terms with their customers are generally shorter term, e.g. 3-5 years. The quality of the waste is determined by the type of the waste generator. The best type of feedstock is homogeneous and has minimal seasonal fluctuation.
The existing waste management system and infrastructure are key factors for facility development. The type of collection system, recycling programs in place and existing WTE plants will determine the success of a gasification plant in a community. A municipality with a well-established collection system for residential and/or commercial waste can provide a feedstock more consistent in quality and quantity than a system based on resident drop-offs or self-hauling of waste. Co-locating the gasification facility with existing landfill or transfer station used by the municipality and/or commercial haulers will not alter the haul distances for waste in order to provide feedstocks for the gasification project. In addition, co-location

GBB 38 August 13, 2013
will be convenient for disposing of the solid residue, char, and ash from the gasification facility.
The current level and manner of recycling in a community will significantly affect the composition of waste that may be available for a gasification facility. The potential feedstock for a gasification plant is different in communities with single and dual stream recycling systems. A community with a single stream recycling program or accepting all plastic resin grades for recycling typically has a MSW stream with less plastics, glass, metal, and paper materials. Single stream recycling systems include all papers, plastic containers, metals, glass, and other recyclables mixed in one collection bin and/or truck. The number of this type of recycling system is increasing across the United States. These systems are proven to divert more recyclable materials, and are often easier for the residents (they no longer need to set out multiple bins for different material types) and collection contractors to manage.
However, the single stream MRFs processing these recyclables often have higher residual rates compared to dual stream MRFs. This may be an opportunity for a gasification facility, as an increased amount of MRF residue with non-recycled plastics and contaminated paper could serve as a viable feedstock. Otherwise, this MRF residue would be destined for landfill. A gasification facility may be utilized in several additional ways in partnership with a strong recycling program:
To process residue from the single stream MRF that accepts the community’s recyclables
To process all materials that are not diverted for recycling, helping elevate the landfill diversion rates for the community.
To process commercial wastes, yard wastes, or construction and demolition wastes in communities that have programs and requirements for mandatory recycling of these materials.
The relationship between the recycling community (MRFs and material-specific recyclers and reprocessors) and gasification project developers or technology providers also has an impact on the advancement of the use of gasification as a technology for processing waste materials that contain non-recycled plastics. The MRF is driven to capture maximum value from the materials it handles, which motivates them to recycle all of the plastics that make economic sense to recycle. Pairing a gasification facility with a single stream MRF can occur where the MRF is willing to send residual materials to a gasification facility. This partnership can be encouraged by locating the gasification facility near the MRF, by giving direct benefits to the MRF such as guaranteed electricity supply, and offering a tipping fee that is competitive with the existing landfill-tipping fee.
Overall, the largest interaction between the mechanical recycling community and gasification facilities is dependent upon the amount of segregation performed at the MRF. The more a MRF segregates plastic resin grades, for example, the less non-recycled plastic will be present in the MRF residue, which will have a lower heating value as a feedstock for gasification. This suggests that partnerships between MRFs and gasification facilities could be particularly fruitful when the MRF residue has a high percentage of non-recycled plastic in it and produces a feedstock with a high heating value, improving the economics of small-scale gasification.
The presence of a WTE facility in or near a community has both functional and ideological influence on the development of a gasification facility in its vicinity. If a community is already utilizing another waste conversion and energy recovery technology, the gasification facility has the opportunity to process only what is not processed by this existing facility.

GBB 39 August 13, 2013
This can happen where the disposal needs of the community have outgrown the community’s WTE capacity. Otherwise, the gasification facility will compete with the WTE facility for feedstock. Therefore, an ideal community for gasification development utilizing MSW as a feedstock would not have all of its MSW disposal capacity needs met by an existing WTE facility. Yet existing WTE facilities in the region would reassure the community that these technologies can coexist with strong recycling programs and are appropriately regulated.
Gasification facilities may be coupled with existing energy recovery technologies in the following cases:
The existing facility produces RDF for use in a boiler and there is 20-25 percent process residue. The gasification facility may be able to accept the materials that are not suitable for RDF production and are otherwise landfilled (from the waste received at the RDF facility).
The existing mass burn WTE facility receives a large amount of green waste (yard waste, agricultural wastes) not ideal for combustion in the facility or recycling. The gasification facility may be able to accept these materials.
7.1 Cost/Tipping Fees of the Existing Solid Waste Management System
Tipping/service fees are ultimately the largest determinants of acceptability, long-term success, and economic viability of a gasification facility. Tipping fees are charged at landfills and other waste facilities. As shown in Figure 15, tipping fees vary regionally. These fees depend on the cost of transportation, the amount of disposal capacity available, the capital and operating costs of the disposal facilities.

GBB 40 August 13, 2013
Figure 15 State Average Tipping Fees at Landfills and Other Disposal Facilities26
In order to attract waste and ensure feedstock supply, the gasification facility must be cost competitive with these other disposal sites. States where tipping fees are low (on the left hand side of the list in Figure 15) may not be locations where a gasification facility will be competitive charging a tipping fee sufficient to cover its operating costs. Facilities in states toward the right hand side of the figure may be able to charge higher tipping fees and remain cost competitive.
Gasification facilities that are able to reduce their tipping fees through special financing programs (such as grants and federal loan guarantees) and/or reducing its capital and/or operating costs (below the average of existing facilities and developer estimates), may be cost competitive in a wider range of states.
Alternatively, a facility able to provide desirable alternative benefits to communities, MRFs, or industry (such as increasing diversion rates, producing specifically desirable products, or providing energy and/or disposal independence), may be able to find a feedstock supplier/partner willing to pay a higher than market rate tipping fee.
7.2 Policy Framework
Alternative waste conversion technology facilities have not yet developed in the U.S. to a stage where state and local governments have regulatory classifications that are technology-specific. In most states, gasification facilities are currently regulated as waste processing facilities - most frequently as WTE facilities, and have to comply with the EPA 26 Waste Business Journal: www.wastebusinessjournal.com

GBB 41 August 13, 2013
standards for existing mass burn WTE facilities. As research into the utilization of gasification technologies for waste processing advances, it is important for the legislation to be structured such that gasification facilities can be implemented and advance to the stage of commercial operation.
Some public policy drivers that can influence the implementation of gasification include tax and trade policy, landfill policies, regulatory approvals, land use authorizations, permissibility of sales or distribution of facility products, and regulations governing the utilization of waste materials. These factors have the greatest amount of influence during the facility development stage, as facilities cannot be approved for construction and operation unless policy and regulatory requirements are met.
Regulatory requirements for successful facility development include:
The facility’s ability to obtain state and local environmental permits for facility construction and operation, including groundwater, stormwater, air emission permits, and state and local solid waste facility permits.
The facility’s adherence to land use specifications (i.e., facility sites in areas zoned as industrial or light industrial).
If a facility is producing a fuel product, the ability of the facility to meet fuel quality specifications to market the product.
Policy conditions particularly advantageous to development of gasification facilities include:
Policies and programs that promote the redevelopment of brownfield sites, which often have appropriate zoning for waste processing facilities. These policies often provide site developers with tax benefits, grant funding, and development support.
Flow control policies, which allow municipalities to designate disposal facilities for MSW collected within their geographic boundaries.
Policies that allow the energy generated from waste conversion technologies, including both the biogenic and non-biogenic portions of MSW, to be counted as renewable and eligible to fulfill Renewable Portfolio Standard (RPS) requirements.
Flow control and Renewable Energy Portfolio requirements may influence the development of gasification facilities in a community. Flow control gives authority to a municipality to direct its solid waste to a specific disposal or processing facility. This has a strong impact on the predictability of feedstock for gasification facilities. If a facility can enter into a contract with a municipality such that a certain amount of collected waste is brought to the facility each day, the facility may be protected from short-term fluctuations in the market price for disposal capacity.
The U.S. Energy Policy Act of 2005, the U.S. Department of Energy, and 27 state governments, shown in Figure 16, classify energy generated through WTE as renewable and eligible to fulfill RPS energy production quotas. The RPS obliges utility companies to produce a percentage of their energy from renewable sources (depending upon specific state requirements and definitions). States with RPS requirements mandate between 4 and 33 percent of all electricity to be generated from renewable sources by a specified date.
States that classify MSW as renewable and not limited to the biogenic portion of the MSW stream are considered advantageous. This practice increases incrementally in many states every few years.

GBB 42 August 13, 2013
Figure 16 States and Territories Defining Waste-to-Energy as Renewable (as of 10/1/12)
States and Territories Defining Waste-to-Energy as Renewable (as of 10/1/12)
Alabama Maine Ohio
Arizona Maryland Oklahoma Arkansas Massachusetts Oregon California Michigan Pennsylvania Colorado Minnesota Puerto Rico Connecticut Missouri South Carolina District of Columbia Montana South Dakota Florida Nevada Utah Hawaii New Hampshire Virginia Indiana New Jersey Washington Iowa New York Wisconsin Louisiana Northern Mariana Isl.
7.3 Public Perception
The community’s perception of WTE and waste conversion technologies has an influence on the ability of gasification facility to be permitted and constructed in the community. Permitting process requires these facilities to allow for a public notice and comment period where community members can raise concerns and questions regarding the facility.
Public opposition to a gasification facility in the community may lead local authorities to oppose the facility and prevent it from receiving permits for construction.
Public opposition to gasification technologies may be based upon factors including:
The community’s past experience with traditional incineration facilities. If the community has had experience with incineration without energy recovery or air pollution controls, they may not have an understanding of the manner in which modern WTE facilities operate.
The community’s previous experience with gasification or other alternative waste conversion technologies. If the community has been previously approached by a project developer, they may have only an understanding of one technology or facility type and a suspicion towards another conversion technology.
A lack of information or misinformation in the community regarding waste conversion technologies and their applications, WTE’s compatibility with recycling programs, and municipal waste management issues in general can influence the success and speed of project development. If a public information campaign is required to dispel incorrect information or demonstrate to residents how gasification can fit within the framework of an integrated waste management system, this will increase the project development timeframe.
An ideal community for gasification project development may be one that has positive past experience (either their own experience or familiar with experience in a nearby community), limited negative experience or unfavorable impressions regarding WTE technologies. A

GBB 43 August 13, 2013
robust public information program for the residents about their waste management system can help to create community acceptance of the facility.
7.4 Markets and Infrastructure for the Final Products
Established local markets and available infrastructure for marketing the final products significantly affect the economics of a gasification facility. These factors also contribute to the determination of the size of the plant and types of end products produced. Gasification facilities that are co-located with or located near industrial facilities may have an advantage regarding product use – if their products can be used on-site in existing industrial processes. Infrastructure to handle the products such as pipeline, transportation, or electric interconnection distance must be available at the site to consider it for a gasification plant.
Facilities located in an area near an industrial facility or warehouse space, can use the heat from the facility for district heating or cooling, and those co-located with an industrial park, wastewater treatment plant, or other large energy user, can sell electricity to the neighboring plants. The existing infrastructure in a community for distribution of energy and transportation of fuels and chemicals will affect the ease of sale of gasification facility products.
If the facility is producing electricity or steam, then it needs to be located in an area that has adequate interconnection to the electrical grid or district steam network.
If the facility must transport containerized syngas or fuel products, then the added cost of transportation to market(s) or end users will affect overall facility economics.

GBB 44 August 13, 2013
8 Conclusions
Gasification is a technically mature and proven technology for a variety of feedstocks such as agricultural biomass, auto-shredder residue, and fossil fuels. Its application for processing MSW and/or mixed plastics is relatively recent, and experience in development of full-scale commercially operating facilities is limited.
Gasification technology developers are attempting to build commercial-scale gasification facilities for processing MSW and mixed wastes, though none has yet to complete development or is commercially operating in the U.S. Full-scale commercial gasification facilities processing MSW as a dedicated feedstock are currently operating only in Japan.
As an emerging technology in waste treatment, gasification faces a number of barriers toward commercialization, including large capital investment and operating costs, insufficient experience in scaling from pilot to commercial size facilities, and inexperience with long-term commercial-scale operation.
Gasification facilities in some areas struggle with ill-suited regulatory classifications. Gasification is often still (inappropriately) associated with mass burn as a thermal technology and may need to overcome public perception challenges as it is implemented at a commercial scale.
Primary factors determining the success of gasification of MSW as a commercially viable business include an abundant supply of MSW as a feedstock, established (and developing) markets for the final products, and supportive state and federal policies. The markets for the final products of this process are established. Electricity, ethanol and chemicals are valuable, marketable products and are potential sources of revenue for the gasification facility operators/owners.
Gasification can potentially process both mixed waste and the plastic-only fraction of the waste. This makes gasification technology attractive to municipalities that have to manage mixed waste material and for commercial/industrially generated segregated materials and plastic waste.
As communities move forward with planning for future disposal, many are experiencing pressure from reduced landfill capacity within or in close proximity to their boundaries, as well as a general desire to reduce the amount of waste sent to landfill. Thermal conversion technologies, including gasification, greatly reduce the amount of material that requires disposal. Ambitious communities are aiming for zero waste to landfill, and thus are exploring conversion technologies to enable them to recover the non-recycled materials from the waste.
Successful implementation of a gasification facility is strongly influenced by the following factors (among others discussed in this study):
The willingness of elected officials and local management of solid waste services to accept the development of a gasification facility within their community
Establishing the quality and quantity of available feedstock to determine the size of the facility and the type of gasification technology
Existing collection, processing and disposal practices and infrastructure for waste management in the facility’s host community
Existing level of recycling and WTE experience in the facility’s host community
Existing markets for final facility products

GBB 45 August 13, 2013
Ability to obtain the required environmental permits and land use authorizations, as well as ability to meet fuel quality and other market specifications for products
Advancing the commercialization of gasification technology in the U.S. market will be supported by developing public policy and infrastructure drivers that may include landfill policies, single stream recycling and the encouraging collaboration with the mechanical recycling community, as well as the existing WTE infrastructure.
As technologies move forward with plans to utilize MSW as feedstock, several types of data sets would help to instill a sense of confidence in financiers, municipalities, and others interested in gasification facilities. Capital and operational cost data are of great importance, particularly since no facilities have been processing MSW in the U.S. for long enough to have consistent record of real facility operational costs. Air emission performance data is also needed. Although several of these facilities have obtained air permits in the U.S. and Canada, their actual air emission data will help others to determine what type of permitting process is required, and determine if the facility’s emissions meet the performance expectations of the developer.
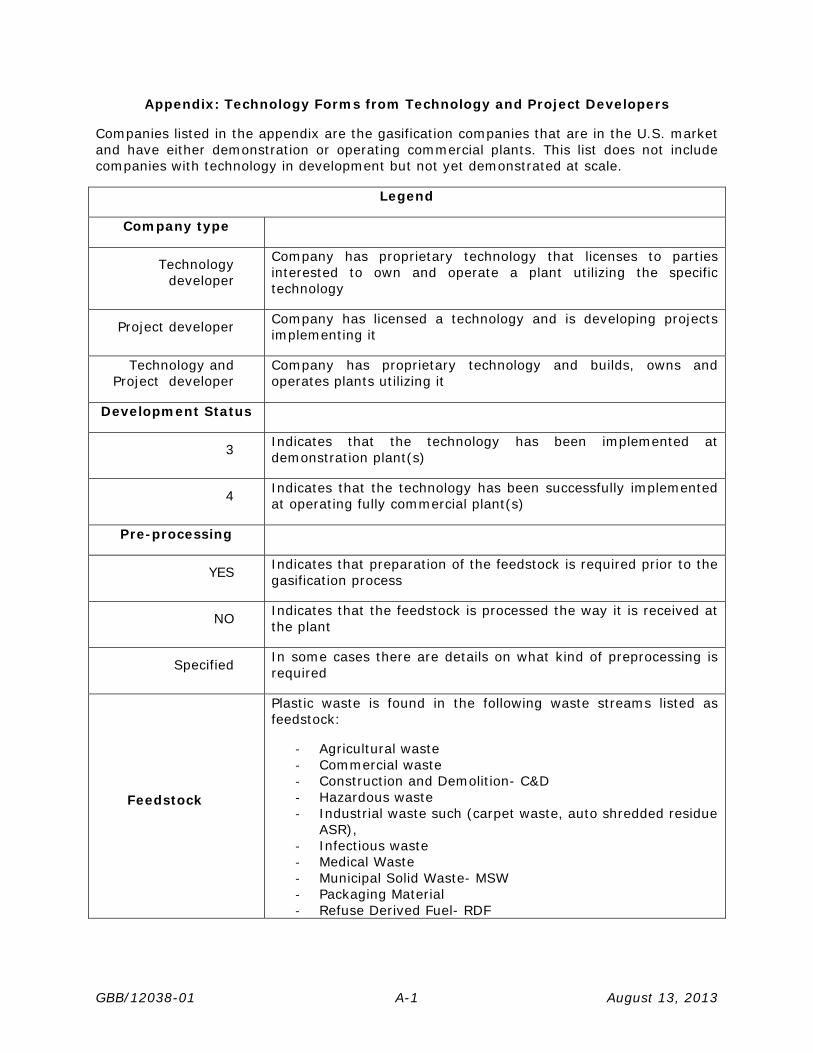
GBB/12038-01 A-1 August 13, 2013
Appendix: Technology Forms from Technology and Project Developers
Companies listed in the appendix are the gasification companies that are in the U.S. market and have either demonstration or operating commercial plants. This list does not include companies with technology in development but not yet demonstrated at scale.
Legend
Company type
Technology developer
Company has proprietary technology that licenses to parties interested to own and operate a plant utilizing the specific technology
Project developer Company has licensed a technology and is developing projects implementing it
Technology and Project developer
Company has proprietary technology and builds, owns and operates plants utilizing it
Development Status
3 Indicates that the technology has been implemented at demonstration plant(s)
4 Indicates that the technology has been successfully implemented at operating fully commercial plant(s)
Pre-processing
YES Indicates that preparation of the feedstock is required prior to the gasification process
NO Indicates that the feedstock is processed the way it is received at the plant
Specified In some cases there are details on what kind of preprocessing is required
Feedstock
Plastic waste is found in the following waste streams listed as feedstock:
‐ Agricultural waste ‐ Commercial waste ‐ Construction and Demolition- C&D ‐ Hazardous waste ‐ Industrial waste such (carpet waste, auto shredded residue
ASR), ‐ Infectious waste ‐ Medical Waste ‐ Municipal Solid Waste- MSW ‐ Packaging Material ‐ Refuse Derived Fuel- RDF
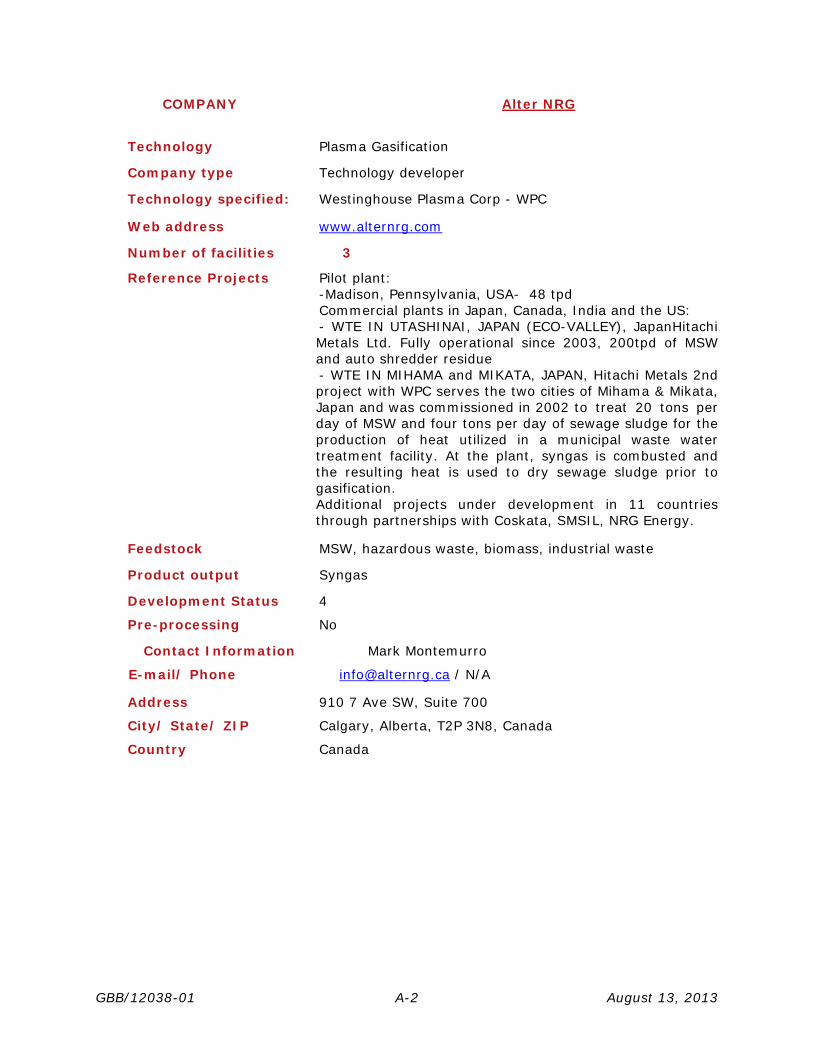
GBB/12038-01 A-2 August 13, 2013
COMPANY Alter NRG
Technology Plasma Gasification
Company type Technology developer
Technology specified: Westinghouse Plasma Corp - WPC
Web address www.alternrg.com
Number of facilities 3
Reference Projects Pilot plant: -Madison, Pennsylvania, USA- 48 tpd Commercial plants in Japan, Canada, India and the US:
- WTE IN UTASHINAI, JAPAN (ECO-VALLEY), JapanHitachi Metals Ltd. Fully operational since 2003, 200tpd of MSW and auto shredder residue - WTE IN MIHAMA and MIKATA, JAPAN, Hitachi Metals 2nd project with WPC serves the two cities of Mihama & Mikata, Japan and was commissioned in 2002 to treat 20 tons per day of MSW and four tons per day of sewage sludge for the production of heat utilized in a municipal waste water treatment facility. At the plant, syngas is combusted and the resulting heat is used to dry sewage sludge prior to gasification. Additional projects under development in 11 countries through partnerships with Coskata, SMSIL, NRG Energy.
Feedstock MSW, hazardous waste, biomass, industrial waste
Product output Syngas
Development Status 4
Pre-processing No
Contact Information Mark Montemurro
E-mail/ Phone [email protected] / N/A
Address 910 7 Ave SW, Suite 700
City/ State/ ZIP Calgary, Alberta, T2P 3N8, Canada
Country Canada

GBB/12038-01 A-3 August 13, 2013
COMPANY Chinook Energy, LLC
Technology Gasification, Pyrolysis
Company type Technology developer Project developer
Web address www.chinookenergy.com
Number of facilities 16
Reference Projects Commercial Metal Recovery Plants: - Brazil - 1 - Canada - 2 - United Kingdom - 1 - Portugal - 1 - Italy – 1 - Hungary - 1 - Slovakia - 1 - Russia - 1 - Turkey - 2 - UAE - 1 - U.S. - 4 (TX, NJ, NC, PA)
Europe –Several ASR & MSW facilities are currently under development.
Feedstock Scrap metal such as UBC (beverage cans), morph, rayon bond, tetra-pak, insulated copper wire, ASR, MSW, and any other form of organic waste.
Product output Syngas, Electricity
Development Status 4
Pre-processing Yes
Contact Information William F. Gleason
E-mail/ Phone [email protected] / N/A
Address 20 Commerce Drive, Suite 326
City/ State/ ZIP Cranford, NJ, 7016
Country USA

GBB/12038-01 A-4 August 13, 2013
COMPANY Coaltec Energy USA, Inc.
Technology Gasification
Company type Technology developer
Technology specified: biomass gasification
Web address www.coaltecenergy.com
Number of facilities 3
Reference Projects Commercial scale R&D at Coal Research Park of Southern Illinois University in Carterville, Illinois; Commercial scale demonstration project at Frye Poultry Farm Wardensville, West Virginia; Commercial scale demonstration plant at P & J Products, a turkey farm, near Northfield Minnesota; Commercial plant under development Sexing Technologies, South Charleston, Ohio;
Feedstock RDF, coal (raw, washed, and fines), crop residues, dairy, manure (horse, cattle, and hog), food processing by-products, poultry litter, wet distiller's grain, wood debris
Product output Syngas, biochar
Development Status 3
Pre-processing Yes
Contact Information Barbara T. Gaume
E-mail/ Phone [email protected] /214-542-3321
Address 5749 Coal Drive,
City/ State/ ZIP Carterville, IL, 62918
Country USA

GBB/12038-01 A-5 August 13, 2013
COMPANY Coskata, Inc.
Technology Ethanol Production/ Gasification
Company type Technology developer
Technology specified: Biofermentation of syngas
Web address www.coskata.com
Number of facilities 3
Reference Facilities Pilot facility - Global Headquarters in Warrenville, Illinois Demonstration plants: -Semi-commercial facility- Madison, Pennsylvania
-Commercial scale plant- Facility Lighthouse, 2009. This commercial demonstration facility developed by Coskata Inc. (Coskata) uses the Westinghouse Plasma Corporation's (WPC) gasification solution to turn biomass into ethanol.
Feedstock Energy crops, wood chips, forestry products, corn stove, agricultural wastes; MSW and industrial organic waste
Product output cellulosic ethanol
Development Status 3
Pre-processing Yes
Additional Notes Listed #17 on the list of the 50 Hottest Companies in Bioenergy 2011- 2012 by Biofuels Digest
Contact Information Wes Bolson
E-mail/ Phone [email protected] / N/A
Address 4575 Weaver Parkway, Suite 100
City/ State/ ZIP Warrenville, IL, 60555
Country USA

GBB/12038-01 A-6 August 13, 2013
COMPANY Covanta Energy
Technology Gasification
Company type Technology developer, Facility Developer
Technology specified: CLEERGAS technology
Web address www.covantaenergy.com
Number of facilities 1
Reference Facilities Demonstration plants: - Unit #3 Walter Hall Resource Recovery Facility, Tulsa OK
Feedstock unprocessed MSW
Product output electricity
Development Status 3
Pre-processing No
Contact Information Steve Goff
E-mail/ Phone [email protected]/ (862)345-5000
Address 445 South Street
City/ State/ ZIP Morristown, NJ, 07960
Country USA

GBB/12038-01 A-7 August 13, 2013
COMPANY Enerkem
Technology Gasification to Ethanol
Company type Technology developer Facility developer
Technology specified: Gasification and catalytic synthesis of ethanol
Web address www.enerkem.com
Number of facilities 6
Reference Facilities Operating plants: - Sherbrooke, Quebec (Canada) - Pilot Plant, 2003 - Edmonton, Alberta (Canada) - Research Facility, 2012- www.edmontonbiofuels.ca
-Westbury, Quebec (Canada) - Commercial demonstrational plant- 2009 (syngas product)
Plants under Construction: -Edmonton, Alberta (Canada)- commercial, 10 mill gallons of ethanol per year
Plants under development: - Pontotoc, Mississippi (U.S.)- commercial, 10 mill gallons of ethanol per year - Varennes, Quebec (Canada)- commercial, 10 mill gallons of ethanol per year
Feedstock Presorted MSW
Product output Cellulosic Ethanol, chemical intermediates
Development Status 3
Pre-processing Yes
Contact Information Vanessa Champagne
E-mail/ Phone [email protected] / N/A
Address 615, boul. Rene-Levesque Ouest, Bureau 820
City/ State/ ZIP Montreal, Quebec, H3B 1P5, Canada
Country Canada

GBB/12038-01 A-8 August 13, 2013
COMPANY Foster Wheeler
Technology Gasification/WTE: Mass Burn, Modular, Dedicated boilers, and RDF
Company type Technology developer Facility developer
Web address www.fwc.com/GlobalEC/Gasification/gasification.cfm
Number of facilities 5
Reference Facilities Developed facilities: - Bedzin, Poland for PKE, 2008
- Novocherkassk, Russia for PJSC Energo Mashinostroitelny Alliance (EM Alliance), 2012 - Lomellina (Parona) for Linea Holding 2000-2007; Fuel: refuse Boiler/incinerator - Red Wing, MN for Xcel Energy, 1949; Fuel: RDF Boiler/incinerator system - Thetford, Norfolk for Fibrothetford Ltd, 1998; Fuel: poultry litter, Boiler/incinerator system
Feedstock RDF, wood, packaging material
Product output syngas, chemicals, electricity, fuel
Development Status 4
Pre-processing Yes
Contact Information [email protected]
E-mail/ Phone [email protected] / N/A
Address Perryville Corporate Park,
City/ State/ ZIP Clinton, NJ, 08809-4000
Country USA

GBB/12038-01 A-9 August 13, 2013
COMPANY Fulcrum Bioenergy
Technology Ethanol Production/Gasification
Company type Facility developer
Technology specified: InEnTech Gasification followed by alcohol synthesis
Web address www.fulcrum-bioenergy.com
Number of facilities 0
Reference Facilities Commercial plant under development: - Sierra BioFuels Plant located in the Tahoe-Reno Industrial Center, in the City of McCarran, Storey County, Nevada. Capacity of 10 mill gallons of ethanol per year
Feedstock MSW
Product output Ethanol
Development Status 3
Pre-processing YES
Contact Information
E-mail/ Phone [email protected] /925.730.0150
Address 4900 Hopyard Road, Suite 220
City/ State/ ZIP Pleasanton, CA, 94588
Country USA
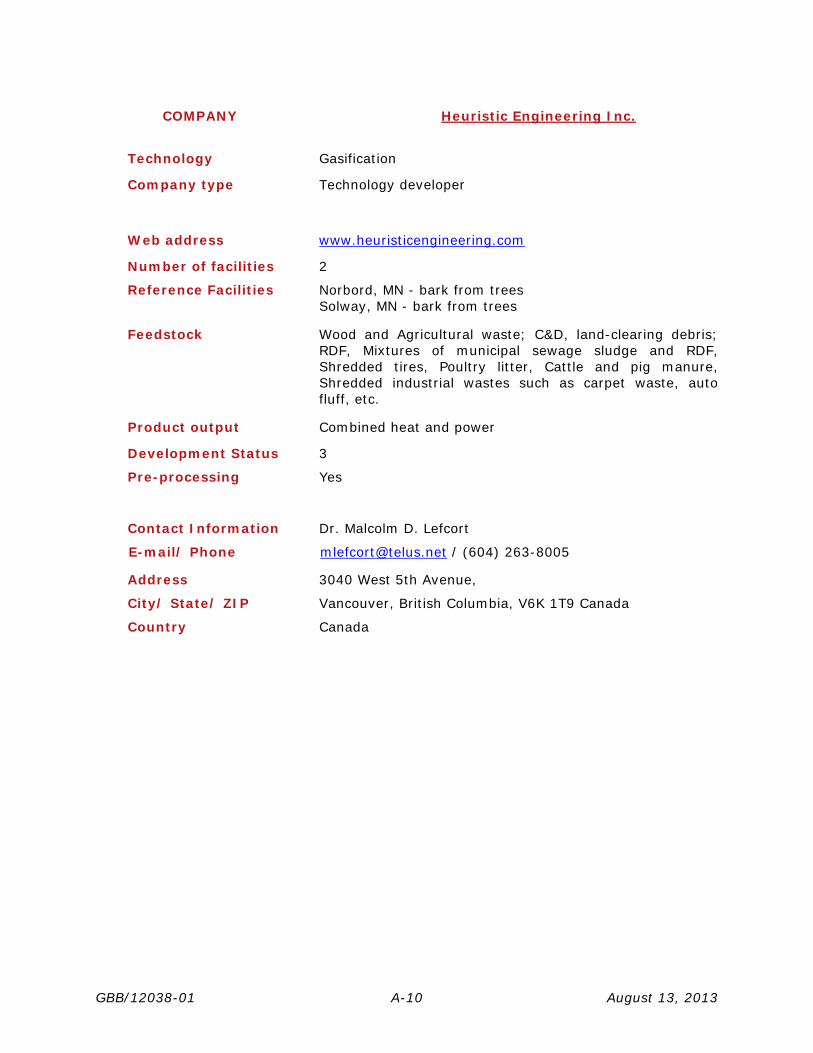
GBB/12038-01 A-10 August 13, 2013
COMPANY Heuristic Engineering Inc.
Technology Gasification
Company type Technology developer
Web address www.heuristicengineering.com
Number of facilities 2
Reference Facilities Norbord, MN - bark from trees Solway, MN - bark from trees
Feedstock Wood and Agricultural waste; C&D, land-clearing debris; RDF, Mixtures of municipal sewage sludge and RDF, Shredded tires, Poultry litter, Cattle and pig manure, Shredded industrial wastes such as carpet waste, auto fluff, etc.
Product output Combined heat and power
Development Status 3
Pre-processing Yes
Contact Information Dr. Malcolm D. Lefcort
E-mail/ Phone [email protected] / (604) 263-8005
Address 3040 West 5th Avenue,
City/ State/ ZIP Vancouver, British Columbia, V6K 1T9 Canada
Country Canada

GBB/12038-01 A-11 August 13, 2013
COMPANY InEnTec
Technology Plasma Gasification
Company type Technology developer Facility developer
Web address www.inentec.com
Number of facilities 11
Reference Facilities Commercial facilities: - Waste Management Columbia Ridge Landfill, Arlington, OR, USA- MSW, 2009 - Dow Corning Facility, Midland, MI, USA, industrial byproducts - Richland, WA, USA at its Technology Center in Richland, WA. The G100P represents a significant commercial development for the PEM® technology as it provides for nearly a 500 percent increase in the throughput over the G100 units installed elsewhere. The system has been used to process portions of the City of Richland’s daily MSW stream and to further commercialize the technology. - Transportable System – various locations; In 2007, InEnTec Leasing Services LLC (a partly-owned InEnTec subsidiary) constructed a fully contained, self-sufficient transportable Model G30 PEM® system on two flat-bed trailers. The system began operating for demonstration purposes in March 2007 at Fort Riley Army Base in Kansas, processing municipal solid waste. - Global Plasma Technology Limited – Kuan Yin (Taipei), Taiwan R.O.C. - medical waste, 2005. - Kawasaki Plant Systems – Harima, Japan- PCB processing (listed below) was disassembled and re-installed it in Harima, Japan. In April 2006, it began operating again, to demonstrate the destruction of asbestos materials for potential Kawasaki clients. Asbestos testing activities were completed in June 2006; current plans involve moving the system to Chiba (near Tokyo) where it will process PCB waste materials on an ongoing basis. - Kawasaki Heavy Industries, Ltd. – Okinawa, Japan, 2003- PCB oil and PCB-contaminated materials. The test program was successful, and the Japanese government gave approval to use the PEM® for PCB destruction throughout Japan. - The Boeing Company – Kuala Lumpur, Malaysia, 2001 and delivered the unit in early 2002 to BioPure Systems SDN BHD in Malaysia, a company Boeing established to own and operate the system. Boeing initially purchased the system as part of a military offset program, but it has not

GBB/12038-01 A-12 August 13, 2013
yet needed to fund the offsets, so the system has not yet been installed. - Fuji Kaihatsu Ltd. – Iizuka City, Japan- wood and plastic waste, using the syngas to produce electric power- 2002 with the feedstock being changed to electronic scrap shortly after the system came on-line, in order to extract gold and copper. Economic challenges (negative tip fees for the feedstock) caused the company to stop operating the PEM® in mid-2003, but they have been pursuing new regulatory approvals to process other materials with a plan to restart the system once appropriate approvals are granted. - Asia Pacific Environmental Technologies, Inc. (APET) – Kapolei, HI, USA, 2001-2004, medical waste and use the syngas for fuel in dual-fueled gas genset that provided power to the PEM®. - Allied Technology Group, Inc – Richland, WA, USA, 1999, mixed hazardous and radioactive wastes. It was the first facility in the U.S. to receive a mixed RCRA / TSCA permit. The system began operating in September 2000 and was operated for over 13 months before financial troubles within the company unrelated to the PEM® system forced ATG to shut the facility down and file for bankruptcy. The PEM® system is still installed in the facility, in cold standby
Feedstock MSW, hazardous, medical, radioactive, and industrial wastes, and used tires
Product output syngas
Development Status 4
Pre-processing Unknown
Contact Information William J. Quapp
E-mail/ Phone [email protected]
Address 595 SW Bluff Drive, Suite B
City/ State/ ZIP Bend, OR, 97702
Country USA
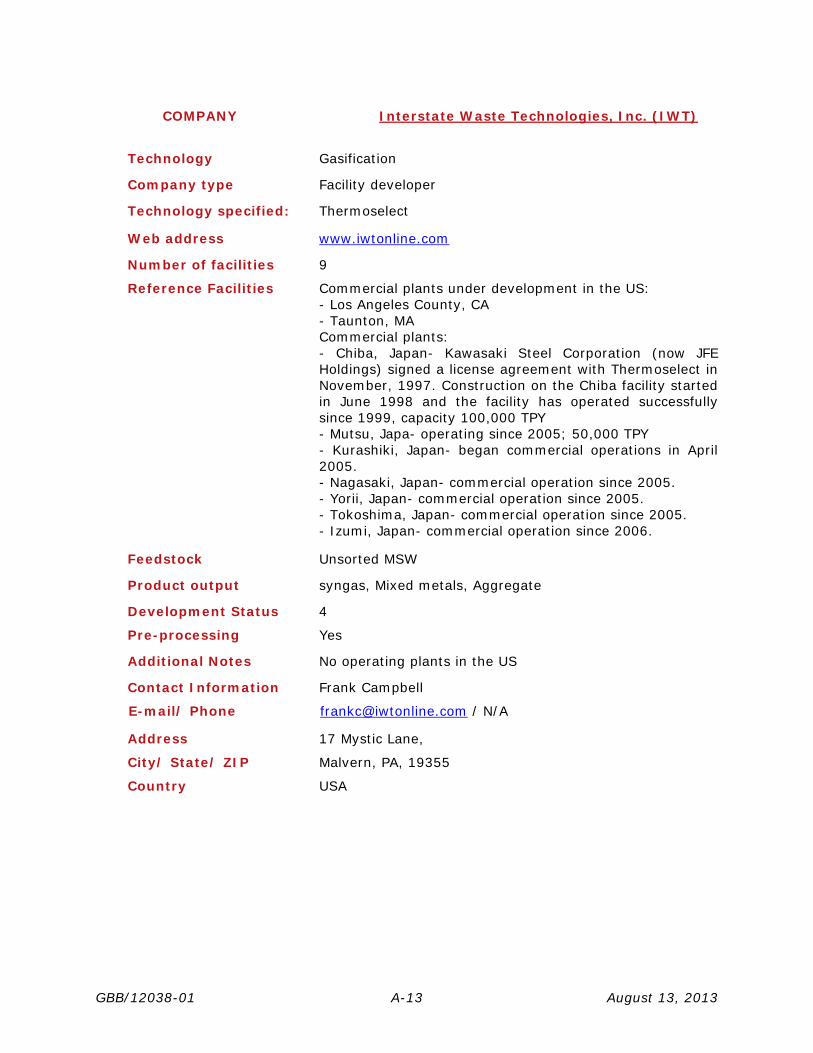
GBB/12038-01 A-13 August 13, 2013
COMPANY Interstate Waste Technologies, Inc. (IWT)
Technology Gasification
Company type Facility developer
Technology specified: Thermoselect
Web address www.iwtonline.com
Number of facilities 9
Reference Facilities Commercial plants under development in the US: - Los Angeles County, CA - Taunton, MA Commercial plants:
- Chiba, Japan- Kawasaki Steel Corporation (now JFE Holdings) signed a license agreement with Thermoselect in November, 1997. Construction on the Chiba facility started in June 1998 and the facility has operated successfully since 1999, capacity 100,000 TPY
- Mutsu, Japa- operating since 2005; 50,000 TPY - Kurashiki, Japan- began commercial operations in April 2005.
- Nagasaki, Japan- commercial operation since 2005. - Yorii, Japan- commercial operation since 2005. - Tokoshima, Japan- commercial operation since 2005. - Izumi, Japan- commercial operation since 2006.
Feedstock Unsorted MSW
Product output syngas, Mixed metals, Aggregate
Development Status 4
Pre-processing Yes
Additional Notes No operating plants in the US
Contact Information Frank Campbell
E-mail/ Phone [email protected] / N/A
Address 17 Mystic Lane,
City/ State/ ZIP Malvern, PA, 19355
Country USA

GBB/12038-01 A-14 August 13, 2013
COMPANY Navitus Plasma Inc.
Technology Plasma Gasification
Company type Project developer
Technology specified: AlertNRG, Whestinghouse Plasma
Web address www.navitusplasma.com
Number of facilities 0
Reference Projects Project under development: - Dufferin Project – The original EfW project, as contemplated by the DEEP development plan, was for a 25,000 tonne per year facility, or about 75 tonnes per day. After selecting Alter NRG as preferred supplier, the County approved an increase in size to slightly over 200 tonnes per day using combustion turbines in a combined cycle configuration. The larger size was needed to ensure the best match between waste volumes, gasifier size and power generation equipment to optimize the project economics. In early 2011, Alter NRG initiated a new development company called Navitus Plasma Inc. (“Navitus”) that will have an exclusive license for use of Westinghouse Plasma Gasification for waste in the Province of Ontario. Navitus will advance Dufferin County and other plasma gasification projects in the Ontario market. Currently Navitus is proposing a further enhancement to the project scope and has initiated the Environmental Screening process for this new configuration.
Feedstock MSW, compost residual waste, regional sewage sludge and other area waste streams.
Product output syngas
Development Status 4
Pre-processing Unknown
Contact Information George Todd
E-mail/ Phone [email protected] /416.849.2083
Address 151 Bloor Street West, Suite 1100
City/ State/ ZIP Toronto, Ontario, Canada M5S 1S4
Country Canada

GBB/12038-01 A-15 August 13, 2013
COMPANY Nippon Steel Corporation (Nippon Steel USA, Inc.)
Technology Gasification
Company type Technology developer
Technology specified: Direct Melting Systems (Shaft furnace type gasification and melting system)
Web address www.nsc.co.jp
Number of facilities 9
Reference Projects Commercial plants: -Kamaishi City, Iwate Pref. MSW; CFC gas, 110 / 2 sets of 55- Sep. 1979 Hot water recovery - Ibaraki City, Osaka Pref. MSW; CFC gas, 166 /refurbished Apr. 1999, Waste heat boiler/ power generation (capacity: 10,000kW) - East Incineration Facilities Union, Kagawa Pref.MSW; incineration residues 72 /annexed Apr. 2002 Waste heat boiler / power generation (capacity: 1600kW+1100kW) - Lizuka City, Fukuoka Pref. MSW; sludge 198/ 2 sets of 99 Apr. 1998 Waste heat boiler / power generation (capacity: 1200kW) - Itoshima Regional Fighting & Facilities Union, Fukuoka Pref. MSW; sludge; sludge-incineration residues; CFC gas 220/2 sets of 110 Apr. 2000 Waste heat boiler/power generation (capacity: 3000kW) - Kameyama City, Mie Pref. MSW; landfill wastes 88 / 2 sets of 44 Apr. 2000 Waste heat boiler / power generation (capacity: 1250kW) - Akita City, Akita Pref. MSW; sludge; incineration residues 440 / 2 sets of 220 Apr. 2002 Waste heat boiler / power generation (capacity: 8500kW) - Kazusa Clean System Co.,Ltd. [Phase-1] Chiba Pref.MSW; sludge; incineration residues 220 / 2 sets of 110 Apr. 2002 Waste heat boiler / power generation
(Capacity: 2300kW) - Narashino City, Chiba Pref. MSW; sludge 222 / 3 sets of 74 Nov. 2002 Waste heat boiler / power generation (capacity: 2400kW)
Feedstock MSW, plastic waste, sludge
Product output CHP
Development Status 4
Pre-processing Unknown
Additional Notes No plants in the US
Contact Information Shoji Muneoka
E-mail/ Phone N/A /212-486-7150

GBB/12038-01 A-16 August 13, 2013
COMPANY Nippon Steel Corporation (Nippon Steel USA, Inc.)
Address 780 Third Ave. 34th Floor
City/ State/ ZIP New York, NY, 10017
Country USA

GBB/12038-01 A-17 August 13, 2013
COMPANY Powers Energy of America, Inc.
Technology Ethanol Production/Gasification
Company type Project developer
Technology specified: INEOS Bio
Web address www.powersenergyofamerica.com
Number of facilities 1
Reference Projects Pilot Plant: - Fayetteville, AR
Feedstock MSW
Product output ethanol
Development Status 3
Pre-processing Yes
Contact Information Earl H. Powers
E-mail/ Phone [email protected] /
(812) 473-5500
Address P.O. Box 5404,
City/ State/ ZIP Evansville, IN, 47716
Country USA
GBB/12038-01 A-18 August 13, 2013
COMPANY Primenergy, LLC
Technology Gasification
Company type Technology developer
Technology specified: biomass gasification
Web address www.primenergy.com
Number of facilities 6
Reference Projects Commercial plants: - Stuttgart, AR, 600 tpd Rice Hulls, 150,000 pph Steam, 12.8MWe - Jonesboro, AR, 165 tpd Rice Hulls, 30,000 pph Steam & 35 mm Btu/hr Process Heat
- Dalton, GA, 80 tpd Waste Carpet, 50,000 pph Steam - St. Joseph, MO, 168 tpd Corn Fiber, 60,000 pph Steam - Philadelphia, PA - 10 Wet Tons per Hour Demonstration plant: - Corporate headquarters in Tulsa commissioned in 1996
Feedstock Rice hulls, olive oil, wood, carpet waste, sewage sludge
Product output CHP
Development Status 4
Pre-processing Yes
Contact Information Bill Scott
E-mail/ Phone [email protected] / N/A
Address 3172 North Toledo Avenue,
City/ State/ ZIP Tulsa, OK, 74115
Country USA

GBB/12038-01 A-19 August 13, 2013
COMPANY PyroGenesis, Inc. (Canada)
Technology Plasma Gasification
Company type Technology developer
Technology specified: Plasma torches
Web address www.pyrogenesis.com
Number of facilities 9
Reference Projects Pilot plant: -Montreal, Canada- capacity of 0.5-2.5 t/day depending on the type of waste and has been treating waste since January 2002.
Commercial plants: - Air Force Special Operations Command (AFSOC)- 2011 - Northrop Grumman Newport, 2008 - US Navy, 2001 - PPG Industries 2008 - Carnival Cruise Lines- 2002 - Environmental Energy Resources- 2006 - Fiscantieri- 2004 - Natural Resources Canada
Feedstock Variety of waste types including MSW
Product output Syngas, energy
Development Status 4
Pre-processing Yes
Contact Information Gillian Holcroft, M.Eng
E-mail/ Phone [email protected] / (514) 937-0002 ext. 224
Address 1744 William St., Suite 200
City/ State/ ZIP Montreal, Quebec, Canada H3J TR4
Country Canada

GBB/12038-01 A-20 August 13, 2013
COMPANY Renewable Energy Management Inc. (REM)
Technology Gasification
Company type Project developer
Technology specified: Entech gasification technology
Web address www.rem-energysolutions.com
Number of facilities 0
Reference Projects Under development: - Brant County, Canada - Wesleyville, Port Hope, Canada - Huntington Beach, County of Los Angeles- USA - Dominican Republic, Carabean
Feedstock MSW, RDF, Various biomasses, Industrial and commercial wastes, Infectious wastes, Petrochemical wastes
Product output
Development Status 4
Pre-processing Unknown
Contact Information Stan Kinsman
E-mail/ Phone [email protected] / N/A
Address 1101 Kingston Rd., Suite 270
City/ State/ ZIP Pickering, Ontario, L1V 1B5 Canada
Country Canada

GBB/12038-01 A-21 August 13, 2013
COMPANY Whitten Group International/Entech Environmental/Wtgas
Technology Gasification
Company type Project developer
Technology specified: Entech gasification technology
Web address www.entech-res.com/wtgas/
Number of facilities 6
Reference Projects Commercial plants: -Genting/Sri Layang Municipality, Malaysia- 1998, (Waste Derived Fuel (WDF) 60 T/d), Thermal capacity: 6.9 MWt - Chung Gung Municipality, Taiwan- 1991 (Waste Derived Fuel (WDF) 30 T/dy) Thermal capacity 3.5 MWt - RCO Investment Corporation, Poland- 2003 (Biohazardous Waste Derived Fuel 3.5 T/dy), Thermal capacity: 5.6 MWt - LG Engineering, Korea- 1997 (Byproduct Semi-Conductor Production Waste Derived Fuel, 20 T/dy), Thermal capacity 5.7 MWt
Feedstock MSW, RDF, Biomass Infectious wastes, Industrial wastes, Petrochemical wastes
Product output Energy
Development Status 4
Pre-processing Yes
Additional Notes
Contact Information Ron Whitten
E-mail/ Phone [email protected] / N/A
Address 2622 Lilac Street,
City/ State/ ZIP Longview, WA, 98632
Country USA