gas-phase adsorption isotherms
TRANSCRIPT
1
Surface Adsorption Adsorption is used to describe the attachment of gases or dissolved substances to the surface of a solid or liquid interfaces. At constant temperature the quantity of adsorbed substances is a function of the type of system investigated and the partial pressure and/or the concentration of the substance in question. The correlation is described by great numbers of adsorption isotherms. A technique to measure the specific surface area and pore size distribution of powdered or solid materials. Using dry sample (evacuated) at temperature of 77K (liquid N2) At this temperature normally using inert gases, that physically adsorb on the surface sample such as;
1. nitrogen, 2. argon and 3. krypton
Nitrogen gas is ideal for measuring surface area and pore size distribution. This adsorption process can be considered to be a reversible condensation or layering of molecules on the sample surface during which heat is evolved. What is adsorption? The use of solids for removing substances from either gaseous or liquid solutions. This process, known as adsorption, involves nothing more than the preferential partitioning of substances from the gaseous or liquid phase onto the surface of a solid substrate.
• In the early days - using bone char for decolorization of sugar solutions and foods.
• Implementation of activated carbon for removing nerve gases from the battlefield. • Today's thousands of applications, the adsorption phenomenon has become a
useful tool for purification and separation.
Adsorption phenomena are operative in most natural physical, biological, and chemical systems, and adsorption operations employing solids such as activated carbon and synthetic resins are used widely in industrial applications and for purification of waters and wastewaters.
The process of adsorption involves - separation of a substance from one phase accompanied by its accumulation or concentration at the surface of another. Adsorption is defined as the concentration of gas molecules near the surface of a solid material. The adsorbed gas is called adsorbate and the solid where adsorption takes place is known as the adsorbent. Adsorption is thus different from absorption, a process in which material transferred from one phase to another (e.g. liquid) interpenetrates the second phase to form a "solution". The term sorption is a general expression encompassing both processes. Theory and evaluation As a result of the action of attractive forces between the exposed particles, gases or dissolved substances B attached themselves (adsorbate) reversibly to the surface of solid phases A (adsorbing agent)
absABBA ↔+ Depending on the strength of the interactions, can differentiate;
Categories of adsorption
• submonolayer,
• monolayer, and
• multilayer
the thermodynamics of adsorption may be developed around experimental isotherms or
around calorimetric data.
Adsorption isotherms may be derived from a consideration of two-dimensional
equations of state, from partition functions by statistical thermodynamics, or from kinetic
arguments.
Developed around the determination of specifics gas adsorption.
Two widely used studies of analysis are,
1. Low-temperature N2 adsorption and
22. the Brunauer-Emmett-Teller method for this purpose
3
- Adsorption experiments are conducted at constant temperature,
An empirical or theoretical representation of the amount adsorbed as a
function of the equilibrium gas pressure is called an adsorption isotherm.
Chemisorption
- formation of chemical bonds between the adsorbent and the adsorbate.
-two consequences
That the associated heat effects are comparable to those which accompany ordinary
chemical reactions and that the process is not always reversible. It is possible, For
example, to absorb (chemisorb) oxygen on carbon and desorb CO or CO2.
Chemisorption typically involve:
1- Chemical bonds 2- Subtantial adsorption enthalpies.
Monolayer of the adsorbed substance.
Physical adsorption The energy effects are comparable to those which accompany physical changes such
as liquefaction and are completely reversible for non-porous solids.
Example of the solid-gas interface in which only physical adsorption occurs -
nonporous solids.
Adsorption typically involve:
1- Weak Van Der Waals forces. 2- Very low adsorption enthalpies. 3- A number of superimposed adsorption layers.
Physical adsorption -caused mainly by van der Waals forces and electrostatic forces between adsorbate molecules and the atoms which compose the adsorbent surface. Thus adsorbents are characterized first by surface properties such as surface area and polarity. A large specific surface area is preferable for providing large adsorption capacity, but the creation of a large internal surface area in a limited volume inevitably gives rise to large numbers of small sized pores between adsorption surfaces.
4
The size of the micropores determines the accessibility of adsorbate molecules to the internal adsorption surface, so the pore size distribution of micropores is another important property for characterizing adsorptivity of adsorbents. Zeolite and carbon molecular sieves can be specifically engineered with precise pore size distributions. Surface polarity - affinity with polar substances such as water or alcohols. Polar adsorbents also called "hydrophillic" Example: aluminosilicates such as zeolites, porous alumina, silica gel or silica-alumina. Nonpolar adsorbents are generally "hydrophobic". Greater affinity with oil or hydrocarbons Example: Carbonaceous adsorbents, polymer adsorbents and silicalite. These adsorbents have more than water. Adsorption Isotherm
An adsorption isotherm (one temperature) is usually recorded as volume of gas
adsorbed (cc/g at STP) versus relative pressure (i.e., sample pressure / saturation
vapor pressure). Using relative pressure to construct the isotherm eliminates changes in
pressure from small changes in temperature. A small change in temperature changes
the saturation vapor pressure considerably.
For example, 0.1K increase in temperature changes the saturation pressure of nitrogen
from approx. 760 mm Hg to 800 mm Hg. The use of relative pressure is convenient and
is scaled from 0 to 1. A relative pressure of 1 represents a completely saturated sample,
i.e., all of the available surface structure is filled with liquid-like gas
Different Methods of Measurement There are three instrument methods in common use today for measuring adsorption
isotherm data. These volumetric methods use the "GAS LAWS" to calculate the volume
of gas adsorbed at measured relative pressures and are known as
1) Static, (classic) fully equilibrated,
2) Continuous Flow, or quasi-equilibrated, and
3) Dynamic or Chromatographic.
5
BET Surface Area Determination BET (Brunauer, Emmett and Teller) equation is used to give specific surface area.
The BET equation is used to give the volume of gas needed to form a monolayer on the
surface of the sample. The actual surface area can be calculated from knowledge of the
size and number of the adsorbed gas molecules.
Gases:
Nitrogen has low surface area is low but often used for BET,
Argon or krypton - both give a more sensitive measurement, because of their lower
saturation vapor pressures at liquid nitrogen temperature.
Brief description of the gas adsorption technique for surface area characterization
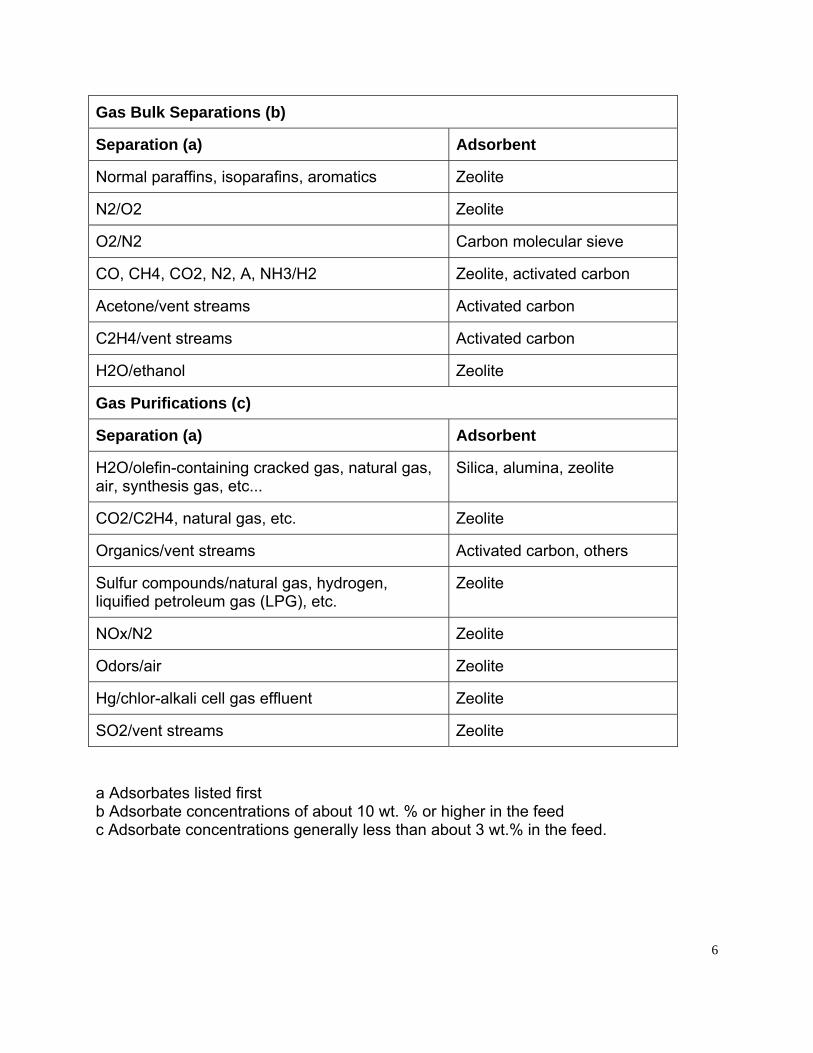
Adsorbents The adsorbent is the separating agent used to express the difference between molecules in a mixture: adsorption equilibrium or kinetics. Applications
Representative Commercial Gas Phase Adsorption Separation
6
Gas Bulk Separations (b)
Separation (a) Adsorbent
Normal paraffins, isoparafins, aromatics Zeolite
N2/O2 Zeolite
O2/N2 Carbon molecular sieve
CO, CH4, CO2, N2, A, NH3/H2 Zeolite, activated carbon
Acetone/vent streams Activated carbon
C2H4/vent streams Activated carbon
H2O/ethanol Zeolite
Gas Purifications (c)
Separation (a) Adsorbent
H2O/olefin-containing cracked gas, natural gas, air, synthesis gas, etc...
Silica, alumina, zeolite
CO2/C2H4, natural gas, etc. Zeolite
Organics/vent streams Activated carbon, others
Sulfur compounds/natural gas, hydrogen, liquified petroleum gas (LPG), etc.
Zeolite
NOx/N2 Zeolite
Odors/air Zeolite
Hg/chlor-alkali cell gas effluent Zeolite
SO2/vent streams Zeolite a Adsorbates listed first b Adsorbate concentrations of about 10 wt. % or higher in the feed c Adsorbate concentrations generally less than about 3 wt.% in the feed.
7
Gas-Phase Adsorption Isotherms In adsorption, a dynamic phase equilibrium is established for the distribution of the
solute between the fluid (gas, vapour or liquid) and the solid surface.
The equilibrium is usually expressed in terms of partial pressure (gas, vapour) or
concentration (liquid) of the adsorbate in the fluid and the solute loading on the
adsorbent, expressed as mass, mole or volume of adsorbate per unit mass, mole or
volume of the adsorbent.
Unlike vapour-liquid and liquid-liquid equilibria, where theory is often applied to estimate
phase distribution, no acceptable theory has been developed to estimate fluid-solid
adsorption equilibria. Thus it is necessary to obtain experimental equilibrium data for a
particular solute, or mixtures of solutes and/or solvent, and a sample of the actual solid
adsorbent material of interest.
If the data are taken over a range of fluid concentrations at a constant temperature, a
plot of solute loading on the adsorbent versus concentration or partial pressure in the
fluid can be made. Such a plot is called the adsorption isotherm. We focused primarily
on gas-phase adsorption. Liquid-phase adsorption exhibits their own isotherms as well.
Gas-Phase Adsorption Adsorption is a physical phenomenon (physisorption) that occurs at any environmental
condition (pressure and temperature) but only at very low temperature it becomes
measurable.
Physisorption experiments are performed at very low temperature, usually at liquid
nitrogen or liquid argon boiling temperature at atmospheric pressure.
Adsorption takes place because of the presence of an intrinsic surface energy. When a
porous material is exposed to a gas, an attractive force acts between the exposed
surface of the solid and the gas molecules. The result of these forces is characterized
as physical (or Van der Waals) adsorption.
The surface area of a solid includes both the external surface and the internal surface of
the pores.
Adsorption is a reversible phenomenon - due to the weak bonds involved between gas
molecules and the surface (less than 10 Kcal/mole).
Non-selective, thus filling the surface step by step (or layer by layer) depending on the
available solid surface and the relative pressure.
Filling the first layer enables the measurement of the surface area of the material
because the amount of gas adsorbed when the mono-layer is saturated is proportional
to the entire surface, that includes the internal and external surface. Adsorption
isotherm – a complete cycle of adsorption/desorption analysis. FIVE adsorption
isotherms are well known and defined representing different gas/solid interactions on
most solid materials.
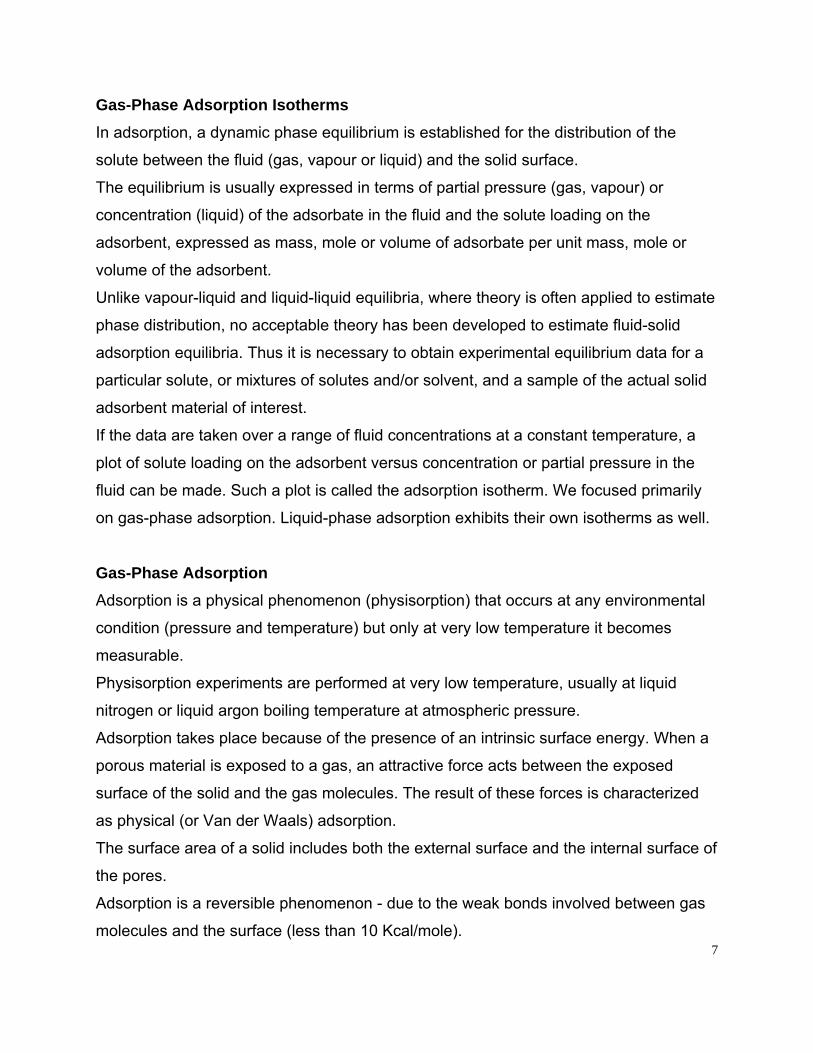
For pure gases, experimental physical adsorption isotherms have shapes, that are
classified into FIVE types.
Most common are types I, II and IV.
0.0 0.2 0.4 0.6 0.8 1.00.0
0.2
0.4
0.6
0.8
1.0
Amou
nt A
dsor
b
Relative Pressure
TYPE-1
Type I isotherms is that adsorption is limited to the completion of a single monolayer of
adsorbate at the adsorbent surface. Type I isotherms are observed for the adsorption of
gases on microporous solids and chemisorption isotherms whose pore sizes are not
much larger than the molecular diameter of the adsorbate. Complete filling of these
narrow pores corresponds to the completion of a molecular monolayer.
An example is the adsorption of oxygen on carbon black at -183 oC.
Adsorption in all other types do not reach a limit corresponding to the completion of a
monolayer. 8
0.0 0.2 0.4 0.6 0.8 1.00.0
0.2
0.4
0.6
0.8
1.0
Am
ount
Ads
orb
Relative Pressure
A
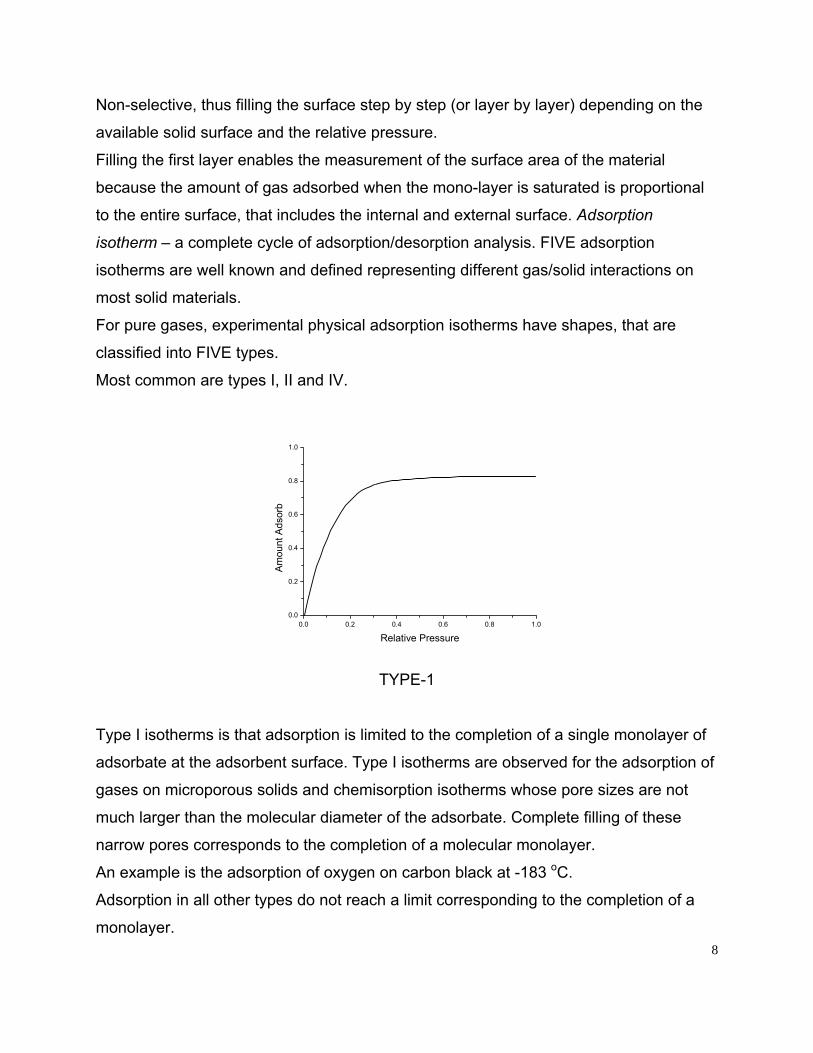
TYPE-2
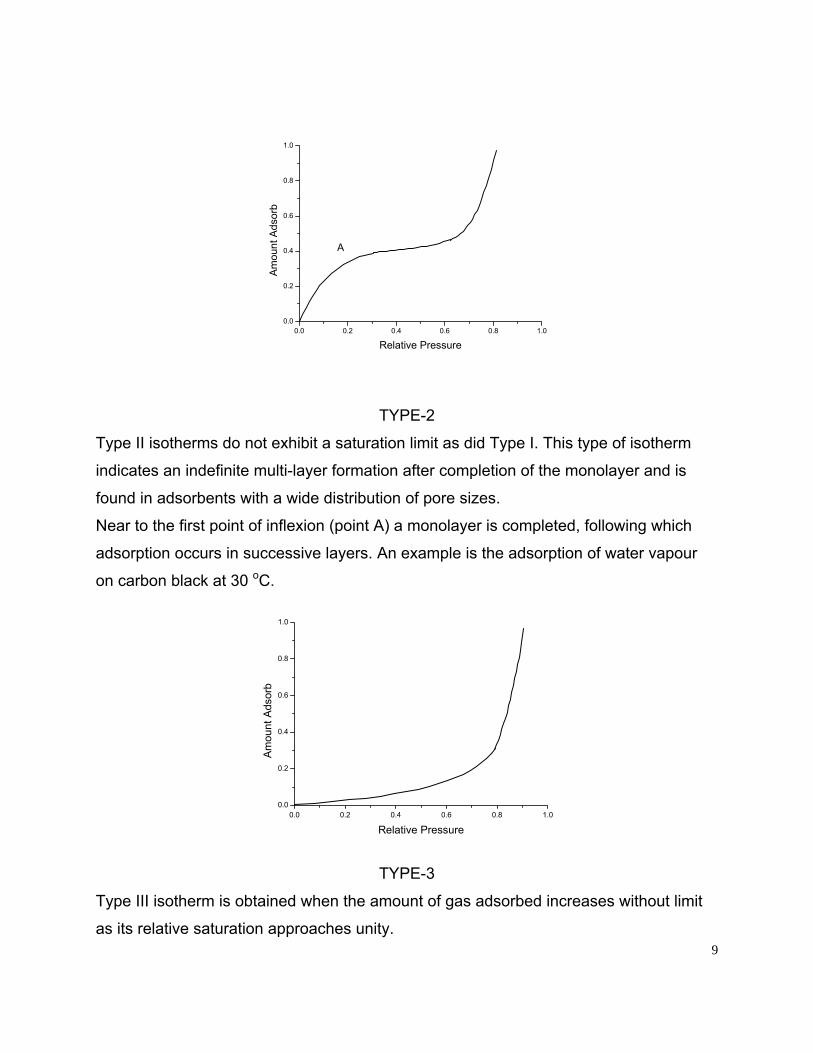
Type II isotherms do not exhibit a saturation limit as did Type I. This type of isotherm
indicates an indefinite multi-layer formation after completion of the monolayer and is
found in adsorbents with a wide distribution of pore sizes.
Near to the first point of inflexion (point A) a monolayer is completed, following which
adsorption occurs in successive layers. An example is the adsorption of water vapour
on carbon black at 30 oC.
0.0 0.2 0.4 0.6 0.8 1.00.0
0.2
0.4
0.6
0.8
1.0
Am
ount
Ads
orb
Relative Pressure
TYPE-3
Type III isotherm is obtained when the amount of gas adsorbed increases without limit
as its relative saturation approaches unity. 9
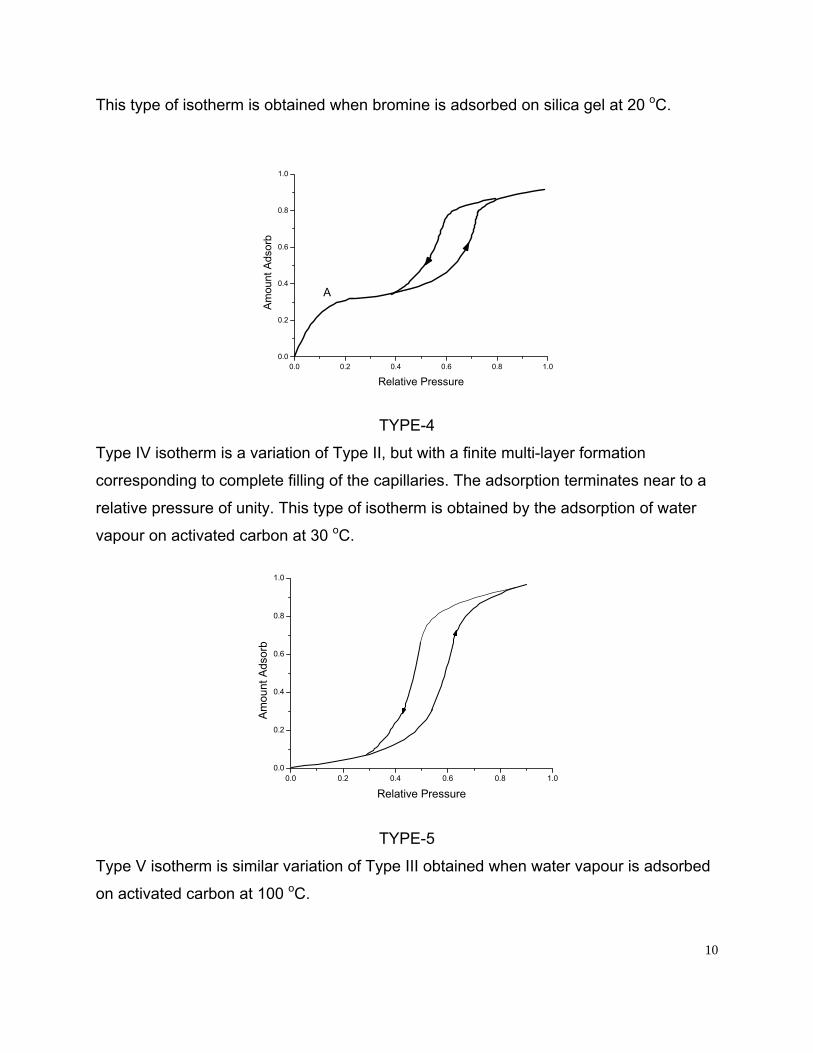
This type of isotherm is obtained when bromine is adsorbed on silica gel at 20 oC.
0.0 0.2 0.4 0.6 0.8 1.00.0
0.2
0.4
0.6
0.8
1.0
Am
ount
Ads
orb
Relative Pressure
A
TYPE-4
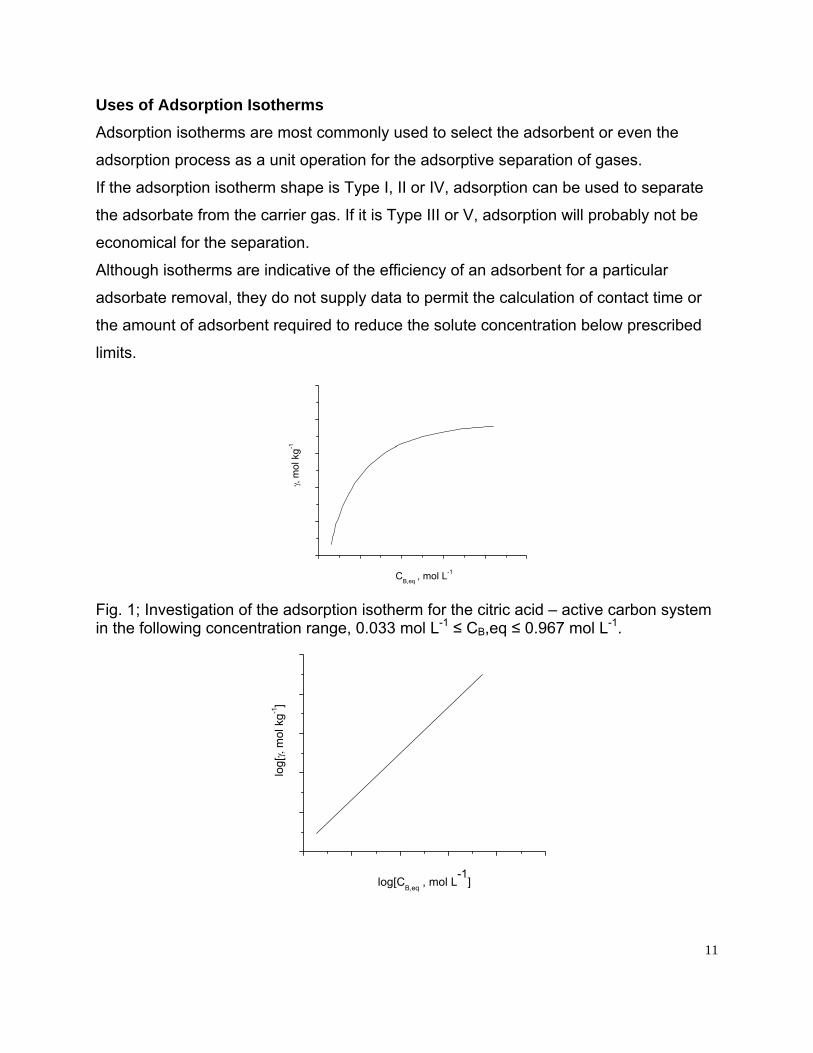
Type IV isotherm is a variation of Type II, but with a finite multi-layer formation
corresponding to complete filling of the capillaries. The adsorption terminates near to a
relative pressure of unity. This type of isotherm is obtained by the adsorption of water
vapour on activated carbon at 30 oC.
0.0 0.2 0.4 0.6 0.8 1.00.0
0.2
0.4
0.6
0.8
1.0
Am
ount
Ads
orb
Relative Pressure
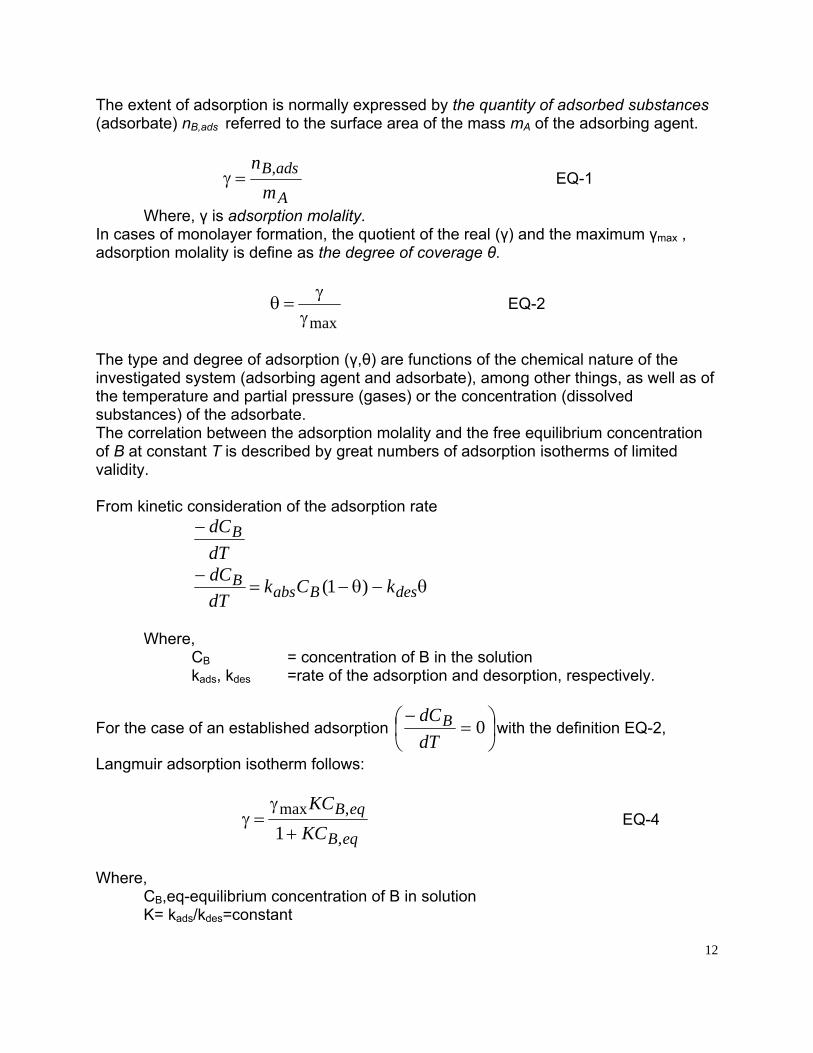
TYPE-5
Type V isotherm is similar variation of Type III obtained when water vapour is adsorbed
on activated carbon at 100 oC.
10
Uses of Adsorption Isotherms Adsorption isotherms are most commonly used to select the adsorbent or even the
adsorption process as a unit operation for the adsorptive separation of gases.
If the adsorption isotherm shape is Type I, II or IV, adsorption can be used to separate
the adsorbate from the carrier gas. If it is Type III or V, adsorption will probably not be
economical for the separation.
Although isotherms are indicative of the efficiency of an adsorbent for a particular
adsorbate removal, they do not supply data to permit the calculation of contact time or
the amount of adsorbent required to reduce the solute concentration below prescribed
limits.
γ, m
ol k
g-1
CB,eq , mol L-1
Fig. 1; Investigation of the adsorption isotherm for the citric acid – active carbon system in the following concentration range, 0.033 mol L-1 ≤ CB,eq ≤ 0.967 mol L-1.
log[
γ, m
ol k
g-1]
log[CB,eq , mol L-1
]
11
The extent of adsorption is normally expressed by the quantity of adsorbed substances (adsorbate) nB,ads referred to the surface area of the mass mA of the adsorbing agent.
A
adsBm
n ,=γ EQ-1
Where, γ is adsorption molality. In cases of monolayer formation, the quotient of the real (γ) and the maximum γmax , adsorption molality is define as the degree of coverage θ.
maxγγ
=θ EQ-2
The type and degree of adsorption (γ,θ) are functions of the chemical nature of the investigated system (adsorbing agent and adsorbate), among other things, as well as of the temperature and partial pressure (gases) or the concentration (dissolved substances) of the adsorbate. The correlation between the adsorption molality and the free equilibrium concentration of B at constant T is described by great numbers of adsorption isotherms of limited validity. From kinetic consideration of the adsorption rate
dTdCB−
θ−θ−=−
desBabsB kCk
dTdC )1(
Where,
CB = concentration of B in the solution kads, kdes =rate of the adsorption and desorption, respectively.
For the case of an established adsorption ⎟⎠⎞
⎜⎝⎛ =
− 0dTdCB with the definition EQ-2,
Langmuir adsorption isotherm follows:
eqB
eqBKCKC
,
,max1+
γ=γ EQ-4
Where,
CB,eq-equilibrium concentration of B in solution
12
K= kads/kdes=constant
13
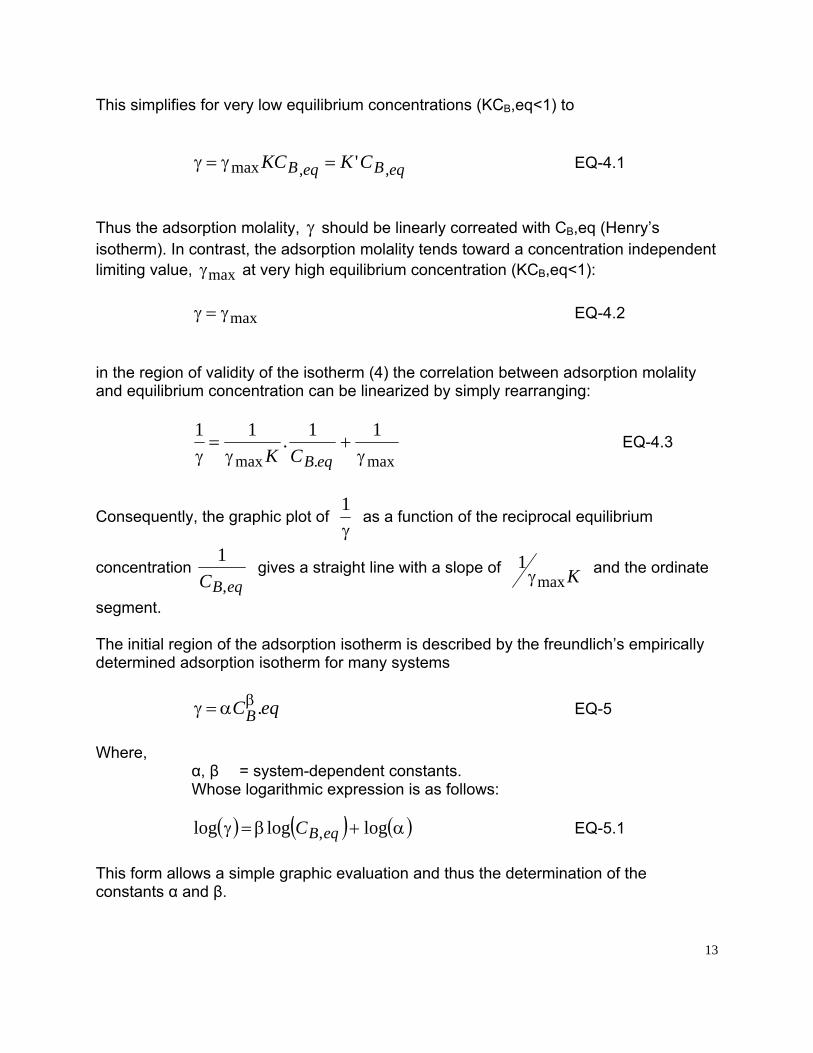
his simplifies for very low equilibrium concentrations (KCB,eq<1) to T
eqBeqB CKKC ,,max '=γ=γ EQ-4.1
hus the adsorption molality, should be linearly correated with CB,eq (Henry’s orption molality tends toward a concentration independent
EQ-4.2
the region of validity of the isotherm (4) the correlation between adsorption molality
T γisotherm). In contrast, the adslimiting value, maxγ at very high equilibrium concentration (KCB,eq<1):
maxγ=γ
inand equilibrium concentration can be linearized by simply rearranging:
max.max
11.11γ
+γ
=γ eqBCK
EQ-4.3
Consequently, the graphic plot of γ1
as a function of the reciprocal equilibrium
concentration eqBC ,
1 gives a straight line with a slope of Kmax
1γ and the ordinate
segment.
he initial region of the adsorption isotherm is described by the freundlich’s empirically
EQ-5
here, α, β = system-dependent constants.
e ws:
Tdetermined adsorption isotherm for many systems
eqCB .βα=γ
W
Whos logarithmic expression is as follo
( ) ( ) ( )α+β=γ logloglog ,eqBC EQ-5.1
his form allows a simple graphic evaluation and thus the determination of the T
constants α and β.
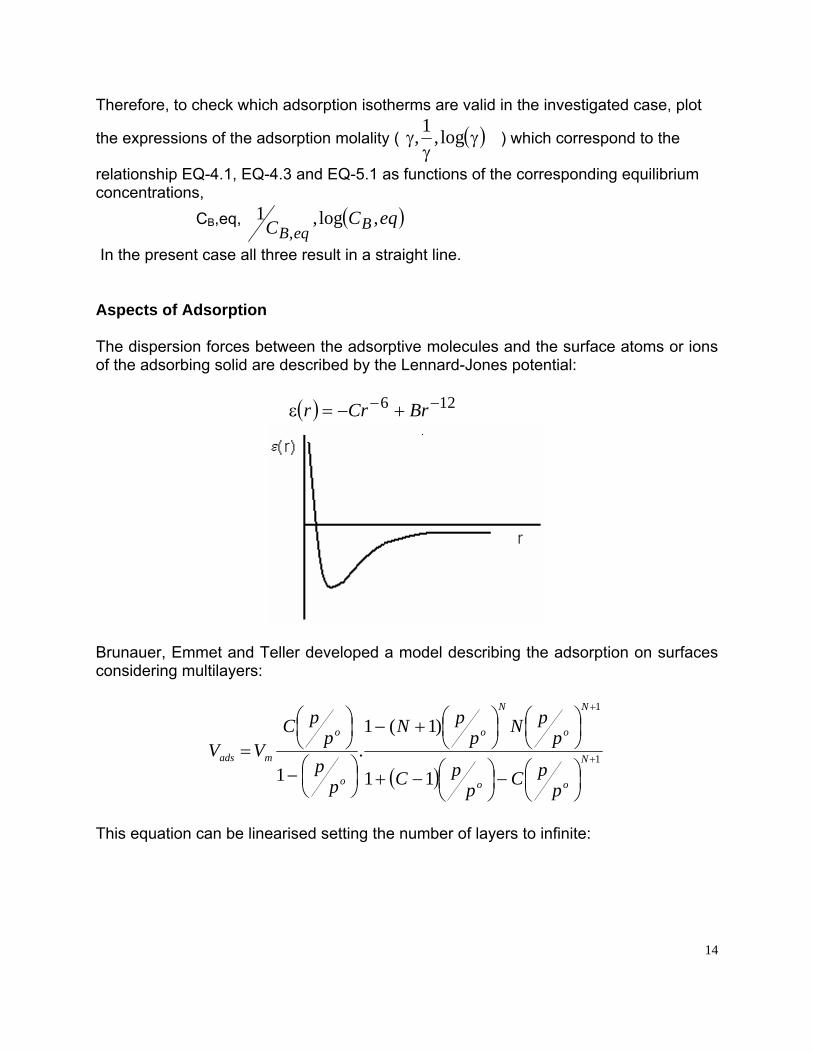
Therefore, to check which adsorption isotherms are valid in the investigated case, plot
the expressions of the adsorption molality ( ( )γγ
γ log,1, ) which correspond to the
relationship EQ-4.1, EQ-4.3 and EQ-5.1 as functions of the corresponding equilibrium concentrations,
CB,eq, ( )eqCC BeqB,log,1
,
In the present case all three result in a straight line. Aspects of Adsorption The dispersion forces between the adsorptive molecules and the surface atoms or ions of the adsorbing solid are described by the Lennard-Jones potential:
( ) 126 −− +−=ε BrCrr
Brunauer, Emmet and Teller developed a model describing the adsorption on surfaces considering multilayers:
( )1
1
11
)1(1.
1+
+
⎟⎠⎞
⎜⎝⎛−⎟
⎠⎞
⎜⎝⎛−+
⎟⎠⎞
⎜⎝⎛
⎟⎠⎞
⎜⎝⎛+−
⎟⎠⎞
⎜⎝⎛−
⎟⎠⎞
⎜⎝⎛
= N
oo
N
o
N
o
o
o
mads
ppCp
pC
ppNp
pN
ppp
pCVV
This equation can be linearised setting the number of layers to infinite:
14

omm
oads
o
pp
CVC
CVp
pV
pp
.11
1
−+=
⎟⎠⎞
⎜⎝⎛ −
Giving the monolayer volume, Vm and thus the surface area, A:
erceptslopeVm int
1+
= ,
mmol
mA aV
VNA .=
where,
A is surface area am is area of one molecule of adsorbate (N2 = 16.2 Å) d is diameter e is potential energy r is radius NA is Avogadro number (6.022×10²³ mol-1) V is volume P is pressure Po is saturation vapour pressure Vmol is volume of one mole of an ideal gas (22.41 L mol-1)
Adsorption Equilibria A variety of different isotherm equations have been proposed, some of which have a theoretical foundation and some being of a more empirical nature. Many of these equations are valid over small relative pressure ranges but do not fit experimental data when tested over the full range of relative pressures. The same pure gas may also illustrate different isotherms on different adsorbents. An example is the adsorption of pure propane at 298 - 303 K. The Langmuir Isotherm This isotherm described adsorbate-adsorbent systems in which the extent of adsorbate coverage is limited to one molecular layer at or before a relative pressure of unity is reached (i.e. Type I). Although the isotherm is more usually appropriate for the description of chemisorption, the equation is nevertheless obeyed at moderately low
15
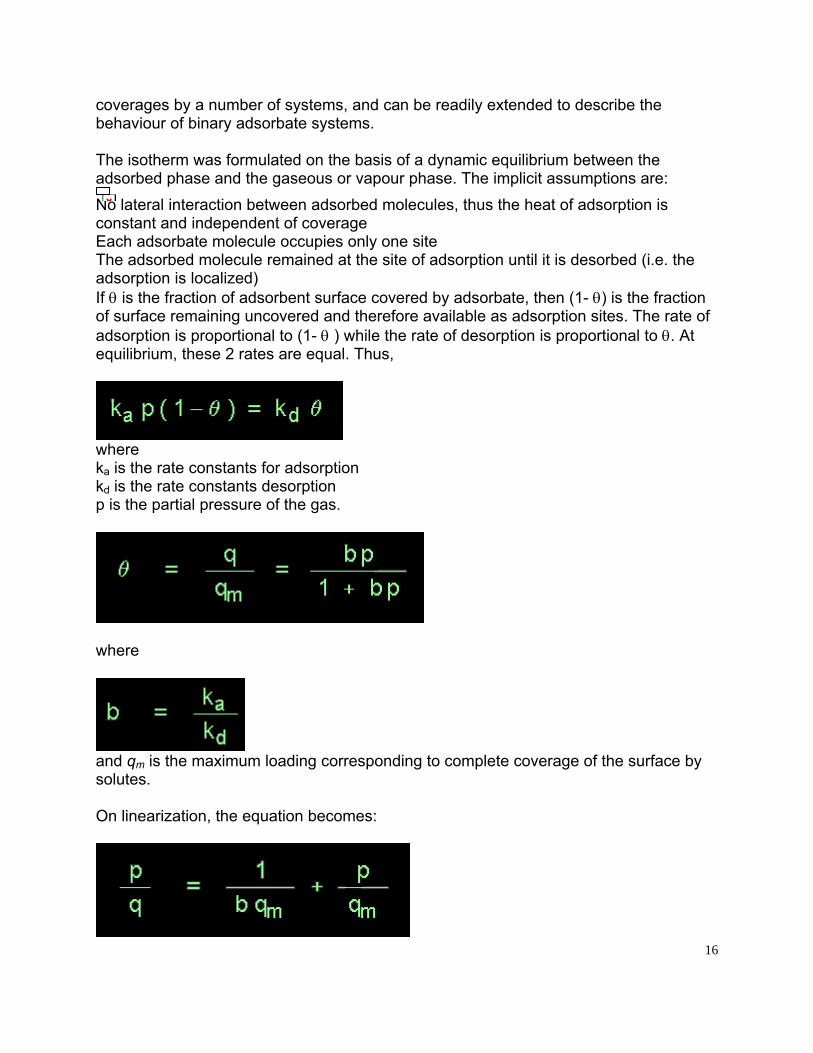
coverages by a number of systems, and can be readily extended to describe the behaviour of binary adsorbate systems. The isotherm was formulated on the basis of a dynamic equilibrium between the adsorbed phase and the gaseous or vapour phase. The implicit assumptions are: No lateral interaction between adsorbed molecules, thus the heat of adsorption is constant and independent of coverage Each adsorbate molecule occupies only one site The adsorbed molecule remained at the site of adsorption until it is desorbed (i.e. the adsorption is localized) If θ is the fraction of adsorbent surface covered by adsorbate, then (1- θ) is the fraction of surface remaining uncovered and therefore available as adsorption sites. The rate of adsorption is proportional to (1- θ ) while the rate of desorption is proportional to θ. At equilibrium, these 2 rates are equal. Thus,
where ka is the rate constants for adsorption kd is the rate constants desorption p is the partial pressure of the gas.
where
and qm is the maximum loading corresponding to complete coverage of the surface by solutes. On linearization, the equation becomes:
16
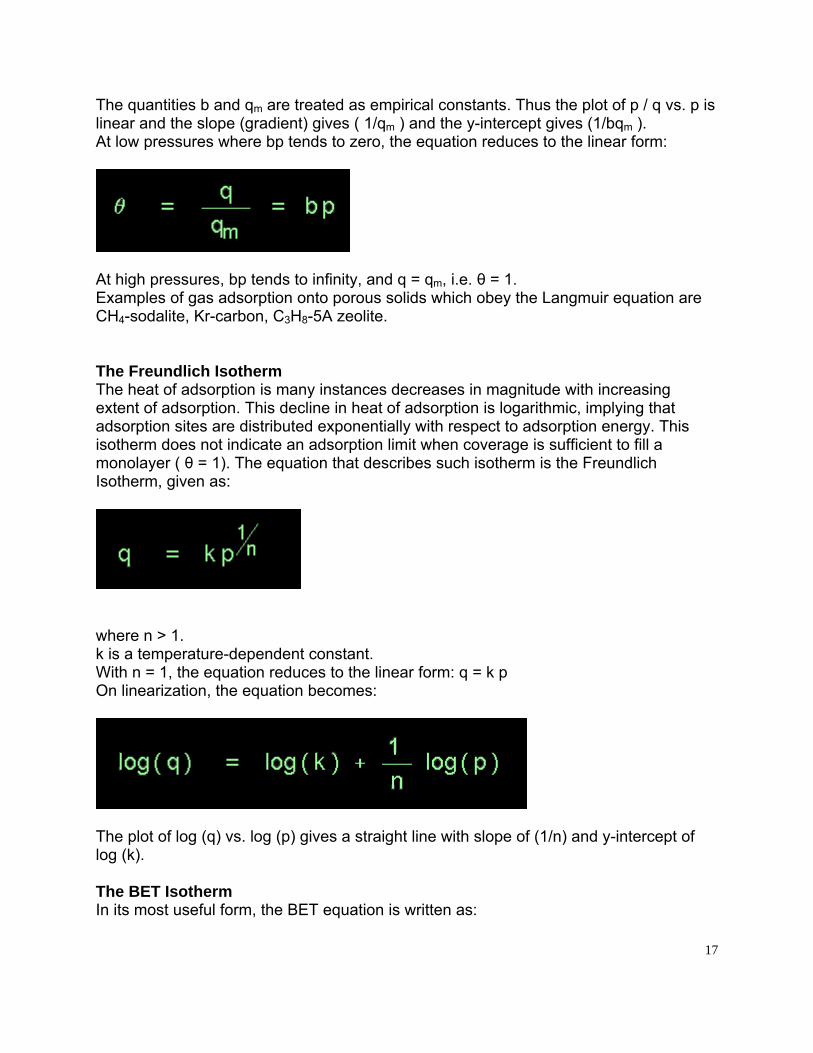
The quantities b and qm are treated as empirical constants. Thus the plot of p / q vs. p is linear and the slope (gradient) gives ( 1/qm ) and the y-intercept gives (1/bqm ). At low pressures where bp tends to zero, the equation reduces to the linear form:
At high pressures, bp tends to infinity, and q = qm, i.e. θ = 1. Examples of gas adsorption onto porous solids which obey the Langmuir equation are CH4-sodalite, Kr-carbon, C3H8-5A zeolite. The Freundlich Isotherm The heat of adsorption is many instances decreases in magnitude with increasing extent of adsorption. This decline in heat of adsorption is logarithmic, implying that adsorption sites are distributed exponentially with respect to adsorption energy. This isotherm does not indicate an adsorption limit when coverage is sufficient to fill a monolayer ( θ = 1). The equation that describes such isotherm is the Freundlich Isotherm, given as:
where n > 1. k is a temperature-dependent constant. With n = 1, the equation reduces to the linear form: q = k p On linearization, the equation becomes:
The plot of log (q) vs. log (p) gives a straight line with slope of (1/n) and y-intercept of log (k). The BET Isotherm In its most useful form, the BET equation is written as: 17
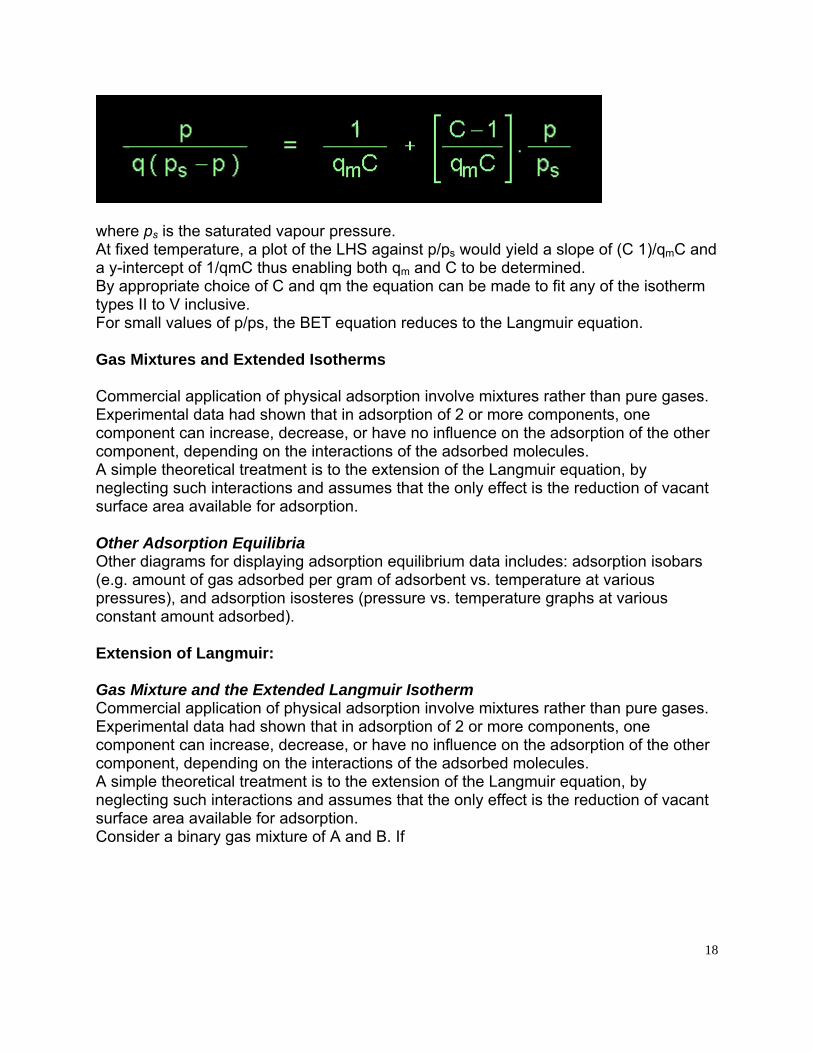
where ps is the saturated vapour pressure. At fixed temperature, a plot of the LHS against p/ps would yield a slope of (C 1)/qmC and a y-intercept of 1/qmC thus enabling both qm and C to be determined. By appropriate choice of C and qm the equation can be made to fit any of the isotherm types II to V inclusive. For small values of p/ps, the BET equation reduces to the Langmuir equation. Gas Mixtures and Extended Isotherms Commercial application of physical adsorption involve mixtures rather than pure gases. Experimental data had shown that in adsorption of 2 or more components, one component can increase, decrease, or have no influence on the adsorption of the other component, depending on the interactions of the adsorbed molecules. A simple theoretical treatment is to the extension of the Langmuir equation, by neglecting such interactions and assumes that the only effect is the reduction of vacant surface area available for adsorption. Other Adsorption Equilibria Other diagrams for displaying adsorption equilibrium data includes: adsorption isobars (e.g. amount of gas adsorbed per gram of adsorbent vs. temperature at various pressures), and adsorption isosteres (pressure vs. temperature graphs at various constant amount adsorbed). Extension of Langmuir: Gas Mixture and the Extended Langmuir Isotherm Commercial application of physical adsorption involve mixtures rather than pure gases. Experimental data had shown that in adsorption of 2 or more components, one component can increase, decrease, or have no influence on the adsorption of the other component, depending on the interactions of the adsorbed molecules. A simple theoretical treatment is to the extension of the Langmuir equation, by neglecting such interactions and assumes that the only effect is the reduction of vacant surface area available for adsorption. Consider a binary gas mixture of A and B. If
18
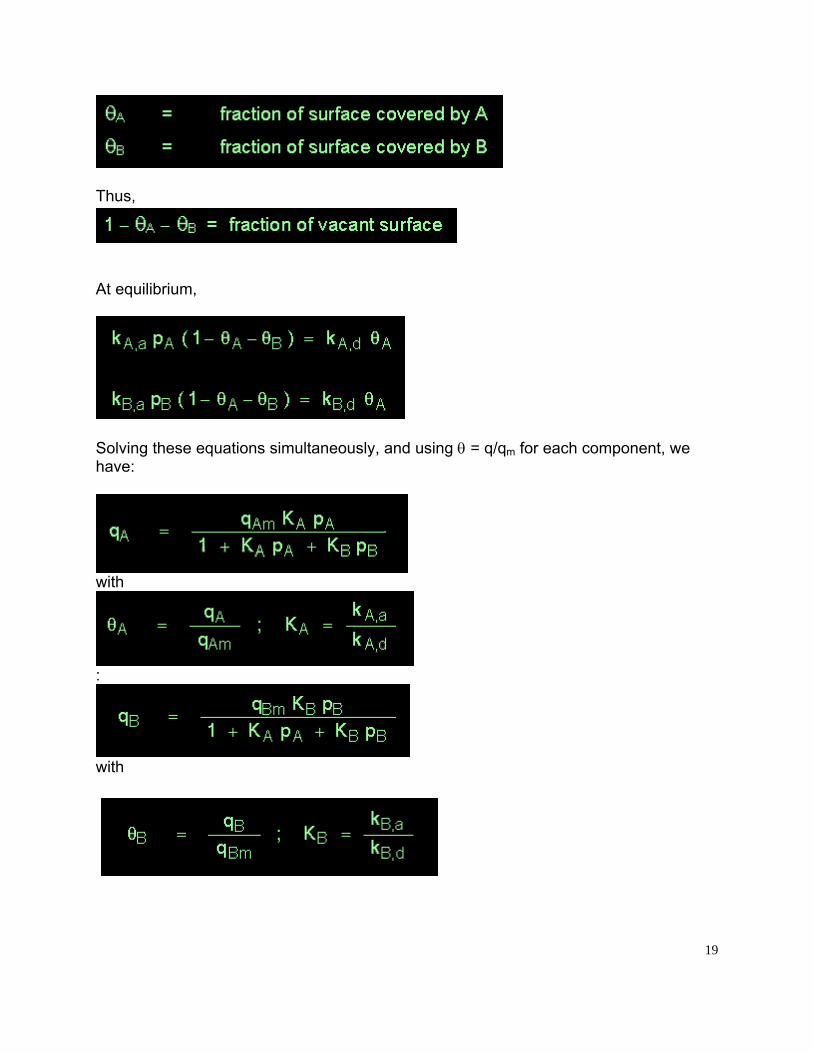
Thus,
At equilibrium,
Solving these equations simultaneously, and using θ = q/qm for each component, we have:
with
:
with
19
LIGHT SCATTERING 1. Static light scattering (SLS)
• Total intensity light scattering, or just plain of light scattering. • Relies on the intensity of scattered light and its variation with concentration of
polymer and/or scattering angle. • Can produce thermodynamic data: molecular weight and virial coefficient. • Can produce size (for sizes > about 10 nm). • The size returned is the so-called “radius of gyration”, Rg.
2. Dynamic light scattering (DLS) • Alias: quasielastic light scattering, photon correlation spectroscopy, Brillouin
scattering (a special variant). • Relies on rapid fluctuations in the scattered signal. • Can measure a transport property, the mutual diffusion coefficient, absolutely. • This size is easily converted to a hydrodynamic radius, Rh. • The size range is very wide: < 1 nm to >500 nm
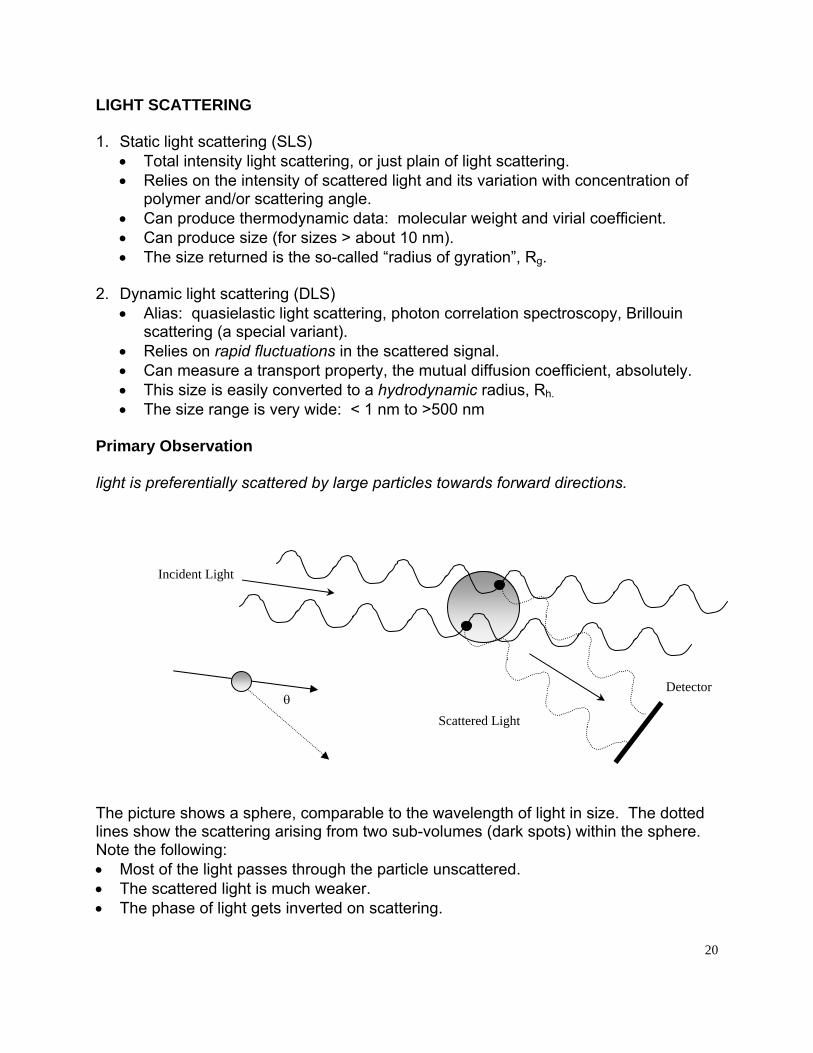
Primary Observation light is preferentially scattered by large particles towards forward directions.
20
The picture shows a sphere, comparable to the wavelength of light in size. The dotted lines show the scattering arising from two sub-volumes (dark spots) within the sphere. Note the following:
Incident Light
θ Detector
Scattered Light
• Most of the light passes through the particle unscattered. • The scattered light is much weaker. • The phase of light gets inverted on scattering.

• The light scattered by one subvolume might be out of phase with that scattered by another subvolume when both reach detector located at some angle, with respect to the main beam. This is because the light travels different distances to reach the detector.
• If the subvolumes were very close to each other, their scattered signals would arrive in phase.
• If the detector were at zero angle to the beam (i.e., right in the incident light) the scattered light would not be out of phase (there are limits to this—basically related to the difference in the refractive index of the particle and that of the surrounding medium).
• Position of detector is never placed at zero angle. PHOTON CORRELATION SPECTROSCOPY Normal white light propagates through a vacuum at a constant speed of 3x10⁸ ms-1.
The physical consequence depends on a number of experimental parameters,
• the wavelength of the incident radiation,
• the nature (e.g. size) of the suspended aggregates, and
• the refractive indices of the particle in the suspension medium.
Dynamic light scattering measurements offer the possibility of instantaneous aggregate
size determination, together with interparticle interactions, by measuring the intensity of
the elastic scattering of moving aggregates in the dispersed sample as a function of
volume fraction of the dispersed phase.
21
22
The original theory of light scattering was developed by Raleigh (1871).
The light radiation must be monochromatic and coherent.
The use of a laser source provides a precise frequency of incident light
REASON: can be used to explore light scattering in highly dynamic colloidal
dispersions.
For aggregates much smaller than the wavelength of light (diameter<λ/20), the simplest
version of Raleigh theory is applicable.
REASON:
all regions within the aggregate are subjected to a similar electric field so that the
scattered waves, produced by dipole oscillation of the electrons bound within the
particle, are in phase. The induced dipole is also parallel at the plane of polarisation of
the light, so if the scattered light is viewed in a plane at right angles to this plane of
polarisation the scattered light will have no angular distribution, as it is simply the
summation of all contributions from the individual dipoles adding constructively. The
system in summary behaves as a point source of radiation and so information on the
internal structure of the aggregate cannot be obtained;- that means that it would not be
possible to distinguish the shape of the aggregate.
Only possible for larger aggregates where the dimensions approach the wavelength of
light.
Consider a coherent monochromatic radiation of;
λ - wavelength,
Io - intensity propagating in a medium
no - refractive index
R - particle of radius with refractive index n1.
The relative refractive index
n=n1/no.
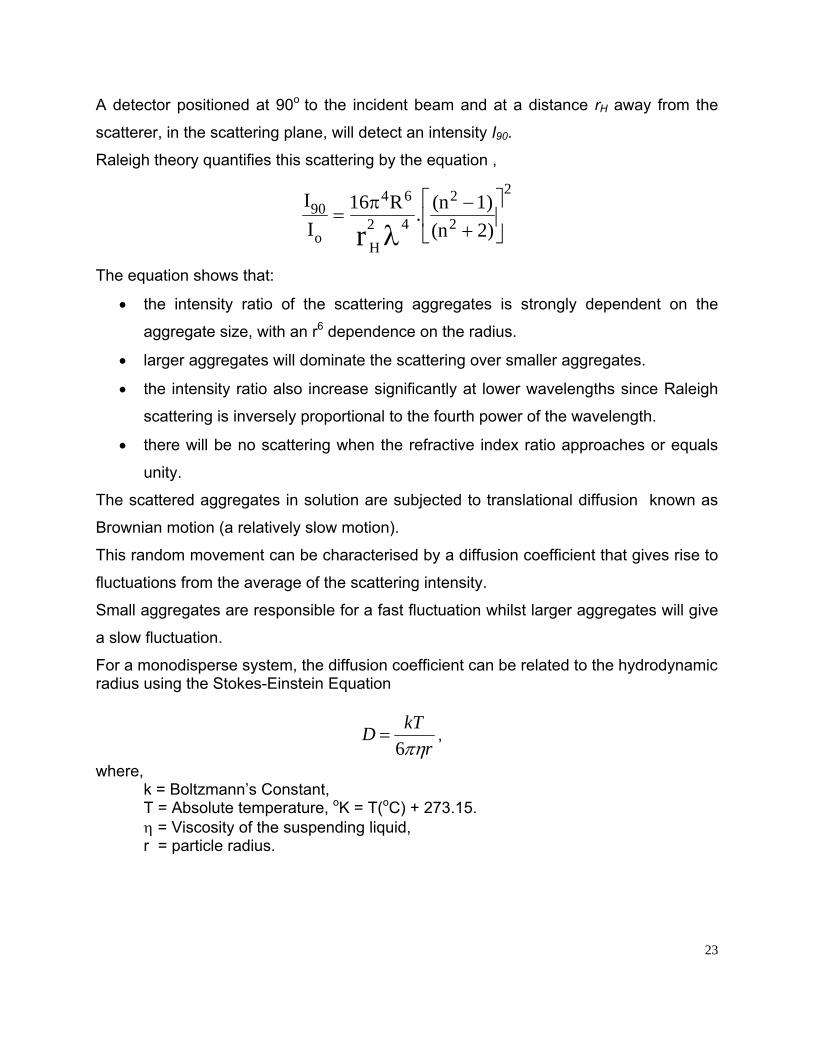
A detector positioned at 90o to the incident beam and at a distance rH away from the
scatterer, in the scattering plane, will detect an intensity I90.
Raleigh theory quantifies this scattering by the equation ,
II
16 R . (n 1)(n 2)
90
o
4 6
H2
2
2r=
−+
⎡
⎣⎢
⎤
⎦⎥
π
λ4
2
The equation shows that:
• the intensity ratio of the scattering aggregates is strongly dependent on the
aggregate size, with an r6 dependence on the radius.
• larger aggregates will dominate the scattering over smaller aggregates.
• the intensity ratio also increase significantly at lower wavelengths since Raleigh
scattering is inversely proportional to the fourth power of the wavelength.
• there will be no scattering when the refractive index ratio approaches or equals
unity.
The scattered aggregates in solution are subjected to translational diffusion known as
Brownian motion (a relatively slow motion).
This random movement can be characterised by a diffusion coefficient that gives rise to
fluctuations from the average of the scattering intensity.
Small aggregates are responsible for a fast fluctuation whilst larger aggregates will give
a slow fluctuation.
For a monodisperse system, the diffusion coefficient can be related to the hydrodynamic radius using the Stokes-Einstein Equation
rkTDπη6
= ,
where, k = Boltzmann’s Constant, T = Absolute temperature, oK = T(oC) + 273.15. η = Viscosity of the suspending liquid, r = particle radius.
23
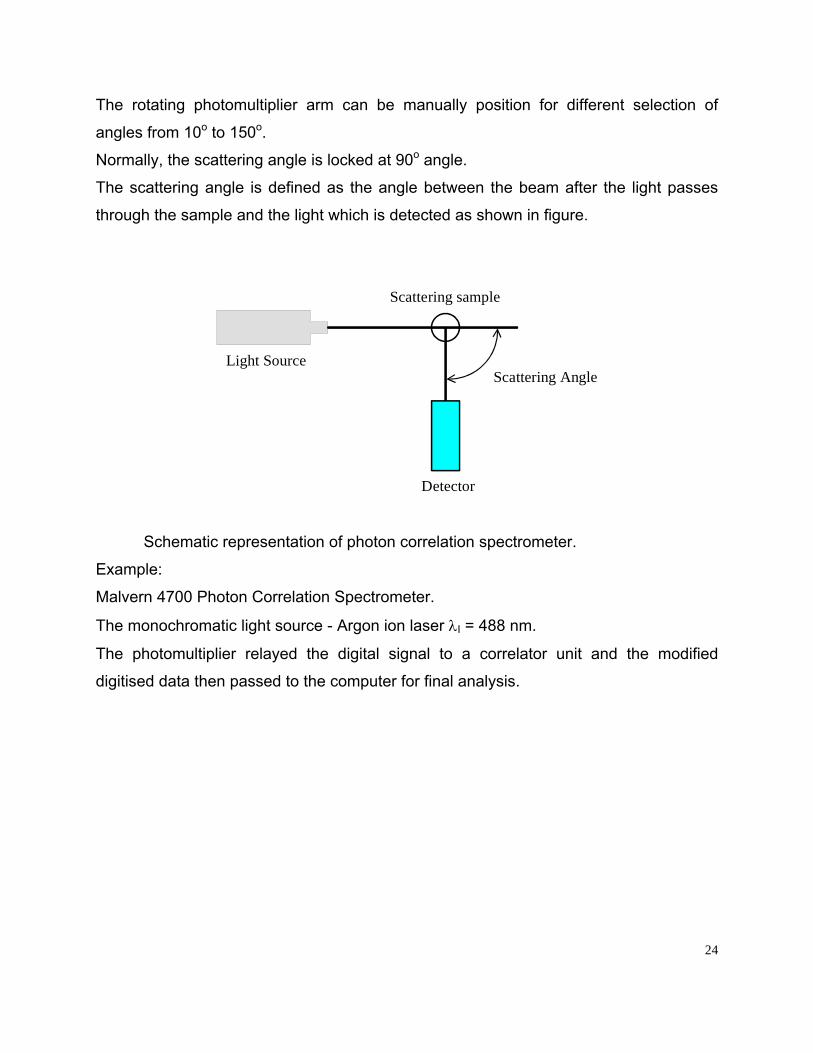
The rotating photomultiplier arm can be manually position for different selection of
angles from 10o to 150o.
Normally, the scattering angle is locked at 90o angle.
The scattering angle is defined as the angle between the beam after the light passes
through the sample and the light which is detected as shown in figure.
Scattering AngleLight Source
Scattering sample
Detector
Schematic representation of photon correlation spectrometer.
Example:
Malvern 4700 Photon Correlation Spectrometer.
The monochromatic light source - Argon ion laser λI = 488 nm.
The photomultiplier relayed the digital signal to a correlator unit and the modified
digitised data then passed to the computer for final analysis.
24
Laser
Temperature Controller
Computer
Laser Power supply
Unit
CorrelatorPhotomultiplier
Sample
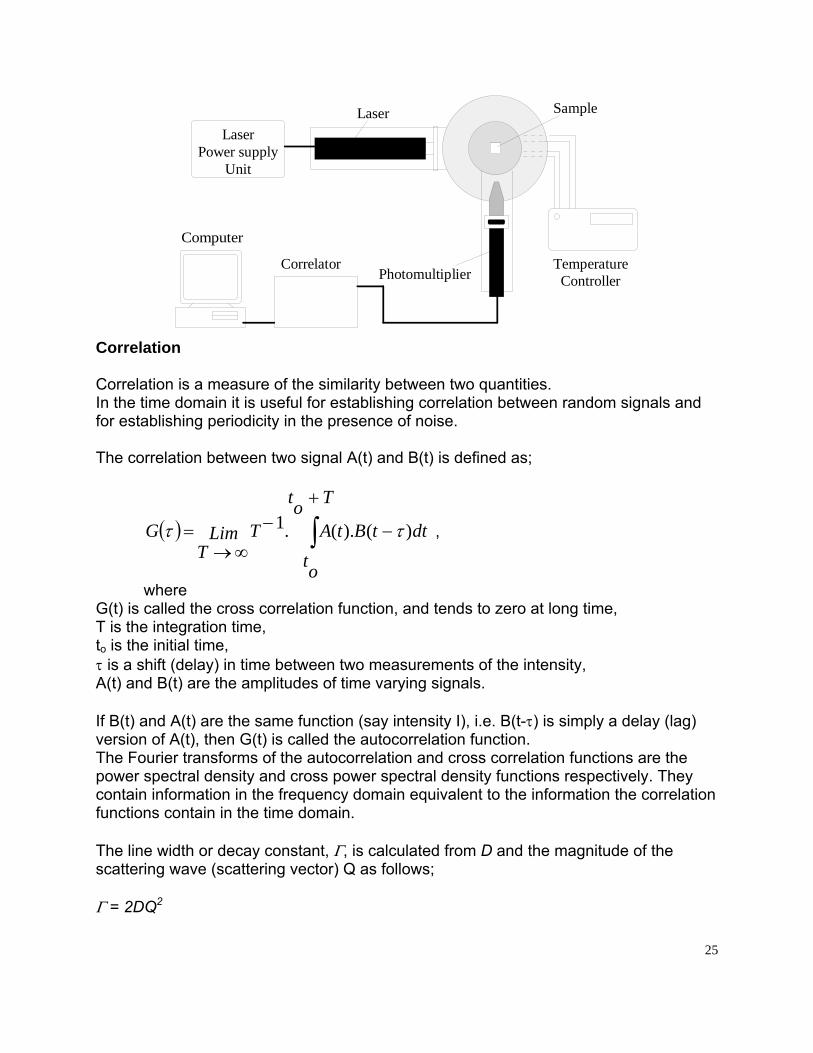
Correlation Correlation is a measure of the similarity between two quantities. In the time domain it is useful for establishing correlation between random signals and for establishing periodicity in the presence of noise. The correlation between two signal A(t) and B(t) is defined as;
( ) ∫+
−−
∞→=
Tot
otdttBtATLim
TG )().(.1 ττ ,
where G(t) is called the cross correlation function, and tends to zero at long time, T is the integration time, to is the initial time, τ is a shift (delay) in time between two measurements of the intensity, A(t) and B(t) are the amplitudes of time varying signals. If B(t) and A(t) are the same function (say intensity I), i.e. B(t-τ) is simply a delay (lag) version of A(t), then G(t) is called the autocorrelation function. The Fourier transforms of the autocorrelation and cross correlation functions are the power spectral density and cross power spectral density functions respectively. They contain information in the frequency domain equivalent to the information the correlation functions contain in the time domain. The line width or decay constant, Γ, is calculated from D and the magnitude of the scattering wave (scattering vector) Q as follows; Γ = 2DQ2 25
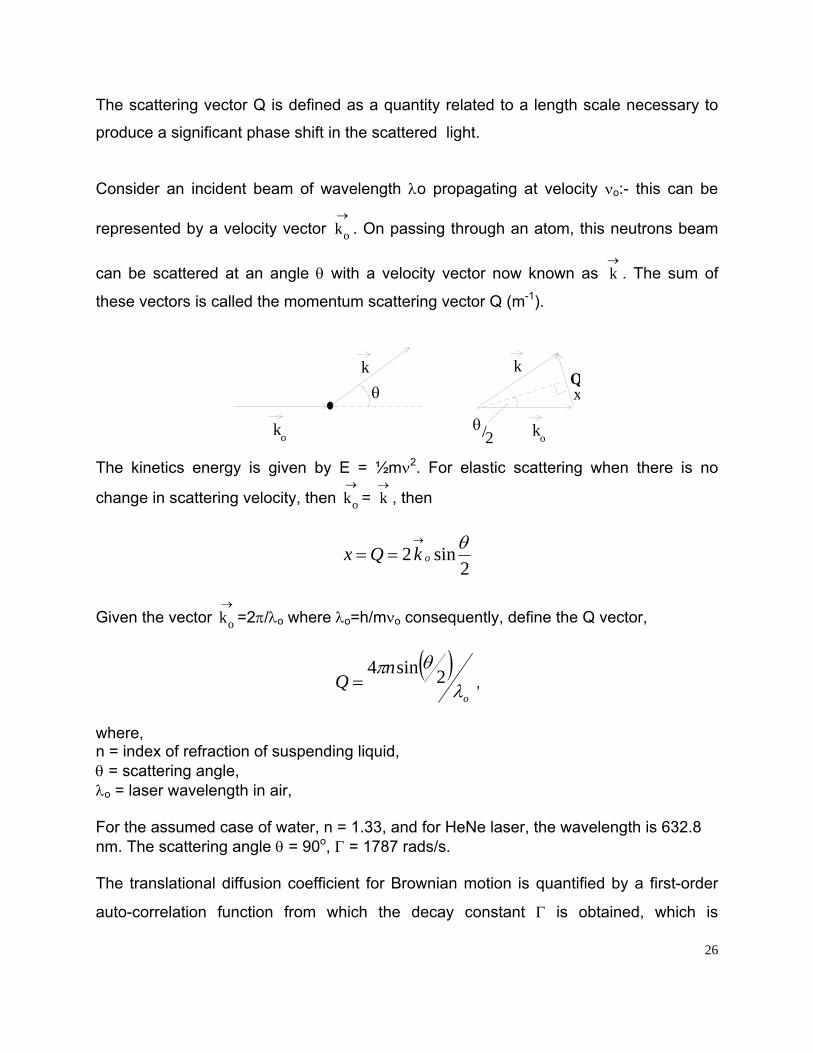
The scattering vector Q is defined as a quantity related to a length scale necessary to
produce a significant phase shift in the scattered light.
Consider an incident beam of wavelength λo propagating at velocity νo:- this can be
represented by a velocity vector . On passing through an atom, this neutrons beam
can be scattered at an angle θ with a velocity vector now known as
ko
→
k→
. The sum of
these vectors is called the momentum scattering vector Q (m-1).
θ
k
ko
xQ
θ/2
k
ko The kinetics energy is given by E = ½mν2. For elastic scattering when there is no
change in scattering velocity, then = , then ko
→k→
2sin2 θ
okQx→
==
Given the vector =2π/λko
→o where λo=h/mνo consequently, define the Q vector,
( )
o
nQ λ
θπ 2sin4= ,
where, n = index of refraction of suspending liquid, θ = scattering angle, λo = laser wavelength in air, For the assumed case of water, n = 1.33, and for HeNe laser, the wavelength is 632.8 nm. The scattering angle θ = 90o, Γ = 1787 rads/s. The translational diffusion coefficient for Brownian motion is quantified by a first-order
auto-correlation function from which the decay constant Γ is obtained, which is
26
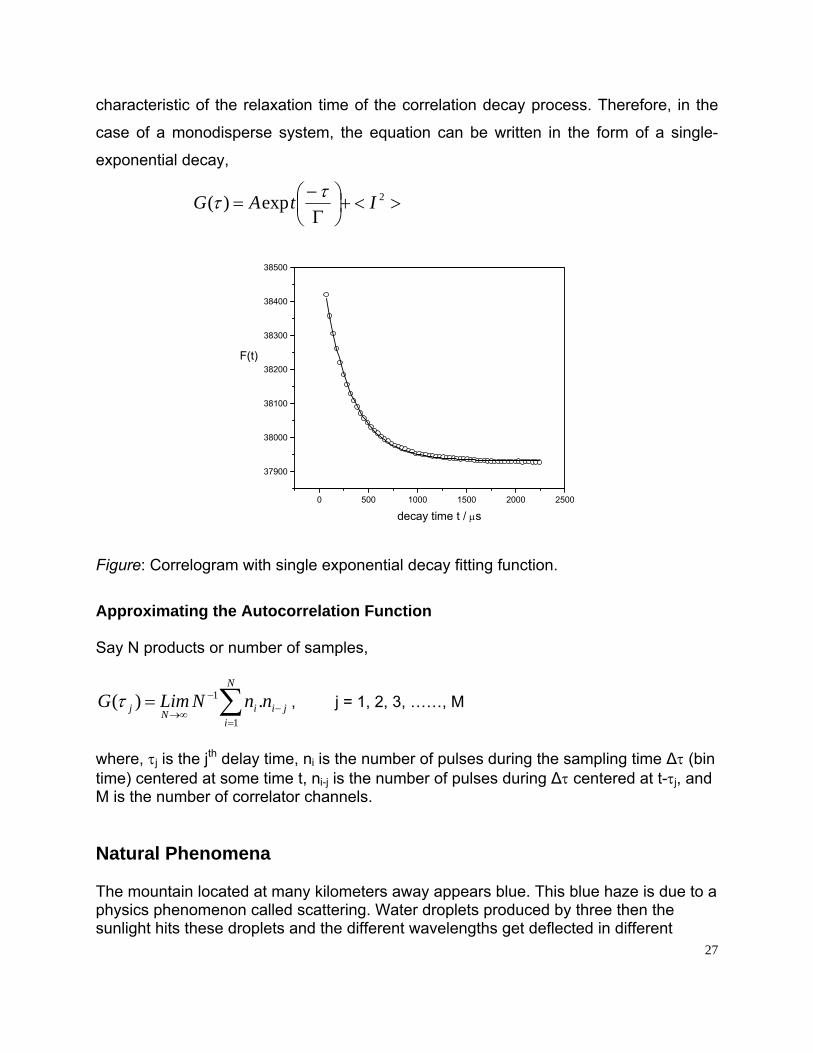
characteristic of the relaxation time of the correlation decay process. Therefore, in the
case of a monodisperse system, the equation can be written in the form of a single-
exponential decay,
><+⎟⎠⎞
⎜⎝⎛
Γ−
= 2exp)( ItAG ττ
0 500 1000 1500 2000 2500
37900
38000
38100
38200
38300
38400
38500
F(t)
decay time t / µs
Figure: Correlogram with single exponential decay fitting function.
Approximating the Autocorrelation Function Say N products or number of samples,
∑=
−−
∞→=
N
ijiiNj nnNLimG
1
1 .)(τ , j = 1, 2, 3, ……, M
where, τj is the jth delay time, ni is the number of pulses during the sampling time ∆τ (bin time) centered at some time t, ni-j is the number of pulses during ∆τ centered at t-τj, and M is the number of correlator channels. Natural Phenomena The mountain located at many kilometers away appears blue. This blue haze is due to a physics phenomenon called scattering. Water droplets produced by three then the sunlight hits these droplets and the different wavelengths get deflected in different 27
28
directions. The wavelengths corresponding to the blue are deflected more than the wavelengths corresponding to the red. Our eyes see a blue haze. Scattering is a complex phenomenon arising from the interaction between an electromagnetic radiation such as light with small particles or molecules. The incident radiation is partially deflected in all directions by the small particles. There are several types of scattering depending on what happens to the incident radiation. We will only mention:
Rayleigh scattering Mie scattering
Mie Scattering Mie scattering is more general than Rayleigh scattering. It occurs when radiation "hits" a spherical particle or a molecule whose diameter is similar or greater than the wavelength of the radiation. Wavelengths tend to be scattered in all directions. Rayleigh Scattering Rayleigh scattering occurs when radiation "hits" a spherical particle or a molecule whose diameter is smaller than the wavelength of the radiation. Some of the radiation continues in its original direction but some of it is deflected or scattered in other directions without change in energy. The collision is called elastic. The power of Rayleigh scattering is inversely proportional to the fourth power of the wavelength. Short wavelength radiation is scattered more than long wavelength radiation. Another interesting phenomenon called the green flash can be explained by scattering. Rayleigh Scattering Rayleigh scattering occurs when radiation "hits" a spherical particle or a molecule whose diameter is smaller than the wavelength of the radiation. Some of the radiation continues in its original direction but some of it is deflected or scattered in other directions without change in energy: the collision is called elastic. The power of Rayleigh scattering is inversely proportional to the fourth power of the wavelength. Short wavelength radiation is scattered more than long wavelength radiation. Green Flash phenomenon The Silver Lining of a Cloud and dark cloud can be explained by scattering. The white rim of the cloud is caused by diffraction.
The light coming from the sun is bent by the water droplets present in the clouds.
The waves interfere between each other. When two waves cancel each other (destructive interference) therefore we see dark. When they combine (constructive interference), the light appears brighter.