gas hydrate research, stratigraphic test, and production ... library/research/oil-gas/methane... ·...
TRANSCRIPT

Gas Hydrate Research, Stratigraphic Test, and Production Test Plans
Alaska North Slope
January 22, 2009NETL Alaska Projects Meeting
Morgantown, WV
Robert Hunter, PI, ASRC EnergyScott Wilson, RyderScottSteve Hancock, RPS Eng.with Scott Digert - BPGordon Pospisil – BPRay Boswell – DOERick Baker – DOE Tim Collett - USGS
U.S. Department of Energy
Presentation OutlinePresentation Outline
• Project Overview/Schedule
• Resource Characterization
• Stratigraphic Test Results
• Reservoir Simulation
• Production Testing
• Conclusions / Future Plans

Presentation OutlinePresentation Outline
Project Overview/Schedule
• Resource Characterization
• Stratigraphic Test Results
• Reservoir Simulation
• Production Testing
•Conclusions / Future Plans

AcknowledgementsAcknowledgementsThe Mount Elbert Science PartyThe Mount Elbert Science Party
• Myung Lee – USGS• John Miller - USGS• Bill Waite – USGS• Bill Winters – USGS• Tom Lorenson – USGS• Tanya Inks – Int. Services, Inc.• Dennis Urban – BPXA• Paul Hanson – BPXA• Warren Agena - USGS
• Kelly Rose – DOE/NETL• Eilis Rosenbaum – DOE/NETL• Micaela Weeks – BPXA• Larry Vendl – BPXA• Danny Kara - BPXA• Rick Colwell – OSU• Marta Torres – OSU• Steve Hancock (RPS)• Tim Collett (USGS)• Ray Boswell (DOE/NETL)• Robert Hunter (ASRC/BP)• The Crew of the Doyon 14
U.S. Department of Energy

Gas Hydrate Resource PyramidGas Hydrate Resource PyramidInIn--Place Resource Distribution Place Resource Distribution
• increasing in-place resource• decreasing certainty in resource
estimates• decreasing reservoir quality• increasing technical challenges• decreasing ultimate % recoverable
GH-saturated fractured clays –Bay of Bengal
Massive GH seafloor mound –Gulf of Mexico
GH-saturated turbidite –Nankai trough
GH-Saturated fluvial-deltaic sands – Milne Point, Alaska
A
B
A
C
B
D
DC
E
Gas Hydrate Resource PyramidGas Hydrate Resource PyramidInIn--Place Resource Distribution Place Resource Distribution

Cooperative Agreement ObjectivesCooperative Agreement ObjectivesCharacterize, quantify, and determine
commercial viability of gas hydrates in the ANS field infrastructure areas
How – Methods:Prove exploration & reservoir modelsDescribe & Quantify ANS resourceConduct long-term production test
Why – Motivations:Understand ANS hydrate productivityDemonstrate ANS hydrate resource Leverage to potential marine resourceSynergies to other ANS gas resources

Cooperative Agreement MotivationsCooperative Agreement MotivationsOpportunities
Determine if long-term U.S. resourceCollaborate with Federal & State R&DMid-term possible fuel gas source?Long-term supplemental gas source?
ChallengesUncertain resource potential & riskAlign with existing O&G operationsMinimize impact to ANS developmentManage stakeholder expectationsClarify goals, priorities, & timing

• Assess Gas Hydrate Resource• Jointly Decide Project Progression• Use Alaska North Slope as Lab• Require Clear Decision GATES • Cost-shared/Yearly Appropriations• Phases 1-2 (2003-2005)
• Characterization & Modeling
• Phase 3a (2006-1Q2009)• Stratigraphic Test Ops/Analyses
• Phase 3b (2Q2009+)• Long-term Production Testing
U.S. Department of Energy
Cooperative Cooperative AgreementAgreement

Assess Resource Potential in 3 Phases:
1. Resource Characterization/Modeling
2. Schematic Regional Modeling
3a. Acquire Stratigraphic Test Well DataAnalyze Core, Logs, & MDT test
3b. Acquire Additional Well DataLong-term Production Test
2003 – 04
2005
2006 - 09 Current
2009+ Planned
ANS Cooperative Research ProgramANS Cooperative Research Program
Determine Technical & Commercial Viability
Year Phase Major Task

1. Resource Characterization/Modeling
2. Schematic Regional Modeling
3a. Acquire Stratigraphic Test Well DataAnalyze Core, Logs, & MDT test
3b. Acquire Additional Well DataLong-term Production Test
$2.5MM/$2.8MM
$4.8MM/$6.3MMOperations
>$10MM?
Budgetvs. Cost Phase Major Task
$0.8MM/$0.9MM
ANS Cooperative Research ProgramANS Cooperative Research Program
Determine Technical & Commercial Viability
TOTAL:$20MM+
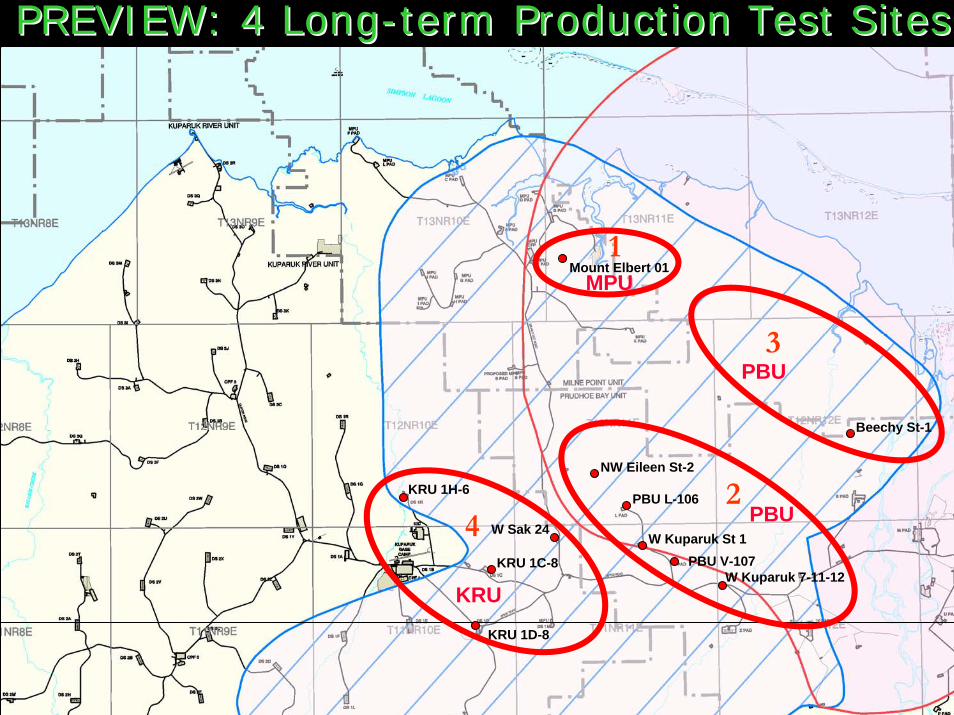
PREVIEW: 4 LongPREVIEW: 4 Long--term Production Test Sitesterm Production Test Sites
NW Eileen St-2
PBU L-106
W Kuparuk St 1
W Kuparuk 7-11-12
W Sak 24
KRU 1H-6
KRU 1C-8
KRU 1D-8
Beechy St-1
Mount Elbert 01
PBU V-107
1
2
3
4
MPU
KRU
PBU
PBU

Project Phase 3b Project Phase 3b –– 2009+2009+Parameters for a Successful Production TestParameters for a Successful Production Test
• Site with continuous, long-term access• Maximize likelihood for success• Conduct long-term test operations• Build on past success, learn from others
• Designed to determine the potential productivity of gas hydrate reservoirs• Validate simulations, test methods• Maximize knowledge, not just rate• Demonstrate technical recovery• Try multiple completions/stimulations
• Carefully manage risks• Maintain operationally simple• Meet all HSE requirements• Minimize impacts to existing operations• Optimize reservoir conditions

Phase 3b SchedulePhase 3b Schedule
1. Stakeholder Alignment/Site Selection
2. Select Production Test Site
3. Production Test Detailed Design, Well Package, Risk Assessment, Preparation
4. Acquire Additional Well DataImplement Long-term Production Test
1Q2009
2Q2009
3-4Q2009
2010+ Planned
Determine Technical & Commercial Viability
Timing Major Task

Presentation OutlinePresentation Outline
• Project Overview / Schedule
Resource Characterization
• Stratigraphic Test Results
• Reservoir Simulation
• Production Testing
• Conclusions / Future Plans

Study Area LocationStudy Area Location
6 Miles
10 KM
Eileen Trend, PBU/KRU/MPU
33 TCF GIP, 0-12 TCF EUR
Tarn Trend
IntroductionIntroduction
After Collett, 2004
A
A’

Eileen/Tarn Gas Hydrate TrendsEileen/Tarn Gas Hydrate Trends
BIBPF
BGHSZ
TGHSZ
A A’TARN EILEEN

Study Area LocationStudy Area LocationMilne Point 3D Survey
6 Miles
10 KM
Eileen Trend, PBU/KRU/MPU
33 TCF GIP, 0-12 TCF EUR
Tarn Trend
IntroductionIntroduction
After Collett, 2004
A
A’

Milne Point Unit Gas Hydrate ProspectsMilne Point Unit Gas Hydrate Prospects• 14 Intra-Hydrate Prospects• Total GIP = 600 BCF• Largest Prospect
158 BCF GIP
Courtesy; Inks, T., Lee, M., Taylor, D., Agena, W., Collett, T. and Hunter, R., in press

Milne Point Unit Gas Hydrate ProspectsMilne Point Unit Gas Hydrate Prospects
Stratigraphic TestMt Elbert Prospect
~90 BCF GIP
Courtesy; Inks, T., Lee, M., Taylor, D., Agena, W., Collett, T. and Hunter, R., in press
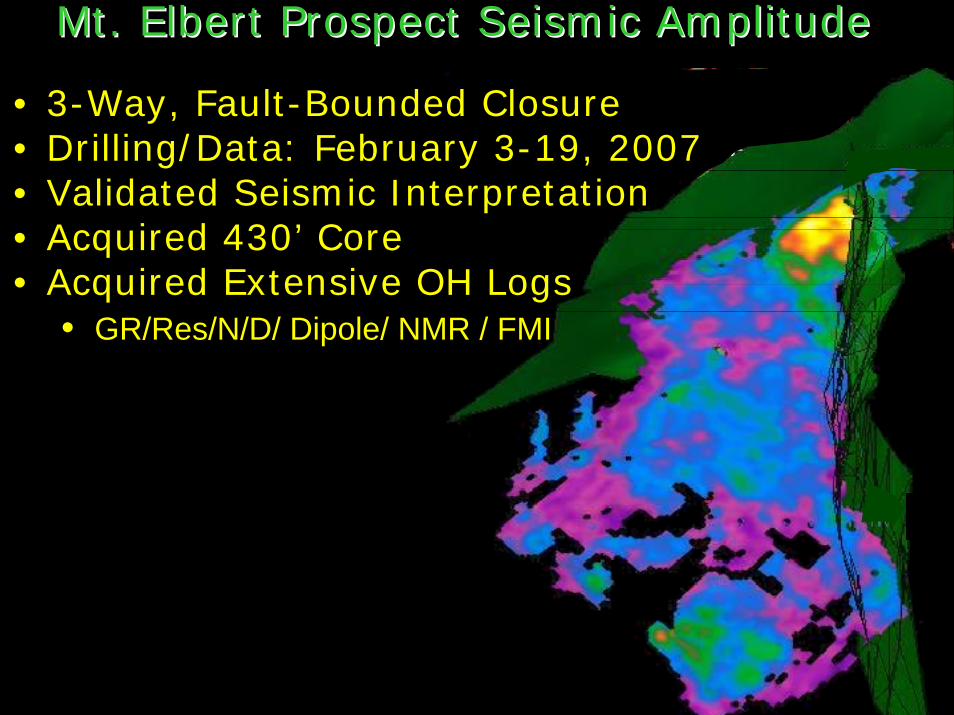
Mt. Elbert Prospect Seismic AmplitudeMt. Elbert Prospect Seismic Amplitude
• 3-Way, Fault-Bounded Closure• Drilling/Data: February 3-19, 2007• Validated Seismic Interpretation• Acquired 430’ Core• Acquired Extensive OH Logs
• GR/Res/N/D/ Dipole/ NMR / FMI

• 3-Way, Fault-Bounded Closure• Drilling/Data: February 3-19, 2007• Validated Seismic Interpretation• Acquired 430’ Core• Acquired Extensive OH Logs
• GR/Res/N/D/ Dipole/ NMR / FMI
Mt. Elbert Prospect Seismic AmplitudeMt. Elbert Prospect Seismic Amplitude
A
A’XX

Top Mikkelson
C16
“D” Hydrate
“C” Hydrate
Minimum BHSZ
Top Staines Tongue
Maximum BHSZ
C12
WEST EASTMtElbert-01 A’A

Presentation OutlinePresentation Outline
• Project Overview / Schedule
• Resource Characterization
Stratigraphic Test Results
• Reservoir Simulation
• Production Testing
• Conclusions / Future Plans

• 1st ANS open-hole multi-day data acquired
• 1st Significant ANS gas hydrate core
• 1st dual-packer, open-hole MDT program
• 1st MDT sampling of hydrate gas/water
• 1st formation temperature data with MDT
Gas Hydrate Stratigraphic Test “Firsts”
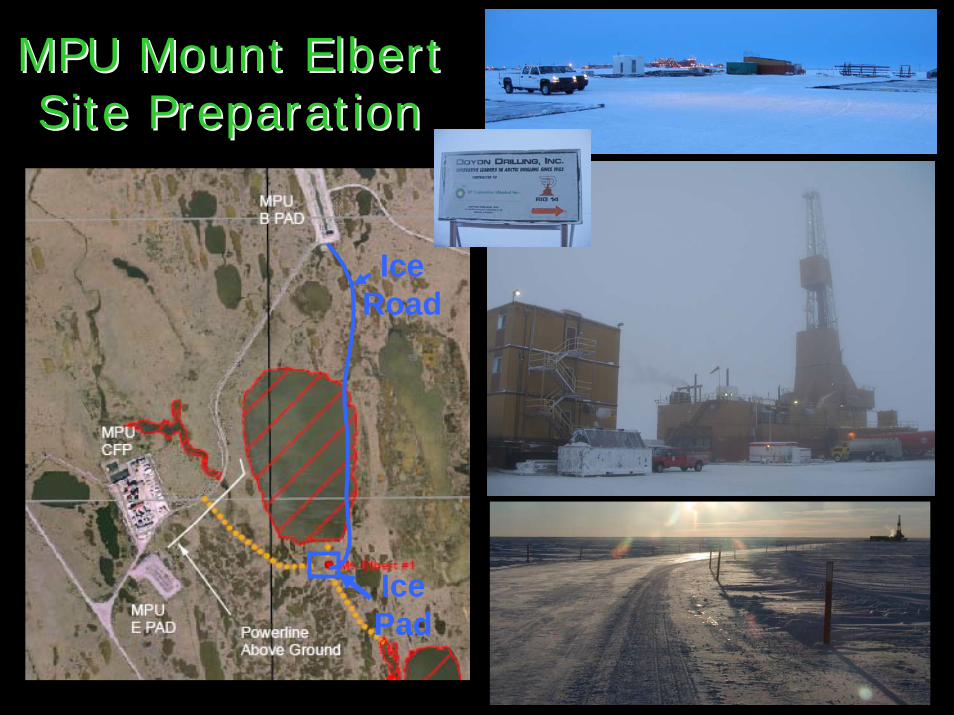
MPU Mount Elbert MPU Mount Elbert Site PreparationSite Preparation
Ice Road
Ice Pad

Downhole Log Acquisition ProgramDownhole Log Acquisition Program
• Excellent Hole Conditions• Use of chilled, oil-based
drilling fluids• Full Log Suite Obtained
• Gamma Ray (lithology)• Resistivity (hydrocarbon)• Neutron and Density
(porosity)• Acoustics (Hydrate
Indicator- Dipole Sonic)• Magnetic Resonance
(distribution, nature, and saturation of fluids)

PREDICTION• Prospect within undrilled,
3-way fault-bounded trap• Seismic attributes estimate
reservoir thickness and saturation for Zones C & D
• Upper “D” sand: 46’ thick with 68% Gas Hydrate Saturation
• Lower “C” sand: 70’ thick with 85% Gas Hydrate Saturation
• Thickest previous total GH seen in MPU wells ~20 ft.
RESULTS• Validated seismic methods• Extensive Open-hole Logs• 430’ core, 261 subsamples• 100’ gas hydrate-bearing• Comprehensive OH MDT
Pre-drill Saturation Estimate – C sand
W
E
CD
Courtesy; Inks, T., Lee, M., Taylor, D., Agena, W., Collett, T. and Hunter, R., in press
Mount Elbert: Delineate & Validate Mount Elbert: Delineate & Validate
MtElbert-01W E

Gas Hydrate Prediction vs. ActualGas Hydrate Prediction vs. Actual
GH Thickness Pre-drill: 70 ft Actual: ~43 ft(perched water)
GH Saturation Pre-drill: 89% Actual: ~75%
GH Thickness Pre-drill: 46 ft Actual: ~44 ft
GH Saturation Pre-drill: 68%Actual: ~75%
Hydrate
2100’
2050’
2150’
Hydrate
Pre-Drill Est.
ZONE D
Pre-Drill Est.
ZONE C

Mount ElbertMount Elbert--01 Log Data Summary01 Log Data Summary
Gas HydrateWater
ZONE D
ZONE B
ZONE E
ZONE A
~BASE PERMAFROST
~ BASE GAS HYDRATE STABILITY ZONE
ZONE C
CO
RE
INTE
RVA
L

Core SubCore Sub--Sampling in the Cold TrailerSampling in the Cold Trailer
Core liner cut, core examined, described, sampled, & archived
Robert Hunter
ASRC
Core – Note rind
of Oil-Based Mud
Tom Lorenson (USGS) & Rick Colwell (OSU)
Tim Collett
USGS
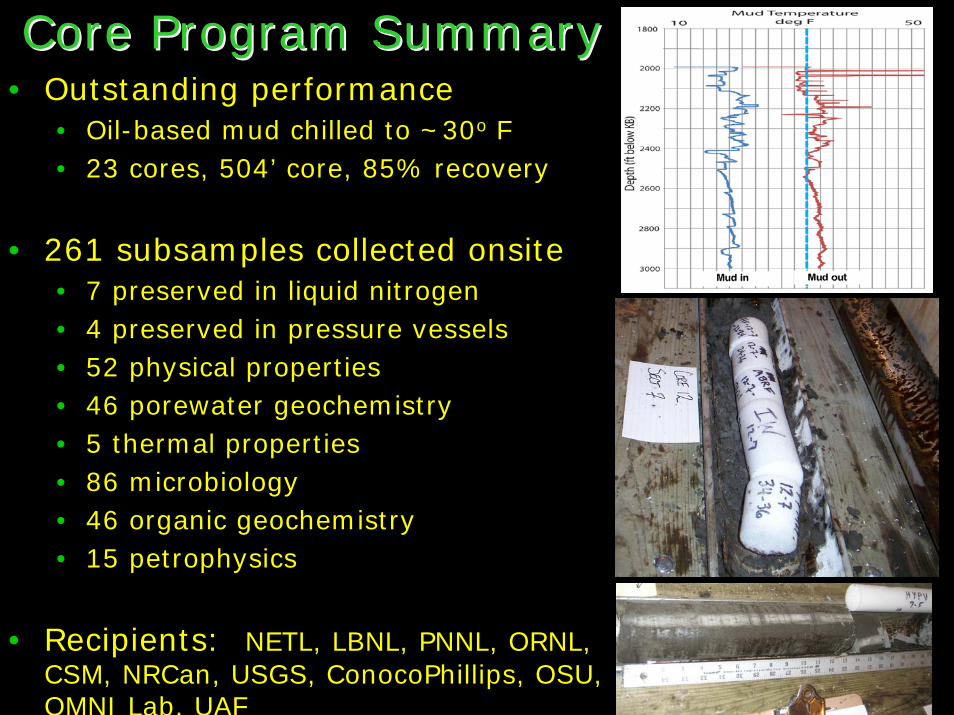
Core Program SummaryCore Program Summary• Outstanding performance
• Oil-based mud chilled to ~30o F• 23 cores, 504’ core, 85% recovery
• 261 subsamples collected onsite• 7 preserved in liquid nitrogen• 4 preserved in pressure vessels• 52 physical properties • 46 porewater geochemistry • 5 thermal properties• 86 microbiology• 46 organic geochemistry • 15 petrophysics
• Recipients: NETL, LBNL, PNNL, ORNL, CSM, NRCan, USGS, ConocoPhillips, OSU, OMNI Lab, UAF

Core SedimentologyCore Sedimentology
Zone D Pebble ConglomerateZone D Pebble ConglomerateME01 Core2 Sec5 0ME01 Core2 Sec5 0--1212””
ZONE C Gas HydrateZONE C Gas Hydrate--bearing sandbearing sandME01 Core7 Sec2 28ME01 Core7 Sec2 28--3333””
ZONE D Gas HydrateZONE D Gas Hydrate--bearing sand bearing sand ME01 Core3 Sec2 19ME01 Core3 Sec2 19--2424””
Shale TopShale Top--SealSealME01 Core1 Sec3 4ME01 Core1 Sec3 4--88””

Petrophysical Data from CorePetrophysical Data from CoreGR RES SATgh (CMR)
ZONE D
ZONE C
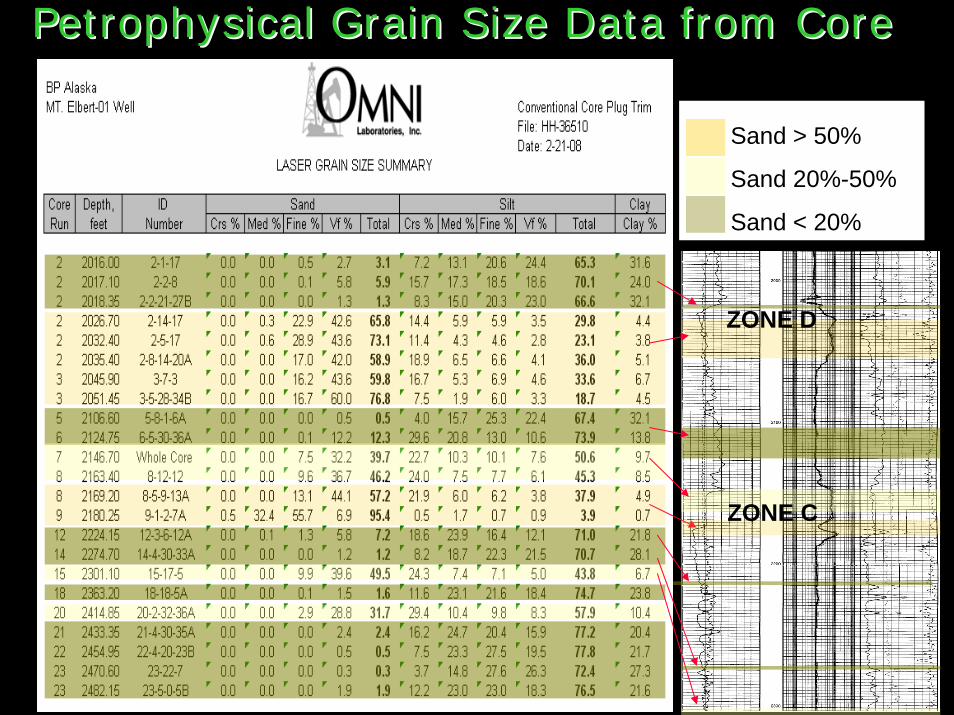
Petrophysical Grain Size Data from CorePetrophysical Grain Size Data from Core
7
Sand > 50%
Sand 20%-50%
Sand < 20%
ZONE D
ZONE C
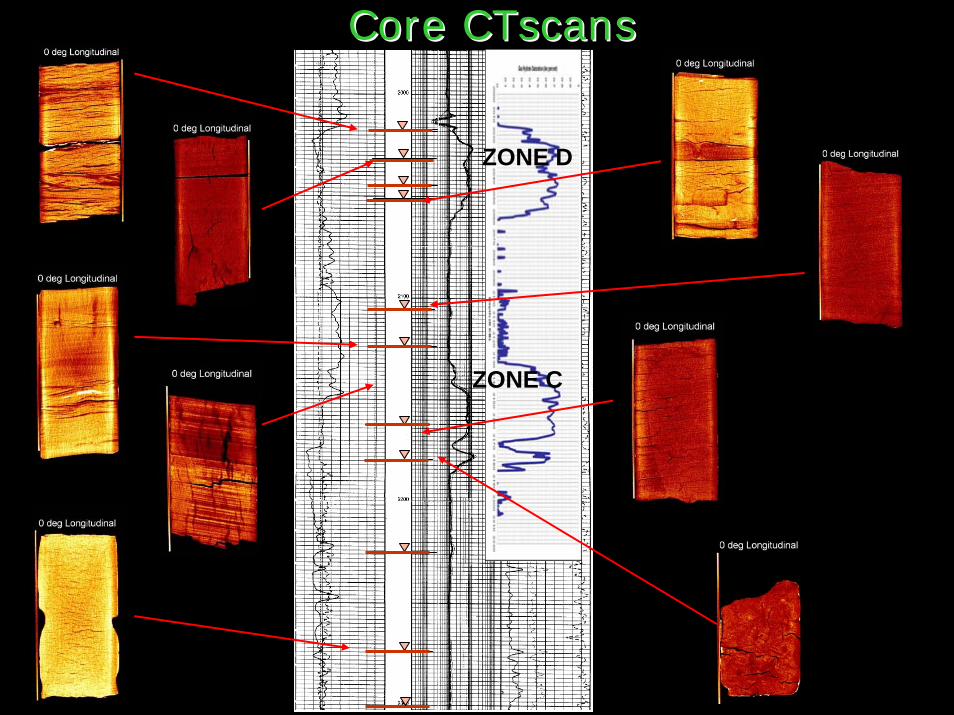
Core CTscansCore CTscans
2018’
2035’
2051’
2169’
2125’
2106’
2146’
2125’
2274’ 2180’
Core CT scans from OMNI
8
ZONE D
ZONE C

Core XRD ResultsCore XRD Results
2017’2018’2124’2163’
2224’2180’
2454’
Note high pyrite in transgressive top of D (but not in C). Note also 10%+ feldspars in D sand except in cleanest sands at top of regressive section
ZONE D
ZONE C

Core SamplingCore SamplingOnsite PoreOnsite Pore--Water Geochemistry LabWater Geochemistry Lab
Core samples are squeezed to extract/examine pore water samples and analyzed for thermal properties
Warren Agena – USGS & Kelly Rose – NETL/DOE Eilis Rosenbaum - NETL/DOE
& Marta Torres - OSU

Downhole Data AcquisitionDownhole Data AcquisitionModular Dynamics Testing (MDT)Modular Dynamics Testing (MDT)
• Tests reservoir response to fluid withdrawal and pressure reduction
• Indication of reservoir quality and performance
• Tests conducted at four locations two per pay zone
• Critical data for reservoir simulation calibration and potential production test
0
0.1
0.2
0.3
0.4
0.5
0.6
0.7
0.8
0.9
2010 2015 2020 2025 2030 2035 2040 2045 2050 2055 2060 2065 2070 2075 2080 2085 2090 2095 2100 2105 2110 2115 2120 2125 2130 2135 2140 2145 2150 2155 2160 2165 2170 2175 2180 2185 2190
Depth MD (ft)
GH
Sat
urat
ion
(%)
NMR Sh
C1 2161C2 2151D1 2047D2 2025ZONE D ZONE C

Modular Dynamic Testing (MDT)Modular Dynamic Testing (MDT)
• Extensive and repeatable flow and pressure transient data obtained from 4 extended Dual-Packer OH MDT’s• Collected formation temperature data tracking
cooling and warming events during flow and build-up periods – an industry first
• 4 gas samples obtained from each test interval • Observed rapid cooling (and potential freezing of
pore water) during gas hydrate dissociation/gas flow• Produced free pore water from gas hydrate zone
without causing gas hydrate dissociation• 1 pore water sample obtained from D1 test interval
Presentation OutlinePresentation Outline
• Project Overview / Schedule
• Resource Characterization
• Stratigraphic Test Results
Reservoir Simulation
• Production Testing
• Conclusions / Future Plans
Presentation OutlinePresentation Outline
• Project Overview / Schedule
• Resource Characterization
• Stratigraphic Test Results
• Reservoir Simulation
Production Testing
• Conclusions / Future Plans
Presentation OutlinePresentation Outline
• Project Overview / Schedule
• Resource Characterization
• Stratigraphic Test Results
• Reservoir Simulation
• Production Testing
Conclusions / Future Plans

Mt Elbert Gas Hydrate Mt Elbert Gas Hydrate Well SummaryWell Summary
• Demonstrated safe data collection in shallow unconsolidated, GH-bearing sediments• good hole = outstanding core recovery
and log suite• Confirmed GH reservoir in close
conformance to pre-drill predictions• ability to prospect for hydrate using G&G
approach• improved confidence in broader ANS GH
resource assessment• Coring, Logging, Pressure Testing Program
• fully integrated data and sample set• moveable fluids in fully-saturated
reservoirs quantified and accessed• gas release via depressurization
• Acquisition and analysis of complete and integrated dataset for cost of ~$6.0 million
Core sampling at Mt Elbert well site – February, 2007

Project Phase 3b Project Phase 3b –– beyond 2009+beyond 2009+Parameters for a Successful Production TestParameters for a Successful Production Test
• Site with continuous, long-term access• Maximize likelihood for success• Conduct long-term operations• Build on past success, learn from others
• Designed to determine the potential productivity of gas hydrate reservoirs• Validate simulations• Maximize knowledge, not just rate• Demonstrate technical recovery• Test multiple completion scenarios
• Carefully manage risks• Maintain operationally simple• Meet all HSE requirements• Minimize impacts to existing operations• Optimize reservoir conditions

Site Evaluation Site Evaluation –– LongLong--term Production Testterm Production Test
NW Eileen St-2
PBU L-106
W Kuparuk St 1
W Kuparuk 7-11-12
W Sak 24
KRU 1H-6
KRU 1C-8
KRU 1D-8
Beechy St-1
Mount Elbert 01
PBU V-107
1
2
3
4
MPU
KRU
PBU
PBU

Four areas under evaluation withinFour areas under evaluation withinEileen trend for Production Test SiteEileen trend for Production Test Site
Key Criteria• Probability of Success
• Reservoir presence and quality
• Temperature
• Nature of contacting units (pressure support?)
• Modeling results
• Operational flexibility (multiple zones)
• Ease of Access
• Logistics/Facilities
• Program Complexity
NW Eileen St-2
PBU L-106
W Kuparuk St 1
W Kuparuk 7-11-12
W Sak 24
KRU 1H-6
KRU 1C-8
KRU 1D-8
Beechy St-1
Mount Elbert 01
PBU V-107
1
2
3
4
MPU
KRUPBU
PBU

Parameter MP E-pad MP B-pad KRU W Sak
24
KRU 1H PBU L-pad PBU Kup St. 3-11-11
PBU downdip
Temp1 H H H H M M L
Ownership2 L L M-L M-L H H H
Access3 M* M* L L L L H
Geo Risk4 L L M M L L H
Data5 L L M M L M H
Well Risk6 L-M L-M M M M M H
Facilities7 L L M L L M H
Gas8 H H H H H H H
Interference9 L ? L H? H? L L
Water10 L L M L L M H
Market11 L? L? L L? M M M
Options12 M-H M-H H H L L M-H
MPU/KRU option PBU L option /down-dipSite Comparison and Risk DetailSite Comparison and Risk Detail

General comparison of test site optionsGeneral comparison of test site optionsTarget Depth Contact H (ft) Sw/Swirr
(%)Phi (%) K (mD) T (oC) Pressure
gradientSalinity
(ppt)Milne Point Unit – Mount Elbert Prospect
C-sand 2132 Water 52 35/25 35 1000 3.3 - 3.9 9792 5D-sand 2014 Water? 47 35 - 40 1000 2.3 – 2.6 9792 5
Prudhoe Bay Unit – L-pad vicinityC2-sand 2318 Shale 62 25 40 1000 5.0 – 6.5 9792 5C1-sand 2226 Shale 56 25 40 1000 5.0 – 6.5 9792 5D-sand 2060 Shale 50E-sand 1915 Shale 50
Prudhoe Bay Unit Down-Dip from L-padC-sand 2500 ? 60* 25 40 1000 ~12 9792 5
Kuparuk River Unit – West Sak 24 vicinityB-sand 2260 Shale? 40 35 40 1000 2.0 – 3.0 9792 5
KRU and MPU units are very similar, both colder and are treated as one scenario for modeling
- MPU/KRU-like reservoirs- PBU L-pad-like reservoirs- Warmer reservoirs such as those that occur down-dip of the PBU L-Pad area
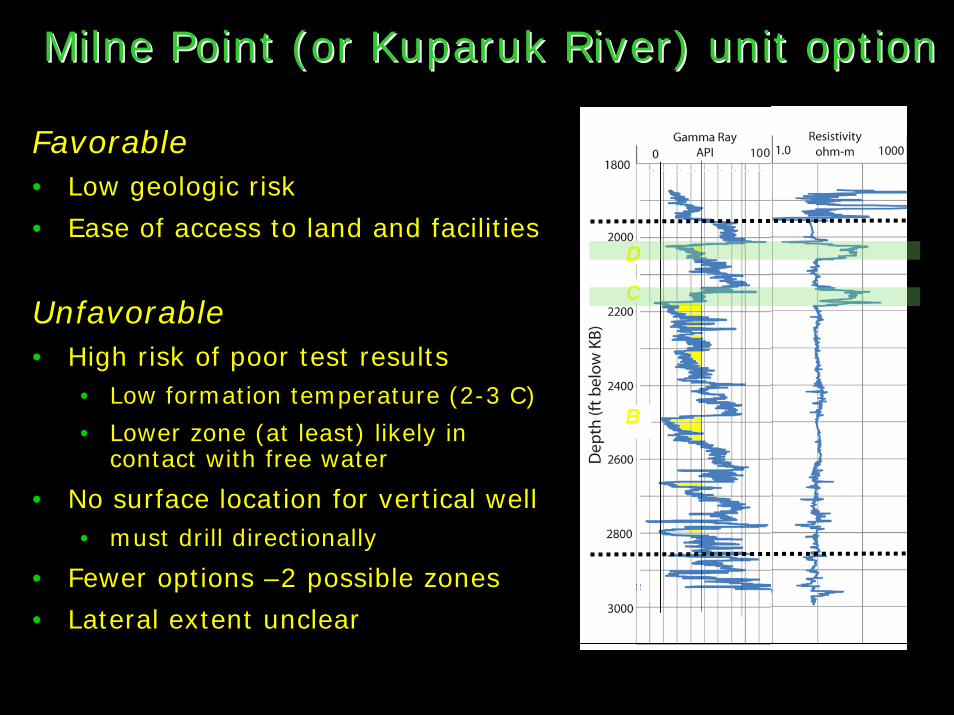
Milne Point (or Kuparuk River) unit optionMilne Point (or Kuparuk River) unit option
Favorable• Low geologic risk
• Ease of access to land and facilities
Unfavorable• High risk of poor test results
• Low formation temperature (2-3 C)
• Lower zone (at least) likely in contact with free water
• No surface location for vertical well• must drill directionally
• Fewer options –2 possible zones
• Lateral extent unclear

Prudhoe Bay downPrudhoe Bay down--dip optiondip optionFavorable• Temperatures as high as 12C
• Most favorable simulation results
Unfavorable• Much higher geologic risk
• very few nearby well penetrations
• uncertainty as to reservoir presence and fill
• Potentially limited reservoir options
• No viable surface site infrastruction or facilities
• Extended reach well or near permanent gravel pad at prohibitive cost
MPU-KRU option basecase simulation results
PBU down-dip option basecase simulation results

W. Prudhoe LW. Prudhoe L--pad vicinity optionpad vicinity option
Favorable• Acceptable technical risk
– Moderate temperature (3-6 C)– Expect at least scalable production rates– Can drill vertically– Multiple zones each ~15m thick
• Acceptable geologic risk – Close offset to high-quality log suites– Clean, fully saturated sands– Recent 3D data in hands of industry
partners
Unfavorable• Complex contractural arrangement
– Would require approval of all Stakeholders
1
2
34

The TeamThe TeamINDUSTRY• BP Exploration Alaska• Arctic Slope Regional Corporation• Ryder Scott Company• RPS - APA Energy• Interpretation Services, Inc.• Doyon Drilling, Inc.• ReedHycalog (Corion) • Drill Cool Systems, Inc.• Omni Laboratories• Schlumberger• MI Swaco
GOVERNMENT• US Geological Survey • Department of Energy
ACADEMIA• U. Alaska-Fairbanks• U. Arizona • Oregon State University

•Backup Misc.

Contribution to R&D CommunityContribution to R&D CommunityResults, Reporting, Publications, PresentationsResults, Reporting, Publications, Presentations• DOE Reports: 15 major DOE Technical Reports, 4Q02-2Q08• 1 Topical Report on Drilling and Data Acquisition Planning, 6/05
• Published 2005 Regional Modeling in June 2006 Q Report
• DOE Advisory Committee / other Government presentations
• Present project updates - technical conferences/public meetings• Annual AAPG Meeting Oral/Poster Sessions 2002 – 2008 • 2002-04: >20 external presentations • 2005-08: ~20 external presentations• M.S. Thesis: 3 + 2 pending UA and 5 + 1 pending UAF• >30 professional publications
• Participate openly in Model Comparison Studies: 2005 – 2008
• Industry-standard input - Operations designs and production test

THEMATIC VOLUME PROPOSALJOURNAL OF MARINE AND PETROLEUM GEOLOGYSCIENTIFIC RESULTS OF 2007 USDOE-BP-USGS
“MOUNT ELBERT” HYDRATE STRATIGRAPHIC TESTMILNE POINT UNIT, ALASKA NORTH SLOPE
Eds. Dr. Ray Boswell, U.S. DOE, National Energy Technology LabDr. Tim Collett, U.S. Geological Survey
Dr. Brian Anderson, West Virginia University/NETL-IAESRobert Hunter, ASRC Energy Services
Our proposed time schedule is as follows:First submission deadline to guest editors: March 1, 2009.
Completion of initial reviews: May 1, 2009.Completion of review-revision process: July 1, 2009.
Appearance on the web: August 15, 2009.Hardcopy: Jan-Feb, 2010.

Introductory Materials (Hunter, ed.)1. R. Hunter (ASRC Energy): Research overview and Stratigraphic Test 2. M. Lee (USGS): 3D seismic analysis of Mount Elbert prospect 3. T. Collett (USGS): Regional geologic framework 4. R. Boswell (DOE): Geologic controls of gas hydrate, Milne Point
5. S. Wilson (RyderScott Co.) Regional production modeling
Coring Program (Boswell, ed.)6. K. Rose (DOE): Core operations and sedimentology7. B. Winters (USGS): Physical and grain-size properties 8. B. Winters (USGS): Geotechnical behavior 9. T. Lorenson (USGS): Gas geochemistry 10. M. Torres (Oregon St. U.): Porewater geochemistry11. F. Colwell (Oregon St. U.): Microbial community diversity 12. T. Kneafsey (LBNL): Core disturbance and handling 13. L. Stern (USGS): SEM and XRD imaging and characterization 14. H. Lu (Natural Resources Canada): Characteristics of gas hydrate 15. A. Johnson (U. Alaska-Fairbanks): Gas-Water Relative Permeability
THEMATIC VOLUME PROPOSAL
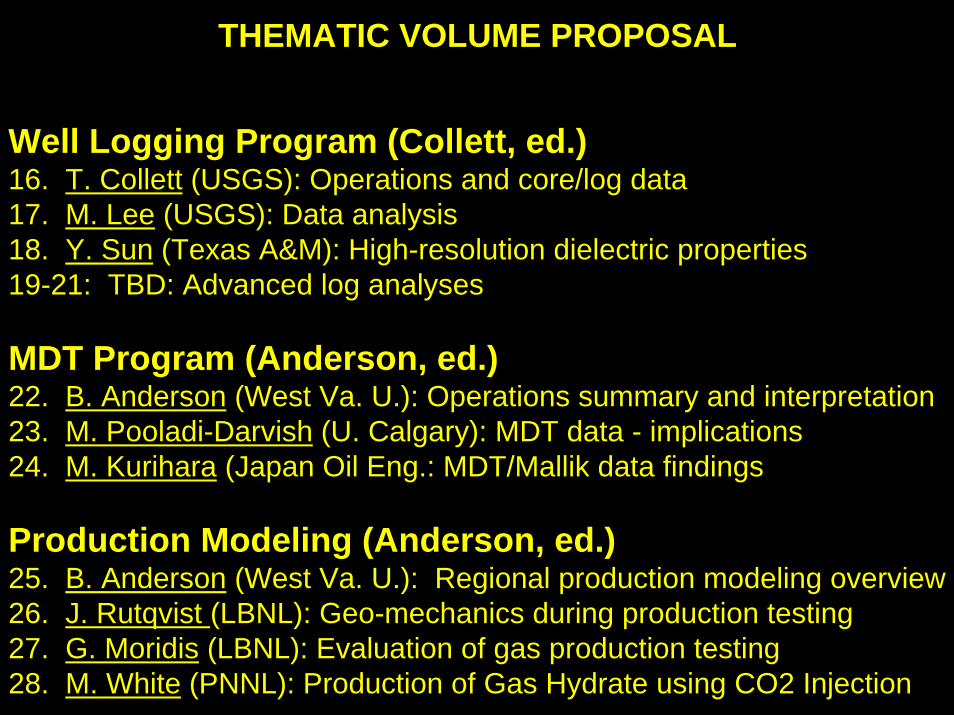
Well Logging Program (Collett, ed.)16. T. Collett (USGS): Operations and core/log data 17. M. Lee (USGS): Data analysis 18. Y. Sun (Texas A&M): High-resolution dielectric properties 19-21: TBD: Advanced log analyses
MDT Program (Anderson, ed.)22. B. Anderson (West Va. U.): Operations summary and interpretation 23. M. Pooladi-Darvish (U. Calgary): MDT data - implications 24. M. Kurihara (Japan Oil Eng.: MDT/Mallik data findings
Production Modeling (Anderson, ed.)25. B. Anderson (West Va. U.): Regional production modeling overview26. J. Rutqvist (LBNL): Geo-mechanics during production testing 27. G. Moridis (LBNL): Evaluation of gas production testing28. M. White (PNNL): Production of Gas Hydrate using CO2 Injection
THEMATIC VOLUME PROPOSAL

Proactions & ReactionsProactions & ReactionsProject Management ChallengesProject Management Challenges
• Gates / Phases / Decisions• 2001 – Present: Industry / Government Alignment
• Underestimated time needed to maintain/grow alignment
• 2002 – 2004: Reservoir Description & Modeling• Recommended MPU field area Field Operations• Regional Eileen trend resource potential not evident• Led to 2005 Redirection Regional Development Model• Maintained & Increased Industry support for Operations
• 2006-07: Field Operations Approved / Executed• 2006 Third-party delays with Drilling Rig
• Optimized Safety, Drilling, & Data Acquisition program• 2007 Budget Overruns ~$1.1MM
• Documented Costs Strong Industry & DOE Commitment• Demonstrated ability to Implement Operations / Acquire Data

Methane Hydrate ResourceMethane Hydrate ResourcePetroleum System ComponentsPetroleum System Components• Source – Thermogenic - Biogenic
• Migration – Fault Systems
• Reservoir – Sub-PermafrostShallow Sands
• Trap – Complex Structural andStratigraphic through 4D
• Seal – Can Self-Seal
• Stability – Pressure/Temperature
• Gas/Water – Clathrate Structure