gao-15-168r, contingent workforce: size, characteristics ... · contingent workforce: size,...
TRANSCRIPT

Page 1 GAO-15-168R Contingent Workforce
441 G St. N.W. Washington, DC 20548
April 20, 2015
The Honorable Patty Murray Ranking Member Committee on Health, Education, Labor, and Pensions United States Senate
The Honorable Kirsten Gillibrand United States Senate
Contingent Workforce: Size, Characteristics, Earnings, and Benefits
Millions of workers do not have standard work arrangements—permanent jobs with a traditional employer-employee relationship. Rather, they are in temporary, contract, or other forms of non-standard employment arrangements in which they may not receive employer-provided retirement and health benefits, or have safeguards such as job-protected leave under the Family Medical Leave Act, even if they have a traditional employer-employee relationship. These non-standard arrangements are sometimes referred to as “contingent” work. To collect information about contingent workers, the Department of Labor’s Bureau of Labor Statistics (BLS) has previously supplemented its monthly Current Population Survey (CPS) with a survey on contingent work, known as the Contingent Work Supplement (CWS).1
In the aftermath of the recent recession,
While the CWS is a comprehensive source of information on contingent workers, BLS has not conducted this supplement since 2005.
2
1 In recent communications, Department of Labor officials have referred to this supplement as the “Contingent Worker and Alternative Work Arrangement Supplement.” To be consistent with the survey’s technical documentation, recent agency budget justifications, and prior work, we refer to the supplement as the Contingent Work Supplement (CWS) throughout this report.
more workers may have become contingent workers with potentially limited access to work-provided health insurance and retirement benefits, as well as coverage under key workforce protection laws. In light of these developments we were asked to examine issues related to the contingent workforce. This report examines what is known about (1) the size of the contingent workforce, (2) the characteristics and employment experiences of contingent versus standard workers, and (3) any differences in earnings, benefits, and measures of poverty between contingent and standard workers.
2 The National Bureau of Economic Research Business Cycle Dating Committee identifies the period of this recession to be December 2007 through June 2009.

Page 2 GAO-15-168R Contingent Workforce
To assess the size of the contingent workforce, we analyzed population counts of contingent workers identified in various national survey data sources, such as the CWS, CPS, the General Social Survey (GSS), and the Survey of Income and Program Participation (SIPP).3
Using these national data sources, we analyzed the data to compare population counts both over time and based on various definitions, as applicable. We also analyzed and compared distributions of various self-reported worker and job characteristics, such as demographics and family income, and job security, benefits, and safety. We conducted regression analysis using CPS data, controlling for various external factors, to determine how various measures of earnings and retirement plan participation compared between contingent and other workers. We also compared the distributions of health insurance coverage and measures of poverty (e.g., family income levels) between contingent and other workers.
These data sources were available for varying timeframes over the last two decades and identified types of contingent workers or workers in alternative work arrangements, based on various definitions. While the CWS has been a comprehensive source of information about contingent workers, it has not been administered in 10 years (since 2005). Other surveys offer additional insight about this workforce, but may be less statistically robust or collect less detailed information about the many alternative employment arrangements researchers have suggested could be part of the contingent workforce. For example, some surveys have smaller samples or ask less detailed questions about why workers hold contingent jobs.
4
We assessed the reliability of the data we analyzed by interviewing the appropriate officials, reviewing documentation, and conducting selected data checks. We determined that the data were reliable for our purposes.
To gain an understanding of and provide context for relevant contingent worker data we analyzed, we interviewed agency officials from the Department of Labor and the Census Bureau (Census). We also interviewed officials from organizations representing workers and employers, and subject matter experts, and reviewed studies that address aspects of contingent work. To identify workforce protections provided to contingent workers, we reviewed our prior reports on this topic and relevant federal laws, including the Patient Protection and Affordable Care Act (PPACA).
Enclosure I to this letter provides a detailed presentation of our work and findings. See enclosure II for a detailed description of our scope and methodology.
We conducted this performance audit from February 2014 to April 2015 in accordance with generally accepted government auditing standards. Those standards require that we plan and perform the audit to obtain sufficient, appropriate evidence to provide a reasonable basis for our findings and conclusions based on our audit objectives. We believe that the evidence obtained provides a reasonable basis for our findings and conclusions based on our audit objectives.
3 The GSS is administered by NORC at the University of Chicago and SIPP is administered by the Census Bureau. The extent to which our analyses are representative of the U.S. contingent worker population varies. For more information about the data sources used and the generalizability of our analyses, see enclosure II. 4 Throughout this report, when we present estimates from survey data, we also present the applicable margins of error (i.e., the maximum half-width of the 95 percent confidence interval around the estimate). In some cases, the confidence intervals around our estimates are asymmetrical; however, we present the maximum half-width for simplicity and for a consistent and conservative representation of the sampling error associated with our estimates.

Page 3 GAO-15-168R Contingent Workforce
Results in Brief
The size of the contingent workforce can range from less than 5 percent to more than a third of the total employed labor force, depending on widely-varying definitions of contingent work. Based on GSS data, we estimated that a core group of contingent workers, such as agency temps and on-call workers, comprised about 7.9 percent of the employed labor force in 2010.5
We found that compared to standard full-time workers, core contingent workers are more likely to be younger, Hispanic, have no high school degree, and have low family income. These contingent workers are also more likely than standard workers to experience job instability, and to be less satisfied with their benefits and employment arrangements than standard full-time workers. Because contingent work can be unstable, or may afford fewer worker protections depending on a worker’s particular employment arrangement, it tends to lead to lower earnings, fewer benefits, and a greater reliance on public assistance than standard work.
Background
Comprehensive, nationally representative data on contingent workers were first collected in 1995 when BLS introduced the CWS to the CPS, a monthly survey of about 60,000 households that, in part, collects data on the U.S. labor force. The CWS asked a series of additional questions about workers’ employment, including whether their jobs were contingent. The supplement has been administered five times: in 1995, 1997, 1999, 2001, and 2005. According to agency officials, BLS receives many requests for data on contingent workers. BLS has requested funding each year from 2012 forward to conduct the CWS but has not received funding to administer the supplement in recent years. In its fiscal year 2016 budget request, BLS asked for funding to conduct the CWS every 2 years. In addition, in our prior work, we reported that key worker protection laws generally apply to employees and therefore do not apply to independent contractors, self-employed workers, and contingent workers who are not classified as employees.6
How these laws apply guide how they are regulated and enforced.
Size of the Contingent Workforce Varies by Definition and Data Source
The size of the contingent workforce can range from less than 5 percent to more than a third of the total employed labor force, depending on the definition of contingent work and the data source. In general, contingent work is a term associated with those individuals who have temporary employment. In its broadest definitions, however, contingent work also refers to all individuals who maintain work arrangements without traditional employers or regular, full-time schedules—regardless of how long their jobs may last. Because the various definitions include different types of workers, a profile of the contingent workforce can vary according to the way contingency is defined and the range and detail of a survey instrument.
• BLS counts those who have temporary employment as contingent workers, irrespective of their work arrangement. BLS has developed three successively broader estimates of the contingent workforce by applying its definition in different ways, such as by first
5 Percentage estimate has a 95 percent confidence interval of +/- 1.7 percentage points. 6 GAO, Contingent Workers: Incomes and Benefits Lag Behind Those of Rest of Workforce, GAO/HEHS-00-76 (Washington, D.C.: June 30, 2000), and GAO, Employer Arrangements: Improved Outreach Could Help Ensure Proper Worker Classification, GAO-06-656 (Washington, D.C.: July 11, 2006).

Page 4 GAO-15-168R Contingent Workforce
excluding and then including self-employed workers. Using the 2005 CWS, these estimates, therefore, ranged from 1.8 to 4.1 percent of the total employed labor force (2.5 to 5.7 million workers).7
• In contrast, other definitions of contingent work focus on whether individuals are employed in alternative work arrangements of various types—regardless of how long their jobs may last. These much broader definitions include agency temps and day laborers, although most are standard part-time workers or independent contractors. Applying a broad definition to analysis of 2005 CWS data, our prior work estimated that 30.6 percent of the employed workforce could be considered contingent.
8 Applying this broad definition to our analysis of data from the General Social Survey (GSS), we estimate that such contingent workers comprised 35.3 percent of employed workers in 2006 and 40.4 percent in 2010.9
However, no clear consensus exists among labor experts as to whether contingent workers should include independent contractors, self-employed workers, and standard part-time workers, since many of these workers may have long-term employment stability. There is more agreement that workers who lack job security and those with work schedules that are variable, unpredictable, or both—such as agency temps, direct-hire temps, on-call workers, and day laborers—should be included. We refer to this group as the “core contingent” workforce.
• We estimate that this core contingent workforce comprised about 7.9 percent of employed workers in the 2010 GSS and also made up similar proportions of employed respondents in the roughly comparable 2005 CWS and 2006 GSS—5.6 percent and 7.1 percent, respectively.10
Other sources of information about contingent workers provide different levels of detail or cover different segments of this workforce. For example, Census’ Survey of Income and Program Participation (SIPP) includes counts of contingent workers over time, but does not identify individual work arrangements within its contingent population. Meanwhile, some labor experts focus on forms of employment instability that do not fully align with traditional definitions of contingent work and available data sources. Some of these other concepts may stem from a focus on enforcing worker protection regulations, such as the Department of Labor’s efforts related to business practices that obscure or eliminate the link between workers and their employers.
Characteristics and Employment Experiences of Contingent Workers Differ from Those of Standard Workers
We found both demographic differences and differences in employment experiences between standard and core contingent workers. While some of these differences may be generally consistent with what would be expected given definitions of contingent work, our findings quantify and show their magnitude.
7 Percentage estimates have 95 percent confidence intervals of +/- 1.1 and +/- 1.0 percentage points; population estimates have 95 percent confidence intervals of +/- 0.2 and +/- 0.3 million. 8 GAO-06-656; percentage estimate has a 95 percent confidence interval of +/- 0.9 percentage points. 9 Percentage estimates have 95 percent confidence intervals of +/- 2.6 and +/- 3.8 percentage points. 10 Percentage estimates have 95 percent confidence intervals of +/- 1.7 and +/- 1.0 and +/- 1.6 percentage points.

Page 5 GAO-15-168R Contingent Workforce
• In both the CWS and GSS, we found that compared to standard full-time workers, core contingent workers appeared to be younger and more often Hispanic, and were more likely to have no high school degree and have low family income.
• Contingent workers are more likely than standard workers to experience job instability. Based on data from a Census working paper, we estimated that in 2004 about 11.7 to 16.2 percent of workers categorized as contingent in a given month either left the labor force or became unemployed in the following month.11
• We also found in the 2010 GSS data that core contingent workers were less satisfied with their fringe benefits and with their jobs overall than standard full-time workers.
This represents a monthly job separation rate several times higher than the rate Census found in the overall employed labor force. In addition, we estimated with 2010 GSS data that core contingent workers were more than three times as likely as standard full-time workers to report being laid off in the previous year. While it is expected that contingent workers would report higher rates of job separation, our analysis of the SIPP and GSS data illustrated relatively large differences between contingent and standard workers.
• Evaluating workplace safety for contingent workers is challenging due to a lack of worker injury data that track injuries by job type. However, other research has found that some contingent workers, particularly agency temps, may be at increased risk of injury (see enclosure I). According to officials from the Department of Labor’s Occupational Safety and Health Administration, this increased risk occurs for a variety of reasons, including because agency temps often are not provided adequate safety training or equipment by either the staffing agency or the host employer.
Contingent Workers Earn Less and Are Less Likely to Have Work-Provided Benefits than Standard Workers
We analyzed earnings and benefits from contingent work, as defined by BLS, by using 2012 CPS data that identify a similar population of contingent workers as that in the CWS. Our regressions accounted for other important factors that have an impact on earnings, such as demographics, education, unionization, industry, occupation, and geography. Because contingent work can be unstable or afford fewer worker protections, depending on a worker’s particular employment arrangement, it tends to lead to lower earnings, fewer benefits, and a greater reliance on public assistance than standard work. Given that contingent workers are less likely than standard workers to have long-term, full-time jobs, such results are not surprising. However, our analysis demonstrates the magnitude of the differences in earnings between contingent and standard workers, which are affected by factors such as differences in the number of hours worked and in hourly pay.
• Accounting for other factors that affect earnings, contingent workers earn less than standard workers on an hourly, weekly, and annual basis.
• We found that contingent workers earn about 10.6 percent less per hour than standard workers.
11 Percentage estimates have 95 percent confidence intervals of +/- 2.0 and +/- 2.3 percentage points.

Page 6 GAO-15-168R Contingent Workforce
• In addition, contingent workers have lower weekly and annual earnings than standard workers. When not controlling for hours worked, contingent workers, on average, earn 27.5 percent less per week and 47.9 percent less per year than standard workers. Because these differences do not control for hours worked, they represent the cumulative difference between groups in both pay rate and hours worked over a week and over a year. The greater differences in weekly and annual earnings are largely the result of contingent workers being more likely to work part-time and to experience gaps in employment. Controlling for the earnings effects of working part-time or only part of a year reduces the differences—then, on average, contingent workers earn 16.7 percent less per week and 12.9 percent less per year than standard workers.
• Differences in earnings vary by industry and occupation. Within some industries and occupations, contingent workers earned significantly less than standard workers regardless of the earnings measure (annual, weekly, or hourly), while other industries and occupations had fewer significant differences between contingent and standard workers. For example, contingent workers in the education industry and the transportation and material moving occupation earned significantly less annually, weekly, and hourly than similar standard workers. In contrast, in the construction industry and the construction and extraction occupation, only the difference in annual earnings was significant.
• In addition to lower earnings, contingent workers are also less likely to have work-provided benefits, such as retirement plans and health insurance. For example, contingent workers are about two-thirds less likely than standard workers to have a work-provided retirement plan.
• While measures of poverty depend on a worker’s earnings as well as the earnings of other members of his or her family, contingent workers are more likely to report living in poverty and receiving public assistance than standard workers.
Concluding Observations
The current discourse on contingent employment is shaped to some extent by both a scarcity of some types of data and an overabundance of other types of data. The Contingent Work Supplement was last conducted a decade ago in 2005. Since that time, researchers and analysts have mined a number of alternative datasets that ask different survey questions. While these efforts may provide important insights about segments of the contingent workforce, they also have limitations that could make identifying emerging trends difficult. Understanding the limitations of the current data may stimulate interest among stakeholders in weighing the advantages versus the potential cost of collecting better information about contingent workers.
Our understanding of the contingent workforce is also shaped by the multiple definitions used to measure its size and characteristics. Current definitions of contingent employment typically highlight instability in scheduling and employment duration, and features of the employer-employee relationship to varying degrees, focusing on alternative employment arrangements such as those characterizing independent contractors, employees of temporary help agencies, and other groups. Each definition has its strengths but can lead to different conclusions about the scope of regulation and the degree of enforcement.

Page 7 GAO-15-168R Contingent Workforce
Nevertheless, despite the data constraints and multiple definitions, contingent employment remains an important concept for understanding the dynamics of the labor market. Even the narrower estimates generated by BLS suggest that millions of contingent workers are in the labor force. Our own work suggests that many of these contingent workers receive lower wages and benefits than workers in standard employment arrangements. Many questions remain as to whether contingent employment and alternative work arrangements are growing or evolving, about the impact of the recent recession and recovery on this segment of the labor force, and about the longer term implications of contingent employment arrangements for workers, employers, income equality, and economic growth. Information about contingent employment helps to determine whether the existing framework of labor market protections, predicated on traditional employer-employee relationships, will continue to be appropriate and adequate in the future.
Agency Comments
We provided copies of this draft report to the Department of Labor (DOL) and the Department of Commerce for review and comment. We also provided a copy of this draft to academic experts for additional external review. DOL, Commerce, and our external reviewers provided technical comments, which we incorporated in the report, as appropriate. DOL also provided formal written comments, which are reproduced in enclosure V. DOL generally agreed with our findings, stating that our report covered an essential component of the labor force and that understanding evolving trends in the structure of work is crucial. DOL noted that inconsistent definitions of contingent work make nuanced analysis difficult and that some data sources are less suited to tracking nonstandard work arrangements.
We agree that differing definitions of contingent work make analyzing the contingent workforce a challenge. These various definitions of, and approaches toward examining this segment of the labor force have different purposes. For example, as DOL noted, defining contingent work as short-term grows out of a concern about the rise of “disposable” or unstable jobs. Classifying jobs by the type of employer-employee relationship stems from a broader view of contingent work as incorporating other dimensions of employment instability beyond short duration, such as unpredictable shifts or hours and lack of access to employer-provided benefits. For these reasons, we analyzed a spectrum of data sources to depict the size and characteristics of the contingent workforce—as defined in the respective data sources—and also discussed some aspects of nonstandard work that do not cleanly fit into current definitions. While we agree that these other data sources are not designed to identify contingent workers in the same way as the CWS, they can add to an understanding of this segment of the workforce. For example, the General Social Survey identifies workers by various nonstandard work arrangements and includes information about employment experiences that were not covered in the last CWS.
As agreed with your office, unless you publicly announce its contents earlier, we plan no further distribution of this report until 30 days from its issue date. At that time, we will send copies of this report to of this report to the appropriate congressional committees, the Secretary of the Department of Commerce, the Secretary of the Department of Labor, and other interested parties. In addition, the report is available at no charge on the GAO website at http://www.gao.gov.
If you or your staff members have any questions about this report, please contact me at (202) 512-7215 or [email protected]. Contact points for our Offices of Congressional Relations and

Page 8 GAO-15-168R Contingent Workforce
Public Affairs may be found on the last page of this report. GAO staff members who made key contributions to this report are listed in enclosure VI.
Charles A. Jeszeck Director, Education, Workforce, and Income Security Issues
Enclosures – 6
Enclosure I
Page 9 GAO-15-168R Contingent Workforce
Background Comprehensive, nationally representative data on contingent workers have not been collected since 2005. Such data were first collected in 1995 when the Bureau of Labor Statistics (BLS) introduced the Contingent Work Supplement (CWS) to the Current Population Survey (CPS), which is a monthly survey of about 60,000 households that, in part, collects data on the U.S. labor force. The CWS asked a series of additional questions about workers’ employment, including whether their jobs were contingent. The supplement has been administered five times: in 1995, 1997, 1999, 2001, and 2005. According to agency officials, BLS receives many requests for data on contingent workers. BLS has requested funding each year from 2012 forward to conduct the CWS but has not received funding to administer the supplement in recent years. In its fiscal year 2016 budget request, BLS asked for funding to conduct the CWS every 2 years.
In our prior work, we reported that key worker protection laws generally apply to employees and therefore do not apply to independent contractors, self-employed workers, and contingent workers who are not classified as employees.13 Even for contingent workers who are employees, other factors, such as length of employment and hours worked per year, may affect whether or to what extent they are covered under some of these laws. For brief descriptions of key worker protection laws, see enclosure III. In addition, while employers may voluntarily offer benefits such as retirement plans, they may choose to not offer them to employees whose link to them is tenuous (e.g., workers hired on a temporary basis).14
When benefits and protections for such workers are not available, some government officials and labor analysts are concerned that contingent employment relationships may have long-term adverse consequences for workers and government programs. If contingent workers do not receive work-provided health or retirement benefits, or do not qualify for workers’ compensation or unemployment, they may turn to needs-based programs such as Medicaid or the Supplemental Nutritional Assistance Program (formerly known as the federal Food Stamp Program). To the extent that this occurs, costs formerly borne by employers and employees may be shifted to federal and state public assistance programs.
This briefing discusses the size, characteristics, and earnings of contingent workers through our analysis of different data sources.
12 We also reviewed published findings from the National Day Labor Survey for their context on that segment of the contingent workforce. However, we did not use this as a data source because it was a one-time survey conducted in summer 2004, prior to the most recent CWS. Abel Valenzuela, et. al., “On the Corner: Day Labor in the United States” (January 2006). 13 GAO, Contingent Workers: Incomes and Benefits Lag Behind Those of Rest of Workforce, GAO/HEHS-00-76 (Washington, D.C.: June 30, 2000), and GAO, Employer Arrangements: Improved Outreach Could Help Ensure Proper Worker Classification, GAO-06-656 (Washington, D.C.: July 11, 2006). 14 Laws, such as the Patient Protection and Affordable Care Act (PPACA), may also affect decisions about offering and participating in benefits such as health insurance.
Data Sources Analyzed We analyzed data from the following national sources:
• CPS basic household survey, various months and years
• CPS Contingent Work Supplement, 1995, 1999, 2005
• CPS Disability Supplement, 2012
• CPS Annual Social and Economic Supplement, 2012
• Current Employment Statistics (CES), various years
• Occupational Employment Statistics (OES), various years
• General Social Survey (GSS) by NORC at the University of Chicago, 2006 and 2010
• Survey of Income and Program Participation (SIPP), 2004 and 2008
We did not use other sources of data on contingent workers, such as those developed by private researchers or industry groups, and state-level data. Our analyses focused on relatively recent, nationally-representative data.12
Use of Contingent Workers Employers may hire contingent workers to accommodate workload fluctuations, meet employees’ requests for part-time hours, screen workers for permanent positions, and save on wage and benefit costs, among other reasons. Workers take contingent jobs for a variety of reasons, both by choice and out of necessity.
Contingent Workforce
Background

Page 10 GAO-15-168R Contingent Workforce
Enclosure I
Estimates of the size of the contingent workforce depend on the definition of contingent work and the data source. As noted in our prior work, labor experts generally agree that contingent workers may share certain characteristics, such as a lack of job security.15
However, there is a lack of consensus on how to define contingent work, in part because researchers focus on different aspects of the labor market. Some definitions focus on job tenure or the precariousness of work, while some focus on employer-employee relationships. Available data thus produce varying estimates of the size of this workforce, depending on definition. Available data also do not fully enable analysis of trends in the size of the contingent workforce or the effects of economic cycles, such as the recent recession.
BLS-Defined Contingent Workers in the CWS BLS defines contingent workers as those without “an explicit or implicit contract for long-term employment” and applies this definition in the CWS, in part, by identifying those who view their jobs as temporary. BLS developed three successively broader contingent workforce estimates by applying its definition in different ways (see sidebar and table 1).
Table 1: BLS-Defined Contingent Workers in the Contingent Work Supplement
BLS-defined contingent workers (percent of employed labor force) 1995 1999 2005 Estimate 1 2.2 (+/- 1.0) 1.9 (+/- 1.1) 1.8 (+/- 1.1) Estimate 2 2.8 (+/- 1.0) 2.3 (+/- 1.1) 2.3 (+/- 1.1) Estimate 3 4.9 (+/- 1.0) 4.3 (+/- 1.1) 4.1 (+/- 1.0)
Source: GAO analysis of data from the 1995, 1999, and 2005 Contingent Work Supplements to the Current Population Survey. | GAO-15-168R
The CPS Disability Supplement (released only once in May 2012) asked all employed respondents an essentially identical temporary work question as in the CWS. These data offer a more recent comparison, albeit only of workers who view their jobs as temporary (see table 2). BLS excludes some of these workers from its contingent workforce estimates.
Table 2: Workers Describing Their Work as Temporary in 2005 and 2012 Surveys
Temporary job Employed labor force 2005 Contingent Work Supplement [self-employed not included – not asked if job was temporary]
5.15 million (+/- 0.28) 138.95 million (+/- 0.78)
2012 Disability Supplement 6.31 million (+/- 0.29) 143.14 million (+/- 0.25) Self-employed excluded (comparable to 2005) 5.40 million (+/- 0.27)
Source: GAO analysis of data from the 2005 Contingent Work and 2012 Disability Supplements to the Current Population Survey. | GAO-15-168R Note: The self-employed were not asked the temp work question in the CWS, but were in 2012; data are limited to workers age 16+.
15 GAO/HEHS-00-76.
Identifying Contingent Workers in the CWS If workers respond “yes” to the first temporary work screening question in the CWS or “no” to the second, they may be included in BLS’s definition of a contingent worker.
• Some people are in temporary jobs that last only for a limited time or until the completion of a project. Is your job temporary?
• Provided the economy does not change and your job performance is adequate, can you continue to work for your current employer as long as you wish?
BLS excludes some of these workers from its varying contingent workforce estimates due to the length of their employment or for other reasons, such as their anticipated departure from a job for personal reasons in which they otherwise could have stayed (see enclosure II for more information about workers who are excluded). BLS also identifies additional workers with other CWS questions, for instance, those who do not view their jobs as temporary but who have been and expect to be at their jobs for 1 year or less.
BLS’s three estimates of the contingent workforce successively include more workers by adding the self-employed and independent contractors and by relaxing time requirements for a job’s duration and tenure with an employer (see enclosure II for full descriptions of who is included in each estimate).
Note: Estimates are shown at the 95 percent level of confidence, unless otherwise noted.
Contingent Workforce
Size Varies by Definition and Data Source BLS Definition Focuses on Temporary Nature of Work

Page 11 GAO-15-168R Contingent Workforce
Enclosure I
GAO-Identified Alternative Work Arrangements in the CWS While BLS defines and identifies contingent workers based on the temporary nature of their employment, other approaches focus more broadly on the structure of employer-employee relationships. According to the Department of Labor’s Wage and Hour Division, an important dimension of contingent work concerns the nature of business relationships, such as independent contracting and agency temp work. Our prior work used the CWS to identify eight types of alternative work that could be considered contingent under such definitions (see sidebar).17
Estimates of the contingent workforce that include all alternative work arrangements, such as those presented in our prior work, have many more workers than those identified by BLS’s definition. For example, in prior work, we identified 42.6 million (+/- 0.7) workers in alternative work arrangements in the 2005 CWS, while the broadest BLS definition estimated 5.7 million (+/- 0.3) contingent workers. In addition, these groups of workers remained relatively constant in proportion to the total employed labor force between 1995 and 2005 (see table 3).
Table 3: Contingent Share of Employed Labor Force by Alternative Work Arrangements Identified by GAO and BLS Estimates, 1995-2005
1995 1999 2005 Employed labor force (in thousands) 123,208
(+/- 571) 131,494
(+/- 645) 138,952
(+/- 775) Workers in alternative arrangements (percent) 32.2 29.9 30.6 (+/- 0.9)
Agency temps 1.0 0.9 0.9 (+/- 1.1) Direct-hire temps 2.8 2.5 2.1 (+/- 1.1) On-call workers and day laborers 1.6 1.7 2.0 (+/- 1.1) Contract company workers 0.5 0.6 0.6 (+/- 1.1)
Core contingent sub-total 5.9 5.7 5.6 (+/- 1.0) Independent contractors 6.7 6.3 7.4 (+/- 1.0) Self-employed workers 5.9 4.8 4.4 (+/- 1.0) Standard part-time workers 13.6 a 13.2 13.2 (+/- 1.0)
BLS-defined contingent workers (estimate 1) 2.2 (+/- 1.0) 1.9 (+/- 1.1) 1.8 (+/- 1.1) BLS-defined contingent workers (estimate 2) 2.8 (+/- 1.0) 2.3 (+/- 1.1) 2.3 (+/- 1.1) BLS-defined contingent workers (estimate 3) 4.9 (+/- 1.0) 4.3 (+/- 1.1) 4.1 (+/- 1.0)
Source: GAO analysis of data from the 1995, 1999, and 2005 Contingent Work Supplements to the Current Population Survey; 1995 and 1999 alternative arrangements from GAO-06-656. | GAO-15-168R Note: Alternative arrangement proportions may not add up to total due to rounding. Data for alternative arrangements from 1995 and 1999 are from a prior GAO report (GAO-06-656), which did not report confidence intervals for individual percentage estimates. Percentage estimates were reported as within +/- 1 percentage point; core contingent for those years are sums of included categories. a
16 There is less agreement about independent contractors, the self-employed, and standard part-time workers, many of whom choose those arrangements and may have long-term employment stability.
Part-time workers who are not already included in one of the other alternative work arrangements.
17 GAO/HEHS-00-76; GAO-06-656. BLS has used the CWS to identify and analyze workers in certain alternative work arrangements; our prior work included these and others identified in the CWS.
Alternative Arrangements • Agency temps: Work for
agencies who assign them to work for other companies
• Contract company workers: Work for companies providing services to firms under contract
• Day laborers: Picked up by employers to work for the day
• Direct-hire temps: Hired directly by companies to work for a specified period of time
• Independent contractors: Obtain customers on their own to provide a product or service
• On-call workers: Called to work on an as-needed basis
• Self-employed workers: Non-wage and salary workers who are not self-identified as independent contractors (e.g., restaurant and shop owners)
• Standard part-time workers: Regularly work fewer than 35 hours a week and not already included in an above group
Core Contingent Workers Labor experts have not reached consensus on which arrangements represent contingent work. Many agree that workers who lack job security and those with variable or unpredictable work schedules should be included in the core definition of contingent. We use the term “core contingent” workforce to refer to such arrangements (e.g., agency temps, direct-hire temps, contract company workers, on-call workers, and day laborers).16
Note: Estimates are shown at the 95 percent level of confidence, unless otherwise noted.
Contingent Workforce
Definitions that Focus on Alternative Work Arrangements Include Many More Workers than BLS’s Definition

Page 12 GAO-15-168R Contingent Workforce
Enclosure I
Alternative Work Arrangements in the General Social Survey The General Social Survey (GSS) collects information about alternative work arrangements similar to those identifiable in the CWS.18
Based on our analysis of the 2010 GSS, the most recent data available, we estimated that 40.4 percent of the employed labor force was in alternative work arrangements; 7.9 percent was in core contingent arrangements—as contract company workers, on-call workers, and agency temps (see table 4).
Table 4: Alternative Work Arrangements in the General Social Survey (Estimated Percent of Total Employed Labor Force), 2006 and 2010
Alternative work arrangements (percent of employed labor force) 2006 2010 Agency temps 0.9 (+/- 0.6) 1.3 (+/- 1.0) On-call workers 2.5 (+/- 1.0) 3.5 (+/- 1.4) Contract company workers 3.6 (+/- 1.3) 3.0 (+/- 1.1)
Core contingent subtotal 7.1 (+/- 1.6) 7.9 (+/- 1.7) Independent contractors 13.5 (+/- 2.0) 12.9 (+/- 2.5) Self-employed workers 2.8 (+/- 1.4) 3.3 (+/- 1.2) Standard part-time workers 11.9 (+/- 2.0) 16.2 (+/- 2.9) Alternative work arrangement total 35.3 (+/- 2.6) 40.4 (+/- 3.8)
Source: GAO analysis of data from the 2006 and 2010 General Social Surveys. | GAO-15-168R Note: Alternative arrangement proportions may not add up to total due to rounding.
While the estimated proportion of the employed labor force in alternative work arrangements grew from 35.3 percent to 40.4 percent between 2006 and 2010 based on GSS data, most of this growth was estimated in standard part-time jobs (see table 4). We do not know from the GSS data who among standard part-time workers are “involuntary”—those who work part-time due to economic reasons, such as an inability to obtain full-time employment. However, this overall growth in part-time workers may be a result of the 2007-2009 recession. Using other data, we examine the rise in part-time work in our section in this report on worker characteristics. In addition, the proportion of workers employed in core contingent arrangements remained relatively constant.
18 The GSS question about work arrangements does not specify self-employed and part-time workers as separate from regular permanent workers. We identified those two work arrangements from other questions in the GSS to mirror the arrangements identified in the CWS (see enclosure II).
About the GSS Administered by NORC at the University of Chicago, the GSS categorizes respondents by work arrangement in its Quality of Working Life survey module. Provided funding continues, NORC plans to continue the module. The 2014 GSS data, including the Quality of Working Life module, were released in March 2015, after our analysis was complete.
Categorizing Work Arrangements in the GSS We identified work arrangements in the GSS (see table 4) primarily from responses to the question, “How would you describe your work arrangement in your main job?” Responses include:
• “I work as an independent contractor, independent consultant, or freelance worker.”
• “I am on-call, and work only when called to work.”
• “I am paid by a temporary agency.”
• “I work for a contractor who provides workers and services to others under contract.”
• “I am a regular permanent employee (standard work arrangement).”
Among those asked the question, but not classified as alternative (i.e., standard, or non-response), we used other GSS questions to identify self-employed and part-time workers (see enclosure II).
Note: Estimates are shown at the 95 percent level of confidence, unless otherwise noted.
Contingent Workforce
Some Data Show Alternative Workers at 40 Percent of the Labor Force, with Core Contingent Workers at 8 Percent

Page 13 GAO-15-168R Contingent Workforce
Enclosure I
Summary Comparison of Alternative Work in the CWS and GSS As roughly comparable surveys (see sidebar), the 2005 CWS and 2006 GSS each categorized about one third of employed respondents in alternative arrangements—30.6 percent and 35.3 percent, respectively (see fig. 1). The types of work that we label core contingent also represented similar proportions—5.6 percent of employed respondents in the 2005 CWS and 7.1 percent of those in the 2006 GSS (see fig. 1).
Figure 1: Alternative Work Arrangements in the 2005 Contingent Work Supplement (CWS) and 2006 General Social Survey (GSS)
Note: Proportions may not add up to 100 percent due to rounding. Each estimate has a 95 percent confidence interval of within +/- 3.0 percentage points. a
Core contingent includes agency temps, direct-hire temps, contract company workers, on-call workers, and day laborers.
In both datasets, most workers in alternative arrangements are standard part-time or independent contractors. In addition, the proportions comprised of agency temps and on-call workers—with day laborers combined in the CWS—also appear similar in both.
Although the types of work that we label core contingent represented similar proportions in both the 2006 GSS and the 2005 CWS, and thus either source could be used to similarly track the size of this workforce segment over time, the GSS has smaller samples and asks less detailed questions about employment. For example, the GSS does not collect information that would be needed to determine the size of the contingent workforce according to other definitions, such as the three BLS estimates based on the temporary nature of employment. In addition, having comparable GSS data for only 2 recent years (2006 and 2010) and its collection at such long intervals limits its ability to illustrate current trends in the size of this workforce.
CWS and GSS Survey Structure Comparison The CWS and GSS both sample populations representative of the national employed labor force and thus their distributions of work arrangements are comparable in the aggregate. However, the structure of their surveys and their results differ.
• The CWS surveys a larger sample than the GSS.
• The CWS is designed to measure specific labor force characteristics and to generate estimates of proportions and population totals, among other things. While the GSS includes questions related to employment and work experiences and can estimate proportions of certain labor force characteristics, it is not specifically designed to measure population totals.
• Both surveys rely on respondents’ interpretations of their employment type, but work arrangements do not entirely align because the questions asked are different. For example, the GSS does not ask detailed questions that could identify direct-hire temps as distinct from workers in other alternative arrangements.
Limitation of Comparisons Due to the above differences, it is not possible to compare the exact sizes of individual groups of workers between the CWS and GSS.
Note: Estimates are shown at the 95 percent level of confidence, unless otherwise noted.
Contingent Workforce
Two Prior Surveys Suggest Similar Proportions of Workers Were in Alternative and Core Contingent Arrangements

Page 14 GAO-15-168R Contingent Workforce
Enclosure I
Other Measures of the Contingent Workforce While the CWS and GSS both include a range of work arrangements, other sources identify contingent or alternative work differently and, in some cases, offer more detailed information over time about certain types of workers.
Other Measures: SIPP Currently available data from Census’ Survey of Income and Program Participation (SIPP) identify workers as contingent if they are in alternative work arrangements without a definite agreement to work on an ongoing basis (see sidebar).19
Using this classification, we estimated that the contingent workforce in SIPP represented 1.1 percent (+/- 0.1) of the total employed labor force at the beginning of the 2004 survey panel and 1.3 percent (+/- 0.1) at the beginning of the 2008 survey panel, the most recent available. Differences between survey structures (e.g., question wording) explain why estimates from SIPP are lower than BLS’s estimates in the CWS. For example, to be categorized as working in an alternative work arrangement in SIPP, respondents would have to answer that they did not work for an employer. However, in the CWS, workers categorized as contingent under BLS’s definitions would potentially self-identify in SIPP as working for an employer (e.g., contingent workers employed by a temp agency).
Unlike CWS and GSS, SIPP does not ask about specific work arrangements (e.g., on-call or company contract workers). Rather, SIPP asks if respondents work for an employer, are self-employed, both, or are in some other arrangement—defined as including odd jobs, on-call work, day labor, one-time jobs, and informal arrangements, such as babysitting, lawn mowing, or leaf raking for neighbors.
19 SIPP identifies contingent workers with variables that track whether respondents work for an employer, are self-employed, both, or are in some other arrangement, and if they have a definite arrangement with an employer to work on an ongoing basis (see enclosure II).
About SIPP The Census Bureau (Census) administers SIPP as a nationally-representative longitudinal survey—the 2008 panel is the most recent completed survey. Census redesigned SIPP for the 2014 survey panel. According to officials, the 2014 data will flag jobs as contingent, as opposed to workers. However, researchers will be able to use survey responses (to the same work questions used in prior panels) to categorize workers according to their own criteria. Census officials stated that the redesign will also allow researchers to better identify individuals who move between contingent work, regular work, and non-work and also identify those who hold multiple jobs where the secondary job may be irregular or temporary.
Note: Estimates are shown at the 95 percent level of confidence, unless otherwise noted.
Contingent Workforce
Other Data Define Contingent Workers Differently: SIPP Counts Those in Temporary, Alternative Arrangements

Page 15 GAO-15-168R Contingent Workforce
Enclosure I
Other Measures: CES and OES Employment statistics data provide different information about the size of one segment of the contingent workforce. BLS’s Current Employment Statistics (CES) and Occupational Employment Statistics (OES) surveys measure the number of jobs and distribution of occupations within industries, respectively. While these datasets are not structured according to definitions of contingent work, temporary help services (i.e., agency temps)—a segment of the contingent workforce—is one of the industries covered. According to CES data, the temporary help industry represented 2.77 million (+/- 0.15) jobs in 2014. Temporary help employment in the CES cannot be compared directly to the CWS because, in part, the CES counts the number of jobs whereas the CWS counts workers. Thus, a worker holding multiple jobs would be counted multiple times in the CES, but only once in the CWS.20
Despite minimal coverage of alternative work arrangements and lack of comparability with the CWS, the monthly CES data enable analysis of trends over time and show how temporary help employment fluctuates with conditions in the overall economy (see sidebar). While the number of temporary help jobs has varied over the past two decades, the industry has remained a relatively consistent proportion of the employed labor force (nonfarm)—roughly 1.5 to 2.0 percent of jobs (see fig. 2).
For example, in 2005, the temporary help industry represented 2.55 million (+/- 0.08) jobs in the CES, while the CWS identified 1.22 million (+/- 0.14) temp agency workers.
Figure 2: Temporary Help Services Industry as a Percentage of Total Nonfarm Employment
Note: Each estimate has a 95 percent confidence interval of within +/- 0.2 percentage points. This confidence interval is based on the largest standard error reported from 2003-2014 because comparable pre-2003 standard errors were not available.
CES data also show that employment swings in temporary help are cyclical; job numbers decrease during recessions at a higher rate than overall employment, and grow faster in recoveries (see enclosure II).
20 For more information about survey differences, see Mary Bowler and Teresa L. Morisi, “Understanding the Employment Measures from the CPS and CES Survey,” Monthly Labor Review (February 2006): 23-38.
About CES and OES The CES and OES surveys collect data from employers, including job counts by and within industries, respectively. The CES includes monthly data on employment and the OES publishes data annually from employer surveys conducted over a 3-year cycle.
Because of its more frequent data collection, the CES more fully captures how populations of workers respond to economic trends, such as recession cycles. For example, contingent workers could be more vulnerable to downsizing than standard workers because they lack long-term arrangements. In contrast, periodic surveys such as the CWS and GSS provide detailed snapshots of workforce size and composition at a single point in time only.
Industry Collected Data Some industry groups, such as the American Staffing Association (ASA) and the Society for Human Resource Management, conduct surveys of member organizations about issues related to contingent workers. For example, one ASA survey on temporary help employment reports job numbers that are somewhat similar to those reported in CES data. However, the opt-in nature of the survey sample (i.e., non-random selection of respondents) means the data may not accurately represent the target population of workers. Other ASA surveys on temporary help workers raise similar methodological concerns.
Note: Estimates are shown at the 95 percent level of confidence, unless otherwise noted.
Contingent Workforce
Other Data Identify Segments of Contingent Workforce: BLS Employment Data Count Temporary Staffing Jobs

Page 16 GAO-15-168R Contingent Workforce
Enclosure I
Other Concepts of Contingent Work without Data Measures Some labor experts and federal agencies focus on forms of employment instability that do not fully align with traditional definitions of contingent work. For example, recent reports by the National Employment Law Project (NELP) have explored domestic outsourcing, including business practices such as franchising,22
Traditional definitions of contingent work may include workers in these situations, but some may also be considered standard full-time workers. For example, according to one labor expert, hourly jobs identified as full-time do not always provide full-time hours, and turnover rates in some permanent jobs are so high they are essentially temporary. Current data are not configured to identify or count workers by their job characteristics, such as schedule variability or layers of subcontracting. According to WHD officials, work relationships they consider fissured that are not currently captured in data may illustrate additional dimensions of contingent work. Alternative arrangements are dynamic and capturing emerging issues in survey data is a challenge. One expert we talked to said she and her colleagues had worked with BLS to add questions on scheduling practices to the National Longitudinal Survey of Youth, but noted this was the first time such questions had been asked nationally. In 1989, BLS recommended unpredictable variability in minimum work hours as a defining trait of contingent work.
contracting, using agency temps, and the misclassification of employees as independent contractors (see sidebar). Domestic outsourcing can change an employee’s formal status or create a tenuous status within standard employment. While some of these workers may be identified as contingent in data sources, others may be counted as standard full-time workers even though they face increased employment instability in some form. Other experts have recently explored scheduling issues, such as variability in work hours and unpredictable shifts, as well as emerging venues for temporary work, such as online clearinghouses for obtaining ad hoc jobs. The Department of Labor’s Wage and Hour Division (WHD) is currently focused on the concept of fissuring, in which employment models like those above attempt to obscure or eliminate the link between the worker and the business (see sidebar). According to WHD, companies are increasingly relying on various contingent workforce solutions, which can lead to violations of worker protection laws.
23
21 Catherine Ruckelshaus, Rebecca Smith, Sarah Leberstein, and Eunice Cho, “Who’s the Boss: Restoring Accountability for Labor Standards in Outsourced Work,” NELP (May 2014).
BLS staff stated this concept was not used in the CWS because it was not viewed as the foremost characteristic of contingent work and it is difficult to design questions that capture it.
22 Franchising can be seen as a form of outsourcing in that an employer (the franchisor) inserts an intermediary (the franchise holder, or franchisee) between itself and the workers and designates the franchisee as the workers’ sole “employer” (e.g., companies that franchise their businesses to another, such as in the fast-food industry). The franchisor may impose controls that make it difficult for the franchisee to pay workers fairly or provide stable work schedules. 23 Anne E. Polivka and Thomas Nardone, “The Quality of Jobs: On the Definition of ‘Contingent’ Work,” Monthly Labor Review (December 1989): 11.
NELP on Outsourcing A 2014 report by NELP profiled industries in which domestic outsourcing is prevalent, such as retail, hospitality, janitorial services, home health care, and the public sector.21
While NELP observed that some companies outsource to increase their efficiency or for other business purposes, jobs in industries with high levels of outsourcing are characterized by lower pay, greater uncertainty in hours and schedules, and according to the report, higher rates of violations of workplace laws. NELP stated that this leads to economic distress for families and communities.
Fissuring According to WHD, the increasingly common practice of fissuring (also referred to as distancing) is characterized by business models that obscure, or eliminate entirely, the link between the worker and the employer. The agency’s 2015 budget justification states that such models which attempt to shield employers from responsibility for working conditions have increased the number of vulnerable workers with reduced protections.
WHD describes fissuring as a key enforcement challenge, as these business practices are associated with a high incidence of wage and hour violations. The agency’s enforcement strategy focuses on compliance and on priority industries including construction, hospitality, and janitorial services.
Note: Estimates are shown at the 95 percent level of confidence, unless otherwise noted.
Contingent Workforce
Traditional Definitions of Contingent Work Do Not Capture All Forms of Employment Instability

Page 17 GAO-15-168R Contingent Workforce
Enclosure I
In our analysis of GSS and CWS data, we found differences between standard and contingent workers in terms of their characteristics and employment experiences. Particularly, we observed key differences in demographics, job stability, and job satisfaction. While differences in areas such as job stability are generally consistent with what would be expected given definitions of contingent work, our findings quantify and show the magnitude of these differences.
Demographics: Core Contingent and Standard Full-time We examined demographics in the 2010 GSS data and found that compared to standard full-time workers, core contingent workers appeared to be younger, more often Hispanic, and less educated. For example, the proportion of core contingent workers that reported they had not completed high school was four times that of standard full-time workers (see table 5). See enclosure IV for a full listing of the demographic characteristics of contingent workers in the 2010 GSS.
Using 2005 CWS data to examine the demographic characteristics of workers in alternative work arrangements, our prior work reported that contingent workers are diverse.25
We further examined core contingent workers and found differences between them and standard full-time workers similar to those found in the 2010 GSS. Core contingent workers in the 2005 CWS were more likely to be Hispanic and the proportion that reported they had not completed high school was almost double that of standard full-time workers (see table 5). See enclosure IV for a full listing of contingent worker demographics in the 2005 CWS.
Table 5: Selected Demographic Differences for Core Contingent and Standard Full-Time Workers, 2010 General Social Survey and 2005 Contingent Work Supplement
Mean age
(years) Hispanic (%
of pop.) No high school
degree (% of pop.) 2010 General Social Survey
Core contingent 40.7 (+/- 3.6) 29.2 (+/- 13.5) 30.8 (+/- 13.0) Standard full-time 41.9 (+/- 1.0) 13.0 (+/- 5.4) 7.7 (+/- 3.4)
2005 Contingent Work Supplement Core contingent 37.4 (+/- 0.7) 18.6 (+/- 4.3) 17.4 (+/- 4.1) Standard full-time 40.8 (+/- 0.2) 13.8 (+/- 1.3) 9.2 (+/- 1.2)
Source: GAO analysis of data from the 2005 Contingent Work Supplement to the Current Population Survey and from the 2010 General Social Survey. | GAO-15-168R Note: Core contingent includes agency temps, direct-hire temps, contract company workers, on-call workers, and day laborers.
24 Because of the GSS sample size, our analyses focused on five groups of workers: (1) standard full-time, (2) standard part-time, (3) self-employed, (4) independent contractors, and (5) core contingent, which was a combined group consisting of on-call, temporary agency, and company contract workers. 25 GAO/HEHS-00-76; GAO-06-656.
Focus on Core Contingent GSS data provide more recent information on worker characteristics than CWS data and offer unique information about employment experiences, such as job stability and satisfaction. However, while the 2010 GSS sample size was large enough to produce reliable estimates of alternative worker populations, it was too small to reliably analyze worker characteristics and experiences for each alternative work arrangement. Thus, we generally focused these analyses on core contingent workers rather than each individual alternative work arrangement, such as agency temps.24
Core contingent workers, as we defined previously, include agency temps, direct-hire temps, contract company workers, on-call workers, and day laborers. The GSS does not identify direct-hire temps or day laborers as separate work arrangements.
We were also unable to analyze the GSS data at the occupation and industry levels.
Other Demographics In the 2010 GSS, an estimated:
• 16.3 percent (+/- 10.5) of core contingent workers had at least some college education compared to 44.6 percent (+/- 4.8) of standard full-time workers.
• 61.5 percent (+/- 12.6) of core contingent workers and 47.7 percent (+/- 4.4) of standard full-time workers were men.
Note: Estimates are shown at the 95 percent level of confidence, unless otherwise noted.
Contingent Workforce
Characteristics and Employment Experiences Differ Core Contingent Workers Are Younger and Less Educated

Page 18 GAO-15-168R Contingent Workforce
Enclosure I
Low Family Income Across Worker Groups While family income may be affected by many factors (see sidebar), core contingent workers are generally more likely to report low family incomes than standard full-time workers. As we observed in prior work, the percentage of workers reporting low family income in the 2005 CWS varied considerably by work arrangement.27
While family income estimates from the GSS vary somewhat from those in the 2005 CWS for specific work arrangements, they similarly show that core contingent workers are more likely to report low family incomes than standard full-time workers. Both the 2006 and 2010 GSS estimated that the proportion of core contingent workers who reported low family income was about three times greater than the proportion of standard full-time workers—23.2 percent versus 7.7 percent, and 33.1 percent versus 10.8 percent, in 2006 and 2010, respectively (see table 6).
The incidence of low family income ranged from 7.6 percent for self-employed workers to 28.4 percent among agency temps (see table 6). Despite this variation, core contingent workers were more likely to report low family income than standard full-time workers—19.8 percent compared to 8.3 percent (see table 6).
Table 6: Estimated Percentage of Workers with Family Incomes Below $20,000 in the 2005 Contingent Work Supplement and the 2006 and 2010 General Social Surveys
Family income below $20,000 a Work arrangement 2005 CWS 2006 GSS 2010 GSS Total workforce 10.5 (+/- 1.1) 10.7 (+/- 2.1) 15.3 (+/- 3.4) Standard full-time workers 8.3 (+/- 1.3) 7.7 (+/- 2.1) 10.8 (+/- 3.2) Core contingent subtotal 19.8* (+/- 4.3) b 23.2* (+/- 12.5) 33.1* (+/- 11.3)
Agency temps 28.4* (+/- 10.0) --- --- Direct-hire temps 18.0* (+/- 7.1) --- --- On-call workers and day laborers 20.8* (+/- 7.2) --- --- Contract company workers 10.8 (+/- 13.3) --- ---
Independent contractors 10.8 (+/- 4.0) 8.5 (+/- 5.0) 18.8* (+/- 7.7) Self-employed workers 7.6 (+/- 5.4) 5.7 (+/- 12.2) --- Standard part-time workers 18.7* (+/- 2.8) 24.0* (+/- 7.4) 19.5* (+/- 7.7)
Source: GAO analysis of data from the 2005 Contingent Work Supplement to the Current Population Survey and from the 2006 and 2010 General Social Surveys. | GAO-15-168R
Note: Dashes indicate that the sample size was too small to compute reportable estimates. * Statistically different from standard full-time at 95 percent confidence level. a We used a threshold of $20,000 (not in constant dollars) for all 3 years. Inflating $20,000 in 2005 constant dollars resulted in 2006 and 2010 nominal dollar values of $20,615 and $22,009, respectively. Because the GSS income variable we used allowed us to draw a cut-off at $20,000 or $25,000, we rounded down to $20,000 for our comparisons. The CWS and GSS percentages in this table are based on valid responses only; not all workers reported their family incomes. b
26
Core contingent includes agency temps, direct-hire temps, contract company workers, on-call workers, and day laborers.
GAO-06-656. 27 GAO-06-656.
Factors Affecting Income Family income is defined in the CWS as the combined income of all family members age 15 years or older from jobs; net income from businesses, farms, and rent; pensions; dividends; interest; Social Security payments; and any other income.
Family income in the GSS is defined simply as total family income, from all sources, before taxes.
Family members may include standard full-time workers. The characteristics of employment of all family members may affect income levels.
As reported in our prior work, the relatively high incidence of low family income among some groups of contingent workers may reflect, among other things, lower levels of educational attainment, lower number of hours worked, or employment in low-wage sectors of the economy.26
Note: Estimates are shown at the 95 percent level of confidence, unless otherwise noted.
Contingent Workforce
Core Contingent Workers Are More Likely to Report Low Family Income

Page 19 GAO-15-168R Contingent Workforce
Enclosure I
Occupations of Contingent Workers Information on the distribution of contingent workers by occupation is limited without the CWS, which afforded analysis of changes in the occupational makeup of this workforce through 2005 (see sidebar).
Meanwhile, OES data show shifts in the occupational distribution of workers in staffing services.29 According to one study, the distribution of blue collar (see sidebar) and office and administrative occupations within this industry reversed completely between 1990 and 2001. In 1990, office and administrative support workers constituted 41.8 percent of those in staffing services, and blue collar workers made up 27.8 percent. By 2001, blue collar workers peaked at 52.6 percent and office and administrative support was at 24.0 percent (see fig. 3).30
To put these shifts in context, CES data on employment by industry show that over this period the number of staffing services workers generally grew through 2000, then fluctuated in later years. For example, CES data estimated 1.5 million staffing services workers in 1990, 3.8 million in 2000, 3.5 million in 2001, and 2.5 million in 2009.
31
Figure 3: Estimated Percentage of Staffing Services Workers, by Occupation Type
Note: The totals for each year—across occupation groups—may not add up to 100 percent due to rounding. Each estimate has a 95 percent confidence interval of within +/- 1.0 percentage points. This confidence interval is based on the largest standard error reported from 1996 onward because standard errors for 1990 were not available (see enclosure II).
28 GAO/HEHS-00-76; GAO-06-656. GAO-06-656 did not report confidence intervals for individual percentage estimates. Percentage estimates were reported as within +/- 1 percentage point. 29 According to current industry classifications, the staffing services (i.e., employment services) industry consists of: (1) temporary help services; (2) professional employer organizations; and (3) employment agencies and executive search services. Temporary help is by far the largest, with 81 percent of industry employment in the 2014 CES data. 30 Matthew Dey, Susan N. Houseman, and Anne E. Polivka, “Manufacturers’ Outsourcing to Staffing Services,” ILRReview (July 2012). Remaining workers were in other occupations, such as healthcare. 31 Each estimate has a 95 percent confidence interval of within +/- 7.5 percentage points. This confidence interval is based on the largest standard error reported from 2003-2014 because comparable pre-2003 standard errors were not available (see enclosure II).
Occupations in the CWS Previously reported estimates from the CWS show changes in the distribution of occupations among groups of contingent workers. For example, a larger proportion of agency temps worked in transportation and material moving in 2005 than in 1999 (an estimated 13 percent versus 2 percent, respectively).28
Blue Collar Occupations The study defined blue collar occupations as production; transportation and material moving; helpers, laborers, and hand material movers; installation, maintenance, and repair; construction; extraction; and supervisors of production, construction, and maintenance workers.
Occupations in the Temporary Help Industry Starting in 1999, data were available for workers in the temporary help services industry (a subpopulation of staffing services) and the study found similar patterns as for staffing services (e.g., more workers in blue collar occupations than office and administrative in 2001 with the proportion of workers in both groups declining slightly thereafter).
Note: Estimates are shown at the 95 percent level of confidence, unless otherwise noted.
Contingent Workforce
Proportion of Staffing Services Workers in Blue Collar Occupations Increased Substantially in the 1990s

Page 20 GAO-15-168R Contingent Workforce
Enclosure I
Employment Experiences: Security, Satisfaction, and Safety In addition to differing from standard full-time workers on demographics and family income, contingent workers also have different employment experiences with job security, job satisfaction, and workplace safety.
Job Security: Transitions and Loss of Employment in the SIPP SIPP data can be used to illustrate the instability of contingent work because it tracks respondents’ employment each month over a multi-year period. A 2009 Census working paper examined the employment transitions of contingent workers, as defined by BLS (see sidebar), using 2004 SIPP data.32 Using the author’s results, we estimated that in 2004 about 11.7 to 16.2 percent of workers categorized as contingent in a given month either left the labor force or became unemployed in the following month, which could include workers who were laid off or quit voluntarily.33 About 66.3 to 79.5 percent remained in contingent work, and 8.8 to 19.4 percent moved into other work—in other words, standard employment (see table 7). In contrast, a 2004 Census report on labor force dynamics found relative stability in the employed labor force overall. Based on Census data from this report, we estimated that from 1996 through 1999 about 1.9 percent (+/- 0.2) of the employed labor force experienced job separation between any given two months.34
Despite the different timeframes, these results suggest contingent workers experience monthly job separation rates several times higher than those experienced by the overall employed labor force.
Table 7: Estimated Percentage of Contingent Workers by Employment Status in Following Month (Example Months, End of Calendar Quarters), 2004
In month after contingent work: Feb-Mar May-Jun Aug-Sep Nov-Dec Still employed in contingent work 79.5 (+/- 2.5) 66.3 (+/- 2.9) 66.4 (+/- 3.1) 72.1 (+/- 3.1) Employed instead in standard work 8.8 (+/- 1.7)
a 19.4 (+/- 2.4) 17.9 (+/- 2.5) 12.6 (+/- 2.3) Unemployed or not in labor force 11.7 (+/- 2.0) 14.3 (+/- 2.2) 15.7 (+/- 2.5) 15.3 (+/- 2.6)
Source: GAO analysis of data from Thomas Palumbo, "Using the Survey of Income and Program Participation (SIPP) to Measure Workers in Contingent and Alternative Employment Arrangements." | GAO-15-168R Note: Proportions may not add up to 100 percent due to rounding. The author calculated estimates at the 90 percent level of confidence, which we converted to the 95 percent level of confidence.
a
32 Thomas Palumbo, "Using the Survey of Income and Program Participation (SIPP) to Measure Workers in Contingent and Alternative Employment Arrangements" (paper presented at the 2009 Annual Conference of the Eastern Economic Association, 2009). As a working paper, this research underwent a more limited review than would official Census publications. The author calculated estimates at the 90 percent level of confidence.
We use the term “standard work” to indicate employment in a non-contingent job.
33 The highest unemployment figure noted in the text (16.2 percent) was from the 2-month period June-July; the 95 percent confidence interval was +/- 2.3 percentage points. 34 Alfred O. Gottschalck, U.S. Census Bureau, “Dynamics of Economic Well-Being: Labor Force Turnover, 1996-1999,” Current Population Reports, p. 70-96, Table 1 (Washington, D.C.: July 2004). The paper defines job separation as a turnover event in which a person goes from being employed in the first month to being not employed in the second month.
SIPP Analysis Population The 2009 Census working paper attempted to identify a population of contingent workers in the SIPP data similar to the BLS-defined population in the CWS by adjusting the contingent workforce identified in SIPP based on other factors, such as job tenure and the reason for job separation. Although the paper observes that the adjusted SIPP data yield a smaller population of contingent workers than the BLS estimates in the CWS, it concludes that the workers analyzed in the SIPP data would meet the BLS definition of contingent.
The working paper illustrates the month-to-month volatility and overall uncertainty that many contingent workers face in the labor market. However, because SIPP does not identify specific work arrangements within its contingent population, these findings do not differentiate between groups of workers, such as contract company and on-call workers.
Contingent Worker Tenure Based on results in the Census working paper, we also estimated that about 72.0 percent (+/- 7.8) of contingent workers in 2004 remained in contingent employment four months or less. The report did not specify how many of those workers obtained standard employment and how many lacked employment for the other eight months of the year.
Note: Estimates are shown at the 95 percent level of confidence, unless otherwise noted.
Contingent Workforce
Contingent Workers Are More Likely to Experience Job Separation

Page 21 GAO-15-168R Contingent Workforce
Enclosure I
Job Security: Loss of Employment in the GSS Similar to the findings from analyzing employment transitions in SIPP data, GSS data show that core contingent workers (i.e., contract company, on-call, agency temp) experience more job instability than standard workers. While data showing this instability may not be surprising as these workers are defined by their non-standard employment, the magnitude of differences between core contingent and standard workers was significant. Estimates from the 2010 GSS show that core contingent workers were more than three times as likely as standard full-time workers to report being laid off in the previous year, and almost five times as likely as standard part-time workers (see table 8).
Table 8: Estimated Percentage of Workers Who Reported That They Were Laid Off in the Previous Year, 2010
Core
contingent Standard full-time
Standard part-time
Independent contractors
Laid off in previous year 28.5* (+/- 12.7) 8.2 (+/- 2.0) 5.9 (+/- 6.1) 18.4* (+/- 10.1)
Source: GAO analysis of data from the 2010 General Social Survey. | GAO-15-168R
Note: We also examined self-employed workers, but the sample size was too small to compute reportable estimates. * Statistically different from standard full-time at 95 percent confidence level.
Similar to workers’ reported experiences of being laid off, a greater proportion of core contingent workers perceived their current jobs as unstable. The estimated proportion of core contingent workers indicating that they were very or fairly likely to lose their jobs within the coming year was more than four times greater than that of standard full-time workers (see table 9). Although the differences were smaller, a higher proportion of standard part-time workers and independent contractors also said they were very or fairly likely to lose their jobs compared to standard full-time workers.
Table 9: Estimated Percentage of Workers Reporting the Likelihood That They Would Lose Their Job in the Coming Year, 2010
Core
contingent Standard full-time
Standard part-time
Independent contractors
Not at all likely 27.1* (+/- 16.2) 55.9 (+/- 5.5) 51.2 (+/- 8.2) 51.6 (+/- 12.2)
Not too likely 30.0 (+/- 14.8) 34.5 (+/- 5.1) 31.2 (+/- 8.8) 22.8* (+/- 9.8) Very/fairly likely 42.9* (+/- 15.2) 9.6 (+/- 3.7) 17.7* (+/- 8.3) 25.7* (+/- 13.5)
Source: GAO analysis of data from the 2010 General Social Survey. | GAO-15-168R
Note: Proportions may not add up to 100 percent due to rounding. We also examined self-employed workers, but the sample size was too small to compute reportable estimates. * Statistically different from standard full-time at 95 percent confidence level.
Subjective Measures of Employment Conditions Survey questions that focus on respondents’ perceptions of their work environment, such as those in the GSS, represent subjective measures of employment conditions. For example, responses to a question such as “how likely are you to lose your job in the coming year” may not accurately depict how many workers will, in fact, lose their jobs. However, such responses illustrate worker perceptions of job security and may be based on past experiences and knowledge of employment conditions.
GSS Job Security Questions We analyzed responses to two GSS survey questions related to job security:
• Were you laid off your main job at any time in the last year?
• Thinking about the next 12 months, how likely do you think it is that you will lose your job or be laid off—very likely, fairly likely, not too likely, or not at all likely?
Job Loss Experience Effect on Expectations in the GSS Workers in the 2010 GSS who said they were laid off in the last year were more than four times as likely as others to respond that they were very or fairly likely to lose their job in the coming year (an estimated 54.7 percent, +/- 15.3, versus 12.3 percent, +/- 3.2).
Note: Estimates are shown at the 95 percent level of confidence, unless otherwise noted.
Contingent Workforce
Core Contingent Workers Are Less Likely to Have Job Security

Page 22 GAO-15-168R Contingent Workforce
Enclosure I
Job Security: Instability and Involuntary Contingent Work Just as employment stability varies among contingent worker groups, so too do workers’ reasons for obtaining alternative work. Some do so involuntarily as a last resort. The 2005 CWS data show that agency temps and on-call/day laborers were more likely than others to report that they had their job because it was the only work they could find (see table 10).
Table 10: Estimated Percentage of Workers who Obtain Contingent Work as a Last Resort or as a Path to Permanent Employment (by Work Arrangement), 2005
Agency temps
On-call workers and day laborers
Independent contractors
Self-employed
Only type of work found 50.9 (+/- 8.2) 24.2 (+/- 6.7) 3.1 (+/- 3.9) 1.8 (+/- 5.1) Laid off, rehired as temp 0.7 (+/- 11.6) --- 0.9 (+/- 4.0) 0.3 (+/- 5.2) Hope job leads to permanent work 12.8 (+/- 10.9) 7.0 (+/- 7.4) 0.5 (+/- 4.0) 0.6 (+/- 5.2)
Source: GAO analysis of data from the 2005 Contingent Work Supplement to the Current Population Survey. | GAO-15-168R Note: This question was only asked specifically of these four worker groups. Percentages are based on valid responses and are not intended to add up to 100 because workers obtain jobs for many different reasons including, for example, other economic reasons, flexibility of schedule, child care, and health limitations. Proportions of agency temps and on-call/day laborers that responded “only type of work found” were statistically different from independent contractors and the self-employed at the 95 percent confidence level.
More recent CPS data show that the percentage of the employed labor force who are “involuntary part-time”—those who work part-time for economic reasons, such as not being able to find full-time work—is almost double what it was estimated to be in 2007 before the onset of the recent recession (see fig. 4). In addition, some who work part-time for reasons categorized as non-economic may not do so entirely by choice but rather out of economic necessity due to child care or other scheduling needs; thus, even more workers could be considered involuntary part-time.
Figure 4: Estimated Share of Employed Labor Force Working Part-Time, by Reason
Note: Data are calculated from BLS’s Labor Force Statistics: “Table A-8.” Part-time refers to those who worked 1-34 hours. “Could only find part-time work” is a subset of “economic reasons.” Each estimate has a 95 percent confidence interval of within +/- 0.2. a Percentages shown represent annual averages, and 2007 was the most recent prior to the Dec. 2007-Jun. 2009 recession.
Part-Time Job Stability Part-time workers are often in stable employment situations, and we estimated with GSS data that a relatively low proportion of standard part-time workers—those not included in another arrangement—reported they had been laid off in the prior year (see table 8). A relatively low proportion also expected to lose their jobs in the coming year (see table 9). However, part-time workers may experience instability in other forms, particularly where wide fluctuations in the hours offered for work can lead to instability in income levels.
Variable Work Hours and Unpredictable Schedules In addition to standard part-time workers, workers in standard full-time or alternative arrangements may have variable work schedules. With advanced scheduling software, employers can minimize labor costs by quickly adjusting work schedules to respond to shifts in customer demand. However, “on-time” staffing decisions may disregard workers’ scheduling considerations. According to Department of Labor officials, the Department currently has no authority under the Fair Labor Standards Act to require advance notification of schedules. Congress has expressed interest in issues related to work scheduling predictability and stability.
The 2014 GSS included a question on advance work scheduling, for the first time, in one of its modules.
Note: Estimates are shown at the 95 percent level of confidence, unless otherwise noted.
Contingent Workforce
Reasons Workers Obtain Contingent Work Vary, though Many Do So Out of Necessity

Page 23 GAO-15-168R Contingent Workforce
Enclosure I
Job Satisfaction: Access to Benefits Without questions about specific work-provided benefits in the GSS and without a recent CWS,35 current information about contingent workers’ access to health insurance and retirement plans is limited. However, our prior work found that contingent workers had less access to work-provided health insurance and retirement plans than other workers.36
While current data on contingent workers’ access to work-provided benefits are limited, GSS data show that core contingent workers, as well as others who are not in standard full-time arrangements, report significantly lower satisfaction with their fringe benefits.
Reported access varied among respondents in different types of alternative work arrangements and was lowest among agency temps, excluding those who identified themselves as independent contractors and self-employed workers and thus may not have employers. BLS researchers have noted that relatively low access to work-provided benefits may be a common characteristic of contingent workers, which may also suggest a need for further study. In our section on earnings and benefits, we examine an approximate population of contingent workers from 2012 CPS data to provide information on retirement plan and health insurance coverage.
37
Most workers, regardless of group, reported that their fringe benefits were very or somewhat good, including 63.3 percent of core contingent workers (see table 11). However, core contingent and part-time workers, as well as independent contractors, were significantly less satisfied than standard full-time workers. For example, an estimated 28.4, 26.6, and 28.7 percent of these groups, respectively, responded that it was not at all true that their fringe benefits were good, as compared to just 12.9 percent of standard full-time workers (see table 11).
Table 11: Estimated Percentage of Workers Who Agreed That Their Fringe Benefits Were Good, 2010
“My Fringe Benefits Are Good”
Core contingent
Standard full-time
Standard part-time
Independent contractors
Very / somewhat true 63.3* (+/- 12.7) 75.6 (+/- 3.9) 55.7* (+/- 7.5) 61.0* (+/- 9.6) Not too true 8.3 (+/- 8.4) 11.5 (+/- 2.7) 17.7 (+/- 7.3) 10.3 (+/- 7.2) Not at all true 28.4* (+/- 12.2) 12.9 (+/- 3.5) 26.6* (+/- 8.6) 28.7* (+/- 10.8)
Source: GAO analysis of data from the 2010 General Social Survey. | GAO-15-168R
Note: Proportions may not add up to 100 percent due to rounding. We also examined self-employed workers, but the sample size was too small to compute reportable estimates for all responses. * Statistically different from standard full-time at 95 percent confidence level.
35 A past GSS topical module had questions about fringe benefits, but was administered only in 1991 (see sidebar). 36 GAO/HEHS-00-76; GAO-06-656. GAO previously reported on pension coverage. We use the term retirement plans because the survey questions analyzed ask about pension or retirement plan offerings. We also use the term “work-provided” rather than the legal term “employer-sponsored” because the survey questions ask about benefits offered by a worker’s employer or union. 37 Fringe benefits were open to the interpretation of respondents (see sidebar).
Fringe Benefits in the GSS GSS data offer some insight into workers’ access to work-provided benefits by asking workers whether they agree that their “fringe benefits are good.” This measure of employment conditions is limited, as survey respondents may think of different things as fringe benefits. However, differences in perceptions between worker groups are apparent.
While the 2010 GSS question does not clearly define fringe benefits for respondents, a past GSS module that focused on fringe benefits asked questions about medical, dental, and life insurance; child care; maternity and paid sick leave; flexible scheduling; stock options; and pensions/retirement programs.
Note: Estimates are shown at the 95 percent level of confidence, unless otherwise noted.
Contingent Workforce
Data Are Limited, But Core Contingent Workers May Be Less Satisfied with Work-Provided Benefits

Page 24 GAO-15-168R Contingent Workforce
Enclosure I
Job Satisfaction: Current Employer and Job Beyond contentment with benefits, contingent worker groups also vary in their overall job satisfaction. As stated in our prior work, the 2005 CWS data show differences between workers in alternative arrangements.38
Of those worker groups asked, agency temps and on-call/day laborers were more likely to state that they would prefer a different type of employment. In contrast, more than 85 percent of independent contractors and the self-employed appeared content with their employment type (see table 12).
Table 12: Estimated Percentage of Workers Who Want a Different Type of Employment, 2005
Would you prefer a different type of employment?
Agency temps
On-call workers and day laborers
Independent contractors
Self-employed
Yes 59.3 (+/- 7.4) 48.3 (+/- 5.5) 9.4 (+/- 3.8) 7.5 (+/- 4.9) Depends 6.8 (+/- 11.3) 6.2 (+/- 7.4) 5.4 (+/- 3.9) 4.0 (+/- 5.0) No 33.8 (+/- 9.5) 45.5 (+/- 5.7) 85.2 (+/- 1.5) 88.4 (+/- 1.7)
Source: GAO analysis of data from the 2005 Contingent Work Supplement to the Current Population Survey. | GAO-15-168R Note: This question was only asked specifically of these four groups of workers and was phrased slightly differently by group, as appropriate. The percentages in this table are based on valid responses (those shown); proportions may not add up to 100 percent due to rounding. The proportions of agency temps and on-call workers/day laborers that responded “Yes” and “No” were statistically different from those of independent contractors and the self-employed at the 95 percent confidence level.
Similar to the 2005 CWS findings, core contingent workers in the 2010 GSS appeared more dissatisfied with their employment than some other worker groups. Compared with standard full-time workers, a larger proportion of core contingent workers indicated that they were not at all or not too satisfied with their jobs.39 Independent contractors were also more likely to report being “very satisfied” with their jobs than core contingent workers—56.8 percent versus 36.1 percent (see table 13).40
Table 13: Estimated Percentage of Workers Who Reported That They Were Satisfied with Their Jobs, 2010
Core
contingent Standard full-time
Standard part-time
Independent contractors
Not at all/Not too satisfied 18.0 (+/- 10.6) 9.5 (+/- 2.9) 21.6* (+/- 8.0) 8.1 (+/- 9.3) Somewhat satisfied 45.9 (+/- 12.0) 45.2 (+/- 4.5) 39.9 (+/- 8.8) 35.1* (+/- 9.4) Very satisfied 36.1 (+/- 13.2) 45.3 (+/- 4.3) 38.6 (+/- 8.1) 56.8* (+/- 8.1)
Source: GAO analysis of data from the 2010 General Social Survey. | GAO-15-168R
Note: Proportions may not add up to 100 percent due to rounding. We also examined self-employed workers, but the sample size was too small to compute reportable estimates. * Statistically different from standard full-time at 95 percent confidence level.
38 GAO-06-656. 39 Our results were significant at the 0.064 significance level; therefore, we can state with 90 percent confidence that the full population of core contingent workers would indicate more dissatisfaction with their jobs than standard full-time workers. 40 The difference was significant at the 95 percent confidence level.
GSS Job Satisfaction Questions The GSS examines job satisfaction with various subjective measures. Whereas the CWS simply asked respondents whether they would prefer to be in a job with a different type of employer, the GSS asked about issues such as respect at work, job fatigue, fringe benefits, and overall satisfaction. After analyzing the GSS job satisfaction variables, we focused on two issues: fringe benefits (see table 11) and overall job satisfaction (see table 13).
Note: Estimates are shown at the 95 percent level of confidence, unless otherwise noted.
Contingent Workforce
Job Satisfaction Differs Among Contingent Groups, though Core Contingent Workers Generally Like their Jobs Less

Page 25 GAO-15-168R Contingent Workforce
Enclosure I
Workplace Safety Evaluating workplace safety for contingent workers is challenging due to a lack of data that track the employment type of workers injured on the job. Occupational Safety and Health Administration (OSHA) officials said that the agency has implemented new procedures which require staff, upon receiving a report, to inquire whether the fatality, injury, or illness involved workers from a temporary staffing agency—one type of contingent employment.41
According to OSHA officials, some temporary workers are more vulnerable to workplace safety and health hazards, for a variety of reasons, including because they often are not provided adequate safety training or equipment by either the staffing agency or the host employer (see sidebar).
Officials stated that, as a result, the agency is beginning to capture meaningful data and will soon have enough to conduct analyses.
42 Because some states’ workers’ compensation data track whether a worker is employed by a temp staffing agency, researchers have used these data to compare rates of injury between temporary and standard workers; for example, two such studies suggested that a greater proportion of temporary workers file claims for workers’ compensation.43
To examine additional types of contingent and alternative arrangements, we analyzed GSS data on perceptions of workplace safety and self-reported injuries. We found no significant differences between worker groups, though small sample size and survey design limit the conclusions that can be drawn. Almost 90 percent of each worker group indicated they had not been injured in the past year (see table 14 and sidebar).
44
Table 14: Workers Who Reported Being Injured on the Job in the Past Year, 2010
Estimated percent who reported:
Core contingent
Standard full-time
Standard part-time
Independent contractors
No injuries 86.6 (+/- 11.5) 89.7 (+/- 2.9) 90.3 (+/- 6.6) 90.0 (+/- 6.6) Injured 1 time 8.1 (+/- 11.4) 6.9 (+/- 2.5) 6.1 (+/- 5.9) 3.9 (+/- 6.2) Injured 2+ times 5.3 (+/- 8.1) 3.4 (+/- 2.1) 3.6 (+/- 4.4) 6.1 (+/- 5.4)
Source: GAO analysis of data from the 2010 General Social Survey. | GAO-15-168R
Note: Proportions may not add up to 100 percent due to rounding. We also examined self-employed workers, but the sample size was too small to compute reportable estimates.
41 Officials said OSHA’s new procedures are the result of a revised reporting rule effective Jan. 1, 2015. See 79 Fed. Reg. 56,130 (Sep. 18, 2014) (codified at 29 C.F.R. § 1904). Previously, OSHA found out the employer of only workers killed on the job or those among three or more hospitalized. 42 For further discussion of why contingent workers are at risk of work injuries and Illnesses, see OSHA, Adding Inequality to Injury: The Costs of Failing to Protect Workers on the Job (March 2015). 43 Caroline K. Smith, et al., “Temporary Workers in Washington State,” American Journal of Industrial Medicine, vol. 53, (2010); Yong-Seung Park and Richard J. Butler, “The Safety Costs of Contingent Work: Evidence from Minnesota,” Journal of Labor Research, vol. 22, no. 4 (Fall 2001). 44 Injury rates based on GSS data are higher than the injury and illness rate reported by BLS (about 4 percent for full-time workers) based on 2007 OSHA data, as we previously reported. However, GSS respondents may have included any work-related injury, whether reported to their employer or not. GAO, Workplace Safety and Health: Enhancing OSHA’s Records Audit Process Could Improve the Accuracy of Worker Injury and Illness Data, GAO-10-10 (Washington, D.C.: October 15, 2009).
Temporary Worker Initiative OSHA started the Temporary Worker Initiative in April 2013 to prevent injuries and illnesses among temporary workers. The initiative brings stakeholders together to ensure worksite protections are in place and that agency temps receive adequate hazard training. According to OSHA, through the initiative, inspectors assess and record instances when temporary workers are exposed to safety violations and clarify staffing firms’ and host employers’ shared responsibilities for providing hazard training and protective equipment, and for other safety issues. Challenges encountered by OSHA include the unavailability of injured workers because they are no longer employed at worksites by the time OSHA inspections occur, as well as the multiple layers of contractors and workers employed by different employers at some worksites.
Limitations of Injury Data Survey findings about workplace safety may be limited by the fact that the overall incidence of injuries is low and injury rates depend on the hazards present in an industry. These factors make it difficult to detect differences in injury rates between groups of workers, if any exist. Also, survey respondents may define injury differently. The GSS does not offer comprehensive injury data, as it is not designed to account for these dynamics.
Note: Estimates are shown at the 95 percent level of confidence, unless otherwise noted.
Contingent Workforce
Data on Work Injuries by Employment Type Are Limited, though Temporary Workers May Be at Greater Risk
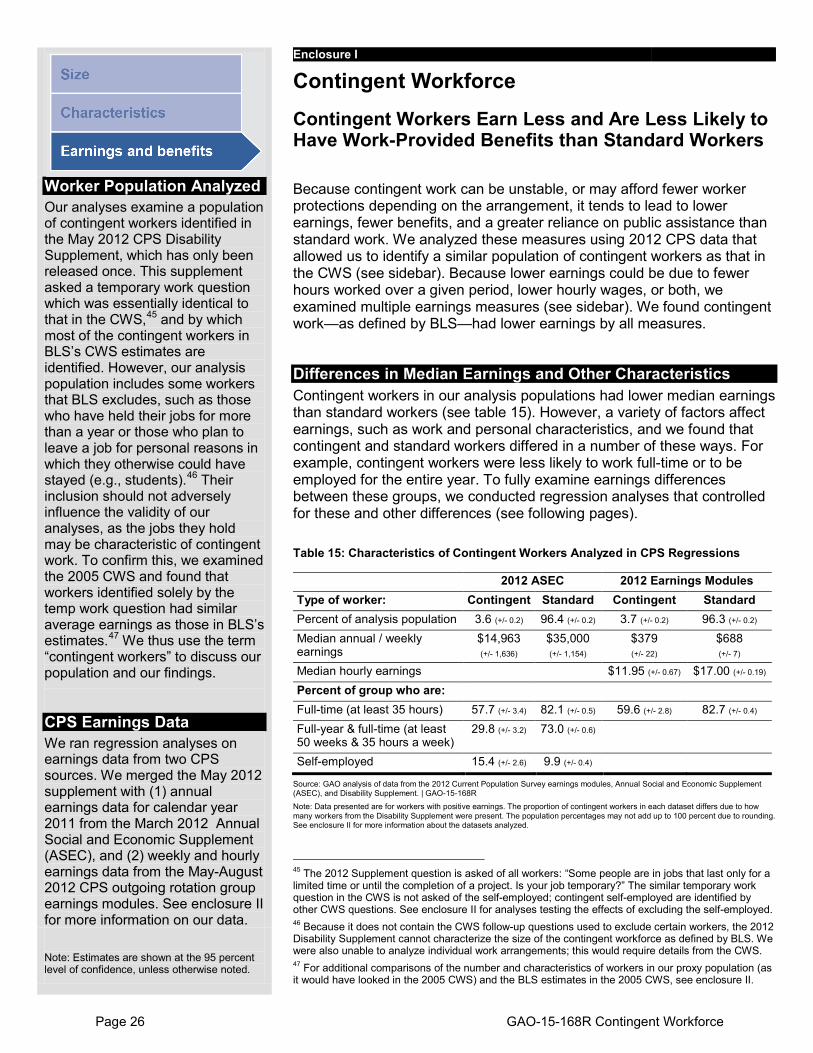
Page 26 GAO-15-168R Contingent Workforce
Enclosure I
Because contingent work can be unstable, or may afford fewer worker protections depending on the arrangement, it tends to lead to lower earnings, fewer benefits, and a greater reliance on public assistance than standard work. We analyzed these measures using 2012 CPS data that allowed us to identify a similar population of contingent workers as that in the CWS (see sidebar). Because lower earnings could be due to fewer hours worked over a given period, lower hourly wages, or both, we examined multiple earnings measures (see sidebar). We found contingent work—as defined by BLS—had lower earnings by all measures.
Differences in Median Earnings and Other Characteristics Contingent workers in our analysis populations had lower median earnings than standard workers (see table 15). However, a variety of factors affect earnings, such as work and personal characteristics, and we found that contingent and standard workers differed in a number of these ways. For example, contingent workers were less likely to work full-time or to be employed for the entire year. To fully examine earnings differences between these groups, we conducted regression analyses that controlled for these and other differences (see following pages).
Table 15: Characteristics of Contingent Workers Analyzed in CPS Regressions
2012 ASEC 2012 Earnings Modules Type of worker: Contingent Standard Contingent Standard Percent of analysis population 3.6 (+/- 0.2) 96.4 (+/- 0.2) 3.7 (+/- 0.2) 96.3 (+/- 0.2) Median annual / weekly earnings
$14,963 (+/- 1,636)
$35,000 (+/- 1,154)
$379 (+/- 22)
$688 (+/- 7)
Median hourly earnings $11.95 (+/- 0.67) $17.00 (+/- 0.19) Percent of group who are: Full-time (at least 35 hours) 57.7 (+/- 3.4) 82.1 (+/- 0.5) 59.6 (+/- 2.8) 82.7 (+/- 0.4) Full-year & full-time (at least 50 weeks & 35 hours a week)
29.8 (+/- 3.2) 73.0 (+/- 0.6)
Self-employed 15.4 (+/- 2.6) 9.9 (+/- 0.4)
Source: GAO analysis of data from the 2012 Current Population Survey earnings modules, Annual Social and Economic Supplement (ASEC), and Disability Supplement. | GAO-15-168R Note: Data presented are for workers with positive earnings. The proportion of contingent workers in each dataset differs due to how many workers from the Disability Supplement were present. The population percentages may not add up to 100 percent due to rounding.
45 The 2012 Supplement question is asked of all workers: “Some people are in jobs that last only for a limited time or until the completion of a project. Is your job temporary?” The similar temporary work question in the CWS is not asked of the self-employed; contingent self-employed are identified by other CWS questions. See enclosure II for analyses testing the effects of excluding the self-employed.
See enclosure II for more information about the datasets analyzed.
46 Because it does not contain the CWS follow-up questions used to exclude certain workers, the 2012 Disability Supplement cannot characterize the size of the contingent workforce as defined by BLS. We were also unable to analyze individual work arrangements; this would require details from the CWS. 47 For additional comparisons of the number and characteristics of workers in our proxy population (as it would have looked in the 2005 CWS) and the BLS estimates in the 2005 CWS, see enclosure II.
Worker Population Analyzed Our analyses examine a population of contingent workers identified in the May 2012 CPS Disability Supplement, which has only been released once. This supplement asked a temporary work question which was essentially identical to that in the CWS,45 and by which most of the contingent workers in BLS’s CWS estimates are identified. However, our analysis population includes some workers that BLS excludes, such as those who have held their jobs for more than a year or those who plan to leave a job for personal reasons in which they otherwise could have stayed (e.g., students).46 Their inclusion should not adversely influence the validity of our analyses, as the jobs they hold may be characteristic of contingent work. To confirm this, we examined the 2005 CWS and found that workers identified solely by the temp work question had similar average earnings as those in BLS’s estimates.47
We thus use the term “contingent workers” to discuss our population and our findings.
CPS Earnings Data We ran regression analyses on earnings data from two CPS sources. We merged the May 2012 supplement with (1) annual earnings data for calendar year 2011 from the March 2012 Annual Social and Economic Supplement (ASEC), and (2) weekly and hourly earnings data from the May-August 2012 CPS outgoing rotation group earnings modules. See enclosure II for more information on our data.
Note: Estimates are shown at the 95 percent level of confidence, unless otherwise noted.
Contingent Workforce
Contingent Workers Earn Less and Are Less Likely to Have Work-Provided Benefits than Standard Workers

Page 27 GAO-15-168R Contingent Workforce
Enclosure I
Hourly, Weekly, and Annual Earnings Our regression results suggest that even after accounting for other factors that affect earnings—such as education, age, unionization, industry, occupation, and geography—contingent workers earn less, on average, than standard workers on an hourly, weekly, and annual basis.50
Our analysis of the CPS earnings module data, which included hours worked and allowed us to estimate hourly earnings, showed that after controlling for various characteristics, contingent workers, on average, earn 10.6 percent less per hour than standard workers (see table 16).
Using the CPS earnings modules and the ASEC data, respectively, we also found that contingent workers, on average, earn 27.5 percent less per week and 47.9 percent less per year than standard workers (see table 16). Because these differences do not control for hours worked, they represent the cumulative difference between groups in both pay rate and hours worked over a given period. The larger differences illustrate, in part, the effects of contingent workers being less likely to have full-time work and working fewer weeks over a year as compared to standard workers (see table 15). The transitory nature observed here and in other data (e.g., as previously illustrated with SIPP) may be expected given definitions of contingent work. Controlling additionally for the earnings effects of part-time or partial year work (i.e., limiting the analysis to full-time or full-time, full-year workers) reduces the larger differences in weekly and annual earnings, again showing the combined effects of lower wages and fewer hours worked over a given period. Contingent workers earn 16.7 percent less per week and 12.9 percent less per year (see table 16).51
Table 16: Contingent Workers’ Earnings as a Percentage of Standard Workers’, 2012
Earnings measure, workers analyzed:
Hourly, all
Weekly, all
Annual, all
Weekly, full-time
Annual, full-time/full-year
Contingent earnings as a percentage of standard 0.894* 0.725* 0.521* 0.833* 0.871*
Source: GAO regression analysis using data from the 2012 Current Population Survey earnings modules, Annual Social and Economic Supplement (ASEC), and Disability Supplement. | GAO-15-168R Note: Our models controlled for factors that affect earnings, such as education, age, unionization (weekly and hourly earnings models), industry, occupation, and geography (for full list, see enclosure II). Full-time includes those who worked at least 35 hours per week; full-year includes those who worked at least 50 weeks in the year. The self-employed are not included in the weekly and hourly models. * Indicates that the regression coefficient is statistically significant at least at the level of p-value < 0.05.
48 Miranda Dietz, “Temporary Workers in California are Twice as Likely as Non-Temps to Live in Poverty: Problems with Temporary and Subcontracted Work in California” (Berkeley, CA: UC Berkeley Labor Center, August 2012); Lewis M. Segal and Daniel G. Sullivan, “The Growth of Temporary Services Work,” The Journal of Economic Perspectives, vol. 11, No. 2 (1997). 49 Sarah Hamersma, Carolyn Heinrich, and Peter Mueser, “Temporary Help Work: Earnings, Wages, and Multiple Job Holding,” Industrial Relations, vol. 53, no. 1 (January 2014). 50 For a full list of regression covariates, see enclosure II. All of the earnings differences discussed in the text of this section are statistically significant at least at the level of p-value < 0.05. 51 We limited the annual data to only full-time, full-year workers and the weekly data to only full-time. The earnings results differ because they rely on different datasets and include different workers; the weekly earnings regressions also control for union membership (see enclosure II).
Validity of Merged Sample To ensure that our results were not affected by the construction of our merged sample of CPS earnings modules, we ran weekly and hourly earnings regressions on only those workers who reported earnings in the May 2012 earnings module. Our results were qualitatively similar to those from the merged sample (see enclosure II). For example, contingent workers in the May-only sample, on average, earn 14.0 percent less per hour than standard workers.
Earnings Analysis in Studies Other studies’ results related to hourly earnings differences have varied. Two studies using data on the temporary help industry from the CPS and the American Community Survey, respectively, suggest that temporary help workers have lower hourly wages than similar workers in other industries.48 In contrast to those studies and our regression results, a 2014 study using administrative data on disadvantaged workers in Wisconsin produced results that suggest temporary help workers earn more per hour than others. Consistent with our findings, that same study produced results that suggest temporary help workers earn significantly less per quarter than others. The authors stated that this observed earnings gap could be the result of working fewer hours per quarter.49
Each of these studies focused on only a segment of the contingent workforce for which data were available.
Note: Estimates are shown at the 95 percent level of confidence, unless otherwise noted.
Contingent Workforce
Due to Lower Wages and Fewer Hours Worked, Contingent Workers Earn Less than Standard Workers

Page 28 GAO-15-168R Contingent Workforce
Enclosure I
Earnings Differences by Industry and Occupation Our regression analysis also showed that differences in earnings varied between contingent and standard workers in individual industries and occupations. We examined those industries and occupations that had the greatest share of the contingent workforce, as defined by BLS as having temporary jobs.53
After controlling for various characteristics, we found that within some industries and occupations, contingent workers earn significantly less than standard workers on an hourly, weekly, and annual basis. For example, in the education industry, contingent workers, on average, earn 13.6 percent less per hour than standard workers (see fig. 5) and 65.7 percent less per year (33.6 percent less among full-time, full-year workers). Contingent workers in the transportation and material moving occupation also earn significantly less hourly, weekly, and annually than standard workers. In other industries and occupations, some but not all earnings measures were significantly less for contingent workers. In the construction industry and construction and extraction occupation, for example, only the difference in annual earnings was significant.
More contingent workers were in the education industry than in others (see fig. 5), and more were in education, construction, and office and administrative occupations than in others.
54
Figure 5 shows the percentage of contingent workers and earnings differences in the industries we analyzed.
Figure 5: Percentage Differences between Contingent and Standard Workers’ Hourly Earnings in Industries with the Greatest Share of Contingent Workers, 2012
Note: Earnings differences shown are from our regression analyses—limited to workers within specified industries—that control for factors that affect earnings, such as education, age, and geography (for full list, see enclosure II). Estimated percentages of contingent workers in the industries shown (right side of figure) all have 95 percent confidence intervals of within +/- 2.3 percentage points; percentages are from the outgoing rotation group earnings module dataset and do not add up to 100 because only those industries with the highest share of contingent workers are shown (see enclosure II). a
52 For a full list of regression covariates, see enclosure II. All of the earnings differences discussed in the text of this section are statistically significant at least at the level of p-value < 0.05.
Indicates that the earnings difference is statistically significant at least at the level of p-value < 0.05.
53 We examined those industries and occupations that contained at least 5.0 percent of contingent workers in both the ASEC and CPS earnings modules datasets (see enclosure II). 54 For the complete set of industry and occupation regression results and a full list of regression covariates, see enclosure II.
Education Workers Education generally has a higher share of the contingent workforce than other industries and occupations (see fig. 5). This may be a result of the large numbers of substitute teachers who may be on call and adjunct professors who may only work part of the year or few hours per week. Earnings differences in education were also large and generally significant. To confirm that education was not skewing our overall estimates for earnings, we re-ran our regression analyses excluding education workers.
While the resulting differences were slightly smaller, contingent workers still earned significantly less than standard workers on an hourly, weekly, and annual basis. For example, even after excluding workers in the education industry or occupation, contingent workers, on average, earn 9.8 percent less per hour than standard workers.52
Controlling for More Precise Industries and Occupations We also ran our regression analyses controlling for workers’ more precise industries and occupations instead of the detailed groupings used elsewhere (e.g., postsecondary teachers instead of the education, training, and library occupation group). The differences between contingent and standard workers were only slightly smaller when the more precise industry and occupation controls were used (see enclosure II).
Note: Estimates are shown at the 95 percent level of confidence, unless otherwise noted.
Contingent Workforce
Within Certain Industries and Occupations, Contingent Workers Earn Significantly Less than Standard Workers

Page 29 GAO-15-168R Contingent Workforce
Enclosure I
Work-Provided Benefits: Retirement Plan Participation In addition to lower earnings from work, contingent workers are also less likely to have work-provided retirement plans.
From our analysis of the ASEC data, we found that contingent workers are less likely to have work-provided retirement plans (see sidebar) than standard workers.56 Specifically, the odds of participating in a work-provided retirement plan are an estimated 67.6 percent lower for contingent workers than for standard workers (see table 17).57 Even after limiting our analysis to full-time, full-year workers, the odds of participating in a work-provided plan remain about 56.0 percent lower for contingent workers than for standard workers (see enclosure II for additional detail regarding the calculation of odds ratios).58
Table 17: Contingent Worker Participation in a Work-Provided Retirement Plan, 2012
Workers analyzed: All Full-time/full-year Relative odds of participating in a work-provided retirement plan (contingent workers compared to standard workers)
0.324* 0.440*
Source: GAO regression analysis using data from the 2012 Annual Social and Economic and Disability Supplements to the Current Population Survey. | GAO-15-168R Note: Our models controlled for factors that could affect participation, such as education, age, industry, occupation, self-employment, and geography (for full list, see enclosure II). Full-time, full year includes those who worked at least 35 hours per week and at least 50 weeks in the year. The self-employed are included in the models, but we also include self-employment as a control variable because these workers may not necessarily have an employer with which they would qualify for a retirement plan (see enclosure II). Also see enclosure II for additional detail regarding the calculation of odds ratios.
* Indicates that the regression coefficient is statistically significant at least at the level of p-value < 0.05.
55 GAO-06-656. 56 We use the term “work-provided” rather than the legal term “employer-sponsored” because the survey questions ask about benefits offered by a worker’s employer or union. 57 Under the Employee Retirement Income and Security Act of 1974, employer-sponsored retirement plans generally must permit employees to participate by the later of when the employee attains the age of 21 or completes a year of service. A year of service means completion of at least 1,000 hours of service during a 12-month period. 29 U.S.C. § 1052. 58 All of the differences in participation discussed in the text of this section are statistically significant at least at the level of p-value < 0.05.
Retirement Plans in ASEC The ASEC asks respondents two questions to determine whether they have a work-provided retirement plan:
• Other than Social Security did any employer or union that you worked for in 2011 have a pension or other type of retirement plan for any of its employees?
• Were you included in that plan?
Worded in this way, the ASEC data do not distinguish between different kinds of retirement plans, such as defined benefit or defined contribution plans. Defined benefit plans include traditional pensions, in which an employer provides a predefined monthly benefit after retirement. Defined contribution plans include 401(k) accounts, in which both the employee and the employer may contribute a certain amount to an employee’s investment account—future benefits depend, in part, on employee investment decisions and market returns.
Retirement Plans in CWS The CWS has asked more specific questions about retirement plans, such as whether workers had other retirement accounts (e.g., IRAs) and why workers did not participate in a work-provided plan. Our prior work reported that contingent workers who did not participate most frequently cited eligibility reasons, such as not working enough hours or weeks.55
Note: Estimates are shown at the 95 percent level of confidence, unless otherwise noted.
Contingent Workforce
Contingent Workers Are Two-Thirds Less Likely to Have Work-Provided Retirement Plans than Standard Workers

Page 30 GAO-15-168R Contingent Workforce
Enclosure I
Work-Provided Benefits: Health Insurance Participation Comparing contingent and standard workers’ health insurance coverage is complicated because workers may be covered by other family members’ plans. The ASEC does not ask respondents who are already covered by family members’ plans whether their own employers offer coverage. Thus, rather than conducting regression analysis, we examined the distributions of various measures of insurance coverage.
Within our analysis population of ASEC data, contingent workers were less likely than standard workers to have any private health insurance and less likely to have work-provided coverage. In particular, less than half the proportion of contingent workers reported having health insurance coverage in their own name (27.0 percent versus 57.8 percent of standard workers) as opposed to through another family member (see table 18). While most workers who had insurance in their own name had it through their employers, contingent workers were less than half as likely as standard workers to have health coverage through their own employer—21.4 percent versus 53.1 percent (see table 18).
Table 18: Health Insurance Coverage of Contingent and Standard Workers, 2012
Worker type: Contingent Standard Covered by any private insurance plan 61.0* (+/- 3.0) a 77.9 (+/- 0.5) Covered by private insurance in own name 27.0* (+/- 2.8) 57.8 (+/- 0.6) Worker has work-provided health insurance plan 21.4* (+/- 2.6) b 53.1 (+/- 0.6)
Source: GAO analysis of data from the 2012 Annual Social and Economic and Disability Supplements to the Current Population Survey. | GAO-15-168R
Note: Proportions shown in the table are not intended to add to 100 percent as each represents a different population of workers. a Private insurance includes work-provided and other health plans, such as those purchased directly from insurers. b
* Statistically different from standard workers at 95 percent confidence level.
Participation in a work-provided plan does not indicate whether contingent or standard workers have access to work-provided health insurance because a worker could be offered a work-provided plan but choose not to participate (e.g., if the worker is covered under a spouse’s plan).
The Patient Protection and Affordable Care Act (PPACA) was intended to increase the accessibility and affordability of health coverage, including by expanding Medicaid and providing new health premium tax credits to assist eligible individuals to purchase health plans through health insurance marketplaces established under the law (see sidebar).61
59 PPACA defines full-time work differently than the Current Population Survey. We use the survey’s definition of 35 hours per week in our various analyses.
However, contingent workers, whose work hours and earnings fluctuate, could face changes in their eligibility for employer-sponsored insurance, premium tax credits, or Medicaid during the course of a year.
60 Including more than 7.1 million in the 37 states using the HealthCare.gov platform and nearly 2.4 million in the 14 states (including DC) using their own platforms. In the HealthCare.gov states, 87 percent of plan selections qualify for premium tax credits or cost-sharing reductions. 61 For more information on the PPACA, see enclosure III.
Patient Protection and Affordable Care Act The estimates we report from CPS data do not reflect increased health insurance coverage under PPACA.
Although PPACA requires certain employers to provide coverage to full-time employees—averaging at least 30 hours per week59
The Department of Health and Human Services reported that as of mid-January 2015, more than 9.5 million individuals had selected or reenrolled in a 2015 health plan in the marketplace.
—or pay a penalty starting in 2015, these requirements do not apply to small employers, part-time employees, or seasonal employees and therefore may not directly affect coverage for some contingent workers. PPACA provides new options from which those who may not have access to affordable employer-sponsored insurance could benefit, including expanding Medicaid and providing new premium tax credits to assist those meeting income and other eligibility requirements to purchase health plans through marketplaces established under the law. The law requires individuals to maintain insurance, though tax penalties for failing to meet the law’s employer and individual mandates are being phased in over time.
60
Also as of mid-January 2015, 28 states plus DC had expanded Medicaid. While enrollment data by worker type is not available, newly-covered individuals likely include contingent workers and their families because they have historically had less access to employer-based coverage than standard workers.
Note: Estimates are shown at the 95 percent level of confidence, unless otherwise noted.
Contingent Workforce
Contingent Workers Are Less Likely to Have Private or Work-Provided Health Insurance

Page 31 GAO-15-168R Contingent Workforce
Enclosure I
Measures of Poverty: Family Income and Public Assistance While measures of poverty depend on a worker’s earnings as well as other factors, such as the earnings of other members of the family, poverty indicators and receipt of public assistance show some of the broader effects of contingent work. As with health care, we used data from the 2012 ASEC to evaluate summary statistics on poverty for contingent and standard workers rather than conducting regression analysis.63
Based on an examination of family income levels and various sources of public assistance, contingent workers are more likely to report being in situations of poverty than standard workers (see table 19). Specifically, contingent workers are more likely than standard workers to have family incomes below the poverty line and below 150 percent of the poverty line. They are also more likely to receive: benefits from the Supplemental Nutritional Assistance Program (SNAP, formerly known as the federal Food Stamp Program); cash assistance from state or county welfare programs; and Supplemental Security Income (SSI).
Table 19: Estimated Proportion of Contingent and Standard Workers at Different Income-to-Poverty Ratios and Participating in Selected Programs, 2012
Worker type: Contingent Standard Family income below poverty line 15.2* (+/- 2.3) 6.2 (+/- 0.3) Family income below 150 percent of poverty line 26.0* (+/- 2.8) 12.9 (+/- 0.4) Anybody in family received Supplemental Nutritional Assistance Program (SNAP) benefits
11.1* (+/- 2.1) 5.6 (+/- 0.3)
Worker received cash assistance from state or county welfare program
1.8* (+/- 1.0) 0.4 (+/- 0.1)
Worker received Supplemental Security Income (SSI) 1.0* (+/- 0.8) 0.3 (+/- 0.1)
Source: GAO analysis of data from the 2012 Annual Social and Economic and Disability Supplements to the Current Population Survey. | GAO-15-168R
Note: Proportions shown in the table are not intended to add to 100 percent given that each represents a response to a different question. Because CPS estimates are known to underestimate public assistance program participation, the data in this table provide an indicator of the difference in participation rates between contingent and standard workers rather than estimates of the absolute levels of program participation in either group. * Statistically different from standard workers at 95 percent confidence level.
62 Laura Wheaton, “Underreporting of Means-Tested Transfer Programs in the CPS and SIPP,” 2007 Proceedings of the American Statistical Association, Social Statistics Section (Alexandria, VA: American Statistical Association, 2007); Bruce D. Meyer, Wallace K. C. Mok, and James X. Sullivan, “The Under-Reporting of Transfers in Household Surveys: Its Nature and Consequences,” National Bureau of Economic Research, NBER Working Paper 15181 (July 2009). 63 Family and household characteristics were not a focus of our work, and they would have been necessary for regression analysis.
Differences in Participation Because CPS estimates are known to underestimate participation in public assistance programs,62
our analysis provides an indicator of the difference in participation rates between contingent and standard workers rather than estimates of the absolute levels of program participation in either group.
Note: Estimates are shown at the 95 percent level of confidence, unless otherwise noted.
Contingent Workforce
Contingent Workers Are More Likely to Live in Poverty and Rely on Various Sources of Public Assistance

Page 32 GAO-15-168R Contingent Workforce
Enclosure II—Objectives, Scope, and Methodology
We analyzed and compared a number of data sources to examine (1) the size of the contingent workforce, (2) the characteristics and employment experiences of contingent versus standard workers, and (3) any differences in earnings, benefits, and measures of poverty between contingent and standard workers.
To gain an understanding of and provide context for the relevant contingent worker data that we analyzed, we interviewed officials who collect and maintain the respective datasets from the Department of Labor and the Census Bureau (Census), and an official from NORC at the University of Chicago. To provide additional context, we also interviewed officials from the Department of Labor, as well as subject matter experts and officials from organizations representing workers and employers, including the American Staffing Association; the Society for Human Resource Management; the National Employment Law Project; the Service Employees International Union; the National Staffing Workers Alliance; and the Chicago Workers’ Collaborative. To provide additional context and to complement our findings, we reviewed studies that address topics related to contingent work. These studies were identified through our queries of bibliographic databases as well as through recommendations of the experts we interviewed. We assessed the methodological approaches of these studies and determined that they were sufficiently rigorous to support our use of their findings; we noted limitations as applicable.
To identify workforce protections provided to contingent workers, we reviewed our prior reports on this topic, and reviewed relevant federal laws, including the Patient Protection and Affordable Care Act (PPACA).
The remainder of this enclosure provides detailed information about the data and methods we used in our review. Section 1 identifies our key data sources; section 2 describes the methods we used to answer questions 1 and 2; and section 3 covers the methods for question 3.
Section 1: Data Sources
To answer our research questions, we used data from the following sources:
Table 20: Data Sources Used in GAO’s Analyses
Data file Type of information in file used in analyses Years of data analyzed
Used for question
Current Population Survey (CPS) For all CPS data, we limit our analysis to individuals ages 16 and over
CPS basic household survey, including outgoing rotation group earnings modules
General and earnings information about employed labor force
2005, 2012 (various months)
1, 2, 3
CPS Contingent Work Supplement (CWS)
Information about employed labor force, including identification of contingent workers and alternative work arrangements
1995, 1999, 2005
1, 2, 3

Page 33 GAO-15-168R Contingent Workforce
CPS Disability Supplement Information about employed labor force, including identification of temporary (i.e., contingent) workers
2012 1, 3
CPS Annual Social and Economic Supplement (ASEC)
In part, information on annual earnings, benefits, income, and program participation for employed labor force
2012 3
General Social Survey (GSS) Information about employed labor force, ages 18 and over
2006, 2010 1, 2
Quality of Working Life Module (QWL)
In part, information about employed labor force, including identification of alternative work arrangements and perceptions about employment, ages 18 and over
2006, 2010 1, 2
Survey of Income and Program Participation (SIPP)
Information about employed labor force, including identification of contingent workers, ages 15 and over (some data used are from a working paper)
2004, 2008 1, 2
Current Employment Statistics (CES)
Information about jobs by industry, age range is not explicitly restricted
1995-2014 1, 2
Occupational Employment Statistics (OES)
Information about jobs by occupation and within industries, age range is not explicitly restricted (data used are from an external study)
Selected years from
1990 through 2009
2
Source: GAO analysis of various data sources. | GAO-15-168R
While the minimum ages of respondents varied slightly, the data sources covering workers (as opposed to jobs) were representative of the employed labor force.
Throughout our analyses, we generally only report estimates from survey data where the maximum margin of error was within 15 percentage points. However, occasionally we report estimates with larger margins of error because we deemed them reliable representations of given findings due to the statistical significance of large differences between comparison groups. In all cases, we report the applicable margins of error (i.e., the maximum half-width of the 95 percent confidence interval around the estimate). In some cases, the confidence intervals around our estimates are asymmetrical; however, we present the maximum half-width for simplicity and for a consistent and conservative representation of the sampling error associated with our estimates.
Additional details about the datasets follow; for more information, refer to the technical documentation associated with each dataset.
Current Population Survey (CPS)
The CPS is designed and administered jointly by Census and the Bureau of Labor Statistics (BLS). It is the source of official government statistics on employment and unemployment in the United States. The basic monthly survey is used to collect information on employment, such as employment status, occupation, and industry, as well as demographic information, such as age, sex, race, marital status, educational attainment, and family structure, among other things. The survey is based on a sample of the civilian, non-institutionalized population of the United States.

Page 34 GAO-15-168R Contingent Workforce
Using a multistage stratified sample design, about 60,000 households are selected on the basis of area of residence to represent the country as a whole and individual states.
CPS Outgoing Rotation Group Earnings Module
Earnings data in the CPS are collected from approximately one-fourth of the CPS basic monthly sample, limited to wage and salary workers. All self-employed workers, both incorporated and unincorporated, are excluded from the CPS earnings module. The CPS monthly survey is administered to each household for four sequential months, followed by eight months out of the sample, and then again for an additional four sequential months. Each month, those respondents in their fourth or eighth survey month (the “outgoing rotation group”) who are wage or salary workers are administered the earnings module. Earnings data include usual weekly earnings, representing earnings before taxes and other deductions, and include any overtime pay, commissions, or tips usually received (at the main job in the case of multiple jobholders). The earnings module also includes information about usual hours worked per week, and actual hours worked last week. This report uses data from the 2012 May, June, July, and August earnings modules.
CPS Contingent Work Supplement (CWS)
Census has administered the February CWS five times—in 1995, 1997, 1999, 2001, and 2005—to collect information on the contingent workforce. BLS designed the CWS to produce estimates of the number of workers in contingent jobs—that is, jobs structured to last only a limited period of time—as well as other information about employment and benefits, among other things. In addition, the supplement collected information on several alternative work arrangements. Using information collected in the supplement, BLS developed three estimates of the contingent workforce, in part to assess the impact of different assumptions about which factors may indicate contingent employment. All employed persons except unpaid family members are included in the supplement. For persons holding more than one job, the questions refer to the characteristics of their main job—the job in which they work the most hours. This report uses data from the February 1995, 1999, and 2005 CWS.
CPS Annual Social and Economic Supplement (ASEC)
The ASEC provides supplemental data on work experience, such as weeks and hours worked, total income and income components, such as earnings, noncash benefits, and program participation, among other things. Data on employment and income refer to the preceding calendar year, although demographic data refer to the time of the survey. This file also contains data covering nine noncash income sources: the Supplemental Nutritional Assistance Program (SNAP, formerly known as the federal Food Stamp Program), school lunch program, employer-provided group health insurance plan, work-provided pension plan, personal health insurance, Medicaid, Medicare, CHAMPUS or military health care, and energy assistance. According to Census, the ASEC is a high quality source of information used to produce the official annual estimate of poverty, and estimates of a number of other socioeconomic and demographic

Page 35 GAO-15-168R Contingent Workforce
characteristics, including income, health insurance coverage, educational attainment, marital status, and family structure. This report uses data from the March 2012 ASEC.64
CPS Disability Supplement
In May 2012, Census administered the Disability Supplement to the Current Population Survey. This supplement was designed to measure data in specific areas related to the employment of persons with disabilities. The supplement gives labor force participation rates, work history, barriers to employment, and types of workplace accommodations for persons with disabilities and those without disabilities. The supplement also includes the question: “Some people are in jobs that last only for a limited time or until the completion of a project. Is your job temporary?” This variable is available for all currently employed survey respondents who completed the May 2012 CPS Disability Supplement. We used this variable to obtain a recent population of workers in temporary jobs. We merged this population, from May 2012, with data from the March 2012 ASEC, and with data from the May, June, July, and August 2012 earnings modules from the basic monthly CPS surveys.
General Social Survey (GSS) and Quality of Working Life (QWL) Module
The GSS, conducted annually or biannually since 1972, collects national data on social characteristics and attitudes, including information on workers in alternative work arrangements. The GSS is administered by NORC at the University of Chicago, and contains a standard core of demographic and attitudinal questions as well as additional questions related to topics of special interest. The GSS is administered as a nationally representative sample of households and includes weights for estimating population proportions for adults ages 18 and above. While the GSS is not specifically designed to generate labor force estimates, it includes several questions that enable identification and analysis of workers in various work arrangements in some years.
The QWL survey module collects information about respondents’ work arrangements and perceptions about their employment, among other things. The National Institute of Occupational Safety and Health developed the questions in the QWL module, and NORC has administered the module through a grant from the National Science Foundation every 4 years beginning in 2002 (completed surveys available for 2002, 2006, 2010, and 2014). We used data from the 2006 and 2010 QWL modules and full GSS (data from the 2014 GSS were released in March 2015, after our analysis was complete).
Survey of Income and Program Participation (SIPP)
Administered by Census, SIPP is a household-based survey designed as a continuous series of national panels. Census uses a two-stage stratified design to produce a nationally representative panel of respondents who are interviewed over a period of approximately three to four years. Within a SIPP panel, the entire sample is interviewed at various intervals called
64 The ASEC sample includes March CPS respondents and it also includes the outgoing rotation group in February and the incoming rotation group in April (i.e., about one-quarter of the February and April CPS respondents).

Page 36 GAO-15-168R Contingent Workforce
waves (from 1983 through 2013, generally 4-month intervals). In addition to income and public program participation, the SIPP includes data on other factors of economic well-being, demographics, and household characteristics. We used data from the 2004 and 2008 SIPP.
Current Employment Statistics (CES)
The CES program is a monthly survey conducted by BLS which provides employment, hours, and earnings estimates based on payroll records. The CES sample is a random sample of worksites, clustered by unemployment insurance account number and stratified by state, industry, and employment size. The active CES sample includes approximately one-third of all nonfarm payroll employees in the United States—covering about 144,000 business and government agencies, which represent about 554,000 worksites. We used data from the 1995 through 2014 CES.
Occupational Employment Statistics (OES)
The OES program is a federal-state cooperative between BLS and State Workforce Agencies which produces estimates of employment and wages for about 800 occupations. The OES covers all full-time and part-time wage and salary workers in nonfarm industries in the United States, surveying approximately 200,000 establishments every six months and taking 3 years to complete a sample of 1.2 million establishments. Data from the self-employed are not collected or included in the estimates. The OES survey draws its sample from unemployment insurance files and is stratified by metropolitan and non-metropolitan area, industry, and size. We did not use OES data directly, but analyzed a study that relied on OES data.
Data Reliability
For each of the datasets described above, we conducted a data reliability assessment of selected variables including those used in our analysis. We reviewed technical documentation and related publications and websites with information about the data. We spoke with the appropriate officials at each agency or company to review our plans for analyses, as well as to resolve any questions about the data and any known limitations. We also conducted electronic testing, as applicable, to check for logical consistency, missing data, and consistency with data reported in technical documentation. We determined that the variables that we used from the data we reviewed were reliable for the purposes of this report.
Section 2: Analyses of Size and Characteristics of Contingent Workforce
This section discusses the data and methods we used to examine (1) the size of the contingent workforce, and (2) the characteristics and employment experiences of contingent versus standard workers. We analyzed data from various sources about the contingent workforce.

Page 37 GAO-15-168R Contingent Workforce
CPS Contingent Work Supplement (CWS)
To analyze the size of the contingent workforce using CWS data, we estimated the percent of contingent workers in the employed labor force based on different definitions of contingent employment. We examined data from the 1995, 1999, and 2005 CWS, and limited our analysis to individuals ages 16 and older who responded that they were employed. For each of the three years, we estimated the proportion of the employed labor force consisting of workers included in BLS’s three estimates of the contingent workforce, as well as workers identified as being in an alternative work arrangement.
BLS defines contingent workers as those who do not have an implicit or explicit arrangement for long-term employment. BLS does not include those workers who do not expect to continue in their jobs for personal reasons, such as retirement or returning to school. BLS developed three successively broader estimates of the contingent workforce based on this definition.65
• Estimate 1: “Wage and salary workers who expect their jobs will last for an additional year or less and who had worked at their jobs for 1 year or less. Self-employed workers and independent contractors are excluded from the estimates. For temporary help and contract workers, contingency is based on the expected duration and tenure of their employment with the temporary help or contract firm, not with the specific client to whom they were assigned.” BLS explains that the rationale for excluding self-employed workers and independent contractors from this estimate “is that people who work for themselves, by definition, have ongoing employment arrangements, although they may face financial risks.”
• Estimate 2: “Workers including the self-employed and independent contractors who expect their employment to last for an additional year or less and who had worked at their jobs (or been self-employed) for 1 year or less. For temporary help and contract workers, contingency is determined on the basis of the expected duration and tenure with the client to whom they have been assigned, instead of their tenure with the temporary help or contract firm.”
• Estimate 3: “Workers who do not expect their jobs to last. Wage and salary workers are included even if they already have held the job for more than 1 year and expect to hold the job for at least an additional year. The self-employed and independent contractors are included if they expect their employment to last for an additional year or less and they had been self-employed or independent contractors for 1 year or less.”
We calculated each BLS estimate of the contingent workforce as a percentage of all employed workers in 1995, 1999, and 2005. We also compared the number of temporary workers identified in the 2005 CWS to the number of temporary workers identified in the May 2012 CPS Disability Supplement, in the context of the total employed labor force for both years. Because the question about temporary work in the CWS is not asked of self-employed workers, we estimated the number of temporary workers in the May 2012 CPS Disability Supplement both including and excluding the self-employed for consistency.
65 All descriptions are from Bureau of Labor Statistics, “Contingent and Alternative Employment Arrangements, February 2005,” Bureau of Labor Statistics News Release (Washington, DC, July 27, 2005).

Page 38 GAO-15-168R Contingent Workforce
Our previous work identified 8 subgroups of workers using the CWS: (1) on-call workers/day laborers;66 (2) agency temps; (3) independent contractors; (4) contract company workers; (5) self-employed workers; (6) direct-hire temps; (7) standard part-time workers; and (8) standard full-time workers.67 We identified the first four subgroups using variables in the CWS that BLS created to identify these workers. We identified self-employed workers using a CPS variable identifying the class of worker as self-employed (among those workers not already included in the first 4 groups; e.g., independent contractors). As in our prior work, we identified direct-hire temps using several variables in the CWS. We included workers who indicated that although they did not work for a temporary employment agency, their job was temporary or they could not stay in their job as long as they wished for one of the following reasons: (a) they were working only until a specific project was completed; (b) they were temporarily replacing another worker; (c) they were hired for a fixed period of time; (d) their job was seasonal; or (e) they expected to work for less than a year because their job was temporary.68 Among those remaining workers not already identified as being in an alternative work arrangement, we identified standard part-time workers and standard full-time workers using a CPS variable identifying worker status—part-time work indicates fewer than 35 hours per week and full-time generally indicates at least 35 hours per week. We also identified a population of “core contingent” workers, in which we included agency temps, direct-hire temps, contract company workers, on-call workers, and day laborers. We calculated each subgroup of workers as a percentage of all employed workers in 2005 (most recent CWS data available). We used percentages for 1995 and 1999 from our prior published work.69
Using the 2005 CWS data, we analyzed various demographic and employment characteristics of core contingent workers or workers in alternative work arrangements, as applicable, and compared them to those of standard full-time workers. The characteristics we analyzed included age, sex, race, level of education, proportion of workers with low family income (defined as below $20,000), and responses to questions about why workers had their respective jobs and whether certain workers would like to have different jobs.
70
Findings from our analysis of CWS data are generalizable to the employed labor force and to the contingent workforce or other worker groups, as defined. All estimates and calculations were weighted using the PWSUPWGT variable, and confidence intervals were calculated according to BLS guidance using parameters provided by BLS.
We only included valid responses in our analyses of characteristics; for example, we disregarded non-responses as necessary.
66 As in GAO’s previous work, we combined on-call workers and day laborers because the definitions and characteristics of these workers are similar and the number of day laborers alone was not large enough to be statistically significant. 67 GAO/HEHS-00-76; GAO-06-656. 68 Reasons (a) through (d) correspond to CWS follow-up questions that ask specifically about those conditions (variables PES1A, PES1B, PES1C, and PES1D). Those four questions are mutually exclusive and asked consecutively; for instance, if a respondent answers PES1A affirmatively that they are only working until a specific project is completed, then they are not asked the three remaining questions. Three CWS questions relate to reason (e) that they expected short-term employment because their jobs were temporary: PES1I (for workers who expect their jobs to last less than a year), PES1IDK (for workers who don’t know how long their job will last), and PES1IIN (for workers who left the job they held last week). Those workers who responded to one of these three questions that the reason is because the “job is temporary” were included. 69 GAO-06-656. 70 To analyze the reasons why workers had their respective jobs, we included agency temps’ responses to mutually exclusive questions about why they had temporary jobs and why they worked for temp agencies. For other types of workers, we analyzed separate questions asking specifically why they held their respective jobs.

Page 39 GAO-15-168R Contingent Workforce
General Social Survey (GSS)
To analyze the size, characteristics, and demographics of the contingent workforce using the GSS, we analyzed data from the core questionnaire and from a special topic module on the Quality of Working Life (QWL) in 2006 and 2010. We identified similar subgroups of workers as in the CWS. We identified on-call workers, agency temps, independent contractors, and contract company workers from a question in the QWL module (variable is WRKTYPE). Among those remaining workers not already identified as being in an alternative work arrangement, we identified standard part-time workers as those who worked fewer than 35 hours per week and standard full-time as those who worked at least 35 hours per week, and identified self-employed workers using a question about self-employment status (variable is WRKSLF). The GSS does not identify direct-hire temps or day laborers as separate work arrangements. As with the CWS data, we also identified a population of “core contingent” workers, in which we included agency temps, contract company workers, and on-call workers. We calculated each subgroup of workers as a percentage of all employed workers in 2006 and 2010.
Using the 2010 GSS data (and 2006 GSS data for a question about family income), we analyzed various demographic and employment characteristics of core contingent workers and workers in alternative work arrangements, as applicable, and compared them to those of standard full-time workers. We do not present distributions of some individual subgroups because their respective sample sizes were too small to produce reliable estimates. We analyzed the following demographic characteristics: age, sex, race, level of education as well as the proportion of workers with low family income (defined as below $20,000). We also analyzed responses to questions about job security, satisfaction with fringe benefits, overall job satisfaction, and workplace safety. We only included valid responses in our analyses of characteristics and experiences; for example, we disregarded non-responses as necessary.
Findings from our analysis of GSS data are generalizable to the employed labor force and at the level of the individual subgroups analyzed, except where noted otherwise (e.g. sample sizes often too small to compute reportable estimates for self-employed workers). When generating estimates from GSS data, we followed guidance in the codebook and used population weight and variance variables (WTSSALL and VSTRAT) to ensure that our standard errors appropriately accounted for the survey sample design.
Survey of Income and Program Participation (SIPP)
To estimate the percentage of contingent workers in the employed labor force, we obtained the Wave 1 core data for both the 2004 and 2008 SIPP panels. We did not use data from the 2014 SIPP panel because the first wave was being collected during the audit and was not yet available. We used the SIPP variable that indicated the respondent had a paid job during the reference period (EPDJBTHN) for the denominator and the variable that indicated the paid work was contingent (ECFLAG) for the numerator to estimate the percent of employed workers who were in contingent work. According to Census officials, the contingent work variable (ECFLAG) consists of respondents who state that they have some “other” work arrangement—defined as including odd jobs, on-call work, day labor, one-time jobs, and informal arrangements, such as babysitting, lawn mowing, or leaf raking for neighbors—and that they do not have a definite

Page 40 GAO-15-168R Contingent Workforce
arrangement to work on an ongoing basis.71
Findings from our analysis of SIPP data are generalizable to the employed labor force and to the contingent workforce, as defined in the SIPP data. Per the SIPP technical documentation, we used population weight and variance variables (WPFINWGT and GVARSTR) to ensure that our standard errors appropriately accounted for the survey sample design. We also followed Census technical documentation to scale the population weight variable we used (WPFINWGT) so that the weights summed up correctly to the U.S. population eligible for participation in SIPP.
The SIPP paid work and contingent work variables are defined for people who are age 15 or older.
To analyze the employment characteristics of contingent workers, specifically job transitions, we reviewed a 2009 Census working paper which provided information on the month-to-month employment status of contingent workers based on SIPP data.72 The data we used were from accompanying tables of data analysis (“Table 6. Employed SIPP Estimate 1 Contingent Workers by Month by Employment Status in the Following Month: 2001 and 2004;” and “Table 7. People Employed as SIPP Estimate 1 Contingent Worker in January of Year: 2001 and 2004”), and were based on the paper’s narrowest estimate of contingent workers, constructed to reflect a population similar to BLS’ Estimate 1. Our analysis focused on the most recent data provided in the report—monthly data for 2004. We converted the 90 percent confidence intervals provided in the working paper to 95 percent confidence intervals to be consistent with other estimates in our report. The 2009 working paper also highlighted a contrast between the turnover experienced by contingent workers and that of the overall labor force by citing a 2004 Census report on labor force dynamics.73
We examined the 2004 report and estimated a monthly job turnover rate of 1.9 percent for the overall labor force by multiplying the average turnover rate (5.5 percent) times “turnover due to separations” (33.8 percent). We used generalized variance functions from the 2008 SIPP technical documentation and guidance from a Census official to calculate 95 percent confidence intervals for our estimates.
Current Employment Statistics (CES)
To illustrate temporary help services as a percentage of total nonfarm employment, we calculated annual proportions using CES data on “Employment, Hours, and Earnings” and specifically, estimates of the number of workers employed in temporary help services and total nonfarm from 1995 to 2014. BLS provided us with historical standard errors for the annual estimates dating back to 2003. As a result of a coding change from the Standard Industrial Classification (SIC) system to North American Industry Classification System (NAICS), comparable pre-2003 standard errors were not available because data for these years were reconstructed to conform with the NAICS. As a result of discussion with BLS officials, we used the maximum standard error reported between 2003 and 2014 to estimate a confidence interval, which we applied to the entire period analyzed (1995-2014).
71 ECFLAG is constructed from the SIPP variables JBORSE, which asks respondents whether they work for an employer, are self-employed, both, or are in some other arrangement, and the CONCHK variables, which ask respondents if they have a definite arrangement with an employer to work on an ongoing basis. 72 Thomas Palumbo, "Using the Survey of Income and Program Participation (SIPP) to Measure Workers in Contingent and Alternative Employment Arrangements" (paper presented at the 2009 Annual Conference of the Eastern Economic Association, 2009). As a working paper, this research underwent a more limited review than would official Census publications. 73 Alfred O. Gottschalck, U.S. Census Bureau, Dynamics of Economic Well-Being: Labor Force Turnover, 1996-1999, Current Population Reports, p. 70-96 (Washington, D.C.: July 2004), Table 1.

Page 41 GAO-15-168R Contingent Workforce
To assess the extent to which employment in temporary help services is cyclical, we used seasonally adjusted “12-month percent change” estimates from CES data on “Employment, Hours, and Earnings.” As a result of our analysis, we found that employment swings in temporary help are highly cyclical, with job numbers decreasing at a higher rate than overall employment in recessions and increasing at a higher rate than overall employment in recoveries (see fig. 6).
Figure 6: Estimated Annual Percentage Change in Temporary Help Services and Total Nonfarm Employment, 1995-2014
Note: The data shown are seasonally adjusted estimates and annual changes are based on December to December employment. Each estimate for temporary help services and total nonfarm has a 95 percent confidence interval of within +/- 8.8 and 0.4 percentage points, respectively. These confidence intervals are based on the largest standard errors reported from 2003 through 2014 as comparable pre-2003 standard errors were not available. Recession periods are identified by the National Bureau of Economic Research’s Business Cycle Dating Committee.
Occupational Employment Statistics (OES)
To analyze changes in the occupational distribution of staffing services—a subgroup of contingent workers—we examined a 2012 study based on OES data.74
74 Matthew Dey, Susan N. Houseman, and Anne E. Polivka, “Manufacturers’ Outsourcing to Staffing Services,” ILRReview, vol. 65, no. 3 (July 2012). As the authors do, we use the term “staffing services” in this report. This industry is also referred to as employment services and, according to current industry classifications, consists of three components: (1) temporary help services; (2) professional employer organizations; and (3) employment agencies and executive search services. Temporary help is by far the largest, with 81 percent of industry employment in the 2014 CES data.
The study examined 1990-2009 OES data (selected years) and illustrated that, as of 2000, the proportion of workers in the staffing services industry employed in blue collar occupations had surpassed the proportion employed in office and administrative support. We calculated subtotals for blue collar, office and administrative support, and all other occupations by adding up the proportions employed in each occupation grouping presented in the OES-based study. Standard errors for 1990 were not directly available and we estimated a confidence interval based on the range of confidence intervals from 1996 through 2009.

Page 42 GAO-15-168R Contingent Workforce
CPS Data on Part-Time Workers
To identify the percentage of the employed labor force who work part-time involuntarily, we used data from BLS’s CPS Labor Force Statistics historical table: “A-8. Employed persons by class of workers and part-time status.” Table A-8 presents estimates of the number of part-time workers as well as the total labor force. For our estimated proportions of the labor force who worked part-time for various reasons, we calculated the total employed labor force (i.e., the denominator) by combining the totals employed in “Agriculture and Related Industries” and “Nonagricultural Industries.” For the numerators, we used the total numbers of workers who were “Part-Time for Non-economic Reasons;” “Part-Time for Economic Reasons” (i.e., involuntary part-time); and part-time because they “Could only find part-time work” (a subset of “Economic Reasons”).
To estimate the standard errors that we used to calculate 95 percent confidence intervals around our estimated proportions, we utilized the generalized variance functions presented in technical documentation.75
The documentation did not provide generalized variance function parameters for “Could only find part-time work.” To avoid underestimating our standard errors for this estimate, we utilized the largest parameter listed in the documentation.
Section 3: Analyses of Earnings, Benefits, and Poverty Measures of Contingent Workers
This section discusses the data and methods we used to examine any differences in earnings, benefits, and measures of poverty between contingent and standard workers. To explore these issues, we identified a population of contingent workers in the May 2012 CPS Disability Supplement and merged this population with other CPS datasets to obtain information about workers’ earnings, benefits, income, and other related economic measures. We conducted multivariate regression analyses on various measures of earnings and on the probability of workers participating in a work-provided retirement plan, and we examined descriptive statistics on workers’ access to health insurance, poverty status, and participation in income-related public assistance programs. We limited all analyses to individuals age 16 and older.
We used two datasets to conduct our analyses of earnings, benefits, and measures of poverty. Both datasets consist of observations from the May 2012 CPS Disability Supplement, which contains the survey question, “Is your job temporary?”76
The temporary job question from the May 2012 CPS Disability Supplement served as the basis for our regression analyses because most workers included in BLS’ estimates of the size of the contingent workforce responded “yes” to a nearly identical question in the CWS. In the 2005 CWS, 86.1 percent, 73.1 percent, and 70.6 percent of contingent workers in Estimates 1, 2, and 3, respectively responded “yes” to the first temporary work screening question (Q1), “Is your job
For the purpose of these analyses, workers who responded “yes” to this question are identified as contingent workers, and workers who responded “no” to this question are considered standard workers (i.e., non-contingent). Workers who did not respond or responded “don’t know” were excluded from the analyses.
75 “Employment and Earnings”, Household Data (“A” tables, monthly; “D” tables, quarterly) February 2006. 76 Variable name PESD18 in the 2012 CPS Disability Supplement.

Page 43 GAO-15-168R Contingent Workforce
temporary?”77
Not all workers who responded “yes” were included in the BLS estimates because BLS includes and excludes workers for a variety of reasons (see fig. 7 for an illustration of Estimate 1). For example, BLS excludes individuals who do not plan to continue in their job for personal reasons, such as retirement or returning to school, provided they would have the option to keep the job otherwise. In addition, BLS includes some workers who did not respond that their job was temporary based on their responses to other questions; for example, responses that indicate they expect to stay in their current job for one year or less and have worked for their current employer for one year or less.
Figure 7: Identification of Workers in Bureau of Labor Statistics (BLS) Estimate 1 of the Contingent Workforce, 2005
Note: Each estimate shown has a 95 percent confidence interval of within +/- 9% of the estimate itself, except the 0.25 mil. included from Q2 (+/- 25%) and the 0.09 mil. from other (+/-41%). a BLS estimates represent the employed labor force (estimated at 139.0 million in 2005). However, question 1 is not asked of the self-employed; they are asked other questions to determine whether their jobs are temporary, though they are not included in Estimate 1 (shown in the figure). Question 2 is asked of remaining respondents in the universe who did not answer “yes” to question 1 and who are in the same job they held the previous week. b
Additional workers are identified with other questions; for instance, those who do not view their jobs as temporary, but who have been and expect to be at their job for one year or less.
Since BLS does not include everyone who responds “yes” to Q1 in its contingent workforce estimates, we performed additional checks to ensure that our analysis population was not biased. Using 2005 CWS data, we compared the characteristics of those who responded “yes” to Q1 (i.e. those who would have been our 2012 proxy population of contingent workers) with those in BLS’ three estimates of the contingent workforce. We found that respondents in all four groups were similar. For example, the estimated mean hourly earnings of those who responded “yes” to Q1 (i.e., the equivalent of our 2012 proxy population) was $13.57 compared to an estimated range of $12.45 to $14.35 for BLS’ three contingent worker populations (see table 77 The complete phrasing of the question in the 2005 CWS (variable PES1) was, “Some people are in temporary jobs that last only for a limited time or until the completion of a project. Is your job temporary?” The complete phrasing of the question in the 2012 Disability Supplement (variable PESD18) was, “Some people are in jobs that last only for a limited time or until the completion of a project. Is your job temporary?” Estimates presented have 95 percent confidence intervals of within +/- 3.0, 3.7, and 2.9 percentage points, respectively.
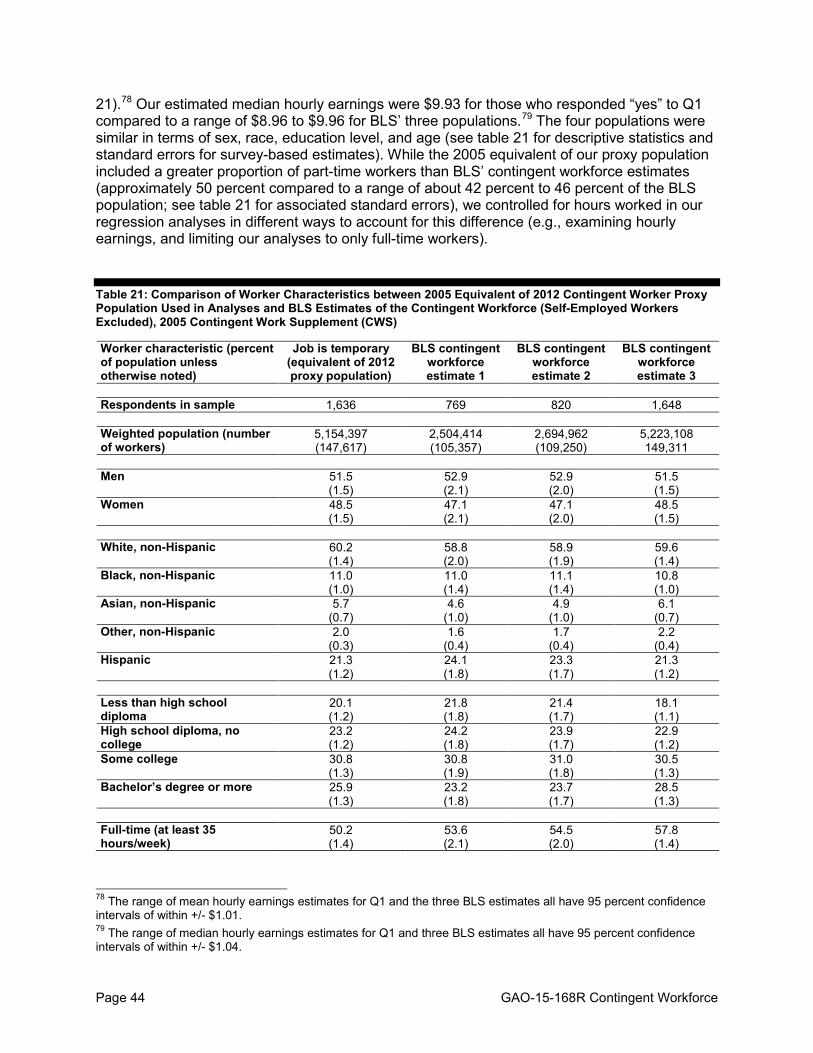
Page 44 GAO-15-168R Contingent Workforce
21).78 Our estimated median hourly earnings were $9.93 for those who responded “yes” to Q1 compared to a range of $8.96 to $9.96 for BLS’ three populations.79
The four populations were similar in terms of sex, race, education level, and age (see table 21 for descriptive statistics and standard errors for survey-based estimates). While the 2005 equivalent of our proxy population included a greater proportion of part-time workers than BLS’ contingent workforce estimates (approximately 50 percent compared to a range of about 42 percent to 46 percent of the BLS population; see table 21 for associated standard errors), we controlled for hours worked in our regression analyses in different ways to account for this difference (e.g., examining hourly earnings, and limiting our analyses to only full-time workers).
Table 21: Comparison of Worker Characteristics between 2005 Equivalent of 2012 Contingent Worker Proxy Population Used in Analyses and BLS Estimates of the Contingent Workforce (Self-Employed Workers Excluded), 2005 Contingent Work Supplement (CWS)
Worker characteristic (percent of population unless otherwise noted)
Job is temporary (equivalent of 2012 proxy population)
BLS contingent workforce estimate 1
BLS contingent workforce estimate 2
BLS contingent workforce estimate 3
Respondents in sample 1,636 769 820 1,648 Weighted population (number of workers)
5,154,397 (147,617)
2,504,414 (105,357)
2,694,962 (109,250)
5,223,108 149,311
Men 51.5
(1.5) 52.9 (2.1)
52.9 (2.0)
51.5 (1.5)
Women 48.5 (1.5)
47.1 (2.1)
47.1 (2.0)
48.5 (1.5)
White, non-Hispanic 60.2
(1.4) 58.8 (2.0)
58.9 (1.9)
59.6 (1.4)
Black, non-Hispanic 11.0 (1.0)
11.0 (1.4)
11.1 (1.4)
10.8 (1.0)
Asian, non-Hispanic 5.7 (0.7)
4.6 (1.0)
4.9 (1.0)
6.1 (0.7)
Other, non-Hispanic 2.0 (0.3)
1.6 (0.4)
1.7 (0.4)
2.2 (0.4)
Hispanic 21.3 (1.2)
24.1 (1.8)
23.3 (1.7)
21.3 (1.2)
Less than high school diploma
20.1 (1.2)
21.8 (1.8)
21.4 (1.7)
18.1 (1.1)
High school diploma, no college
23.2 (1.2)
24.2 (1.8)
23.9 (1.7)
22.9 (1.2)
Some college 30.8 (1.3)
30.8 (1.9)
31.0 (1.8)
30.5 (1.3)
Bachelor’s degree or more 25.9 (1.3)
23.2 (1.8)
23.7 (1.7)
28.5 (1.3)
Full-time (at least 35 hours/week)
50.2 (1.4)
53.6 (2.1)
54.5 (2.0)
57.8 (1.4)
78 The range of mean hourly earnings estimates for Q1 and the three BLS estimates all have 95 percent confidence intervals of within +/- $1.01. 79 The range of median hourly earnings estimates for Q1 and three BLS estimates all have 95 percent confidence intervals of within +/- $1.04.

Page 45 GAO-15-168R Contingent Workforce
Part-time (less than 35 hours/week)
49.8 (1.4)
46.3 (2.1)
45.4 (2.0)
42.0 (1.4)
Mean age (years) 35.1
(0.4) 32.5 (0.5)
33.0 (0.5)
36.1 (0.4)
Mean hourly earnings ($/hour) 13.57
(0.39) 12.45 (0.51)
12.68 (0.49)
14.35 (0.42)
Median hourly earnings ($/hour)
9.93 (0.14)
8.96 (0.34)
9.47 (0.28)
9.96 (0.09)
Mean weekly earnings ($/week)
400 (12)
379 (16)
386 (15)
460 (13)
Median weekly earnings ($/week)
280 (7)
280 (11)
288 (10)
318 (9)
Detailed industry group Construction 11.6
(1.0) 13.0 (1.5)
13.0 (1.4)
11.6 (0.9)
Retail trade 7.5 (0.8)
6.4 (1.0)
6.2 (1.0)
6.1 (0.7)
Professional and technical services
6.1 (0.7)
6.6 (1.0)
7.5 (1.0)
6.5 (0.7)
Administrative and support services
12.5 (1.0)
11.4 (1.4)
12.9 (1.4)
11.3 (1.0)
Educational services 19.5 (1.1)
17.1 (1.5)
16.4 (1.4)
20.8 (1.1)
Arts, entertainment, and recreation
3.2 (0.5)
3.6 (0.8)
3.3 (0.8)
2.7 (0.5)
Food services and drinking places
4.8 (0.6)
5.5 (1.0)
5.3 (1.0)
4.1 (0.6)
Detailed occupation group Management 2.4
(0.4) 1.6
(0.5) 1.5
(0.4) 3.4
(0.5) Education, training, and library
11.7 (0.9)
9.7 (1.2)
9.0 (1.1)
13.2 (1.0)
Arts, design, entertainment, sports, and media
4.3 (0.6)
4.3 (0.9)
4.7 (0.9)
4.0 (0.6)
Food preparation and serving related
5.3 (0.6)
5.7 (1.0)
5.5 (0.9)
4.8 (0.6)
Building and grounds cleaning and maintenance
4.0 (0.6)
4.8 (0.9)
4.6 (0.9)
3.5 (0.5)
Sales and related 6.8 (0.7)
4.9 (0.8)
5.0 (0.8)
5.2 (0.6)
Office and administrative support
16.4 (1.1)
19.4 (1.7)
18.9 (1.6)
15.9 (1.0)
Construction and extraction 10.0 (0.9)
11.4 (1.4)
11.5 (1.3)
10.6 (0.9)
Production 5.9 (0.7)
4.5 (0.8)
4.3 (0.8)
5.5 (0.6)
Transportation and material moving
6.9 (0.8)
9.1 (1.3)
9.1 (1.2)
6.6 (0.7)
Source: GAO analysis of data from the 2005 Contingent Work Supplement to the Current Population Survey. | GAO-15-168R
Note: Populations presented in the table include workers who answered “yes” to the question “Is your job temporary?” (variable is PES1) and BLS’ three estimates of the contingent workforce (variables are PRCONDF1, PRCONDF2, and PRCONDF3). Because self-employed workers are not asked the question “Is your job temporary?” self-employed workers are excluded from all populations in this table. Earnings averages are for positive earners only. Standard errors are presented in parentheses below the estimates.

Page 46 GAO-15-168R Contingent Workforce
Constructing the Merged Datasets
We merged data by matching respondents from the May 2012 CPS Disability Supplement with additional CPS datasets to obtain earnings, benefits, and related information for contingent and standard workers. We used the first of the two datasets, the May-Annual Social and Economic Supplement (May-ASEC) merged dataset, to analyze differences in annual earnings, as well as participation in work-provided retirement plans, health insurance coverage, and poverty measures such as family income-to-poverty ratios and participation in selected public assistance programs. The second dataset, the May-Merged Outgoing Rotation Group (May-MORG) merged dataset, is used to analyze differences in weekly and hourly earnings.
Data on annual earnings and retirement plan participation in the ASEC are only collected for individuals who worked during calendar year 2011. Similarly, data on weekly and hourly earnings are only collected in the outgoing rotation modules. These data were present in the May 2012 CPS Disability Supplement for the roughly quarter of our sample who were in their outgoing rotation month in May 2012. However, for the majority of the May-MORG merged dataset, these data were obtained from months June, July, and August 2012. Only those individuals who were employed both in May 2012 and during their outgoing rotation month are represented in the May-MORG merged dataset. Therefore, individuals who were continuously employed over multiple months are more likely to be represented in analyses conducted on the merged datasets than individuals with intermittent employment.
Merging the datasets
The May-ASEC merged dataset consists of observations from the May 2012 CPS Disability Supplement merged with observations from the March 2012 CPS Annual Social and Economic Supplement (ASEC). Due to the rotation structure of the CPS, approximately half of the units who were interviewed in May 2012 (i.e., present in the May 2012 CPS Disability Supplement) were also interviewed for the 2012 ASEC (i.e., present in the ASEC). Units are interviewed for four consecutive months; therefore, those who were in their first or second interview month in March were also interviewed in May. Following guidance from Census, we merged individual person records from the two datasets by household ID (parts 1 and 2) and person line number. We then dropped from the merged sample any observations where sex, race, or Hispanic status did not match in the two samples, or where age differed by more than 1 year across the two samples. Following guidance from Census, we then constructed a post-stratification adjustment to the population weights in which we raked the sample by the race/ethnicity of the householder and the presence of children in the household. This raking was done to rebalance the merged sample, to take account of the ASEC’s oversampling of a “CHIP expansion sample,” which consists of any household in which the householder is minority (Hispanic or non-white or both) and/or contains at least one child (18 years or younger). The ASEC population weights take account of the oversampling of the CHIP expansion sample, but other supplement weights do not. Therefore, we constructed a post-stratification adjustment to the population weights to ensure that members of the CHIP expansion sample are appropriately represented in our analysis. We also examined the distribution of additional characteristics in the full May sample and the merged sample, including sex, education, and age. However, we did not identify any additional differences that warranted further post-stratification adjustments to the population weights.

Page 47 GAO-15-168R Contingent Workforce
The May-MORG merged dataset consists of observations from the May 2012 CPS Disability Supplement merged with observations from the June, July, and August 2012 basic monthly files. As discussed in our previous section covering data sources used, individuals who are in their fourth or eighth interview month in the CPS and who meet certain employment criteria are administered a set of detailed earnings questions. Self-employed workers are not administered these earnings questions. Each month, therefore, only about one-quarter of the employed CPS sample is administered these questions. In order to obtain detailed earnings information for a larger portion of the May 2012 sample, we merged individuals in their first, second, and third (or fifth, sixth, and seventh) interview months with their outgoing rotation group data from August, July, or June (respectively); those in their fourth or eighth interview month are eligible to have earnings data present in the May sample itself. From the full May CPS, we restrict the sample to adult civilians. From the full June, July, and August CPS files, we restrict the sample to adult civilians in their fourth or eighth interview month. We merged the datasets using the household ID (parts 1 and 2) and person line number variables. After this merge, we restrict our earnings analyses to observations that were administered the May 2012 CPS Disability Supplement, and that answered either “yes” or “no” to the question, “Do you consider your job temporary?”
The sample frame for the May-MORG merged dataset is defined by both the May 2012 CPS Disability Supplement population and the population that responded to the outgoing rotation group earnings modules. BLS produces a different set of weights for each of these populations. Because the earnings questions are asked of only one quarter of the monthly CPS sample, BLS produces outgoing rotation group weights (also called the earnings weights) to ensure that the earnings module data reflect the demographic and economic characteristics of the weighted full sample data. BLS also produces a May 2012 CPS Disability Supplement weight, which adjusts for the response rate to the supplement. In addition, BLS produces a composited final weight, which is used to produce BLS labor force statistics. Normally, variables from the May 2012 CPS Disability Supplement are tabulated using the supplement weights, and variables from the earnings module are tabulated using the earnings weights (outgoing rotation group weights).
Our sample is based on earners and on the May 2012 CPS Disability Supplement sample frame because it is limited to individuals present in the supplement who answered the earnings module questions in May, June, July or August, and who answered the temporary work question from the May 2012 CPS Disability Supplement. In consultation with BLS, we therefore constructed a population weight for the merged sample defined by the ratio of the supplement weight to the individual’s composited final weight, multiplied by the earnings weight. We examined the characteristics of workers in the full May 2012 CPS Disability Supplement sample and of workers in the May-MORG merged dataset and did not find significant differences along the characteristics we examined (race, Hispanic ethnicity, education, sex, and age). We therefore did not make any additional post-stratification adjustments to the May-MORG merged dataset population weights.
Variance estimates using the merged datasets
Census has made a replicate weight file available for the May 2012 CPS Disability Supplement. However, the replicate weights are constructed for the full supplement dataset. In both the May-ASEC merged dataset and the May-MORG merged dataset used in this analysis, we are using a subset of the full supplement dataset (the merged sample) that will be reweighted up to the size of the employed labor force (defined as workers responding yes or no to the question about whether their jobs were temporary). Because of this, we determined that using the replicate

Page 48 GAO-15-168R Contingent Workforce
weights would be inappropriate for this analysis. In the absence of replicate weights, Census provides guidance for adjusting the standard errors of selected statistics from the CPS using generalized variance functions and parameters, including the standard errors of means, proportions, ratios, and population counts. However, Census does not provide any guidance for using generalized variance functions and parameters to adjust standard errors of regression coefficients. To take account of the CPS sampling structure in our multivariate analysis, we decided to use state of residence as a generalized variance stratification variable, because CPS samples are drawn independently within states. We assume sampling with replacement. We tested this approach by comparing selected estimates we obtained from the full May sample using the May replicate weights to estimates obtained from the full May sample using our variance estimating approach, and found the results to be consistent across model specifications. We therefore determined that our method was an acceptable approach to variance estimation in the merged datasets in which we could not use the replicate weights.
Sample Characteristics
Table 22 (below) presents the distribution of the variables used in the regression analyses for each of our four population samples. Estimates are shown for standard workers and for contingent workers. The first sample (sample A) is the May 2012 CPS Disability Supplement sample, restricted to individuals who responded “yes” or “no” to the question, “Do you consider your job temporary?” The second sample (sample B) is the subset of the first sample who were administered the earnings module in May, and who had positive values for weekly earnings. The third sample (sample C) is data from the May-MORG merged dataset, described above, who had positive values for weekly earnings. The fourth sample (sample D) is data from the May-ASEC merged dataset, described above, who had positive values for annual earnings. We used samples C and D for the regression analyses of earnings differences among standard and contingent workers.
• Sample A shows the characteristics of all standard and contingent workers identified in the May 2012 CPS Disability Supplement. This complete sample was not used for our analyses because most observations did not have earnings data.
• Sample B shows the characteristics of workers with earnings data from only the May 2012 outgoing rotation group. This sample can be used to compare the characteristics of these workers to those with earnings data obtained from later CPS months. This sample was also used in an iteration of our basic regression model to further test the robustness and validity of our May-MORG merged dataset and regression results (see below for comparison).
• Sample C shows the characteristics of standard and contingent workers in the 2012 May-MORG merged dataset, which was the sample used for our regressions of hourly and weekly earnings.
• Sample D shows the characteristics of standard and contingent workers in the 2012 May-ASEC merged dataset, which was the sample used for our regressions of annual earnings and participation in work-provided retirement plans. This sample was also used for our analyses of participation in work-provided health insurance plans and various measures of poverty and program participation.

Page 49 GAO-15-168R Contingent Workforce
Table 22: Characteristics of Standard (stnd.) and Contingent (cont.) Workers in Analysis Populations
Worker characteristic (percent of population unless otherwise noted)
Sample A
(stnd.)
Sample A
(cont.)
Sample B
(stnd.)
Sample B
(cont.)
Sample C
(stnd.)
Sample C
(cont.)
Sample D
(stnd.)
Sample D
(cont.) Respondents in sample 51,345 2,359 11,162 457 41,976 1,565 29,086 1,118 Men 53.0
(0.3) 53.9 (1.2)
51.7 (0.5)
52.5 (2.6)
51.8 (0.3)
54.3 (1.4)
53.3 (0.3)
55.5 (1.7)
Women 47.0 (0.3)
46.1 (1.2)
48.3 (0.5)
47.5 (2.6)
48.2 (0.3)
45.7 (1.4)
46.7 (0.3)
44.5 (1.7)
White, non-Hispanic 67.4
(0.2) 57.5 (1.2)
66.9 (0.5)
57.8 (2.6)
67.0 (0.3)
54.3 (1.5)
67.9 (0.3)
59.7 (1.7)
Black, non-Hispanic 10.2 (0.2)
10.3 (0.8)
10.7 (0.3)
9.8 (1.7)
10.3 (0.2)
11.1 (1.0)
10.0 (0.2)
8.7 (1.0)
Asian, non-Hispanic 4.9 (0.1)
6.3 (0.6)
5.0 (0.2)
4.5 (1.1)
5.1 (0.1)
6.6 (0.7)
5.1 (0.1)
5.6 (0.7)
Other, non-Hispanic 2.1 (0.1)
3.4 (0.4)
2.2 (0.2)
5.5 (1.2)
2.2 (0.1)
3.4 (0.5)
2.2 (0.1)
3.2 (0.6)
Hispanic 15.3 (0.2)
22.6 (1.0)
15.1 (0.4)
22.4 (2.3)
15.4 (0.2)
24.6 (1.3)
14.8 (0.2)
22.8 (1.5)
Less than high school diploma
9.1 (0.1)
17.9 (0.9)
8.8 (0.3)
18.0 (2.0)
8.8 (0.2)
17.5 (1.1)
8.3 (0.2)
16.5 (1.3)
High school diploma, no college
27.2 (0.2)
22.4 (1.0)
27.7 (0.5)
24.5 (2.3)
27.3 (0.2)
23.8 (1.3)
26.8 (0.3)
21.6 (1.4)
Some college 29.2 (0.2)
28.6 (1.1)
29.3 (0.5)
27.5 (2.4)
29.5 (0.3)
29.8 (1.3)
29.0 (0.3)
28.5 (1.5)
Bachelor’s degree or more 34.5 (0.2)
31.2 (1.1)
34.1 (0.5)
30.1 (2.4)
34.4 (0.3)
28.9 (1.3)
36.0 (0.3)
33.5 (1.6)
Mean age (years) 42.2
(0.1) 37.6 (0.4)
41.3 (0.1)
38.9 (0.8)
41.6 (0.1)
36.6 (0.4)
42.2 (0.1)
38.9 (0.5)
Full-time (at least 35 hours/week)
80.4 (0.2)
50.1 (1.2)
81.4 (0.4)
51.4 (2.6)
82.7 (0.2)
59.6 (1.4)
82.1 (0.3)
57.7 (1.7)
Part-time (less than 35 hours/week)
19.6 (0.2)
49.4 (1.2)
18.6 (0.4)
48.3 (2.6)
17.3 (0.2)
40.4 (1.4)
17.9 (0.3)
42.3 (1.7)
Not full-year (less than 50 weeks/year), full-time
27.0 (0.3)
70.2 (1.6)
Full-year (at least 50 weeks/year), full-time
73.0 (0.3)
29.8 (1.6)
Not a union membera
86.9 (0.4)
89.8 (1.5)
87.2 (0.2)
90.4 (0.8)
Union membera
13.1 (0.4)
10.2 (1.5)
12.8 (0.2)
9.6 (0.8)
Detailed industry group Construction 6.0
(0.1) 11.4 (0.7)
4.7 (0.2)
11.7 (1.7)
4.9 (0.1)
10.2 (0.9)
5.9 (0.2)
13.1 (1.1)
Retail trade 11.4 (0.2)
6.4 (0.6)
11.9 (0.4)
8.6 (1.5)
11.7 (0.2)
7.5 (0.8)
11.1 (0.2)
6.3 (0.8)
Professional and technical services
7.1 (0.1)
7.2 (0.6)
6.2 (0.3)
6.9 (1.5)
6.4 (0.1)
6.1 (0.7)
7.4 (0.2)
8.5 (1.0)
Administrative and support services
3.8 (0.1)
10.1 (0.7)
3.3 (0.2)
9.9 (1.5)
3.2 (0.1)
9.8 (0.9)
3.7 (0.1)
8.7 (1.0)
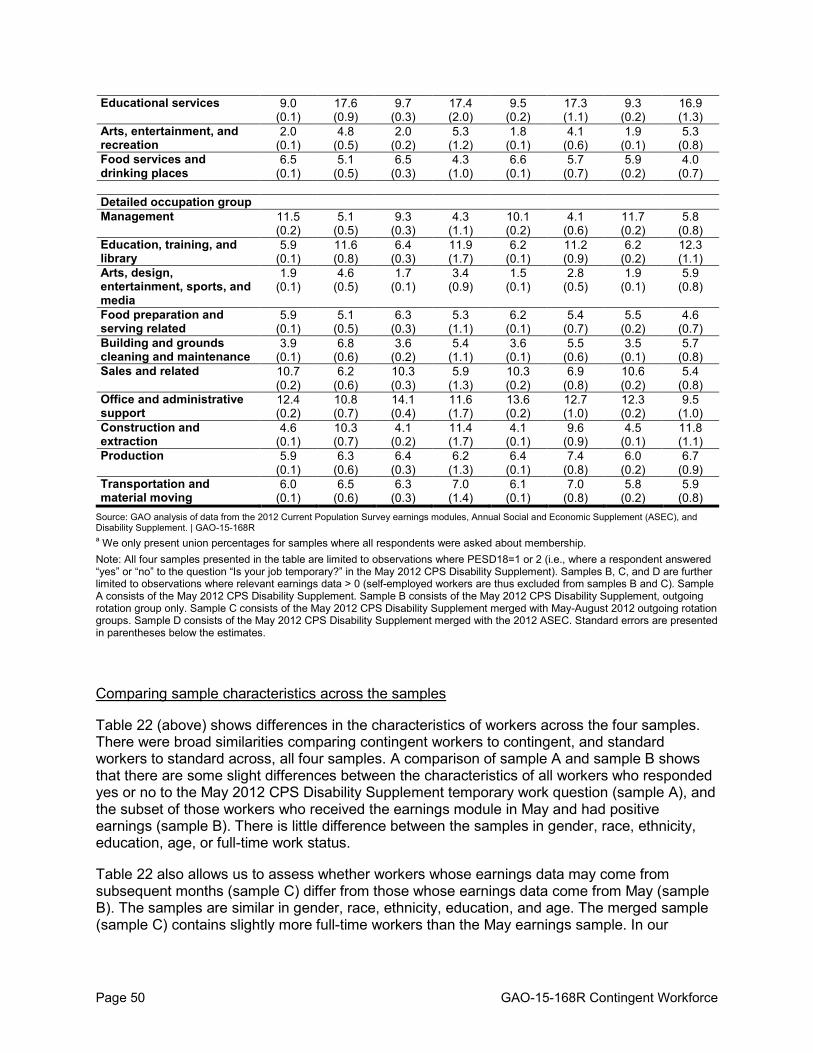
Page 50 GAO-15-168R Contingent Workforce
Educational services 9.0 (0.1)
17.6 (0.9)
9.7 (0.3)
17.4 (2.0)
9.5 (0.2)
17.3 (1.1)
9.3 (0.2)
16.9 (1.3)
Arts, entertainment, and recreation
2.0 (0.1)
4.8 (0.5)
2.0 (0.2)
5.3 (1.2)
1.8 (0.1)
4.1 (0.6)
1.9 (0.1)
5.3 (0.8)
Food services and drinking places
6.5 (0.1)
5.1 (0.5)
6.5 (0.3)
4.3 (1.0)
6.6 (0.1)
5.7 (0.7)
5.9 (0.2)
4.0 (0.7)
Detailed occupation group Management 11.5
(0.2) 5.1
(0.5) 9.3
(0.3) 4.3
(1.1) 10.1 (0.2)
4.1 (0.6)
11.7 (0.2)
5.8 (0.8)
Education, training, and library
5.9 (0.1)
11.6 (0.8)
6.4 (0.3)
11.9 (1.7)
6.2 (0.1)
11.2 (0.9)
6.2 (0.2)
12.3 (1.1)
Arts, design, entertainment, sports, and media
1.9 (0.1)
4.6 (0.5)
1.7 (0.1)
3.4 (0.9)
1.5 (0.1)
2.8 (0.5)
1.9 (0.1)
5.9 (0.8)
Food preparation and serving related
5.9 (0.1)
5.1 (0.5)
6.3 (0.3)
5.3 (1.1)
6.2 (0.1)
5.4 (0.7)
5.5 (0.2)
4.6 (0.7)
Building and grounds cleaning and maintenance
3.9 (0.1)
6.8 (0.6)
3.6 (0.2)
5.4 (1.1)
3.6 (0.1)
5.5 (0.6)
3.5 (0.1)
5.7 (0.8)
Sales and related 10.7 (0.2)
6.2 (0.6)
10.3 (0.3)
5.9 (1.3)
10.3 (0.2)
6.9 (0.8)
10.6 (0.2)
5.4 (0.8)
Office and administrative support
12.4 (0.2)
10.8 (0.7)
14.1 (0.4)
11.6 (1.7)
13.6 (0.2)
12.7 (1.0)
12.3 (0.2)
9.5 (1.0)
Construction and extraction
4.6 (0.1)
10.3 (0.7)
4.1 (0.2)
11.4 (1.7)
4.1 (0.1)
9.6 (0.9)
4.5 (0.1)
11.8 (1.1)
Production 5.9 (0.1)
6.3 (0.6)
6.4 (0.3)
6.2 (1.3)
6.4 (0.1)
7.4 (0.8)
6.0 (0.2)
6.7 (0.9)
Transportation and material moving
6.0 (0.1)
6.5 (0.6)
6.3 (0.3)
7.0 (1.4)
6.1 (0.1)
7.0 (0.8)
5.8 (0.2)
5.9 (0.8)
Source: GAO analysis of data from the 2012 Current Population Survey earnings modules, Annual Social and Economic Supplement (ASEC), and Disability Supplement. | GAO-15-168R a We only present union percentages for samples where all respondents were asked about membership. Note: All four samples presented in the table are limited to observations where PESD18=1 or 2 (i.e., where a respondent answered “yes” or “no” to the question “Is your job temporary?” in the May 2012 CPS Disability Supplement). Samples B, C, and D are further limited to observations where relevant earnings data > 0 (self-employed workers are thus excluded from samples B and C). Sample A consists of the May 2012 CPS Disability Supplement. Sample B consists of the May 2012 CPS Disability Supplement, outgoing rotation group only. Sample C consists of the May 2012 CPS Disability Supplement merged with May-August 2012 outgoing rotation groups. Sample D consists of the May 2012 CPS Disability Supplement merged with the 2012 ASEC. Standard errors are presented in parentheses below the estimates.
Comparing sample characteristics across the samples
Table 22 (above) shows differences in the characteristics of workers across the four samples. There were broad similarities comparing contingent workers to contingent, and standard workers to standard across, all four samples. A comparison of sample A and sample B shows that there are some slight differences between the characteristics of all workers who responded yes or no to the May 2012 CPS Disability Supplement temporary work question (sample A), and the subset of those workers who received the earnings module in May and had positive earnings (sample B). There is little difference between the samples in gender, race, ethnicity, education, age, or full-time work status.
Table 22 also allows us to assess whether workers whose earnings data may come from subsequent months (sample C) differ from those whose earnings data come from May (sample B). The samples are similar in gender, race, ethnicity, education, and age. The merged sample (sample C) contains slightly more full-time workers than the May earnings sample. In our

Page 51 GAO-15-168R Contingent Workforce
regression analyses, we control for hours of work by examining weekly earnings among full-time workers and by examining hourly earnings.
Table 22 also shows differences between the May-MORG merged dataset (sample C) and the May-ASEC merged dataset (sample D). Though not identical, the samples have similar characteristics in terms of gender, race, education, and part-time status, whether one compares contingent workers or standard workers.
Comparing sample characteristics between contingent and standard workers
Table 22 (above) also shows some broad differences in the characteristics of standard and contingent workers. In this discussion we describe the characteristics shown in sample D, the May-ASEC merged dataset. The differences discussed here are also seen in sample C, the May-MORG merged dataset, although the estimates are not identical.
Contingent and standard workers in the May-ASEC merged dataset are not significantly different in terms of sex, but exhibit some other demographic differences, specifically in terms of race, age, and level of education (see table 22 for the associated standard errors for the following survey-based estimates).
• Contingent workers and standard workers are similarly likely to be men. Approximately 55.5 percent of contingent workers are men, compared to an estimated 53.3 percent of standard workers.
• About 67.9 percent of standard workers are white, non-Hispanic, significantly higher than the estimated 59.7 percent of contingent workers who are white, non-Hispanic. About 14.8 percent of standard workers are Hispanic, significantly lower than the estimated 22.8 percent of contingent workers who are Hispanic. Similar percentages of standard and contingent workers are Black and Asian.
• Contingent workers are younger, on average, than standard workers.
• Contingent workers are more likely to report low levels of education. For example, only an estimated 8.3 percent of standard workers have less than a high school degree, compared to approximately 16.5 percent of contingent workers.
In addition, in the May-MORG merged dataset (sample C), standard workers are more likely to report that they are union members than contingent workers.
About 42.3 percent of contingent workers usually work part-time, significantly more than the estimated 17.9 percent of standard workers who usually work part-time. In addition, contingent workers are much less likely to be full-year, full-time workers (i.e., at least 50 weeks of work per year and at least 35 hours of work per week)—only about 29.8 percent of contingent workers compared to an estimated 73.0 percent of standard workers.
Contingent and standard workers are also concentrated differently in some industries and occupations. Table 22 presents the proportions of contingent and standard workers that are employed in certain industries and occupations (e.g., an estimated 11.4 percent of contingent workers in the May 2012 CPS Disability Supplement—sample A—are employed in the
Page 52 GAO-15-168R Contingent Workforce
construction industry).80
Contingent and standard workers are distributed similarly over some industries and occupations. For example, an estimated 5.8 to 6.3 percent of standard workers, depending on the sample, were employed in the transportation and material moving occupation; similarly, that occupation accounted for about 5.9 to 7.0 percent of contingent workers, depending on the sample (see table 22). Worker distributions over other industries and occupations varied considerably more. For example, an estimated 4.7 to 6.0 percent of standard workers, depending on the sample, were employed in the construction industry; in contrast, that industry accounted for about 10.2 to 13.1 percent of contingent workers, depending on the sample (see table 22).
Regression Analysis
We conducted multivariate regression analyses of annual, weekly, and hourly earnings, as well as participation in work-provided retirement plans.
All of our earnings regressions use survey regression software that permitted us to use state of residence as a generalized variance stratification variable, assuming sampling with replacement, with standard errors estimated using Taylor-series linearization. We use the natural log of earnings for our dependent variable in a linear model, reflecting both the assumption that the underlying distribution of earnings is closer to log normal than normal, and the assumption that changes in the values of independent variables are associated with percentage changes—not level changes—in earnings.
Our retirement plan regression is run using a logistic model, using state as a generalized variance stratification variable, and assuming sampling with replacement.
Regression analysis: dependent variables
For our analysis of annual earnings, we use the ASEC variable PEARNVAL, which measures individual earnings from wages, salaries, and self-employment income from all jobs in the previous calendar year (i.e., the 2012 ASEC has data for earnings in calendar year 2011). We only include workers with positive values of annual earnings in our analysis. Self-employment earnings can have negative values. We do not exclude observations in which Census imputed or allocated components of the annual earnings variable.
The CPS earnings module reports weekly earnings for wage and salary workers, which we use for our weekly earnings regressions. We do not exclude observations in which Census imputed or allocated components of the weekly earnings variable. We also construct a measure of hourly earnings, following guidance received from BLS officials. For those workers who report their earnings hourly, we use their reported hourly wage. For those workers who report their earnings using another unit of time (such as weekly, monthly, or annually) we construct hourly earnings by dividing weekly earnings by usual hours worked per week. A number of workers report that their usual hours worked per week “varies.” For these workers, we examine two additional variables: actual hours worked last week, and whether the worker is normally full-time or part-time. If the worker indicates that they are normally full-time, and their reported actual hours
80 Table 22 presents industries and occupations in which at least 5 percent of contingent workers were employed (i.e., exactly 5.0 percent or more) in either of the samples used in our regression analyses (i.e., samples C and D).

Page 53 GAO-15-168R Contingent Workforce
worked last week exceeds 20 hours per week, then we construct hourly earnings by dividing weekly earnings by actual hours worked last week. Similarly, if the worker indicates that they are normally part-time, and their actual hours worked last week is less than 40 hours per week, then we construct hourly earnings by dividing weekly earnings by actual hours worked last week. If the worker indicates that they are normally full-time, but their actual hours worked last week was less than 20 hours per week, we construct hourly earnings by dividing weekly earnings by 42.8 (the mean hours of work among full-time workers who reported usual hours of work in our 2012 sample). If the worker indicates that they are normally part-time, but their actual hours worked last week exceeded 60 hours per week, we construct hourly earnings by dividing weekly earnings by 21.4 (the mean hours of work among part-time workers who reported usual hours of work in our 2012 sample).
For our analysis of access to work-provided retirement plans, we coded a worker as having access to a work-provided retirement plan if they responded “yes” to both of the following questions from the ASEC: (1) “Other than Social Security, did the employer or union that [worker] worked for [last year] have a pension or other type of retirement plan for any of the employees?” (variable is PENPLAN) and (2) “Was [worker] included in that plan?” (variable is PENINCL). We use the term “work-provided” rather than the legal term “employer-sponsored” because the survey questions ask about benefits offered by a worker’s employer or union.
We conducted regressions using the following dependent variables:
1. Log (annual earnings) – In our analysis of the May-ASEC merged dataset, we used the natural log of annual earnings as our dependent variable. Annual earnings reflect both the wages and work experience (hours and weeks worked) of contingent and standard workers throughout calendar year 2011. This analysis is limited to positive earners.
o We also conduct regression analysis on this dependent variable limited to full-time, full-year workers.
2. Log (weekly earnings) – In our analysis of the May-MORG merged dataset, we used the natural log of weekly earnings as our dependent variable. Weekly earnings reflect both the wages and work experience (hours worked) of contingent and standard workers during the reference week. This analysis is limited to positive earners.
o We also conduct regression analysis on this dependent variable limited to full-time workers.
3. Log (hourly earnings) – In our analysis of the May-MORG merged dataset, we also constructed a measure of hourly earnings using information about weekly earnings, usual hours of work, and actual hours worked last week (for those workers who indicated that their usual hours of work varied), following guidance from BLS as described above. Hourly earnings reflect only the wage rate of contingent and standard workers during the reference week. This analysis is limited to positive earners.
4. Access to Work-Provided Retirement Plan. We also ran a multivariate regression on access to a work-provided retirement plan (as described above) as our dependent variable. We used a logistic model. This analysis includes all workers, regardless of their level of earnings.

Page 54 GAO-15-168R Contingent Workforce
Regression analysis: independent variables
The independent variable of primary interest in our analysis is the binary variable “contingent,” which identifies contingent workers. This variable is obtained from the May 2012 CPS Disability Supplement survey question “Do you consider your job temporary?” (variable is PESD18). Workers who respond “yes” to this question are identified as contingent workers for the purpose of this analysis. Workers who respond “no” to this question are considered standard workers (i.e., non-contingent). Workers who did not respond or responded “don’t know” were excluded from the analysis.
All of our regression analyses include controls for selected human capital, demographic, and job characteristics. In addition, we include controls for state to capture geographic variation in wages. The human capital characteristics include age, age squared, and education. The demographic characteristics include sex, race, and ethnicity. The job characteristics include detailed industry groups and detailed occupation groups. In addition, in our analysis of weekly and hourly earnings we include controls for union membership. We could not include this variable in our analysis of annual earnings because it is only present in the earnings module. We also include self-employed as a control variable for our regression analyzing participation in work-provided retirement plans because these workers may not necessarily have an employer with which they would qualify for a retirement plan. We did not include self-employed as a control variable for our earnings regressions. We examined whether our annual earnings regression results were sensitive to the inclusion of self-employed workers in our sensitivity analyses, described below.81
Table 23 (below) shows coefficients and standard errors from each of our earnings regressions. The table shows the exponents of the model coefficients and standard errors. Because the dependent variables in the earnings models are the natural logarithms of earnings, subtracting 1 from the presented coefficients on indicator variables can be interpreted as the percentage change in the dependent variable associated with a change in the indicator variable. For example, the exponent of the coefficient on “Contingent” is 0.871 in the regression of the log of annual earnings for full-time, full-year workers. This can be interpreted as: contingent worker’s earnings are 12.9 percent lower than the earnings of standard workers, holding all other predictors constant, because 0.871 – 1 = -.129, or – 12.9 percent.
Table 23: Multivariate Regression Results on Earnings of Contingent Workers as a Percentage of Standard Workers
Dependent variable: Log of annual earnings
Log of annual earnings
Log of weekly earnings
Log of weekly earnings
Log of hourly earnings
Population (workers): All Full-time, full-year All Full-time All Contingent 0.521
(0.021) 0.871
(0.034) 0.725
(0.016) 0.833
(0.018) 0.894
(0.015) Age 1.126
(0.003) 1.061
(0.003) 1.090
(0.002) 1.056
(0.002) 1.046
(0.001) Age squared 0.999
(0.000) 0.999
(0.000) 0.999
(0.000) 0.999
(0.000) 1.000
(0.000) 81 Self-employed workers are excluded from the May-MORG merged dataset, but they are included in the May-ASEC merged dataset.

Page 55 GAO-15-168R Contingent Workforce
Men (base) (base) (base) (base) (base) Women 0.679
(0.009) 0.745
(0.008) 0.757
(0.006) 0.808 0.006
0.850 (0.006)
White non-Hispanic (base) (base) (base) (base) (base) Black non-Hispanic 0.924
(0.018) 0.892
(0.014) 0.901
(0.011) 0.864
(0.010) 0.900
(0.009) Asian non-Hispanic 0.924
(0.022) 0.892
(0.018) 0.964
(0.016) 0.955
(0.014) 0.976
(0.013) Other non-Hispanic 0.906
(0.038) 0.920
(0.030) 0.924
(0.023) 0.914
(0.023) 0.959
(0.015) Hispanic 0.962
(0.018) 0.869
(0.014) 0.949
(0.011) 0.889
(0.010) 0.909
(0.009) Less than high school (base) (base) (base) (base) (base) High school 1.362
(0.033) 1.203
(0.028) 1.264
(0.018) 1.216
(0.017) 1.135
(0.012) Some college 1.465
(0.037) 1.354
(0.033) 1.322
(0.020) 1.297
(0.019) 1.205
(0.013) Bachelor’s degree or more
2.080 (0.056)
1.837 (0.048)
1.833 (0.030)
1.766 (0.029)
1.595 (0.020)
Union membership (base: no)
N/A N/A 1.203 (0.012)
1.130 (0.011)
1.141 (0.010)
Detailed industry group
(see note)
Detailed occupation group
(see note)
State (see note) Unweighted sample 30,204 21,568 43,541 35,615 43,504 R2 0.402 0.389 0.436 0.386 0.396 F statistic 111.163 86.523 209.309 146.531 196.693
Source: GAO regression analysis using data from the 2012 Current Population Survey earnings modules, Annual Social and Economic Supplement (ASEC), and Disability Supplement. | GAO-15-168R
Note: Regressions on weekly and hourly earnings use the May-MORG merged dataset and regressions on annual earnings use the May-ASEC merged dataset. Regressions also include controls for detailed industry group, detailed occupation group, and state, not presented in this table. Full-time includes those who worked at least 35 hours per week; full-year includes those who worked at least 50 weeks in the year. The self-employed are not included in the weekly and hourly earnings models. Standard errors have been estimated as described earlier in this enclosure, and are presented in parentheses below the regression coefficients. The exponents of coefficients and standard errors are presented to ease interpretation. Earnings models are linear models with a logged dependent variable and are limited to positive earners.
Table 24 (below) shows the odds ratios and standard errors from logistic regressions to analyze participation in retirement plans, and can be interpreted as relative odds. Relative odds of less than 1 mean that contingent workers are less likely than standard workers to participate in a work-provided retirement plan.
Prior to adjusting for other factors, only an estimated 19 percent of contingent workers participate in a work-provided retirement plan, compared to about 45 percent of standard workers (not shown in table 24). The odds that a contingent worker participates in a work-provided plan can be expressed as 19:81, or 0.23, whereas the odds that a standard worker participates are 45:55, or 0.82. To compare the relative odds of participating in a plan between contingent and standard workers, we take the ratio of the two unadjusted odds, 0.23 to 0.82, which would yield an odds ratio of 0.28. This indicates that prior to adjusting for other factors,
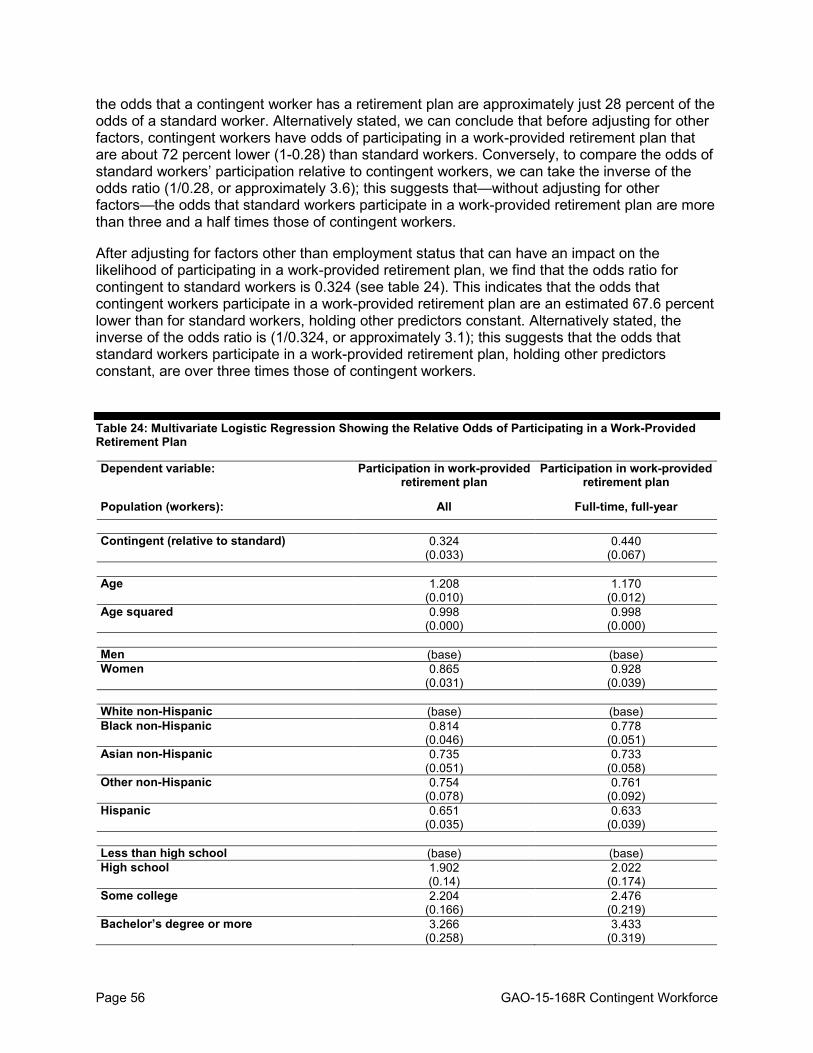
Page 56 GAO-15-168R Contingent Workforce
the odds that a contingent worker has a retirement plan are approximately just 28 percent of the odds of a standard worker. Alternatively stated, we can conclude that before adjusting for other factors, contingent workers have odds of participating in a work-provided retirement plan that are about 72 percent lower (1-0.28) than standard workers. Conversely, to compare the odds of standard workers’ participation relative to contingent workers, we can take the inverse of the odds ratio (1/0.28, or approximately 3.6); this suggests that—without adjusting for other factors—the odds that standard workers participate in a work-provided retirement plan are more than three and a half times those of contingent workers.
After adjusting for factors other than employment status that can have an impact on the likelihood of participating in a work-provided retirement plan, we find that the odds ratio for contingent to standard workers is 0.324 (see table 24). This indicates that the odds that contingent workers participate in a work-provided retirement plan are an estimated 67.6 percent lower than for standard workers, holding other predictors constant. Alternatively stated, the inverse of the odds ratio is (1/0.324, or approximately 3.1); this suggests that the odds that standard workers participate in a work-provided retirement plan, holding other predictors constant, are over three times those of contingent workers.
Table 24: Multivariate Logistic Regression Showing the Relative Odds of Participating in a Work-Provided Retirement Plan
Dependent variable: Participation in work-provided retirement plan
Participation in work-provided retirement plan
Population (workers): All Full-time, full-year Contingent (relative to standard) 0.324
(0.033) 0.440
(0.067) Age 1.208
(0.010) 1.170
(0.012) Age squared 0.998
(0.000) 0.998
(0.000) Men (base) (base) Women 0.865
(0.031) 0.928
(0.039) White non-Hispanic (base) (base) Black non-Hispanic 0.814
(0.046) 0.778
(0.051) Asian non-Hispanic 0.735
(0.051) 0.733
(0.058) Other non-Hispanic 0.754
(0.078) 0.761
(0.092) Hispanic 0.651
(0.035) 0.633
(0.039) Less than high school (base) (base) High school 1.902
(0.14) 2.022
(0.174) Some college 2.204
(0.166) 2.476
(0.219) Bachelor’s degree or more 3.266
(0.258) 3.433
(0.319)

Page 57 GAO-15-168R Contingent Workforce
Self-employed (base: no) 0.181
(0.012) 0.19
(0.014) Detailed industry group (see note) Detailed occupation group (see note) State (see note) Unweighted sample 30,204 21,568 F statistic 33.790 22.565 ALa 1.07 1.21 p > ALa 0.38 0.28
Source: GAO regression analysis using data from the 2012 Current Population Survey Annual Social and Economic Supplement (ASEC) and Disability Supplement. | GAO-15-168R a AL indicates the Archer-Lemeshow goodness-of-fit test statistic (a modification for survey data of the Hosmer-Lemeshow goodness of fit test) and p>AL is the p-value associated with the goodness-of-fit test statistic. Higher p-values for the goodness-of-fit test indicate a better model fit; p-values less than .05 indicate that the model is a poor fit. Note: Regressions on retirement plan participation use the May-ASEC merged dataset. Regressions also include controls for detailed industry group, detailed occupation group, and state, not presented in this table. Full-time includes those who worked at least 35 hours per week; full-year includes those who worked at least 50 weeks in the year. Standard errors have been estimated as described earlier in this enclosure, and are presented in parentheses below the regression coefficients. The exponents of coefficients (called odds ratios) and standard errors are presented to ease interpretation. Retirement plan models are logistic models, estimating the odds that a contingent worker has a work-provided retirement plan relative to standard workers; all workers are included, regardless of their level of earnings.
Regression analysis: additional analyses and sensitivity tests
In addition to the regressions described above, we ran several sensitivity tests to examine the robustness of our results.
• To make sure that our results were not driven by the large share of contingent workers in the education-related industry and occupation, we ran all of our earnings regressions on populations that excluded workers employed in education.
• To examine whether our results would be sensitive to the inclusion of more precise industry and occupation categories, we ran all of our earnings regressions replacing our initial industry and occupation categories with more precise controls (i.e., moving from 51 industry codes and 22 occupation codes to 259 industry codes and 478 occupation codes).
• To make sure that our results were not significantly affected by the construction of our merged samples, we ran our weekly and hourly earnings regressions on the May 2012 earnings sample.
• To make sure that our results were not affected by the inclusion of self-employed workers in our May-ASEC merged dataset, we ran our annual earnings regressions on a sample that excluded self-employed workers.
• We also ran each of our earnings regressions separately for men and women to account for any earnings differences based on sex.
The results of our sensitivity tests were qualitatively similar to the results of our primary regression models presented in this report (see table 25). The differences between contingent and standard workers were consistently, though only slightly, smaller when education workers were excluded and when the more precise industry and occupation controls were used, and
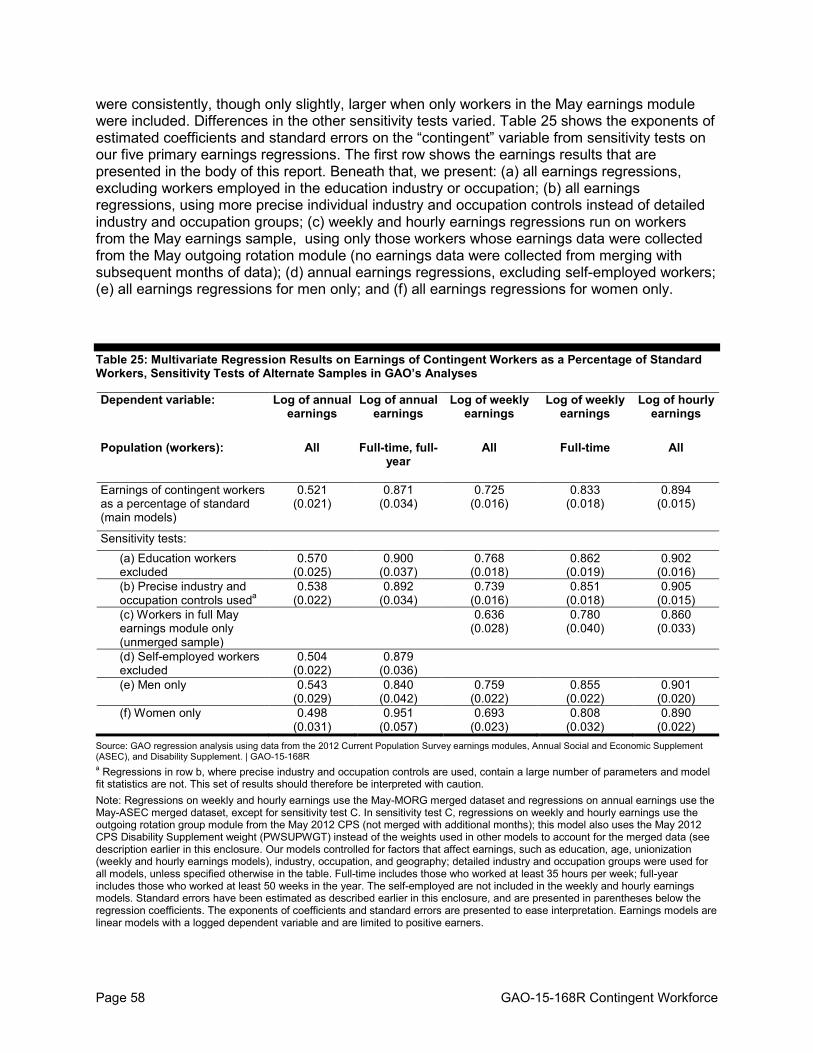
Page 58 GAO-15-168R Contingent Workforce
were consistently, though only slightly, larger when only workers in the May earnings module were included. Differences in the other sensitivity tests varied. Table 25 shows the exponents of estimated coefficients and standard errors on the “contingent” variable from sensitivity tests on our five primary earnings regressions. The first row shows the earnings results that are presented in the body of this report. Beneath that, we present: (a) all earnings regressions, excluding workers employed in the education industry or occupation; (b) all earnings regressions, using more precise individual industry and occupation controls instead of detailed industry and occupation groups; (c) weekly and hourly earnings regressions run on workers from the May earnings sample, using only those workers whose earnings data were collected from the May outgoing rotation module (no earnings data were collected from merging with subsequent months of data); (d) annual earnings regressions, excluding self-employed workers; (e) all earnings regressions for men only; and (f) all earnings regressions for women only.
Table 25: Multivariate Regression Results on Earnings of Contingent Workers as a Percentage of Standard Workers, Sensitivity Tests of Alternate Samples in GAO’s Analyses
Dependent variable: Log of annual earnings
Log of annual earnings
Log of weekly earnings
Log of weekly earnings
Log of hourly earnings
Population (workers): All Full-time, full-year
All Full-time All
Earnings of contingent workers as a percentage of standard (main models)
0.521 (0.021)
0.871 (0.034)
0.725 (0.016)
0.833 (0.018)
0.894 (0.015)
Sensitivity tests: (a) Education workers excluded
0.570 (0.025)
0.900 (0.037)
0.768 (0.018)
0.862 (0.019)
0.902 (0.016)
(b) Precise industry and occupation controls used
0.538 a (0.022)
0.892 (0.034)
0.739 (0.016)
0.851 (0.018)
0.905 (0.015)
(c) Workers in full May earnings module only (unmerged sample)
0.636 (0.028)
0.780 (0.040)
0.860 (0.033)
(d) Self-employed workers excluded
0.504 (0.022)
0.879 (0.036)
(e) Men only 0.543 (0.029)
0.840 (0.042)
0.759 (0.022)
0.855 (0.022)
0.901 (0.020)
(f) Women only 0.498 (0.031)
0.951 (0.057)
0.693 (0.023)
0.808 (0.032)
0.890 (0.022)
Source: GAO regression analysis using data from the 2012 Current Population Survey earnings modules, Annual Social and Economic Supplement (ASEC), and Disability Supplement. | GAO-15-168R a Regressions in row b, where precise industry and occupation controls are used, contain a large number of parameters and model fit statistics are not. This set of results should therefore be interpreted with caution. Note: Regressions on weekly and hourly earnings use the May-MORG merged dataset and regressions on annual earnings use the May-ASEC merged dataset, except for sensitivity test C. In sensitivity test C, regressions on weekly and hourly earnings use the outgoing rotation group module from the May 2012 CPS (not merged with additional months); this model also uses the May 2012 CPS Disability Supplement weight (PWSUPWGT) instead of the weights used in other models to account for the merged data (see description earlier in this enclosure. Our models controlled for factors that affect earnings, such as education, age, unionization (weekly and hourly earnings models), industry, occupation, and geography; detailed industry and occupation groups were used for all models, unless specified otherwise in the table. Full-time includes those who worked at least 35 hours per week; full-year includes those who worked at least 50 weeks in the year. The self-employed are not included in the weekly and hourly earnings models. Standard errors have been estimated as described earlier in this enclosure, and are presented in parentheses below the regression coefficients. The exponents of coefficients and standard errors are presented to ease interpretation. Earnings models are linear models with a logged dependent variable and are limited to positive earners.

Page 59 GAO-15-168R Contingent Workforce
To make sure that our results were not affected by the construction of our merged samples, we also ran several sensitivity tests to examine the effects the weights and the variance estimation approach we use on our merged sample (described above). Using the May only earnings sample, which does not involve a merge to additional months of data, we compare the effect of using the CPS replicate weights for variance estimation, the May 2012 CPS Disability Supplement weight for point estimates, and the May earnings weight for point estimates, to the weighting and variance estimation approach that we developed (described above).
The sensitivity tests demonstrate consistency across model specifications, including the main regressions presented in this report. Table 26 shows the impact of using different population weights and variance estimation techniques on our results, using the May only earnings sample. The first row in the table uses the weight and variance methods that we use in our main regression analyses (presented elsewhere in this report), namely the constructed population weight and variance estimation using state as a stratification variable. The three rows of sensitivity test results show the effects of using replicate weights to calculate model standard errors. The first row (a) presents the regression results using the same constructed population weight that we use in our main models, but instead of using our method of variance estimation (described above) that sets state as a survey stratification variable, uses replicate weights. A comparison of the standard errors on the contingent worker coefficients in the main models and the sensitivity tests in row (a) demonstrate consistency across model specifications. The sensitivity tests in rows (a), (b), and (c) show the result of using various population weights, holding constant the variance estimation method using replicate weights. Row (a) uses the weight that we constructed, which is defined as the ratio of the May 2012 CPS Disability Supplement weight (PWSUPWGT) to the individual’s composited final weight (PWCMPWGT), multiplied by the earnings weight ((PWSUPWGT / PWCMPWGT) x PWORWGT). Row (b) uses the earnings weight (PWORWGT). Row (c) uses the May 2012 CPS Disability Supplement weight (PWSUPWGT). Table 26 shows that the estimates resulting from these different population weights are consistent across model specifications.
Table 26: Multivariate Regression Results on Earnings, Sensitivity Tests of Population Weights and Variance Estimation Techniques, Using May 2012 Sample Only
Dependent variable (all workers included): Log of weekly earnings
Log of hourly earnings
Earnings of contingent workers as a percentage of standard Population weight: constructed population weight (ratio of the May 2012 CPS Disability Supplement weight to the individual’s composited final weight, multiplied by the earnings weight; PWSUPWGT / PWCMPWGT x PWORWGT) – method for main models Variance estimation method: state stratification variable – method for main models
0.637 (0.029)
0.861 (0.032)
Sensitivity tests:
(a) Population weight: constructed population weight (same as above ) Variance estimation method: replicate weights
0.637 (0.028)
0.861 (0.033)
(b) Population weight: outgoing rotation group weight (PWORWGT) Variance estimation method: replicate weights
0.636 (0.028)
0.860 (0.033)

Page 60 GAO-15-168R Contingent Workforce
(c) Population weight: May 2012 CPS Disability Supplement weight (PWSUPWGT) Variance estimation method: replicate weights
0.636 (0.028)
0.860 (0.033)
Source: GAO regression analysis using data from the 2012 Current Population Survey earnings modules and Disability Supplement. | GAO-15-168R
Note: Our models controlled for factors that affect earnings, such as education, age, unionization, industry, occupation, and geography. The self-employed are not included in the weekly and hourly earnings models. Standard errors have been estimated as described earlier in this enclosure, and are presented in parentheses below the regression coefficients. The exponents of coefficients and standard errors are presented to ease interpretation. Earnings models are linear models with a logged dependent variable and are limited to positive earners.
To further test the validity of our proxy population,82 we also ran our regression models on the 2005 CWS to compare results for those workers who simply answered “yes” to the temporary work screening question with those workers included in BLS’s three estimates of the contingent workforce. We ran the regression models on only those workers who had earnings data present in the CWS, which may be a different population than the group of workers who were administered earnings questions in the outgoing rotation group earnings module, used in our 2012 regressions. We excluded self-employed workers because they were not asked the temporary work screening question in the 2005 CWS.83
Results from these sensitivity tests again demonstrated results consistent with the main regression specification presented in this report. Table 27 shows the similarities between each population measure. For example, the estimated differences in hourly earnings between contingent and standard workers resulting from our multivariate models were similar whether using the temporary work population (i.e., the population similar to our proxy population, though without self-employed workers) or BLS’s Estimate 1. The results on weekly earnings were slightly different, largely because, as previously noted, the temporary work population included a greater proportion of part-time workers than workers included in BLS’s three estimates. In our analyses using the May 2012 CPS Disability Supplement data we address this potential difference by presenting regressions of hourly earnings (which implicitly control for hours worked), presenting regressions of weekly earnings limited to full-time workers, and presenting regressions of annual earnings limited to full-time, full-year workers.
In all other ways, our regression models were the same as our main analyses using data from the May 2012 CPS Disability Supplement.
Table 27: Multivariate Regression Results on Earnings, Sensitivity Tests of Proxy Population Using 2005 CWS Data to Compare Temporary Workers and BLS Contingent Worker Estimates
Dependent variable (all workers included): Log of weekly earnings
Log of hourly earnings
Earnings of contingent workers as a percentage of standard (a) Workers who responded “Yes” to temporary work screening question (variable PES1); practically identical to question used to identify proxy population in May 2012 CPS Disability Supplement
0.665 (0.020)
0.862 (0.021)
(b) Workers in BLS Estimate 1 of the contingent workforce 0.763 (0.028)
0.863 (0.024)
82 As previously discussed, we identified a proxy population of contingent workers as those who answered “yes” to the temporary work screening question in the May 2012 Disability Supplement. 83 As previously discussed, contingent self-employed were identified using other questions in the CWS. Self-employed workers were asked the temporary work screening question in the May 2012 Disability Supplement and thus we include them in our main regression analyses that use the 2012 data, as we are able.

Page 61 GAO-15-168R Contingent Workforce
(c) Workers in BLS Estimate 2 of the contingent workforce 0.759 (0.027)
0.867 (0.023)
(d) Workers in BLS Estimate 3 of the contingent workforce 0.770 (0.023)
0.874 (0.021)
Source: GAO regression analysis using data from the 2005 Contingent Work Supplement to the Current Population Survey. | GAO-15-168R
Note: Our models controlled for factors that affect earnings, such as education, age, industry, occupation, and geography. The self-employed are not included in the weekly and hourly earnings models. Standard errors have been estimated as described earlier in this enclosure, and are presented in parentheses below the regression coefficients. The exponents of coefficients and standard errors are presented to ease interpretation. Earnings models are linear models with a logged dependent variable and are limited to positive earners.
In addition to the sensitivity tests described above, we also ran each of our earnings regressions separately by detailed industry group and detailed occupation group. We ran separate regressions on each industry and occupation that employed at least 5.0 percent of contingent workers in both our May-MORG merged dataset and our May-ASEC merged dataset (see fig. 8 for the percentages of contingent workers in industries and occupations in the ASEC data and see also table 22 above for percentages in sample C and sample D).
Figure 8: Distribution of Contingent Workers by Industry and Occupation in the 2012 ASEC Merged Dataset
Note: Industry and occupation numbers do not add up to 100 percent of contingent workers because only those with the highest share of contingent workers are shown. Each estimate has a 95 percent confidence interval of within +/- 2.7 percentage points.
Within some industries and occupations, such as the education industry and the transportation and material moving occupation, contingent workers earned significantly less than standard workers on an annual, weekly, and hourly basis. Within other industries and occupations, such as the construction industry and construction and extraction occupation only the difference in annual earnings was significant (see table 28).

Page 62 GAO-15-168R Contingent Workforce
Table 28: Multivariate Regression Results on Earnings, Limited to Workers in Individual Detailed Industry Groups and Detailed Occupation Groups
Dependent variable: Log of annual
earnings
Log of annual
earnings
Log of weekly
earnings
Log of weekly
earnings
Log of hourly
earnings Population (workers): All Full-time,
full-year All Full-time All
Detailed industry group Construction 0.782* 1.000 0.897 1.007 1.008 Retail trade 0.507* 0.647* 0.770* 0.941 0.906* Professional and technical services 0.503* 0.924 0.749* 0.962 0.830 Administrative and support services 0.555* 0.779 0.929 0.867* 0.942 Educational services 0.343* 0.664* 0.577* 0.658* 0.864*
Detailed occupation group Education, training, and library 0.332* 0.587* 0.616* 0.696* 0.914 Building and grounds cleaning and maintenance 0.513* 0.880 0.792* 0.799* 0.896* Sales and related 0.569* 0.975 0.765* 0.809* 0.896* Office and administrative support 0.514* 0.943 0.736* 0.886* 0.921* Construction and extraction 0.720* 0.946 0.900 1.011 0.972 Production 0.628* 0.731 0.787* 0.797* 0.884 Transportation and material moving 0.495* 0.747* 0.775* 0.857* 0.904*
Source: GAO regression analysis using data from the 2012 Current Population Survey earnings modules, Annual Social and Economic Supplement (ASEC), and Disability Supplement. | GAO-15-168R
Note: Regressions on weekly and hourly earnings use the CPS outgoing rotation group earnings module dataset and regressions on annual earnings use the May-ASEC merged dataset. Our models controlled for factors that affect earnings, such as education, age, unionization (weekly and hourly earnings models), industry, occupation, and geography. Full-time includes those who worked at least 35 hours per week; full-year includes those who worked at least 50 weeks in the year. The self-employed are not included in the weekly and hourly earnings models. The exponents of coefficients are presented to ease interpretation. Earnings models are linear models with a logged dependent variable and are limited to positive earners. * Indicates that the regression coefficient is statistically significant at least at the level of p-value < 0.05.
We used the May-ASEC merged dataset to examine health insurance coverage and measures of poverty among contingent workers and standard workers; we included all workers, regardless of their level of earnings. We did not analyze these variables using the framework of our earnings regression model because health insurance and family poverty are determined by many factors besides the individual and job characteristics of workers, such as marital status, family structure, the earnings of other adults in the family, and whether other adults in the family have work-provided benefits. Examining these broader aspects of the circumstances of contingent workers was outside the scope of this report. However, we present basic information and descriptive statistics on the following measures:
Descriptive analysis:
• Private health insurance coverage: The ASEC contains information about whether individual workers are covered by private health insurance, as well as whether that coverage is in their own name and through their own employer. We present distributions for contingent and standard workers who are in each of these coverage groups in the report. The ASEC does not provide information about whether workers who do not have private health insurance in their own name (e.g., had health insurance through a family member or had no health insurance) worked for employers who offered health insurance.

Page 63 GAO-15-168R Contingent Workforce
• Family poverty: We present information about the percentage of contingent workers and standard workers who live in families whose income is less than 100 percent of Census’s official poverty line and those whose income is less than 150 percent of the official poverty line.
• Receipt of selected forms of public assistance and income support: We present information about the percentage of contingent and standard workers who live in families that receive income from Supplemental Nutrition Assistance Program (SNAP, formerly known as the federal Food Stamp Program); who receive cash assistance from a state or county welfare program; and who receive Supplemental Security Income.
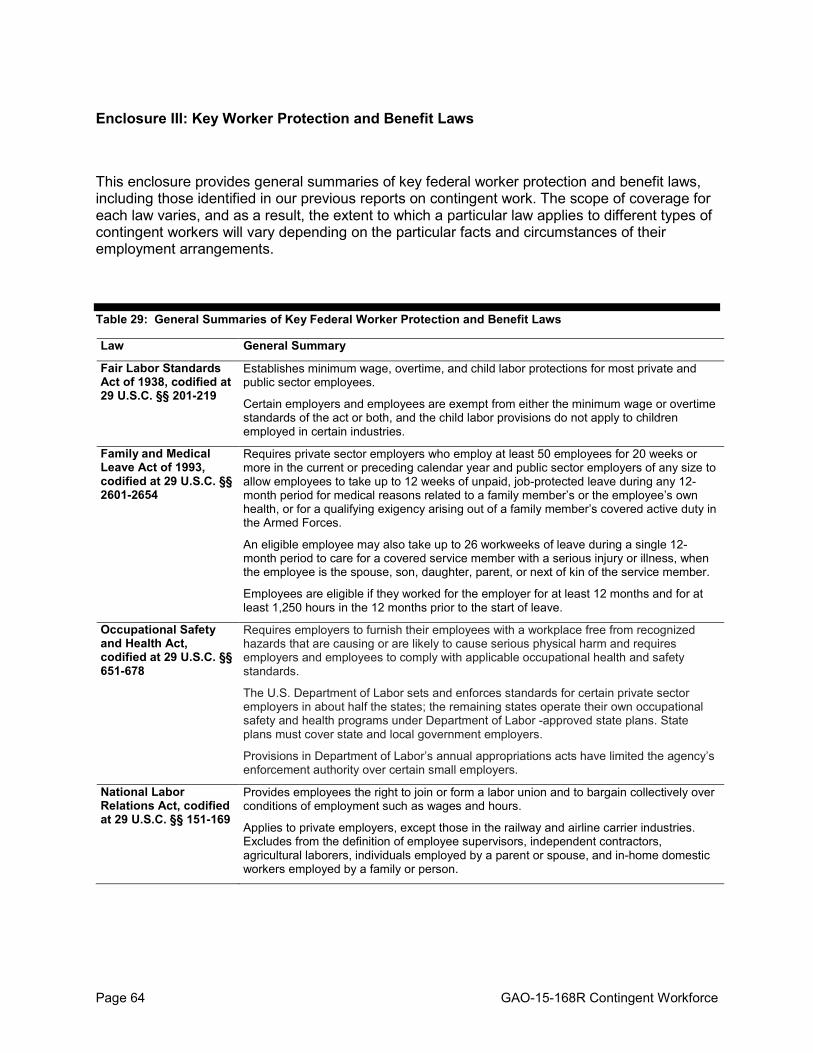
Page 64 GAO-15-168R Contingent Workforce
Enclosure III: Key Worker Protection and Benefit Laws
This enclosure provides general summaries of key federal worker protection and benefit laws, including those identified in our previous reports on contingent work. The scope of coverage for each law varies, and as a result, the extent to which a particular law applies to different types of contingent workers will vary depending on the particular facts and circumstances of their employment arrangements.
Table 29: General Summaries of Key Federal Worker Protection and Benefit Laws
Law General Summary
Fair Labor Standards Act of 1938, codified at 29 U.S.C. §§ 201-219
Establishes minimum wage, overtime, and child labor protections for most private and public sector employees.
Certain employers and employees are exempt from either the minimum wage or overtime standards of the act or both, and the child labor provisions do not apply to children employed in certain industries.
Family and Medical Leave Act of 1993, codified at 29 U.S.C. §§ 2601-2654
Requires private sector employers who employ at least 50 employees for 20 weeks or more in the current or preceding calendar year and public sector employers of any size to allow employees to take up to 12 weeks of unpaid, job-protected leave during any 12-month period for medical reasons related to a family member’s or the employee’s own health, or for a qualifying exigency arising out of a family member’s covered active duty in the Armed Forces.
An eligible employee may also take up to 26 workweeks of leave during a single 12-month period to care for a covered service member with a serious injury or illness, when the employee is the spouse, son, daughter, parent, or next of kin of the service member.
Employees are eligible if they worked for the employer for at least 12 months and for at least 1,250 hours in the 12 months prior to the start of leave.
Occupational Safety and Health Act, codified at 29 U.S.C. §§ 651-678
Requires employers to furnish their employees with a workplace free from recognized hazards that are causing or are likely to cause serious physical harm and requires employers and employees to comply with applicable occupational health and safety standards.
The U.S. Department of Labor sets and enforces standards for certain private sector employers in about half the states; the remaining states operate their own occupational safety and health programs under Department of Labor -approved state plans. State plans must cover state and local government employers.
Provisions in Department of Labor’s annual appropriations acts have limited the agency’s enforcement authority over certain small employers.
National Labor Relations Act, codified at 29 U.S.C. §§ 151-169
Provides employees the right to join or form a labor union and to bargain collectively over conditions of employment such as wages and hours.
Applies to private employers, except those in the railway and airline carrier industries. Excludes from the definition of employee supervisors, independent contractors, agricultural laborers, individuals employed by a parent or spouse, and in-home domestic workers employed by a family or person.

Page 65 GAO-15-168R Contingent Workforce
Consolidated Omnibus Budget Reconciliation Act of 1985, codified at 29 U.S.C. §§ 1161-1169 and 42 U.S.C. §§ 300bb-1-300bb-8
Requires that temporary continuation of group health plan coverage be offered to covered employees and their family members who would lose coverage under employer-sponsored group health plans as a result of certain events, such as employees being laid off from or changing their jobs.
Applies to group health plans sponsored by private sector employers or state or local governments that employed at least 20 employees in the previous calendar year.
Employee Retirement Income Security Act of 1974, codified at 26 U.S.C. §§ 401-436 and 4971-4982 and 29 U.S.C. §§ 1001-1461
Does not require employers to provide employee benefit plans but establishes requirements that must be met by employee pension and welfare benefit plans sponsored by employers or employee organizations in order to qualify for tax preferences, including minimum participation, accrual, and vesting requirements; fiduciary responsibilities; and reporting and disclosure requirements.
No qualified pension plan may require an employee, as a condition of participation, to complete a period of service extending beyond the later of when the employee attains the age of 21 or completes one year of service (defined generally as a 12-month period during which the employee has at least 1,000 hours of service).
Unemployment Insurance, see generally 26 U.S.C. §§ 3301 – 3311 and 42 U.S.C. §§ 501-505
Provides temporary, partial wage replacement to employees who become unemployed and meet eligibility rules of state programs established in accordance with requirements of federal law.
Unemployment insurance is a joint federal-state system funded by federal and state payroll taxes. Employers who pay state taxes under a state unemployment insurance program meeting federal requirements receive a credit against federal tax liability, and states with such unemployment insurance programs may receive grants for the costs of administering their programs.
Title VII of the Civil Rights Act of 1964, codified at 42 U.S.C. §§ 2000e-2000e-17
Protects employees and job applicants from discrimination in employment based on race, color, religion, sex, or national origin.
Applies to employers that have 15 or more employees for each working day in each of 20 or more calendar weeks in a year.
Title I of the Americans with Disabilities Act of 1990, codified at 42 U.S.C. §§ 12111-12117
Protects qualified employees and job applicants with disabilities from discrimination based on disability.
Applies to employers that have 15 or more employees for each working day in each of 20 or more calendar weeks in a year.
Age Discrimination in Employment Act of 1967, codified at 29 U.S.C. §§ 621-634
Protects employees and job applicants 40 years of age or older from discrimination in employment based on age.
Applies to employers that have 20 or more employees for each working day in each of 20 or more calendar weeks in a year.
Source: GAO analysis of selected federal laws. | GAO-15-168R
Note: The focus of this enclosure is federal worker protection and benefit laws. However, in our prior work, we have also highlighted state workers’ compensation programs as being potentially relevant to contingent workers. See GAO, Employment Arrangements: Improved Outreach Could Help Ensure Proper Worker Classification, GAO-06-656 (Washington, D.C.: July 11, 2006). Workers who are injured on the job or who contract a work-related illness may receive benefits under state workers’ compensation programs. The federal government is not involved in financing or administering these programs nor does it set standards for such programs to enable them to receive favorable tax treatment. State workers’ compensation programs vary in terms of employer coverage as well as which injuries or illnesses are compensable and the level of benefits provided. However, these programs generally pay for medical care, rehabilitation, and provide cash benefits for workers who are injured on the job or contract work-related illnesses. In addition, benefits are generally provided to families of workers who die from work-related causes. See National Academy of Social Insurance, Workers’ Compensation: Benefits, Coverage, and Costs, 2012 (Washington, D.C.: August 2014).

Page 66 GAO-15-168R Contingent Workforce
Patient Protection and Affordable Care Act
The Patient Protection and Affordable Care Act (PPACA) refers to the health reform law enacted in 2010.84 The act includes provisions aimed at expanding access to affordable health insurance coverage. It requires certain employers to provide and most individuals to obtain health insurance or face financial penalties. PPACA allows states to expand eligibility for Medicaid to most low-income adults with incomes at or below 133 percent of the federal poverty level.85
With respect to private health insurance coverage, the act required the establishment, in each state, of health insurance exchanges (marketplaces) in which eligible families and individuals can purchase private insurance. It also established a refundable health insurance premium tax credit, generally paid in advance, to offset some of the cost of health insurance purchased through such an exchange. The act also mandates that individuals, subject to certain exceptions, obtain health insurance coverage or pay a financial penalty beginning in 2015.
As of mid-January 2015, 28 states plus the District of Columbia had implemented Medicaid expansion programs, with additional programs under consideration, according to the Department of Health and Human Services and the Kaiser Family Foundation.
In addition, the act provides, beginning in 2014, that large employers—those with 50 or more full-time employees—who fail to offer their full-time employees (and their dependents) health coverage that is affordable and meets certain other requirements will be subject to a tax penalty for each full-time employee who enrolls in an exchange plan and receives a premium tax credit. A full-time employee under the act is one who works, on average, 30 or more hours a week. Seasonal employees, defined under the law as those seasonal and temporary positions for which the customary annual employment is six months or less, are not included in the calculation of full-time employees. The Internal Revenue Services has announced it will gradually phase in this “employer shared responsibility requirement” beginning in 2015.
PPACA also imposes requirements on individual and group health plans, including both insured and self-insured group health plans. Among other provisions, the act guarantees the availability and renewability of health insurance coverage in the individual and group markets and limits the waiting period a group health plan may impose before an employee or dependent who is otherwise eligible to enroll can do so to a maximum of 90 days.
The act amended the Fair Labor Standards Act to require employers with more than 200 full-time employees that offer employees enrollment in one or more health benefit plans to automatically enroll new full-time employees in one of those plans, and to continue the enrollment of current employees in a health benefit plan offered through the employer. Any automatic enrollment program must include adequate notice and an opportunity for an employee to opt out of coverage. These amendments require employers to inform employees of the existence of a health benefit exchange, that they may be eligible for a premium tax credit and cost sharing reduction, and that if the employee purchases a health plan through the exchange, the employee may lose the employer contribution to any health benefit plan offered by the employer.
84 Pub. L. No. 111-148, 124 Stat. 119 (2010). References to the Patient Protection and Affordable Care Act include amendments made by the Health Care and Education Reconciliation Act of 2010. 85 PPACA imposes a 5 percent income disregard when calculating modified adjusted gross income (MAGI), which, in effect, raises this income limit to 138 percent of the federal poverty level.

Page 67 GAO-15-168R Contingent Workforce
Enclosure IV: Characteristics of the Contingent Workforce in the 2005 Contingent Work Supplement and the 2010 General Social Survey
Table 30: Characteristics of the Contingent Workforce in the 2005 Contingent Work Supplement
Characteristic (percentage of workers unless otherwise noted)
Agency temps
On-call workers and day laborers
Contract company workers
Direct-hire
temps
Core contin.a
Indep. cntrct.
Self-emp.
workers
Stnd. part-time
Stnd. full-time
Age Mean age (years)
37.4 (+/- 1.5)
38.9 (+/- 1.1)
40.3 (+/- 1.7)
35.2 (+/- 1.1)
37.4 (+/- 0.7)
46.4 (+/- 0.5)
47.9 (+/- 0.6)
36.2 (+/- 0.5)
40.8 (+/- 0.2)
16-19 years 2.7 (+/- 11.2)
6.9 (+/- 7.3)
0.9 (+/- 13.8)
10.9 (+/- 6.9)
7.1 (+/- 4.3)
0.9 (+/- 3.9)
0.4 (+/- 5.1)
20.0 (+/-2.6)
1.2 (+/-1.3)
20-24 years 16.6 (+/- 10.4)
15.1 (+/-7.0)
10.7 (+/- 13.1)
21.5 (+/- 6.4)
17.3 (+/- 4.1)
3.5 (+/- 3.8)
1.2 (+/- 5.0)
17.3 (+/- 2.7)
8.5 (+/- 1.2)
25-34 years 29.8 (+/- 9.5)
21.5 (+/- 6.7)
25.2 (+/- 12.0)
25.3 (+/- 6.3)
24.7 (+/- 3.9)
14.7 (+/- 3.6)
12.8 (+/- 4.7)
15.1 (+/-2.7)
24.0 (+/- 1.1)
35-54 years 37.2 (+/- 9.0)
39.1 (+/-5.9)
47.0 (+/- 10.1)
28.5 (+/- 6.2)
35.6 (+/- 3.6)
53.7 (+/- 2.7)
55.3 (+/- 3.4)
30.0 (+/- 2.5)
52.1 (+/- 0.9)
55-64 years 11.1 (+/- 10.7)
10.7 (+/- 7.2)
14.0 (+/- 12.9)
8.7 (+/- 7.0)
10.3 (+/- 4.3)
18.8 (+/- 3.5)
21.4 (+/- 4.5)
10.0 (+/- 2.8)
12.6 (+/- 1.2)
65+ years 2.7 (+/- 11.2)
6.7 (+/- 7.3)
2.3 (+/- 13.8)
5.2 (+/- 7.1)
5.0 (+/- 4.4)
8.5 (+/- 3.7)
8.9 (+/- 4.8)
7.7 (+/- 2.8)
1.7 (+/- 1.3)
Gender Men 47.2
(+/- 8.1) 52.7
(+/- 5.1) 69.0
(+/- 7.6) 48.6
(+/- 5.1) 52.0
(+/- 3.1) 64.7
(+/- 2.3) 63.2
(+/- 3.0) 31.5
(+/- 2.4) 55.6
(+/- 0.8) Women 52.8
(+/- 7.4) 47.3
(+/- 5.2) 31.0
(+/- 11.0) 51.4
(+/- 4.8) 48.0
(+/- 3.1) 35.3
(+/- 3.0) 36.8
(+/- 3.8) 68.5
(+/- 1.6) 44.4
(+/- 0.9) Race White, non-Hispanic
49.7 (+/- 8.1)
68.1 (+/- 4.3)
61.9 (+/- 8.6)
63.5 (+/- 4.4)
62.8 (+/- 2.8)
80.0 (+/- 1.8)
80.9 (+/- 2.2)
75.7 (+/- 1.4)
68.7 (+/- 0.7)
Black, non-Hispanic
21.8 (+/- 10.7)
8.3 (+/- 7.7)
14.9 (+/- 13.6)
9.4 (+/- 7.4)
11.5 (+/- 4.5)
5.4 (+/- 4.0)
3.6 (+/- 5.3)
8.9 (+/- 3.0)
11.4 (+/- 1.3)
Other, non-Hispanic
7.5 (+/- 10.9)
4.7 (+/- 7.4)
6.8 (+/- 13.4)
9.3 (+/- 6.9)
7.1 (+/- 4.3)
5.4 (+/- 3.8)
9.0 (+/- 4.8)
4.8 (+/- 2.9)
6.1 (+/- 1.2)
Hispanic 21.0 (+/- 10.7)
19.0 (+/- 7.2)
16.4 (+/- 13.5)
17.8 (+/- 7.0)
18.6 (+/- 4.3)
9.2 (+/- 3.9)
6.5 (+/- 5.2)
10.7 (+/- 2.9)
13.8 (+/- 1.3)
Highest degree Less than high school
18.0 (+/- 10.3)
20.2 (+/- 6.8)
16.7 (+/- 12.7)
14.9 (+/- 6.7)
17.4 (+/- 4.1)
8.2 (+/- 3.7)
7.9 (+/- 4.9)
21.1 (+/- 2.6)
9.2 (+/- 1.2)
High school 29.4 (+/- 9.6)
28.7 (+/- 6.4)
22.1 (+/- 12.3)
20.8 (+/- 6.5)
25.1 (+/- 3.9)
27.5 (+/- 3.3)
28.4 (+/- 4.3)
27.0 (+/- 2.5)
30.6 (+/- 1.1)
Some collegeb 32.0 (+/- 9.4)
28.2 (+/- 6.4)
29.1 (+/- 11.7)
33.3 (+/- 5.9)
30.8 (+/- 3.8)
29.2 (+/- 3.3)
25.9 (+/- 4.4)
34.6 (+/- 2.4)
28.5 (+/- 1.1)
Bachelors 18.5 (+/- 10.3)
16.4 (+/- 6.9)
17.8 (+/- 12.6)
17.1 (+/- 6.6)
17.1 (+/- 4.1)
21.9 (+/- 3.4)
22.7 (+/- 4.5)
12.4 (+/- 2.7)
20.8 (+/- 1.1)
Graduate 2.1 (+/- 11.2)
6.4 (+/- 7.3)
14.4 (+/- 12.9)
14.1 (+/- 6.7)
9.5 (+/- 4.3)
13.2 (+/- 3.6)
15.2 (+/- 4.7)
5.0 (+/- 2.9)
10.9 (+/- 1.2)
Source: GAO analysis of data from the 2005 Contingent Work Supplement to the Current Population Survey. | GAO-15-168R
Note: Core contingent workers, independent contractors, self-employed workers, and standard part-/full-time workers abbreviated as core contin., indep. cntrct., self-emp. workers, and stnd. part-/full-time, respectively. a Core contingent includes agency temps, direct-hire temps, contract company workers, on-call workers, and day laborers. b Some college includes individuals who attended college but did not obtain a degree as well as those who completed associate degrees in either academic or vocational programs.

Page 68 GAO-15-168R Contingent Workforce
Table 31: Characteristics of the Contingent Workforce in the 2010 General Social Survey
Characteristic (percentage of workers unless otherwise noted)
Agency temps
On-call workersa
Contract company workers
Core contingentb
Independent contractors
Self-employed workers
Standard part-time
Standard full-time
Age Mean age (years) 33.8
(+/- 6.5) 40.6
(+/- 5.3) 43.7
(+/- 6.1) 40.7
(+/- 3.6) 50.4
(+/- 2.2) 53.7
(+/- 4.4) 41.9
(+/- 2.9) 41.9
(+/- 1.0) 18-24 years --- --- --- 18.7
(+/- 11.2) 2.1
(+/- 3.5) 2.1
(+/- 12.0) 20.1
(+/-8.8) 7.4
(+/-3.2) 25-34 years --- 27.2
(+/- 14.0) --- 26.0
(+/- 11.2) 11.8
(+/- 6.9) --- 18.7
(+/-7.3) 25.9
(+/- 3.9) 35-54 years --- 20.1
(+/-14.2) --- 33.2
(+/- 11.3) 48.0
(+/- 8.6) --- 32.6
(+/- 9.0) 49.0
(+/- 5.1) 55-64 years --- --- --- 10.2
(+/- 9.7) 21.7
(+/- 8.9) --- 17.3
(+/- 7.7) 15.7
(+/- 3.2) 65+ years --- 15.0
(+/- 12.4) --- 12.0
(+/- 8.3) 16.4
(+/- 7.5) --- 11.2
(+/- 6.3) 2.0
(+/- 1.6) Gender Men --- --- --- 61.5
(+/- 12.6) 66.0
(+/- 8.2) --- 27.9
(+/-8.5) 47.7
(+/- 4.4) Women --- --- --- 38.8
(+/- 12.6) 34.0
(+/- 8.2) --- 72.1
(+/- 8.5) 52.3
(+/- 4.4) Race White, non-Hispanic --- --- --- 47.9
(+/- 12.4) 75.3
(+/- 7.7) --- 72.0
(+/- 8.2) 70.1
(+/- 5.0) Black, non-Hispanic --- 10.5
(+/- 13.3) --- 19.3
(+/- 12.1) 8.1
(+/- 6.0) --- 15.4
(+/- 7.5) 13.4
(+/- 4.3) Other, non-Hispanic --- --- --- 3.6
(+/- 12.4) 8.4
(+/- 6.9) 6.6
(+/- 12.6) 3.6
(+/- 4.9) 3.5
(+/- 1.8) Hispanic --- --- --- 29.2
(+/- 13.5) 8.2
(+/- 6.9) --- 9.0
(+/- 7.7) 13.0
(+/- 5.4) Highest degree Less than high school --- --- --- 30.8
(+/- 13.0) 14.5
(+/- 8.0) --- 10.2
(+/- 6.8) 7.7
(+/- 3.4) High school --- --- --- 52.9
(+/- 13.8) 35.8
(+/- 8.4) --- 56.4
(+/- 8.5) 47.7
(+/-4.7) Associate/junior college
--- 2.1 (+/- 11.8)
--- 2.9 (+/- 6.2)
10.5 (+/- 7.9)
2.3 (+/- 11.8)
11.9 (+/- 8.0)
8.6 (+/- 2.9)
Bachelors --- 7.5 (+/- 12.3)
--- 11.0 (+/- 9.8)
25.6 (+/- 8.5)
--- 10.6 (+/- 5.8)
22.4 (+/- 3.4)
Graduate --- 4.3 (+/- 11.6)
1.2 (+/- 7.3)
2.4 (+/- 5.2)
13.6 (+/- 7.0)
--- 10.9 (+/- 5.7)
13.6 (+/- 3.1)
Source: GAO analysis of data from the 2010 General Social Survey. | GAO-15-168R
Note: Dashes indicate that the sample size was too small to compute reportable estimates. a The General Social Survey does not identify direct-hire temps or day laborers as separate work arrangements. b Core contingent includes agency temps, direct-hire temps, contract company workers, on-call workers, and day laborers (direct-hire temps and day laborers not identified separately in the GSS).

Page 69 GAO-15-168R Contingent Workforce
Enclosure V: Agency Comments
Page 70 GAO-15-168R Contingent Workforce

Page 71 GAO-15-168R Contingent Workforce
Enclosure VI: GAO Contact and Staff Acknowledgments
GAO Contact
Charles A. Jeszeck, Director, (202) 512-7215 or [email protected].
Staff Acknowledgments
In addition to the contact named above, Gretta L. Goodwin, Assistant Director; Julianne Hartman Cutts, Michael Kniss, Justin Gordinas, Susanna Clark, Rhiannon Patterson, and Jesse Tow, along with Carl Barden, Melinda Cordero, Kirsten Lauber, and Anna Maria Ortiz, made significant contributions to this report. In addition, key support was provided by James Bennett, Jessica Botsford, Susan Bernstein, Holly Dye, Kathy Leslie, and Sheila McCoy.

Page 72 GAO-15-168R Contingent Workforce
Related GAO Products
Contingent Workers: Incomes and Benefits Lag Behind Those of Rest of Workforce. GAO/HEHS-00-76. Washington, D.C.: June 30, 2000.
Employee Misclassification: Improved Coordination, Outreach, and Targeting Could Better Ensure Detection and Prevention. GAO-09-717. Washington, D.C.: August 10, 2009.
Employee Misclassification: Improved Outreach Could Help Ensure Proper Worker Classification. GAO-07-859T. Washington, D.C.: May 8, 2007.
Employment Arrangements: Improved Outreach Could Help Ensure Proper Worker Classification. GAO-06-656. Washington, D.C.: July 11, 2006.
Fair Labor Standards Act: Extending Protections to Home Care Workers. GAO-15-12. Washington, D.C.: December 17, 2014.
Unemployment Insurance: Low-Wage and Part-Time Workers Continue to Experience Low Rates of Receipt. GAO-07-1147. Washington, D.C.: September 7, 2007.
Worker Protection: Labor’s Efforts to Enforce Protections for Day Laborers Could Benefit from Better Data and Guidance. GAO-02-925. Washington, D.C.: September 26, 2002.
(131302)

This is a work of the U.S. government and is not subject to copyright protection in the United States. The published product may be reproduced and distributed in its entirety without further permission from GAO. However, because this work may contain copyrighted images or other material, permission from the copyright holder may be necessary if you wish to reproduce this material separately.

The Government Accountability Office, the audit, evaluation, and investigative arm of Congress, exists to support Congress in meeting its constitutional responsibilities and to help improve the performance and accountability of the federal government for the American people. GAO examines the use of public funds; evaluates federal programs and policies; and provides analyses, recommendations, and other assistance to help Congress make informed oversight, policy, and funding decisions. GAO’s commitment to good government is reflected in its core values of accountability, integrity, and reliability.
The fastest and easiest way to obtain copies of GAO documents at no cost is through GAO’s website (http://www.gao.gov). Each weekday afternoon, GAO posts on its website newly released reports, testimony, and correspondence. To have GAO e-mail you a list of newly posted products, go to http://www.gao.gov and select “E-mail Updates.”
The price of each GAO publication reflects GAO’s actual cost of production and distribution and depends on the number of pages in the publication and whether the publication is printed in color or black and white. Pricing and ordering information is posted on GAO’s website, http://www.gao.gov/ordering.htm.
Place orders by calling (202) 512-6000, toll free (866) 801-7077, or TDD (202) 512-2537.
Orders may be paid for using American Express, Discover Card, MasterCard, Visa, check, or money order. Call for additional information.
Connect with GAO on Facebook, Flickr, Twitter, and YouTube. Subscribe to our RSS Feeds or E-mail Updates. Listen to our Podcasts . Visit GAO on the web at www.gao.gov.
Contact:
Website: http://www.gao.gov/fraudnet/fraudnet.htm E-mail: [email protected] Automated answering system: (800) 424-5454 or (202) 512-7470
Katherine Siggerud, Managing Director, [email protected], (202) 512-4400, U.S. Government Accountability Office, 441 G Street NW, Room 7125, Washington, DC 20548
Chuck Young, Managing Director, [email protected], (202) 512-4800 U.S. Government Accountability Office, 441 G Street NW, Room 7149 Washington, DC 20548
GAO’s Mission
Obtaining Copies of GAO Reports and Testimony
Order by Phone
Connect with GAO
To Report Fraud, Waste, and Abuse in Federal Programs
Congressional Relations
Public Affairs
Please Print on Recycled Paper.