gao-11-909 national export initiative: u.s. and foreign
TRANSCRIPT

United States Government Accountability Office
GAO Report to Congressional Requesters
NATIONAL EXPORT INITIATIVE
U.S. and Foreign Commercial Service Should Improve Performance and Resource Allocation Management
September 2011
GAO-11-909

United States Government Accountability Office
Highlights of GAO-11-909, a report to congressional requesters
September 2011
NATIONAL EXPORT INITIATIVE U.S. and Foreign Commercial Service Should Improve Performance and Resource Allocation Management
Why GAO Did This Study
Recognizing the potential of increased exports to drive economic growth and create jobs, President Obama in 2010 launched the National Export Initiative (NEI), aimed at doubling the dollar value of U.S. exports by the end of 2014. As requested, GAO examined the extent to which (1) the goals and activities of the U.S. and Foreign Commercial Service (CS) support the NEI, (2) CS performance measures accurately reflect its activities and align with the NEI, and (3) CS incorporates relevant data in allocating resources to help achieve its strategic goals.
GAO interviewed Department of Commerce (Commerce) officials, particularly from CS, and CS staff and officials at six overseas posts. GAO analyzed the NEI’s priorities, and documents and data related to CS activities and performance.
What GAO Recommends
GAO recommends that the Department of Commerce (1) take steps to improve the CS customer-service survey response rate and include customer-service-related data in its performance measures, (2) take further steps to achieve greater cooperation by CS clients in reporting the dollar value of export successes, (3) review CS’s Overseas Resource Allocation Model to determine whether its variables and structure best incorporate available indicators of potential U.S. exports, (4) include commercial diplomacy and advocacy data in evaluating cost-benefit ratios of CS locations, and (5) systematically include activity data in making resource allocation decisions.
Commerce welcomed and generally agreed with the overall findings and recommendations in the report.
What GAO Found
CS’s goals and activities generally support NEI priorities by, for example, arranging trade missions, assisting U.S. exporters with trade problems, and advocating on behalf of U.S. firms competing for foreign government contracts. The NEI has not required CS to undertake new activities; however, it has prompted CS to direct more of its efforts toward certain markets, activities, and sectors and to shift its focus from firms that are new to exporting to firms already exporting, as firms exporting to new markets or increasing exports to markets in which they are already active produce the greatest share of export successes (see figure).
Share of CS Export Successes by Type of Firm, Fiscal Years 2008-2010
Increase-to-market
New-to-export
New-to-market60%
5%
35%13,246
22,372
1,732
Source: GAO analysis of CS data.
Companies increasing exports in a market where they already export
Firms making their first sale to a customer outside the United States
Companies expanding exports into an additional market
In fiscal year 2012, CS will implement revised performance measures that align more closely with the NEI. Although CS did not meet four of its six performance targets in 2010, it achieved increases in most of its measures as it shifted to address NEI priorities. CS’s revised performance measures for fiscal year 2012 address some past weaknesses; however, some weaknesses will remain—for example, the lack of a measure for customer-service satisfaction and the clients’ underreporting of export successes, especially with regard to dollar value. CS’s new measures necessitate that export success data be complete and accurate; otherwise, CS’s efforts to support the NEI goal will be undervalued and policymakers will not have an accurate picture of CS’s performance.
CS’s resource allocation management process does not make full use of relevant information to guide its decisions. CS is using a data-driven process to prioritize foreign markets (and domestic locations) and to help it allocate staff and other resources to meet its performance goals and support NEI objectives. GAO’s analysis of the quantitative parts of the process, however, found that there may be opportunities to reallocate overseas resources to better reflect NEI priorities and better achieve CS’s new performance goals. The overseas model, designed to reflect export potential of partner countries, currently gives greater weight to historical variables that have a high degree of overlap with the other historical inputs in the resource allocation process. Also, the process does not systematically consider important available data on commercial diplomacy and advocacy, which are related to CS performance goals, and program activity data on how CS staff divide their time. Including such data in the process would help Commerce managers make decisions informed by the best available information.
View GAO-11-909 or key components. For more information, contact Loren Yager at (202) 512-4347 or [email protected].

Page i GAO-11-909
Contents
Letter 1
Background 3 Commercial Service’s Goals and Activities Support the National
Export Initiative 5 Commercial Service Is Modifying Performance Measures to Align
More Closely with the NEI 14 Commercial Service’s Resource Allocation Process Does Not Make
Full Use of Relevant Information to Guide Its Decisions 23 Conclusions 46 Recommendations for Executive Action 48 Agency Comments and Our Evaluation 49
Appendix I Scope and Methodology 50
Appendix II Distribution of Domestic CS Staff in U.S. Export Assistance Centers by State, Fiscal Year 2010 53
Appendix III Country Groupings and Allocation of Overseas CS Staff in Fiscal Year 2010 55
Appendix IV Locations of State Department Partnership Posts Providing Export Promotion Services 57
Appendix V Country Groupings and U.S. Exports, Calendar Years 2008-2010 58
Appendix VI Example of Network Analysis of CS Fee-for-Service Activities 62
Appendix VII Comments from the Department of Commerce 64
National Export Initiative

Appendix VIII GAO Contact and Staff Acknowledgments 65
Tables
Table 1: CS Activities Align with NEI Priorities 10 Table 2: CS Fiscal Year 2010 Performance Measure Targets versus
Actual Performance 16 Table 3: Changes in CS Performance Measures, Fiscal Year 2010
versus 2012 17 Table 4: CS Fiscal Year 2012 Performance Measures and Targets 18
Figures
Figure 1: Average Time Frames Associated with Achieving Export Successes by Type of Exporter 13
Figure 2: Share of Export Successes by Exporter Type, Fiscal Years 2008-2010 14
Figure 3: Fiscal Year 2011 Market Potential Scores by Market Group 26
Figure 4: Cost-Benefit Scores by Market Group, Annual Average, Fiscal Years 2006-2009 28
Figure 5: Number of Export Successes by Market Group, Annual Average, Fiscal Years 2008-2010 29
Figure 6: Total CS Staff by Market Group, Annual Average, Fiscal Years 2008-2010 33
Figure 7: Total CS Budget by Market Group, Annual Average, Fiscal Years 2008-2010 35
Figure 8: Distribution of Individual Country CS Market Potential Scores, Fiscal Year 2011 37
Figure 9: Number of Commercial Diplomacy Successes, Annual Average, Fiscal Years 2008-2010 39
Figure 10: Value of Advocacy Wins by Market Group, Annual Average, Fiscal Years 2008-2010 40
Figure 11: Number of Export Promotion Fee-based Services Sold by Market Group, Annual Average, Fiscal Years 2008-2010 43
Figure 12: Average Annual Sales per Country Staff by Market Group, Fiscal Years 2008-2010 44
Figure 13: Network of Strongest Relationships between Domestic and International CS Offices, Fiscal Years 2008-2010 63
Page ii GAO-11-909 National Export Initiative

Abbreviations
Commerce U.S. Department of Commerce CS U.S. and Foreign Commercial Service GDP gross domestic product FTA free trade agreement GPRA Government Performance and Results MSA Metropolitan Statistical Area NEI National Export Initiative SME small and medium-sized enterprise State U.S. Department of State
This is a work of the U.S. government and is not subject to copyright protection in the United States. The published product may be reproduced and distributed in its entirety without further permission from GAO. However, because this work may contain copyrighted images or other material, permission from the copyright holder may be necessary if you wish to reproduce this material separately.
Page iii GAO-11-909 National Export Initiative

Page 1 GAO-11-909
United States Government Accountability Office
Washington, DC 20548
September 29, 2011
The Honorable Sherrod Brown Chairman Subcommittee on Financial Institutions and Consumer Protection Committee on Banking, Housing, and Urban Development United States Senate The Honorable Jeff Merkley United States Senate
In the wake of the recent global recession, high unemployment rates in the United States have persisted, motivating U.S. policymakers to intensify efforts to grow the economy and create jobs. With 95 percent of the world’s consumers living outside U.S. borders, a crucial focus of these efforts is to increase exports. At present, less than 1 percent of all U.S. companies export, largely due to the challenges of international trade, particularly for small and medium-sized businesses. Recognizing the potential of exports to help the United States solidify the recovery and accelerate job growth, on March 11, 2010, President Obama signed an executive order creating the National Export Initiative (NEI), which established the Export Promotion Cabinet to oversee U.S. trade promotion activities and set a goal of doubling the dollar value of exports in the next 5 years.1 The Secretary of Commerce committed to supporting the NEI’s goal by directing the department’s U.S. and Foreign Commercial Service (CS) to focus on key elements of the initiative, including advocating on behalf of U.S. exporters to help U.S. companies competing for international contracts and increasing the number of trade missions and other matchmaking efforts that bring U.S. sellers and foreign buyers together.
As requested, in this report we examined the extent to which (1) the goals and activities of the U.S. and Foreign Commercial Service support the NEI, (2) CS performance measures accurately reflect its activities and
1Exec. Order No. 13534, 75 Fed. Reg. 12433 (Mar. 11, 2010).
National Export Initiative
align with the NEI, and (3) CS incorporates relevant data in allocating resources to help achieve its strategic goals.
To determine CS’s export promotion role and the extent to which its goals and activities support the NEI’s priorities, we reviewed CS’s statutory mission, CS services and activity information, and the Report to the President on the National Export Initiative.2 We also met with CS officials in Washington, D.C., who are responsible for managing CS. We also traveled to six overseas posts (Brazil, Chile, China, El Salvador, Thailand, and Vietnam) and interviewed CS commercial officers and locally employed staff who carry out CS’s mission. The posts we visited differed in staff size (small, medium, and large) and included posts considered to be key markets (Brazil and China) or designated as an NEI priority market (Vietnam). Information from the six posts is not generalizable but was used to understand how activity data are collected, input, and used at posts and in headquarters, as well as to identify any potential problems with the data—topics also discussed in interviews with CS officials in Washington, D.C.
To determine how CS measures progress toward its goals and the extent to which its performance measures accurately reflect its activities and align with the NEI, we reviewed CS’s performance measures as documented in Department of Commerce (Commerce) annual performance and accountability reports for fiscal years 2008 through 2010, as well as Commerce’s congressional budget submissions for fiscal years 2011 and 2012. Additionally, we reviewed CS’s annual reports for fiscal years 2009 and 2010 to determine what performance measures CS reported publicly, and interviewed CS officials responsible for developing and tracking CS’s performance measures to learn about the development of the fiscal year 2010 and 2012 measures. Additionally, we reviewed data CS provided us on performance measures it tracks for its own use and that are not reported in the performance and accountability reports.
To determine the extent to which CS uses relevant data in allocating its resources to help achieve its strategic goals, we interviewed CS officials about its resource allocation process, including the use of the Overseas Resource Allocation Model, cost-benefit analysis, and other factors CS
2Department of Commerce, Report to the President on the National Export Initiative: The Export Promotion Cabinet’s Plan for Doubling U.S. Exports in Five Years (Washington, D.C.: 2010).
Page 2 GAO-11-909 National Export Initiative

considers when making resource allocation decisions. We also analyzed CS activity data in conjunction with its domestic and foreign office staffing and budgets from 2008 through 2010. We analyzed the fiscal year 2011 Overseas Resource Allocation Model, examining the impact of market size and market structure weighting, as well as the weighting of the 20 individual variables used in the model to determine country ranking. In addition, we analyzed CS’s cost-benefit model in conjunction with staffing and activity data. We determined that the CS data on activities (including fee for service), events, budget and staffing, and performance measures were sufficiently reliable for the purposes of this engagement.
We conducted this performance audit from September 2010 to September 2011, in accordance with generally accepted government auditing standards. Those standards require that we plan and perform the audit to obtain sufficient, appropriate evidence to provide a reasonable basis for our findings and conclusions based on our audit objectives. We believe that the evidence obtained provides a reasonable basis for our findings and conclusions based on our audit objectives. Appendix I contains additional details about our scope and methodology.
The Department of Commerce chairs the coordinating committee of federal trade promotion and finance agencies charged with implementing the NEI. CS is one of four business units within Commerce’s International Trade Administration. The other units are Market Access and Compliance, Manufacturing and Services, and Import Administration.3 CS is the largest unit in terms of budget and staff, and about two-thirds of its staff work at posts outside the United States. CS’s statutory purpose is to promote the export of goods and services from the United States, particularly by small and medium-sized enterprises (SME), and to advance and protect United States business interests abroad.4 While CS’s mission specifically identifies SMEs, CS assists companies of all sizes. According to the U.S. Census Bureau, in calendar year 2009, the total number of identified U.S. export firms was about 276,000, of which
Background
3GAO recently completed an evaluation of the Manufacturing and Services unit. See Department of Commerce: Office of Manufacturing and Services Could Better Measure and Communicate Its Contributions to Trade Policy, GAO-11-583. (Washington, D.C.: June 7, 2011).
415 U.S.C. § 4721.
Page 3 GAO-11-909 National Export Initiative

over 97 percent were SMEs. The dollar value of exports associated with the efforts of SMEs that year amounted to about $308 billion, which represented approximately one-third of the $939 billion in exports.5
CS Has a Global Network That Includes Domestic and Overseas Posts
CS employs a variety of staff in its global network. Domestically, CS had about 500 staff working in Washington, D.C., and throughout the United States in 2010. Overseas, CS mainly employs Foreign Service officers6 and locally employed staff. In 2010, CS had over 900 staff overseas, including both Foreign Service officers and locally employed staff.
CS operates 108 domestic offices referred to as U.S. Export Assistance Centers. Staffed by trade specialists, and Foreign Service officers on domestic tours, the centers deliver the full range of export promotion services to U.S. companies and connect to CS’s global network of overseas offices. The centers work cooperatively with key partner agencies and organizations, especially the Export-Import Bank, the Small Business Administration, and state trade offices. (See app. II for the allocation of domestic CS staff in fiscal year 2010, by state.)
CS’s 125 offices in more than 75 countries promote U.S. exports and defend U.S. commercial interests, implementing the full range of Department of Commerce overseas commercial services. Foreign Service officers, referred to as commercial officers, manage the overseas offices and engage in activities requiring a U.S. official. Locally engaged staff, consisting of commercial specialists and commercial assistants, provide export promotion services to U.S. companies and support the commercial officers in other activities. (See app. III for a table of country groupings and allocation of overseas CS staff in fiscal year 2010.)
In 45 countries where the CS has no presence, it engages in a Partnership Program with the State Department (State) under which
National Export Initiative
5Department of Commerce, U.S. Census Bureau, A Profile of U.S. Exporting Companies, 2008–2009 (Washington, D.C.: 2011). The report indicates that the $939 billion is the “known value” of exports in calendar year 2009 since not all exports that occur are tracked.
6Some Foreign Service officers are assigned to domestic field offices, headquarters, and international development banks.
Page 4 GAO-11-909
State Foreign Service officers and locally employed staff provide some export promotion assistance. In September 2011, the Departments of Commerce and State agreed to expand the program to an additional 11 countries. The formal Partnership Program began in January 2009; however, CS and State have a long history of working together because, for many years, commercial officers were part of State until the Commercial Service was established as a separate entity under Commerce in 1980. (See app. IV for the locations of State Department partnership posts providing export promotion services.)
CS also operates a Trade Information Center, which serves as a central point of contact for U.S. exporters seeking export advice such as how to begin exporting; complying with trade documentation requirements, standards, and regulations; and accessing other U.S. government trade programs and resources. Additionally, CS’s Advocacy Center, in Washington, D.C., with support from CS offices abroad, assists individual firms in various industry sectors competing for foreign government contracts.
Commercial Service’s
Goals and Activities Support the National Export Initiative
CS Provides Services to U.S. Exporters, Particularly to SMEs
The goals and activities of the U.S. and Foreign Commercial Service contribute to the National Export Initiative (NEI) goal of doubling the dollar value of U.S. exports from $1.57 trillion in 2009 to $3.14 trillion by the end of 2014. CS’s strategic goals include expanding the exports of U.S. goods and services, removing obstacles to exporting, particularly for small and medium-sized companies, and advancing U.S. business interests abroad by advocating on their behalf and helping to remove foreign trade barriers. CS conducts a variety of activities to advance these goals, generally falling into four broad categories: (1) trade counseling, (2) fee-for-service activities, (3) commercial diplomacy, and (4) advocacy. In addition to these core activities, CS assists other U.S. agencies overseas involved in trade-related activities, mainly at overseas posts. Our interviews with Foreign Service officers and locally employed staff at the six posts we visited indicate that counseling and fee-for-service activities are the primary focus
Page 5 GAO-11-909 National Export Initiative

of their day-to-day activities and take most of their time. However, CS also promotes the export success of U.S. firms and advances U.S. business interests abroad by helping firms overcome obstacles in specific markets through commercial diplomacy and by advocating on their behalf for foreign government contracts. When any CS trade-promotion activity successfully assists a U.S. company to export a product or service, CS staff document an “export success” that is verified by CS management. An export success is defined as a CS service, rendered by locally employed staff, Foreign Service officers, or U.S. Export Assistance Centers, that facilitates (1) a sale of a product or service; (2) a commercial agreement (distribution, wholesale, or joint venture); or (3) an overseas activity resulting in revenue for a U.S. company or its affiliate or subsidiary.7
Trade counseling involves assisting U.S. businesses in understanding foreign markets and developing export marketing plans, as well as providing information about export finance and public and private export promotion assistance. CS counsels thousands of firms each year, particularly SMEs. CS counsels firms that have never exported, as well as firms already exporting that want to expand their efforts to one or more new markets or to increase their exports to one or more markets where they already have a presence. (CS categorizes these types of firms, respectively, as new-to-export, new-to-market, and increase-to-market.) From 2008 through 2010, according to CS, it had approximately 68,000 clients, and counseling activities were the primary service provided in over 18,000 export successes during that period.
Trade Counseling
CS’s fee-for-service activities include standardized services such as matchmaking, which CS generally refers to as a Gold Key—introducing U.S. businesses to qualified buyers overseas—and providing market intelligence such as reports on a specific foreign company, which CS refers to as International Company Profiles. CS also provides customized services such as Business Facilitation Services, Single Company Promotions, Customized Market Research, Trade Missions, and Webinars, among others. CS is authorized to charge a user fee for its
Fee-for-Service Activities
7Specifically, overseas activities include (1) opening an overseas office or making an overseas investment directly supportive of a client’s export, (2) helping a client avoid harm through due diligence, (3) removing a market access barrier, (4) resolving an export trade complaint, (5) obtaining foreign publicity for a U.S. client that facilitates an export sale, (6) securing product/service registration, and (7) securing positive resolution in an advocacy case.
Page 6 GAO-11-909 National Export Initiative

export promotion services. Since May 2008, its standardized fees have been based on full-cost recovery for large companies and a lower amount for new-to-export SMEs. Fees for customized services also vary based on company size, with large companies paying more than SMEs. Large companies pay 100 percent of both direct and indirect costs, whereas SMEs pay 100 percent of direct costs but 35 percent of indirect costs.8 From fiscal year 2008 through 2010, U.S. firms purchased a total of 27,076 services from CS, of which approximately 68 percent9 were purchased by SMEs. CS collected approximately $19 million in fees for these services.
CS addresses a wide variety of obstacles that U.S. companies may face in specific markets by conducting commercial diplomacy on their behalf, as well as by assisting with formal efforts by the International Trade Administration’s Market Access and Compliance unit to remove government-imposed barriers such as standards or technical barriers and subsidies. Overall, from fiscal year 2008 through 2010, CS successfully assisted 486 companies through commercial diplomacy efforts, resulting in at least $17 billion in exports.10 Commercial diplomacy occurs when CS’s interactions with foreign governments contribute to achieve one or more of the following outcomes:
Commercial Diplomacy
reduce, eliminate, or prevent a foreign trade barrier;
comply with a bilateral or multilateral trade agreement;
eliminate or reduce a threat to U.S. business interests; and
create market opportunities.
National Export Initiative
8Direct costs include costs billed by a third party needed to deliver a CS product or service, such as ground transportation, translators, or airport expediter. Indirect costs include CS resources used to provide a service or benefit to a client; these are usually calculated based on the number of CS staff hours worked to provide the service.
9Large companies purchased 26 percent of CS services, and 6 percent of companies purchasing CS services did not identify their company size.
10CS uses the export success dollar value to calculate the total value of its commercial diplomacy efforts. Not all commercial diplomacy successes contain a dollar value when reported; thus, $17 billion is a conservative estimate of the actual total value.
Page 7 GAO-11-909

For example, if a company comes to CS indicating that a shipment of mackerel valued at $100,000 is being held by customs in a particular European country due to a regulation that is inconsistent with its international trade obligations, CS may assist the company by engaging the foreign government to advocate that the regulation—in this case requiring a European Union health certificate—is inconsistent with a bilateral trade agreement. If CS’s diplomacy efforts are successful in this case, the European Union member would rescind the regulation and release the shipment from customs. CS could then count this case as a commercial diplomacy success.
CS also assists Market Access and Compliance led teams in overcoming existing or potential trade barriers facing U.S. companies or exporters. Because of their overseas presence, CS commercial officers on these teams generally represent U.S. interests in interactions with foreign governments. In addition, these teams may work to ensure that U.S. exporters receive benefits of a trade agreement or avoid potential inconsistencies in the implementation of an agreement. For example, CS, in collaboration with Market Access and Compliance, might help a U.S. firm that is stymied by a country’s arbitrary customs valuations that would lead to excessive tariffs on the firm’s products. The Market Access and Compliance team, with CS playing a key role, would advocate on behalf of such a company in a concerted effort to get the country to honor its commitments under the World Trade Organization’s Customs Valuation Agreement. From fiscal year 2008 through 2010, Market Access and Compliance initiated 664 such cases and reported that it successfully resolved 248 cases with CS assistance. The average annual percentage of cases undertaken on behalf of SMEs during that period was 36 percent, and the total export value of the successfully closed cases was about $59 billion, according to Market Access and Compliance.
CS also advocates on behalf of U.S. companies interested in competing for government contracts in foreign countries. This type of activity involves educating U.S. companies about major overseas projects and procurements and advocating with the foreign government on behalf of U.S. companies wanting to bid on such projects. As of February 2011, CS had a 20-person Advocacy Center in Washington, D.C., but much of the
Advocacy
Page 8 GAO-11-909 National Export Initiative
work takes place in the field.11 Advocacy activities are often joint efforts with the State Department because CS regularly engages U.S. ambassadors and other U.S government officials in efforts to win foreign government contracts. CS data indicate that advocacy efforts resulted in 108 successful outcomes out of 1,239 cases, and the total value of the U.S. export content of those “advocacy wins” was about $44 billion from fiscal year 2008 through fiscal year 2010.
While CS advocates on behalf of companies of all sizes, advocacy results are mainly from large companies. For example, in fiscal year 2010, CS advocated successfully on behalf of 50 U.S. firms, of which 6 were SMEs. The total U.S. export content value of the 50 advocacy wins was about $17.1 billion, of which approximately $274 million (less than 1 percent of the total) reflected exports by SMEs. According to CS officials, SMEs generally do not seek out advocacy because the large government contracts are beyond their capabilities; however, many SMEs benefit from advocacy wins because they provide goods and services required by the large companies that win the contracts.
In addition to its export promotion and advocacy efforts, CS also supports other trade-related agencies’ efforts—for example, assisting the U.S. Trade and Development Agency, the U.S. Trade Representative, and the Export-Import Bank at overseas posts. CS overseas posts also host important delegations, including high-level federal agency officials, state trade offices and associations, and congressional delegations, and help host other official visits. CS overseas posts assisted a total of 1,203 important delegations for fiscal years 2008 through 2010.
Other Supporting-Role Activities
Important delegations of U.S. and foreign officials also visit sites within the United States, supported by CS’s domestic staff. The U.S. Export Assistance Centers supported 53 visits by foreign government officials and 208 visits by U.S. officials from 2008 through 2010.12 The centers
11The Advocacy Center also has Commercial Service liaisons to five multilateral development banks (World Bank, Inter-American Development Bank, European Bank for Reconstruction and Development, Africa Development Bank, and Asia Development Bank) to assist U.S. firms and advocate on their behalf when they compete for bank tenders.
12The number of visits by U.S. officials to the domestic field in 2008 was unusually high, a total of 142 visits, due to activities associated with the Colombia, Panama, and South Korea free trade agreements, which the United States has signed but for which Congress must enact legislation before they go into effect.
Page 9 GAO-11-909 National Export Initiative

also direct potential exporters to other U.S. government assistance, such as loans provided by the Small Business Administration and the U.S. Export-Import Bank. In addition, the centers work with District Export Councils throughout the United States—organizations of volunteer leaders from the local business community, appointed by the Secretary of Commerce, including exporters and export service providers, who assist the centers in export outreach and counseling to U.S. businesses and promote numerous trade-related activities.
CS Goals and Activities Align with NEI Priorities, but NEI Prompted New Areas of Emphasis
We found that CS activities align with six of the NEI’s eight trade promotion priorities, as shown in table 1. (Two other NEI priorities are not directly related to export promotion: increasing export credit and macroeconomic rebalancing, areas in which CS has no direct role.)
Table 1: CS Activities Align with NEI Priorities
NEI priorities CS activities supporting NEI
Exports by SMEs–broadening SME awareness of and facilitating access to U.S. government trade promotion programs and services, identifying SMEs that can begin or expand exporting, preparing SMEs to export successfully, connecting SMEs to export opportunities, and supporting SMEs once they find opportunities.
Outreach activities and trade counseling–educating firms about export opportunities and CS services, helping firms develop and execute international sales strategies, providing firms with market research and trade leads, arranging matchmaking meetings, and assisting firms in finding qualified agents or distributors. In FY 2010, more than 85 percent of companies assisted by CS were SMEs.
Federal export assistance–creating more opportunities for U.S. exporters to meet with foreign buyers either in the United States or overseas.
International Buyer Program–recruiting international buyers and distributors to attend U.S. trade shows and finding new international business partners for U.S. firms to meet with. Trade Fair Certification–certifying foreign trade fairs, and providing services ranging from receptions to matchmaking with foreign buyers.
Trade missions–increasing the number of trade missions (held abroad) and reverse trade missions (held in the United States).
Trade missions–CS trade professionals lead delegations of U.S. businesses to meet face to face with prescreened international business contacts overseas.
Commercial advocacy–helping level the playing field for U.S. businesses competing for international contracts.
Commercial advocacy–helping to level the playing field by assisting firms on a case-by-case basis pursue foreign government procurements or projects.
Reducing barriers to trade–improving market access overseas by opening new markets, identifying and reducing significant barriers to exports, and robustly enforcing trade agreements.
Reducing barriers to trade–assisting with formal efforts by the International Trade Administration’s Market Access and Compliance to remove government-imposed barriers such as standards or technical barriers and subsidies.
Export promotion of services–building on the other priorities with enhanced focus on services.
Export promotion of services–implementing an export promotion plan targeted at top services sectors in export value.
Source: Commerce.
Note: The priorities are identified in The Report to the President on the National Export Initiative.
Page 10 GAO-11-909 National Export Initiative

Supporting the NEI has not required CS to undertake any new activities; however, it has prompted CS to direct more of its efforts toward certain markets, specific kinds of activities, NEI-priority sectors such as services and clean-energy technology, and firms currently exporting to one or two markets but capable of expanding into additional markets.
The NEI highlighted a desire to focus more U.S. export promotion efforts in high-growth markets in Brazil, China, and India, and next-tier emerging markets in Colombia, Indonesia, Saudi Arabia, South Africa, Turkey, and Vietnam. These were markets where CS already had a presence. Nevertheless, in response to the NEI, CS arranged trade missions to several of these markets and indicated that it would also increase its staff in these markets.13
CS has also given increased attention to certain of its routine activities that the NEI identified as priorities; for example, CS increased trade missions abroad and expanded its International Buyer Program, which recruits qualified foreign buyers, sales representatives, and distributors to attend U.S. trade shows each year. For example, U.S. companies participating in CS trade missions increased from 210 in 2008 to 292 in 2010, and the number of International Buyer Program participants increased from 959 in 2008 to 1,005 in 2010. CS also provided additional funds in support of these activities. For example, a CS official stated that Brazil—an NEI priority country—received additional funds to support the International Buyer Program.
The NEI also prioritized the services sector and clean-energy technology. In response, CS led several trade missions focused specifically on clean energy to China, India, Indonesia, and Mexico in 2010. While CS has always assisted the services sector, including companies exporting services in information and communication technology, banking and finance, and logistics, the International Trade Administration developed an export expansion plan focusing on service exports to high-growth countries such as Brazil, China, and
13Since CS’s budgets have stayed relatively flat while its costs increased, its ability to increase staff in these countries is dependent on receiving increased funding or shifting resources from elsewhere.
Page 11 GAO-11-909 National Export Initiative

India and targeting the top services sectors in terms of export dollar value, such as construction and travel and tourism services.14
The NEI prompted CS to shift its focus from helping first-time exporters to encouraging firms already exporting, which supports NEI’s goal of doubling the dollar value of exports in 5 years. On average, according to CS, achieving an export success takes longer when it assists new-to-export firms than when it helps new-to-market or increase-to-market companies expand their exporting.15 (See fig. 1 for the different time frames CS estimates for achieving export success depending on the experience level of the exporter.) As a result, CS has placed more emphasis on its New Market Exporter Initiative, which it began in 2008.16
14Goods and services purchased by international travelers visiting the United States are considered exports, producing business revenue that creates jobs in the United States as well as federal, state, and local tax revenue.
15Type of firms includes new-to-export, meaning firms making their first export transaction to a foreign market; new-to-market, meaning firms exporting to a foreign market to which they had not exported in the past; and increase-to-market, meaning firms that increase exports in markets where they are already active.
16The New Market Exporter Initiative began under the auspices of CS’s Strategic Partnership Initiative, which increased collaboration with private organizations, state and local governments, trade associations, and educational institutions through a range of joint activities aimed at engaging more U.S. companies in exporting.
Page 12 GAO-11-909 National Export Initiative

Figure 1: Average Time Frames Associated with Achieving Export Successes by Type of Exporter
Increase-to-market
Source: Commerce.
Exporters by type
Months
New-to-market
60 12
New-to-export
18 24
Companies increasing exports in a market where they already export
Firms making their first sale to a customer outside the United States
Companies expanding exports into an additional market
Higher 12-month yield ............Achieving export success ..........Lower 12-month yield
Through the New Market Exporter Initiative, CS obtains information from partner firms that provide exporting services, such as FedEx, United Parcel Service, the U.S Postal Service, and the National Association of Manufacturers. Partner firms refer SMEs that are already exporting in one market to CS. CS then works with those SMEs to expand exporting to a second or additional market. CS has indicated that there are opportunity costs associated with shifting its focus in this way, including (1) loss of new-to-export activity in the short term and (2) a reduced pipeline of export-ready companies. However, to address these opportunity costs, CS is leveraging the resources of the Small Business Administration and District Export Councils by having them work with and support companies that are new-to-export. CS data indicate that the greatest number of CS export successes have come from firms that were increasing exports into markets where the firms were already exporting (increase-to-market firms). For fiscal years 2008 through 2010, increase-to-market firms accounted for 22,372 export successes, 60 percent of the total (see fig. 2). During the same period, new-to-market firms produced 13,246 export successes (35 percent), and firms that were new to exporting produced 1,732 export successes (5 percent).
Page 13 GAO-11-909 National Export Initiative

Figure 2: Share of Export Successes by Exporter Type, Fiscal Years 2008-2010
Increase-to-market
New-to-export
New-to-market60%
5%
35%13,246
22,372
1,732
Source: GAO analysis of CS data.
In fiscal year 2012, CS will implement revised performance measures that align more closely with the NEI. Although CS did not meet four of six performance targets in fiscal year 2010, its efforts resulted in increases for most of its measures as it shifted to address NEI priorities. CS’s new revised set of performance measures for fiscal year 2012 addresses some past weaknesses; however, some weaknesses will remain—for example, underreporting of export successes, especially with regard to their dollar value. Accurately measuring performance is crucial to results-oriented management. Performance measures enable an organization to track progress toward its goals and give managers key information that can be used, among other things, to identify problems and take corrective action, develop strategy and allocate resources, recognize and reward performance, and identify and share effective approaches. In short, performance measures provide powerful incentives to influence organizational and individual behavior. The Government Performance and Results Act (GPRA) of 1993 laid the foundation for results-oriented agency planning, measurement, and reporting in the federal government, highlighting the important role performance information plays in improving
Commercial Service Is Modifying Performance Measures to Align More Closely with the NEI
Page 14 GAO-11-909 National Export Initiative

the efficiency and effectiveness of an agency.17 The GPRA Modernization Act of 2010 reinforces these principles.18
CS Exceeded Past Performance for Effectiveness but Did Not Meet Most Targets in Fiscal Year 2010
CS tracked six performance measures to report on progress toward its goals in the Department of Commerce’s Fiscal Year 2010 Performance and Accountability Report, as required by GPRA.19 CS reported that it exceeded targets for two of its six performance measures, including the measure for overall effectiveness, while it failed to meet targets for the other four measures (see table 2 for CS’s fiscal year 2010 performance targets versus actual performance).20 Although CS did not meet most of its 2010 performance targets, its efforts still resulted in increases in the dollar value of some types of export successes, in the number of successes, or both. For example, CS reported that while it did not reach the target increase for the number of commercial diplomacy successes in 2010, the overall dollar value of those successes increased from $974 million in fiscal year 2009 to $4.56 billion in fiscal year 2010. Likewise, although CS did not meet its target for advocacy wins, the number of wins increased from 26 in fiscal year 2009 to 50 in fiscal year 2010. CS reported that it missed the new-to-export target due to its shift in focus toward new-to-market exporters in support of the NEI’s goal of doubling exports. Commerce noted that new exporters remain a priority of CS and the U.S. government. CS reported it is now referring these clients to the Small Business Administration and other partners so that CS can focus its efforts where it can best contribute to the goals of the NEI.
17Pub. L. No. 103-62, 107 Stat. 285 (1993).
18Pub. L. No. 111-352, 124 Stat. 3866 (2011). The GPRA Modernization Act of 2010 amends GPRA and is being implemented in phases starting in fiscal year 2012 (for reports on fiscal year 2011 results and fiscal year 2013 performance budgets).
19These measures differed somewhat from the GPRA measures CS used in 2008. In fiscal year 2009, CS used nearly the same measures as it did in 2010; the only difference was that in 2009 CS used average total dollar value of wins over three years, and it did not include percentage of advocacy bids won. CS maintained its 2010 measures in fiscal year 2011. In addition to its GPRA measures, CS also tracked other performance measures that were not publicly reported but were used for its own internal purposes.
20In addition to its six GPRA measures, the Commerce Department established a 2-year high-priority performance goal in fiscal year 2009: to increase the number of SMEs that CS successfully assisted in exporting to a second or additional country by 2011. In fiscal years 2009 and 2010, CS did not meet its targets. In 2009, the goal was 3,130, and CS’s actual performance was 2,876; in 2010, the goal was 3,513, and the actual performance was 2,813.
Page 15 GAO-11-909 National Export Initiative

Table 2: CS Fiscal Year 2010 Performance Measure Targets versus Actual Performance
Performance measure Target Actual Status
1. CS overall effectiveness (percent) (number of total firms CS assisted to achieve export success divided by number of CS active clients)
11.0 29.1 Exceeded
2. CS SME new-to-export effectiveness (percent)(number of SME new-to-export firms CS assisted to achieve export success divided by total change in SME exporters nationwide based on most recent Census data)
12.74 2.28 Not Met
3. CS SME new-to-market effectiveness (percent)(number of SME new-to-market firms CS assisted to achieve export success divided by number of SME firms exporting to two to nine markets as reported in most recent Census data)
3.92 3.11 Not Met
4. Number of commercial diplomacy successes 166 112 Not Met
5. Increase in percent of SME firms that export (increase in annual growth rate of SME exporters as determined from Census data)
2.80 6.42 Exceeded
6. Percentage of advocacy bids won (number of advocacy wins divided by CS average annual advocacy caseload)
17 9 Not Met
Source: Commerce.
Changes in Fiscal Year 2012 Performance Measures Reflect NEI Goal of Doubling Exports within 5 Years
For fiscal year 2012, CS reconfigured its 2010 GPRA measures, reducing the total from six to five by eliminating two measures and adding one. In addition to dropping the growth rate of SME exporters as determined by Census data, CS dropped its sole measure related to tracking new-to-export firms, as the organization shifted its focus to new-to-market firms. CS also eliminated reliance on Census data for the 2012 measure related to new-to-market firms and modified two other measures from 2010. One retained measure remained unchanged—the number of commercial diplomacy cases resolved. Finally, CS added a performance measure it had previously only tracked for internal reporting purposes: the ratio of CS export value to CS costs. (See table 3 for a summary of changes to CS’s performance measures for 2012.)
Page 16 GAO-11-909 National Export Initiative

Table 3: Changes in CS Performance Measures, Fiscal Year 2010 versus 2012
2010 measures 2012 measures Difference
N/A Ratio of CS export value to CS costs
New in 2012
Number of commercial diplomacy successes
Number of commercial diplomacy successes
Unchanged
Percentage of advocacy bids won
Dollar value of U.S. export content in advocacy cases won
Modified (changed ratio of wins/cases to dollar value of cases won)
CS overall effectiveness Number of clients assisted by CS
Modified (changed from percentage of active clients CS helped to achieve an export success)
CS SME new-to-market effectiveness
Annual number of SMEs CS assists in exporting to a second or additional country
Modified (left out Census data as basis for comparison in calculating a percentage)
CS SME new-to-export effectiveness
N/A Eliminated
Increase in percentage of SME firms that export
N/A Eliminated
N/A = Not applicable Source: Commerce
NEI’s overarching goal is to double the total value of U.S. exports in 5 years. The baseline against which the NEI’s success is being measured is $1.57 trillion, which was the level of goods and services exported by U.S. companies in 2009; the NEI goal is to reach $3.14 trillion in U.S. exports by the end of 2014. In February 2011, the Secretary of Commerce reported that exports in 2010 had increased 16.6 percent over 2009 levels, putting the U.S. on track to achieve the NEI’s goal. CS export promotion activities alone cannot achieve the NEI goal of doubling U.S. exports by the end of 2014. In 2010 CS export promotion activities (which do not include agriculture or export financing) resulted in $18.7 billion in export value. However, this represents about 1 percent of the $1.8 trillion in U.S. exports that year. Advocacy activities in which CS participated resulted in $17.1 billion in export value or about another 1 percent of U.S. exports.21 Commercial diplomacy contributes another $4.6 billion in
21Commerce officials told us that CS staff at multilateral development banks also facilitated an additional $2.6 million in advocacy-related wins.
Page 17 GAO-11-909 National Export Initiative

exports.22 Other CS statistics show that they support about 18,000 clients annually, which is about 7 percent of the approximately 276,000 firms that export, and about 1 percent of the approximately 27.5 million businesses in the United States.
Compared with its 2010 performance measures, CS’s 2012 measures shift its emphasis in two ways that are consistent with the overarching NEI goal of doubling the total value of U.S. exports: First, the 2012 measures put new focus on the dollar value generated by CS’s export promotion activities and on helping firms already exporting to expand to new markets rather than on helping new-to-export clients. Second, by tracking the number of clients assisted, CS reported that it will capture data reflecting its total export counseling and assistance efforts. These counseling and assistance efforts are a significant CS activity, but they may not produce an immediate export success or have a dollar amount attributed to them, though they often lead to CS-assisted export successes. (See table 4 for CS’s 2012 performance measures with targets.)
Table 4: CS Fiscal Year 2012 Performance Measures and Targets
Performance measure Target
1. Ratio of CS export value to CS costsa $140
2. Number of commercial diplomacy successesb 152
3. Dollar value of U.S. export content in advocacy cases wonc $19 billion
4. Number of clients assisted by CSc 20,709
5. Annual number of SMEs CS assists in exporting to a second or additional countryc
3,307
Source: International Trade Administration.
aThis is a new GPRA measure for CS in fiscal year 2012; previously, it was tracked internally as a measure but was not included in GPRA-required reports. bThis measure was left unchanged from CS’s 2010 performance measures. cThese measures were modified from CS’s 2010 performance measures. See table 3.
In giving greater emphasis to the dollar value of export sales attributable to its assistance, CS’s new measures may motivate staff to prioritize activities that are more likely to produce significant dollar value of exports.
22Commerce officials reported that these three activities resulted in a total export value of $34.8 billion, after correcting for double counting.
Page 18 GAO-11-909 National Export Initiative

Two of CS’s fiscal year 2012 measures are based on dollar values, whereas none of its six measures for fiscal year 2010 reflected dollar values. In addition, we believe the fiscal year 2012 measures may lessen CS’s emphasis on helping SMEs. Whereas three out of six of CS’s fiscal year 2010 measures focused primarily on helping SMEs, which is one piece of CS’s broad statutory mission, only one of CS’s five measures for fiscal year 2012 focuses on SMEs. Moreover, because advocacy and the activities of large firms generate a much higher dollar value of exports than export promotion activities of SMEs, the focus on export value also means less focus on SMEs. For example, in fiscal year 2010, CS data indicate that 50 advocacy wins generated $17.1 billion in exports and 86 percent of the wins were for large companies. Additionally, of the approximately 12,300 export successes that generated $18.7 billion in exports in 2010, about 88 percent of the overall dollar value of those successes was for large companies.
The new emphasis in CS’s fiscal year 2012 performance measures necessitates that CS obtain the dollar value of the export successes that it claims. While seeking this information is not new for CS, previously it was not used to measure the organization’s performance. The accuracy of this information thus takes on greater importance because it is now being used as a performance measure and helps measure CS’s contribution toward the NEI’s goal of doubling the value of U.S. exports.
Performance Measures for Fiscal Year 2012 Partially Address Some Weaknesses
CS has implemented key elements of good performance management systems, including defining measures that reflect its goals, ensuring the accuracy of the data used in its performance reporting, and refining or changing performance measures in response to recognized weaknesses with them or because of changing priorities. For example, export successes, a fundamental measure of CS’s performance, go through a multistage internal review process: Initial reviews are conducted in the domestic and international offices, respectively, and CS headquarters conducts a second review of all export successes over $500,000 in value on a quarterly basis. This process aims to ensure that each reported case meets CS’s criteria for “success.” CS management also recognizes the importance of communication as an important element of performance management, which it demonstrates by communicating its goals to staff and setting performance expectations in support of those goals.
While CS’s performance management system exhibits important elements of a good system, we also found that CS’s fiscal year 2010 performance measures exhibit three weaknesses: (1) the use of outdated
Page 19 GAO-11-909 National Export Initiative

Census data, (2) the underreporting of export successes, and (3) the lack of a performance measure tied to governmentwide customer service standards. Below, we describe these weaknesses and the steps CS has taken to address the first two, while also identifying the weaknesses that remain in CS’s modified performance measures for fiscal year 2012.
Three of its fiscal year 2010 measures tied CS’s success at meeting performance targets to volatile national economic trends, as measured by Census data. (See measures 2, 3, and 5 in table 2.) According to CS documents, the 2-year lag in available Census data caused the affected measures to systematically understate CS’s fulfillment of its mission and its contribution to the U.S. government’s export promotion agenda. CS’s fiscal year 2012 performance measures eliminate this weakness; the fiscal year 2012 measures do not use Census data from prior years for comparison but rather rely solely on performance information generated within CS.
Outdated Census Data to Compute Performance Measures: Addressed
Four of CS’s fiscal year 2010 measures were calculated using export success data (see measures 1 to 4 in table 2). CS acknowledged that export successes were underreported to some extent. Underreporting occurred at least in part because of the difficulty of getting clients to provide CS information on their sales. Additionally, technical problems associated with Commerce’s client tracking system made inputting export successes cumbersome and time consuming; as a result, some CS staff stated that they input only the minimum number of successes needed to meet their performance goals. Some CS staff also told us that, in an effort to balance administrative and client responsibilities, they did not always follow up with exporters to capture all export successes.
Underreporting of Export Successes: Partially Addressed
CS has taken steps to address the underreporting of export successes and problems with its client tracking system that it hopes will make capturing this information easier. In May 2011, CS finalized new export success policy guidelines that simplify export success reporting by eliminating the requirement for a staff-written narrative and replacing it with verification from the U.S. client or foreign buyer to document the success. Doing so puts the responsibility on the clients to confirm the assistance and value that CS provides. CS also created a standardized reporting format to capture the relevant export success information. In response to identified weaknesses with its client tracking system, the International Trade Administration reported it plans to address identified problems with the system, although it has not begun this effort. These steps alone, however, do not eliminate the potential for underreporting of
Page 20 GAO-11-909 National Export Initiative

the dollar value of export successes, which assumes new importance in CS’s fiscal year 2012 performance measures.
CS has also taken steps to prompt clients to provide sales information from export successes. Historically, CS has had difficulty obtaining the dollar value of all export successes, although clients agree to provide this information when signing a purchase agreement for a CS service. Collecting this information is wholly dependent on a client’s willingness to provide such information. At several of the posts we visited, CS staff told us that some companies are reluctant to provide the dollar value of export successes, considering that information to be proprietary. To overcome the reluctance of companies to provide the dollar value of CS-assisted exports, CS developed a new client intake form, which it began using in April 2011. The form, like the purchase agreement, contains a statement indicating that CS “expects” clients to report export sales related to CS assistance. While this may improve the situation because the statement is up-front and explicit, the problem may persist for several reasons. First, this statement on the intake form is not a binding requirement. Second, CS data indicate approximately 34 percent of CS’s export successes from 2008 through 2010 had no dollar value; nearly 25 percent of these export successes were attributed solely to counseling, for which CS does not collect a fee. Thus, the clients receiving counseling would not see or sign the new intake form. And third, although clients obtaining fee-based services from CS sign a purchase agreement, which includes a clause about reporting export results or feedback, many companies have not complied with the requirement, and CS has not strictly enforced it as businesses are sensitive about disclosing such information. Therefore, it is unclear that the new effort to collect this information will produce any change, and the problem of underreporting the value of CS’s export assistance through fee-based services may remain.
None of CS’s fiscal year 2010 GPRA performance measures reflected governmentwide management priorities, such as quality, timeliness, cost of service, and customer and employee satisfaction. Internally, CS tracks survey data from its customers regarding their satisfaction with its fee-for-service and counseling activities. For example, CS’s annual customer satisfaction survey in 2009 and 2010 indicated that 84 percent and 82 percent of respondents, respectively, were very satisfied or satisfied with the service they received from CS, although the response rates to its surveys were low—10 percent and 19 percent, respectively. CS reported this information in its annual report for 2010; however, it omitted the margin of error and confidence level along with the low response rate, potentially misleading readers of its report about clients’ level of
Reporting on Customer Service Satisfaction: Partially Addressed
Page 21 GAO-11-909 National Export Initiative

satisfaction with CS services. One of CS’s new measures for fiscal year 2012 includes a cost component—reporting the ratio of export value to costs of export promotion efforts, which creates a cost-versus-benefit measure. If the measure reported a ratio of number of services relative to costs, it would be an efficiency measure reflecting total cost of service.23
Recently, both Congress and the President have made customer service a governmentwide priority. The GPRA Modernization Act of 2010, which became effective in January 2011 and is being fully implemented starting in fiscal year 2012, requires that agencies establish a balanced set of performance indicators including, as appropriate, customer service standards.24 On April 27, 2011, the President directed agencies of the U.S. government to put more emphasis on streamlining service delivery and improving customer service.25 Among other requirements, the executive order directs agencies to set clear customer service standards and expectations, including, where appropriate, performance goals for customer service required by the GPRA Modernization Act of 2010. CS is aware of this new requirement, although its 2012 GPRA performance measures currently do not include a metric addressing the requirement.
23With regard to cost of service, we made recommendations to CS in 2009 to improve its cost accounting for its export promotion services. See GAO, Export Promotion: Commerce Needs Better Information to Evaluate Its Fee-Based Programs and Customers, GAO-09-144 (Washington, D.C.: Mar. 4, 2009).
24Pub. L. No. 111-352, § 3.
25Exec. Order No. 13571, 76 Fed. Reg. 24339 (Apr. 27, 2011).
Page 22 GAO-11-909 National Export Initiative

Systematic use of economic, performance, and activity data can help CS allocate resources to achieve its goals more efficiently and effectively. In general, optimal resource allocation requires that managers monitor the economic environment, operational costs, and performance to identify strategic advantages that can be gained by realigning resources.26 In keeping with good management practices when making resource allocation decisions, CS is using a data-driven process to prioritize foreign markets (and domestic locations) and to help it allocate its staff and other resources to meet its performance goals and to support NEI objectives. CS is in the process of adjusting to staff levels that are significantly smaller than in 2004 and addressing resource management challenges. Our analysis of the quantitative parts of the process found that there may be opportunities to reallocate overseas resources to better reflect NEI priorities and better achieve CS’s new performance goals. Furthermore, important available data related to some CS performance goals and activities are not systematically considered in the current process.
Commercial Service’s Resource Allocation Process Does Not Make Full Use of Relevant Information to Guide Its Decisions
CS Has a Data-Driven Process to Inform Its Resource Allocation Decisions
In making resource allocation decisions, CS management considers a combination of quantitative and qualitative factors to determine the number and type of staff at overseas posts and domestic offices. In response to our previous report, CS is updating and reinstituting a data-driven process that it last used in fiscal year 2007.27 CS management does not have a formal process for analyzing how CS staff should be allocated between the overseas, domestic, and headquarters locations. The overall needs of the organization are assessed as part of general workforce planning, which is undergoing changes in response to our recommendations in 2010. CS management has reviewed the budget and activities of its headquarters units as part of its ongoing efforts to improve operations. About 70 percent of CS staff is located overseas, about 17 percent is in domestic field offices, and about 12 percent is at headquarters in Washington, D.C.
26GAO, Executive Guide: Effectively Implementing the Government Performance and Results Act, GGD-96-118 (Washington, D.C.: June 1, 1996).
27GAO, Export Promotion: Increases in Commercial Service Workforce Should Be Better Planned, GAO-10-874 (Washington, D.C.: Aug. 31, 2010).
Page 23 GAO-11-909 National Export Initiative

With regard to overseas field staff, CS starts with its existing allocation of more than 900 staff across the more than 75 countries and then goes through a three-step process to adjust the allocation of staff depending on available resources. CS managers first consider an Overseas Resource Allocation Model that assesses market potential; the model ranks countries and is the starting point for CS management prioritizing which staff and posts should get more resources and which ones could be cut. Second, CS managers then consider a cost-benefit model that also produces rankings to ascertain how posts compare in terms of relative expense and productivity. Third, CS management additionally evaluates qualitative factors such as foreign and trade policy priorities in making adjustments to the models’ strictly quantitative rankings. CS managers use their professional judgment in balancing the results of the three-step process, arriving at a final proposal that is sent to the management of the International Trade Administration. It is not clear how managers balance the market potential and cost-benefit rankings; however, our discussions with a high-ranking CS official indicated that cost-benefit rankings were given less weight. All decisions to hire new staff and where to place them are reviewed by the International Trade Administration. Proposals to open and close posts are reviewed by the International Trade Administration and at the department level and then by the Office of Management and Budget, as part of the annual appropriation process. Furthermore, changes in the number of CS officers or locally engaged staff at a post must be approved by the Chief of Mission to a foreign country, who has responsibilities for managing and supporting U.S. government personnel overseas.
Overseas Resource Allocation Process
Overseas model. The Overseas Resource Allocation Model includes factors associated with market structure and size. Market structure captures the impact of variables representing such factors as the openness of a market, the level of development and country risk, and other factors that measure the level of difficulty that U.S. businesses may have in marketing their goods and services. The more open a country’s market structure, the higher its ranking and the more likely it is to get resources. Market size relates to the scale of export opportunity for U.S. firms related to a particular country and includes such measures as a country’s total imports, gross domestic product, and investment flows. Larger markets are generally ranked higher. In general, CS’s model is weighted 60 percent toward market structure and 40 percent toward market size. While most of the model’s 20
Page 24 GAO-11-909 National Export Initiative

variables are based on historical trade data, a few are based on projections, including estimates of future imports by a trading partner.28 A score for each country is computed based on a percentage of the total market potential, and the countries are ranked accordingly. (See app. V for the average annual U.S. exports to partner countries for calendar years 2008 through 2010, by country groupings.)
We analyzed the degree to which the overseas model’s export potential scores were generally consistent with NEI priorities. While the NEI gives highest priority to high-growth and next-tier emerging markets, the outcome of the fiscal year 2011 Overseas Resource Allocation Model showed that traditional markets—the European Union 15 and Japan,29 and free trade agreement (FTA) countries—still represent high export potential for U.S. companies (see fig. 3); this can be seen in terms of average country scores (1.39 and 0.84, respectively) and in the combined shares of the traditional market groups (35 percent in the pie chart in fig. 3). It also showed that on average the next-tier emerging markets have a lower market potential score (0.67), and thus may require a longer-term outlook and would contribute less toward short-term goals like doubling U.S. exports by 2014. All “other” countries ranked in the model also had low average scores, though as a grouping they account for a large share of the total (54 percent) because of the large number of countries in the group. The overlapping ranges of individual country scores show that the market potential within many groupings varies significantly.
28The fiscal year 2011 model mainly uses trade data from 2005 through 2008.
29The European Union members included in this group are Austria, Belgium, Denmark, Finland, France, Germany, Greece, Ireland, Italy, Netherlands, Portugal, Spain, Sweden, and the United Kingdom. Luxembourg is also a member but is not included in our analysis.
Page 25 GAO-11-909 National Export Initiative

Figure 3: Fiscal Year 2011 Market Potential Scores by Market Group
Source: GAO analysis of Department of Commerce data.
0.0
0.5
1.0
1.5
2.0
2.5
3.0
High-growth markets
(4 countries)
Next-tier emerging markets
(6 countries)
Free Trade Agreement
partners(17 countries)
EU15 and Japan
(15 countries)
Other CS posts
(39 countries)
Other State Department partnership
posts (41 countries)
Markets without CS or State Department partnership
posts (13 countries)
Average
NEI priority Traditional Other
High-growth
NEI priority
Traditional
Next-tier emerging
Free Trade Agreement partners
EU15 and Japan
No CS or State
partnership
Other State Department partnership
Other CS posts
7 4
14
2127
21
6
Percentage score
100.0
Share of total
Export market group
Other
1.68
0.670.84
1.39
0.690.51
0.48
• High-growth and EU15 and Japan have highest average market potential
• Significant overlap in range of High-growth and Traditional markets shows similar export potential
• Traditional markets comprise a much larger share than NEI priority
• Cumulative potential score of Other 93 markets is largest share
Note: Number of countries in each export market group indicates the number for which CS scored in its model.
Page 26 GAO-11-909 National Export Initiative

Cost-benefit model. CS’s cost-benefit model seeks to measure the cost effectiveness of posts in the more than 75 countries where CS operates. In contrast to the Overseas Resource Allocation Model, which seeks to establish market potential, this model seeks to capture actual CS results. A cost-benefit score is calculated using a weighted measure based on the number and value of export successes in each country, as well as the cost of operating in that country over a 5-year period. Costs of CS posts, which include operational and administrative costs such as salaries, rents, and utilities, can vary considerably by country. The benefit component of the model gives four times more weight to the number of export successes than to their dollar value because not every export success has a dollar value associated with it. CS management uses the cost-benefit model’s rankings to ascertain how posts compare in terms of relative expense and productivity.
We analyzed the cost-benefit scores used by CS in fiscal years 2006-2009. Next-tier emerging markets have better (higher) cost-benefit scores on average (1.93) when compared with other groups (see fig. 4). Average scores for the other country groupings are lower, and there is a wide range of scores for the 37 other CS posts, with the United Arab Emirates ranking highest in the group (9.44 percent) and Libya lowest (0.13 percent). We also looked at costs and benefits separately. The average number of export successes in high-growth countries reported by CS (485 successes) was at least twice as large as the average for any other market group, but there was also a wide range among countries in several of the groups (see fig. 5). The share of total export successes (26 percent) was lowest for NEI priority (high-growth and next-tier) markets and highest for traditional markets (38 percent). We discuss costs later in this report.
Page 27 GAO-11-909 National Export Initiative

Figure 4: Cost-Benefit Scores by Market Group, Annual Average, Fiscal Years 2006-2009
Source: GAO analysis of Department of Commerce data.
0
1
2
3
4
5
6
7
8
9
10
• Next-tier emerging markets have highest average cost-benefit scores
• EU15 and Japan have the lowest average cost-benefit scores
• Some countries in Other CS markets have very high cost-benefit scores
High-growth markets
(4 countries)
Next-tier emerging markets
(6 countries)
Free Trade Agreement
partners(14 countries)
EU15 and Japan
(15 countries)
Other CS posts
(37 countries)
AverageNEI priority Traditional Other
Percentage (higher is better)
Export market group
1.14
1.93
1.090.67
1.58
100.0
Note: Number of countries in each export market group indicates the number for which CS scored in its model.
Page 28 GAO-11-909 National Export Initiative

Figure 5: Number of Export Successes by Market Group, Annual Average, Fiscal Years 2008-2010
0
100
200
300
400
500
600
700
800
900
High-growth markets
(4 countries)
Next-tier emerging markets
(6 countries)
Free Trade Agreement
partners(17 countries)
EU15 and Japan
(15 countries)
Other CS posts
(39 countries)
Other State Department partnership
posts (41 countries)
Markets without CS or State Department partnership
posts (13 countries)
AverageNEI priority Traditional Other
Source: GAO analysis of Department of Commerce data.
Number
Export market group
6 4
485
195147 148
107
High-growth
NEI priority
Traditional
Next-tier emerging
Free Trade Agreement partners
EU15 and Japan
Other State Department partnership
Other CS posts
16%
10%
20%18%
34%
2%Share of total
Other
• High-growth markets produce at least twice as many export successes on average as any other group
• Other markets produce the lowest number of export successes on average, but the range among individual countries is great
• The share of export successes was lowest for NEI priority markets
Note: Number of countries in each export market group indicates the number for which CS had data.
Page 29 GAO-11-909 National Export Initiative

Qualitative factors (overseas). CS considers various qualitative factors, including foreign policy and trade policy priorities, level of economic development, geographic coverage, and commercial environment. For example, CS opened an office in Afghanistan in 2010 in order to help support U.S. foreign policy efforts to develop the local economy.
CS managers go through a similar process for allocating over 280 staff among 108 domestic offices in all 50 states except Delaware and Wyoming. Puerto Rico, a U.S. territory, is also included as a domestic location. A quantitative domestic model ranks locations to identify those with the highest export potential. CS then considers qualitative factors. While the model takes into account export successes (a measure of benefit), there is no similar consideration of costs in the domestic resource allocation process.
Domestic Resource Allocation Process
Domestic model. The Domestic Resource Allocation Model uses a mix of quantitative factors to rank the U.S. metropolitan statistical areas (MSA)30 based on the export potential of the small and medium-sized businesses located in each area. The model relies primarily on an export intensiveness factor calculated for each of industry sectors based on each industry’s level of exporting activwith greater weight given to industries with higher levels of exporting. Two other variables are also used in the model—the SME percent growth indicator and SME absolute growth indicator, both of which are based on forecasted data at the MSA level. The model then uses Census Bureau county-level data on small and medium-sized businesses—including both manufacturing and services, as well as exporters and nonexporters—and applies export intensiveness to the industry groups within each MSA. The MSAs are then ranked by the resulting weighted SME c
60 ity,
factors
ount.
Qualitative factors (domestic). CS considers policy priorities, whether a location is a hub for international business activity, availability of alternative services, and whether a location encompasses an industry that the International Trade Administration or the administration has identified as a priority. In some cases, these qualitative factors lead
30Metropolitan statistical areas are geographic entities defined by the U.S. Office of Management and Budget for use by Federal statistical agencies in collecting, tabulating, and publishing Federal statistics.
Page 30 GAO-11-909 National Export Initiative

CS to change how resources would be allocated based strictly on the quantitative results of the Domestic Resource Allocation Model.
CS Is Still Responding to Resource Management Challenges
Given the current budget pressures of the federal government, CS management faces tough decisions about how best to allocate existing resources. We previously reported that CS had management control weaknesses with regard to its resources from 2004 to 2009. During that period, CS’s budgets remained essentially flat while per capita personnel costs and administrative costs increased. CS’s workforce declined almost 14 percent through attrition, and, in response to the “crisis” situation, hiring, travel, training, and supplies were frozen, compromising CS’s ability to conduct its core business.31 Requested funding increases never materialized, and CS has not been able to rebuild its workforce as it had planned.
As a result, CS’s current distribution of overseas resources in fiscal year 2010 largely reflects this attrition and its 2007 Transformational Commercial Diplomacy initiative, which emphasized emerging markets. The focus under Transformational Commercial Diplomacy was to move resources from well-developed markets to high-growth markets such as Brazil, China, and India that would be increasingly important to future opportunities for U.S. business. Under the initiative, 23 offices, mainly in Europe, were closed, but the overall size of CS remained the same as it shifted resources to emerging markets. CS’s constrained resources limited its ability to continue moving staff. However, in an effort to support the NEI, CS moved 15 staff from headquarters to domestic offices. Though CS also hired 17 new Foreign Service officers in 2010, it has not been able to fully staff all of its posts even in high-priority countries. For example, CS China had a 27 percent vacancy rate in 2010. CS received its fiscal year 2011 funding in April, and officials were considering what reallocations could be made before the end of the fiscal year. CS is also considering whether it could sustain a presence in more than 75 countries given its level of resources. CS’s fiscal year 2012 funding is still under consideration in Congress. A senior CS official told us they plan to have
31GAO-10-874.
Page 31 GAO-11-909 National Export Initiative

its repositioning strategy implemented in fiscal year 2012 and its new structure in place in fiscal year 2013.32
CS's distribution of staff shows that a significant proportion of its staff resources go to countries that are not NEI priority countries; currently, about one-third of CS's overseas staff is in NEI priority countries, a little over a third is in traditional markets, and one-third is in “other” countries (see pie chart in fig. 6). High-growth markets have the most average staff per country (41). We found that the current distribution of CS staff closely mirrors key indicators of market size—U.S. exports to a trading partner and total imports by the trading partner. As noted, the Overseas Resource Allocation Model gives greater weight to market structure variables, and therefore, CS decisions to shift resources in the future may favor countries with higher market structure rankings.
32While CS generates plans and proposals, the Office of the Under Secretary of Commerce for International Trade reviews and approves resource allocation decisions.
Page 32 GAO-11-909 National Export Initiative

Figure 6: Total CS Staff by Market Group, Annual Average, Fiscal Years 2008-2010
Source: GAO analysis of Department of Commerce data.
0
10
20
30
40
50
60
70
80
90
100
High-growth markets
(4 countries)
Next-tier emerging markets
(6 countries)
Free Trade Agreement
partners(17 countries)
EU15 and Japan
(15 countries)
Other CS posts
(39 countries)
Average
NEI priority Traditional Other
Number
Export market group
41
138
106
High-growthNEI priority
Traditional
Next-tier emerging
Free Trade Agreement partners
EU15 and Japan
Other CS posts
21%
10%
20% 17%
32%
Share of total
Other
• High-growth markets have the most CS staff on average
• Total CS staff are more or less evenly split between NEI priority, Traditional markets, and Other
Note: Number of countries in each export market group includes those without CS staff. Such countries were given a zero value.
Page 33 GAO-11-909 National Export Initiative
CS’s resources include more than staff, though they are the biggest component of the CS budget, and human capital costs vary by location. Thus, we also reviewed the distribution of CS’s overseas funding and found that it follows a different pattern from staffing. High-growth markets get the largest average budgets ($3.2 million). Almost half of total CS post funding goes to traditional markets, and less than one-third goes to NEI priority markets (see pie chart in fig. 7). The upper ranges of traditional export markets show that some of these countries have relatively high costs. These results suggest that CS management may need to give more consideration to what proportion of their staff and funding should be allocated to NEI priority countries and traditional markets versus other CS countries.
Page 34 GAO-11-909 National Export Initiative

Figure 7: Total CS Budget by Market Group, Annual Average, Fiscal Years 2008-2010
Source: GAO analysis of Department of Commerce data.
0
1
2
3
4
5
6
High-growth markets
(4 countries)
Next-tier emerging markets
(6 countries)
Free Trade Agreement
partners(17 countries)
EU15 and Japan
(15 countries)
Other CS posts
(39 countries)
AverageNEI priority Traditional Other
Dollars in millions
Export market group
3.2
1.0
0.6
1.5
0.4
High-growth
NEI priority
Traditional
Next-tier emerging
Free Trade Agreement partners
EU15 and Japan
Other CS posts
19%
9%
33% 15%
25%
Share of total
Other
• High-growth markets had the highest average budgets
• 48% of CS’s budget went to Traditional markets, which was the largest share
• 28% of CS’s budget went to NEI priority markets
Note: Number of countries in each export market group includes those without a CS budget. Such countries were given a zero value.
Page 35 GAO-11-909 National Export Initiative

Additional Data Are Available to Improve Resource Allocation Decisions
We found that CS’s resource allocation decision making could be enhanced by including three types of relevant information. First, refined and simplified data variables could be added to the Overseas Resource Allocation Model to differentiate more sharply among countries when ranking countries by U.S. export promotion potential. Second, data on commercial diplomacy successes and advocacy wins would add relevant information when considering costs and benefits at various posts; these benefits are not systematically considered in resource allocation decision making, even though they are integrated into CS objectives and performance measures. And third, to enable managers to assess relative workloads and efficiency in making resource allocation decisions and calculating costs, CS could include data on activities that consume considerable staff time and resources, including fee-for-service sales, trade-counseling sessions, requests for advocacy and commercial diplomacy, and other support functions such as organizing and hosting visits by delegations to overseas posts and domestic locations.
CS uses its Overseas Resource Allocation Model to reflect the potential of export markets, which it considers in conjunction with the historical information on the performance of each overseas post in the cost-benefit model. We assessed the fiscal year 2011 Overseas Resource Allocation Model and found that the rankings generated by the model closely approximated the rankings obtained using only the historical imports variable for each country. The overseas model as currently constructed includes 5 of 20 variables that are designed to incorporate projections of future conditions, but these variables comprise only 25 percent of the market potential score in the model. In addition, these 5 variables only project a maximum of 3 years into the future. While projections and indicators of the future economic performance of countries necessarily involve uncertainty, the Overseas Resource Allocation Model, though designed to reflect export potential, currently gives greater weight to historical variables that have a high degree of overlap with the other historical inputs in the resource allocation process.
Refined Data Variables for the Overseas Resource Allocation Model to Capture Export Potential
In addition, the large number of variables also creates complexity without obvious benefits, as we found a significant statistical correlation (covariance) among the overseas model’s 20 variables, such as between U.S. market share, average fixed investment, average annual gross domestic product (GDP), and per capita GDP. Four variables were statistically insignificant regarding their individual impact on a country’s export-potential ranking. Furthermore, the current selection, number, and weighting of the variables result in a tight distribution of country scores. Over half the countries ranked by CS have scores of less than one-half a
Page 36 GAO-11-909 National Export Initiative

percent and are within one-quarter percent of each other’s scores. (See fig. 8.) CS management told us CS uses the model to help it differentiate the export potential of its overseas locations, especially those with lower rankings, but the current model provides limited differentiation of those countries where CS told us the model would be of most value.
Figure 8: Distribution of Individual Country CS Market Potential Scores, Fiscal Year 2011
0 20 40 60 80 100 120 1400.0
0.5
1.0
1.5
2.0
2.5
3.0
Countries
Scores between 0.58 and 0.33
Source: GAO analysis of Department of Commerce data.
Market potential score (percent)
About half of all countries ranked have scores within 0.25 of each other. The concentration of countries in this range makes it difficult to discriminate between these countries using just their market potential scores.
We found that CS does not systematically use available data on the number and value of commercial diplomacy successes or advocacy wins in considering costs and benefits at various posts. These are important benefits and are reflected in CS objectives and performance measures, but they are not systematically considered in CS’s resource allocation decision-making process. Only export successes are considered in measuring the benefits a CS country generated. In 2010, CS reported 112 commercial diplomacy successes valued at $4.6 billion in exports, approximately 50 advocacy wins valued at $17.1 billion, and 12,300 export successes valued at $18.7 billion. Because of their high dollar
Data on Commercial Diplomacy Successes and Advocacy Wins
Page 37 GAO-11-909 National Export Initiative

value relative to export successes, including commercial diplomacy successes and advocacy wins could have a large impact on CS management’s cost-benefit calculations and therefore potentially affect its decisions on allocating resources among posts and whether a post is worth the expense of operating it. High-growth markets showed the highest average number of commercial diplomacy successes per year (5), as shown in figure 9. However, though the average for the EU15 and Japan was lower (3), the range in that market group was large, and Japan had the highest number per year (18) of all countries.33 Nevertheless, the largest share of commercial diplomacy successes comes from the 39 “other” CS post countries (see the pie chart in fig. 9); for advocacy wins, however, next-tier emerging markets, on average, showed the largest dollar value of advocacy wins ($844 million), followed by high-growth and “other” CS countries (see fig. 10). While countries in the “other” categories might not be ranked highly in the Overseas Resource Allocation Model, they accounted for 55 percent of advocacy wins by country group over the same period. Thus, if advocacy wins are factored into resource allocation decision making, the importance and value of some “other” CS markets may increase.
33We present the number of commercial diplomacy successes because not all such successes are associated with dollar values.
Page 38 GAO-11-909 National Export Initiative

Figure 9: Number of Commercial Diplomacy Successes, Annual Average, Fiscal Years 2008-2010
Source: GAO analysis of Department of Commerce data.
0
5
10
15
20
High-growth markets
(4 countries)
Next-tier emerging markets
(6 countries)
Free Trade Agreement
partners(17 countries)
EU15 and Japan
(15 countries)
Other CS posts
(39 countries)
Average
NEI priority Traditional Other
Number
Export market group
5
3
12 2
High-growth
NEI priority
Traditional
Next-tier emerging
Free Trade Agreement partners
EU15 and Japan
Other CS posts
13%
10%
18%
15%
42%
Share of total
Other
• High-growth markets have the highest average of commercial diplomacy successes
• The largest share of Commercial Diplomacy Successes come from Other CS Posts
Note: Number of countries in each export market group includes those without commercial diplomacy successes. Such countries were given a zero value.
Page 39 GAO-11-909 National Export Initiative

Figure 10: Value of Advocacy Wins by Market Group, Annual Average, Fiscal Years 2008-2010
Source: GAO analysis of Department of Commerce data.
0
500
1,000
1,500
2,000
2,500
3,000
High-growth markets
(4 countries)
Next-tier emerging markets
(6 countries)
Free Trade Agreement
partners(17 countries)
EU15 and Japan
(15 countries)
Other CS posts
(39 countries)
Other State Department partnership
posts (41 countries)
Markets without CS or State Department partnership
posts (13 countries)
AverageNEI priority Traditional Other
High-growth
NEI priority
Traditional
Next-tier emerging
Free Trade Agreement partners
1% EU15 and Japan
No CS or State
partnership
Other State Department partnership
Other CS posts
7%
29%
8%32%
17%6%
Dollars in millions
Share of total
Export market group
Other
300
844
82 16145
75 82
• NEI priority markets had the highest value advocacy wins on average
• The range within Other CS and Other State Department partnership posts is very high
• Traditional markets have a small share of the total value of advocacy wins
Note: Number of countries in each export market group includes those without advocacy wins. Such countries were given a zero value.
Page 40 GAO-11-909 National Export Initiative

In making resource allocation decisions, CS does not systematically consider activity data, including data on fee-based services such as trade missions, trade-counseling sessions, requests for advocacy and commercial diplomacy, hosting official visits, and supporting other trade-related agencies. CS does not collect systematic information on how CS staff divide their time to carry out mission-critical activities. Such information would enable managers to assess relative workloads and efficiency in making resource allocation decisions and calculating program costs.34 This information could also be used to inform management decisions about setting performance targets, determining the best mix of staff (Foreign Service officers versus locally employed staff) at specific posts, prioritizing cost reductions, and deciding what fees should be charged for which services. For example, if CS determined that a post had a high need for services and little need for advocacy on behalf of U.S. companies, the post could be staffed with more locally employed personnel and fewer Foreign Service officers, thus reducing the cost of the office while maintaining, or improving, its productivity.35
Activity Data
Five examples follow to illustrate how activity data could help inform resource management decisions. First, CS’s fee-for-service data could be used to determine whether resources should be shifted to markets with growing demand, regardless of whether those markets are designated as NEI priorities. CS data we analyzed showed that about three-fourths of services are sold to non-NEI priority countries (see fig. 11). However, it is not clear whether these data reflect customer demand alone, or whether to some extent they also reflect demand resulting from customers who were redirected to countries where CS had available resources, when the customers’ initially requested country could not accommodate their request for assistance. Some staff in our field visits told us there are times they have to delay or turn away a request for services, like a Gold Key (introducing U.S. businesses to qualified buyers overseas), and that
34GAO-09-144.
35For example, the NEI highlights high-growth markets (Brazil, China, and India) and next-tier emerging markets (Colombia, Indonesia, Saudi Arabia, South Africa, Turkey, and Vietnam) as well suited to experienced exporters and advocacy work. In these markets, CS needs a higher proportion of Foreign Service officers to address demand for advocacy and other trade-related duties as well as visits by important delegations. However, we found that throughout CS’s overseas network, the ratio of Foreign Service officers to locally employed staff does not vary greatly between countries. In high-growth and next-tier emerging markets, the average ratio is 1 to 5; in all other countries where CS has posts, the average ratio is approximately 1 to 4.
Page 41 GAO-11-909 National Export Initiative

sometimes staff at a U.S. Export Assistance Center will then refer the exporter to another country where CS staff are not as busy. High-growth markets averaged 309 services sold per country, while the free trade agreement partners averaged about 101 and the EU15 and Japan averaged about 71 services sold per country (see fig. 11). However, when evaluating average sales per each country’s staff, free trade agreement countries (15 products sold per staff) are by far more productive than high-growth markets (see fig. 12), which have many more staff per post. Analyzing data on fee-for-service activities could help CS management understand these productivity differences and the capacity of particular posts to deliver certain services, and the analysis in turn could help CS determine where its limited resources should be focused to increase sales of fee-based services.
Page 42 GAO-11-909 National Export Initiative

Figure 11: Number of Export Promotion Fee-based Services Sold by Market Group, Annual Average, Fiscal Years 2008-2010
Source: GAO analysis of Department of Commerce data.
0
100
200
300
400
500
600
700
High-growth markets
(4 countries)
Next-tier emerging markets
(6 countries)
Free Trade Agreement
partners(17 countries)
EU15 and Japan
(15 countries)
Other CS posts
(39 countries)
Other State Department partnership
posts (41 countries)
Markets without CS or State Department partnership
posts (13 countries)
Average
NEI-priority Traditional Other
High-growthNEI priority
Traditional
Next-tier emerging
Free Trade Agreement partners
EU15 and Japan
Other State Department partnership
Other CS posts
17%
9%
14%23%
36%
1%
Number
Share of total
Export market group
Other
309
108
70
10171
1 0
• High-growth markets have the highest average sales
• The range of sales in Other CS posts is the largest
• 37% of CS services are sold outside NEI priority and Traditional markets
• Only 9% of CS services are sold to Next-tier emerging markets
Note: Number of countries in each export market group includes those without fee-for-service sales. Such countries were given a zero value.
Page 43 GAO-11-909 National Export Initiative
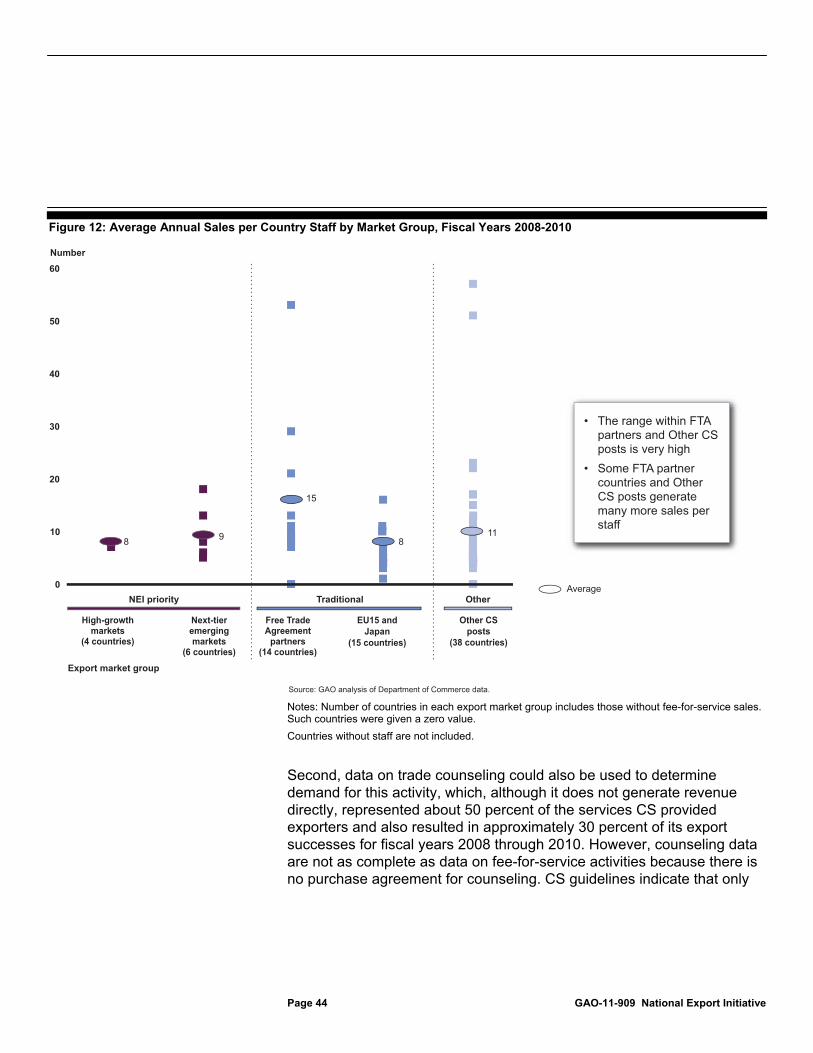
Figure 12: Average Annual Sales per Country Staff by Market Group, Fiscal Years 2008-2010
0
10
20
30
40
50
60
High-growth markets
(4 countries)
Next-tier emerging markets
(6 countries)
Free Trade Agreement
partners(14 countries)
EU15 and Japan
(15 countries)
Other CS posts
(38 countries)
AverageNEI priority Traditional Other
Number
Export market group
8 9
15
811
Source: GAO analysis of Department of Commerce data.
• The range within FTA partners and Other CS posts is very high
• Some FTA partner countries and Other CS posts generate many more sales per staff
Notes: Number of countries in each export market group includes those without fee-for-service sales. Such countries were given a zero value.
Countries without staff are not included.
Second, data on trade counseling could also be used to determine demand for this activity, which, although it does not generate revenue directly, represented about 50 percent of the services CS provided exporters and also resulted in approximately 30 percent of its export successes for fiscal years 2008 through 2010. However, counseling data are not as complete as data on fee-for-service activities because there is no purchase agreement for counseling. CS guidelines indicate that only
Page 44 GAO-11-909 National Export Initiative
value-added counseling must be tracked in CS’s client tracking system.36 Also, CS staff told us in interviews that they do not record all of their counseling sessions in the client tracking system because of difficulties with the system. CS therefore does not know the true demand for counseling or how much staff time is spent on this activity. A better understanding of the types of counseling provided and how much time and effort each type takes would enable CS to make more informed decisions about how staff should prioritize their time. It would also enable CS to evaluate the degree to which charging fees for counseling services could provide additional revenue to the organization. We found that fee-for-service income was very important to the operations of some of the overseas posts we visited. In order to help fund export promotion activities in the face of resource constraints, several senior CS officials told us they felt it necessary to make the selling of CS fee-based services a local performance target and tried to create incentives for their staff to sell such services.
Third, both fee-for-service and counseling data could be used to assess patterns of collaboration between domestic and international field offices through a network analysis.37 Such analysis would enable CS to identify key hubs that work with a broad array of offices in the global CS network and less central offices working with a narrower set of countries. Furthermore, it can be used to identify weak or missing collaboration between offices to better serve U.S. exporters. (See app. VI for an example based on our network analysis of these data.)
Fourth, commercial diplomacy and advocacy are significant activities, especially for Foreign Service officers, because these activities involve government-to-government discussions. For example, Advocacy Center officials stated that the center receives about 500-600 requests for assistance a year, of which they accept about 400 cases. While cases are
36CS defines value-added counseling as providing information that facilitates exports for U.S. companies and imports of U.S. products and services—for example, when CS staff personally assist a U.S. firm to identify and communicate with a business contact, or assist a non-U.S. company to identify and contact a U.S. suppler, or help either party execute the purchase of a good or service from the United States. CS deems activities such as providing a referral to a caller—for example, an address to a local bank—or other potential trade partner or contact as not providing a value-added service.
37Network analysis is a set of quantitative and graphical methods to identify the underlying patterns and structures in a complex set of relationships among many entities such as countries, organizations, or individuals.
Page 45 GAO-11-909 National Export Initiative

initiated in Washington, D.C., the majority of the work on the ground is led by Foreign Service officers at the post where the competition for the contract occurs, and it may take years before the pursued contract is awarded. Although requests from companies for commercial diplomacy and advocacy services are related to NEI priorities, CS data on these activities are not systematically considered when setting resource allocation priorities. CS officials told us that when they make staffing decisions, they consider workload factors such as demand for commercial diplomacy and advocacy in particular markets; however, their process for considering these activities is not systematic across all posts and is not documented.
Finally, some posts have significant responsibilities for supporting other agencies and important delegations. These important activities are counted in CS highlights—weekly reporting on noteworthy events or successes in a country or region—but are not systematically considered when determining resource needs.38 For fiscal years 2008 through 2010, CS overseas posts assisted with a total of 1,203 important delegations, and CS’s domestic offices supported 53 visits by foreign governments and 208 visits by U.S. officials during the same period.39 At several of the posts we visited, CS Foreign Service officers and locally employed staff described the demands that these visits place on their time. These supporting-role functions should be taken into account when allocating resources; moreover, data on staff time and effort should be analyzed to determine the extent to which these important but ancillary activities may detract from CS’s primary export promotion objectives.
The National Export Initiative lays out a comprehensive strategy for marshaling the nation’s export promotion resources with the goal of doubling the dollar value of U.S. exports by the end of 2014. The U.S. Foreign and Commercial Service (CS) is a critically important agent in executing the NEI strategy and six of its eight priorities. The NEI targets specific activities, such as advocacy and trade missions, that may require
Conclusions
38Events covered include visits by assistant secretaries and above, congressional and staff delegations, and upcoming trade events.
39The number of visits by U.S. officials to the domestic field was unusually high in 2008—a total of 142 visits—due to interest in supporting the free trade agreements with Colombia, Panama, and South Korea.
Page 46 GAO-11-909 National Export Initiative

changes in CS’s current structure, staffing, and activities and services. Trade-offs CS faces also have implications for how it allocates resources between (1) small and medium-sized enterprises versus large companies, (2) short-term export generation activities versus long-term market development efforts, (3) new-to-export companies versus experienced exporters, (4) traditional and FTA markets versus high-growth and next-tier emerging markets, and (5) services that yield high-dollar exports and reach multiple exporters versus customized services for single exporters.
CS’s revised set of performance measures for fiscal year 2012 gives greater emphasis to the dollar value of export sales attributable to its assistance, prioritizing activities that are more likely to produce significant dollar value of exports. Moreover, because advocacy and the activities of large firms generate a much higher dollar value of exports than the export promotion activities serving small and medium-sized enterprises, the new measures’ emphasis on export dollar value also is likely to shift the focus to efforts that contribute to doubling exports but may result in less focus on smaller firms. While our analysis shows that the fiscal year 2012 performance measures address some problems that we found with CS’s fiscal year 2010 measures, some issues remain—for example, underreporting of export successes, especially with regard to their dollar value. Taking further steps to address these issues is particularly important given this metric’s greater importance to the NEI. Additionally, though CS has a role that is inherently customer focused, CS’s survey to measure customer service satisfaction has a low response rate, making it difficult to accurately assess client satisfaction with its services, and customer service satisfaction is currently not a CS GPRA performance measure.
To maximize its value in this time of increasing pressure on government budgets, CS needs to ensure that its resource allocation decision makers take into account the most complete and accurate economic, performance, and activity data available. Currently, CS allocates its resources (about 1,400 employees and a budget of about $260 million) to more than 75 countries around the world based on various quantitative and qualitative factors, but we found that CS does not systematically consider certain important activities when calculating the export potential and cost-benefit ratios used to rank locations. CS plans to implement a repositioning strategy in fiscal year 2013. Financial constraints will require tough resource allocation decisions based on analyses of trade-offs that should include weighing the costs and benefits of operating in particular markets and taking steps to maximize income and eliminate high-cost/low-yield export promotion activities versus providing a wide range of
Page 47 GAO-11-909 National Export Initiative
affordable services to any exporter seeking assistance. Although CS has reinstituted its Overseas Resource Allocation Model, limitations with the model that we identified reduce its ability to reflect key changes in the global economic outlook and, therefore, in potential U.S. exports to various countries, thus reducing the model’s usefulness in helping CS make these difficult decisions. Additionally, CS needs to systematically incorporate relevant data such as advocacy wins and program activity data to better understand all of the benefits that its activities create and the full range of workload demands on its staff. Finally, such data can also inform other important management decisions such as setting priorities for particular posts and groups of posts, and identifying opportunities for increasing fee income or eliminating marginally productive export promotion services.
We recommend that the Secretary of Commerce direct the Under Secretary for International Trade and the Assistant Secretary for Trade Promotion to take the following five actions:
Recommendations for Executive Action
In order for policymakers to have accurate and complete information to make performance management and resource allocation decisions, take further steps to achieve greater cooperation by CS clients in reporting the dollar value of export successes.
To improve government services in keeping with the Government Performance and Results Modernization Act of 2010, take steps as appropriate to improve the CS customer-service survey response rate and include the measure in its GPRA-related reporting.
To improve program management and the information that CS resource allocation decisions are based upon,
review the Overseas Resource Allocation Model to determine whether the variables and structure best incorporate available indicators of potential U.S. exports,
include commercial diplomacy and advocacy data in evaluating cost-benefit ratios of CS locations, and
systematically include program activity data in making resource allocation decisions.
Page 48 GAO-11-909 National Export Initiative

Commerce provided written comments on a draft of this report. We have reprinted their comments in appendix VII. Commerce also provided technical comments and updated information, which we have incorporated throughout the report, as appropriate.
Agency Comments and Our Evaluation
In its written comments, Commerce welcomed and generally agreed with our overall findings and recommendations. Commence noted that CS has undertaken an initiative to better focus its strategic planning and alignment of its resources with its mission and the NEI and has improved its analytical tools and processes, which—as noted in our report—can be further enhanced. Commerce also stated that corrective actions begun during the course of our study would benefit from guidance provided by our recommendations, such as CS’s plan to incorporate customer-service data into its performance measures and its effort to increase cooperation from clients in reporting the dollar value of export successes.
As agreed with your offices, unless you publicly announce the contents of
this report earlier, we plan no further distribution until 30 days from the report date. At that time, we will send copies to other interested Members of Congress and to the Secretary of Commerce. In addition, the report will be available at no charge on the GAO Web site at http://www.gao.gov.
If you or your staff have any questions about this report, please contact me at (202) 512-4347 or [email protected]. Contact points for our offices of Congressional Relations and Public Affairs may be found on the last page of this report. GAO staff who made major contributions to this report
Loren Yager
are listed in appendix VIII.
Director, International Affairs and Trade
Page 49 GAO-11-909 National Export Initiative

Appendix I: Scope and Methodology
Page 50 GAO-11-909
Appendix I: Scope and Methodology
To determine the U.S. and Foreign Commercial Service (CS) export promotion role and the extent to which its goals and activities support the National Export Initiative (NEI) priorities, we reviewed CS’s statutory mission, CS services and activity information, and the Report to the President on the National Export Initiative.1 We also met with CS officials in Washington, D.C., who are responsible for managing CS and ensuring it has the necessary resources to meet its mission and support the NEI, as well as the International Trade Administration’s Deputy Under Secretary, Department of Commerce’s NEI Director, and the Director of the Trade Promotion Coordinating Committee. In addition, we met with officials from CS’s Advocacy Center and from Commerce’s Market Access and Compliance unit, as both contribute to CS’s success in meeting its goals and the goals of the NEI. To determine the types of services and activities CS undertook from 2008 through 2010, we analyzed CS fee-for-service activity and performance data for all of CS’s 125 offices in more than 75 countries and its 108 domestic offices for fiscal years 2008 through 2010, as well as data from the Advocacy Center for the same time period, to ascertain the size of companies that CS assists and the types of fee-for-service activities its clients purchase. Market Access and Compliance also provided data on the number of cases it initiated and successfully closed as well as the dollar value of those cases from 2008 through 2010. We also reviewed CS guidance related to capturing and verifying data on export successes, commercial diplomacy successes, and advocacy wins, as well as on documenting Market Access and Compliance and advocacy-related cases. We traveled to six overseas posts (Brazil, Chile, China, El Salvador, Thailand, and Vietnam) and interviewed CS commercial officers and locally employed staff who carry out CS’s mission. The posts we visited differed in staff size (small, medium, and large) and included posts considered to be key markets (Brazil and China) or designated as an NEI priority market (Vietnam). Information from the six posts is not generalizable but was used to understand how activity data are collected, input, and used at posts and in headquarters, as well as to identify potential problems with the data and to learn about data-audit procedures, topics also discussed in interviews with CS officials in Washington, D.C.
1Department of Commerce, Report to the President on the National Export Initiative: The Export Promotion Cabinet’s Plan for Doubling U.S. Exports in Five Years (Washington, D.C.: 2010).
National Export Initiative

Appendix I: Scope and Methodology
To determine if CS performance measures accurately reflect its activities and align with the NEI, we reviewed CS’s fiscal year 2010 performance measures and assessed its 2012 performance measures to see if they changed to align with the NEI. We also reviewed Commerce’s annual performance and accountability reports from 2008 through 2010. In addition, we reviewed Commerce’s congressional budget submissions for 2011 and 2012 to identify upcoming changes to CS’s performance measures. Additionally, we reviewed CS’s annual reports for fiscal year 2009 and 2010 to determine what performance measures CS reported publicly. We also reviewed data CS provided to us on performance measures it tracks for its own use but that are not reported in its annual performance and accountability reports. Since we had CS data on its activities, including export successes, commercial diplomacy successes, and advocacy wins, we attempted to verify the data CS reported and found some discrepancies. (See related discussion below on data reliability.) We also interviewed the CS officials responsible for developing and tracking CS’s performance measures to learn about the development of the 2010 and 2012 measures.
To determine the extent to which CS uses relevant data in allocating its resources to help achieve its strategic goals, we interviewed CS officials about its resource allocation process, including the use of the Overseas Resource Allocation Model, the cost-benefit model, and other qualitative factors CS considers when making resource allocation decisions. We also analyzed factors associated with market structure and size, and overall ranking of CS posts in the Overseas Resource Allocation Model and the degree to which the model’s export potential scores were consistent with NEI priorities. We also performed a statistical analysis of the model’s variables to evaluate the model’s ability as to reflect key changes in the economic outlook and, therefore, potential U.S. exports to various nations, and we assessed the fiscal year 2011 model’s ability to differentiate the export potential of overseas locations, especially those with lower ranking. In addition, we analyzed the cost-benefit scores used by CS in an attempt to show whether NEI priority markets have better (higher) cost-benefit scores on average when compared with other export market groups. We also looked at costs and benefits separately and analyzed the number of export successes and CS’s distribution of staff and funding among its posts. We reviewed how each variable contributes to the overall score and correlation among variables. We reviewed data on commercial diplomacy successes and advocacy wins that would add relevant information when considering costs and benefits at various posts, as well as factors that could enable managers to assess relative workloads and efficiency in making resource allocation decisions and calculating costs.
Page 51 GAO-11-909 National Export Initiative

Appendix I: Scope and Methodology
To assess the reliability of the data on CS activities (export and commercial diplomacy success), fees-for-service, official events, and advocacy wins data we (1) interviewed knowledgeable technical and management personnel at CS, (2) reviewed documentation related to these data sources such as manuals and other guidance, and (3) performed a variety of electronic data testing procedures to check for the internal consistency, completeness, and accuracy of the data.
Regarding the CS activities data (export success and commercial diplomacy success), we identified a number of limitations, particularly regarding potential incompleteness and inaccuracy in these data. In particular, not all export successes are entered by staff in to the CS data system and in some cases the dollar value of export successes is not entered.
Regarding CS’s commercial diplomacy success data, we also noted a considerable number of instances of missing data on the dollar totals of specific commercial diplomacy successes. We also found some discrepancies; for example, CS’s commercial diplomacy dollar value was sometimes reported as the value of assistance, which amounted to the total dollar value of the commercial diplomacy success, and sometimes as the export success value of the U.S. export. According to a CS official, guidance at the time allowed for such reporting. CS, however, now plans to report only the value of the U.S. exports resulting from commercial diplomacy successes. To assess the reliability of the CS staffing data, we confirmed there were no significant changes to the way the data were compiled by CS since we last requested, reviewed, and confirmed the reliability of the data in our previous report.
We determined that the CS data on activities (including fee-for-service activities), export and commercial diplomacy success, official events, and advocacy wins data were sufficiently reliable for the purposes of this engagement, in particular to provide information on overall levels of export and commercial diplomacy success, fees-for-service, advocacy wins, and official events counts and dollar totals, as well as to provide information on trends in these levels between 2008 and 2010. We also determined that the budget and staffing and performance data were sufficiently reliable for the purposes of this engagement. We conducted this performance audit from September 2010 to September 2011 in accordance with generally accepted government auditing standards. Those standards require that we plan and perform the audit to obtain sufficient, appropriate evidence to provide a reasonable basis for our findings and conclusions based on our audit objectives. We believe that the evidence obtained provides a reasonable basis for our findings and conclusions based on our audit objectives.
Page 52 GAO-11-909 National Export Initiative

Appendix II: Distribution of Domestic CS Staff in U.S. Export Assistance Centers by State, Fiscal Year 2010
State Number of U.S. export
assistance centers CS staff
California 14 46
Texas 8 20
New York 6 19
Ohio 4 14
Florida 6 13
Illinois 4 13
Michigan 4 11
North Carolina 3 11
Pennsylvania 3 11
Missouri 2 10
Arizona 3 8
New Jersey 2 8
Washington 2 8
Colorado 1 8
Maryland 1 8
Georgia 2 7
Virginia 2 7
Massachusetts 1 7
Minnesota 1 6
South Carolina 3 5
Tennessee 3 5
Louisiana 2 5
Oregon 1 5
Kentucky 2 4
Nevada 2 4
Oklahoma 2 4
Connecticut 1 4
Indiana 1 4
Alabama 1 3
Arkansas 1 3
Mississippi 1 3
Wisconsin 1 3
West Virginia 2 2
Iowa 1 2
New Hampshire 1 2
Appendix II: Distribution of Domestic CS Staff in U.S. Export Assistance Centers by State, Fiscal Year 2010
Page 53 GAO-11-909 National Export Initiative

Appendix II: Distribution of Domestic CS Staff in U.S. Export Assistance Centers by State, Fiscal Year 2010
State Number of U.S. export
assistance centers CS staff
Puerto Rico 1 2
Utah 1 2
Hawaii 1 1
Idaho 1 1
Kansas 1 1
Maine 1 1
Montana 1 1
Nebraska 1 1
New Mexico 1 1
North Dakota 1 1
Rhode Island 1 1
South Dakota 1 1
Vermont 1 1
Alaskaa 1 0
Delaware 0 0
Wyoming 0 0
Source: Commerce.
Note: Puerto Rico, a U.S. territory, is included as a domestic location. aAlaska is staffed by a contractor.
Page 54 GAO-11-909 National Export Initiative

Appendix III: Country Groupings and Allocation of Overseas CS Staff in Fiscal Year 2010
Export market group Partner group Partner CS officers
FY2010Locally employed
staff FY2010 2010 posts
NEI priority markets High-growth markets China 18 69 6 India 7 48 7 Brazil 6 36 6 Hong Kong 2 11 1 Next-tier emerging markets Vietnam 4 17 2 Saudi Arabia 5 15 3 Indonesia 1 14 1 South Africa 2 13 2 Turkey 3 9 3 Colombia 2 8 1Traditional markets Free trade agreement Mexico 7 37 4 Canada 3 15 5 Australia 2 10 2 Israel 2 10 2 Singapore 2 10 1 Chile 2 9 1 Dominican Republic 2 7 1 Peru 1 7 1 El Salvador 2 6 1 Costa Rica 1 5 1 Morocco 1 5 1 Guatemala 1 3 1 Honduras 0 3 1 Jordan 1 2 1 EU 15 + Japan Japan 9 28 4 Germany 3 24 4 Italy 3 16 3 France 3 14 1 United Kingdom 3 10 1 Belgium 5 10 2 Greece 2 7 1 Netherlands 1 6 1 Sweden 1 6 1 Portugal 1 5 1 Austria 1 4 1 Finland 1 4 1 Denmark 0 4 1 Ireland 1 3 1Other Other CS posts Russia 6 19 3 Taiwan 5 17 2 Korea 4 13 1
Appendix III: Country Groupings and Allocation of Overseas CS Staff in Fiscal Year 2010
Page 55 GAO-11-909 National Export Initiative

Appendix III: Country Groupings and Allocation of Overseas CS Staff in Fiscal Year 2010
Export market group Partner group Partner CS officers
FY2010Locally employed
staff FY2010 2010 posts
Philippines 2 14 1 Argentina 2 13 1 Thailand 2 13 1 Poland 2 12 1 Nigeria 2 10 1 Egypt 2 9 2 Malaysia 3 7 1 Kenya 1 8 1 Romania 1 7 1 Ukraine 1 7 1 Hungary 2 6 1 United Arab Emirates 2 6 2 Czech Republic 1 6 1 Kazakhstan 1 6 1 Kuwait 0 5 1 Bulgaria 1 4 1 Croatia 1 4 1 Ecuador 1 4 1 Panama 1 4 1 Norway 0 4 1 Qatar 1 3 1 Serbia 1 3 1 Slovak Republic 1 3 1 Switzerland 1 3 1 Pakistan 0 3 2 Ghana 1 2 1 Libya 1 2 1 Senegal 1 2 1 Iraq 2 1 2 Algeria 0 2 1 Lebanon 0 2 1 Afghanistan 1 1 1 New Zealand 0 1 1
Source: GAO analysis of Commerce data.
Page 56 GAO-11-909 National Export Initiative

A PartnershiSer
ppendix IV: Locations of State Departmentp Posts Providing Export Promotion
vices
Page 57 GAO-11-909
Appendix IV: Locations of State Department Partnership Posts Providing Export Promotion Services
Angola
BahrainBenin
Botswana
Burkina Faso
Cameroon
Democratic Republicof Congo
Côted’Ivoire
Ethiopia
Gabon
Gambia
Guinea
Lesotho
Swaziland
NamibiaMadagascar
ZambiaMalawiMozambique
Liberia
MaliOman
Mauritius
Uganda
TanzaniaRwanda
Sri Lanka
Tunisia
Bosnia & Herzegovina
Cyprus
Lithuania
MacedoniaMontenegro
Slovenia
LatviaEstonia
Fiji
Brunei
Mongolia
Iceland
Trinidad & Tobago
Jamaica
BarbadosNicaragua
Bahamas
State Department partnership post (45)
Commercial Service post (75+)
Sources: GAO analysis of Department of Commerce data; Map Resources (map).
Note: In September 2011, the Departments of Commerce and State agreed to expand the program to an additional 11 countries: Albania, Azerbaijan, Bangladesh, Belize, Cambodia, Georgia, Haiti, Malta, Paraguay, Turkmenistan, and Uzbekistan.
National Export Initiative

Appendix V: Country Groupings and U.S. Exports, Calendar Years 2008-2010
Dollars in millions
U.S. exports: 2008-2010
Export market group Partner group Partners Annual average Rank
NEI priorities High-growth markets China $144,111 3
Brazil 53,711 9
Hong Kong 33,483 16
India 31,573 17
Next-tier emerging markets Saudi Arabia 21,859 20
Colombia 20,202 22
Turkey 17,999 26
Indonesia 11,470 35
South Africa 10,429 37
Vietnam 6,112 45
Traditional markets Free trade agreement markets Canada 399,719 1
Mexico 245,617 2
Singapore 47,285 11
Australia 39,482 14
Chile 19,805 25
Israel 15,299 27
Dominican Republic 11,674 34
Peru 10,743 36
Costa Rica 9,439 39
Honduras 8,268 41
Guatemala 8,172 42
El Salvador 4,321 54
Morocco 3,309 61
Oman 2,341 68
Jordan 2,137 71
Nicaragua 1,758 74
Bahrain 1,741 75
EU 15 + Japan Japan 108,446 4
United Kingdom 89,915 5
Germany 89,703 6
Netherlands 64,682 7
France 50,109 10
Belgium 45,100 12
Italy 25,397 18
Appendix V: Country Groupings and U.S. Exports, Calendar Years 2008-2010
Page 58 GAO-11-909 National Export Initiative

Appendix V: Country Groupings and U.S. Exports, Calendar Years 2008-2010
U.S. exports: 2008-2010
Export market group Partner group Partners Annual average Rank
Spain $19,917 24
Ireland 13,630 29
Sweden 8,681 40
Austria 4,667 51
Finland 4,440 53
Denmark 4,195 55
Greece 3,539 60
Portugal 3,019 64
Other Other CS posts Korea (South) 64,526 8
Taiwan 42,625 13
Switzerland 35,703 15
United Arab Emirates 23,309 19
Malaysia 21,614 21
Venezuela 19,996 23
Thailand 15,228 28
Philippines 13,499 30
Russia 13,135 31
Argentina 11,946 32
Egypt 11,944 33
Panama 9,530 38
Ecuador 7,839 43
Nigeria 7,736 44
Poland 5,956 46
Norway 5,897 47
Qatar 5,478 49
New Zealand 4,758 50
Kuwait 4,522 52
Pakistan 3,550 58
Iraq 3,546 59
Lebanon 3,239 62
Ukraine 2,656 66
Afghanistan 2,649 67
Algeria 2,328 69
Czech Republic 2,199 70
Hungary 2,113 72
Romania 1,560 76
Page 59 GAO-11-909 National Export Initiative

Appendix V: Country Groupings and U.S. Exports, Calendar Years 2008-2010
U.S. exports: 2008-2010
Export market group Partner group Partners Annual average Rank
Ghana $1,506 77
Kazakhstan 1,495 78
Uruguay 1,464 79
Libya 1,310 80
Tunisia 1,029 83
Kenya 928 85
Slovak Republic 638 91
Croatia 624 92
Bulgaria 573 96
Senegal 345 105
Serbia 266 112
Other State Department partnership posts Bahamas 5,539 48
Trinidad and Tobago 3,874 56
Jamaica 3,645 57
Angola 3,093 63
Benin 1,122 81
Lithuania 1,071 82
Ethiopia 879 86
Barbados 784 87
Iceland 744 90
Latvia 616 93
Slovenia 551 97
Gabon 455 98
Mozambique 416 100
Cote d’Ivoire 404 101
Sri Lanka 380 102
Estonia 375 103
Namibia 359 104
Tanzania 318 107
Cyprus 312 108
Liberia 278 110
Cameroon 271 111
Brunei 216 114
Congo (Democratic Republic)
196 115
Madagascar 191 116
Uganda 184 117
Page 60 GAO-11-909 National Export Initiative
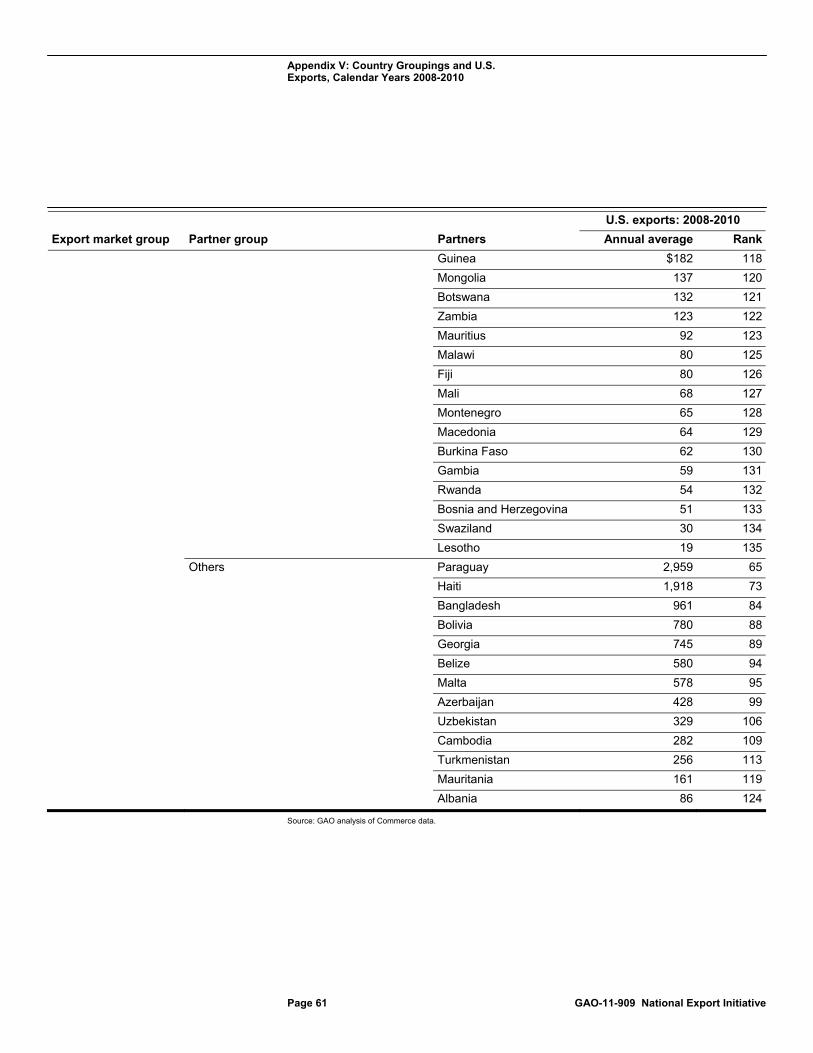
Appendix V: Country Groupings and U.S. Exports, Calendar Years 2008-2010
U.S. exports: 2008-2010
Export market group Partner group Partners Annual average Rank
Guinea $182 118
Mongolia 137 120
Botswana 132 121
Zambia 123 122
Mauritius 92 123
Malawi 80 125
Fiji 80 126
Mali 68 127
Montenegro 65 128
Macedonia 64 129
Burkina Faso 62 130
Gambia 59 131
Rwanda 54 132
Bosnia and Herzegovina 51 133
Swaziland 30 134
Lesotho 19 135
Others Paraguay 2,959 65
Haiti 1,918 73
Bangladesh 961 84
Bolivia 780 88
Georgia 745 89
Belize 580 94
Malta 578 95
Azerbaijan 428 99
Uzbekistan 329 106
Cambodia 282 109
Turkmenistan 256 113
Mauritania 161 119
Albania 86 124
Source: GAO analysis of Commerce data.
Page 61 GAO-11-909 National Export Initiative
Appendix VI: Example of Network Analysis of CS Fee-for-Service Activities
Appendix VI: Example of Network Analysis of CS Fee-for-Service Activities
We conducted network analysis of 3 years of CS’s fee-for-service data and found that certain domestic field locations tend to have strong relationships (as measured by the number of fee-based services jointly sold by a domestic and international office) with particular overseas posts, while others do not. We examined the pattern of collaboration between the three high-growth markets—Brazil, China, and India—and the 15 most active U.S. domestic offices.1 Figure 13 shows five domestic offices—Chicago, Cleveland, Houston, Newport Beach, and Northern Virginia—that each collaborated on a large number of participation agreements with each of the three high-growth markets. However, other domestic offices have strong relationships with one or two of the three high-growth markets, but not with the others. For example, San Jose, Milwaukee, and three others have their strongest relationships with China and India, but less so with Brazil. Salt Lake City, Boston, and Baltimore have only one strong relationship with a high-growth market. Such patterns may suggest markets where personnel or budgetary resources could be added or moved to expand existing relationships or to establish new ones.2
Page 62 GAO-11-909 National Export Initiative
1Collaboration is measured by the numbers of services sold involving domestic and international offices jointly.
2In doing such analysis, other factors such as collaboration, international market type, dominant industries, or world region, would need to be considered.

Appendix VI: Example of Network Analysis of CS Fee-for-Service Activities
Figure 13: Network of Strongest Relationships between Domestic and International CS Offices, Fiscal Years 2008-2010
• Chicago• Cleveland• Houston• Newport Beach• Northern VA
Philadelphia
1 of 3 countries
2 of 3 countries
All 3 countries
Domestic CS offices having significant joint sales with:
Sources: Commerce (data); GAO (analysis); Map Resources (maps).
Fort Lauderdale
San Jose
Pittsburgh
New York
Minneapolis
Milwaukee
Salt Lake City Baltimore
Boston
IndiaChina
53(average)
54(average)
40(average)
36
32
44
50
30
26
32
24
32
28
2258
2426
24
48 28Brazil
Note: The numbers in the figure show, for individual domestic offices, the number of services sold jointly by the office and the corresponding CS offices in Brazil, China, or India; for the one group of domestic offices (listed in triangle), the numbers show the group average of services sold jointly by offices in the group and CS offices in Brazil, China, or India.
Page 63 GAO-11-909 National Export Initiative

Appendix VII: Comments from the Department of Commerce
Appendix VII: Comments from the Department of Commerce
Page 64 GAO-11-909 National Export Initiative

Appendix VIII: GAO Contact and Staff Acknowledgments
Appendix VIII: GAO Contact and Staff Acknowledgments
Loren Yager, (202) 512-4347 or [email protected]
In addition to the contact named above, Adam Cowles, Assistant Director; Julie Hirshen, Analyst-in-Charge; Gezahegne Bekele; David Dornisch; David Dayton; Grace Lui; Emily Suarez-Harris; and Amanda Weldon made key contributions to this report. Other staff providing technical assistance included Kathryn Bernet, Ming Chen, Etana Finkler, Mitchell Karpman, and Jena Sinkfield.
Page 65 GAO-11-909 National Export Initiative
GAO Contact
Staff Acknowledgments
(320719)

GAO’s Mission The Government Accountability Office, the audit, evaluation, and investigative arm of Congress, exists to support Congress in meeting its constitutional responsibilities and to help improve the performance and accountability of the federal government for the American people. GAO examines the use of public funds; evaluates federal programs and policies; and provides analyses, recommendations, and other assistance to help Congress make informed oversight, policy, and funding decisions. GAO’s commitment to good government is reflected in its core values of accountability, integrity, and reliability.
The fastest and easiest way to obtain copies of GAO documents at no cost is through GAO’s Web site (www.gao.gov). Each weekday afternoon, GAO posts on its Web site newly released reports, testimony, and correspondence. To have GAO e-mail you a list of newly posted products, go to www.gao.gov and select “E-mail Updates.”
Obtaining Copies of GAO Reports and Testimony
Order by Phone The price of each GAO publication reflects GAO’s actual cost of production and distribution and depends on the number of pages in the publication and whether the publication is printed in color or black and white. Pricing and ordering information is posted on GAO’s Web site, http://www.gao.gov/ordering.htm.
Place orders by calling (202) 512-6000, toll free (866) 801-7077, or TDD (202) 512-2537.
Orders may be paid for using American Express, Discover Card, MasterCard, Visa, check, or money order. Call for additional information.
Contact:
Web site: www.gao.gov/fraudnet/fraudnet.htm E-mail: [email protected] Automated answering system: (800) 424-5454 or (202) 512-7470
Ralph Dawn, Managing Director, [email protected], (202) 512-4400 U.S. Government Accountability Office, 441 G Street NW, Room 7125 Washington, DC 20548
Chuck Young, Managing Director, [email protected], (202) 512-4800 U.S. Government Accountability Office, 441 G Street NW, Room 7149 Washington, DC 20548
To Report Fraud, Waste, and Abuse in Federal Programs
Congressional Relations
Public Affairs
Please Print on Recycled Paper