gao-10-805 nonprime mortgages: analysis of loan ... · pdf filethe surge in mortgage...
TRANSCRIPT
GAO United States Government Accountability Office
Report to the Joint Economic Committee, United States Congress
NONPRIME MORTGAGES
Analysis of Loan Performance, Factors Associated with Defaults, and Data Sources
August 2010
GAO-10-805
What GAO Found
United States Government Accountability Office
Why GAO Did This Study
HighlightsAccountability Integrity Reliability
August 2010
NONPRIME MORTGAGES
Analysis of Loan Performance, Factors Associated with Defaults, and Data Sources Highlights of GAO-10-805, a report to the
Joint Economic Committee, United States Congress
The surge in mortgage foreclosures that began in late 2006 and continues today was initially driven by deterioration in the performance of nonprime (subprime and Alt-A) loans. Nonprime mortgage originations increased dramatically from 2000 through 2006, rising from about 12 percent ($125 billion) of all mortgage originations to about 34 percent ($1 trillion). The nonprime market contracted sharply in mid-2007, partly in response to increasing defaults and foreclosures for these loans. This report (1) provides information on the performance of nonprime loans through December 31, 2009; (2) examines how loan and borrower characteristics and economic conditions influenced the likelihood of default (including foreclosure) of nonprime loans; and (3) describes the features and limitations of primary sources of data on nonprime loan performance and borrower characteristics, and discusses federal government efforts to improve the availability or use of such data. To do this work, GAO analyzed a proprietary database of securitized nonprime loans and Home Mortgage Disclosure Act data, and reviewed information on mortgage data sources maintained by private firms and the federal government.
What GAO Recommends
GAO makes no recommendations in this report.
The number of active nonprime loans originated from 2000 through 2007 that were seriously delinquent (90 or more days late or in the foreclosure process) increased from 1.1 million at the end of 2008 to 1.4 million at the end of 2009. Serious delinquency rates were higher for certain adjustable-rate products common in the subprime and Alt-A market segments than they were for fixed-rate products. The number of nonprime loans that were 90 or more days late grew throughout 2009, accounting for most of the overall growth in the number of serious delinquencies. By comparison, the number of active loans in the foreclosure process grew in the first half of the year, and then began to decline somewhat. Additionally, 475,000 nonprime mortgages completed the foreclosure process during 2009. The persistently weak performance of nonprime loans suggests that problems in the nonprime market will not be resolved quickly, and underscores the importance of federal efforts to assist distressed borrowers and prevent a recurrence of the aggressive lending practices that helped precipitate the foreclosure crisis. In addition to performance differences between mortgage products, GAO found across product types that house price changes, loan amount, the ratio of the amount of the loan to the value of the home, and borrower credit score were among the variables that influenced the likelihood of default on nonprime loans originated from 2004 through 2006. In addition, loans that lacked full documentation of borrower income and assets were associated with increased default probabilities, and the influence of borrowers’ reported income varied with the level of documentation. GAO found that borrower race and ethnicity were associated with the probability of default, particularly for loans used to purchase rather than to refinance a home. However, these associations should be interpreted with caution because GAO lacks data on factors that may influence default rates and that may also be associated with race and ethnicity, such as borrower wealth and first-time homebuyer status. Existing sources of data on nonprime mortgages contain a range of information to support different uses. While these data sources offer some similar elements, they vary in their coverage of loan, property, and borrower attributes. The data sources generally lack information on certain attributes that could help inform policy decisions or regulatory efforts to mitigate risk. For example, first-time homebuyers are not identified in any of the data sources, limiting the ability of analysts to compare the marginal effect of prior homeownership experience on default probabilities. In addition, most of the data sources do not cover the entire nonprime mortgage market. Ongoing federal efforts have the potential to provide data that may not have some of the constraints of the existing sources. For example, officials from the Board of Governors of the Federal Reserve System and Freddie Mac are collaborating on a pilot project to develop a publicly available National Mortgage Database, which would compile data on a representative sample of outstanding mortgages and provide more comprehensive data than are currently available.
View GAO-10-805 or key components. To view the e-supplement online, click GAO-10-806SP. For more information, contact William B. Shear at (202) 512-8678 or [email protected].

Page i GAO-10-805
Contents
Letter 1
Background 5 Nonprime Loan Performance Deteriorated through the End of 2009
and Varied by Market Segment, Product Type, Cohort Year, and Location 9
House Price Changes and Certain Loan and Borrower Characteristics Were Associated with Default Rates 16
Available Nonprime Mortgage Data Sources Provide Useful Information but Have Constraints That May Be Addressed, in Part, by Ongoing Efforts 32
Observations 40
Appendix I Description of the Econometric Analysis of
Nonprime Mortgage Default Probabilities 42
Appendix II Matching CoreLogic LoanPerformance and
Home Mortgage Disclosure Act Records 61
Appendix III GAO Contact and Staff Acknowledgments 67
Tables
Table 1: Variables Used in the Logistic Regression Models 44 Table 2: Mean Values for Short-term Hybrid ARMs 47 Table 3: Mean Values for Longer-term ARMs 49 Table 4: Mean Values for Fixed-rate Mortgages 51 Table 5: Estimation Results for Short-term Hybrid ARMs for
Owner-Occupants 53 Table 6: Estimation Results for Short-term Hybrid ARMs for
Investors 55 Table 7: Estimation Results for Longer-term ARMs for Owner-
Occupants 57 Table 8: Estimation Results for Fixed-rate Mortgages for Owner-
Occupants 59 Table 9: Results of the Matching Process (CoreLogic LP Loan
Records to HMDA Loan Records) 65
Nonprime Mortgages
Table 10: Median Initial Interest Rates, by Loan Origination Year, Mortgage Product Type, and Match Status 66
Figures
Figure 1: Percentage of Subprime and Alt-A Loans Originated from 2000 through 2007, by Product Type 6
Figure 2: Status of Nonprime Loans Originated from 2000 through 2007 as of December 31, 2009 10
Figure 3: Active Nonprime Loans by Performance Category as of December 31, 2009 11
Figure 4: Number of Seriously Delinquent Nonprime Loans, December 31, 2008, through December 31, 2009 12
Figure 5: Serious Delinquency Rates for Subprime Loans as of December 31, 2009, and Year-over-Year Changes in Serious Delinquency (Dec. 31, 2008-Dec. 31, 2009) 14
Figure 6: Serious Delinquency Rates for Alt-A Loans as of December 31, 2009, and Year-over-Year Changes in Serious Delinquency (Dec. 31, 2008-Dec. 31, 2009) 14
Figure 7: Cumulative Percentage of Subprime and Alt-A Loans That Completed the Foreclosure Process by Cohort Year, 2004 through 2007 15
Figure 8: Estimated Probability of Nonprime Mortgages Defaulting within 24 Months under Different House Price Appreciation Assumptions in the First 2 Years of the Loan, 2004 through 2006 Loans 19
Figure 9: Estimated Probability of Nonprime Mortgages Defaulting within 24 Months under Different Loan Amount, CLTV Ratio, and Credit Score Assumptions, 2004 through 2006 Loans 22
Figure 10: Estimated Probability of Nonprime Mortgages Defaulting within 24 Months under Different Reported Income Assumptions for Borrowers with and without Full Documentation, 2004 through 2006 Loans 26
Figure 11: Default Rates for Nonprime Mortgages 24 Months after First Payment, by Race and Ethnicity, Not Controlling for Other Variables, 2004 through 2006 Loans 28
Figure 12: Estimated Probability of Nonprime Mortgages Defaulting within 24 Months, by Borrower Race and Ethnicity, 2004 through 2006 Loans 29
Figure 13: Examples of Available Data in Selected Mortgage Data Sources 35
Page ii GAO-10-805 Nonprime Mortgages
Abbreviations
ABS asset-backed securities ARM adjustable-rate mortgage BLS Bureau of Labor Statistics CLTV combined loan-to-value CoreLogic LP CoreLogic LoanPerformance DTI debt-service-to-income FFIEC Federal Financial Institutions Examination Council FHA Federal Housing Administration FHFA Federal Housing Finance Agency HMDA Home Mortgage Disclosure Act HPA house price appreciation HPI house price index HUD Department of Housing and Urban Development LLS Loan Level Servicing LPS Lender Processing Services LTV loan-to-value MBS mortgage-backed securities NMDB National Mortgage Database SFDW Single Family Data Warehouse Nonprime Mortgages: Data on Loan Performance by Cohort Year,
Product Type, and Location, an E-Supplement to GAO-10-805 (GAO-10-806SP)
This is a work of the U.S. government and is not subject to copyright protection in the United States. The published product may be reproduced and distributed in its entirety without further permission from GAO. However, because this work may contain copyrighted images or other material, permission from the copyright holder may be necessary if you wish to reproduce this material separately.
Page iii GAO-10-805 Nonprime Mortgages
Page 1 GAO-10-805
United States Government Accountability Office
Washington, DC 20548
August 24, 2010
The Honorable Carolyn B. Maloney Chair The Honorable Charles E. Schumer Vice Chairman Joint Economic Committee United States Congress
The surge in mortgage foreclosures that began in late 2006 and continues today was initially driven by deterioration in the performance of nonprime (subprime and Alt-A) loans.1 Nonprime mortgage originations increased dramatically from 2000 through 2006, rising from about 12 percent ($125 billion) of all mortgage originations to about 34 percent ($1 trillion).2 The nonprime market contracted sharply in mid-2007, partly in response to increasing default and foreclosure rates for these mortgages. As economic conditions deteriorated in 2008 and 2009, growing numbers of borrowers—including those with both nonprime and prime loans—entered foreclosure, exacerbating stresses in the mortgage and housing markets.
Researchers and policymakers have sought to understand the causes of the foreclosure crisis and develop policy responses to reduce foreclosures and prevent similar crises in the future. However, data limitations have complicated efforts to analyze the nonprime mortgage market, in part because no one database provides complete information on the features and performance of nonprime loans and the characteristics of borrowers. Furthermore, questions have been raised about whether timely access to more comprehensive information on the nonprime mortgage market could have helped federal banking regulators anticipate the foreclosure crisis or respond to it more quickly and effectively.
To inform congressional oversight and decision making about efforts to address problems in the mortgage market, you requested that we examine
1The subprime segment of the nonprime loan market generally serves borrowers with blemished or limited credit histories, while the Alt-A market segment serves borrowers whose credit histories are close to prime, but the loans have one or more high-risk features.
2GAO, Characteristics and Performance of Nonprime Mortgages, GAO-09-848R (Washington, D.C.: July 28, 2009).
Nonprime Mortgages
the evolution and condition of the nonprime market segment. In prior reports, we discussed certain characteristics of nonprime loans and borrowers; the performance of nonprime mortgages as of March 31, 2009, and June 30, 2009; the extent of negative equity among nonprime borrowers in selected metropolitan areas and nationwide as of June 30, 2009; and the proportion of nonprime borrowers with negative equity and seriously delinquent loans, by state, from 2006 through 2009.3 This report (1) provides information on the performance of nonprime loans through December 31, 2009; (2) examines how loan and borrower characteristics and economic conditions influenced the likelihood of default and foreclosure of nonprime loans; and (3) describes the features and limitations of primary sources of data on nonprime loan performance and borrower characteristics, and discusses federal government efforts to improve the availability or use of such data. An electronic supplement to this report provides additional information on the performance of nonprime mortgages by annual loan cohort, product type, Census division, state, and congressional district as of December 31, 2009.4
To examine the recent performance of nonprime mortgages, we used data from CoreLogic LoanPerformance’s (CoreLogic LP) Asset-Backed Securities Database for nonprime loans originated from 2000 through 2007 (the last year in which substantial numbers of nonprime mortgages were made). The CoreLogic LP database contains loan-level data on a large majority of nonagency securitized mortgages in subprime and Alt-A pools.5
3GAO, State-Level Information on Negative Home Equity and Loan Performance in the
Nonprime Mortgage Market, GAO-10-633R (Washington, D.C.: May 14, 2010); Loan
Performance and Negative Home Equity in the Nonprime Mortgage Market, GAO-10-146R (Washington, D.C.: Dec. 16, 2009); and GAO-09-848R.
4See GAO, Nonprime Mortgages: Data on Loan Performance by Cohort Year, Product
Type, and Location, an E-Supplement to GAO-10-805, GAO-10-806SP (Washington, D.C.: Aug. 24, 2010). For a discussion of our methodology for estimating performance by congressional district, see GAO-09-848R.
5Nonagency mortgage-backed securities (MBS), also known as private-label MBSs, are backed by nonconforming conventional mortgages securitized primarily by investment banks. Nonconforming mortgages are those that do not meet the purchase requirements of Fannie Mae or Freddie Mac because they are too large or do not meet their underwriting criteria. About 75 percent of subprime and Alt-A mortgages originated from 2001 through 2007 were securitized. For the period of January 2001 through July 2007, the CoreLogic LP database contains information covering, in dollar terms, an estimated 87 percent of securitized subprime loans and 98 percent of securitized Alt-A loans. Researchers have found some evidence that nonprime mortgages that were not securitized (mortgages that lenders held in their portfolios) may have less risky characteristics than those that were securitized. See Christopher L. Foote and others, “Reducing Foreclosures,” Federal Reserve Bank of Boston Public Policy Discussion Paper No. 09-2 (April 2009).
Page 2 GAO-10-805 Nonprime Mortgages

For the purposes of our analysis, we defined a subprime loan as a loan in a subprime pool and an Alt-A loan as a loan in an Alt-A pool.6 We focused our analysis on first-lien purchase and refinance mortgages for one- to four-family residential units. For the nonprime market as a whole, and for the subprime and Alt-A market segments, we calculated the number and percentage of nonprime mortgages that were in different performance categories—for example, current (up to date on payments); delinquent (30 to 89 days behind); in default (90 or more days behind); in the foreclosure process; or having completed the foreclosure process—at the end of each quarter from December 31, 2008, through December 31, 2009, the most recent quarterly data that we could analyze within the time frame of our review.7 We classified mortgages in default or in the foreclosure process as “seriously delinquent.” We also examined mortgage performance as of December 31, 2009, by loan cohort; product type; and geographic areas, including Census divisions, states, and congressional districts.8 These latter analyses are reported in detail in the electronic supplement to this report.9
To analyze the influence of loan and borrower characteristics and economic conditions on the performance of nonprime loans, we developed a statistical model to estimate the relationship between relevant variables and the probability of loan default or foreclosure within 24 months after the borrower’s first payment. We define a loan as being in default or foreclosure if it was delinquent by at least 90 days, in the foreclosure process (including loans identified as in real-estate-owned status), paid off after being 90-days delinquent or in foreclosure, or already terminated with evidence of a loss. We analyzed nonprime loans originated from 2004 to 2006, using records from the CoreLogic LP database that we matched to records in the Home Mortgage Disclosure Act (HMDA)
6The CoreLogic LP database has a loan-level indicator for loan class (subprime or Alt-A), but it is not well populated. Therefore, we used the pool-level classification. According to mortgage researchers, some of the loans in subprime pools may not be subprime loans, and some of the loans in Alt-A pools may not be Alt-A loans.
7Unless otherwise noted, we treated delinquent loans, loans in default, and loans in the foreclosure process as mutually exclusive categories. We considered a loan to have completed the foreclosure process if it was in real-estate-owned status as of a particular date, or was paid off after being either 90 or more days delinquent, in the foreclosure process, or in real-estate-owned status.
8A loan cohort is a group of loans that originated in the same year.
9GAO-10-806SP.
Page 3 GAO-10-805 Nonprime Mortgages
database compiled by the Federal Financial Institutions Examination Council (FFIEC) from information reported by lenders.10 Combining the information in these two data sources yielded a data set with loan-level information on loan characteristics (mortgage type and key mortgage terms); loan performance (payment status at particular times); and certain borrower characteristics (such as borrower race, ethnicity, reported income, and credit score).11 In addition, we used the Federal Housing Finance Agency’s (FHFA) house price indexes (HPI) for metropolitan areas to incorporate data on house price appreciation.12 We also used employment data from the Bureau of Labor Statistics (BLS) and Census tract-level data from the 2000 Census to control for various economic conditions and neighborhood characteristics. Appendix I contains additional information on the methodology for this statistical model.
To identify sources of data on nonprime loans and borrowers, we reviewed research literature on mortgage markets and interviewed knowledgeable private sector and federal agency officials. For data sources that are national in scope, provide loan-level information on nonprime loans, and are widely available for free or a fee, we reviewed database documentation and related research and interviewed agency and company officials to determine the scope and features of each data source. We also collected and reviewed similar documentation for data on loans insured by the Department of Housing and Urban Development’s (HUD) Federal Housing Administration (FHA) because borrowers served by FHA earlier in the decade had some similar characteristics to subprime borrowers. We also used our review of documentation and research and
10The period of 2004 through 2006 covers the peak years of nonprime mortgage lending, and the performance window includes periods of both house price appreciation and depreciation. Additionally, we focused on this period because data limitations complicated our efforts to produce robust matches between the CoreLogic LP and HMDA databases for loans originated in other years.
11Although the HMDA data provide information on borrowers’ race, ethnicity, and reported income, they contain limited information about loan characteristics and no information about performance. HMDA data are estimated to capture about 80 percent of the mortgages funded each year and cover all major market segments, including nonprime loans. HMDA data should therefore capture most of the loans in the CoreLogic LP database, which provides extensive information about loan characteristics and performance.
12More than 90 percent of loans in the CoreLogic LP database was for properties located in metropolitan areas covered by FHFA’s HPIs. We excluded loans for properties outside of these areas.
Page 4 GAO-10-805 Nonprime Mortgages
interviews to identify limitations in data availability and federal government efforts to address them or to improve the use of such data.
We tested the reliability of the data used in this report by reviewing documentation on the process that the data providers use to collect and ensure the reliability and integrity of their data, and by conducting reasonableness checks on data elements to identify any missing, erroneous, or outlying data. We also interviewed CoreLogic LP representatives to discuss the interpretation of various data fields. We concluded that the data we used were sufficiently reliable for our purposes.
We conducted this engagement in Washington, D.C., and Chicago, Illinois, from December 2009 through August 2010 in accordance with generally accepted government auditing standards. Those standards require that we plan and perform the audit to obtain sufficient, appropriate evidence to provide a reasonable basis for our findings and conclusions based on our audit objectives. We believe that the evidence obtained provides a reasonable basis for our findings and conclusions based on our audit objectives.
The nonprime mortgage market has two segments: Background
• Subprime: Generally serves borrowers with blemished or limited credit histories, and the loans feature higher interest rates and fees than prime loans.
• Alt-A: Generally serves borrowers whose credit histories are close to prime, but the loans have one or more high-risk features, such as limited documentation of income or assets or the option of making monthly payments that are lower than would be required for a fully amortizing loan.
Of the 14.5 million nonprime loans originated from 2000 through 2007, 9.4 million (65 percent) were subprime loans and 5.1 million (35 percent) were Alt-A loans.
In both of these market segments, two types of loans are common: fixed-rate mortgages, which have unchanging interest rates, and adjustable-rate mortgages (ARM), which have interest rates that can adjust periodically on the basis of changes in a specified index. Specific types of ARMs are prevalent in each market segment. “Short-term hybrid ARMs” accounted for 70 percent of subprime mortgage originations from 2000 through 2007
Page 5 GAO-10-805 Nonprime Mortgages
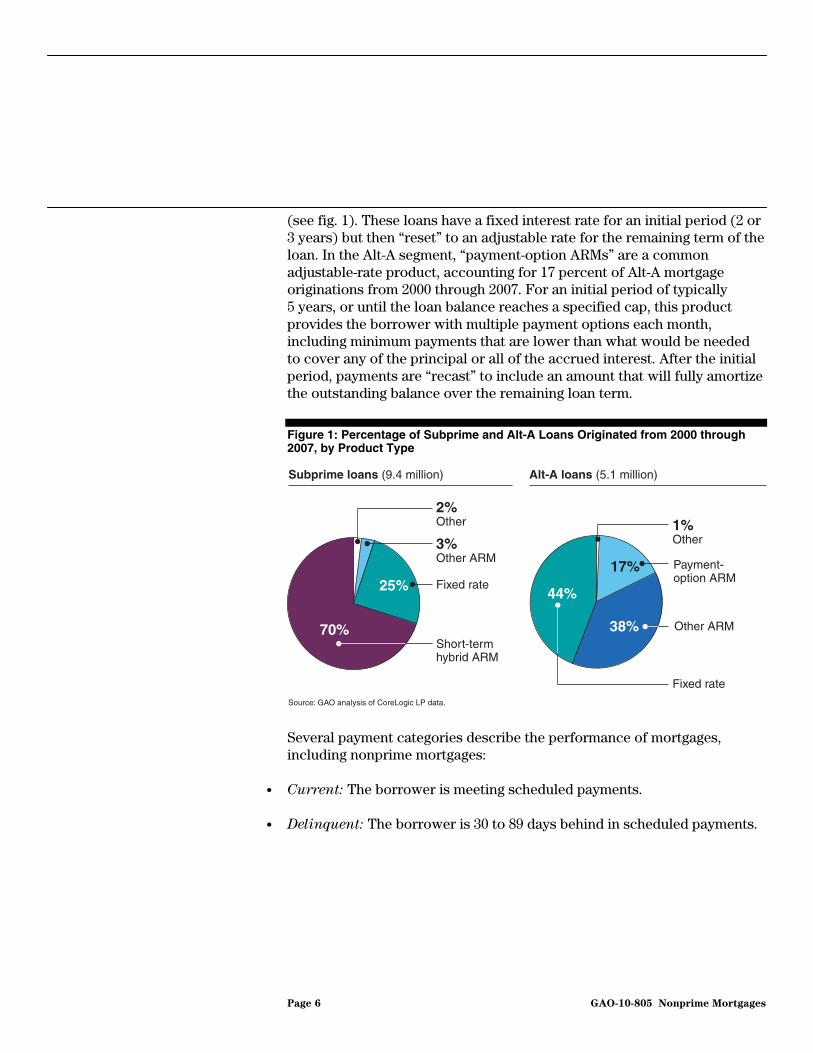
(see fig. 1). These loans have a fixed interest rate for an initial period (2 or 3 years) but then “reset” to an adjustable rate for the remaining term of the loan. In the Alt-A segment, “payment-option ARMs” are a common adjustable-rate product, accounting for 17 percent of Alt-A mortgage originations from 2000 through 2007. For an initial period of typically 5 years, or until the loan balance reaches a specified cap, this product provides the borrower with multiple payment options each month, including minimum payments that are lower than what would be needed to cover any of the principal or all of the accrued interest. After the initial period, payments are “recast” to include an amount that will fully amortize the outstanding balance over the remaining loan term.
Figure 1: Percentage of Subprime and Alt-A Loans Originated from 2000 through 2007, by Product Type
Several payment categories describe the performance of mortgages, including nonprime mortgages:
Source: GAO analysis of CoreLogic LP data.
Subprime loans (9.4 million) Alt-A loans (5.1 million)
70%
25%
Short-termhybrid ARM
Fixed rate
2%Other
3%Other ARM
1%Other
17%
44%
38% Other ARM
Payment-option ARM
Fixed rate
• Current: The borrower is meeting scheduled payments.
• Delinquent: The borrower is 30 to 89 days behind in scheduled payments.
Page 6 GAO-10-805 Nonprime Mortgages
• Default: The borrower is 90 days or more delinquent.13 At this point, foreclosure proceedings against the borrower become a strong possibility.
• In the foreclosure process: The borrower has been delinquent for more than 90 days, and the lender has elected to foreclose in what is often a lengthy process. The loan is considered active during the foreclosure process.
• Completed the foreclosure process: The borrower’s loan terminates and foreclosure proceedings end with one of several possible outcomes. For example, the borrower may sell the property or the lender may repossess the home.
• Prepaid: The borrower has paid off the entire loan balance before it is due. Prepayment often occurs as a result of the borrower selling the home or refinancing into a new mortgage.
In this report, we describe mortgages in default or in the foreclosure process as “seriously delinquent.”
As we have stated in previous reports, a combination of falling house prices, aggressive lending practices, and weak economic conditions have contributed to the increase in troubled mortgages. For example, in 2009, we noted that falling house prices had left a substantial proportion of nonprime borrowers in a negative equity position—that is, their mortgage balances exceeded the current value of their homes—limiting their ability to sell or refinance their homes in the event they could not stay current on their mortgage payments.14 Additionally, we reported that an easing of underwriting standards and wider use of certain loan features associated with poorer loan performance contributed to increases in mortgage delinquencies and foreclosures.15 These features included mortgages with higher loan-to-value (LTV) ratios (the amount of the loan divided by the value of the home at loan origination), adjustable interest rates, limited or no documentation of borrower income or assets, and deferred payment of
13There is no uniform definition of default across the lending industry. For the purposes of this report, we use the definition provided unless otherwise noted.
14GAO-10-146R.
15GAO, Information on Recent Default and Foreclosure Trends for Home Mortgages and
Associated Economic and Market Developments, GAO-08-78R (Washington, D.C.: Oct. 16, 2007).
Page 7 GAO-10-805 Nonprime Mortgages

principal or interest. Also, in some cases, mortgage originators engaged in questionable sales practices that resulted in loans with onerous terms and conditions that made repayment more difficult for some borrowers. Furthermore, rising unemployment has contributed to mortgage defaults and foreclosures because job loss directly affects a borrower’s ability to make mortgage payments.
The foreclosure crisis has imposed significant costs on borrowers, neighborhoods, and taxpayers. For example, vacant and foreclosed properties have contributed to neighborhood blight and reduced property values in many communities. Additionally, foreclosures affecting minority populations and the high incidence of subprime lending to members of these groups have heightened concerns that these groups have received disparate treatment in mortgage lending. In light of these costs and concerns, Congress and federal agencies have taken a number of steps to address and prevent a recurrence of ongoing problems in the mortgage market. These efforts include programs to modify or refinance the loans of distressed borrowers and legislation to strengthen mortgage-lending standards and prevent mortgage originators from steering borrowers into high-risk or high-cost mortgages.
Page 8 GAO-10-805 Nonprime Mortgages

Nonprime Loan Performance Deteriorated through the End of 2009 and Varied by Market Segment, Product Type, Cohort Year, and Location
The Worsening Performance of Nonprime Loans Was Reflected in Increases in Serious Delinquencies
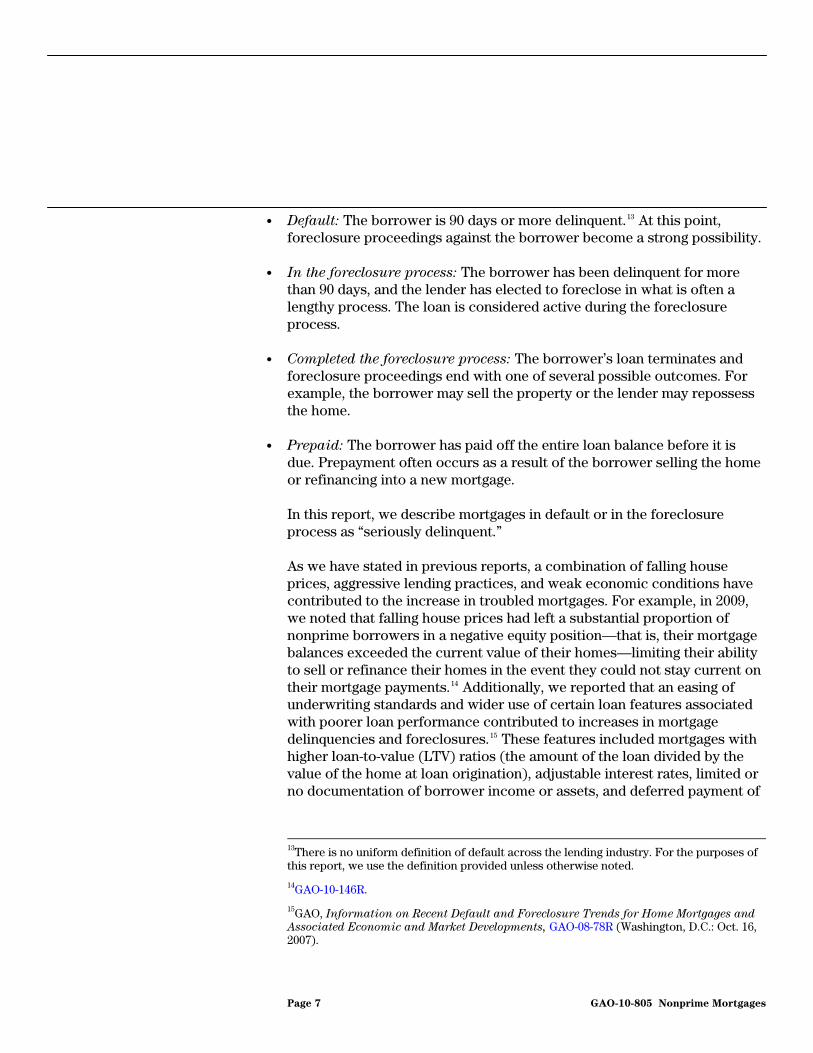
As of December 31, 2009, 63 percent of the 14.50 million nonprime loans originated from 2000 through 2007 (the last year in which substantial numbers of nonprime mortgages were made) was no longer active. Fifty percent of the nonprime loans originated during this period had prepaid, and 13 percent had completed foreclosure (see fig. 2).16
16As we have previously noted, the data we used for our analysis do not cover the entire nonprime market but do cover the large majority of nonagency securitized mortgages within that market.
Page 9 GAO-10-805 Nonprime Mortgages
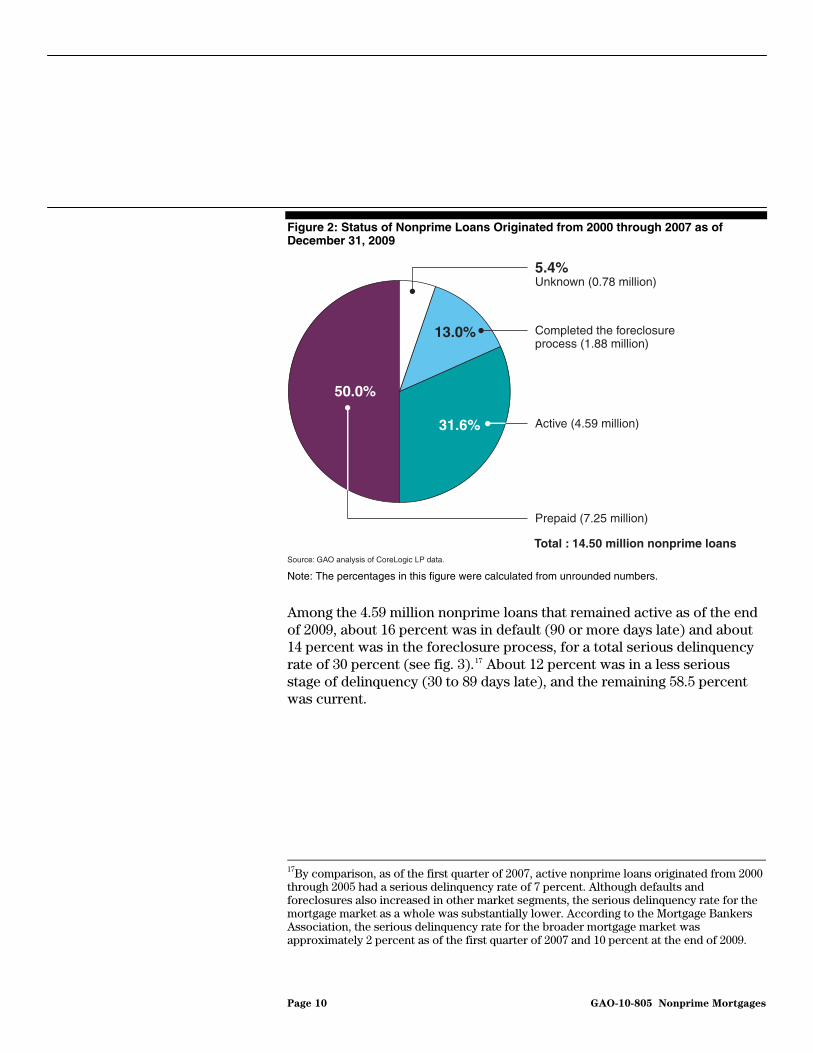
Figure 2: Status of Nonprime Loans Originated from 2000 through 2007 as of December 31, 2009
13.0%
31.6%
50.0%
Source: GAO analysis of CoreLogic LP data.
5.4%Unknown (0.78 million)
Active (4.59 million)
Prepaid (7.25 million)
Total : 14.50 million nonprime loans
Completed the foreclosureprocess (1.88 million)
Note: The percentages in this figure were calculated from unrounded numbers.
Among the 4.59 million nonprime loans that remained active as of the end of 2009, about 16 percent was in default (90 or more days late) and about 14 percent was in the foreclosure process, for a total serious delinquency rate of 30 percent (see fig. 3).17 About 12 percent was in a less serious stage of delinquency (30 to 89 days late), and the remaining 58.5 percentwas curre
nt.
17By comparison, as of the first quarter of 2007, active nonprime loans originated from 2000 through 2005 had a serious delinquency rate of 7 percent. Although defaults and foreclosures also increased in other market segments, the serious delinquency rate for the mortgage market as a whole was substantially lower. According to the Mortgage Bankers Association, the serious delinquency rate for the broader mortgage market was approximately 2 percent as of the first quarter of 2007 and 10 percent at the end of 2009.
Page 10 GAO-10-805 Nonprime Mortgages

Figure 3: Active Nonprime Loans by Performance Category as of December 31, 2009
13.6%
11.5%
16.4%
58.5%
Source: GAO analysis of CoreLogic LP data.
Delinquent (0.53 million)
In default (0.75 million)
Current (2.68 million)
In the foreclosure process (0.63 million)
Total : 4.59 million active nonprime loans
Note: The percentages in this figure were calculated from unrounded numbers.
The performance of nonprime mortgages originated from 2000 through 2007 deteriorated from the end of 2008 through the end of 2009. At the end of 2009, 1.38 million active nonprime loans were seriously delinquent, compared with 1.10 million at the end of 2008.18 Over the 12-month period, the serious delinquency rate rose from 21 percent to 30 percent. About three-quarters of the year-over-year change in the number of serious delinquencies was due to an increase in defaults, while the remainder was due to an increase in loans in the foreclosure process. As shown in figure 4, the number of active nonprime loans in default grew each quarter, with the largest increases occurring in the third and fourth quarters of 2009. By comparison, the number of active nonprime loans in the foreclosure process grew in the first two quarters of the year, held almost steady in the third quarter, and declined in the last quarter of 2009. The decline in the number of loans in the foreclosure process may be attributable to decisions by lenders not to begin foreclosure proceedings on defaulted loans.
18Active loans can move in and out of serious delinquency status over time. For example, if a borrower makes one or more payments on a loan that has been in default (more than 90 days past due), its status could improve to delinquent (30 to 89 days past due) or current.
Page 11 GAO-10-805 Nonprime Mortgages

Figure 4: Number of Seriously Delinquent Nonprime Loans, December 31, 2008, through December 31, 2009
0
300,000
600,000
900,000
1,200,000
1,500,000
Q4Q3Q2Q1Q4
Seriously delinquent loans
2008 2009
Source: GAO analysis of CoreLogic LP data.
Loans in default
Loans in the foreclosure process
Total seriously delinquent loans (loans in default + loans in the foreclosure process)
In addition, among all nonprime loans originated from 2000 through 2007, the cumulative percentage that had completed the foreclosure process increased from 10 percent at the end of 2008 to 13 percent at the end of 2009. About 475,000 nonprime loans completed foreclosure in 2009, or roughly 119,000 per quarter. Most (63 percent) of the 759,000 decline in the number of active loans in 2009 was attributable to loans completing foreclosure, rather than to prepayments.
Loan Performance Varied by Market Segment, Product Type, Cohort Year, and Location
In 2009, the performance of nonprime loans differed between the subprime and Alt-A market segments and, within each segment, among product types (fixed-rate mortgages versus ARMs). Nonprime loan performance also varied by the year of loan origination (cohort year) and by location.
In general, the subprime market segment performed worse than the Alt-A segment in 2009.
Loan Performance by Market Segment and Product Type
Page 12 GAO-10-805 Nonprime Mortgages
• Of the 2.76 million subprime loans that were active at the end of 2008, 10 percent (267,000) completed foreclosure in 2009. By comparison, 8 percent (208,000) of the 2.59 million Alt-A loans that were active at the end of 2008 completed foreclosure in 2009.
• Cumulatively, 15 percent (1.41 million) of subprime loans originated from 2000 through 2007 had completed foreclosure as of December 31, 2009, compared with 9 percent (474,000) of Alt-A loans.
• Among active loans at the end of 2009, 36 percent (858,000) of subprime loans were seriously delinquent, compared with 23 percent (517,000) of Alt-A loans.
However, Alt-A loans accounted for 55 percent (152,000) of the 277,000 year-over-year increase in the number of seriously delinquent loans.
Within the subprime and Alt-A market segments, loan performance varied by product type. As we stated in a previous report, serious delinquency rates were higher for certain adjustable-rate products common in the subprime and Alt-A market segments than they were for fixed-rate products or the market as a whole.19 Although many nonprime borrowers with adjustable-rate loans fell behind on their mortgages before their payments increased, the higher serious delinquency rates for these products may partly reflect the difficulties some borrowers had in making their payments when their interest rates reset to higher levels or when their monthly payments recast to fully amortizing amounts. In the subprime market segment, the serious delinquency rate for short-term hybrid ARMs was 48 percent at the end of 2009, compared with 21 percent for fixed-rate mortgages and 36 percent for all active subprime loans (see fig. 5). The serious delinquency rate increased by 11 percentage points for short-term hybrid ARMs in 2009, compared with 8 percentage points for fixed-rate mortgages and 10 percentage points for all active subprime loans. However, the year-over-year increase in the number of fixed-rate mortgages that were seriously delinquent (over 62,000) was greater than the corresponding increase among short-term hybrid ARMs (over 47,000), even though short-term hybrid ARMs were more prevalent than fixed-rate mortgages among subprime loans.
19GAO-09-848R.
Page 13 GAO-10-805 Nonprime Mortgages
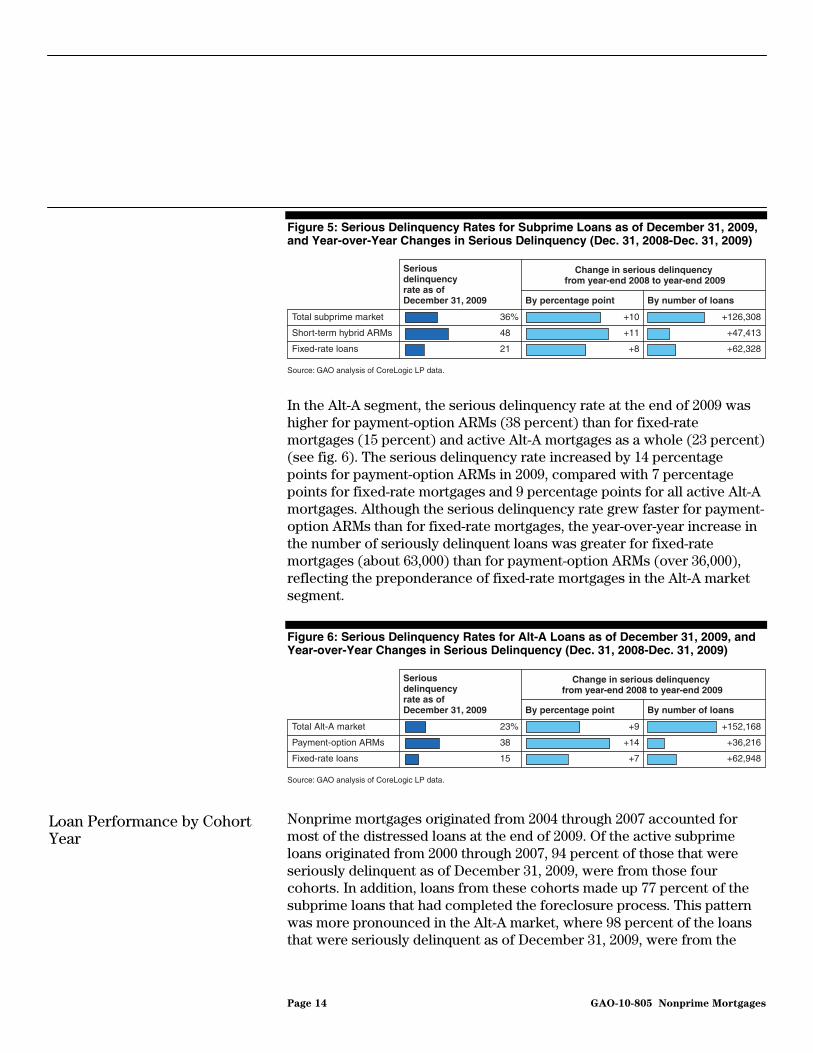
Figure 5: Serious Delinquency Rates for Subprime Loans as of December 31, 2009, and Year-over-Year Changes in Serious Delinquency (Dec. 31, 2008-Dec. 31, 2009)
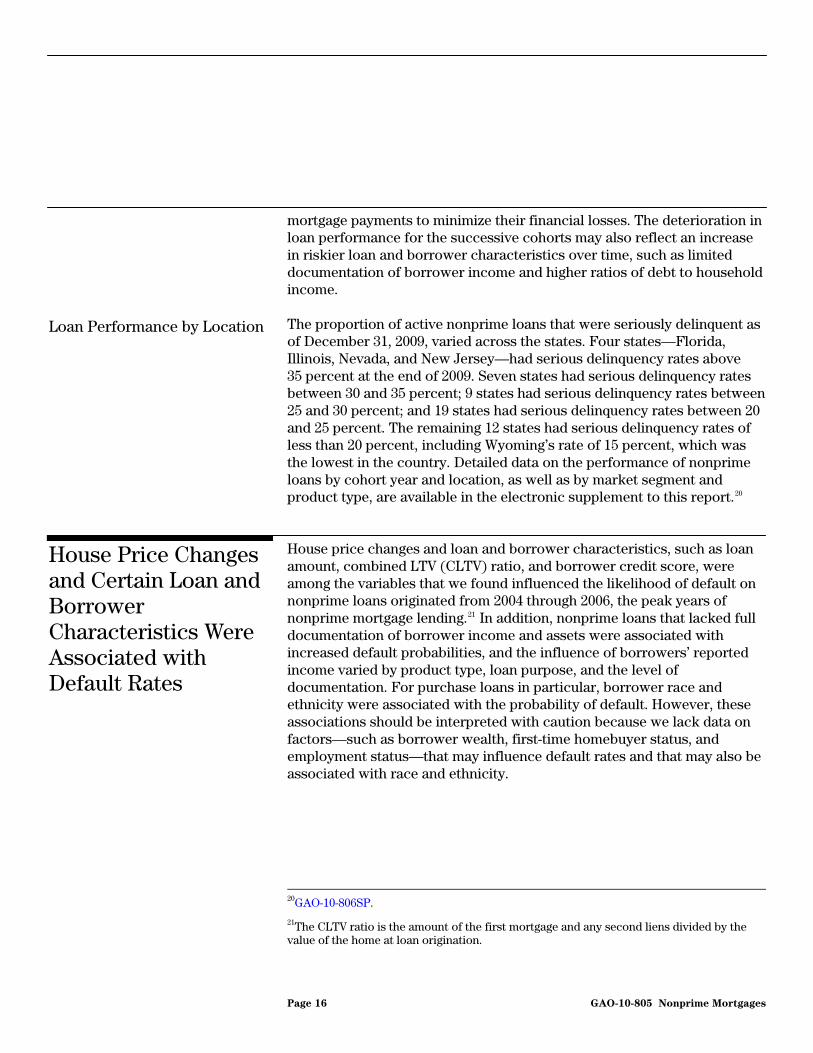
In the Alt-A segment, the serious delinquency rate at the end of 2009 was higher for payment-option ARMs (38 percent) than for fixed-rate mortgages (15 percent) and active Alt-A mortgages as a whole (23 percent) (see fig. 6). The serious delinquency rate increased by 14 percentage points for payment-option ARMs in 2009, compared with 7 percentage points for fixed-rate mortgages and 9 percentage points for all active Alt-A mortgages. Although the serious delinquency rate grew faster for payment-option ARMs than for fixed-rate mortgages, the year-over-year increase in the number of seriously delinquent loans was greater for fixed-rate mortgages (about 63,000) than for payment-option ARMs (over 36,000), reflecting the preponderance of fixed-rate mortgages in the Alt-A market segment.
Figure 6: Serious Delinquency Rates for Alt-A Loans as of December 31, 2009, and Year-over-Year Changes in Serious Delinquency (Dec. 31, 2008-Dec. 31, 2009)
Source: GAO analysis of CoreLogic LP data.
Serious delinquencyrate as of December 31, 2009
Change in serious delinquency from year-end 2008 to year-end 2009
By percentage point By number of loans
Total subprime market
Short-term hybrid ARMs
Fixed-rate loans
36
48
21
% +10
+11
+8
+126,308
+47,413
+62,328
Source: GAO analysis of CoreLogic LP data.
Serious delinquencyrate as of December 31, 2009
Change in serious delinquency from year-end 2008 to year-end 2009
By percentage point By number of loans
Total Alt-A market
Payment-option ARMs
Fixed-rate loans
23
38
15
% +9
+14
+7
+152,168
+36,216
+62,948
Nonprime mortgages originated from 2004 through 2007 accounted for most of the distressed loans at the end of 2009. Of the active subprime loans originated from 2000 through 2007, 94 percent of those that were seriously delinquent as of December 31, 2009, were from those four cohorts. In addition, loans from these cohorts made up 77 percent of the subprime loans that had completed the foreclosure process. This pattern was more pronounced in the Alt-A market, where 98 percent of the loans that were seriously delinquent as of December 31, 2009, were from the
Loan Performance by Cohort Year
Page 14 GAO-10-805 Nonprime Mortgages

2004 through 2007 cohorts. Similarly, 95 percent of the Alt-A loans that had completed the foreclosure process were from those cohorts.
Also, within each market segment, the percentage of mortgages completing the foreclosure process generally increased for each successive loan cohort (see fig. 7). Within 3 years of loan origination, 5 percent of subprime loans originated in 2004 had completed the foreclosure process, compared with 8 percent of the 2005 cohort and 16 percent each of the 2006 and 2007 cohorts. Among Alt-A loans, 1 percent of the 2004 cohort had completed the foreclosure process within 3 years of origination, compared with 2 percent of the 2005 cohort, 8 percent of the 2006 cohort, and 13 percent of the 2007 cohort.
Figure 7: Cumulative Percentage of Subprime and Alt-A Loans That Completed the Foreclosure Process by Cohort Year, 2004 through 2007
0
5
10
15
20
25
654321
Subprime loans Alt-A loans
Percentage
Loan duration in years
Percentage
Source: GAO analysis of CoreLogic LP data.
2007
2006
2005
2004
0
5
10
15
20
25
654321
Loan duration in years
2007
2006
2005
2004
This trend is partly attributable to a decline in the appreciation of or an absolute decline in house prices in much of the country beginning in 2005 and worsening in subsequent years. This situation made it more difficult for some borrowers to sell or refinance their homes to avoid default or foreclosure. In addition, borrowers who purchased homes but came to owe more than the properties were worth, had incentives to stop making
Page 15 GAO-10-805 Nonprime Mortgages
mortgage payments to minimize their financial losses. The deterioration in loan performance for the successive cohorts may also reflect an increase in riskier loan and borrower characteristics over time, such as limited documentation of borrower income and higher ratios of debt to household income.
The proportion of active nonprime loans that were seriously delinquent as of December 31, 2009, varied across the states. Four states—Florida, Illinois, Nevada, and New Jersey—had serious delinquency rates above 35 percent at the end of 2009. Seven states had serious delinquency rates between 30 and 35 percent; 9 states had serious delinquency rates between 25 and 30 percent; and 19 states had serious delinquency rates between 20 and 25 percent. The remaining 12 states had serious delinquency rates of less than 20 percent, including Wyoming’s rate of 15 percent, which was the lowest in the country. Detailed data on the performance of nonprime loans by cohort year and location, as well as by market segment and product type, are available in the electronic supplement to this report.20
Loan Performance by Location
House price changes and loan and borrower characteristics, such as loan amount, combined LTV (CLTV) ratio, and borrower credit score, were among the variables that we found influenced the likelihood of default on nonprime loans originated from 2004 through 2006, the peak years of nonprime mortgage lending.21 In addition, nonprime loans that lacked full documentation of borrower income and assets were associated with increased default probabilities, and the influence of borrowers’ reported income varied by product type, loan purpose, and the level of documentation. For purchase loans in particular, borrower race and ethnicity were associated with the probability of default. However, these associations should be interpreted with caution because we lack data on factors—such as borrower wealth, first-time homebuyer status, and employment status—that may influence default rates and that may also be associated with race and ethnicity.
House Price Changes and Certain Loan and Borrower Characteristics Were Associated with Default Rates
20GAO-10-806SP.
21The CLTV ratio is the amount of the first mortgage and any second liens divided by the value of the home at loan origination.
Page 16 GAO-10-805 Nonprime Mortgages
Prior research has shown that various loan, borrower, and economic variables influence the performance of a mortgage.22 We developed a statistical model to examine the relationship between such variables and the probability of a loan defaulting within 24 months after the borrower’s first payment. We focused on the probability of a loan defaulting within 24 months as our measure of performance because a large proportion of nonprime borrowers had hybrid ARMs and prepaid their loans (e.g., by refinancing) within 2 years. For the purposes of this analysis, we defined a loan as being in default if it was delinquent by at least 90 days, in the foreclosure process (including loans identified as in real-estate-owned status), paid off after being 90 days delinquent or in foreclosure, or already terminated with evidence of a loss.23
Description of our Statistical Model
We developed the statistical model using data on nonprime mortgages originated from 2004 through 2006. To include more information on borrower demographics (i.e., race, ethnicity, and reported income) than is available in the CoreLogic LP data, we matched CoreLogic LP records to HMDA records.24 Although we matched about three-quarters of the CoreLogic LP loans, and the loans that we could match were similar in important respects to the loans that we could not match, our estimation results may not be fully representative of the securitized portion of the nonprime market or the nonprime market as a whole. (See app. II for additional information on our matching methodology.)
We produced separate estimates for the three most prevalent nonprime loan products: (1) short-term hybrid ARMs, representing 51 percent of nonprime loans originated during this period; (2) longer-term ARMs—
22In a prior report, we examined the relationship between these types of variables and the likelihood of default to assess the implications of proposed legislation intended to strengthen consumer protections for mortgage borrowers. See GAO, Home Mortgages:
Provisions in a 2007 Mortgage Reform Bill (H.R. 3915) Would Strengthen Borrower
Protections, but Views on Their Long-term Impact Differ, GAO-09-741 (Washington, D.C.: July 31, 2009).
23Earlier in this report, we used the term “in default” to refer only to loans that were delinquent by at least 90 days. For efficiency of language, henceforth we use the broader definition stated in this section of the report.
24In GAO-09-741, we used a similar model to estimate mortgage defaults. However, the results presented in that prior report and this report are not directly comparable, in part because we did not match the CoreLogic LP data to HMDA data in the prior report. Therefore, we did not include information on borrowers’ race, ethnicity, or reported income. Also, for that study, we estimated default probabilities for loans originated from 2000 through 2006.
Page 17 GAO-10-805 Nonprime Mortgages
those with interest rates that were fixed for 5, 7, or 10 years before adjusting (11 percent of originations); and (3) fixed-rate mortgages (27 percent of originations). For each product type, we produced separate estimates for purchase and refinance loans and for loans to owner-occupants and investors.25 Twenty-four months after the first loan payment, default rates were highest for short-term hybrid ARMs and, across product types, were generally higher for purchase loans than refinance loans. Appendix I provides additional information about our model and estimation results.
Across Product Types, Changes in House Prices Influenced Default Probabilities
Consistent with prior research, we found that lower rates of house price appreciation or declines in house prices were strongly associated with a higher likelihood of default for each product type and loan purpose.26 To illustrate the role of this variable, we estimated the default probability assuming house price changes that resembled the actual patterns in certain metropolitan areas, all else being equal.27 For example, for short-term hybrid ARMs used for home purchases, house price appreciation of 25 percent in the 1st year of the loan and then 20 percent in the 2nd year was associated with about a 5 percent estimated default probability, all else being equal (see fig. 8).28 Assuming instead that house prices stayed about level in the 1st year of the loan and then dropped by about 10 percent in the 2nd year, the estimated default probability for short-term hybrid ARM purchase loans increased by about 26 percentage points, to 31 percent.
25We present the results for purchase and refinance loans to owner-occupants in the body of this report and results for loans to investors in appendix I.
26Michelle A. Danis and Anthony Pennington-Cross, “The Delinquency of Subprime Mortgages,” Journal of Economics and Business, vol. 60 (2008); Andrew Haughwout, Richard Peach, and Joseph Tracy, “Juvenile Delinquent Mortgages: Bad Credit or Bad Economy?,” Journal of Urban Economics, vol. 64 (2008); Shane M. Sherlund, “The Past, Present, and Future of Subprime Mortgages,” Finance and Economic Discussion Series,
no. 2008-63, Federal Reserve Board (November 2008); and Yuliya S. Demyanyk, “Quick Exits of Subprime Mortgages,” Federal Reserve Bank of St. Louis Review, vol. 91, no. 2 (2009).
27When we use the phrase “all else being equal” in describing the marginal effect of changes in a particular variable, we mean that we estimated default probabilities using two different values for that variable, setting the values for all other variables to their means for the respective product type and loan purpose.
28We used FHFA’s metropolitan HPIs, which are broad measures of the movement of single-family house prices in 384 metropolitan areas. The HPIs are published by FHFA using home price data provided by Fannie Mae and Freddie Mac on the basis of sales and refinancings of the same properties at different points in time.
Page 18 GAO-10-805 Nonprime Mortgages

These two scenarios approximate the actual house price changes in Los Angeles beginning in early 2004 and mid-2005, respectively, and are emblematic of a number of markets in which a period of substantial house price growth was followed by a period of decline. Assuming that house prices rose by a modest 2 percent per year—approximating the pattern in a number of midwestern markets—the estimated default probability was about 22 percent. As shown in figure 8, the influence of house prices changes on estimated default probabilities was greater for short-term hybrid ARMs than for other mortgage products.
Figure 8: Estimated Probability of Nonprime Mortgages Defaulting within 24 Months under Different House Price Appreciation Assumptions in the First 2 Years of the Loan, 2004 through 2006 Loans
Short-termhybrid ARMs
Longer-termARMs
Fixed-ratemortgages
Estimated probability of default for house price appreciation assumptions (year 1 / year 2)
25% / 20% appreciation 2% / 2% appreciation 0% / (10%) appreciation
5.0
4.1
1.1
0.8
1.2
1.4
% 22.2
15.1
4.8
3.9
5.4
5.1
30.9
20.4
7.7
5.9
8.3
7.2
% %
Source: GAO analysis of CoreLogic LP, HMDA, FHFA, Census, and BLS data.
Purchase loan
Refinance loan
Note: This figure compares the estimated probability of default assuming the house price change values shown in the 1st and 2nd year of the loan, all else being equal. The results presented are for owner-occupants. The estimated default probabilities that we present do not necessarily reflect the ultimate performance of any product type.
House price changes may also reflect broader economic trends, thereby affecting the precision of estimated impacts of other broad economic variables, such as employment growth, on mortgage defaults. In our model, we included a variable for state-level employment growth and noted that the variable was positively correlated with the variable for
Page 19 GAO-10-805 Nonprime Mortgages

house price changes.29 With that in mind, we found that for purchase and refinance loans of all product types, lower rates of employment growth were associated with somewhat higher estimated default probabilities. For example, for short-term hybrid ARM purchase loans, moving from a 4 percent employment growth rate over 24 months to a zero percent employment growth rate was associated with about a 1 percentage point increase in estimated default probabilities. For each of the other product types and loan purposes, the corresponding change was between 1 and 2 percentage points.
Nonprime Mortgages
In general, we found that higher loan amounts, higher CLTV ratios, and lower credit scores also were strongly associated with higher likelihoods of default.30 For example:
• Loan amount: For each product type and loan purpose, we estimated the default probability assuming a loan amount near the 25th percentile for that product and purpose and compared this with the estimated default probability assuming a loan amount near the 75th percentile for that product and purpose. For short-term hybrid ARMs used for home purchases, moving from a loan amount of $125,000 to $300,000 was associated with a 6 percentage point increase in estimated default probability, all else being equal (see fig. 9). A similar pattern held across product types, with a larger effect for purchase loans than refinance loans.
Loan Amount, CLTV Ratio, and Credit Score Also Were Associated with the Likelihood of Default for All Product Types
• CLTV ratio: For each product type and loan purpose, we estimated the default probability assuming a CLTV ratio close to the 25th percentile for that product and purpose and compared this with the estimated default probability assuming a CLTV ratio close to the 75th percentile for that product and purpose. For short-term hybrid ARMs used for home purchases, moving from a CLTV ratio between 80 and 90 percent to a
29That is, house prices and employment growth tended to move in the same direction. Specifically, the correlation coefficient between our measures for house price changes and employment growth in the first 24 months of the loan was 0.66. (The Pearson’s correlation coefficient is a statistical measure of association, ranging in value from negative 1 to positive 1, with negative 1 indicating a perfect negative correlation, 0 an absence of correlation, and positive 1 a perfect positive correlation.)
30Other research has found similar associations. See Danis and Pennington-Cross, “The Delinquency of Subprime Mortgages”; Haughwout, Peach, and Tracy, “Juvenile Delinquent Mortgages: Bad Credit or Bad Economy?”; Sherlund, “The Past, Present, and Future of Subprime Mortgages”; and Demyanyk, “Quick Exits of Subprime Mortgages.”
Page 20 GAO-10-805
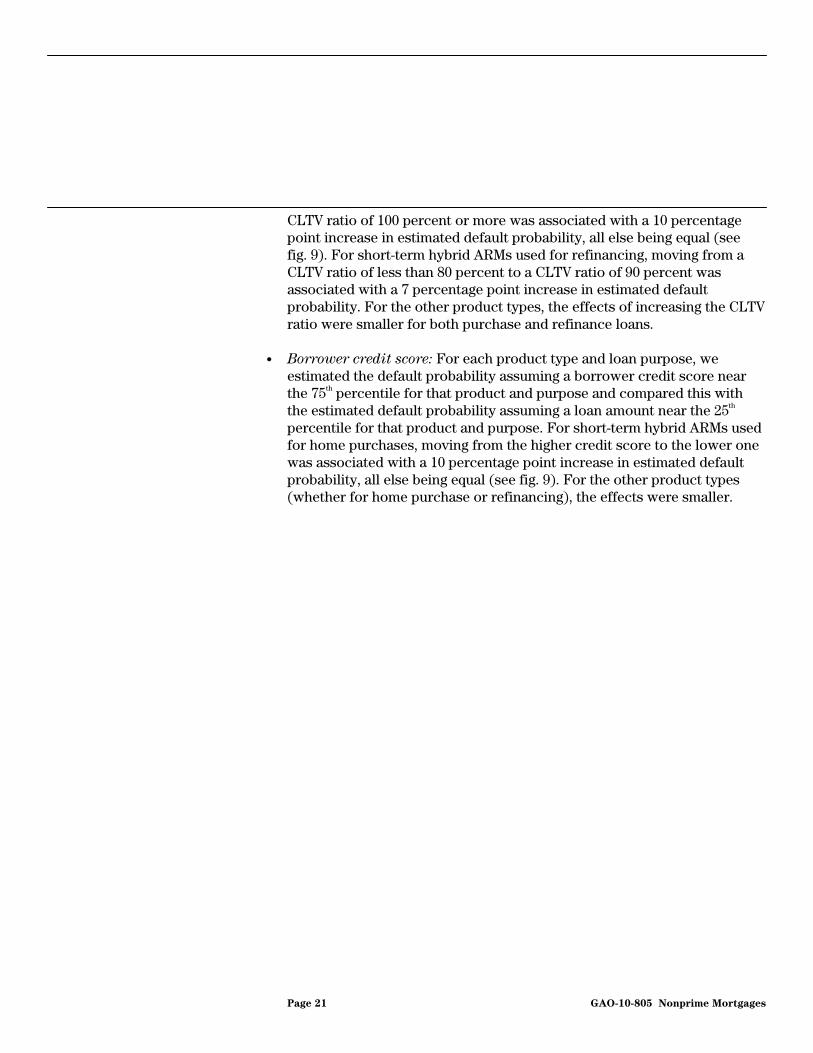
CLTV ratio of 100 percent or more was associated with a 10 percentage point increase in estimated default probability, all else being equal (see fig. 9). For short-term hybrid ARMs used for refinancing, moving from a CLTV ratio of less than 80 percent to a CLTV ratio of 90 percent was associated with a 7 percentage point increase in estimated default probability. For the other product types, the effects of increasing the CLTV ratio were smaller for both purchase and refinance loans.
• Borrower credit score: For each product type and loan purpose, we estimated the default probability assuming a borrower credit score near the 75th percentile for that product and purpose and compared this with the estimated default probability assuming a loan amount near the 25th
percentile for that product and purpose. For short-term hybrid ARMs used for home purchases, moving from the higher credit score to the lower one was associated with a 10 percentage point increase in estimated default probability, all else being equal (see fig. 9). For the other product types (whether for home purchase or refinancing), the effects were smaller.
Page 21 GAO-10-805 Nonprime Mortgages

Figure 9: Estimated Probability of Nonprime Mortgages Defaulting within 24 Months under Different Loan Amount, CLTV Ratio, and Credit Score Assumptions, 2004 through 2006 Loans
Note: For each variable presented, the figure compares the estimated probability of default assuming values near the 25th and 75th percentile for the respective product type and loan purpose, all else being equal. The results presented in this figure are for loans to owner-occupants.
Short-termhybrid ARMs
VariableBase
AssumptionAlternative
Estimated probability of default
Loanamount:
CLTV ratio:
Borrower credit score:
Loanamount:
CLTV ratio:
Borrower credit score:
Loanamount:
CLTV ratio:
Borrower credit score:
Longer-termARMs
Fixed-ratemortgages
$300,000
$300,000
100% or more
90%
600
550
$500,000
$500,000
100% or more
90%
650
600
$300,000
$300,000
100% or more
90%
650
600
$125,000
$140,000
80% to 90%
Less than 80%
675
635
$200,000
$200,000
80% to 90%
Less than 80%
750
700
$125,000
$125,000
80% to 90%
Less than 80%
750
700
20.3
13.4
20.9
15.0
23.3
15.0
5.7
4.1
6.9
6.5
7.3
7.1
5.2
4.8
6.8
6.9
6.8
6.3
14.6
10.0
11.0
7.8
13.9
10.0
3.8
3.2
2.0
2.0
3.3
3.6
3.6
3.5
2.8
2.8
2.4
2.5
%
%
Source: GAO analysis of CoreLogic LP, HMDA, FHFA, Census, and BLS data.
Purchase loan
Refinance loan
Page 22 GAO-10-805 Nonprime Mortgages
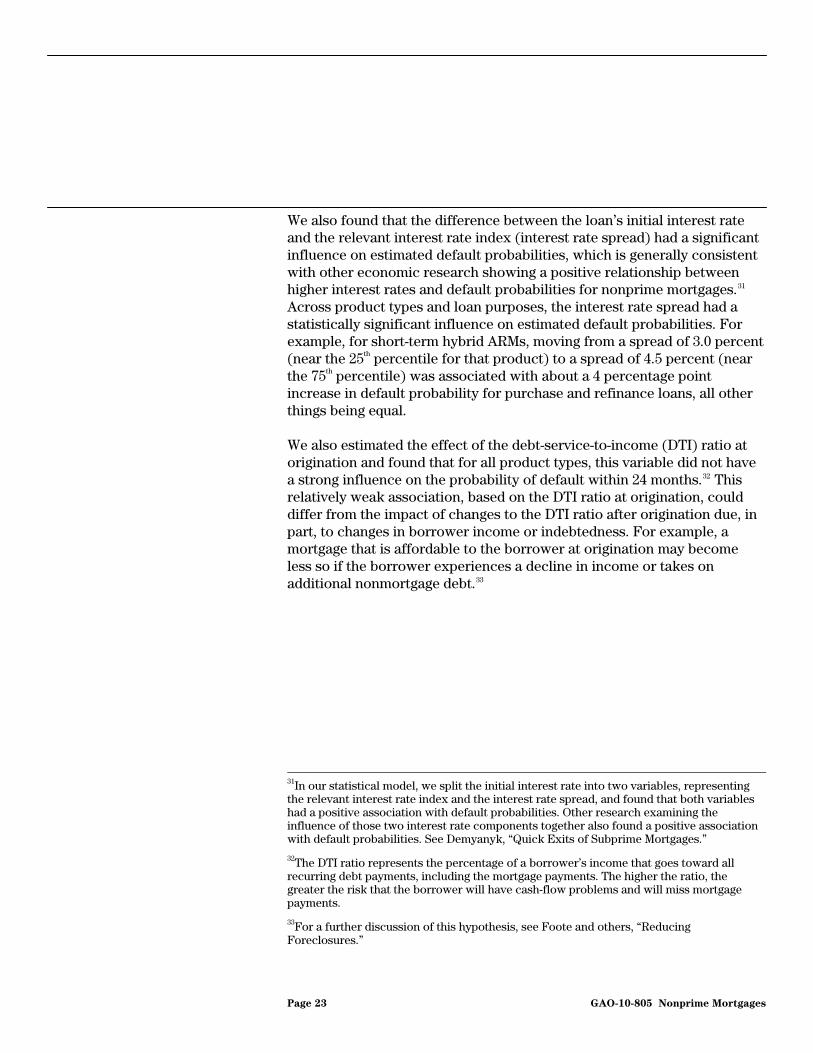
We also found that the difference between the loan’s initial interest rate and the relevant interest rate index (interest rate spread) had a significant influence on estimated default probabilities, which is generally consistent with other economic research showing a positive relationship between higher interest rates and default probabilities for nonprime mortgages.31 Across product types and loan purposes, the interest rate spread had a statistically significant influence on estimated default probabilities. For example, for short-term hybrid ARMs, moving from a spread of 3.0 percent (near the 25th percentile for that product) to a spread of 4.5 percent (near the 75th percentile) was associated with about a 4 percentage point increase in default probability for purchase and refinance loans, all other things being equal.
We also estimated the effect of the debt-service-to-income (DTI) ratio at origination and found that for all product types, this variable did not have a strong influence on the probability of default within 24 months.32 This relatively weak association, based on the DTI ratio at origination, could differ from the impact of changes to the DTI ratio after origination due, in part, to changes in borrower income or indebtedness. For example, a mortgage that is affordable to the borrower at origination may become less so if the borrower experiences a decline in income or takes on additional nonmortgage debt.33
31In our statistical model, we split the initial interest rate into two variables, representing the relevant interest rate index and the interest rate spread, and found that both variables had a positive association with default probabilities. Other research examining the influence of those two interest rate components together also found a positive association with default probabilities. See Demyanyk, “Quick Exits of Subprime Mortgages.”
32The DTI ratio represents the percentage of a borrower’s income that goes toward all recurring debt payments, including the mortgage payments. The higher the ratio, the greater the risk that the borrower will have cash-flow problems and will miss mortgage payments.
33For a further discussion of this hypothesis, see Foote and others, “Reducing Foreclosures.”
Page 23 GAO-10-805 Nonprime Mortgages
Loans originated with limited documentation of borrowers’ income or assets became prevalent in the nonprime mortgage market, particularly in the Alt-A market segment. We found that documentation of borrower income and assets influenced the probability of default of nonprime loans originated from 2004 through 2006. For purchase and refinance loans of all product types, limited documentation of income and assets was associated with a 1 to 3 percentage point increase in the estimated probability of default, all other things being equal. Our results are generally consistent with prior research showing an association between a lack of documentation and higher default probabilities.34
Level of Income Documentation Influenced Default Probabilities, and Associations between Income and Defaults Varied by Product Type, Loan Purpose, and Documentation Level
Because our data indicated that borrowers with full documentation loans had different reported risk characteristics (e.g., credit score, CLTV ratio, and reported income) than borrowers with limited documentation loans, we more closely explored the relationship between documentation level and default for short-term hybrid ARMs (the most common nonprime product) taking these differences into account. On average, short-term hybrid ARM purchase loans with limited documentation went to borrowers with higher credit scores, higher reported incomes, and somewhat lower CLTV ratios, compared with borrowers who had full documentation loans.35 To account for these differences, we estimated default probabilities separately for borrowers with full and limited documentation loans, using the mean credit score, reported income, and CLTV ratio values specific to each group.36 Using this method, the expected default probability for the limited documentation group was 3 percentage
34Anthony Pennington-Cross and Giang Ho, “The Termination of Subprime Hybrid and Fixed Rate Mortgages,” Federal Reserve Bank of St. Louis Working Paper Series,
no. 2006-042A (July 2006); Danis and Pennington-Cross, “The Delinquency of Subprime Mortgages”; and Haughwout, Peach, and Tracy, “Juvenile Delinquent Mortgages: Bad Credit or Bad Economy?.”
35This pattern reflects the fact that loans with limited documentation of income were typically associated with the Alt-A market, which serves borrowers with credit histories better than those of subprime borrowers.
36To produce these estimates we used a statistical model similar to the one used to produce the other estimates in this report, except that the model excluded the documentation variable. We estimated default probabilities separately for loans with and without full documentation using the documentation-level-specific means for credit score, reported income, and CLTV ratio and the mean values for all loans for all other variables. The mean loan amount was higher for loans with limited documentation (about $265,000) than for loans with full documentation (about $200,000). To control for the tendency of the higher loan amount to increase the default risk for loans with limited documentation, we used the mean loan amount for all loans (about $230,000) in this example.
Page 24 GAO-10-805 Nonprime Mortgages
points lower than for the full documentation group, reflecting their better reported risk characteristics. However, in reality, borrowers with limited documentation loans had a 5 percentage point higher default rate than borrowers with full documentation loans. The differences between the estimated and actual default probabilities for these borrowers suggest that the reported risk characteristics—particularly income—may be misstated, or that other unobserved factors may be associated with the use of the limited documentation feature. For example, mortgage originators or borrowers may have used the limited documentation feature in some cases to overstate the financial resources of borrowers and qualify them for larger, potentially unaffordable loans. In addition, borrowers who used the feature could have experienced decreases in their income after loan origination, thereby making it more difficult for them to stay current on their payments.
We also found that the influence of borrowers’ reported income varied by product type and loan purpose and, in some cases, depended on whether the loan had full documentation. For example, for short-term hybrid ARMs used for home purchases and refinancing, moving from $60,000 to $100,000 in reported income was associated with an 1 percentage point decrease in the estimated default probability for loans with full documentation, all else being equal (see fig. 10). However, for loans with limited documentation, the same change in reported income was associated with a slight increase (0.2 percentage points) in estimated default probability for purchase loans and a small decrease (0.5 percentage points) for refinance loans. For fixed-rate mortgages used for purchase and refinancing, moving from $60,000 to $100,000 in reported income was associated with small decreases in estimated default probabilities for both full and limited documentation loans, although the decreases were slightly smaller for loans with limited documentation. For longer-term ARMs, moving from the lower to the higher income level generally did not affect the estimated default probabilities for purchase or refinance loans, regardless of the level of documentation.
Page 25 GAO-10-805 Nonprime Mortgages

Figure 10: Estimated Probability of Nonprime Mortgages Defaulting within 24 Months under Different Reported Income Assumptions for Borrowers with and without Full Documentation, 2004 through 2006 Loans
Short-termhybrid ARMs
Documentation ofborrower incomeand assets
Incomeassumption(in thousands)
Estimated probability of default
Full
Limited
Full
Limited
Full
Limited
Full
Limited
Full
Limited
Longer-termARMs
Fixed-ratemortgages
Full
Limited
$100
100
100
100
100
100
100
100
100
100
100
100
$60
60
60
60
60
60
60
60
60
60
60
60
15.0
20.8
10.0
14.2
3.0
5.9
2.4
4.9
3.3
6.0
3.3
5.8
16.0
20.6
11.3
14.7
3.1
5.8
2.4
4.8
3.6
6.2
3.8
5.9
%
%
Source: GAO analysis of CoreLogic LP, HMDA, FHFA, Census, and BLS data.
Purchase loan
Refinance loan
Note: This figure compares the estimated probability of default assuming different levels of reported income, with all other variables for each product type and loan purpose being equal. The results presented in this figure are for owner-occupants.
Page 26 GAO-10-805 Nonprime Mortgages
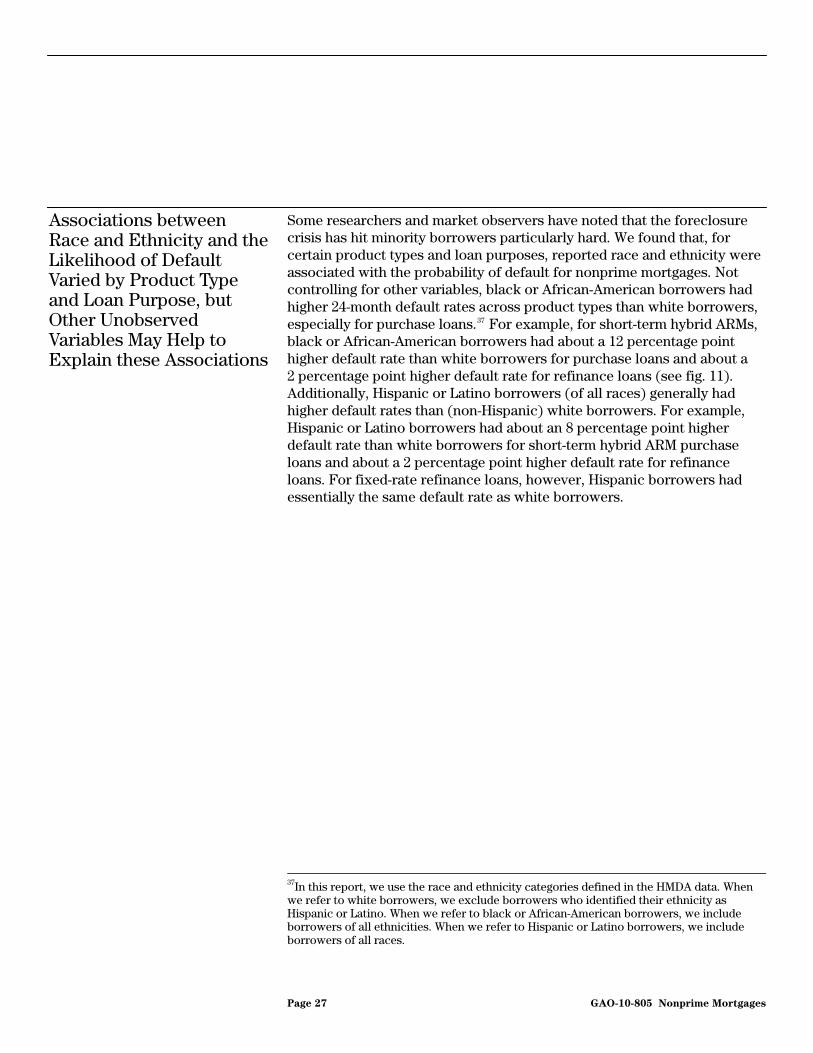
Some researchers and market observers have noted that the foreclosure crisis has hit minority borrowers particularly hard. We found that, for certain product types and loan purposes, reported race and ethnicity were associated with the probability of default for nonprime mortgages. Not controlling for other variables, black or African-American borrowers had higher 24-month default rates across product types than white borrowers, especially for purchase loans.37 For example, for short-term hybrid ARMs, black or African-American borrowers had about a 12 percentage point higher default rate than white borrowers for purchase loans and about a 2 percentage point higher default rate for refinance loans (see fig. 11). Additionally, Hispanic or Latino borrowers (of all races) generally had higher default rates than (non-Hispanic) white borrowers. For example, Hispanic or Latino borrowers had about an 8 percentage point higher default rate than white borrowers for short-term hybrid ARM purchase loans and about a 2 percentage point higher default rate for refinance loans. For fixed-rate refinance loans, however, Hispanic borrowers had essentially the same default rate as white borrowers.
Associations between Race and Ethnicity and the Likelihood of Default Varied by Product Type and Loan Purpose, but Other Unobserved Variables May Help to Explain these Associations
37In this report, we use the race and ethnicity categories defined in the HMDA data. When we refer to white borrowers, we exclude borrowers who identified their ethnicity as Hispanic or Latino. When we refer to black or African-American borrowers, we include borrowers of all ethnicities. When we refer to Hispanic or Latino borrowers, we include borrowers of all races.
Page 27 GAO-10-805 Nonprime Mortgages
Figure 11: Default Rates for Nonprime Mortgages 24 Months after First Payment, by Race and Ethnicity, Not Controlling for Other Variables, 2004 through 2006 Loans
Short-termhybrid ARMs
Longer-termARMs
Fixed-ratemortgages
Default rate, by race and ethnicity
White Black or African-American Hispanic or Latino
17.6
14.9
6.7
7.3
6.4
7.0
% 31.0
16.6
16.8
11.7
19.6
9.6
25.5
17.2
23.7
15.6
12.8
7.1
% %
Source: GAO analysis of CoreLogic LP and HMDA data.
Purchase loan
Refinance loan
Note: The White category excludes people who identified their ethnicity as Hispanic or Latino. The Black or African-American category includes people of all ethnicities. The Hispanic or Latino category includes people of all races. The results presented in this figure are for owner-occupants.
Various factors may help to explain some of the observed differences in the default rates between racial and ethnic groups. Across product types, black or African-American borrowers had lower average credit scores and reported incomes than white and Hispanic or Latino borrowers. Also, black or African-American borrowers generally were more likely than white borrowers to have CLTV ratios of 90 percent or more. For short-term hybrid ARMs and longer-term ARMs, black or African-American and Hispanic or Latino borrowers were less likely to have loans that originated in 2004, when house price appreciation was still strong in many parts of the country. In addition, Hispanic or Latino borrowers had a higher incidence of limited documentation loans and were concentrated in California, where house price declines in a number of areas were particularly severe.
Controlling for these variations, we found that the differences in estimated default probabilities by racial and ethnic group were still significant but considerably smaller than the actual observed differences (i.e., the differences without the statistical controls in place). Taking short-term hybrid ARMs used for home purchases as an example, when we estimated default probabilities by racial and ethnic group holding the other variables in our model to the mean values for each group, we found that the estimated default probability for black or African-American borrowers was about 7 percentage points higher than for white borrowers, compared
Page 28 GAO-10-805 Nonprime Mortgages

with the observed 12 percentage point difference that we have previously discussed (see fig. 12).38 Using the same assumptions, the corresponding default probability for Hispanic or Latino borrowers was about 4 percentage points higher than for white borrowers. For short-term hybrid ARMs used for refinancing, black or African-American borrowers had only about a 1 percentage point higher estimated default probability than white borrowers, while Hispanic or Latino borrowers had about the same estimated default probability as white borrowers.
d about the same estimated default probability as white borrowers.
Figure 12: Estimated Probability of Nonprime Mortgages Defaulting within 24 Figure 12: Estimated Probability of Nonprime Mortgages Defaulting within 24 Months, by Borrower Race and Ethnicity, 2004 through 2006 Loans
Short-termhybrid ARMs
Longer-termARMs
Fixed-ratemortgages
Estimated probability of default, by borrower race and ethnicity
White Black or African-American Hispanic or Latino
15.5
11.7
3.1
3.0
3.6
4.0
% 22.6
12.8
7.3
5.9
10.0
6.4
19.7
11.9
11.8
6.3
6.7
3.7
% %
Source: GAO analysis of CoreLogic LP, HMDA, FHFA, Census, and BLS data.
Purchase loan
Refinance loan
Note: The White category excludes people who identified their ethnicity as Hispanic or Latino. The Black or African-American category includes people of all ethnicities. The Hispanic or Latino category includes people of all races. The results presented in this figure are for owner-occupants. We estimated the default probability for each group of borrowers setting all variables to their mean values for the respective group.
Inferences drawn from these statistical results should be viewed with caution because we lack data for variables that may help to explain the remaining differences in estimated default probabilities between borrowers of different racial and ethnic groups. Unobserved factors that may influence the likelihood of default may also be associated with race and ethnicity. For example:
38To produce these estimates, we used a statistical model similar to the one we used to produce the other estimates in this report, except that the model excluded the race and ethnicity variables. We estimated default probabilities separately for white, black or African-American, and Hispanic or Latino borrowers using the mean values for all variables for the respective group.
Page 29 GAO-10-805 Nonprime Mortgages
• First-time homebuyer: We could not determine which nonprime borrowers were first-time homebuyers, but other evidence suggests that members of minority groups are disproportionately first-time homebuyers.39 To the extent that black or African-American and Hispanic or Latino borrowers with purchase loans were disproportionately first-time homebuyers, their higher estimated default probabilities may partly reflect limited experience with the risks and costs of homeownership. As shown in figure 12, we found that the differences in estimated default rates between racial and ethnic groups were much smaller for nonprime refinance loans—which, by definition, exclude first-time homebuyers—than they were for purchase loans.
• Employment status: We did not have data on the employment status of nonprime borrowers, but unemployment rates are generally higher for black or African-American and Hispanic or Latino workers than for white workers.40 The higher estimated default probabilities that we found for black or African-American and Hispanic or Latino borrowers may reflect that nonprime borrowers from minority groups were disproportionately affected by unemployment in recent years.
• Wealth: Although we obtained data on reported income by matching CoreLogic LP and HMDA records, we did not have information on nonprime borrowers’ savings or other assets, which may affect their ability to keep up with their mortgage payments if faced with job loss or other unexpected changes in income or expenses. However, according to the Survey of Consumer Finances, nonwhite and Hispanic families generally are less likely to save or hold financial assets than non-Hispanic white families.41 Furthermore, the median value of assets for nonwhite and
39For example, among owner-occupants, about 60 percent of black homeowners and 55 percent of Hispanic homeowners were first-time buyers, compared with 40 percent of all homeowners in 2007, according to the American Housing Survey. See U.S. Census Bureau, Current Housing Reports series H150/07, American Housing Survey for the
United States: 2007 (Washington, D.C.: 2008), p. 158.
40In 2006, for example, the average unemployment rate was 8.9 percent for the black or African-American civilian population, 5.2 percent for the Hispanic population, and 4.0 percent for the white population, according to BLS.
41For example, in 2007, 51 percent of nonwhite and Hispanic families reported that they had saved in the preceding year and 87 percent reported owning any financial assets; the corresponding percentages for non-Hispanic white families were 59 percent and 98 percent, respectively. See Brian K. Bucks and others, “Changes in U.S. Family Finances from 2004 to 2007: Evidence from the Survey of Consumer Finances,” Federal Reserve
Bulletin (February 2009).
Page 30 GAO-10-805 Nonprime Mortgages

Hispanic families having financial assets is dramatically less than for non-Hispanic white families.42
• Origination channel or lender steering to higher-cost or riskier loans:
We did not have data on whether the nonprime loans were originated by mortgage brokers (intermediaries between borrowers and lenders) or directly by a lender’s retail branch, or how the loans were marketed to the borrowers. Some evidence suggests that broker-originated loans were associated with higher default rates and that, at least in some markets, minority families were more likely to access the mortgage market through brokers rather than through retail lenders.43 In addition, some researchers and market observers have raised concerns that some nonprime loan originators used questionable marketing tactics in lower-income and minority neighborhoods.44 Such practices may have led borrowers to take out higher-cost or riskier loans than necessary, which may have increased their probability of default.
42In 2007, the median assets for nonwhite and Hispanic families having any assets was $9,000, compared with $44,000 for non-Hispanic white families, according to the Survey of
Consumer Finances.
43William P. Alexander and others, “Some Loans Are More Equal than Others: Third-Party Originations and Defaults in the Subprime Mortgage Industry,” Real Estate Economics,
vol. 30 (2002); and Carolina Reid and Elizabeth Laderman, “The Untold Costs of Subprime Lending: Examining the Links among Higher-Priced Lending, Foreclosures and Race in California,” (a paper presented at the Institute for Assets and Social Policy, Brandeis University, April 2009).
44William C. Apgar and Allegra Calder, “The Dual Mortgage Market: The Persistence of Discrimination in Mortgage Lending,” in The Geography of Opportunity: Race and
Housing Choice in Metropolitan America, ed. Xavier deSousa Briggs (Washington, D.C.: Brookings Institution Press, 2005).
Page 31 GAO-10-805 Nonprime Mortgages
Available Nonprime Mortgage Data Sources Provide Useful Information but Have Constraints That May Be Addressed, in Part, by Ongoing Efforts
Several Private and Public Sector Data Sources Cover Nonprime Loans
Mortgage market participants, financial regulators, investors, and public policy analysts use mortgage data for a variety of purposes. Some of the broad uses of such data include monitoring and modeling the performance of mortgages and mortgage-backed securities, assessing the soundness of financial institutions with mortgage-related holdings, and examining fair lending and consumer protection issues. For example, in a 2009 report, we used loan-level mortgage data to assess the implications of proposed mortgage reform legislation on consumer protections and on the availability of mortgage credit.45 Existing sources of data on nonprime mortgages contain a range of information to support these different uses. Loan-level data with broad national coverage of the nonprime market segment are available from several sources: four mortgage databases (three maintained by private firms and one by the federal government) and two major credit reporting agencies.46 For comparison, we also reviewed information on a HUD database of FHA-insured mortgages, because the borrower populations served by FHA and the nonprime market earlier in the decade had some similarities (e.g., relatively low credit scores) and the database is rich in detail.
• CoreLogic LP Asset-Backed Securities (ABS) Database: A private sector database of nonprime loans that contains information on nonagency
45GAO-09-741.
46As we have previously noted, we focused on data sources that are widely available. As a result, we did not include proprietary data maintained by lending institutions and other mortgage market participants in our scope.
Page 32 GAO-10-805 Nonprime Mortgages

securitized mortgages in subprime and Alt-A pools.47 The data are supplied by a number of different parties, including loan servicers; broker-dealers; and security issuers, trustees, and administrators.
• CoreLogic LP Loan Level Servicing (LLS) database: A private sector database of prime, nonprime, and government-guaranteed mortgages that contains data supplied by participating loan servicers.48 The mortgages include loans in agency and nonagency securitizations and loans held in lenders’ portfolios.49
• Lender Processing Services (LPS) Loan Level Data: Similar to the LLS database, this private sector database contains data supplied by participating loan servicers on prime, nonprime, and government-guaranteed mortgages, including loans in agency and nonagency securitization and loans held in lenders’ portfolios.
• Consumer credit file data: Two national credit reporting agencies—both private firms—provide anonymous data from consumer credit files that include information on prime, nonprime, and government-guaranteed mortgages.
• FFIEC HMDA data: A federal government database that contains information reported by lenders on about 80 percent of all mortgages funded each year, including nonprime loans.
• HUD Single Family Data Warehouse (SFDW): A federal government database with information on mortgages insured by FHA.50
47As we have previously explained, nonagency securitized loans are nonconforming conventional mortgages securitized primarily by investment banks. Nonconforming mortgages are those that do not meet the purchase requirements of Fannie Mae or Freddie Mac because they are too large or do not meet their underwriting criteria.
48The prime market segment serves borrowers with strong credit histories and provides the most attractive interest rates and mortgage terms. The government-guaranteed market segment primarily serves borrowers who may have difficulty in qualifying for prime mortgages but features interest rates competitive with prime loans in return for payment of insurance premiums or guarantee fees. FHA and the Department of Veterans Affairs operate the two main federal programs that insure or guarantee mortgages.
49Agency securitized loans are conforming conventional mortgages that meet the requirements for purchase and securitization by Fannie Mae or Freddie Mac.
50HUD provides aggregated and some loan-level data on its Web site (see http://www.hud.gov/offices/hsg/hsgrroom.cfm (accessed July 6, 2010) and https://entp.hud.gov/sfnw/public/ (accessed July 6, 2010)).
Page 33 GAO-10-805 Nonprime Mortgages

Among the data sources that include nonprime mortgages, the private databases and extracts of credit file data can be licensed or purchased for a fee. Recent HMDA data can be acquired at no charge. Some of these data may be subject to use restrictions determined by the provider. The private companies and credit reporting agencies update data on a daily or monthly basis and provide the updated data to users within 1 month or upon request. HMDA data are updated annually with a lag of 9 months.51
While these data sources currently offer some similar data elements, the sources vary in their coverage of loan, property, and borrower attributes.52 In part, this variation reflects the different primary purposes of the data sets. For example, the HMDA database is intended to provide the public with loan data that can assist in identifying potential risks for discriminatory patterns to help enforce antidiscrimination laws and evaluate bank community reinvestment initiatives. Accordingly, the HMDA data provide relatively detailed information about mortgage borrowers but no information about the performance of the loans. By contrast, the CoreLogic LP and LPS databases offer performance data to support the benchmarking and analysis of loans or mortgage-backed securities. Figure 13 presents some of the available data elements, with a focus on data that may assist in evaluating the probability of mortgage default and differences in mortgage outcomes across demographic groups.53 All of the nonprime data sources report on loan amount. The sources vary in their coverage of other loan attributes, such as mortgage type and performance status. All of the nonprime data sources report the property location at the ZIP code or Census-tract level, while coverage of other property attributes, such as property type and appraised value, varies. In the category of borrower attributes, all but one of the nonprime data sources provide borrower credit score at loan origination and owner-occupancy status. Among the nonprime data sources, only the HMDA data and credit reporting agency data provide additional demographic information on borrowers.
51For example, HMDA data on mortgages made in 2009 are not available until September 2010. HMDA data can be ordered through the FFIEC Web site (see http://www.ffiec.gov/hmda/ (accessed July 6, 2010)).
52The data sources may have different definitions for certain data elements. Some data fields in the HMDA database may be unavailable to the public to protect borrowers’ privacy, and some data fields in nonprime data sources may not be well populated.
53Information in figure 13 is current as of July 2010. The availability of different data elements may change over time. The data elements shown in the figure are those available to data users outside of the companies or agencies that maintain the data.
Page 34 GAO-10-805 Nonprime Mortgages

Figure 13: Examples of Available Data in Selected Mortgage Data Sources
xxxxx x
xxxxx x
xxxxx xxxxxx xxxxxx x
xxxxx x
xxxxx x
Source: GAO analysis of information provided by CoreLogic LP, LPS, Experian, Equifax, FFIEC, and HUD.
CoreLogic LP LPS Equifax and Experiana FFIEC HUD
LLS(Prime, nonprime, and
government-guaranteedmortgages serviced byparticipating servicers)
ABS(Nonagency
securitized mortgagesin subprime
and Alt-A pools)
Loan Level Data(Prime, nonprime, and
government-guaranteedmortgages serviced byparticipating servicers)
Credit file information(Prime, nonprime, and
government-guaranteedmortgages as reported
to credit reportingagencies by lendersand loan servicers)
HMDA(Prime, nonprime, and
government-guaranteedmortgages originatedby lenders required
to report)
SFDW(FHA-insuredmortgages)
Loan attributes
Appraised value at originationor sale price
Investor or owner-occupant
Loan status (e.g.,delinquent, in foreclosure)
Loan start dateb
Race and ethnicity
Reported income
Sex
First-time homebuyer
Age or date of birth
Property type (e.g., singleunit, multiunit)
Credit score at loanorigination
Loan-to-value ratioat loan origination
Product type (e.g., fixedor adjustable rate)
Debt service-to-incomeratio
Outstanding loan balance
Initial interest rate
Loan purpose (i.e.,purchase or refinance)
Loan amount
Lowest level geographicindicator
ZIP code ZIP code ZIP code ZIP code
Estimates of incomeare available
Census tract ZIP code
Property attributes
Borrower attributes
xxxxx xxxxxx xxxxxx xxxxxx xxxxxx xxxxxx xxxxxx xxxxxx x
xxxxx xxxxxx x
xxxxx x
May be imputed fromborrower’s credit account
history
aFor all data elements, an “X” indicates that both credit reporting agencies provide the information, and a blank cell indicates that neither agency provides the information. Analysts may be able to calculate values for some data elements without an “X,” such as LTV and DTI ratios, depending on the availability of supplemental or estimated information.
Page 35 GAO-10-805 Nonprime Mortgages

bLoan start date represents either the loan origination date or, for the credit reporting agencies, the date that the credit account was opened. The specificity of the loan start date varies by data source. The publicly available HMDA data provide the year only, and the credit reporting agencies and one other source provide at least the month and year. The remaining two nonprime data sources provide the day, month, and year; but for some loans, the origination date is imputed from the date of the first loan payment.
Several other sources of mortgage data provide useful information about the mortgage market, including nonprime loans, but do not provide loan-level detail or, in some cases, lack broad national data coverage. For example, the Mortgage Bankers Association’s National Delinquency Survey provides quarterly summary statistics on the performance of the overall mortgage market and different market segments, including subprime loans. RealtyTrac offers data on the number of properties in some stage of the foreclosure process but not data on all active loans. Additionally, federal banking regulators and the government-sponsored enterprises produce free or comparatively low-cost data that are typically aggregated and only cover mortgages within their regulatory jurisdiction.
Limitations in Data Sources Constrain Analysis of Some Aspects of Nonprime Mortgages
Although the selected data sources that include nonprime mortgages contain important loan, property, and borrower characteristics, the sources have a number of constraints. First, the data sources generally lack information on certain attributes that could help inform policy decisions or regulatory efforts to mitigate risk, including the following:
• Loan attributes: Although three of the five nonprime data sources provide information on the initial interest rates of the mortgages (and, in some cases, how those interest rates can change over the life of the loan), they do not provide information on other mortgage costs, such as points and fees paid at loan closing.54 For example, one study that found no evidence of adverse pricing of subprime loans by race, ethnicity, or gender noted that an important caveat to the analysis was the lack of data on points and fees.55 Consequently, data users have limited ability to evaluate the
54The HMDA data, however, do provide information on the spread between the annual percentage rate—a measure of credit cost to the borrower that takes account of the interest rate, points, and certain lender charges—and the rate on Treasury securities of comparable maturity for loans with prices above designated thresholds. A point is a loan charge, usually paid at loan closing, expressed as a percentage of the loan amount (1 point is 1 percent of the loan balance).
55The study examined pricing in terms of interest rates for subprime loans originated from 2004 through 2006. See Andrew Haughwout, Christopher Mayer, and Joseph Tracy, “Subprime Mortgage Pricing: The Impact of Race, Ethnicity, and Gender on the Cost of Borrowing,” Federal Reserve Bank of New York Staff Paper No. 368 (April 2009).
Page 36 GAO-10-805 Nonprime Mortgages
influence of loan costs on default probabilities or to examine fair lending concerns regarding loan pricing. In addition, while the CoreLogic LP LLS and LPS Loan Level Data databases indicate whether a mortgage was originated by a broker or directly by a lender’s retail branch, the other data sources do not. As we have previously noted, some research has suggested associations between origination channel and mortgage performance.
• Borrower attributes: A number of borrower characteristics that may be associated with default risk generally does not appear in the nonprime data sources we reviewed. For example, first-time homebuyers are not directly identified in any of the nonprime data sources, limiting the ability of analysts to compare the marginal effect of prior homeownership experience on default probabilities. (By comparison, SFDW identifies first-time homebuyers with FHA-insured mortgages and contains data on loan performance.) In addition, none of the nonprime data sources contain information on borrower wealth (savings and other assets), a factor that could affect a borrower’s ability to continue making mortgage payments in times of economic stress. With the exception of the credit reporting agencies, the data sources also do not always directly provide information on the amount of borrowers’ other mortgage debt (second liens), which may constrain accurate assessment of the relationship between home equity and default.56 Similarly, data on nonmortgage credit obligations are unavailable, except from the credit reporting agencies, which may limit researchers’ understanding of how borrowers’ total debt burden affects the mortgages they obtain and their ability to meet mortgage obligations. Also, the data sources lack information on borrower life events that may influence the probability of mortgage default, such as job loss or divorce.
A second type of constraint is that analysts may not be able to generalize their results to the entire nonprime market because certain data sources do not cover all segments of the market and some mortgage originators, securitizers, or servicers do not contribute information. For example, the CoreLogic LP ABS database contains information on a large majority of nonprime mortgages that were securitized but not those that lenders hold
56CoreLogic LP offers a separate data product that provides information on other mortgage debt. HMDA data contain records on first and junior liens but do not identify whether two or more loans are related to the same property. However, using a record-matching process, it is possible to identify pairs of loans used to finance the same property. See GAO, Federal
Housing Administration: Decline in the Agency’s Market Share Was Associated with
Product and Process Developments of Other Mortgage Market Participants, GAO-07-645 (Washington, D.C.: June 29, 2007).
Page 37 GAO-10-805 Nonprime Mortgages

in their portfolios. As we have previously noted, researchers have found that nonprime mortgages that were not securitized may have less risky characteristics than those that were securitized. Private sector databases that contain information on both securitized and nonsecuritized mortgages (CoreLogic LP LLS and LPS Loan Level Data) cover the majority of the market but do not provide complete market coverage because not all servicers contribute information to the databases. Similarly, because mortgage originators located outside of metropolitan areas are not required to report their loan information, the HMDA data do not capture many mortgages made in rural areas. By contrast, the credit reporting agencies have broader market coverage but lack data on key mortgage attributes, such as loan type and purpose.
The third constraint we identified is that the existing nonprime data sources cannot readily be combined to create a single database with a more comprehensive set of variables. Merging data sources enables researchers to more thoroughly analyze lending patterns and factors influencing loan performance. However, due to competition and privacy concerns, the selected data sources either elect not to provide or are restricted from providing certain key fields that could be used to merge databases, such as the property address. For example, to match loan records in the CoreLogic LP ABS database and HMDA data, we relied in part on loan origination date fields that are not publicly released due to privacy concerns.57 Even with the origination date fields, we could not match all of the CoreLogic LP records to HMDA records.
Finally, a user of existing data sources may have the ability to track some specific loans over time but may not easily track a specific borrower or property. Tracking a specific borrower or property over time would
57We requested and obtained the date fields from FFIEC, which compiles and publishes the HMDA data, to conduct studies requested by Congress. Under GAO’s disclosure regulations, set forth at 4 C.F.R. Part 81, we do not provide members of the public with records that originate in another agency obtained in connection with our work. Instead, we refer members of the public requesting information to the agency that originated the record. 4 C.F.R. § 81.5(a). Additionally, under our regulations, we do not disclose to the public records containing confidential financial information, see 4 C.F.R. § 81.6(e), nor do we disclose records containing private or personal information, which, if disclosed to the public, would amount to a clearly unwarranted invasion of the privacy of a person, see 4 C.F.R. § 81.6(f).
Page 38 GAO-10-805 Nonprime Mortgages

provide insights into mortgage outcomes throughout a homeownership experience, even if a borrower refinances into a new mortgage.58
Ongoing Federal Efforts May Address Some Constraints in Mortgage Data Sources
Ongoing federal efforts could provide data on the entire mortgage market that potentially would not have some of the constraints that we identified in the existing sources of mortgage data. First, officials from the Board of Governors of the Federal Reserve System (Federal Reserve Board) and Freddie Mac are collaborating on a pilot project to develop a publicly available National Mortgage Database (NMDB). The officials are exploring the feasibility of developing a federally funded, loan-level, and representative database of first-lien mortgages designed to address mortgage-related policy, finance, and business concerns. NMDB would compile data on a representative sample of outstanding mortgages from a national credit reporting agency, supplement those data by matching records to existing mortgage databases (such as the HMDA data), and obtain data unavailable in any existing databases through a survey of borrowers. Since NMDB would include data from a variety of sources, it would provide more comprehensive data on the first-lien mortgage market than are currently available. If implemented, the combined database would contain loan-level information on (1) mortgage terms; (2) mortgage performance from origination to termination; (3) borrowers’ other credit circumstances over the life of the loan; (4) borrower demographics; and (5) other borrower attributes, such as key life events and shopping behavior.
Second, the Dodd-Frank Wall Street Reform and Consumer Protection Act provides for additional compilation of HMDA data, such as borrower age and credit score, loan origination channel, and—as the Bureau of Consumer Financial Protection deems appropriate—a unique identifier for the loan originator and a universal loan identifier.59 Additionally, the act includes the creation of a publicly available Default and Foreclosure database that would include Census tract-level information on the number and percentage of mortgages delinquent for more than 30 and 90 days,
58Some firms offer databases that draw on public records and may be used to track properties or borrowers over time. For example, researchers used historical registry of deeds records for the entire state of Massachusetts to track homeownership experiences of subprime borrowers. See Kristopher Gerardi, Adam Hale Shapiro, and Paul S. Willen, “Subprime Outcomes: Risky Mortgages, Homeownership Experiences, and Foreclosures,” Federal Reserve Bank of Boston Working Paper No. 07-15 (May 2008).
59Pub. L. No. 111-203, 124 Stat. 1376 (July 21, 2010).
Page 39 GAO-10-805 Nonprime Mortgages
real-estate-owned properties, mortgages in the foreclosure process, mortgages with negative equity, and other information. If implemented, the universal loan identifier could facilitate matching among mortgage databases, and the HMDA data would become more comprehensive.
The growth of the nonprime market earlier in this decade was accompanied by a shift toward increasingly risky mortgage products. Nonprime loans provided homeownership and refinancing opportunities that may have benefited many households. However, many nonprime loans had features or were underwritten to standards that made them vulnerable to default and foreclosure, particularly in recent years when house prices began to stagnate and decline and economic conditions eroded more broadly. As a result, millions of nonprime borrowers have lost their homes or are in danger of doing so. These issues have particular salience for minority borrowers, who have experienced particularly high default rates.
Observations
The persistently weak performance of nonprime mortgages suggests that loan performance problems in the nonprime market will not be resolved quickly, and underscores the importance of federal efforts to assist distressed borrowers and prevent a recurrence of the aggressive lending practices that helped precipitate the foreclosure crisis. As lawmakers seek to reform mortgage lending practices, they will need to consider how their efforts may affect consumer protections, the availability of mortgage credit, and progress toward the goal of sustainable homeownership.
Data on the performance of nonprime loans and on the borrowing and lending practices associated with them can help analysts and policymakers assess the potential effects of proposed reforms and evaluate the results of their implementation. Although extensive data are available on nonprime loans, no one data source is comprehensive. Existing data sources can be combined with effort, but even then certain data that could inform understanding of the nonprime market—such as total mortgage costs and first-time homebuyer status—are not readily available. Having access to a more comprehensive set of data might have enhanced the ability of researchers, regulators, and investors to monitor lending practices, evaluate mortgage performance, and assess the mortgage outcomes for different groups of borrowers. Ongoing federal efforts, including the NMDB pilot project, may improve the quality and availability of mortgage market data going forward.
Page 40 GAO-10-805 Nonprime Mortgages

As agreed with your offices, unless you publicly announce its contents earlier, we plan no further distribution of this report until 30 days from the report date. At that time, we will send copies of this report to the appropriate congressional committees and other interested parties. In addition, the report will be made available at no charge on GAO’s Web site at http://www.gao.gov.
If you or your staffs have any questions about this report, please contact me at (202) 512-8678 or [email protected]. Contact points for our Offices of Congressional Relations and Public Affairs may be found on the last page
William B. Shear
of this report. Key contributors to this report are listed in appendix III.
Director, Financial Markets Investment and Community
Page 41 GAO-10-805 Nonprime Mortgages
Appendix I: Description of the Econometric
Analysis of Nonprime Mortgage Default
Probabilities
Appendix I: Description of the Econometric Analysis of Nonprime Mortgage Default Probabilities
This appendix describes the econometric model we developed to examine the relationship between variables representing loan attributes, borrower characteristics, and economic conditions and the probability of a nonprime loan entering default within 24 months after the first loan payment. Certain loan attributes and borrower characteristics have been associated with a higher risk of mortgage default. For example, lower down payments, lower borrower credit scores, and limited documentation of borrowers’ income and assets have been cited as increasing the risk of default. Economic conditions, such as house price changes, have also been associated with default risk.
Since minority borrowers have accounted for a larger share of the nonprime mortgage market than the mortgage market as a whole, associations between race and ethnicity and nonprime mortgage performance also are of interest. However, data limitations have complicated efforts to analyze the demographic characteristics of nonprime borrowers, such as race, ethnicity, and income. Existing data sets either provide detailed information about nonprime loans but limited information about the borrowers (e.g., CoreLogic LoanPerformance (CoreLogic LP) data) or provide more extensive information about borrowers but not about loan performance over time (e.g., Home Mortgage Disclosure Act (HMDA) data). To include information on the demographic characteristics of nonprime borrowers in our model, we matched records in the CoreLogic LP data to HMDA records. For securitized first-lien nonprime loans originated from 2004 through 2006, we achieved a match rate of approximately 73 percent, representing about 6.9 million records. (App. II contains a more detailed discussion of our methodology.)
Of all the CoreLogic LP records that we matched to HMDA records, we used those for which the associated property was located in an area covered by the Federal Housing Finance Agency’s (FHFA) house price indexes (HPI) for metropolitan areas, approximately 92 percent of loans.1 Based on each associated property’s state and Census tract, we also incorporated employment data from the Bureau of Labor Statistics (BLS) and data from the 2000 Census to control for various economic conditions and neighborhood characteristics. For each loan, we determined the performance status 24 months after the month of the first payment. We
1We used the FHFA metropolitan HPIs, which are broad measures of the movement of single-family house prices in 384 metropolitan areas. The HPIs are published by FHFA using home price data provided by Fannie Mae and Freddie Mac on the basis of sales and refinancings of the same properties at different points in time.
Page 42 GAO-10-805 Nonprime Mortgages

Appendix I: Description of the Econometric
Analysis of Nonprime Mortgage Default
Probabilities
defined a loan as being in default if it was delinquent by at least 90 days, in the foreclosure process (including loans identified as in real-estate-owned status), paid off after being 90-days delinquent or in foreclosure, or already terminated with evidence of a loss.
We separately analyzed the three most prevalent types of nonprime loans: short-term hybrid adjustable-rate mortgages (ARM) (ARMs with initial 2- or 3-year fixed-rate periods followed by frequent interest rate adjustments); fixed-rate mortgages; and other longer-term ARMs (ARMs with initial 5-, 7-, or 10-year fixed-rate periods). For each product type, we estimated default probabilities for purchase money loans separately from loans for refinance, and for each product type and loan purpose, we examined separately loans made to owner-occupants and investors. Our primary reason for examining performance by product type, loan purpose, and occupancy status is that borrower incentives and motivations may vary for loans with different characteristics and purposes. For example, because of their early, frequent, and upward interest rate adjustments, short-term hybrid ARMs provide a stronger incentive for a borrower to exit earlier from a mortgage as compared with fixed-rate mortgages or longer-term ARMs. Also, an investor may not react the same way as an owner-occupant may react when facing similar economic circumstances.
We estimated separate default models for each mortgage product type, although the general underlying structure of the models was similar. We used a logistic regression model to explain the probability of loan default, based on the observed pattern of actual defaults and the values of variables representing loan attributes, borrower characteristics, and economic conditions (see table 1). Some variables describe conditions at the time of mortgage origination, such as the loan-to-value (LTV) ratio, the borrower’s credit score, and the borrower’s reported income. Other factors influencing loan performance vary over time in ways that can be observed, or at least approximated. For example, greater house price appreciation (HPA) contributes to greater housing equity, thus reducing the probability that a borrower, if facing financial distress, views defaulting on a loan as a better option than prepaying. More generally, greater house price appreciation creates equity that may induce a borrower to prepay, which eliminates any default risk that would remain if the loan were active. Some potentially significant determinants of mortgage default, such as job loss or illness, are not available for inclusion in our model. In addition, we lack data on certain factors—such as borrower wealth and first-time homebuyer status—that could be especially relevant to explaining actual loan performance.
Page 43 GAO-10-805 Nonprime Mortgages
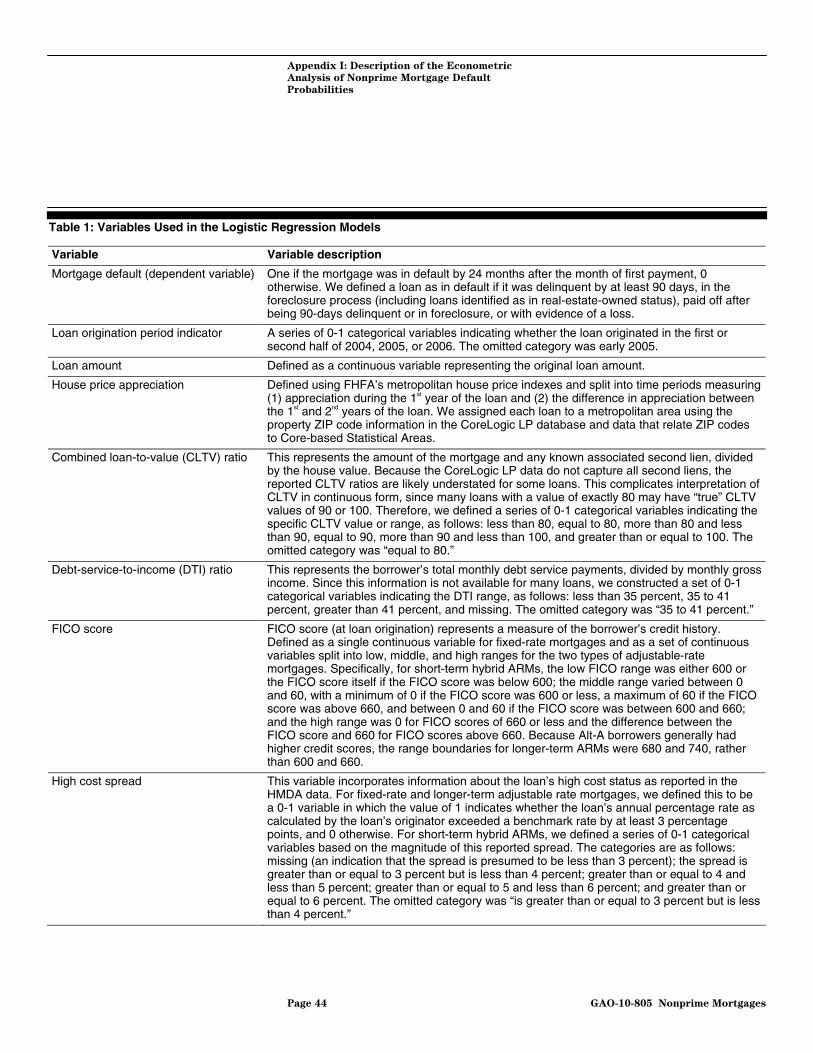
Appendix I: Description of the Econometric
Analysis of Nonprime Mortgage Default
Probabilities
Table 1: Variables Used in the Logistic Regression Models
Variable Variable description
Mortgage default (dependent variable) One if the mortgage was in default by 24 months after the month of first payment, 0 otherwise. We defined a loan as in default if it was delinquent by at least 90 days, in the foreclosure process (including loans identified as in real-estate-owned status), paid off after being 90-days delinquent or in foreclosure, or with evidence of a loss.
Loan origination period indicator A series of 0-1 categorical variables indicating whether the loan originated in the first or second half of 2004, 2005, or 2006. The omitted category was early 2005.
Loan amount Defined as a continuous variable representing the original loan amount.
House price appreciation Defined using FHFA’s metropolitan house price indexes and split into time periods measuring (1) appreciation during the 1st year of the loan and (2) the difference in appreciation between the 1st and 2nd years of the loan. We assigned each loan to a metropolitan area using the property ZIP code information in the CoreLogic LP database and data that relate ZIP codes to Core-based Statistical Areas.
Combined loan-to-value (CLTV) ratio This represents the amount of the mortgage and any known associated second lien, divided by the house value. Because the CoreLogic LP data do not capture all second liens, the reported CLTV ratios are likely understated for some loans. This complicates interpretation of CLTV in continuous form, since many loans with a value of exactly 80 may have “true” CLTV values of 90 or 100. Therefore, we defined a series of 0-1 categorical variables indicating the specific CLTV value or range, as follows: less than 80, equal to 80, more than 80 and less than 90, equal to 90, more than 90 and less than 100, and greater than or equal to 100. The omitted category was “equal to 80.”
Debt-service-to-income (DTI) ratio This represents the borrower’s total monthly debt service payments, divided by monthly gross income. Since this information is not available for many loans, we constructed a set of 0-1 categorical variables indicating the DTI range, as follows: less than 35 percent, 35 to 41 percent, greater than 41 percent, and missing. The omitted category was “35 to 41 percent.”
FICO score FICO score (at loan origination) represents a measure of the borrower’s credit history. Defined as a single continuous variable for fixed-rate mortgages and as a set of continuous variables split into low, middle, and high ranges for the two types of adjustable-rate mortgages. Specifically, for short-term hybrid ARMs, the low FICO range was either 600 or the FICO score itself if the FICO score was below 600; the middle range varied between 0 and 60, with a minimum of 0 if the FICO score was 600 or less, a maximum of 60 if the FICO score was above 660, and between 0 and 60 if the FICO score was between 600 and 660; and the high range was 0 for FICO scores of 660 or less and the difference between the FICO score and 660 for FICO scores above 660. Because Alt-A borrowers generally had higher credit scores, the range boundaries for longer-term ARMs were 680 and 740, rather than 600 and 660.
High cost spread This variable incorporates information about the loan’s high cost status as reported in the HMDA data. For fixed-rate and longer-term adjustable rate mortgages, we defined this to be a 0-1 variable in which the value of 1 indicates whether the loan’s annual percentage rate as calculated by the loan’s originator exceeded a benchmark rate by at least 3 percentage points, and 0 otherwise. For short-term hybrid ARMs, we defined a series of 0-1 categorical variables based on the magnitude of this reported spread. The categories are as follows: missing (an indication that the spread is presumed to be less than 3 percent); the spread is greater than or equal to 3 percent but is less than 4 percent; greater than or equal to 4 and less than 5 percent; greater than or equal to 5 and less than 6 percent; and greater than or equal to 6 percent. The omitted category was “is greater than or equal to 3 percent but is less than 4 percent.”
Page 44 GAO-10-805 Nonprime Mortgages

Appendix I: Description of the Econometric
Analysis of Nonprime Mortgage Default
Probabilities
Variable Variable description
Initial interest rate Defined as a pair of continuous variables that split a loan’s original interest rate into two parts: a relevant Treasury rate at the time of origination, and the difference between the loan’s initial interest and that Treasury rate. For short-term hybrid ARMs, we used the 2-year Treasury constant maturity rate; for fixed-rate mortgages, we used the 10-year Treasury constant maturity rate; and for longer-term ARMs, we used the 5-year Treasury constant maturity rate.
ARM initial fixed-rate period For longer-term ARMs, we defined a set of categorical variables describing the number of years for which the initial interest rate is fixed. The categories are 5 years, 7 years, and 10 years. The omitted category was 5 years.
Documentation of borrower income and assets
One if full documentation, 0 otherwise.
Income if full documentation, and income if limited documentation
Defined as a pair of continuous variables permitting the possibility that the effects of reported income (from HMDA) differ depending on whether the loan had full documentation of income or had limited documentation of income.
Race Defined as a series of 0-1 categorical variables based on the borrower’s reported race. The categories are as follows: Black (1 if black or African-American, 0 otherwise); Asian (1 if Asian, 0 otherwise); White (1 if white, 0 otherwise); and Other (1 if other reported category, 0 otherwise). We excluded observations for which borrower race was not available. The omitted category is White.
Ethnicity One if Hispanic or Latino, 0 otherwise. We excluded observations for which borrower ethnicity was not available.
Change in employment growth We cannot observe borrowers’ employment status. As an indicator of economic conditions in the borrower’s community, we used a state measure of employment growth over the 24-month performance window. These data are from BLS.
Census neighborhood characteristicsa We defined a series of 0-1 indicators representing high and low levels of education, unearned income (e.g., interest or dividends), new versus old housing, and housing vacancy rates that may provide information about housing and borrower characteristics in the Census tract where the property is located. Specifically, the indicators were as follows:
• 1 if property is in a tract with a high incidence of less than high school education, 0 otherwise
• 1 if property is in a tract with a high incidence of greater than college education, 0 otherwise
• 1 if property is in a tract with a low incidence of unearned income, 0 otherwise • 1 if property is in a tract with a high incidence of unearned income, 0 otherwise
• 1 if property is in a tract with a high incidence of very old housing, 0 otherwise
• 1 if property is in a tract with a high incidence of vacant housing, 0 otherwise
State Defined as a series of 0-1 categorical variables based on the property’s state. The omitted category is Texas.
Regulator We defined a series of 0-1 indicators representing the regulatory agencies with oversight over the practices of the lending institutions reporting HMDA data. Specifically, the indicators were the Office of the Comptroller of the Currency, Federal Reserve System, Federal Deposit Insurance Corporation, Office of Thrift Supervision, and Department of Housing and Urban Development. We excluded loans made by institutions overseen by the National Credit Union Administration. The omitted category was the Federal Reserve System.
Source: GAO. aFor each of the Census neighborhood characteristics variables, we used information on the distribution of values across all Census tracts for the relevant Census data element. We defined cutoffs for a high or low incidence based on, approximately, the top or bottom 10 percent of the distribution for each data element.
Page 45 GAO-10-805 Nonprime Mortgages
Appendix I: Description of the Econometric
Analysis of Nonprime Mortgage Default
Probabilities
Tables 2 through 4 provide information on the number of loans and mean values for each of the product types for which we estimated default probabilities. Short-term hybrid ARMs were the most prevalent type of mortgage, and purchase loans were more prevalent than refinance loans, except among fixed-rate mortgages. Default rates were highest for short-term hybrid ARMs and generally higher for purchase loans than for refinance loans, except for fixed-rate and longer-term ARM loans to investors.
Page 46 GAO-10-805 Nonprime Mortgages
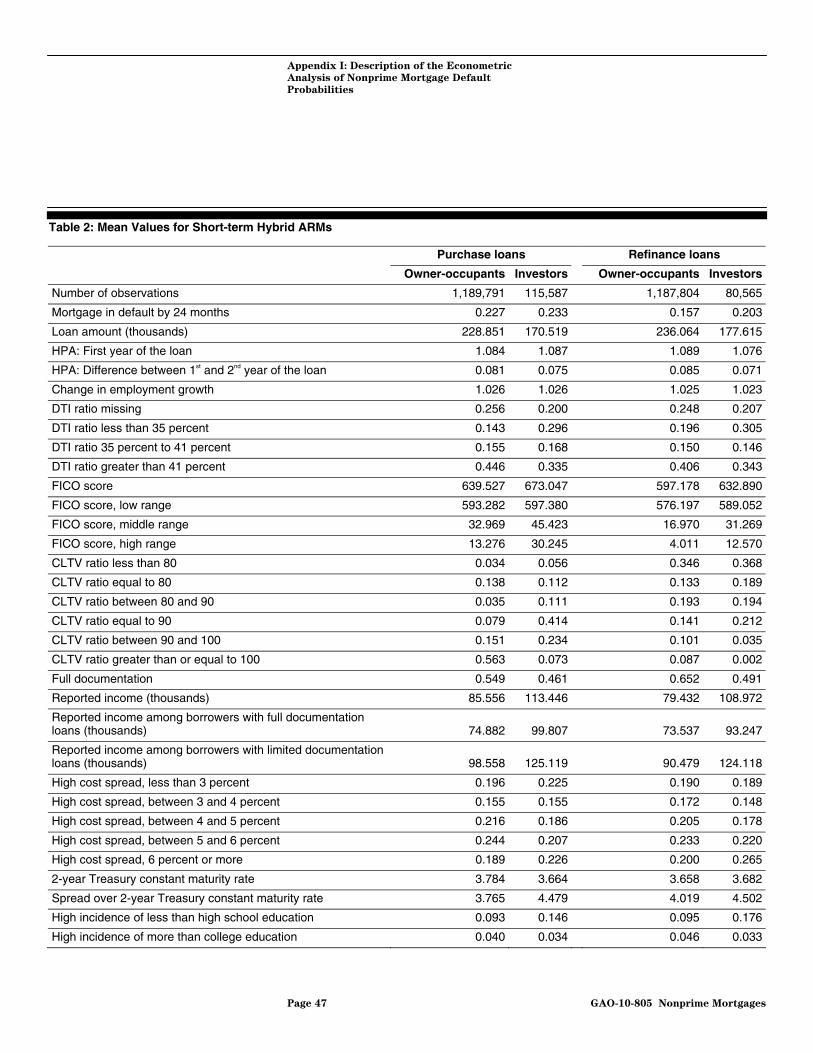
Appendix I: Description of the Econometric
Analysis of Nonprime Mortgage Default
Probabilities
Table 2: Mean Values for Short-term Hybrid ARMs
Purchase loans Refinance loans
Owner-occupants Investors Owner-occupants Investors
Number of observations 1,189,791 115,587 1,187,804 80,565
Mortgage in default by 24 months 0.227 0.233 0.157 0.203
Loan amount (thousands) 228.851 170.519 236.064 177.615
HPA: First year of the loan 1.084 1.087 1.089 1.076
HPA: Difference between 1st and 2nd year of the loan 0.081 0.075 0.085 0.071
Change in employment growth 1.026 1.026 1.025 1.023
DTI ratio missing 0.256 0.200 0.248 0.207
DTI ratio less than 35 percent 0.143 0.296 0.196 0.305
DTI ratio 35 percent to 41 percent 0.155 0.168 0.150 0.146
DTI ratio greater than 41 percent 0.446 0.335 0.406 0.343
FICO score 639.527 673.047 597.178 632.890
FICO score, low range 593.282 597.380 576.197 589.052
FICO score, middle range 32.969 45.423 16.970 31.269
FICO score, high range 13.276 30.245 4.011 12.570
CLTV ratio less than 80 0.034 0.056 0.346 0.368
CLTV ratio equal to 80 0.138 0.112 0.133 0.189
CLTV ratio between 80 and 90 0.035 0.111 0.193 0.194
CLTV ratio equal to 90 0.079 0.414 0.141 0.212
CLTV ratio between 90 and 100 0.151 0.234 0.101 0.035
CLTV ratio greater than or equal to 100 0.563 0.073 0.087 0.002
Full documentation 0.549 0.461 0.652 0.491
Reported income (thousands) 85.556 113.446 79.432 108.972
Reported income among borrowers with full documentation loans (thousands) 74.882 99.807 73.537 93.247
Reported income among borrowers with limited documentation loans (thousands) 98.558 125.119 90.479 124.118
High cost spread, less than 3 percent 0.196 0.225 0.190 0.189
High cost spread, between 3 and 4 percent 0.155 0.155 0.172 0.148
High cost spread, between 4 and 5 percent 0.216 0.186 0.205 0.178
High cost spread, between 5 and 6 percent 0.244 0.207 0.233 0.220
High cost spread, 6 percent or more 0.189 0.226 0.200 0.265
2-year Treasury constant maturity rate 3.784 3.664 3.658 3.682
Spread over 2-year Treasury constant maturity rate 3.765 4.479 4.019 4.502
High incidence of less than high school education 0.093 0.146 0.095 0.176
High incidence of more than college education 0.040 0.034 0.046 0.033
Page 47 GAO-10-805 Nonprime Mortgages
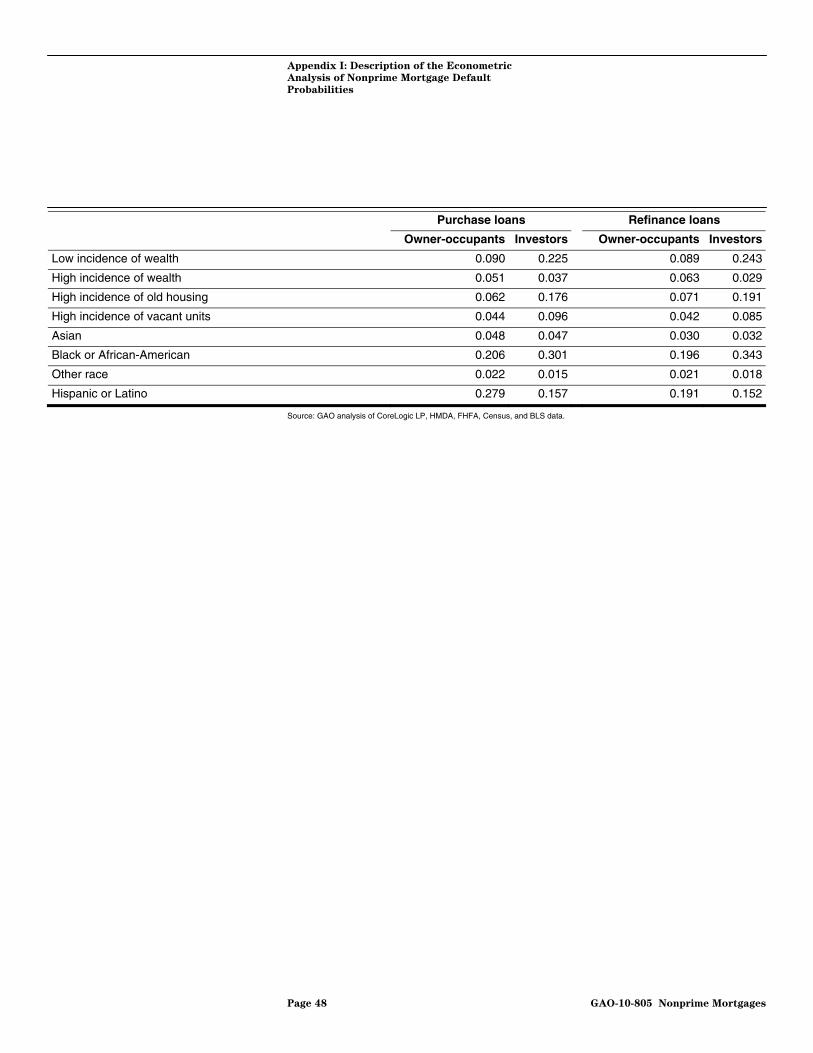
Appendix I: Description of the Econometric
Analysis of Nonprime Mortgage Default
Probabilities
Purchase loans Refinance loans
Owner-occupants Investors Owner-occupants Investors
Low incidence of wealth 0.090 0.225 0.089 0.243
High incidence of wealth 0.051 0.037 0.063 0.029
High incidence of old housing 0.062 0.176 0.071 0.191
High incidence of vacant units 0.044 0.096 0.042 0.085
Asian 0.048 0.047 0.030 0.032
Black or African-American 0.206 0.301 0.196 0.343
Other race 0.022 0.015 0.021 0.018
Hispanic or Latino 0.279 0.157 0.191 0.152
Source: GAO analysis of CoreLogic LP, HMDA, FHFA, Census, and BLS data.
Page 48 GAO-10-805 Nonprime Mortgages
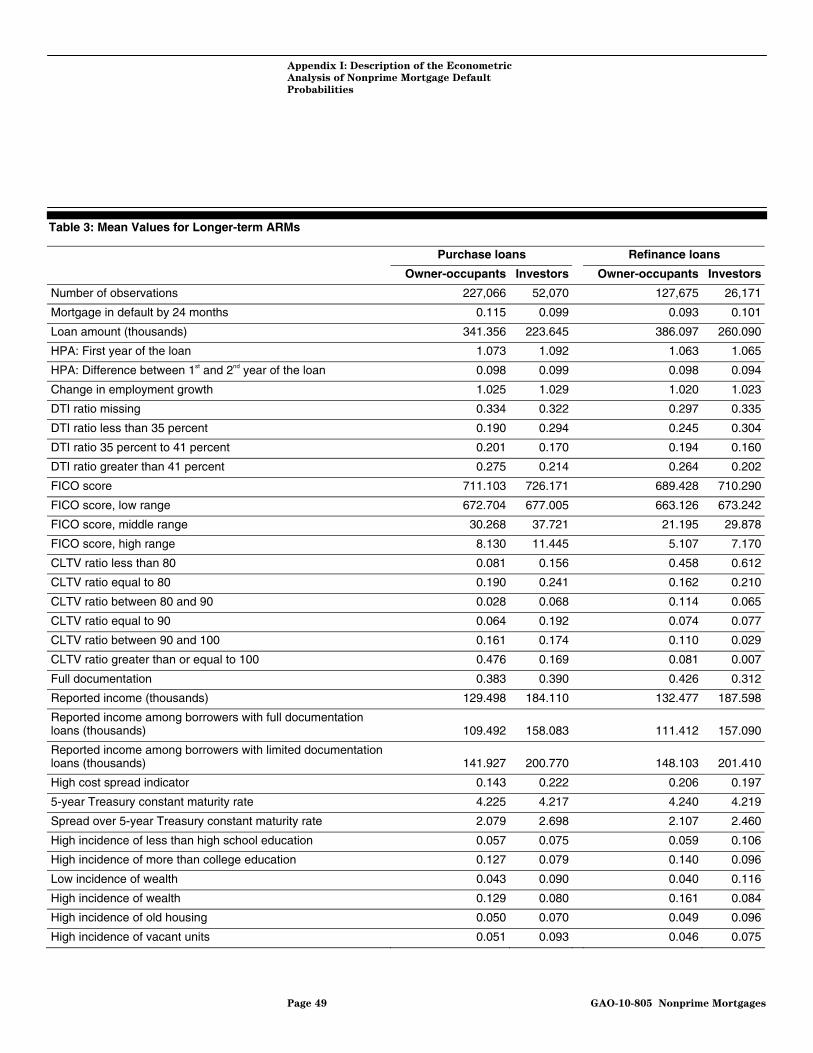
Appendix I: Description of the Econometric
Analysis of Nonprime Mortgage Default
Probabilities
Table 3: Mean Values for Longer-term ARMs
Purchase loans Refinance loans
Owner-occupants Investors Owner-occupants Investors
Number of observations 227,066 52,070 127,675 26,171
Mortgage in default by 24 months 0.115 0.099 0.093 0.101
Loan amount (thousands) 341.356 223.645 386.097 260.090
HPA: First year of the loan 1.073 1.092 1.063 1.065
HPA: Difference between 1st and 2nd year of the loan 0.098 0.099 0.098 0.094
Change in employment growth 1.025 1.029 1.020 1.023
DTI ratio missing 0.334 0.322 0.297 0.335
DTI ratio less than 35 percent 0.190 0.294 0.245 0.304
DTI ratio 35 percent to 41 percent 0.201 0.170 0.194 0.160
DTI ratio greater than 41 percent 0.275 0.214 0.264 0.202
FICO score 711.103 726.171 689.428 710.290
FICO score, low range 672.704 677.005 663.126 673.242
FICO score, middle range 30.268 37.721 21.195 29.878
FICO score, high range 8.130 11.445 5.107 7.170
CLTV ratio less than 80 0.081 0.156 0.458 0.612
CLTV ratio equal to 80 0.190 0.241 0.162 0.210
CLTV ratio between 80 and 90 0.028 0.068 0.114 0.065
CLTV ratio equal to 90 0.064 0.192 0.074 0.077
CLTV ratio between 90 and 100 0.161 0.174 0.110 0.029
CLTV ratio greater than or equal to 100 0.476 0.169 0.081 0.007
Full documentation 0.383 0.390 0.426 0.312
Reported income (thousands) 129.498 184.110 132.477 187.598
Reported income among borrowers with full documentation loans (thousands) 109.492 158.083 111.412 157.090
Reported income among borrowers with limited documentation loans (thousands) 141.927 200.770 148.103 201.410
High cost spread indicator 0.143 0.222 0.206 0.197
5-year Treasury constant maturity rate 4.225 4.217 4.240 4.219
Spread over 5-year Treasury constant maturity rate 2.079 2.698 2.107 2.460
High incidence of less than high school education 0.057 0.075 0.059 0.106
High incidence of more than college education 0.127 0.079 0.140 0.096
Low incidence of wealth 0.043 0.090 0.040 0.116
High incidence of wealth 0.129 0.080 0.161 0.084
High incidence of old housing 0.050 0.070 0.049 0.096
High incidence of vacant units 0.051 0.093 0.046 0.075
Page 49 GAO-10-805 Nonprime Mortgages

Appendix I: Description of the Econometric
Analysis of Nonprime Mortgage Default
Probabilities
Purchase loans Refinance loans
Owner-occupants Investors Owner-occupants Investors
Asian 0.076 0.063 0.059 0.056
Black or African-American 0.089 0.107 0.092 0.132
Other race 0.023 0.014 0.022 0.015
Hispanic or Latino 0.206 0.117 0.166 0.122
Source: GAO analysis of CoreLogic LP, HMDA, FHFA, Census, and BLS data.
Page 50 GAO-10-805 Nonprime Mortgages

Appendix I: Description of the Econometric
Analysis of Nonprime Mortgage Default
Probabilities
Table 4: Mean Values for Fixed-rate Mortgages
Purchase loans Refinance loans
Owner-occupants Investors Owner-occupants Investors
Number of observations 350,486 104,889 621,968 96,326
Mortgage in default by 24 months 0.092 0.077 0.074 0.070
Loan amount (thousands) 230.568 151.556 233.057 161.606
HPA: First year of the loan 1.071 1.088 1.081 1.085
HPA: Difference between 1st and 2nd year of the loan 0.063 0.063 0.079 0.066
Change in employment growth 1.024 1.027 1.022 1.025
DTI ratio missing 0.538 0.576 0.410 0.535
DTI ratio less than 35 percent 0.129 0.181 0.188 0.211
DTI ratio 35 percent to 41 percent 0.115 0.098 0.125 0.091
DTI ratio greater than 41 percent 0.218 0.146 0.278 0.162
FICO score 691.031 721.308 643.810 694.148
CLTV ratio less than 80 0.111 0.165 0.500 0.639
CLTV ratio equal to 80 0.180 0.244 0.128 0.188
CLTV ratio between 80 and 90 0.035 0.065 0.151 0.083
CLTV ratio equal to 90 0.068 0.266 0.082 0.073
CLTV ratio between 90 and 100 0.170 0.136 0.084 0.014
CLTV ratio greater than or equal to 100 0.435 0.124 0.055 0.002
Full documentation 0.506 0.507 0.649 0.466
Reported income (thousands) 99.991 144.007 87.518 137.163
Reported income among borrowers with full documentation loans (thousands) 85.711 125.619 77.873 114.861
Reported income among borrowers with limited documentation loans (thousands) 114.641 162.941 105.313 156.605
High cost spread indicator 0.257 0.381 0.361 0.319
10-year Treasury constant maturity rate 4.498 4.451 4.477 4.440
Spread over 10-year Treasury constant maturity rate 2.546 2.775 2.725 2.640
High incidence of less than high school education 0.057 0.095 0.087 0.133
High incidence of more than college education 0.081 0.058 0.063 0.060
Low incidence of wealth 0.059 0.127 0.084 0.175
High incidence of wealth 0.097 0.055 0.083 0.049
High incidence of old housing 0.064 0.143 0.065 0.151
High incidence of vacant units 0.044 0.085 0.045 0.071
Asian 0.052 0.059 0.030 0.042
Black or African-American 0.126 0.143 0.167 0.192
Other race 0.016 0.012 0.020 0.016
Hispanic or Latino 0.176 0.103 0.166 0.113
Source: GAO analysis of CoreLogic LP, HMDA, FHFA, Census, and BLS data.
Page 51 GAO-10-805 Nonprime Mortgages
Appendix I: Description of the Econometric
Analysis of Nonprime Mortgage Default
Probabilities
The results of our analysis are presented in tables 5 through 8. We ran 12 regressions: separate owner-occupant and investor regressions for purchase and refinance loans of three product types (short-term hybrid ARMs, fixed-rate mortgages, and longer-term ARMs). For short-term hybrid ARMs, the most prevalent product type, we present the results for purchase and refinance loans to owner-occupants (table 5) and investors (table 6). For the other product types, we present the results for purchase and refinance loans to owner-occupants only (tables 7 and 8); the results for investors were substantively similar. We present coefficient estimates as well as a transformation of the coefficients into a form that can be interpreted as the marginal effect of each variable on the estimated probability of default. This marginal effect is the calculation of the change in the estimated probability of default that would result if a variable’s standard deviation were added to that variable’s mean value, while all other variables are held at their mean values. This permits a comparison of the impact of different variables within and across product types. In general, HPA, loan amount, CLTV ratio, and FICO score had substantial marginal effects across different product types and loan purposes. Specifically, lower HPA, higher loan amount, higher CLTV ratio, and lower FICO scores were associated with higher likelihoods of default. The observed effects for DTI ratio were smaller. Documentation of borrower income and assets and a loan’s interest rate spread over the applicable Treasury rate had substantial marginal effects. Limited documentation and higher interest rate spreads were associated with higher default probabilities.
Page 52 GAO-10-805 Nonprime Mortgages

Appendix I: Description of the Econometric
Analysis of Nonprime Mortgage Default
Probabilities
Table 5: Estimation Results for Short-term Hybrid ARMs for Owner-Occupants
Purchase loans Refinance loans
Coefficient Significance Marginal effect Coefficient Significance Marginal effect
Number of observations:
Purchase loans – 1,189,791 Refinance loans – 1,187,804
Intercept 10.904 *** 10.207 ***
Loan amount 0.002 *** 5.11 0.002 *** 3.24
HPA: First year of the loan (7.974) *** (8.51) (6.752) *** (5.31)
HPA: Difference between 1st and 2nd year of the loan 2.850 *** 3.45 2.328 *** 1.92
Change in employment growth (2.246) *** (0.81) (3.994) *** (1.03)
DTI ratio missing 0.023 *** 0.15 0.024 ** 0.11
DTI ratio less than 35 percent (0.028) *** (0.14) (0.025) ** (0.10)
DTI ratio greater than 41 percent 0.079 *** 0.59 0.066 *** 0.35
FICO score, low range (0.006) *** (1.39) (0.005) *** (1.55)
FICO score, middle range (0.009) *** (3.08) (0.006) *** (1.32)
FICO score, high range (0.006) *** (2.18) (0.007) *** (1.04)
CLTV ratio less than 80 (0.962) *** (2.42) (0.498) *** (2.28)
CLTV ratio between 80 and 90 (0.519) *** (1.36) 0.028 *** 0.12
CLTV ratio equal to 90 (0.361) *** (1.38) 0.242 *** 0.91
CLTV ratio between 90 and 100 (0.071) *** (0.37) 0.386 *** 1.28
CLTV ratio greater than or equal to 100 0.249 *** 1.88 0.804 *** 2.59
Full documentation (0.174) *** (1.24) (0.159) *** (0.77)
Reported income if full documentation (0.002) *** (1.32) (0.003) *** (1.61)
Reported income if limited documentation 0.0003 *** 0.25 (0.001) *** (0.56)
High cost spread, less than 3 percent (0.167) *** (0.95) (0.116) *** (0.47)
High cost spread, between 4 and 5 percent 0.106 *** 0.65 0.066 *** 0.28
High cost spread, between 5 and 6 percent 0.194 *** 1.26 0.092 *** 0.42
High cost spread, 6 percent or more 0.121 *** 0.71 0.053 *** 0.22
2-year Treasury constant maturity rate 0.195 *** 2.87 0.259 *** 2.95
Spread over 2-year Treasury constant maturity rate 0.160 *** 3.02 0.251 *** 3.93
Page 53 GAO-10-805 Nonprime Mortgages

Appendix I: Description of the Econometric
Analysis of Nonprime Mortgage Default
Probabilities
Purchase loans Refinance loans
Coefficient Significance Marginal effect Coefficient Significance Marginal effect
High incidence of less than high school education (0.015) (0.06) (0.023) ** (0.07)
High incidence of more than college education (0.141) *** (0.40) (0.115) *** (0.25)
Low incidence of wealth 0.255 *** 1.09 0.042 *** 0.13
High incidence of wealth (0.247) *** (0.78) (0.142) *** (0.36)
High incidence of old housing 0.163 *** 0.58 0.129 *** 0.35
High incidence of vacant units 0.201 *** 0.61 0.115 *** 0.24
Asian 0.023 * 0.07 (0.047) *** (0.08)
Black or African-American 0.483 *** 3.05 0.042 *** 0.17
Other race 0.081 *** 0.18 (0.017) (0.03)
Hispanic or Latino 0.188 *** 1.27 0.093 *** 0.39
Source: GAO analysis of CoreLogic LP, HMDA, FHFA, Census, and BLS data.
Note: In the “Significance” columns, the symbols *, **, and *** indicate statistical significance at the 10 percent, 5 percent, and 1 percent levels, respectively. A blank cell in these columns indicates that the coefficient for the variable was not statistically significant at these levels.
Page 54 GAO-10-805 Nonprime Mortgages

Appendix I: Description of the Econometric
Analysis of Nonprime Mortgage Default
Probabilities
Table 6: Estimation Results for Short-term Hybrid ARMs for Investors
Purchase loans Refinance loans
Coefficient Significance Marginal effect Coefficient Significance Marginal effect
Number of observations: Purchase loans - 115,587
Refinance loans - 80,565
Intercept 12.020 *** 15.119 ***
Loan amount 0.003 *** 4.79 0.001 *** 2.23
HPA: First year of the loan (8.384) *** (7.42) (7.717) *** (6.71)
HPA: Difference between 2st and 3nd year of the loan 0.427 0.41 1.393 *** 1.25
Change in employment growth (2.965) *** (1.00) (7.628) *** (2.35)
DTI ratio missing 0.005 0.02 0.015 0.08
DTI ratio less than 35 percent 0.079 *** 0.45 (0.010) (0.06)
DTI ratio greater than 41 percent 0.031 0.18 0.018 0.11
FICO score, low range (0.005) *** (0.64) (0.005) *** (1.28)
FICO score, middle range (0.009) *** (2.33) (0.006) *** (1.83)
FICO score, high range (0.008) *** (3.58) (0.010) *** (2.89)
CLTV ratio less than 80 (0.550) *** (1.50) (0.526) *** (2.88)
CLTV ratio between 80 and 90 0.302 *** 1.22 0.239 *** 1.22
CLTV ratio equal to 90 0.547 *** 3.67 0.513 *** 2.81
CLTV ratio between 90 and 100 0.568 *** 3.24 0.676 *** 1.62
CLTV ratio greater than or equal to 100 0.869 *** 3.04 0.237 0.14
Full documentation (0.212) *** (1.26) (0.276) *** (1.63)
Reported income if full documentation (0.003) *** (2.34) 0.000 0.24
Reported income if limited documentation (0.003) *** (2.29) 0.000 0.30
High cost spread, less than 3 percent (0.215) *** (1.08) (0.054) (0.26)
High cost spread, between 4 and 5 percent 0.021 0.10 0.083 ** 0.40
High cost spread, between 5 and 6 percent 0.116 *** 0.59 0.110 ** 0.57
High cost spread greater than or equal to 6 percent (0.041) (0.21) 0.101 ** 0.56
2-year Treasury constant maturity rate 0.225 *** 2.81 0.271 *** 3.67
Spread over 2-year Treasury constant maturity rate 0.109 *** 1.65 0.198 *** 3.45
Page 55 GAO-10-805 Nonprime Mortgages

Appendix I: Description of the Econometric
Analysis of Nonprime Mortgage Default
Probabilities
Purchase loans Refinance loans
Coefficient Significance Marginal effect Coefficient Significance Marginal effect
High incidence of less than high school education 0.048 * 0.21 0.028 0.13
High incidence of more than college education (0.389) *** (0.85) (0.229) *** (0.51)
Low incidence of wealth 0.504 *** 2.81 0.147 *** 0.80
High incidence of wealth (0.330) *** (0.76) (0.134) * (0.28)
High incidence of old housing 0.302 *** 1.48 0.127 *** 0.63
High incidence of vacant units 0.275 *** 1.03 0.098 *** 0.34
Asian (0.122) ** (0.32) (0.065) (0.14)
Black or African-American 0.367 *** 2.22 0.102 *** 0.61
Other race (0.007) (0.01) (0.104) (0.17)
Hispanic or Latino (0.160) *** (0.71) (0.071) ** (0.31)
Source: GAO analysis of CoreLogic LP, HMDA, FHFA, Census, and BLS data.
Note: In the “Significance” columns, the symbols *, **, and *** indicate statistical significance at the 10 percent, 5 percent, and 1 percent levels, respectively. A blank cell in these columns indicates that the coefficient for the variable was not statistically significant at these levels.
Page 56 GAO-10-805 Nonprime Mortgages
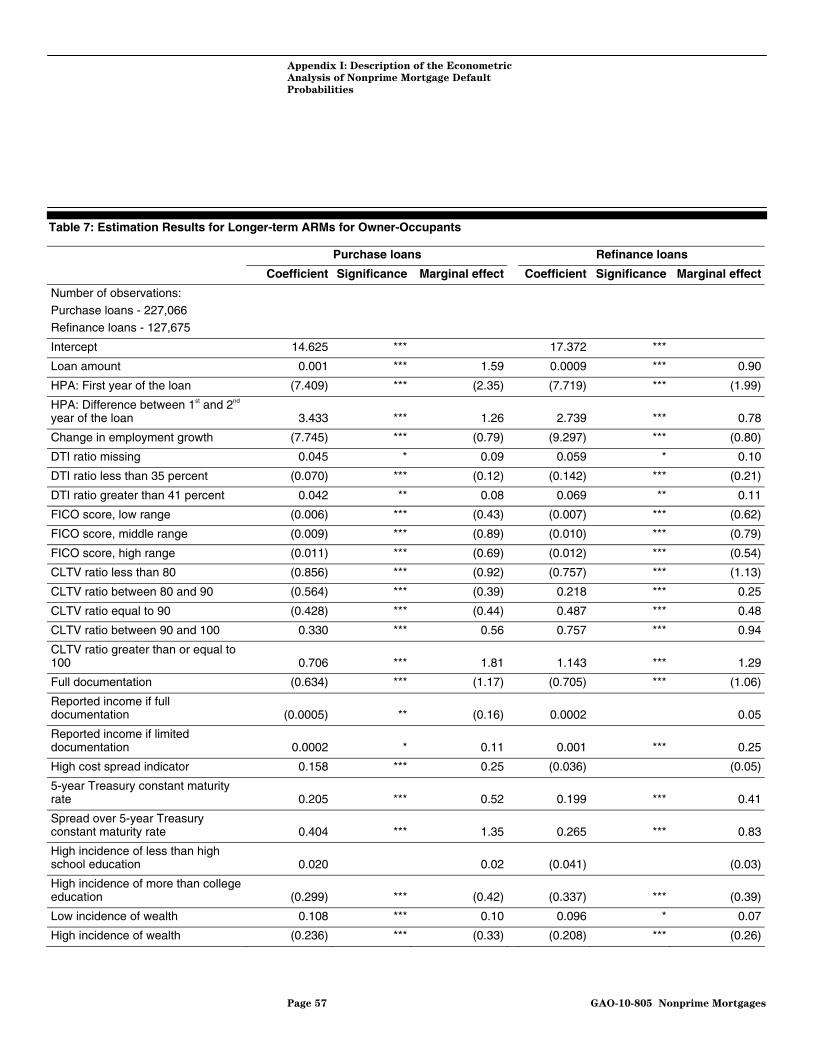
Appendix I: Description of the Econometric
Analysis of Nonprime Mortgage Default
Probabilities
Table 7: Estimation Results for Longer-term ARMs for Owner-Occupants
Purchase loans Refinance loans
Coefficient Significance Marginal effect Coefficient Significance Marginal effect
Number of observations:
Purchase loans - 227,066 Refinance loans - 127,675
Intercept 14.625 *** 17.372 ***
Loan amount 0.001 *** 1.59 0.0009 *** 0.90
HPA: First year of the loan (7.409) *** (2.35) (7.719) *** (1.99)
HPA: Difference between 1st and 2nd year of the loan 3.433 *** 1.26 2.739 *** 0.78
Change in employment growth (7.745) *** (0.79) (9.297) *** (0.80)
DTI ratio missing 0.045 * 0.09 0.059 * 0.10
DTI ratio less than 35 percent (0.070) *** (0.12) (0.142) *** (0.21)
DTI ratio greater than 41 percent 0.042 ** 0.08 0.069 ** 0.11
FICO score, low range (0.006) *** (0.43) (0.007) *** (0.62)
FICO score, middle range (0.009) *** (0.89) (0.010) *** (0.79)
FICO score, high range (0.011) *** (0.69) (0.012) *** (0.54)
CLTV ratio less than 80 (0.856) *** (0.92) (0.757) *** (1.13)
CLTV ratio between 80 and 90 (0.564) *** (0.39) 0.218 *** 0.25
CLTV ratio equal to 90 (0.428) *** (0.44) 0.487 *** 0.48
CLTV ratio between 90 and 100 0.330 *** 0.56 0.757 *** 0.94
CLTV ratio greater than or equal to 100 0.706 *** 1.81 1.143 *** 1.29
Full documentation (0.634) *** (1.17) (0.705) *** (1.06)
Reported income if full documentation (0.0005) ** (0.16) 0.0002 0.05
Reported income if limited documentation 0.0002 * 0.11 0.001 *** 0.25
High cost spread indicator 0.158 *** 0.25 (0.036) (0.05)
5-year Treasury constant maturity rate 0.205 *** 0.52 0.199 *** 0.41
Spread over 5-year Treasury constant maturity rate 0.404 *** 1.35 0.265 *** 0.83
High incidence of less than high school education 0.020 0.02 (0.041) (0.03)
High incidence of more than college education (0.299) *** (0.42) (0.337) *** (0.39)
Low incidence of wealth 0.108 *** 0.10 0.096 * 0.07
High incidence of wealth (0.236) *** (0.33) (0.208) *** (0.26)
Page 57 GAO-10-805 Nonprime Mortgages
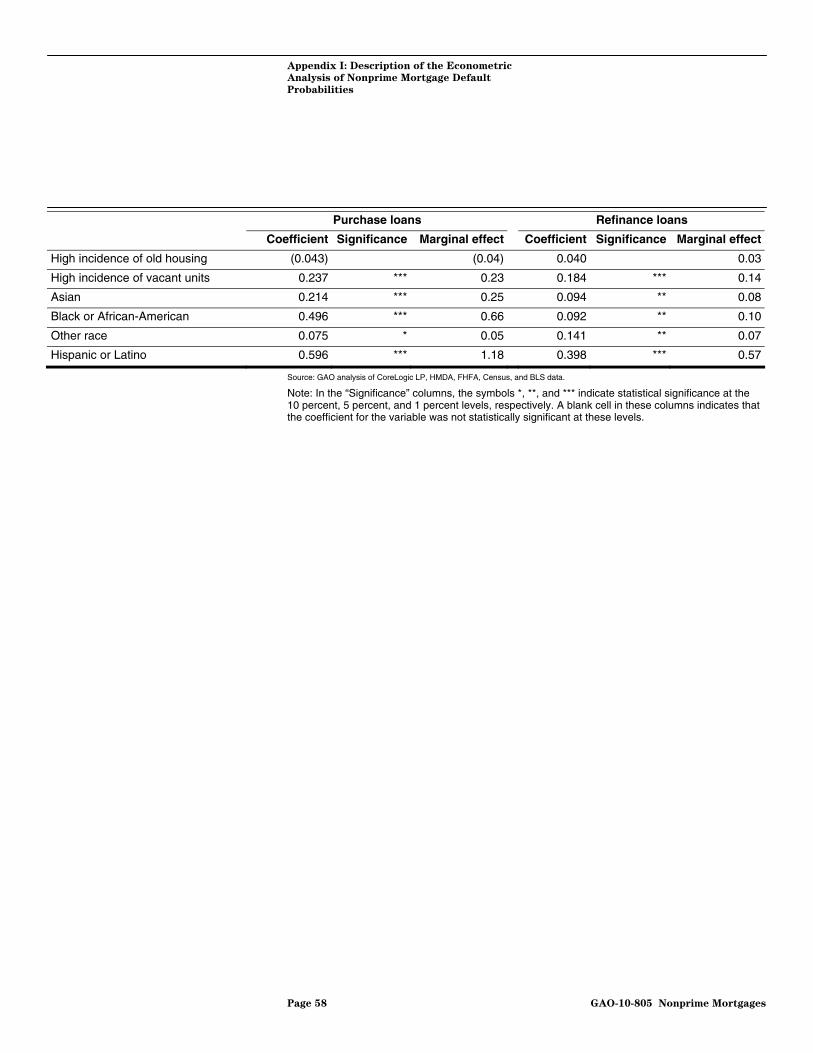
Appendix I: Description of the Econometric
Analysis of Nonprime Mortgage Default
Probabilities
Purchase loans Refinance loans
Coefficient Significance Marginal effect Coefficient Significance Marginal effect
High incidence of old housing (0.043) (0.04) 0.040 0.03
High incidence of vacant units 0.237 *** 0.23 0.184 *** 0.14
Asian 0.214 *** 0.25 0.094 ** 0.08
Black or African-American 0.496 *** 0.66 0.092 ** 0.10
Other race 0.075 * 0.05 0.141 ** 0.07
Hispanic or Latino 0.596 *** 1.18 0.398 *** 0.57
Source: GAO analysis of CoreLogic LP, HMDA, FHFA, Census, and BLS data.
Note: In the “Significance” columns, the symbols *, **, and *** indicate statistical significance at the 10 percent, 5 percent, and 1 percent levels, respectively. A blank cell in these columns indicates that the coefficient for the variable was not statistically significant at these levels.
Page 58 GAO-10-805 Nonprime Mortgages
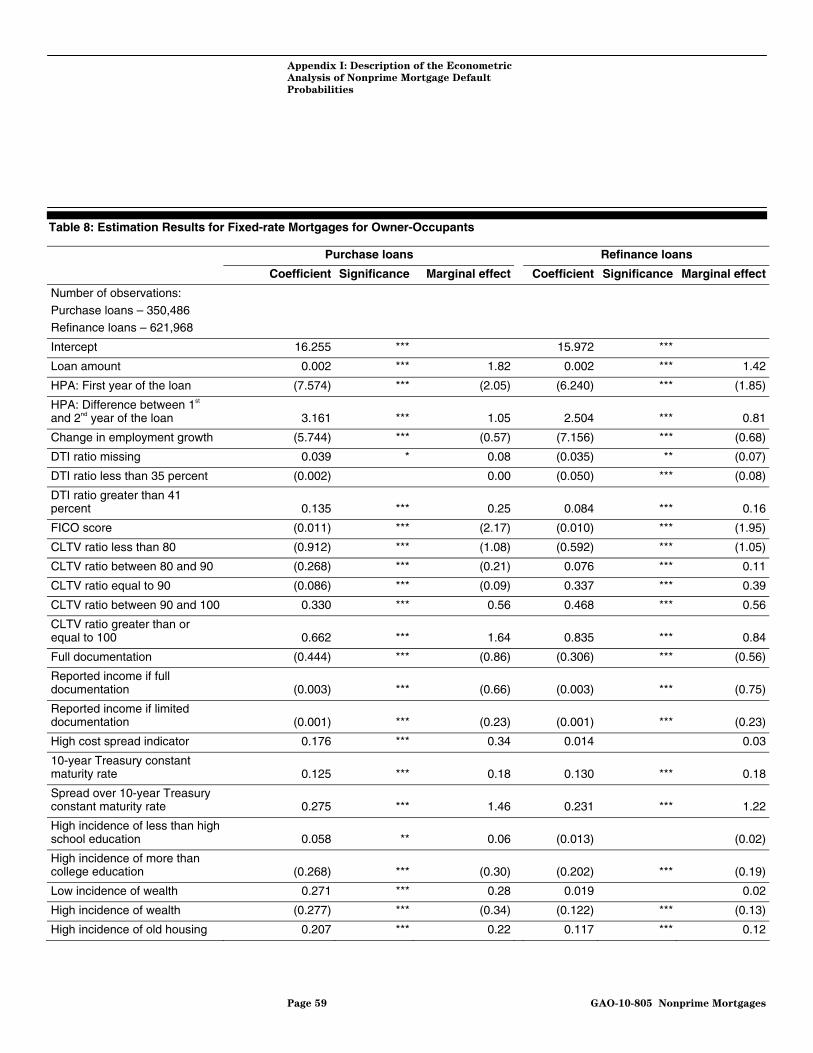
Appendix I: Description of the Econometric
Analysis of Nonprime Mortgage Default
Probabilities
Table 8: Estimation Results for Fixed-rate Mortgages for Owner-Occupants
Purchase loans Refinance loans
Coefficient Significance Marginal effect Coefficient Significance Marginal effect
Number of observations:
Purchase loans – 350,486 Refinance loans – 621,968
Intercept 16.255 *** 15.972 ***
Loan amount 0.002 *** 1.82 0.002 *** 1.42
HPA: First year of the loan (7.574) *** (2.05) (6.240) *** (1.85)
HPA: Difference between 1st and 2nd year of the loan 3.161 *** 1.05 2.504 *** 0.81
Change in employment growth (5.744) *** (0.57) (7.156) *** (0.68)
DTI ratio missing 0.039 * 0.08 (0.035) ** (0.07)
DTI ratio less than 35 percent (0.002) 0.00 (0.050) *** (0.08)
DTI ratio greater than 41 percent 0.135 *** 0.25 0.084 *** 0.16
FICO score (0.011) *** (2.17) (0.010) *** (1.95)
CLTV ratio less than 80 (0.912) *** (1.08) (0.592) *** (1.05)
CLTV ratio between 80 and 90 (0.268) *** (0.21) 0.076 *** 0.11
CLTV ratio equal to 90 (0.086) *** (0.09) 0.337 *** 0.39
CLTV ratio between 90 and 100 0.330 *** 0.56 0.468 *** 0.56
CLTV ratio greater than or equal to 100 0.662 *** 1.64 0.835 *** 0.84
Full documentation (0.444) *** (0.86) (0.306) *** (0.56)
Reported income if full documentation (0.003) *** (0.66) (0.003) *** (0.75)
Reported income if limited documentation (0.001) *** (0.23) (0.001) *** (0.23)
High cost spread indicator 0.176 *** 0.34 0.014 0.03
10-year Treasury constant maturity rate 0.125 *** 0.18 0.130 *** 0.18
Spread over 10-year Treasury constant maturity rate 0.275 *** 1.46 0.231 *** 1.22
High incidence of less than high school education 0.058 ** 0.06 (0.013) (0.02)
High incidence of more than college education (0.268) *** (0.30) (0.202) *** (0.19)
Low incidence of wealth 0.271 *** 0.28 0.019 0.02
High incidence of wealth (0.277) *** (0.34) (0.122) *** (0.13)
High incidence of old housing 0.207 *** 0.22 0.117 *** 0.12
Page 59 GAO-10-805 Nonprime Mortgages
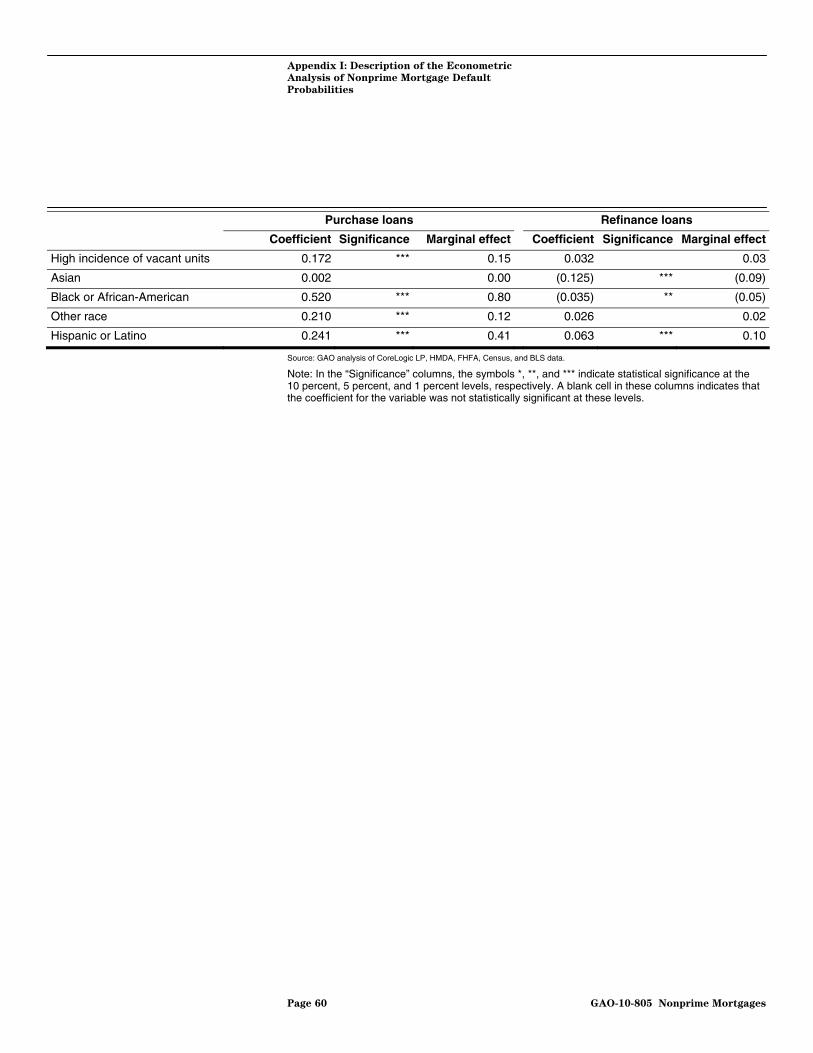
Appendix I: Description of the Econometric
Analysis of Nonprime Mortgage Default
Probabilities
Purchase loans Refinance loans
Coefficient Significance Marginal effect Coefficient Significance Marginal effect
High incidence of vacant units 0.172 *** 0.15 0.032 0.03
Asian 0.002 0.00 (0.125) *** (0.09)
Black or African-American 0.520 *** 0.80 (0.035) ** (0.05)
Other race 0.210 *** 0.12 0.026 0.02
Hispanic or Latino 0.241 *** 0.41 0.063 *** 0.10
Source: GAO analysis of CoreLogic LP, HMDA, FHFA, Census, and BLS data.
Note: In the “Significance” columns, the symbols *, **, and *** indicate statistical significance at the 10 percent, 5 percent, and 1 percent levels, respectively. A blank cell in these columns indicates that the coefficient for the variable was not statistically significant at these levels.
Page 60 GAO-10-805 Nonprime Mortgages
Appendix II: M
LoanPerforma
Disclosure
atching CoreLogic
nce and Home Mortgage
Act Records
Page 61 GAO-10-805
Appendix II: Matching CoreLogic LoanPerformance and Home Mortgage Disclosure Act Records
To describe the race, ethnicity, and reported income of nonprime borrowers, we matched loan-level records from two primary data sources—CoreLogic LoanPerformance’s (CoreLogic LP) Asset-Backed Securities Database and Home Mortgage Disclosure Act (HMDA) data compiled by the Federal Financial Institutions Examination Council (FFIEC). The CoreLogic LP database provides extensive information about the characteristics and performance of securitized nonprime mortgages. However, it contains relatively little information about borrowers, providing only credit scores and debt-service-to-income ratios.1 In contrast, HMDA data contain limited information about loan characteristics and nothing about performance, but they do provide information on borrowers’ race, ethnicity, and reported income. HMDA data are estimated to capture about 80 percent of the mortgages funded each year and cover all major market segments, including nonprime loans. HMDA data, therefore, should capture most of the loans in the CoreLogic LP database.
Data Sources
While the CoreLogic LP and HMDA data emphasize different kinds of loan and borrower information, they do have some information in common. These common data items—including loan amount, loan purpose, loan origination date, property location, and loan originator—allow the two data sets to be matched on a loan-by-loan basis. Using the methodology that we developed in previous work, we matched records from the CoreLogic LP database for loans that were originated from 2004 through 2006 to HMDA data files for those same years.2 We focused on loan originations from this period because there were large numbers of nonprime originations in those years.
The CoreLogic LP data set that we used for the matching process contained records for 9,292,684 loans. The data set included records for conventional first-lien purchase and refinance loans to owner-occupants, investors, and owners of second homes. The data excluded records for loans for units in multifamily structures, and for manufactured housing; loans in Guam, Puerto Rico, and the Virgin Islands; and loans with terms other than 15, 30, or 40 years.
1The debt-service-to-income ratio is the borrower’s total monthly debt service payments divided by monthly gross income.
2GAO, Loan Performance and Negative Home Equity in the Nonprime Mortgage Market,
GAO-10-146R (Washington, D.C.: Dec. 16, 2009).
Nonprime Mortgages

Appendix II: Matching CoreLogic
LoanPerformance and Home Mortgage
Disclosure Act Records
The HMDA data set that we used for the matching process contained records for 24,227,566 loans. As with the CoreLogic LP data, we focused on first-lien purchase and refinance loans. The HMDA data set excluded loans for properties other than one- to four-family residential units. Because the CoreLogic LP database contained only conventional loans in private label securitizations, we also excluded from the HMDA data set loans that involved government programs—such as mortgages guaranteed by the Federal Housing Administration or the Department of Veterans Affairs—and conventional loans that were indicated as sold to Fannie Mae, Freddie Mac, Ginnie Mae, or Farmer Mac.
Matching the loan records from the two data sources required us to make the common data items compatible. We were able to use a straightforward process for the loan amount and purpose that required only rounding the CoreLogic LP loan amount to the nearest $1,000 and aggregating the three CoreLogic LP refinance categories into one category. However, the process was more complicated for origination date and property location.3 We determined that the name of the loan originator was not particularly useful for making initial matches of loan records because this information was missing for a substantial percentage of the CoreLogic LP records. However, the originator’s name was useful in assessing the quality of the matches that we made using other data elements.
Steps Taken to Make the Data Sets Compatible
3For privacy reasons, the origination date is omitted from each HMDA record when it is publicly released. We requested and obtained the date fields from FFIEC, which compiles and publishes the HMDA data. Under GAO’s disclosure regulations, set forth at 4 C.F.R. Part 81, we do not provide members of the public with records that originate in another agency obtained in connection with our work. Instead, we refer members of the public requesting information to the agency that originated the record. 4 C.F.R. § 81.5(a). Additionally, under our regulations, we do not disclose to the public records containing confidential financial information, see 4 C.F.R. § 81.6(e), nor do we disclose records containing private or personal information, which, if disclosed to the public, would amount to a clearly unwarranted invasion of the privacy of a person, see 4 C.F.R. § 81.6(f).
Page 62 GAO-10-805 Nonprime Mortgages
Appendix II: Matching CoreLogic
LoanPerformance and Home Mortgage
Disclosure Act Records
About 15 percent of the loans in our CoreLogic LP data set had an origination date that was the 1st day of a month.4 This distribution pattern was inconsistent with the distribution of origination days in HMDA, which showed a much more even pattern throughout the month, with an increase in originations toward the end of each month rather than the beginning of each month. Because of this inconsistency, we relied on the origination month rather than the origination month and day to match loan records.
Loan Origination Dates
Property Location The CoreLogic LP and HMDA data provided different geographic
identifiers for loans, with the CoreLogic LP data providing the ZIP code and the HMDA data providing the Census tract. To facilitate record matching on the basis of property location, we related the Census tract information in the HMDA data to a corresponding ZIP code or ZIP codes in the CoreLogic LP data, using 2000 Census files and ZIP code boundary files from Pitney Bowes Business Insight. Using mapping software, we overlaid Census tract boundaries on ZIP code boundaries to determine the proportion of each Census tract’s area that fell within a given ZIP code area. For each Census tract, we kept all ZIP codes that accounted for at least 5 percent of that tract’s area. About 60 percent of the Census tracts were associated with only one ZIP code (meeting the 5 percent threshold), and almost all Census tracts (97.5 percent) included no more than four ZIP codes. When a Census tract was associated with only one ZIP code, all HMDA records in that Census tract were candidates to match CoreLogic LP records in that ZIP code. All HMDA records in tracts with more than one ZIP code were candidates to match CoreLogic LP records in those ZIP codes.
We matched loan records in the CoreLogic LP and HMDA data sets as follows. First, for each loan origination year (2004, 2005, and 2006), we made initial matches by identifying CoreLogic LP and HMDA loans with the same property location,5 origination month, loan amount, and loan purpose. After finding all possible HMDA matches for each CoreLogic LP
Matching Methodology
4This pattern reflects CoreLogic LP’s practice of imputing the origination month for some loans on the basis of the month in which the first payment is due. In these cases, CoreLogic LP records the origination date as the 1st day of the imputed origination month.
5Property location is reported at the Census tract level in HMDA and at the ZIP code level by CoreLogic LP. We used the spatial relationships between Census tracts and ZIP codes to assign each Census tract to those ZIP codes associated with it.
Page 63 GAO-10-805 Nonprime Mortgages
Appendix II: Matching CoreLogic
LoanPerformance and Home Mortgage
Disclosure Act Records
record, we classified these initial matches as either one-to-one matches (CoreLogic LP records with one corresponding HMDA record), one-to-many matches (CoreLogic LP records with more than one corresponding HMDA record), or nonmatches (CoreLogic LP records with no corresponding HMDA record). One-to-one matches accounted for about 55 percent of the loans in our CoreLogic LP data set, one-to-many matches accounted for about 25 percent, and nonmatches accounted for about 15 percent. Our match rates were highest for 2004 originations, about 85 percent, and lowest for 2006 originations, about 82 percent.
The quality of the matches was particularly important because we were examining statistical relationships between borrower characteristics and loan performance. To provide reasonable assurance that the matches were robust, we performed three types of quality checks on our initial one-to-one and one-to-many matches. First, we used information about the loan originator—information that was included in both the CoreLogic LP and HMDA data. The HMDA data clearly identified loan originators—referred to as “HMDA respondents”—using a series of codes that corresponded to a list of standardized originator names. However, in more than 40 percent of the CoreLogic LP records in our data set, the originator name was marked as not available. In other cases, the originator was listed by a generic term, such as “conduit,” or was an entity that appeared to be involved in the securitization process but was not necessarily the originator. Originators that were listed were often referred to in a number of ways—for example, “Taylor Bean,” “Taylor Bean Whitaker,” “Taylor, Bean & Whitaker,” “TaylorBean,” “TBW,” and “TBW Mortgage Corp.” all referred to the HMDA respondent “Taylor, Bean & Whitaker.” For CoreLogic LP loans with originator information, we standardized the originator names in the CoreLogic LP data, and we used these same originator names for the HMDA data. We compared the standardized originator names in matched records and if the standardized names matched, we classified the match as a robust match, and deleted any other HMDA records that might have matched to that CoreLogic LP record.
Second, for CoreLogic LP loans with no originator name, we examined the relationship between the HMDA loan originator and the issuer of the securities associated with the loan. Many institutions, such as Countrywide and Ameriquest, originated and securitized large numbers of nonprime loans. While some of these institutions identified themselves as the originator of a loan, others typically did not make the originator information available. In these cases, if the CoreLogic LP securitizer matched the HMDA originator, we classified an initial match as a robust match. If the issuer did not originate substantial numbers of nonprime
Page 64 GAO-10-805 Nonprime Mortgages
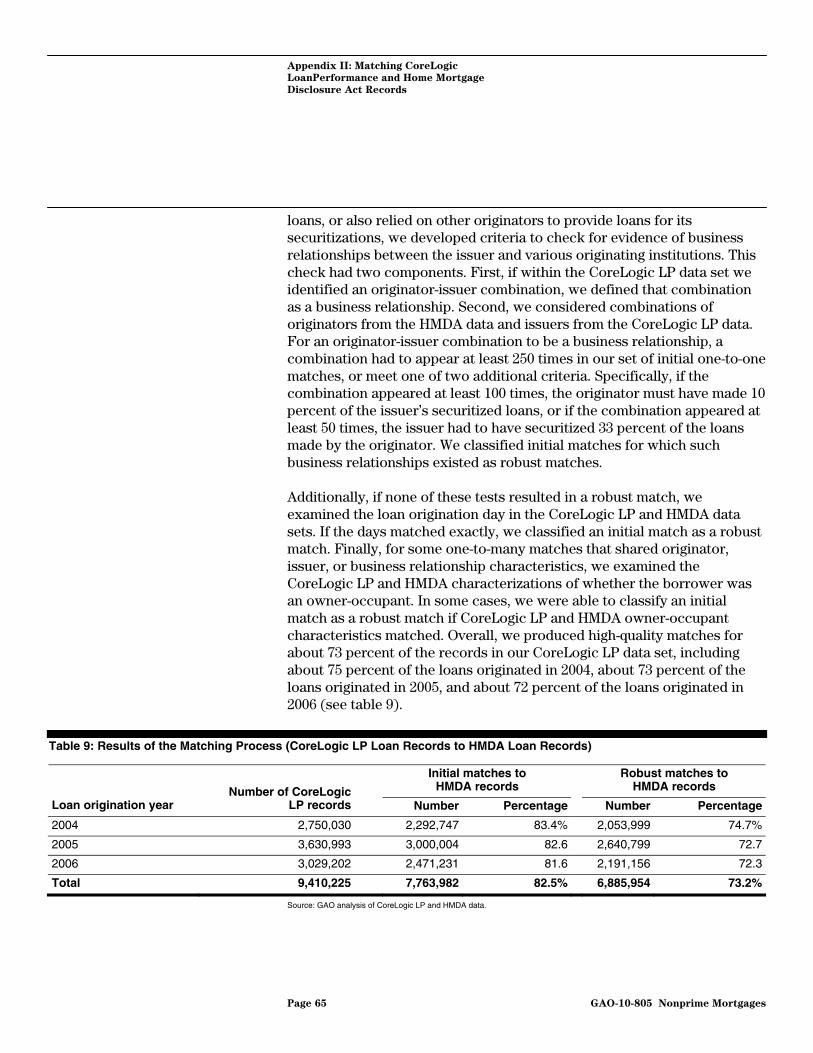
Appendix II: Matching CoreLogic
LoanPerformance and Home Mortgage
Disclosure Act Records
Nonprime Mortgages
loans, or also relied on other originators to provide loans for its securitizations, we developed criteria to check for evidence of business relationships between the issuer and various originating institutions. This check had two components. First, if within the CoreLogic LP data set we identified an originator-issuer combination, we defined that combination as a business relationship. Second, we considered combinations of originators from the HMDA data and issuers from the CoreLogic LP data. For an originator-issuer combination to be a business relationship, a combination had to appear at least 250 times in our set of initial one-to-one matches, or meet one of two additional criteria. Specifically, if the combination appeared at least 100 times, the originator must have made 10 percent of the issuer’s securitized loans, or if the combination appeared at least 50 times, the issuer had to have securitized 33 percent of the loans made by the originator. We classified initial matches for which such business relationships existed as robust matches.
Additionally, if none of these tests resulted in a robust match, we examined the loan origination day in the CoreLogic LP and HMDA data sets. If the days matched exactly, we classified an initial match as a robust match. Finally, for some one-to-many matches that shared originator, issuer, or business relationship characteristics, we examined the CoreLogic LP and HMDA characterizations of whether the borrower was an owner-occupant. In some cases, we were able to classify an initial match as a robust match if CoreLogic LP and HMDA owner-occupant characteristics matched. Overall, we produced high-quality matches for about 73 percent of the records in our CoreLogic LP data set, including about 75 percent of the loans originated in 2004, about 73 percent of the loans originated in 2005, and about 72 percent of the loans originated in 2006 (see table 9).
Table 9: Results of the Matching Process (CoreLogic LP Loan Records to HMDA Loan Records)
Initial matches to HMDA records
Robust matches to HMDA records
Loan origination year Number of CoreLogic
LP records Number Percentage Number Percentage
2004 2,750,030 2,292,747 83.4% 2,053,999 74.7%
2005 3,630,993 3,000,004 82.6 2,640,799 72.7
2006 3,029,202 2,471,231 81.6 2,191,156 72.3
Total 9,410,225 7,763,982 82.5% 6,885,954 73.2%
Source: GAO analysis of CoreLogic LP and HMDA data.
Page 65 GAO-10-805
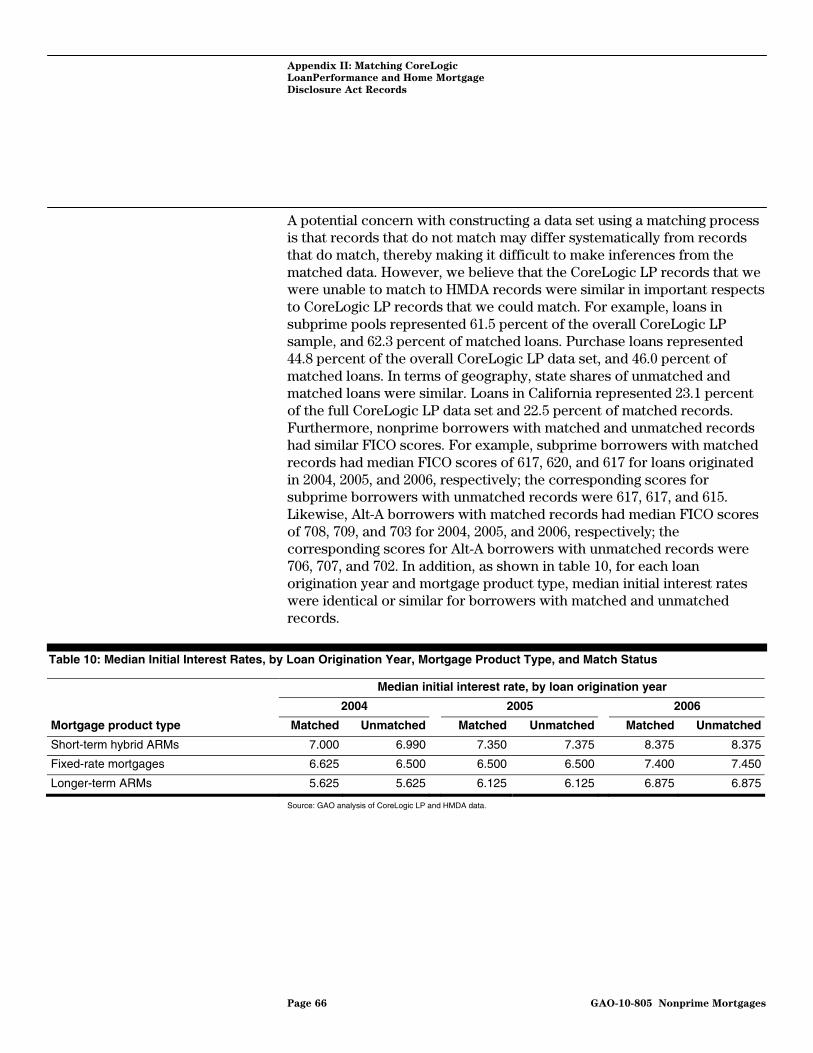
Appendix II: Matching CoreLogic
LoanPerformance and Home Mortgage
Disclosure Act Records
A potential concern with constructing a data set using a matching process is that records that do not match may differ systematically from records that do match, thereby making it difficult to make inferences from the matched data. However, we believe that the CoreLogic LP records that we were unable to match to HMDA records were similar in important respects to CoreLogic LP records that we could match. For example, loans in subprime pools represented 61.5 percent of the overall CoreLogic LP sample, and 62.3 percent of matched loans. Purchase loans represented 44.8 percent of the overall CoreLogic LP data set, and 46.0 percent of matched loans. In terms of geography, state shares of unmatched and matched loans were similar. Loans in California represented 23.1 percent of the full CoreLogic LP data set and 22.5 percent of matched records. Furthermore, nonprime borrowers with matched and unmatched records had similar FICO scores. For example, subprime borrowers with matched records had median FICO scores of 617, 620, and 617 for loans originated in 2004, 2005, and 2006, respectively; the corresponding scores for subprime borrowers with unmatched records were 617, 617, and 615. Likewise, Alt-A borrowers with matched records had median FICO scores of 708, 709, and 703 for 2004, 2005, and 2006, respectively; the corresponding scores for Alt-A borrowers with unmatched records were 706, 707, and 702. In addition, as shown in table 10, for each loan origination year and mortgage product type, median initial interest rates were identical or similar for borrowers with matched and unmatched records.
Table 10: Median Initial Interest Rates, by Loan Origination Year, Mortgage Product Type, and Match Status
Median initial interest rate, by loan origination year
2004 2005 2006
Mortgage product type Matched Unmatched Matched Unmatched Matched Unmatched
Short-term hybrid ARMs 7.000 6.990 7.350 7.375 8.375 8.375
Fixed-rate mortgages 6.625 6.500 6.500 6.500 7.400 7.450
Longer-term ARMs 5.625 5.625 6.125 6.125 6.875 6.875
Source: GAO analysis of CoreLogic LP and HMDA data.
Page 66 GAO-10-805 Nonprime Mortgages
Appendix III: GAO
A
Contact and Staff
cknowledgments
Page 67 GAO-10-805
Appendix III: GAO Contact and Staff Acknowledgments
William B. Shear, (202) 512-8678 or [email protected]
In addition to the individual named above, Steve Westley (Assistant Director), William Bates, Jan Bauer, Stephen Brown, Julianne Dieterich, DuEwa Kamara, John McGrail, John Mingus, Marc Molino, Bob Pollard, and Jennifer Schwartz made key contributions to this report.
Nonprime Mortgages
GAO Contact
Staff Acknowledgments
(250510)
GAO’s Mission The Government Accountability Office, the audit, evaluation, and investigative arm of Congress, exists to support Congress in meeting its constitutional responsibilities and to help improve the performance and accountability of the federal government for the American people. GAO examines the use of public funds; evaluates federal programs and policies; and provides analyses, recommendations, and other assistance to help Congress make informed oversight, policy, and funding decisions. GAO’s commitment to good government is reflected in its core values of accountability, integrity, and reliability.
The fastest and easiest way to obtain copies of GAO documents at no cost is through GAO’s Web site (www.gao.gov). Each weekday afternoon, GAO posts on its Web site newly released reports, testimony, and correspondence. To have GAO e-mail you a list of newly posted products, go to www.gao.gov and select “E-mail Updates.”
Obtaining Copies of GAO Reports and Testimony
Order by Phone The price of each GAO publication reflects GAO’s actual cost of production and distribution and depends on the number of pages in the publication and whether the publication is printed in color or black and white. Pricing and ordering information is posted on GAO’s Web site, http://www.gao.gov/ordering.htm.
Place orders by calling (202) 512-6000, toll free (866) 801-7077, or TDD (202) 512-2537.
Orders may be paid for using American Express, Discover Card, MasterCard, Visa, check, or money order. Call for additional information.
Contact:
Web site: www.gao.gov/fraudnet/fraudnet.htm E-mail: [email protected] Automated answering system: (800) 424-5454 or (202) 512-7470
Ralph Dawn, Managing Director, [email protected], (202) 512-4400 U.S. Government Accountability Office, 441 G Street NW, Room 7125 Washington, DC 20548
To Report Fraud, Waste, and Abuse in Federal Programs
Congressional Relations
Chuck Young, Managing Director, [email protected], (202) 512-4800 U.S. Government Accountability Office, 441 G Street NW, Room 7149 Washington, DC 20548
Public Affairs
Please Print on Recycled Paper