gamma-ray flaring activity from the gravitationally...
TRANSCRIPT
Title Gamma-Ray Flaring Activity from the Gravitationally LensedBlazar PKS 1830-211 Observed by Fermi LAT
Author(s)
Abdo, AA; Ackermann, M; Ajello, M; Allafort, A; Amin, MA;Baldini, L; Barbiellini, G; Bastieri, D; Bechtol, K; Bellazzini, R;Blandford, RD; Bonamente, E; Borgland, AW; Bregeon, J;Brigida, M; Buehler, R; Bulmash, D; Buson, S; Caliandro, GA;Cameron, RA; Caraveo, PA; Cavazzuti, E; Cecchi, C; Charles, E;Cheung, CC; Chiang, J; Chiaro, G; Ciprini, S; Claus, R; Cohen-Tanugi, J; Conrad, J; Corbet, RHD; Cutini, S; D'Ammando, F; deAngelis, A; de Palma, F; Dermer, CD; Drell, PS; Drlica-Wagner, A;Favuzzi, C; Finke, J; Focke, WB; Fukazawa, Y; Fusco, P;Gargano, F; Gasparrini, D; Gehrels, N; Giglietto, N; Giordano, F;Giroletti, M; Glanzman, T; Grenier, IA; Grove, JE; Guiriec, S;Hadasch, D; Hayashida, M; Hays, E; Hughes, RE; Inoue, Y;Jackson, MS; Jogler, T; Jóhannesson, G; Johnson, AS; Kamae,T; Knödlseder, J; Kuss, M; Lande, J; Larsson, S; Latronico, L;Longo, F; Loparco, F; Lott, B; Lovellette, MN; Lubrano, P;Madejski, GM; Mazziotta, MN; Mehault, J; Michelson, PF; Mizuno,T; Monzani, ME; Morselli, A; Moskalenko, IV; Murgia, S;Nemmen, R; Nuss, E; Ohno, M; Ohsugi, T; Paneque, D; Perkins,JS; Pesce-Rollins, M; Piron, F; Pivato, G; Porter, TA; Rainò, S;Rando, R; Razzano, M; Reimer, A; Reimer, O; Reyes, LC; Ritz, S;Romoli, C; Roth, M; Saz Parkinson, PM; Sgrò, C; Siskind, EJ;Spandre, G; Spinelli, P; Takahashi, H; Takeuchi, Y; Tanaka, T;Thayer, JG; Thayer, JB; Thompson, DJ; Tibaldo, L; Tinivella, M;Torres, D; Tosti, G; Troja, E; Tronconi, V; Usher, TL;Vandenbroucke, J; Vasileiou, V; Vianello, G; Vitale, V; Waite, AP;Werner, M; Winer, BL; Wood, KS
Citation The Astrophysical Journal, 2015, v. 799 n. 2, article no. 143
Issued Date 2015
URL http://hdl.handle.net/10722/208702
Rights This work is licensed under a Creative Commons Attribution-NonCommercial-NoDerivatives 4.0 International License.
The Astrophysical Journal, 799:143 (14pp), 2015 February 1 doi:10.1088/0004-637X/799/2/143C© 2015. The American Astronomical Society. All rights reserved.
GAMMA-RAY FLARING ACTIVITY FROM THE GRAVITATIONALLY LENSEDBLAZAR PKS 1830−211 OBSERVED BY Fermi LAT
A. A. Abdo1,59, M. Ackermann2, M. Ajello3, A. Allafort4, M. A. Amin5,6, L. Baldini7, G. Barbiellini8,9, D. Bastieri10,11,K. Bechtol4, R. Bellazzini7, R. D. Blandford4, E. Bonamente12,13, A. W. Borgland4, J. Bregeon14, M. Brigida15,16,R. Buehler2, D. Bulmash6,17, S. Buson10,11,60, G. A. Caliandro4,18, R. A. Cameron4, P. A. Caraveo19, E. Cavazzuti20,C. Cecchi12,13, E. Charles4, C. C. Cheung21, J. Chiang4, G. Chiaro11, S. Ciprini20,22,60, R. Claus4, J. Cohen-Tanugi14,
J. Conrad23,24,25,61, R. H. D. Corbet26,27, S. Cutini20,22, F. D’Ammando28,60, A. de Angelis29, F. de Palma15,16,C. D. Dermer21, P. S. Drell4, A. Drlica-Wagner30, C. Favuzzi15,16, J. Finke21,60, W. B. Focke4, Y. Fukazawa31,
P. Fusco15,16, F. Gargano16, D. Gasparrini20,22, N. Gehrels32, N. Giglietto15,16, F. Giordano15,16, M. Giroletti28,T. Glanzman4, I. A. Grenier33, J. E. Grove21, S. Guiriec32,62, D. Hadasch34, M. Hayashida35, E. Hays32,R. E. Hughes36, Y. Inoue4, M. S. Jackson37,24, T. Jogler4, G. Johannesson38, A. S. Johnson4, T. Kamae4,
J. Knodlseder39,40, M. Kuss7, J. Lande4, S. Larsson23,24,41, L. Latronico42, F. Longo8,9, F. Loparco15,16, B. Lott43,M. N. Lovellette21, P. Lubrano12,13, G. M. Madejski4, M. N. Mazziotta16, J. Mehault43, P. F. Michelson4, T. Mizuno44,
M. E. Monzani4, A. Morselli45, I. V. Moskalenko4, S. Murgia46, R. Nemmen26,27,32, E. Nuss14, M. Ohno31, T. Ohsugi44,D. Paneque4,47, J. S. Perkins32, M. Pesce-Rollins7, F. Piron14, G. Pivato11, T. A. Porter4, S. Raino15,16, R. Rando10,11,
M. Razzano7,63, A. Reimer4,34, O. Reimer4,34, L. C. Reyes48, S. Ritz49, C. Romoli11, M. Roth50, P. M. Saz Parkinson49,51,C. Sgro7, E. J. Siskind52, G. Spandre7, P. Spinelli15,16, H. Takahashi31, Y. Takeuchi53, T. Tanaka54, J. G. Thayer4,
J. B. Thayer4, D. J. Thompson32, L. Tibaldo4, M. Tinivella7, D. F. Torres55,56, G. Tosti12,13, E. Troja32,57,V. Tronconi11, T. L. Usher4, J. Vandenbroucke4, V. Vasileiou14, G. Vianello4, V. Vitale45,58, A. P. Waite4,
M. Werner34, B. L. Winer36, and K. S. Wood211 Center for Earth Observing and Space Research, College of Science, George Mason University, Fairfax, VA 22030, USA
2 Deutsches Elektronen Synchrotron DESY, D-15738 Zeuthen, Germany3 Space Sciences Laboratory, 7 Gauss Way, University of California, Berkeley, CA 94720-7450, USA
4 W. W. Hansen Experimental Physics Laboratory, Kavli Institute for Particle Astrophysics and Cosmology, Department ofPhysics and SLAC National Accelerator Laboratory, Stanford University, Stanford, CA 94305, USA
5 Kavli Institute for Cosmology and Institute of Astronomy, University of Cambridge, Madingley Road, Cambridge CB3 0HA, UK6 Department of Physics, Massachusetts Institute of Technology, Cambridge, MA 02138, USA
7 Istituto Nazionale di Fisica Nucleare, Sezione di Pisa, I-56127 Pisa, Italy8 Istituto Nazionale di Fisica Nucleare, Sezione di Trieste, I-34127 Trieste, Italy
9 Dipartimento di Fisica, Universita di Trieste, I-34127 Trieste, Italy10 Istituto Nazionale di Fisica Nucleare, Sezione di Padova, I-35131 Padova, Italy; [email protected]
11 Dipartimento di Fisica e Astronomia “G. Galilei,” Universita di Padova, I-35131 Padova, Italy12 Istituto Nazionale di Fisica Nucleare, Sezione di Perugia, I-06123 Perugia, Italy13 Dipartimento di Fisica, Universita degli Studi di Perugia, I-06123 Perugia, Italy
14 Laboratoire Univers et Particules de Montpellier, Universite Montpellier 2, CNRS/IN2P3, Montpellier, France15 Dipartimento di Fisica “M. Merlin” dell’Universita e del Politecnico di Bari, I-70126 Bari, Italy
16 Istituto Nazionale di Fisica Nucleare, Sezione di Bari, I-70126 Bari, Italy17 Department of Physics, Stanford University, Stanford, CA 94305, USA
18 Consorzio Interuniversitario per la Fisica Spaziale (CIFS), I-10133 Torino, Italy19 INAF-Istituto di Astrofisica Spaziale e Fisica Cosmica, I-20133 Milano, Italy
20 Agenzia Spaziale Italiana (ASI) Science Data Center, I-00133 Roma, Italy; [email protected] Space Science Division, Naval Research Laboratory, Washington, DC 20375-5352, USA; [email protected] Istituto Nazionale di Astrofisica—Osservatorio Astronomico di Roma, I-00040 Monte Porzio Catone (Roma), Italy
23 Department of Physics, Stockholm University, AlbaNova, SE-106 91 Stockholm, Sweden24 The Oskar Klein Centre for Cosmoparticle Physics, AlbaNova, SE-106 91 Stockholm, Sweden
25 The Royal Swedish Academy of Sciences, Box 50005, SE-104 05 Stockholm, Sweden26 Center for Research and Exploration in Space Science and Technology (CRESST) and NASA Goddard Space Flight Center, Greenbelt, MD 20771, USA
27 Department of Physics and Center for Space Sciences and Technology, University of Maryland Baltimore County, Baltimore, MD 21250, USA28 INAF Istituto di Radioastronomia, 40129 Bologna, Italy; [email protected]
29 Dipartimento di Fisica, Universita di Udine and Istituto Nazionale di Fisica Nucleare, Sezione di Trieste,Gruppo Collegato di Udine, I-33100 Udine, Italy
30 Fermilab, Batavia, IL 60510, USA31 Department of Physical Sciences, Hiroshima University, Higashi-Hiroshima, Hiroshima 739-8526, Japan
32 NASA Goddard Space Flight Center, Greenbelt, MD 20771, USA33 Laboratoire AIM, CEA-IRFU/CNRS/Universite Paris Diderot, Service d’Astrophysique, CEA Saclay, F-91191 Gif sur Yvette, France
34 Institut fur Astro- und Teilchenphysik and Institut fur Theoretische Physik, Leopold-Franzens-Universitat Innsbruck, A-6020 Innsbruck, Austria35 Institute for Cosmic-Ray Research, University of Tokyo, 5-1-5 Kashiwanoha, Kashiwa, Chiba 277-8582, Japan
36 Department of Physics, Center for Cosmology and Astro-Particle Physics, The Ohio State University, Columbus, OH 43210, USA37 Department of Physics, KTH Royal Institute of Technology, AlbaNova, SE-106 91 Stockholm, Sweden
38 Science Institute, University of Iceland, IS-107 Reykjavik, Iceland39 CNRS, IRAP, F-31028 Toulouse cedex 4, France
40 GAHEC, Universite de Toulouse, UPS-OMP, IRAP, Toulouse, France41 Department of Astronomy, Stockholm University, SE-106 91 Stockholm, Sweden
42 Istituto Nazionale di Fisica Nucleare, Sezione di Torino, I-10125 Torino, Italy43 Centre d’Etudes Nucleaires de Bordeaux Gradignan, IN2P3/CNRS, Universite Bordeaux 1, BP120, F-33175 Gradignan Cedex, France
44 Hiroshima Astrophysical Science Center, Hiroshima University, Higashi-Hiroshima, Hiroshima 739-8526, Japan45 Istituto Nazionale di Fisica Nucleare, Sezione di Roma “Tor Vergata,” I-00133 Roma, Italy
1
The Astrophysical Journal, 799:143 (14pp), 2015 February 1 Abdo et al.
46 Center for Cosmology, Physics and Astronomy Department, University of California, Irvine, CA 92697-2575, USA47 Max-Planck-Institut fur Physik, D-80805 Munchen, Germany
48 Department of Physics, California Polytechnic State University, San Luis Obispo, CA 93401, USA49 Santa Cruz Institute for Particle Physics, Department of Physics and Department of Astronomy and Astrophysics,
University of California at Santa Cruz, Santa Cruz, CA 95064, USA50 Department of Physics, University of Washington, Seattle, WA 98195-1560, USA
51 Department of Physics, The University of Hong Kong, Pokfulam Road, Hong Kong, China52 NYCB Real-Time Computing Inc., Lattingtown, NY 11560-1025, USA
53 Research Institute for Science and Engineering, Waseda University, 3-4-1, Okubo, Shinjuku, Tokyo 169-8555, Japan54 Department of Physics, Graduate School of Science, Kyoto University, Kyoto, Japan
55 Institut de Ciencies de l’Espai (IEEE-CSIC), Campus UAB, E-08193 Barcelona, Spain56 Institucio Catalana de Recerca i Estudis Avancats (ICREA), Barcelona, Spain
57 Department of Physics and Department of Astronomy, University of Maryland, College Park, MD 20742, USA58 Dipartimento di Fisica, Universita di Roma “Tor Vergata,” I-00133 Roma, Italy
Received 2013 March 10; accepted 2014 November 10; published 2015 January 23
ABSTRACT
The Large Area Telescope (LAT) on board the Fermi Gamma-ray Space Telescope routinely detects the MeV-peakedflat-spectrum radio quasar PKS 1830−211 (z = 2.507). Its apparent isotropic γ -ray luminosity (E > 100 MeV),averaged over ∼3 years of observations and peaking on 2010 October 14/15 at 2.9 × 1050 erg s−1, makes itamong the brightest high-redshift Fermi blazars. No published model with a single lens can account for all of theobserved characteristics of this complex system. Based on radio observations, one expects time-delayed variabilityto follow about 25 days after a primary flare, with flux about a factor of 1.5 less. Two large γ -ray flares ofPKS 1830−211 have been detected by the LAT in the considered period, and no substantial evidence for such adelayed activity was found. This allows us to place a lower limit of about 6 on the γ -ray flux ratio between the twolensed images. Swift XRT observations from a dedicated Target of Opportunity program indicate a hard spectrumwith no significant correlation of X-ray flux with the γ -ray variability. The spectral energy distribution can bemodeled with inverse Compton scattering of thermal photons from the dusty torus. The implications of the LATdata in terms of variability, the lack of evident delayed flare events, and different radio and γ -ray flux ratios arediscussed. Microlensing effects, absorption, size and location of the emitting regions, the complex mass distributionof the system, an energy-dependent inner structure of the source, and flux suppression by the lens galaxy for oneimage path may be considered as hypotheses for understanding our results.
Key words: gamma rays: galaxies – gamma rays: general – gravitational lensing: strong – quasars: individual(PKS 1830-211) – radiation mechanisms: non-thermal – X-rays: individual (PKS 1830-211)
1. INTRODUCTION
The flat-spectrum radio quasar (FSRQ) PKS 1830−211 (alsoknown as TXS 1830−210, RXJ 1833.6−210, MRC 1830−211,2FGLJ 1833.6−2104) has met with considerable attention, be-cause it is such a good example of a gravitationally lensedsource. The two lines of sight toward PKS 1830−211 havebeen used as cosmological probes: temperature of the cos-mic microwave background, variations in the fundamental con-stants, the Hubble constant estimation (Bagdonaite et al. 2013;Blandford & Narayan 1992). This object also offers a uniqueopportunity to study both the interstellar medium of the lensgalaxy and the relativistic jet of the background γ -ray blazar.PKS 1830−211 was discovered as a single source in the Parkescatalog, but later radio observations by the Very Large Ar-ray (VLA) and Australian Telescope Compact Array (ATCA)clearly revealed two sources, one in the northeast (NE) and onein the southwest (SW), separated by 0.′′98 and connected by anEinstein ring (Pramesh Rao & Subrahmanyan 1988; Jaunceyet al. 1991). When the source, lensing foreground object, andobserver lie along a straight line, the theory of gravitational
59 Resident at Naval Research Laboratory, Washington, DC 20375, USA.60 First corresponding author: [email protected]. Co-correspondingauthors: [email protected]. [email protected]@ira.inaf.it.61 Royal Swedish Academy of Sciences Research Fellow, funded by a grantfrom the K. A. Wallenberg Foundation.62 NASA Postdoctoral Program Fellow, USA.63 Funded by contract FIRB-2012-RBFR12PM1F from the Italian Ministry ofEducation, University and Research (MIUR).
lensing (e.g., Einstein 1936) shows that a circle, known as theEinstein ring, may be formed (Schneider et al. 1992), whilesmaller rings could appear inside this main ring if the lens is aSchwarzschild black hole. The lens magnification factor is theratio of the flux of the lens image to the flux of the unlensedsource and is equal to the ratio of the solid angles of the imageand the unlensed source. The NE image has a radio flux densityabout 1.5 times as bright as the SW one at 8.6 GHz (Lovellet al. 1998). Molecular absorption lines revealed lensing galax-ies located at z = 0.88582 (Wiklind & Combes 1996; Lovellet al. 1996; Frye et al. 1999; Lehar et al. 2000; Muller et al.2011; Aller et al. 2012) and z = 0.19 (Lovell et al. 1996), sug-gesting that PKS 1830−211 may be a compound gravitationallylensed system (Lovell et al. 1996). These lensing galaxies wereconfirmed by Gemini and the Hubble Space Telescope (HST;Courbin et al. 2002). A detailed exploration of this system atoptical wavelengths is hampered by its proximity on the sky tothe Galactic plane and the bulge of the Milky Way (the Galacticcoordinates of PKS 1830−211 being l = 12.◦17, b = −5.◦71),leading to considerable dust extinction (Courbin et al. 1998;Gregg et al. 2002, and references there in) and absorption. Ab-sorption by molecular species (>30 different species) from thetwo foreground galaxies also peculiarly characterizes the radioPKS 1830−211 (Wiklind & Combes 1996, 1998; Muller et al.2011). Molecular absorptions from the intervening galaxy atz = 0.886 also allowed us to put a limit on proton-to-electronmass ratio (Bagdonaite et al. 2013).
Despite its position near the Galactic plane and center,progress has been made in studying the source in the optical
2
The Astrophysical Journal, 799:143 (14pp), 2015 February 1 Abdo et al.
and near-infrared (NIR). Courbin et al. (1998, 2002) and Fryeet al. (1999) used a deconvolution algorithm to create optical/NIR images of the region and found the counterparts to theradio sources, including highly reddened images of the lensinggalaxies. IR spectroscopy allowed for the redshift of the quasaritself (z = 2.507) to be directly measured (Lidman et al. 1999).
However, even before the redshifts of PKS 1830−211 or itslensing galaxies were known, attempts were made to model thesource as a lens (Kochanek & Narayan 1992; Nair et al. 1993).Since photons for the source and the image take different pathsto reach Earth, it is expected that there will be a light-travel timedifference and consequently a time delay between the photonsthat arrive from the different lensed images. That is, variationsin the light curve of the SW source will have the same shape asthose from the NE source but arrive later with a constant timedelay and have a smaller magnitude, with respect to variations inthe NE source. Assuming the same emission region at differentfrequency bands, the time delay should be the same since stronggravitational lensing (macrolensing) is an achromatic process.Because PKS 1830−211 is a blazar that has shown variabilityin MeV–GeV bands (COMPTEL, EGRET, AGILE, Fermi), thisopened up the possibility that this time delay can be measuredin γ rays.
Modeling combined with redshift and time delay measurescan be used to measure Hubble’s constant (Blandford & Narayan1992). On the other hand, PKS 1830−211 is a compound lensingsystem, with possible microlensing/millilensing substructuresbesides the two foreground lensing galaxies at z = 0.886 andz = 0.19. Microlensing in the X-ray band is suggested byOshima et al. (2001). An energy-dependent flux ratio of thePKS 1830−211 lens images is found in submillimeter bands asclearly associated with the γ -ray flare of 2012 June and varyingwith time (Ciprini 2012; Martı-Vidal et al. 2013).
A time delay of Δt = 26+4−5 days was measured from the light
curves of the two lensed images by Lovell et al. (1998) withATCA. They used the values of the delay obtained, along withthe model of Nair et al. (1993), to measure Hubble’s constantto be H0 = 69+16
−9 km s−1 Mpc−1, which is consistent with themost recent measurements (Ade et al. 2014). Using molecularabsorption features, Wiklind & Combes (2001) found a timedelay of 24+5
−4 days, consistent with the value found by Lovellet al. (1998). More detailed modeling of the lensing system,using the time delay of Δt ≈ 25 days, finds similar values of H0(e.g., Lehar et al. 2000; Witt et al. 2000). A different time delayof Δt = 44 ± 9 days was measured from the radio light curvesof the two lensed images by van Ommen et al. (1995) using theVLA. Lovell et al. (1998) attribute the difference between theirmeasured time delay and the one found by van Ommen et al.(1995) as being caused by “not correctly accounting for thecontribution of the Einstein ring flux density when calculatingthe magnification ratio.”
PKS 1830−211 is the brightest gravitational lens in thesky at centimeter wavelengths, hard X-ray, and MeV energies.Chandra, XMM-Newton, Swift BAT, and INTEGRAL havemeasured very hard spectra (ΓX ∼ 1) and high absorbingcolumn densities accounting for a spectral break below ∼4 keV(de Rosa et al. 2005; Foschini et al. 2006; Zhang et al. 2008).
PKS 1830−211 was detected by COMPTEL (Collmar 2006)in the 0.75–30 MeV band, by EGRET (above 100 MeV, 3EGJ1832−2110; Mattox et al. 1997a; Combi & Romero 1998;Hartman et al. 1999; Torres et al. 2003), and more recentlyby AGILE (Striani et al. 2009; Donnarumma et al. 2011, andreferences therein).
It can be found in the first and second Fermi LAT source cat-alogs (1FGLJ 1833.6−2103, 2FGLJ 1833.6−2104, Abdo et al.2010a; Nolan et al. 2012) with formal significances of about41σ and 67σ , respectively. The radio source PKS 1830−211and the intervening galaxies are within the LAT error ellipse,as a few nearby field galaxies; nevertheless, there is no sourceother than PKS 1830−211 with radio flux density � 10 mJy,making it the source of γ rays.
Although the NE and SW images of PKS 1830−211 cannotbe resolved by the LAT, the emission from the two imagesin principle can be distinguished by measuring a time delayfrom variable γ -ray light curves. This possibility was studiedby Barnacka et al. (2011), who reported a 27.1 ± 0.6 day timedelay found in the LAT light curve of this source. This value isin agreement with values found in the radio band (e.g., Lovellet al. 1998; van Ommen et al. 1995; Wiklind & Combes 2001).
PKS 1830−211 is an FSRQ characterized by a markedγ -ray Compton luminosity dominance (EGRET/COMPTELobservations; Collmar 2006). The broadband νFν spectralenergy distribution (SED) has been modeled with a combinationof synchrotron, synchrotron self-Compton (SSC), and externalCompton (EC) scattering of dust torus photons assuming that thebroadband data were magnified by a factor of 10 by the lens (deRosa et al. 2005). Foschini et al. (2006) and Celotti & Ghisellini(2008) modeled this source without correcting the SED data forextinction or magnification, which are not well known, and usedthe broad-line region (BLR) as the main seed photon source.Both models provide reasonable descriptions of this object.Hadronic models predict neutrino production coincident withγ -ray flares, and this motivates searches for neutrino eventscoincident with LAT flares (e.g., Cruz et al. 2013).
An outburst observed from the γ -ray point source positionallyconsistent with PKS 1830−211 was observed by Fermi LAT in2010 October (Ciprini 2010). This is the largest flare observedsince the beginning of the Fermi survey and triggered rapid-response Target of Opportunity (ToO) observations by theSwift satellite.64 AGILE also reported a high flux measurementobtained from 2010 October 15 through 17 (Donnarumma et al.2011, and references therein).
In this paper we explore the γ -ray properties of PKS1830−211 as observed by the Fermi LAT, with particular at-tention paid to the main outburst of 2010 October and thesecond-brightest flaring period (2010 December–2011 January;Section 2). In Section 3 we discuss the γ -ray flux light curve andthe search for time-lag signatures, an indicator of gravitationallensing. The Swift observations and results are presented inSection 4, and the multifrequency SEDs and spectral modelingare reported in Section 5. We conclude in Section 6.
2. FERMI LAT OBSERVATIONS
The Fermi LAT analysis was performed with the stan-dard LAT ScienceTools software package (version v9r23p1)and was based on data collected in the period from 2008August 4 to 2011 July 25 (from MJD 54,682.65 to 55,767.65,almost 3 yr). We first produced an LAT spectrum for PKS1830−211 over this entire time interval, using only the eventclass designated as P6_DIFFUSE (class==3), with correspond-ing P6_V3_DIFFUSE instrument response functions (IRFs,
64 Thanks to a Guest Investigator program Swift Cycle AO-6 for flaring LATblazars (PI: L. Reyes).
3
The Astrophysical Journal, 799:143 (14pp), 2015 February 1 Abdo et al.
Ackermann et al. 2012),65 and selecting events in a circularRegion of Interest (RoI) with 7◦ radius centered on the targetposition from the second Fermi source catalog 2FGL. To reducecontamination from diffuse Galactic emission and nearby pointsources, a low-energy cut of 200 MeV was used (comparedto the usual cut of 100 MeV, where the point-spread function[PSF] is relatively large). A high-energy cut of 100 GeV wasalso implemented.
To avoid the contamination due to the γ -ray bright Earthlimb in our analysis, all events with zenith angles >105◦ wereexcluded. Time intervals when the Earth entered the LAT field ofview (FOV) are excluded, selecting only photons with spacecraftrocking angles < 52◦. The unbinned maximum likelihoodtechnique (gtlike tool) accounted for all 21 neighboringsources and the diffuse emission in the physical model of theRoI together with the target source. The RoI model is fit tothe data assuming for the source PKS 1830−211 a power-lawspectrum between minimum and maximum energies (Emin andEmax, respectively), dN/dE ∝ E−Γγ , with γ -ray photon indexΓγ left free in the fit. A more complex log-parabola modelis reported in the 2 yr accumulated data of the 2FGL catalog(Nolan et al. 2012) for PKS 1830−211, but for the purposes ofour study and the extraction of flux light curves in much shortertime bins, the power-law shape is found to adequately reproducethe source spectrum (the spectral parameter values obtained withthe different models agree within the statistical errors, and thedifference in flux values is found to be on average 5%).
Source positions were fixed. The Galactic (gll_iem_v02.fit) and the isotropic (isotropic_iem_v02.fit) back-ground models66 were used with their normalizations left as freeparameters in each time bin, facilitating reliable convergence ofthe likelihood model fits and a reduced computational time. Thisprocedure was the same as in previous works (e.g., Tanaka et al.2013). The isotropic component included both the contributionfrom the extragalactic diffuse emission and from the residualcharged-particle backgrounds. In addition, all γ -ray sources upto 10◦ around the target were included in the fit with power-law spectral models. The normalization and the photon indexwere left free for each point source within a 5◦ radius of PKS1830−211. Sources between 5◦ and 7◦ had just their normaliza-tions free (using for each source the fixed photon index reportedin the 2FGL catalog), while sources within 7◦ and 10◦ had all pa-rameters fixed. By exception, the pulsar PSRJ1809−2332 wasmodeled with an exponentially cutoff power law in which thephoton index at low energy, the cutoff energy, and the normaliza-tion factor were left free. The power-law fit to PKS 1830−211over the entire period in the 0.2–100 GeV energy range gavean integrated flux of (20.4 ± 0.4)×10−8 photons cm−2 s−1 anda steep γ -ray photon index of Γγ = 2.55 ± 0.02.
Next, we produced a flux light curve for PKS 1830−211using a bin-by-bin maximum likelihood fit (gtlike tool) in the200 MeV–100 GeV energy range with regular time intervals(12 hr, 2 days, and 1 week). We did this assuming the simplestappropriate model, the power-law spectrum, by freezing thephoton index for this source in the individual time bins equal tothe value obtained for the spectral fit over the entire time range,
65 These event classes and IRFs were used to better compare our results withthose of Barnacka et al. (2011), where a two-day bin aperture photometry lightcurve of PKS 1830−211 (300 MeV–30 GeV flux) was extracted from LATdata with P6_V3_DIFFUSE IRFs from 2008 August 4 through 2010October 13.66 LAT background models: fermi.gsfc.nasa.gov/ssc/data/access/lat/BackgroundModels.html.
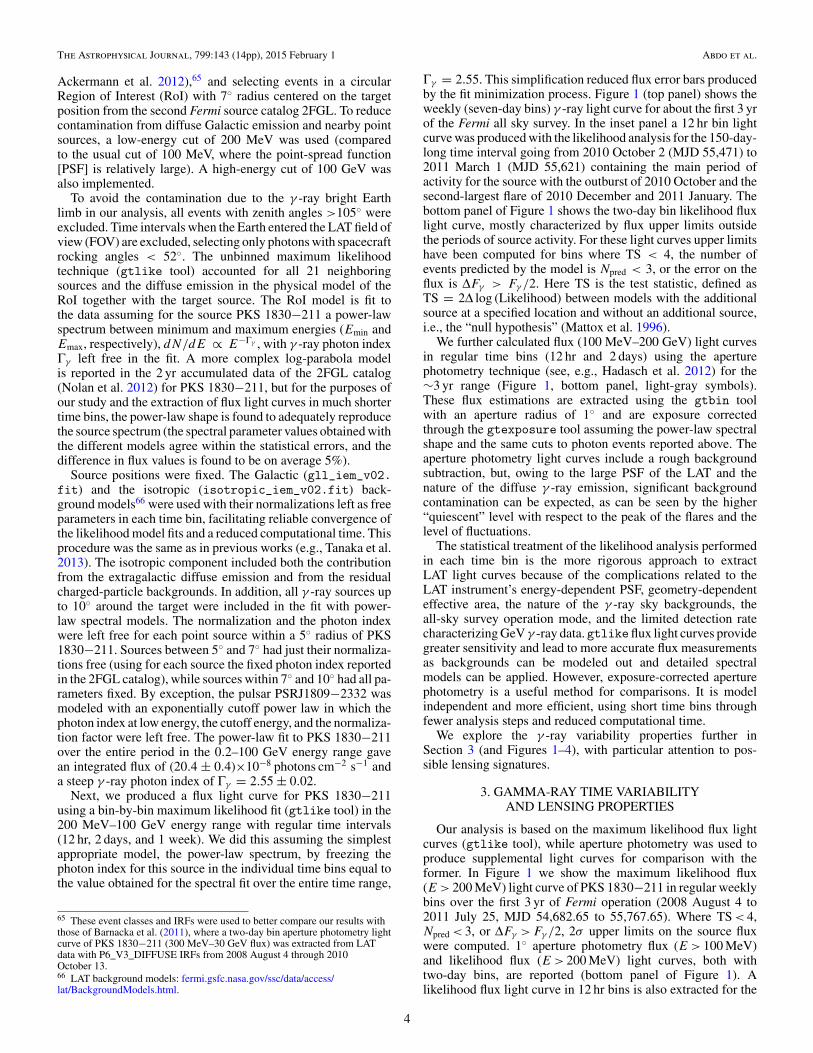
Γγ = 2.55. This simplification reduced flux error bars producedby the fit minimization process. Figure 1 (top panel) shows theweekly (seven-day bins) γ -ray light curve for about the first 3 yrof the Fermi all sky survey. In the inset panel a 12 hr bin lightcurve was produced with the likelihood analysis for the 150-day-long time interval going from 2010 October 2 (MJD 55,471) to2011 March 1 (MJD 55,621) containing the main period ofactivity for the source with the outburst of 2010 October and thesecond-largest flare of 2010 December and 2011 January. Thebottom panel of Figure 1 shows the two-day bin likelihood fluxlight curve, mostly characterized by flux upper limits outsidethe periods of source activity. For these light curves upper limitshave been computed for bins where TS < 4, the number ofevents predicted by the model is Npred < 3, or the error on theflux is ΔFγ > Fγ /2. Here TS is the test statistic, defined asTS = 2Δ log (Likelihood) between models with the additionalsource at a specified location and without an additional source,i.e., the “null hypothesis” (Mattox et al. 1996).
We further calculated flux (100 MeV–200 GeV) light curvesin regular time bins (12 hr and 2 days) using the aperturephotometry technique (see, e.g., Hadasch et al. 2012) for the∼3 yr range (Figure 1, bottom panel, light-gray symbols).These flux estimations are extracted using the gtbin toolwith an aperture radius of 1◦ and are exposure correctedthrough the gtexposure tool assuming the power-law spectralshape and the same cuts to photon events reported above. Theaperture photometry light curves include a rough backgroundsubtraction, but, owing to the large PSF of the LAT and thenature of the diffuse γ -ray emission, significant backgroundcontamination can be expected, as can be seen by the higher“quiescent” level with respect to the peak of the flares and thelevel of fluctuations.
The statistical treatment of the likelihood analysis performedin each time bin is the more rigorous approach to extractLAT light curves because of the complications related to theLAT instrument’s energy-dependent PSF, geometry-dependenteffective area, the nature of the γ -ray sky backgrounds, theall-sky survey operation mode, and the limited detection ratecharacterizing GeV γ -ray data. gtlikeflux light curves providegreater sensitivity and lead to more accurate flux measurementsas backgrounds can be modeled out and detailed spectralmodels can be applied. However, exposure-corrected aperturephotometry is a useful method for comparisons. It is modelindependent and more efficient, using short time bins throughfewer analysis steps and reduced computational time.
We explore the γ -ray variability properties further inSection 3 (and Figures 1–4), with particular attention to pos-sible lensing signatures.
3. GAMMA-RAY TIME VARIABILITYAND LENSING PROPERTIES
Our analysis is based on the maximum likelihood flux lightcurves (gtlike tool), while aperture photometry was used toproduce supplemental light curves for comparison with theformer. In Figure 1 we show the maximum likelihood flux(E > 200 MeV) light curve of PKS 1830−211 in regular weeklybins over the first 3 yr of Fermi operation (2008 August 4 to2011 July 25, MJD 54,682.65 to 55,767.65). Where TS < 4,Npred < 3, or ΔFγ > Fγ /2, 2σ upper limits on the source fluxwere computed. 1◦ aperture photometry flux (E > 100 MeV)and likelihood flux (E > 200 MeV) light curves, both withtwo-day bins, are reported (bottom panel of Figure 1). Alikelihood flux light curve in 12 hr bins is also extracted for the
4
The Astrophysical Journal, 799:143 (14pp), 2015 February 1 Abdo et al.
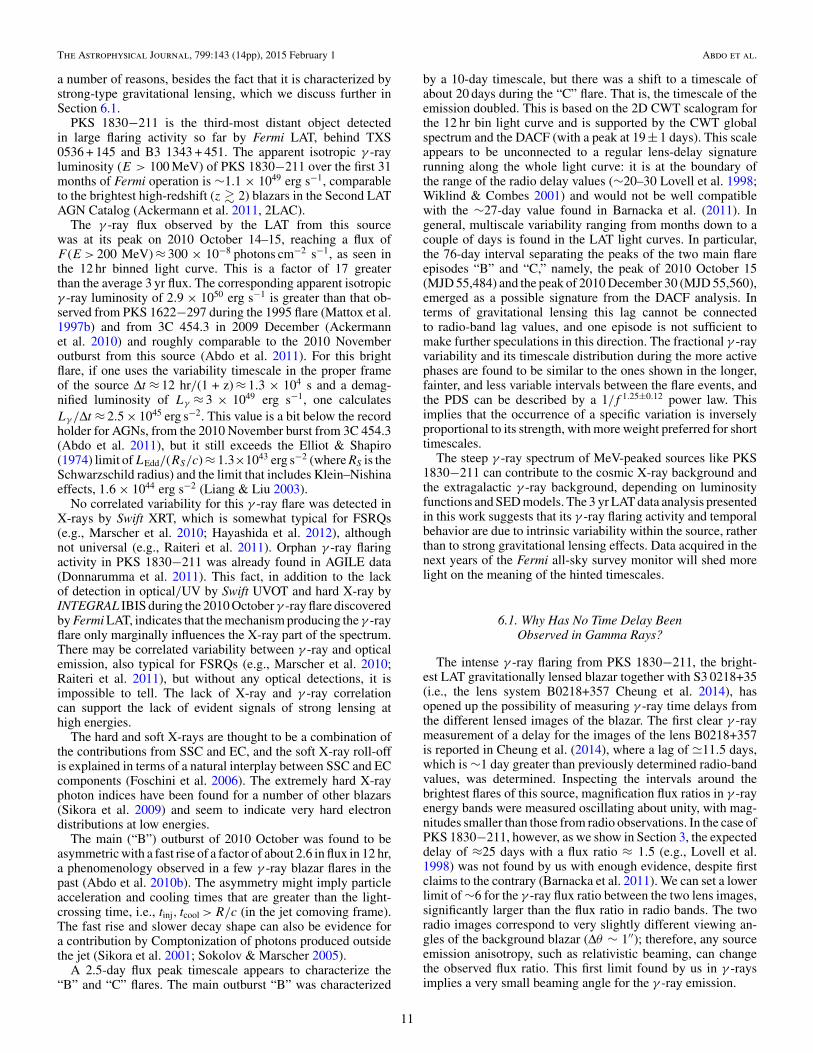
Figure 1. Top: 3 yr (1085 days) LAT γ -ray flux (E > 200 MeV) light curve of PKS 1830−211 in weekly bins, extracted with the gtlike fit in each bin from 2008August 4 to 2011 July 25 (MJD 54,682.65 to 55,767.65). Top inset panel: gtlike light curve detailing the ∼150 day period (MJD interval: 55,471–55,621, i.e.,from 2010 October 2 to 2011 March 1) flux light curve extracted with 12 hr bins and containing the “B” and “C” intervals when the main outburst of 2010 Octoberand the second-largest, and double-peaked, flare of 2010 December and 2011 January occurred. In both panels vertical lines refer to 2σ upper limits on the sourceflux. Upper limits have been computed for bins where TS < 4, Npred < 3, or ΔFγ > Fγ /2. Bottom: 1◦ aperture photometry flux (E > 100 MeV) and gtlike flux(E > 200 MeV) light curve of PKS 1830−211 in two-day bins for comparison.
∼150-day interval of the most active phase for the source (“B”and “C” intervals, upper inset panel). Aperture photometry3 yr light curves (one-day/two-day bins) are also extracted indifferent positions using non-PKS 1830−211 photons withinthe RoI, both along and outside the ecliptic path to betterunderstand possible spurious effects caused by the Sun andMoon passages. We used the same event class and IRFs(P6_V6_DIFFUSE) used in Barnacka et al. (2011) with morechecks using P6_V11_DIFFUSE IRFs, but different energyrange selection (200 MeV–100 GeV) and different variabilityanalysis and time bin sizes.
The “A” interval contains the first γ -ray brightening seen bythe LAT, near the end of 2009. The announcement of a detectionby AGILE on 2009 October 12 and 13, MJD 55,116–55,117(Donnarumma et al. 2011, and references therein), occurredalready some weeks before the “A” interval.
To explore the behavior of PKS 1830−211 during the mainoutburst (interval “B”) and the second-brightest flaring period(interval “C”) in greater detail, we performed power-law fits tothe source in 12 hr bins, with both the flux and photon indices
(Γγ ) left as free parameters. This is in contrast to the likelihoodlight curves in Figure 1, where Γγ was fixed. Note that 12 hrcorresponds to ∼8 Fermi orbits, so that exposures from bin tobin are roughly the same. The results can be found in Figure 2,where we searched possible spectral trends.
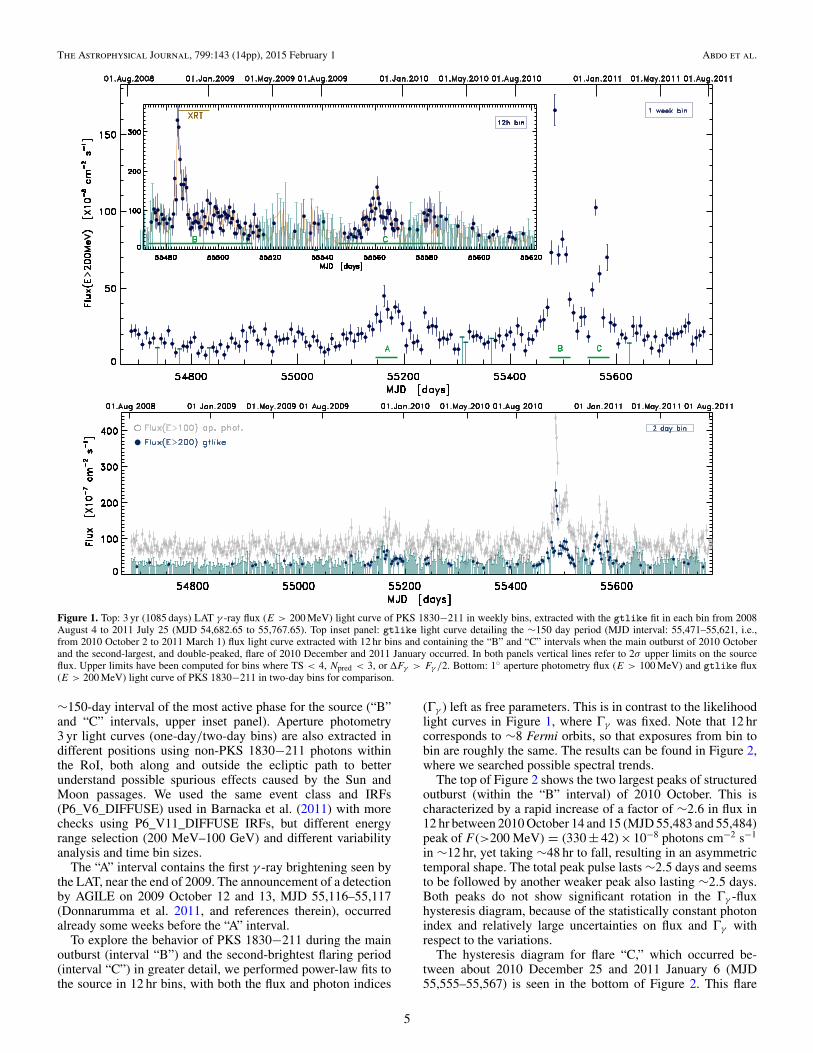
The top of Figure 2 shows the two largest peaks of structuredoutburst (within the “B” interval) of 2010 October. This ischaracterized by a rapid increase of a factor of ∼2.6 in flux in12 hr between 2010 October 14 and 15 (MJD 55,483 and 55,484)peak of F (>200 MeV) = (330 ± 42) × 10−8 photons cm−2 s−1
in ∼12 hr, yet taking ∼48 hr to fall, resulting in an asymmetrictemporal shape. The total peak pulse lasts ∼2.5 days and seemsto be followed by another weaker peak also lasting ∼2.5 days.Both peaks do not show significant rotation in the Γγ -fluxhysteresis diagram, because of the statistically constant photonindex and relatively large uncertainties on flux and Γγ withrespect to the variations.
The hysteresis diagram for flare “C,” which occurred be-tween about 2010 December 25 and 2011 January 6 (MJD55,555–55,567) is seen in the bottom of Figure 2. This flare
5
The Astrophysical Journal, 799:143 (14pp), 2015 February 1 Abdo et al.
Figure 2. Five-day zooms on the evolution of the γ -ray photon index of PKS1830−211 as a function of the γ -ray flux during the highest flux peaks of thetwo main flare events for the source (top and bottom panels). These peaks arecontained in the “B” and “C” intervals of the 12 hr bin light curve reported inthe top inset panel of Figure 1. Here the photon index parameter is left free inthe likelihood fit. Bars represent 1σ errors.
displays a temporal structure characterized by two peaks ofabout a 2.5 day duration each. The second peak reaches a fluxvalue of (159 ± 27) × 10−8 photons cm−2 s−1, roughly half ofthe peak flux of the “B” flare. The flare softens significantly(bins 6, 7, and 8 in the bottom of Figure 2) to Γγ ∼ 2.8, beforeturning to its typical spectrum of Γγ ∼ 2.4 during the decay.
Variability on timescales ranging from about 2 months downto a couple of days is seen in these LAT γ -ray light curves. Twopower density spectra (PDSs) normalized to fractional varianceper unit frequency (f = 1/t) ( rms2 I−2 day−1), are shownin the inset panel of Figure 3. One is calculated from the 3 yrand weekly light curve and one from the 12 hr bin light curveextracted for 150 days between 2010 October 2 (MJD 55,471)and 2011 March 1 (MJD 55,621) (top main and inset panelsof Figure 1, respectively). Following Abdo et al. (2010b), weconsider time bins with flux upper limits replaced by a value(10−12 photons cm−2 s−1), i.e., below the LAT detection limits.This allows us to evenly sample the light curve and limit thebias caused by data gaps. The fraction of upper limits was 5%and 9% for the weekly and 12 hr bin light curves, respectively.Different choices (e.g., replacing upper limits with their half-limit values) affect the PDS slope estimates by a few percent,which is substantially less than other uncertainties. The white-noise level was estimated from the rms of the flux errors andwas subtracted for each PDS.
Both PDSs are in good agreement with each other, meaningthat the fractional variability and its timescale distributionduring the more active “B” and “C” epochs are the same asduring the longer and fainter periods between the flaring events.
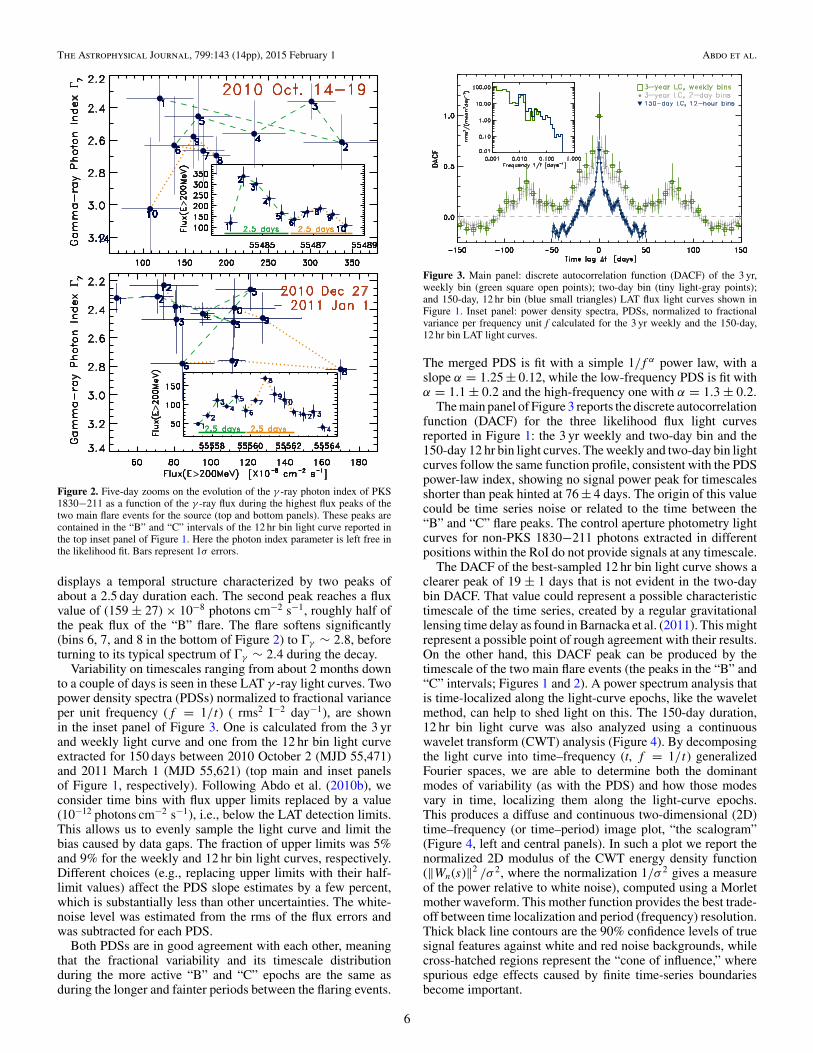
Figure 3. Main panel: discrete autocorrelation function (DACF) of the 3 yr,weekly bin (green square open points); two-day bin (tiny light-gray points);and 150-day, 12 hr bin (blue small triangles) LAT flux light curves shown inFigure 1. Inset panel: power density spectra, PDSs, normalized to fractionalvariance per frequency unit f calculated for the 3 yr weekly and the 150-day,12 hr bin LAT light curves.
The merged PDS is fit with a simple 1/f α power law, with aslope α = 1.25 ± 0.12, while the low-frequency PDS is fit withα = 1.1 ± 0.2 and the high-frequency one with α = 1.3 ± 0.2.
The main panel of Figure 3 reports the discrete autocorrelationfunction (DACF) for the three likelihood flux light curvesreported in Figure 1: the 3 yr weekly and two-day bin and the150-day 12 hr bin light curves. The weekly and two-day bin lightcurves follow the same function profile, consistent with the PDSpower-law index, showing no signal power peak for timescalesshorter than peak hinted at 76 ± 4 days. The origin of this valuecould be time series noise or related to the time between the“B” and “C” flare peaks. The control aperture photometry lightcurves for non-PKS 1830−211 photons extracted in differentpositions within the RoI do not provide signals at any timescale.
The DACF of the best-sampled 12 hr bin light curve shows aclearer peak of 19 ± 1 days that is not evident in the two-daybin DACF. That value could represent a possible characteristictimescale of the time series, created by a regular gravitationallensing time delay as found in Barnacka et al. (2011). This mightrepresent a possible point of rough agreement with their results.On the other hand, this DACF peak can be produced by thetimescale of the two main flare events (the peaks in the “B” and“C” intervals; Figures 1 and 2). A power spectrum analysis thatis time-localized along the light-curve epochs, like the waveletmethod, can help to shed light on this. The 150-day duration,12 hr bin light curve was also analyzed using a continuouswavelet transform (CWT) analysis (Figure 4). By decomposingthe light curve into time–frequency (t, f = 1/t) generalizedFourier spaces, we are able to determine both the dominantmodes of variability (as with the PDS) and how those modesvary in time, localizing them along the light-curve epochs.This produces a diffuse and continuous two-dimensional (2D)time–frequency (or time–period) image plot, “the scalogram”(Figure 4, left and central panels). In such a plot we report thenormalized 2D modulus of the CWT energy density function(‖Wn(s)‖2 /σ 2, where the normalization 1/σ 2 gives a measureof the power relative to white noise), computed using a Morletmother waveform. This mother function provides the best trade-off between time localization and period (frequency) resolution.Thick black line contours are the 90% confidence levels of truesignal features against white and red noise backgrounds, whilecross-hatched regions represent the “cone of influence,” wherespurious edge effects caused by finite time-series boundariesbecome important.
6
The Astrophysical Journal, 799:143 (14pp), 2015 February 1 Abdo et al.
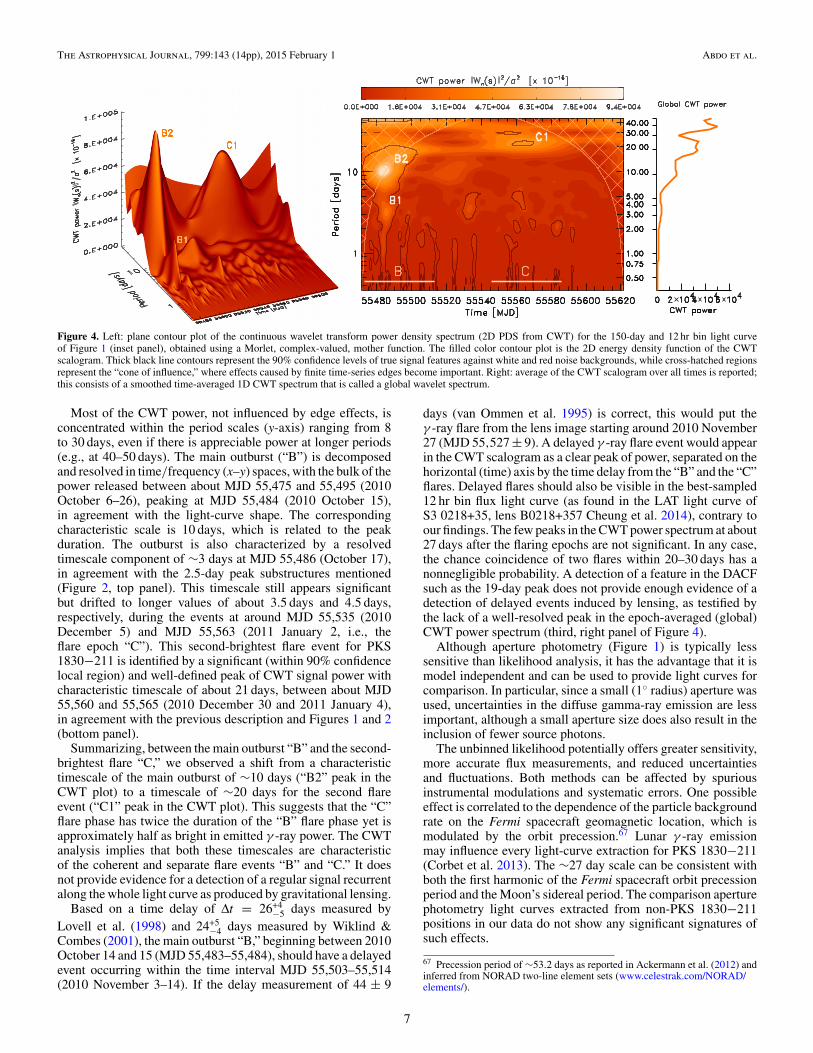
Figure 4. Left: plane contour plot of the continuous wavelet transform power density spectrum (2D PDS from CWT) for the 150-day and 12 hr bin light curveof Figure 1 (inset panel), obtained using a Morlet, complex-valued, mother function. The filled color contour plot is the 2D energy density function of the CWTscalogram. Thick black line contours represent the 90% confidence levels of true signal features against white and red noise backgrounds, while cross-hatched regionsrepresent the “cone of influence,” where effects caused by finite time-series edges become important. Right: average of the CWT scalogram over all times is reported;this consists of a smoothed time-averaged 1D CWT spectrum that is called a global wavelet spectrum.
Most of the CWT power, not influenced by edge effects, isconcentrated within the period scales (y-axis) ranging from 8to 30 days, even if there is appreciable power at longer periods(e.g., at 40–50 days). The main outburst (“B”) is decomposedand resolved in time/frequency (x–y) spaces, with the bulk of thepower released between about MJD 55,475 and 55,495 (2010October 6–26), peaking at MJD 55,484 (2010 October 15),in agreement with the light-curve shape. The correspondingcharacteristic scale is 10 days, which is related to the peakduration. The outburst is also characterized by a resolvedtimescale component of ∼3 days at MJD 55,486 (October 17),in agreement with the 2.5-day peak substructures mentioned(Figure 2, top panel). This timescale still appears significantbut drifted to longer values of about 3.5 days and 4.5 days,respectively, during the events at around MJD 55,535 (2010December 5) and MJD 55,563 (2011 January 2, i.e., theflare epoch “C”). This second-brightest flare event for PKS1830−211 is identified by a significant (within 90% confidencelocal region) and well-defined peak of CWT signal power withcharacteristic timescale of about 21 days, between about MJD55,560 and 55,565 (2010 December 30 and 2011 January 4),in agreement with the previous description and Figures 1 and 2(bottom panel).
Summarizing, between the main outburst “B” and the second-brightest flare “C,” we observed a shift from a characteristictimescale of the main outburst of ∼10 days (“B2” peak in theCWT plot) to a timescale of ∼20 days for the second flareevent (“C1” peak in the CWT plot). This suggests that the “C”flare phase has twice the duration of the “B” flare phase yet isapproximately half as bright in emitted γ -ray power. The CWTanalysis implies that both these timescales are characteristicof the coherent and separate flare events “B” and “C.” It doesnot provide evidence for a detection of a regular signal recurrentalong the whole light curve as produced by gravitational lensing.
Based on a time delay of Δt = 26+4−5 days measured by
Lovell et al. (1998) and 24+5−4 days measured by Wiklind &
Combes (2001), the main outburst “B,” beginning between 2010October 14 and 15 (MJD 55,483–55,484), should have a delayedevent occurring within the time interval MJD 55,503–55,514(2010 November 3–14). If the delay measurement of 44 ± 9
days (van Ommen et al. 1995) is correct, this would put theγ -ray flare from the lens image starting around 2010 November27 (MJD 55,527 ± 9). A delayed γ -ray flare event would appearin the CWT scalogram as a clear peak of power, separated on thehorizontal (time) axis by the time delay from the “B” and the “C”flares. Delayed flares should also be visible in the best-sampled12 hr bin flux light curve (as found in the LAT light curve ofS3 0218+35, lens B0218+357 Cheung et al. 2014), contrary toour findings. The few peaks in the CWT power spectrum at about27 days after the flaring epochs are not significant. In any case,the chance coincidence of two flares within 20–30 days has anonnegligible probability. A detection of a feature in the DACFsuch as the 19-day peak does not provide enough evidence of adetection of delayed events induced by lensing, as testified bythe lack of a well-resolved peak in the epoch-averaged (global)CWT power spectrum (third, right panel of Figure 4).
Although aperture photometry (Figure 1) is typically lesssensitive than likelihood analysis, it has the advantage that it ismodel independent and can be used to provide light curves forcomparison. In particular, since a small (1◦ radius) aperture wasused, uncertainties in the diffuse gamma-ray emission are lessimportant, although a small aperture size does also result in theinclusion of fewer source photons.
The unbinned likelihood potentially offers greater sensitivity,more accurate flux measurements, and reduced uncertaintiesand fluctuations. Both methods can be affected by spuriousinstrumental modulations and systematic errors. One possibleeffect is correlated to the dependence of the particle backgroundrate on the Fermi spacecraft geomagnetic location, which ismodulated by the orbit precession.67 Lunar γ -ray emissionmay influence every light-curve extraction for PKS 1830−211(Corbet et al. 2013). The ∼27 day scale can be consistent withboth the first harmonic of the Fermi spacecraft orbit precessionperiod and the Moon’s sidereal period. The comparison aperturephotometry light curves extracted from non-PKS 1830−211positions in our data do not show any significant signatures ofsuch effects.
67 Precession period of ∼53.2 days as reported in Ackermann et al. (2012) andinferred from NORAD two-line element sets (www.celestrak.com/NORAD/elements/).
7
The Astrophysical Journal, 799:143 (14pp), 2015 February 1 Abdo et al.
We note that changes in observing conditions and other instru-mental effects could induce temporal correlations in measuredquantities. Therefore, uncertainties in both the light curve andderived model parameters might be underestimated owing to thepotential for additional low-level sources of systematic temporalcorrelations.
The absence of clear evidence for delayed flare episodes fol-lowing the “B” and “C” events and the lack of regular timescalesignatures in our 3 yr LAT data imply either that lensing de-layed flares at γ -ray energies do not exist in this source or thatthe flux ratio in the γ -ray band does not match that observedin the radio bands (∼1.5). We might also be observing a time-dependent or energy-variable lensing flux ratio. A varying ratio(range 1.0–1.8) of the measured flux of the two radio imagesis already suggested in Wiklind & Combes (1998). Multiyearmonitoring of the absorption caused by the z = 0.886 galaxyshowed temporal changes in absorption lines, ascribed to mo-tion of the blazar images with respect to the foreground galaxyand produced by sporadic ejection of bright plasmons (Muller& Guelin 2008). We discuss our results further in Section 6.1.
4. SWIFT: DATA ANALYSIS AND RESULTS
The Swift satellite (Gehrels et al. 2004) performed 10ToO observations on PKS 1830−211 between 2010 Oc-tober 15 (16:26 UT) and October 27 (09:07 UT), MJD55,484.685–55,496.380, for a GI program triggered by the highγ -ray activity of the source. The Swift observations were per-formed with all three onboard instruments: the X-ray Tele-scope (XRT, 0.2–10.0 keV), the Ultraviolet/Optical Telescope(UVOT, 1700–6000 Å), and the Burst Alert Telescope (BAT,15–150 keV).
4.1. Swift BAT Observations
The hard X-ray flux of this source is below the sensitivityof the BAT instrument for the short exposures of the SwiftToO observations performed on 2010 October. The source wasnot detected between 2010 October 14 and 18 (net exposureof about 200 ks) by INTEGRAL (Donnarumma et al. 2011).By contrast, PKS 1830−211 is detected in the BAT 58-monthcatalog, generated from the all-sky survey from 2004 Novemberto 2009 August. Therefore, we used the eight-channel spectrumavailable at the HEASARC.68 The 14–195 keV spectrum iswell described by a power law with photon index of 1.50 ± 0.13(χ2
red/dof = 0.89/6). The resulting unabsorbed 14–195 keV fluxis (9.0 ± 0.8) × 10−11 erg cm−2 s−1. The difference in flux andphoton index between the 58- and 70-month BAT catalog spectrais negligible.
4.2. Swift XRT Observations
The XRT data were processed with standard procedures(xrtpipeline v0.12.4), including the filtering and screen-ing criteria from the Heasoft package (v.6.8). The sourcecount rate was low during all the observations (count rate<0.5 counts s−1), so we only considered photon counting (PC)data and further selected XRT event grades 0–12. Source eventswere extracted from a circular region with a radius between 15and 25 pixels (1 pixel ∼2.′′36), while background events wereextracted from a circular region with radius 40 pixels awayfrom background sources. Ancillary response files were gen-erated with xrtmkarf and accounted for different extraction
68 http://swift.gsfc.nasa.gov/results/bs58mon/
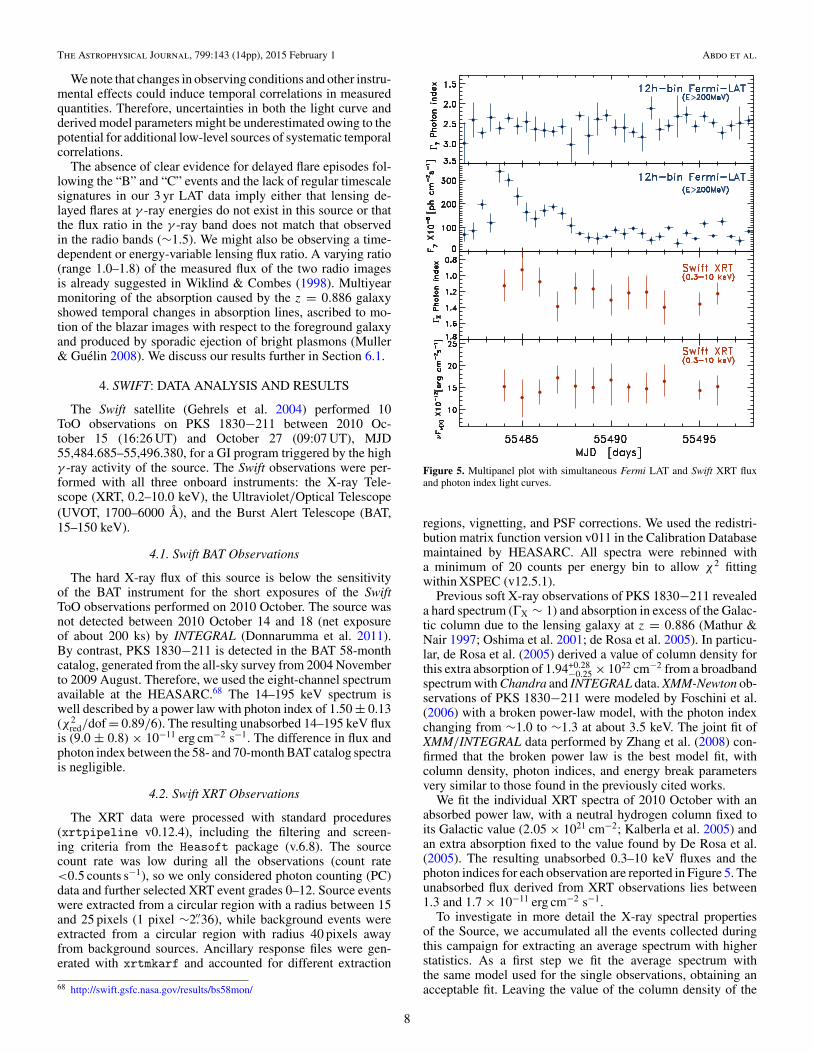
Figure 5. Multipanel plot with simultaneous Fermi LAT and Swift XRT fluxand photon index light curves.
regions, vignetting, and PSF corrections. We used the redistri-bution matrix function version v011 in the Calibration Databasemaintained by HEASARC. All spectra were rebinned witha minimum of 20 counts per energy bin to allow χ2 fittingwithin XSPEC (v12.5.1).
Previous soft X-ray observations of PKS 1830−211 revealeda hard spectrum (ΓX ∼ 1) and absorption in excess of the Galac-tic column due to the lensing galaxy at z = 0.886 (Mathur &Nair 1997; Oshima et al. 2001; de Rosa et al. 2005). In particu-lar, de Rosa et al. (2005) derived a value of column density forthis extra absorption of 1.94+0.28
−0.25 × 1022 cm−2 from a broadbandspectrum with Chandra and INTEGRAL data. XMM-Newton ob-servations of PKS 1830−211 were modeled by Foschini et al.(2006) with a broken power-law model, with the photon indexchanging from ∼1.0 to ∼1.3 at about 3.5 keV. The joint fit ofXMM/INTEGRAL data performed by Zhang et al. (2008) con-firmed that the broken power law is the best model fit, withcolumn density, photon indices, and energy break parametersvery similar to those found in the previously cited works.
We fit the individual XRT spectra of 2010 October with anabsorbed power law, with a neutral hydrogen column fixed toits Galactic value (2.05 × 1021 cm−2; Kalberla et al. 2005) andan extra absorption fixed to the value found by De Rosa et al.(2005). The resulting unabsorbed 0.3–10 keV fluxes and thephoton indices for each observation are reported in Figure 5. Theunabsorbed flux derived from XRT observations lies between1.3 and 1.7 × 10⁻¹¹ erg cm−2 s−1.
To investigate in more detail the X-ray spectral propertiesof the Source, we accumulated all the events collected duringthis campaign for extracting an average spectrum with higherstatistics. As a first step we fit the average spectrum withthe same model used for the single observations, obtaining anacceptable fit. Leaving the value of the column density of the
8
The Astrophysical Journal, 799:143 (14pp), 2015 February 1 Abdo et al.
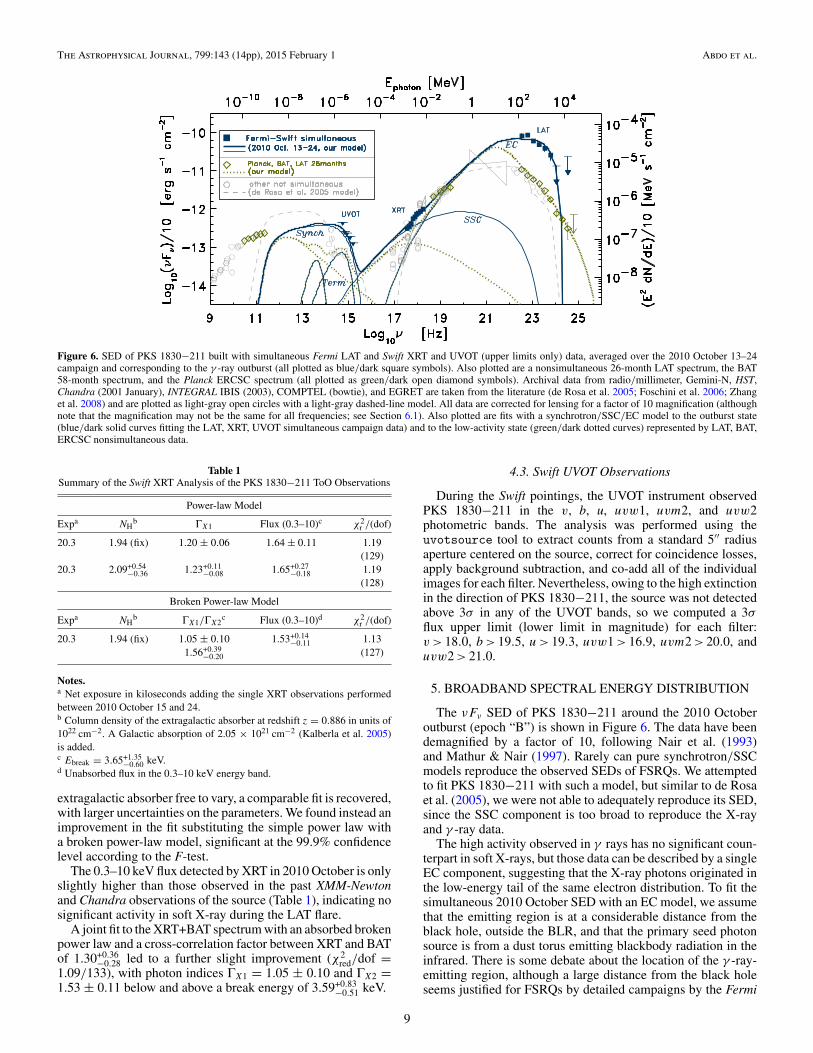
Figure 6. SED of PKS 1830−211 built with simultaneous Fermi LAT and Swift XRT and UVOT (upper limits only) data, averaged over the 2010 October 13–24campaign and corresponding to the γ -ray outburst (all plotted as blue/dark square symbols). Also plotted are a nonsimultaneous 26-month LAT spectrum, the BAT58-month spectrum, and the Planck ERCSC spectrum (all plotted as green/dark open diamond symbols). Archival data from radio/millimeter, Gemini-N, HST,Chandra (2001 January), INTEGRAL IBIS (2003), COMPTEL (bowtie), and EGRET are taken from the literature (de Rosa et al. 2005; Foschini et al. 2006; Zhanget al. 2008) and are plotted as light-gray open circles with a light-gray dashed-line model. All data are corrected for lensing for a factor of 10 magnification (althoughnote that the magnification may not be the same for all frequencies; see Section 6.1). Also plotted are fits with a synchrotron/SSC/EC model to the outburst state(blue/dark solid curves fitting the LAT, XRT, UVOT simultaneous campaign data) and to the low-activity state (green/dark dotted curves) represented by LAT, BAT,ERCSC nonsimultaneous data.
Table 1Summary of the Swift XRT Analysis of the PKS 1830−211 ToO Observations
Power-law Model
Expa NHb ΓX1 Flux (0.3–10)c χ2
r /(dof)
20.3 1.94 (fix) 1.20 ± 0.06 1.64 ± 0.11 1.19(129)
20.3 2.09+0.54−0.36 1.23+0.11
−0.08 1.65+0.27−0.18 1.19
(128)
Broken Power-law Model
Expa NHb ΓX1/ΓX2
c Flux (0.3–10)d χ2r /(dof)
20.3 1.94 (fix) 1.05 ± 0.10 1.53+0.14−0.11 1.13
1.56+0.39−0.20 (127)
Notes.a Net exposure in kiloseconds adding the single XRT observations performedbetween 2010 October 15 and 24.b Column density of the extragalactic absorber at redshift z = 0.886 in units of1022 cm−2. A Galactic absorption of 2.05 × 1021 cm−2 (Kalberla et al. 2005)is added.c Ebreak = 3.65+1.35
−0.60 keV.d Unabsorbed flux in the 0.3–10 keV energy band.
extragalactic absorber free to vary, a comparable fit is recovered,with larger uncertainties on the parameters. We found instead animprovement in the fit substituting the simple power law witha broken power-law model, significant at the 99.9% confidencelevel according to the F-test.
The 0.3–10 keV flux detected by XRT in 2010 October is onlyslightly higher than those observed in the past XMM-Newtonand Chandra observations of the source (Table 1), indicating nosignificant activity in soft X-ray during the LAT flare.
A joint fit to the XRT+BAT spectrum with an absorbed brokenpower law and a cross-correlation factor between XRT and BATof 1.30+0.36
−0.28 led to a further slight improvement (χ2red/dof =
1.09/133), with photon indices ΓX1 = 1.05 ± 0.10 and ΓX2 =1.53 ± 0.11 below and above a break energy of 3.59+0.83
−0.51 keV.
4.3. Swift UVOT Observations
During the Swift pointings, the UVOT instrument observedPKS 1830−211 in the v, b, u, uvw1, uvm2, and uvw2photometric bands. The analysis was performed using theuvotsource tool to extract counts from a standard 5′′ radiusaperture centered on the source, correct for coincidence losses,apply background subtraction, and co-add all of the individualimages for each filter. Nevertheless, owing to the high extinctionin the direction of PKS 1830−211, the source was not detectedabove 3σ in any of the UVOT bands, so we computed a 3σflux upper limit (lower limit in magnitude) for each filter:v > 18.0, b > 19.5, u> 19.3, uvw1 > 16.9, uvm2 > 20.0, anduvw2 > 21.0.
5. BROADBAND SPECTRAL ENERGY DISTRIBUTION
The νFν SED of PKS 1830−211 around the 2010 Octoberoutburst (epoch “B”) is shown in Figure 6. The data have beendemagnified by a factor of 10, following Nair et al. (1993)and Mathur & Nair (1997). Rarely can pure synchrotron/SSCmodels reproduce the observed SEDs of FSRQs. We attemptedto fit PKS 1830−211 with such a model, but similar to de Rosaet al. (2005), we were not able to adequately reproduce its SED,since the SSC component is too broad to reproduce the X-rayand γ -ray data.
The high activity observed in γ rays has no significant coun-terpart in soft X-rays, but those data can be described by a singleEC component, suggesting that the X-ray photons originated inthe low-energy tail of the same electron distribution. To fit thesimultaneous 2010 October SED with an EC model, we assumethat the emitting region is at a considerable distance from theblack hole, outside the BLR, and that the primary seed photonsource is from a dust torus emitting blackbody radiation in theinfrared. There is some debate about the location of the γ -ray-emitting region, although a large distance from the black holeseems justified for FSRQs by detailed campaigns by the Fermi
9
The Astrophysical Journal, 799:143 (14pp), 2015 February 1 Abdo et al.
Table 2Model Fit Parameters
Parameter Symbol 2010 Oct 13–24 Fit Quiescent Fit
Bulk Lorentz factor Γ 20 20Doppler factor δD 20 20Magnetic field B 1 G 1 GVariability timescale tv 12 hr 12 hrComoving Blob radius R′
b 7.4 × 1015 cm 7.4 × 10¹⁵ cmJet height r 1018 cm 1018 cmLow-energy electron spectral index p1 1.0 1.0Medium-energy electron spectral index p2 1.8 1.8High-energy electron spectral index p3 2.8 4.0Minimum electron Lorentz factor γ ′
min 3 3First break electron Lorentz factor γ ′
brk1 30 30Second break electron Lorentz factor γ ′
brk2 300 300Maximum electron Lorentz factor γ ′
max 6 × 10³ 1 × 10⁵
Black hole mass MBH 109 M 109 MAccretion disk luminosity Ldisk 3.9 × 10P 45 erg s−1 3.9 × 1045 erg s−1
Inner disk radius Rin 6Rg 6Rg
Blob distance from black hole rblob 1018 1018
Dust torus temperature Tdust 1.7 × 10³ K 1.7 × 10³ KDust torus radius rdust 2 × 1018 cm 2 × 10¹⁸ cmDust torus luminosity Ldust 3.1 × 1045 erg s−1 3.1 × 1045 erg s−1
Jet power in magnetic field Lj,B 1.6 × 1044 erg s−1 1.6 × 1044 erg s−1
Jet power in electrons Lj,e 3.8 × 1045 erg s−1 3.1 × 1045 erg s−1
Total jet power Lj,tot 4.0 × 1045 erg s−1 3.3 × 1045 erg s−1
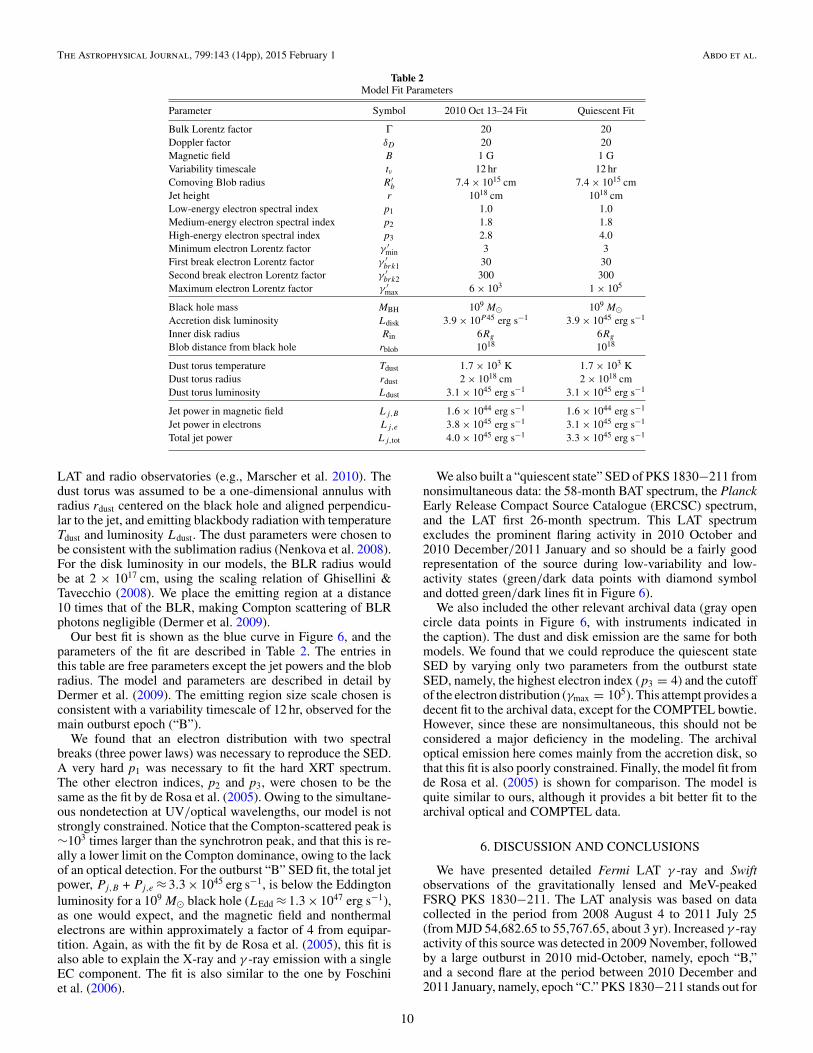
LAT and radio observatories (e.g., Marscher et al. 2010). Thedust torus was assumed to be a one-dimensional annulus withradius rdust centered on the black hole and aligned perpendicu-lar to the jet, and emitting blackbody radiation with temperatureTdust and luminosity Ldust. The dust parameters were chosen tobe consistent with the sublimation radius (Nenkova et al. 2008).For the disk luminosity in our models, the BLR radius wouldbe at 2 × 1017 cm, using the scaling relation of Ghisellini &Tavecchio (2008). We place the emitting region at a distance10 times that of the BLR, making Compton scattering of BLRphotons negligible (Dermer et al. 2009).
Our best fit is shown as the blue curve in Figure 6, and theparameters of the fit are described in Table 2. The entries inthis table are free parameters except the jet powers and the blobradius. The model and parameters are described in detail byDermer et al. (2009). The emitting region size scale chosen isconsistent with a variability timescale of 12 hr, observed for themain outburst epoch (“B”).
We found that an electron distribution with two spectralbreaks (three power laws) was necessary to reproduce the SED.A very hard p1 was necessary to fit the hard XRT spectrum.The other electron indices, p2 and p3, were chosen to be thesame as the fit by de Rosa et al. (2005). Owing to the simultane-ous nondetection at UV/optical wavelengths, our model is notstrongly constrained. Notice that the Compton-scattered peak is∼103 times larger than the synchrotron peak, and that this is re-ally a lower limit on the Compton dominance, owing to the lackof an optical detection. For the outburst “B” SED fit, the total jetpower, Pj,B + Pj,e ≈ 3.3 × 1045 erg s−1, is below the Eddingtonluminosity for a 109 M black hole (LEdd ≈ 1.3 × 1047 erg s−1),as one would expect, and the magnetic field and nonthermalelectrons are within approximately a factor of 4 from equipar-tition. Again, as with the fit by de Rosa et al. (2005), this fit isalso able to explain the X-ray and γ -ray emission with a singleEC component. The fit is also similar to the one by Foschiniet al. (2006).
We also built a “quiescent state” SED of PKS 1830−211 fromnonsimultaneous data: the 58-month BAT spectrum, the PlanckEarly Release Compact Source Catalogue (ERCSC) spectrum,and the LAT first 26-month spectrum. This LAT spectrumexcludes the prominent flaring activity in 2010 October and2010 December/2011 January and so should be a fairly goodrepresentation of the source during low-variability and low-activity states (green/dark data points with diamond symboland dotted green/dark lines fit in Figure 6).
We also included the other relevant archival data (gray opencircle data points in Figure 6, with instruments indicated inthe caption). The dust and disk emission are the same for bothmodels. We found that we could reproduce the quiescent stateSED by varying only two parameters from the outburst stateSED, namely, the highest electron index (p3 = 4) and the cutoffof the electron distribution (γmax = 105). This attempt provides adecent fit to the archival data, except for the COMPTEL bowtie.However, since these are nonsimultaneous, this should not beconsidered a major deficiency in the modeling. The archivaloptical emission here comes mainly from the accretion disk, sothat this fit is also poorly constrained. Finally, the model fit fromde Rosa et al. (2005) is shown for comparison. The model isquite similar to ours, although it provides a bit better fit to thearchival optical and COMPTEL data.
6. DISCUSSION AND CONCLUSIONS
We have presented detailed Fermi LAT γ -ray and Swiftobservations of the gravitationally lensed and MeV-peakedFSRQ PKS 1830−211. The LAT analysis was based on datacollected in the period from 2008 August 4 to 2011 July 25(from MJD 54,682.65 to 55,767.65, about 3 yr). Increased γ -rayactivity of this source was detected in 2009 November, followedby a large outburst in 2010 mid-October, namely, epoch “B,”and a second flare at the period between 2010 December and2011 January, namely, epoch “C.” PKS 1830−211 stands out for
10
The Astrophysical Journal, 799:143 (14pp), 2015 February 1 Abdo et al.
a number of reasons, besides the fact that it is characterized bystrong-type gravitational lensing, which we discuss further inSection 6.1.
PKS 1830−211 is the third-most distant object detectedin large flaring activity so far by Fermi LAT, behind TXS0536 + 145 and B3 1343 + 451. The apparent isotropic γ -rayluminosity (E > 100 MeV) of PKS 1830−211 over the first 31months of Fermi operation is ∼1.1 × 1049 erg s−1, comparableto the brightest high-redshift (z � 2) blazars in the Second LATAGN Catalog (Ackermann et al. 2011, 2LAC).
The γ -ray flux observed by the LAT from this sourcewas at its peak on 2010 October 14–15, reaching a flux ofF (E > 200 MeV) ≈ 300 × 10−8 photons cm−2 s−1, as seen inthe 12 hr binned light curve. This is a factor of 17 greaterthan the average 3 yr flux. The corresponding apparent isotropicγ -ray luminosity of 2.9 × 1050 erg s−1 is greater than that ob-served from PKS 1622−297 during the 1995 flare (Mattox et al.1997b) and from 3C 454.3 in 2009 December (Ackermannet al. 2010) and roughly comparable to the 2010 Novemberoutburst from this source (Abdo et al. 2011). For this brightflare, if one uses the variability timescale in the proper frameof the source Δt ≈ 12 hr/(1 + z) ≈ 1.3 × 10⁴ s and a demag-nified luminosity of Lγ ≈ 3 × 1049 erg s−1, one calculatesLγ /Δt ≈ 2.5 × 1045 erg s−2. This value is a bit below the recordholder for AGNs, from the 2010 November burst from 3C 454.3(Abdo et al. 2011), but it still exceeds the Elliot & Shapiro(1974) limit of LEdd/(RS/c) ≈ 1.3×1043 erg s−2 (where RS is theSchwarzschild radius) and the limit that includes Klein–Nishinaeffects, 1.6 × 1044 erg s−2 (Liang & Liu 2003).
No correlated variability for this γ -ray flare was detected inX-rays by Swift XRT, which is somewhat typical for FSRQs(e.g., Marscher et al. 2010; Hayashida et al. 2012), althoughnot universal (e.g., Raiteri et al. 2011). Orphan γ -ray flaringactivity in PKS 1830−211 was already found in AGILE data(Donnarumma et al. 2011). This fact, in addition to the lackof detection in optical/UV by Swift UVOT and hard X-ray byINTEGRAL IBIS during the 2010 October γ -ray flare discoveredby Fermi LAT, indicates that the mechanism producing the γ -rayflare only marginally influences the X-ray part of the spectrum.There may be correlated variability between γ -ray and opticalemission, also typical for FSRQs (e.g., Marscher et al. 2010;Raiteri et al. 2011), but without any optical detections, it isimpossible to tell. The lack of X-ray and γ -ray correlationcan support the lack of evident signals of strong lensing athigh energies.
The hard and soft X-rays are thought to be a combination ofthe contributions from SSC and EC, and the soft X-ray roll-offis explained in terms of a natural interplay between SSC and ECcomponents (Foschini et al. 2006). The extremely hard X-rayphoton indices have been found for a number of other blazars(Sikora et al. 2009) and seem to indicate very hard electrondistributions at low energies.
The main (“B”) outburst of 2010 October was found to beasymmetric with a fast rise of a factor of about 2.6 in flux in 12 hr,a phenomenology observed in a few γ -ray blazar flares in thepast (Abdo et al. 2010b). The asymmetry might imply particleacceleration and cooling times that are greater than the light-crossing time, i.e., tinj, tcool > R/c (in the jet comoving frame).The fast rise and slower decay shape can also be evidence fora contribution by Comptonization of photons produced outsidethe jet (Sikora et al. 2001; Sokolov & Marscher 2005).
A 2.5-day flux peak timescale appears to characterize the“B” and “C” flares. The main outburst “B” was characterized
by a 10-day timescale, but there was a shift to a timescale ofabout 20 days during the “C” flare. That is, the timescale of theemission doubled. This is based on the 2D CWT scalogram forthe 12 hr bin light curve and is supported by the CWT globalspectrum and the DACF (with a peak at 19±1 days). This scaleappears to be unconnected to a regular lens-delay signaturerunning along the whole light curve: it is at the boundary ofthe range of the radio delay values (∼20–30 Lovell et al. 1998;Wiklind & Combes 2001) and would not be well compatiblewith the ∼27-day value found in Barnacka et al. (2011). Ingeneral, multiscale variability ranging from months down to acouple of days is found in the LAT light curves. In particular,the 76-day interval separating the peaks of the two main flareepisodes “B” and “C,” namely, the peak of 2010 October 15(MJD 55,484) and the peak of 2010 December 30 (MJD 55,560),emerged as a possible signature from the DACF analysis. Interms of gravitational lensing this lag cannot be connectedto radio-band lag values, and one episode is not sufficient tomake further speculations in this direction. The fractional γ -rayvariability and its timescale distribution during the more activephases are found to be similar to the ones shown in the longer,fainter, and less variable intervals between the flare events, andthe PDS can be described by a 1/f 1.25±0.12 power law. Thisimplies that the occurrence of a specific variation is inverselyproportional to its strength, with more weight preferred for shorttimescales.
The steep γ -ray spectrum of MeV-peaked sources like PKS1830−211 can contribute to the cosmic X-ray background andthe extragalactic γ -ray background, depending on luminosityfunctions and SED models. The 3 yr LAT data analysis presentedin this work suggests that its γ -ray flaring activity and temporalbehavior are due to intrinsic variability within the source, ratherthan to strong gravitational lensing effects. Data acquired in thenext years of the Fermi all-sky survey monitor will shed morelight on the meaning of the hinted timescales.
6.1. Why Has No Time Delay BeenObserved in Gamma Rays?
The intense γ -ray flaring from PKS 1830−211, the bright-est LAT gravitationally lensed blazar together with S3 0218+35(i.e., the lens system B0218+357 Cheung et al. 2014), hasopened up the possibility of measuring γ -ray time delays fromthe different lensed images of the blazar. The first clear γ -raymeasurement of a delay for the images of the lens B0218+357is reported in Cheung et al. (2014), where a lag of 11.5 days,which is ∼1 day greater than previously determined radio-bandvalues, was determined. Inspecting the intervals around thebrightest flares of this source, magnification flux ratios in γ -rayenergy bands were measured oscillating about unity, with mag-nitudes smaller than those from radio observations. In the case ofPKS 1830−211, however, as we show in Section 3, the expecteddelay of ≈25 days with a flux ratio ≈ 1.5 (e.g., Lovell et al.1998) was not found by us with enough evidence, despite firstclaims to the contrary (Barnacka et al. 2011). We can set a lowerlimit of ∼6 for the γ -ray flux ratio between the two lens images,significantly larger than the flux ratio in radio bands. The tworadio images correspond to very slightly different viewing an-gles of the background blazar (Δθ ∼ 1′′); therefore, any sourceemission anisotropy, such as relativistic beaming, can changethe observed flux ratio. This first limit found by us in γ -raysimplies a very small beaming angle for the γ -ray emission.
11
The Astrophysical Journal, 799:143 (14pp), 2015 February 1 Abdo et al.
PKS 1830−211 is a case of both strong lensing (characterizedby a double image) and a compound lensing induced bytwo foreground galaxies. For an ideal lens the flux imageratios in different energy bands should be the same as thedeflection is achromatic (Schneider et al. 1992). Multipleimaged quasars and blazars are expected to show intrinsicvariability in all the resolved lensed images with the same timedelay. Variable differences between the light curves could beascribed to microlensing acting on the system. Inhomogeneitiesand radiation absorption can significantly change the observedflux and lensing magnification. In particular, some material caninterfere with the γ -rays in the lens galaxy and suppresses thosefrom the SW image of PKS 1830−211. In Winn et al. (2002)the SW image of PKS 1830−211 is observed to pass throughone of the spiral arms of the z = 0.19 foreground galaxy.
Different flux ratios have been measured from other lensedquasars (e.g., Blackburne et al. 2006; Pooley et al. 2006; Chenet al. 2011). Those authors attributed this to microlensing sub-structure in the lensing system and a different spatial origin of theemission at different wavelengths (X-ray and optical emissionin those cases). This has been shown to be possible through lensmodeling (Dobler & Keeton 2006) and can explain the observeddifferent flux ratio with respect to the radio one. The amplitudeof the magnification caused by microlensing is greater for smallemission regions. Production sites for GeV γ -rays are gener-ally much smaller than those at radio bands (<0.003 pc fromour SED modeling). Microlensing in the lens foreground galaxycould therefore produce further flux modulations and variationsof the light curve produced by stellar motions in the galaxy.Optical microlensing is observed in some galaxies, and γ -ray-emitting regions are comparable to the optical continuum sizeof an AGN. Based on EGRET data of PKS 1830−211 γ -rayflux variations are already suggested to be produced by grav-itational microlensing (Combi & Romero 1998).Microlensingcould allow us to constrain the postulated power-law relation-ship R ∝ Ea between size and energy of γ -ray emission re-gions and could explain some of the unidentified LAT γ -raysources at high galactic latitude through lensing magnificationof background-undetected blazars (Torres et al. 2003).
The typical timescale for a caustic-crossing microlensingevent in a lensed quasar, however, is longer than ∼25 days(weeks, months Fluke & Webster 1999; Wambsganss 2001).On the other hand, modeling of microlensing events has alsoshown that microlensing durations can be different for differentwavelengths when the emission originates from different sizescales (Jovanovic et al. 2008). In addition, PKS 1830−211 hasrather fast source crossing times and a small ratio of source sizeto Einstein radius (Mosquera & Kochanek 2011); therefore,significant microlensing variations are expected for this lensedγ -ray blazar.
The evidence for gravitational microlensing and millilensingeffects in strong lensed quasars is increasing in recent works(e.g., Blackburne et al. 2011; Chartas et al. 2012; Chen et al.2012). Microlensing structures or light path time delays sam-pling intrinsic quasar spectral variability are thought to explainoptical spectral differences between quasar image components(e.g., Wisotzki et al. 1993; Sluse et al. 2007, 2013). In X-raysspectral variations can be described by changes of absorptioncolumn density and by different spectral components and brokenpower laws, with different absorptions. It may be possible thatthe X-ray beam passes through a high-absorption column, butthe radio-band image is covered by a partial absorber with a lowcovering factor. In the peculiar case of PKS 1830−211, energy
dependence observed in X-ray flux ratio between the two imagesis also ascribed to microlensing events Oshima et al. (2001), in-ducing time variability and X-ray chromatic perturbations. Forexample, X-ray microlensing variability was identified and dis-entangled in the Einstein Cross QSO 2237+0305 (Zimmer et al.2011).
The observed flux of resolved lens images (i) at time t is aresult of different factors: F (i)(t) = μ(i)
macro · μ(i)micro · Q(t)μ(i)
macro,where μ are the macro/microlensing magnification factors andQ(t) is the time-dependent flux of the quasar. The Einstein-ringradius on the PKS 1830−211 source plane is RE = θEDos 2 × 10¹⁶√Mlens/M (Paczynski 1986; Oshima et al. 2001).
We can use the lower limit of ∼6 in the γ -ray flux ratioto put an upper limit on the size of the γ -ray-emitting region(Grieger et al. 1991; Yonehara et al. 1998). We find that thismust be R′
b � 5.6 × 10¹⁴m1/2 cm, where m is the mass of amicrolens in solar masses. This is consistent with the γ -rayvariability timescale, although it is larger than the size used inSED modeling (Section 5). The size of the γ -ray emission regionevaluated from the SED modeling (7.4×1015 cm) is smaller thanRE and is therefore subject to possible microlensing, inducingmagnification variations with respect to radio wavelengthswhere the emission region is more extended. In particular, alarger magnification ratio is expected for a caustic-crossingmicrolens event (Blandford & Narayan 1992) acting on oneof the two images, as suggested by the �6 γ -ray flux ratio. Itshould be noted that microlensing due to individual stars in themain lens galaxy is expected to be negligible in many cases,as the projected Einstein radius of each star is smaller thanthe PKS 1830−211 optical source extension. However, furtherlensing effects can be due to nearby galaxies. There are six othersecondary galaxy candidates for weak lensing, identified in thefield within 20′′ from the main lens by Lehar et al. (2000). Thesegalaxies can provide lensing effects exerted at the position ofthe NE and SW images of PKS 1830−211, in the case that oneor more of them is relatively massive and placed at z � 0.1. Inthis case they would have to be included in PKS 1830−211 lensmodeling.
Besides micro/millilensing effects and the need for a refinedstrong-lensing modeling, there are other open possibilitiesthat could explain the lack of an evident γ -ray lensing timedelay for the two major flares of PKS 1830−211 seen bythe LAT. Chandra and XMM-Newton observations of PKS1830−211 show large variations in the absorption columndensity, which are interpreted as intrinsic absorption (Dai et al.2008). As the PKS 1830−211 X-ray emission is dominatedby relativistically beamed components from the jet, it is verylikely that the obscuration may be due to jet-linked absorbingmaterial, physical processes, or variations from the geometricconfiguration of the jet. If the γ -ray emission region is displacedfrom the radio-band emission region, the γ -ray flux ratio canhave the observed difference from the radio flux ratio. Spatiallydistinct emission regions may give some constraint on differingjet structure probed by the two different energy regimes. Thishypothesis may complicate results for this blazar in comparingthe radio/γ -ray properties, in evaluating Compton dominance,and in correctly modeling its SED. It could be possible that theradio and γ -ray emission in blazars comes from different regionsof the jet with different size scales. This is due to the well-known fact that variability at these different wavelengths is onconsiderably different timescales, and that compact synchrotronemission from jets is strongly self-absorbed at radio frequencies.The γ -ray emission site for the quiescent period from 2008
12
The Astrophysical Journal, 799:143 (14pp), 2015 February 1 Abdo et al.
August to 2010 September and the γ -ray-emitting regionresponsible for the two main flaring episodes “B” and “C” alsocould be different (Barnacka et al. 2014), with different lensingmagnification ratios. In general, the magnification ratio mightdiffer for radio-band and γ -ray emission, especially when thereare high-energy flaring episodes.
Multiepoch and multifrequency continuum observations ofthe two resolved lensed images of PKS 1830−211 by ALMAin the 350–1050 GHz band showed a remarkable frequency-dependent behavior of the flux ratio of the two images during theflare observed by the LAT in 2012 June (Martı-Vidal et al. 2013).This implies the presence of energy-dependent submillimeterstructures in PKS 1830−211 during the γ -ray flare. Whilemicro/millilensing events can already introduce a variability inthe flux ratio, frequency-dependent changes directly imply anenergy-dependent structure in the blazar nucleus like a “core-shift” effect (i.e., the frequency-dependent astrometric shift ofthe very long baseline interferometry core position). This dis-covery can have direct consequences for our observations con-sidering the supposed millimeter/submillimeter and GeV γ -rayconnection in blazars (Giommi et al. 2012; Marscher et al. 2012).The concurrence and cospatiality of the submillimeter and γ -ray2012 June flares are a direct prediction of the shock-injet model,while the remarkable energy dependence of the flux ratio of thetwo millimeter/submillimeter core images is related to opacityeffects close to the base of the jet (Martı-Vidal et al. 2013).
In radio bands dispersive refractive properties of the emittingplasma itself can cause gravitational deflection angle to bedependent on the photon energy (Bisnovatyi-Kogan & Tsupko2010), but this effect can be considered not significant atGeV energies. Another aspect is the presence of a strong(cluster-scale) gravitational potential, even with strong lensingonly. Source emission anisotropy may create spectroscopicdifferences along the slightly different lines of sight, yielding todifferences in relativistic beaming of the images and a certainprobability that either the lensed image and or the delayed flareevent may not be observable (Perna & Keeton 2009). However,the Einstein angle is small for an isolated galaxy scale potential,and consequently also source anisotropy is not significant in thecase of PKS 1830−211.
The nondetection of delayed flares for the “B” and “C” γ -rayflares and the lack of correlated activity in soft X-rays observedby Swift do not interfere with the association and identificationof this LAT source with the lensed background blazar PKS1830−211. This is because of the tighter spatial localizationconstraints toward PKS 1830−211 coming from the 1FGL and2FGL (and the next 3FGL) catalogs for the source. Additionally,the lensing galaxies located at z = 0.88582 and z = 0.19are unlikely to be bright γ -ray sources, being a passive faintred galaxy and a passive face-on spiral galaxy (Courbin et al.2002; Winn et al. 2002), respectively. The identification of PKS1830−211 as a γ -ray source has been declared since the EGRETera (Mattox et al. 1997a; Combi & Romero 1998).
Though initially considered a simple two-image gravitationallens, the lensed γ -ray quasar PKS 1830−211 appears to haveseveral peculiar and intriguing features. The line of sight to PKS1830−211 appears to be very busy: one possible Galactic main-sequence star and two or (more likely) three lensing galaxies(Courbin et al. 2002). PKS 1830−211 represents also the firstknown case of a quasar lensed by an almost face-on spiral galaxy(Courbin et al. 2002; Winn et al. 2002), where a different fluxsuppression for the two different lens image paths representsanother hypothesis.
No lens model has been able to explain all the observedcharacteristics and physical phenomena associated with thelens galaxies and the background blazar. As an example, thesame radio time delay value ∼ 26 days could be replaced bya more secure range of possible time delays ranging from 12to 30 days, based on the full set of light curves used by Lovellet al. (1998). There is also evidence for substructure in this lens,and the true mass distribution of the system is probably morecomplicated than the distributions in published lens models forPKS 1830−211 (Jin et al. 2003).
Deep optical imaging of PKS 1830−211 does not producea clear picture of the lens and surrounding field because theline of sight lies near the Galactic plane and the bulge ofthe Milky Way. Modeling of PKS 1830−211 has not beenable to derive the Hubble constant with the precision obtainedusing other cosmological lenses. Besides uncertainty in themeasured radio time delay, PKS 1830−211 also has remarkableuncertainties in the localization of the lensing galaxy and lensbarycenter.
The continuous all-sky survey monitoring performed inthe next years by Fermi LAT, during the extended missionera, and the future Pass 8 data release, based on a com-plete revision of the entire event-level analysis, will allowthe production of improved light curves for more detailedanalysis. PKS 1830−211 may be the best high-energy grav-itational lens for simultaneous millimeter/submillimeter andγ -ray variability and lensing studies with ALMA and theFermi LAT.
We thank the anonymous referees for useful comments thatimproved the paper. S.C. thanks Dr. R. Porcas of MPIfR,Bonn, Germany, for a useful discussion during the course ofthis work. The Fermi LAT Collaboration acknowledges gen-erous ongoing support from a number of agencies and insti-tutes that have supported both the development and the op-eration of the LAT, as well as scientific data analysis. Theseinclude the National Aeronautics and Space Administrationand the Department of Energy in the United States; the Com-missariat a l’Energie Atomique and the Centre National de laRecherche Scientifique/Institut National de Physique Nucleaireet de Physique des Particules in France; the Agenzia SpazialeItaliana and the Istituto Nazionale di Fisica Nucleare in Italy;the Ministry of Education, Culture, Sports, Science and Tech-nology (MEXT), High Energy Accelerator Research Organiza-tion (KEK), and Japan Aerospace Exploration Agency (JAXA)in Japan; and the K. A. Wallenberg Foundation, the SwedishResearch Council, and the Swedish National Space Boardin Sweden.
Additional support for science analysis during the operationsphase is gratefully acknowledged from the Istituto Nazionale diAstrofisica in Italy and the Centre National d’Etudes Spatialesin France.
This work includes observations obtained with the NASASwift Gamma-Ray Burst Explorer. Swift is a MIDEX GammaRay Burst mission led by NASA with participation of Italy andthe UK.
This research has made use of the Smithsonian/NASA’s ADSbibliographic database. This research has made use of thearchives and services of the ASI Science Data Center (ASDC), afacility of the Italian Space Agency (ASI Headquarters, Rome,Italy). This research has made use of the NASA/IPAC NEDdatabase (JPL CalTech and NASA, USA).
Facilities: Fermi LAT, Swift
13
The Astrophysical Journal, 799:143 (14pp), 2015 February 1 Abdo et al.
REFERENCES
Abdo, A. A., Ackermann, M., Ajello, M., et al. 2010a, ApJS, 188, 405Abdo, A. A., Ackermann, M., Ajello, M., et al. 2010b, ApJ, 722, 520Abdo, A. A., Ackermann, M., Ajello, M., et al. 2011, ApJL, 733, L26Ackermann, M., Ajello, M., Albert, A., et al. 2012, ApJS, 203, 4Ackermann, M., Ajello, M., Allafort, A., et al. 2011, ApJ, 743, 171Ackermann, M., Ajello, M., Baldini, L., et al. 2010, ApJ, 721, 1383Ade, P. A. R., Aghanim, N., Armitage-Caplan, C., et al. 2014, A&A,
571, A16Aller, M. C., Kulkarni, V. P., York, D. G., et al. 2012, ApJ, 748, 19Bagdonaite, J., Jansen, P., Henkel, C., et al. 2013, Sci, 339, 46Barnacka, A., Geller, M. J., Dell’antonio, I. P., & Benbow, W. 2014, ApJ,
788, 139Barnacka, A., Glicenstein, J.-F., & Moudden, Y. 2011, A&A, 528, L3Bisnovatyi-Kogan, G. S., & Tsupko, O. Y. 2010, MNRAS, 404, 1790Blackburne, J. A., Pooley, D., & Rappaport, S. 2006, ApJ, 640, 569Blackburne, J. A., Pooley, D., Rappaport, S., & Schechter, P. L. 2011, ApJ,
729, 34Blandford, R. D., & Narayan, R. 1992, ARA&A, 30, 311Celotti, A., & Ghisellini, G. 2008, MNRAS, 385, 283Chartas, G., Kochanek, C. S., Dai, X., et al. 2012, ApJ, 757, 137Chen, B., Dai, X., Kochanek, C. S., et al. 2011, ApJL, 740, L34Chen, B., Dai, X., Kochanek, C. S., et al. 2012, ApJ, 755, 24Cheung, C. C., Larsson, S., Scargle, J. D., et al. 2014, ApJL, 782, L14Ciprini, S. 2010, ATel, 2943, 1Ciprini, S. 2012, ATel, 4158, 1Collmar, W. 2006, in ASP Conf. Ser. 350, Blazar Variability Workshop II:
Entering the GLAST Era, ed. H. R. Miller, K. Marshall, J. R. Webb, & M.F. Aller (San Francisco, CA: ASP), 120
Combi, J. A., & Romero, G. E. 1998, A&AS, 128, 423Corbet, R., Cheung, C. C., Kerr, M., & Ray, P. S. 2013, in IV Fermi Symposium
proc., eConf C121028 (arXiv:1302.5141)Courbin, F., Lidman, C., Frye, B. L., et al. 1998, ApJL, 499, L119Courbin, F., Meylan, G., Kneib, J.-P., & Lidman, C. 2002, ApJ, 575, 95Cruz, A., Gora, D., & Bernardini, E. 2013, in Proc. of the 33rd ICRC, id 0539
(arXiv:1309.6979, 20)Dai, X., Mathur, S., Chartas, G., Nair, S., & Garmire, G. P. 2008, AJ,
135, 333Dermer, C. D., Finke, J. D., Krug, H., & Bottcher, M. 2009, ApJ, 692, 32de Rosa, A., Piro, L., Tramacere, A., et al. 2005, A&A, 438, 121Dobler, G., & Keeton, C. R. 2006, MNRAS, 365, 1243Donnarumma, I., De Rosa, A., Vittorini, V., et al. 2011, ApJL, 736, L30Einstein, A. 1936, Sci, 84, 506Elliot, J. L., & Shapiro, S. L. 1974, ApJL, 192, L3Fluke, C. J., & Webster, R. L. 1999, MNRAS, 302, 68Foschini, L., Ghisellini, G., Raiteri, C. M., et al. 2006, A&A, 453, 829Frye, B. L., Courbin, F., Broadhurst, T. J., et al. 1999, in ASP Conf. Ser. 156,
Highly Redshifted Radio Lines, ed. C. L. Carilli, S. J. E. Radford, K. M.Menten, & G. I. Langston (San Francisco, CA: ASP), 240
Gehrels, N., Chincarini, G., Giommi, P., et al. 2004, ApJ, 611, 1005Ghisellini, G., & Tavecchio, F. 2008, MNRAS, 387, 1669Giommi, P., Polenta, G., Lahteenmaki, A., et al. 2012, A&A, 541, A160Gregg, M. D., Lacy, M., White, R. L., et al. 2002, ApJ, 564, 133Grieger, B., Kayser, R., & Schramm, T. 1991, A&A, 252, 508Hadasch, D., Torres, D. F., Tanaka, T., et al. 2012, ApJ, 749, 54Hartman, R. C., Bertsch, D. L., Bloom, S. D., et al. 1999, ApJS, 123, 79Hayashida, M., Madejski, G. M., Nalewajko, K., et al. 2012, ApJ, 754, 114Jauncey, D. L., Reynolds, J. E., Tzioumis, A. K., et al. 1991, Natur,
352, 132Jin, C., Garrett, M. A., Nair, S., et al. 2003, MNRAS, 340, 1309
Jovanovic, P., Zakharov, A. F., Popovic, L. C., & Petrovic, T. 2008, MNRAS,386, 397
Kalberla, P. M. W., Burton, W. B., Hartmann, D., et al. 2005, A&A, 440, 775Kochanek, C. S., & Narayan, R. 1992, ApJ, 401, 461Lehar, J., Falco, E. E., Kochanek, C. S., et al. 2000, ApJ, 536, 584Liang, E. W., & Liu, H. T. 2003, MNRAS, 340, 632Lidman, C., Courbin, F., Meylan, G., et al. 1999, ApJL, 514, L57Lovell, J. E. J., Jauncey, D. L., Reynolds, J. E., et al. 1998, ApJL, 508, L51Lovell, J. E. J., Reynolds, J. E., Jauncey, D. L., et al. 1996, ApJL, 472, L5Marscher, A. P., Jorstad, S. G., Agudo, I., MacDonald, N. R., & Scott, T. L.
2012, in Proceedings of Fermi and Jansky Conference, St Michaels, MD,eConf C1111101 (arXiv:1204.6707)
Marscher, A. P., Jorstad, S. G., Larionov, V. M., et al. 2010, ApJL, 710, L126Martı-Vidal, I., Muller, S., Combes, F., et al. 2013, A&A, 558, A123Mathur, S., & Nair, S. 1997, ApJ, 484, 140Mattox, J. R., Bertsch, D. L., Chiang, J., et al. 1996, ApJ, 461, 396Mattox, J. R., Schachter, J., Molnar, L., Hartman, R. C., & Patnaik, A. R.
1997a, ApJ, 481, 95Mattox, J. R., Wagner, S. J., Malkan, M., et al. 1997b, ApJ, 476, 692Mosquera, A. M., & Kochanek, C. S. 2011, ApJ, 738, 96Muller, S., Beelen, A., Guelin, M., et al. 2011, A&A, 535, A103Muller, S., & Guelin, M. 2008, A&A, 491, 739Nair, S., Narasimha, D., & Rao, A. P. 1993, ApJ, 407, 46Nenkova, M., Sirocky, M. M., Nikutta, R., Ivezic, Z., & Elitzur, M. 2008, ApJ,
685, 160Nolan, P. L., Abdo, A. A., Ackermann, M., et al. 2012, ApJS, 199, 31Oshima, T., Mitsuda, K., Ota, N., et al. 2001, ApJ, 551, 929Paczynski, B. 1986, ApJ, 304, 1Perna, R., & Keeton, C. R. 2009, MNRAS, 397, 1084Pooley, D., Blackburne, J. A., Rappaport, S., Schechter, P. L., & Fong, W.-f.
2006, ApJ, 648, 67Pramesh Rao, A., & Subrahmanyan, R. 1988, MNRAS, 231, 229Raiteri, C. M., Villata, M., Aller, M. F., et al. 2011, A&A, 534, A87Schneider, P., Ehlers, J., & Falco, E. E. 1992, Gravitational Lenses (Berlin:
Springer)Sikora, M., Błazejowski, M., Begelman, M. C., & Moderski, R. 2001, ApJ,
554, 1Sikora, M., Stawarz, Ł., Moderski, R., Nalewajko, K., & Madejski, G. M.
2009, ApJ, 704, 38Sluse, D., Claeskens, J.-F., Hutsemekers, D., & Surdej, J. 2007, A&A, 468, 885Sluse, D., Kishimoto, M., Anguita, T., Wucknitz, O., & Wambsganss, J.
2013, A&A, 553, A53Sokolov, A., & Marscher, A. P. 2005, ApJ, 629, 52Striani, E., Verrecchia, F., Pittori, C., et al. 2009, ATel, 2242, 1Tanaka, Y. T., Cheung, C. C., Inoue, Y., et al. 2013, ApJL, 777, L18Torres, D. F., Romero, G. E., Eiroa, E. F., Wambsganss, J., & Pessah, M. E.
2003, MNRAS, 339, 335van Ommen, T. D., Jones, D. L., Preston, R. A., & Jauncey, D. L. 1995, ApJ,
444, 561Wambsganss, J. 2001, PASA, 18, 207Wiklind, T., & Combes, F. 1996, Natur, 379, 139Wiklind, T., & Combes, F. 1998, ApJ, 500, 129Wiklind, T., & Combes, F. 2001, in ASP Conf. Ser. 237, Gravitational Lensing:
Recent Progress and Future Goals, ed. T. G. Brainerd & C. S. Kochanek (SanFrancisco, CA: ASP), 155
Winn, J. N., Kochanek, C. S., McLeod, B. A., et al. 2002, ApJ, 575, 103Wisotzki, L., Koehler, T., Kayser, R., & Reimers, D. 1993, A&A, 278, L15Witt, H. J., Mao, S., & Keeton, C. R. 2000, ApJ, 544, 98Yonehara, A., Mineshige, S., Manmoto, T., et al. 1998, ApJL, 501, L41Zhang, S., Chen, Y.-p., Collmar, W., et al. 2008, ApJ, 683, 400Zimmer, F., Schmidt, R. W., & Wambsganss, J. 2011, MNRAS, 413, 1099
14