gaming / u.s.a. 2014 outlook: u.s....
TRANSCRIPT
Corporates
www.fitchratings.com December 16, 2013
Gaming / U.S.A.
2014 Outlook: U.S. Gaming Deleveraging Potential Outlook Report
High Leverage Is So 2013: After a busy 2013, with a first-ever gaming/REIT spin-off and three major debt-funded M&A transactions, gaming companies are positioned with solid FCF profiles, limited development prospects and stringent credit agreement provisions. Fitch Ratings believes this is a formula for meaningful deleveraging across the industry. Notable exceptions could be the U.S.-based Macau operators, which will be ramping up developments on Cotai and currently maintain low leverage levels in Macau. A handful of lightly leveraged companies may also look to increase shareholder-friendly activity.
Finally, a Gaming REIT: Fitch believes the entrance of REITs into the gaming sector will potentially drive up trading EV/EBITDA multiples, provide new sources of capital (e.g. sale and leaseback), create better transparency on the value of physical casino assets and the gaming licenses (retained by the operator) and possibly increase tolerance for higher leverage.
Tepid Domestic Growth Prospects: 2014 casino openings in Ohio, Baltimore and possibly Lake Charles, LA will grow but also cannibalize their respective markets. Same-store growth will continue to be soft, although we project regional markets to fare better relative to 2013 as the effects from the sequester and the payroll tax holiday rollback will anniversary. Operators with exposure to the Las Vegas Strip and Macau will continue to benefit. We project 3% gaming revenue growth for the Las Vegas Strip (5% RevPAR growth) and 12% for Macau.
Greater Interest Rate Sensitivity: Many gaming companies used term loans to refinance fixed-rate notes or execute M&As. We estimate that for the top 15 gaming issuers on a simple average-basis bank debt will make up 50% of their debt outstanding heading into 2014 relative to 44% at year-end 2012. This might be more of a 2015/2016 risk, as the Fed has signaled its intention to keep rates low for the time being. See page 4 for more analysis.
Industry on Sound Footing: Financial flexibility for most gaming issuers remains solid despite the ramp-up in equity-friendly initiatives undertaken by some in 2013. A few issuers improved credit profiles by refinancing more expensive debt, extending maturities and/or using asset sale and equity issuance proceeds to pay down debt. Caesars Entertainment Operating Company (CEOC) remains over-leveraged and we think some sort of restructuring is possible in 2014.
Regulatory Watch: Online gaming will be live in three states. Gaming licenses will be awarded in Massachusetts, Prince George County, MD, and Philadelphia, while New York will start the bidding process for its four new licenses. The Florida and Illinois legislatures will consider gaming expansions. On the federal level, online gaming will get some albeit little traction, while the Obama administration will continue to take a lenient stance on off-reservation gaming.
Outlook Sensitivities Stable Outlook Well Entrenched: We can get more bullish if the U.S. economy outperforms Fitch’s GDP 2.6% growth forecast for 2014; online gaming is accretive to land-based operations; Penn’s REIT spin-off provides additional source of capital for the sector at attractive terms; and companies err on the side of conservatism when making capital allocation decisions.
Room for Caution: The converse of the above positive drivers may have us take a more bearish stance. However, it is worth reiterating that gaming companies are generally on sound financial footing and there is some tolerance for a modest amount of operating pressure and/or further ramp-up in shareholder-friendly activities.
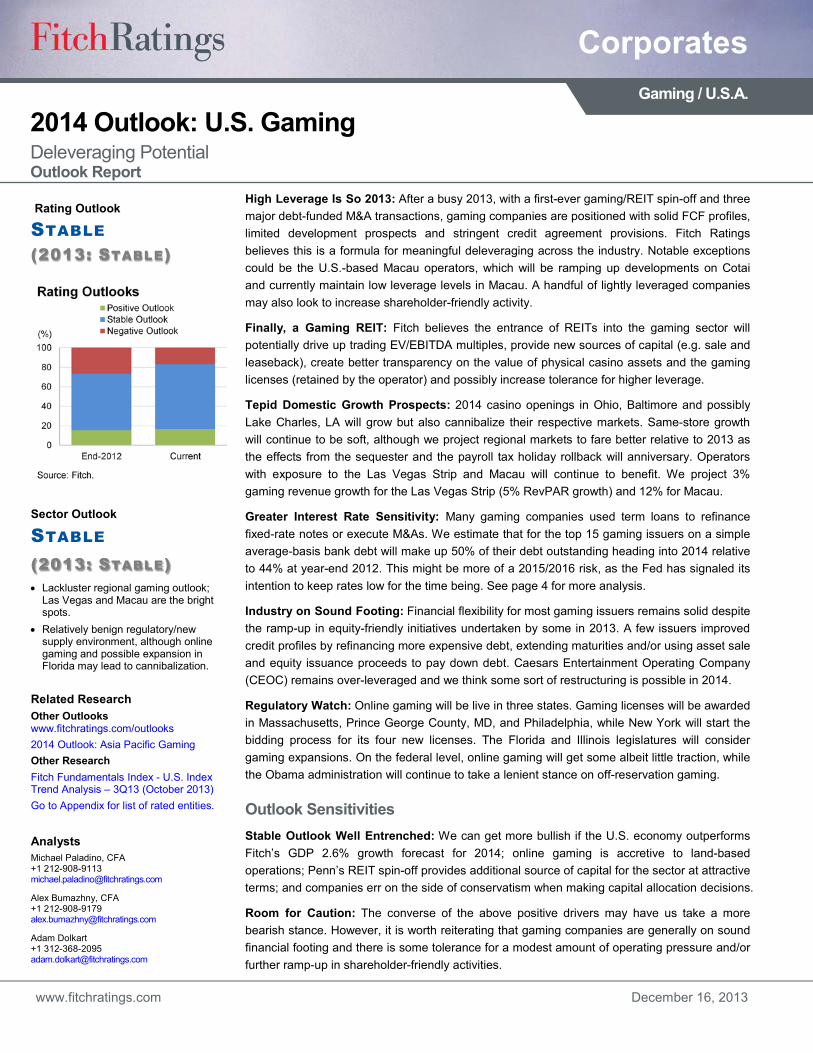
Rating Outlook
STABLE (2013: STABLE)
Sector Outlook
STABLE (2013: STABLE) x Lackluster regional gaming outlook;
Las Vegas and Macau are the bright spots.
x Relatively benign regulatory/new supply environment, although online gaming and possible expansion in Florida may lead to cannibalization.
Related Research Other Outlooks www.fitchratings.com/outlooks 2014 Outlook: Asia Pacific Gaming Other Research
Fitch Fundamentals Index - U.S. Index Trend Analysis – 3Q13 (October 2013) Go to Appendix for list of rated entities.
Analysts Michael Paladino, CFA +1 212-908-9113 [email protected]
Alex Bumazhny, CFA +1 212-908-9179 [email protected]
Adam Dolkart +1 312-368-2095 [email protected]
Corporates
2014 Outlook: U.S. Gaming 2 December 16, 2013
Key Issues
Stated Financial Policies Point to Deleveraging in 2014 for Most Fitch expects gaming companies to take a breather in 2014 after a hectic 2013, which saw a first-ever gaming/REIT spin-off and three large-scale M&As. Casino operators with high leverage will focus on deleveraging, while opportunistically seeking out small-scale M&As and development opportunities. Multiple U.S. regional operators, which tend to be 6x–7x leveraged, have publicly stated goals of lowering their leverage to 5x or below.
Deleveraging will be aided by nearly universal healthy FCFs, modest development pipelines, and covenants that restrict dividends. Pinnacle Entertainment (Pinnacle), Station Casino (Station), Boyd Gaming (Boyd), Isle of Capri (Isle) all fit this profile. The above attributes also apply to MGM Resorts International (MGM) for 2014, although we expect the company to get into the heavy-spending phase of its Cotai project and possibly start construction in Maryland and/or Massachusetts toward the latter part of 2014.
Las Vegas Sands (LVS) and Wynn Resorts (Wynn) are the only two major U.S.-headquartered commercial operators with leverage below 5x. Both companies have been busy returning cash to shareholders. As a result, Wynn’s leverage has migrated toward the 5x marker, with the company issuing $800 million of new money debt in 2013, some of which will go toward its $4 billion Cotai development. LVS’s outperformance in Macau has kept its leverage below 3x, despite meaningful increases in dividends and the initiation of a $2 billion share-buyback program. Both issuers’ leverage may tick up as their respective Cotai projects advance further.
Caesars Entertainment Corp’s (CEC) CEOC remains burdened by the debt load it took on in the 2008 LBO. Some form of restructuring at CEOC is possible within one to two years and maybe within the next several months, given the extent of the FCF burn. CEC did manage to refinance the debt at its PropCo entity (Caesars Entertainment Resort Properties [CERP]), which we now see as having a sustainable capital structure. To execute the refinancing CEC issued $200 million in equity and mezzanine lenders took modest haircuts (receiving 90 cents on the dollar).
We have included financial policy summary tables in the Appendix to this report starting on page 17.
High Leverage Risk is Partially Offset by Healthy FCF/Liquidity Aside from LVS and Wynn, most of commercial casino operators’ leverage hovers above 6x. For context, U.S. casinos trade at around 7x EV/EBITDA multiples for regional assets (plus/minus 1x, depending on the market/asset quality) and probably closer to 10x for Las Vegas Strip assets. Therefore, at 6x leverage some equity cushion exists, although we would still characterize the industry as highly leveraged. The concern over high leverage is partially offset by generally healthy FCF profiles and communicated desire by many industry participants to use FCF to deleverage.
We also take comfort in healthy liquidity profiles across the industry. Many issuers used favorable capital markets in 2012 and 2013 to refinance with cheaper debt while pushing out maturities.
Table of Contents Key Issues Financial Policies/Capital Allocation ........ 2 Balance Sheets Highly Leveraged ........... 2 REIT Spin-Off Implications ....................... 3 Short-Term Rates Sensitivity ................... 4 Project Pipelines ...................................... 5 Regulation ................................................ 6 New York ................................................ 6 Florida .................................................... 7 Illinois ..................................................... 8 Market Outlooks Las Vegas Strip ...................................... 8 Midwest/South ........................................ 9 Atlantic City/Northeast.......................... 10 Las Vegas Locals ................................. 10 Asia-Pacific........................................... 11 Other Key Topics Online Gaming ..................................... 12 Native American Gaming ..................... 12 Slot Suppliers ....................................... 13 2013 Review ............................................ 13 Appendix High-Yield Defaults .............................. 15 Gaming Revenues ............................... 16 Capital Allocation Summaries .............. 17 Coverage List ....................................... 20
Corporates
2014 Outlook: U.S. Gaming 3 December 16, 2013
Industry’s First-Ever REIT: Gaming & Leisure Properties, Inc. Gaming & Leisure Properties, Inc. (Penn National’s REIT spin-off [GLPI]), with low cost of capital, will be an active buyer of gaming assets. Overall, we see the GLPI spin-off as a positive for the industry.
We want to highlight two major effects the REIT may have on the industry.
First, it may spur sale and leasebacks and other types of transactions that enable owners to monetize the casinos’ physical assets while retaining control over operations. We think this value proposition will be especially enticing for some non-strategic private casino owners (118 casinos in U.S. are privately held) and highly leveraged gaming companies looking to delever and/or raise liquidity. GLPI will be an active buyer and lessor of casino assets, which will provide an alternative source of capital for operators.
GLPI announced its first sale-and-leaseback transaction on Dec. 9, 2013. GLPI purchase Casino Queen in East St. Louis, IL, for $140 million and will lease the asset back to the existing
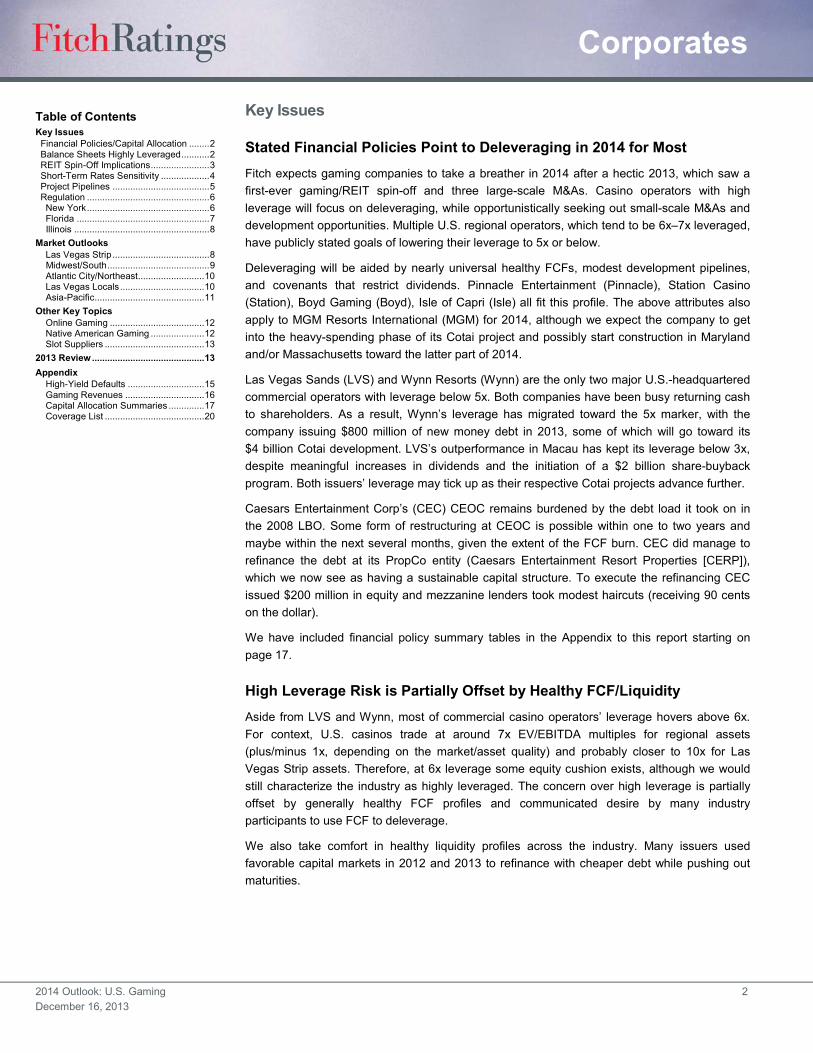
Credit Metrics and Liquidity Summary for Major Gaming Issuers Gross Leverage (x)a FCFb Pro Forma Liquidityc Pro Forma Maturities 2013 2013 Revolver
($ Mil.) IDR Outlook 2011 2012 LTM 2011 2012 LTM Cash Availability Total 2014 2015 2016 Comments Boyd Gaming
B Stable 9.0 8.1 7.6 132 50 110 � 325 325 � � � Leverage and FCF include Peninsula.
Caesars � CEOC CCC Negative 12.7 14.4 15.1 (485) (660) (1,010) 1,700 � 1,700 10 1,017 1,062 Cash is pro forma for sale of Planet Hollywood and Macau land. Bulk of revolver capacity matures Jan. 2014. For LTM period and 2012 maintenance capex is estimated at $300 million.
Caesars � CERP B� Stable 11.9 11.1 8.9 135 (26) 75 � 270 270 � � � LTM data is pro forma for the October refinancing with FCF and EBITDA based on Fitch's 2014 forecast.
Las Vegas Sands BB+ Positive 3.3 3.1 2.6 2,394 1,408 2,185 2,781 1,109 3,890 354 1,549 3,011 Includes all subsidiaries; FCF is gross of 2012 special dividends; maturities are pro forma for US refinancing.
MGM Resorts (includes Macau)
B Positive 9.2 8.2 7.2 370 323 497 1,025 2,615 3,640 537 2,353 1,642
Penn National Gaming
NPR � 2.8 3.8 5.2 449 397 170 � 475 475 � � � OpCo only; debt in LTM leverage is adjusted for rent (company estimated rent times eight); LTM FCF is based on company guidance.
Pinnacle Entertainment
B+ Stable 4.9 5.1 6.4 75 154 300 87 611 698 � � � LTM leverage is pro forma for planned asset sales, associated repayment of term loan A and other adjustments; LTM FCF is Fitch estimated run-rate
Station Casinos NPR � 9.1 7.5 7.2 2,696 145 131 � 311 311 � � � 2011 FCF is affected by fresh start accounting related to Ch. 11
Wynn Resorts BB Stable 2.4 4.7 4.8 1,188 859 644 1,841 1,550 3,391 � � � Debt includes $600 million on notes issued out of Macau in October.
Isle of Capri NPR � 5.7 6.3 6.3 100 71 65 10 104 114 � � � Fiscal year ends April 28 MTR Gaming NPR � 6.6 5.9 5.8 28 35 14 56 20 76 � � � Marina District Finance Company
B� Positive 5.0 6.8 6.6 49 37 41 � 41 41 � � �
CityCenter Holdings B Stable 9.2 9.0 6.1 47 218 150 72 75 147 � � � LTM data and maturities are pro forma for refinancing
Mohegan Tribal Gaming Authority
NPR � 5.0 5.4 5.4 118 87 34 � 97 97 21 10 � Fiscal year ends Sept. 30; LTM FCF is estimated and is net of distributions.
Median 6.2 6.5 6.3 125.0 115.6 139.7 aGross debt/property EBITDA minus cash based corporate expenses and income attributable to minority interest. For Penn pro forma leverage is adjusted for leases. bFCF is gross
of project capex and special dividends. Project capex is estimated if not disclosed by the company. cCash is unrestricted cash minus cage cash, which is estimated by Fitch unless disclosed by company. IDR � Issuer Default Rating; NPR � Not publicly rated. Source: Fitch, Company filings.

Corporates
2014 Outlook: U.S. Gaming 4 December 16, 2013
owner for $14 million per year, which equates to a 10x multiple on the rent income stream. We estimate that the $14 million rent payment represents about half of the property’s EBITDA.
Second, the GLPI spinoff may raise gaming EV/EBITDA multiples. With GLPI actively seeking buying opportunities using its lower cost of capital, casino trading multiples could be pressured upwards. This could be a good or a bad thing for credit profiles within the sector. Positively, higher multiples increase unencumbered equity in gaming companies’ capital structure. More unencumbered equity typically means more contingent liquidity and easier access to capital. On the negative side, higher multiples may require more debt to execute M&A, which may raise the industry’s debt burden over time.
Upwards pressure on trading multiples caused by GLPI could be offset overtime by rising long-term interest rates. A rise in long-term interest rates should increase the discount rates applied to value assets (growth and risk assumptions held constant) and in turn will depress valuations.
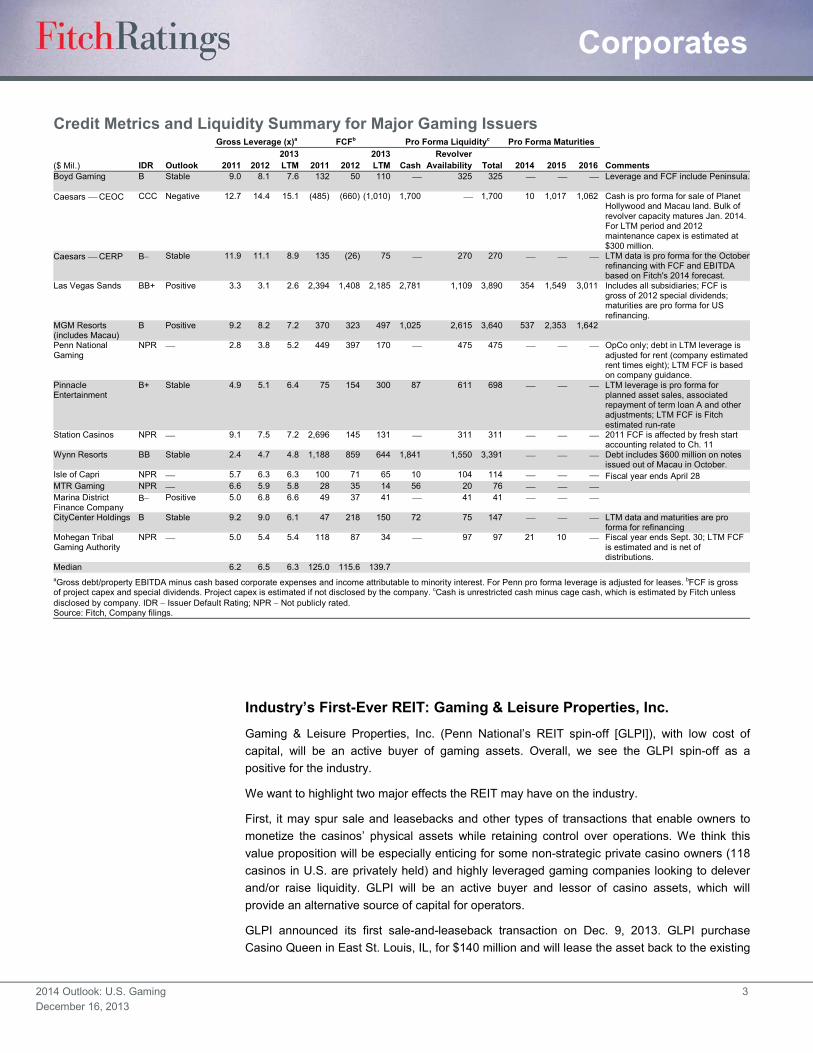
FCFs Somewhat Dependent on Short-Term Rates Remaining Low Gaming companies sizably increased their exposure to short-term rates. Term-loan issuance proceeds were often used to refinance fixed-rate bonds as well as to fund M&A and development capex. Most issuers in the sector did not hedge the interest rate risk. Some term loans were issued with Libor floors, which means interest rate increases will not be felt until Libor exceeds the applicable floor level (typically set at 1.0%–1.5%). The table below highlights the increase of variable rate debt in gaming issuers’ capital structures and FCF sensitivity to potential rate increases. Boyd Gaming, Caesars Entertainment Resort Properties, Marina District Finance Company and Mohegan Tribal Gaming Authority are examples of companies whose FCFs could be materially affected by a spike in short-term rates.
Heavy exposure to term loans also introduces the risk that, at the time of the loan maturity, the loan market will be less active, possibly forcing the issuer to refinance with more expensive fixed-rate notes. This is a more acute risk for lower-rated issuers whose FCF is highly dependent on their weighted average cost of debt remaining low relative to the credit risk.
Corporates
2014 Outlook: U.S. Gaming 5 December 16, 2013
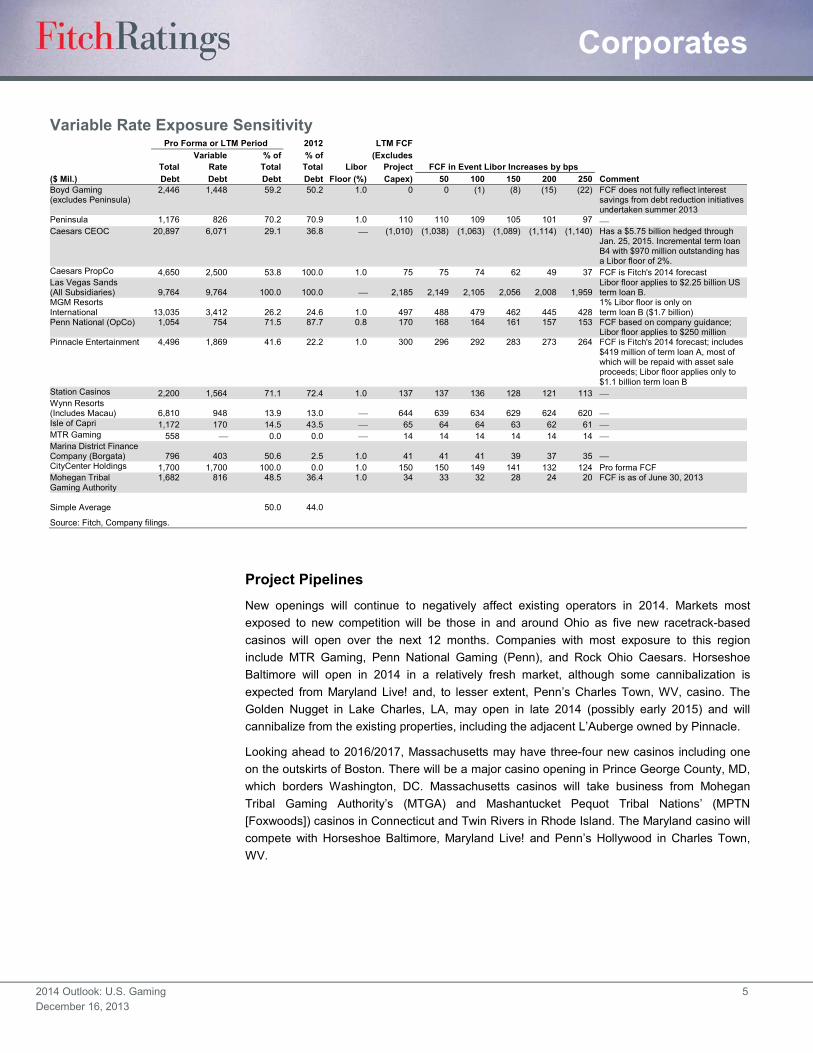
Project Pipelines New openings will continue to negatively affect existing operators in 2014. Markets most exposed to new competition will be those in and around Ohio as five new racetrack-based casinos will open over the next 12 months. Companies with most exposure to this region include MTR Gaming, Penn National Gaming (Penn), and Rock Ohio Caesars. Horseshoe Baltimore will open in 2014 in a relatively fresh market, although some cannibalization is expected from Maryland Live! and, to lesser extent, Penn’s Charles Town, WV, casino. The Golden Nugget in Lake Charles, LA, may open in late 2014 (possibly early 2015) and will cannibalize from the existing properties, including the adjacent L’Auberge owned by Pinnacle.
Looking ahead to 2016/2017, Massachusetts may have three-four new casinos including one on the outskirts of Boston. There will be a major casino opening in Prince George County, MD, which borders Washington, DC. Massachusetts casinos will take business from Mohegan Tribal Gaming Authority’s (MTGA) and Mashantucket Pequot Tribal Nations’ (MPTN [Foxwoods]) casinos in Connecticut and Twin Rivers in Rhode Island. The Maryland casino will compete with Horseshoe Baltimore, Maryland Live! and Penn’s Hollywood in Charles Town, WV.
Variable Rate Exposure Sensitivity Pro Forma or LTM Period 2012 LTM FCF Variable % of % of (Excludes Total Rate Total Total Libor Project FCF in Event Libor Increases by bps ($ Mil.) Debt Debt Debt Debt Floor (%) Capex) 50 100 150 200 250 Comment Boyd Gaming (excludes Peninsula)
2,446 1,448 59.2 50.2 1.0 0 0 (1) (8) (15) (22) FCF does not fully reflect interest savings from debt reduction initiatives undertaken summer 2013
Peninsula 1,176 826 70.2 70.9 1.0 110 110 109 105 101 97 � Caesars CEOC 20,897 6,071 29.1 36.8 � (1,010) (1,038) (1,063) (1,089) (1,114) (1,140) Has a $5.75 billion hedged through
Jan. 25, 2015. Incremental term loan B4 with $970 million outstanding has a Libor floor of 2%.
Caesars PropCo 4,650 2,500 53.8 100.0 1.0 75 75 74 62 49 37 FCF is Fitch's 2014 forecast Las Vegas Sands (All Subsidiaries) 9,764 9,764 100.0 100.0 � 2,185 2,149 2,105 2,056 2,008 1,959
Libor floor applies to $2.25 billion US term loan B.
MGM Resorts International
13,035 3,412 26.2 24.6 1.0 497 488 479 462 445 428
1% Libor floor is only on term loan B ($1.7 billion)
Penn National (OpCo) 1,054 754 71.5 87.7 0.8 170 168 164 161 157 153 FCF based on company guidance; Libor floor applies to $250 million
Pinnacle Entertainment 4,496 1,869 41.6 22.2 1.0 300 296 292 283 273 264 FCF is Fitch's 2014 forecast; includes $419 million of term loan A, most of which will be repaid with asset sale proceeds; Libor floor applies only to $1.1 billion term loan B
Station Casinos 2,200 1,564 71.1 72.4 1.0 137 137 136 128 121 113 � Wynn Resorts (Includes Macau) 6,810 948 13.9 13.0 � 644 639 634 629 624 620 � Isle of Capri 1,172 170 14.5 43.5 � 65 64 64 63 62 61 � MTR Gaming 558 � 0.0 0.0 � 14 14 14 14 14 14 � Marina District Finance Company (Borgata) 796 403 50.6 2.5 1.0 41 41 41 39 37 35 � CityCenter Holdings 1,700 1,700 100.0 0.0 1.0 150 150 149 141 132 124 Pro forma FCF Mohegan Tribal Gaming Authority
1,682 816 48.5 36.4 1.0 34 33 32 28 24 20 FCF is as of June 30, 2013
Simple Average
50.0 44.0
Source: Fitch, Company filings.
Corporates
2014 Outlook: U.S. Gaming 6 December 16, 2013
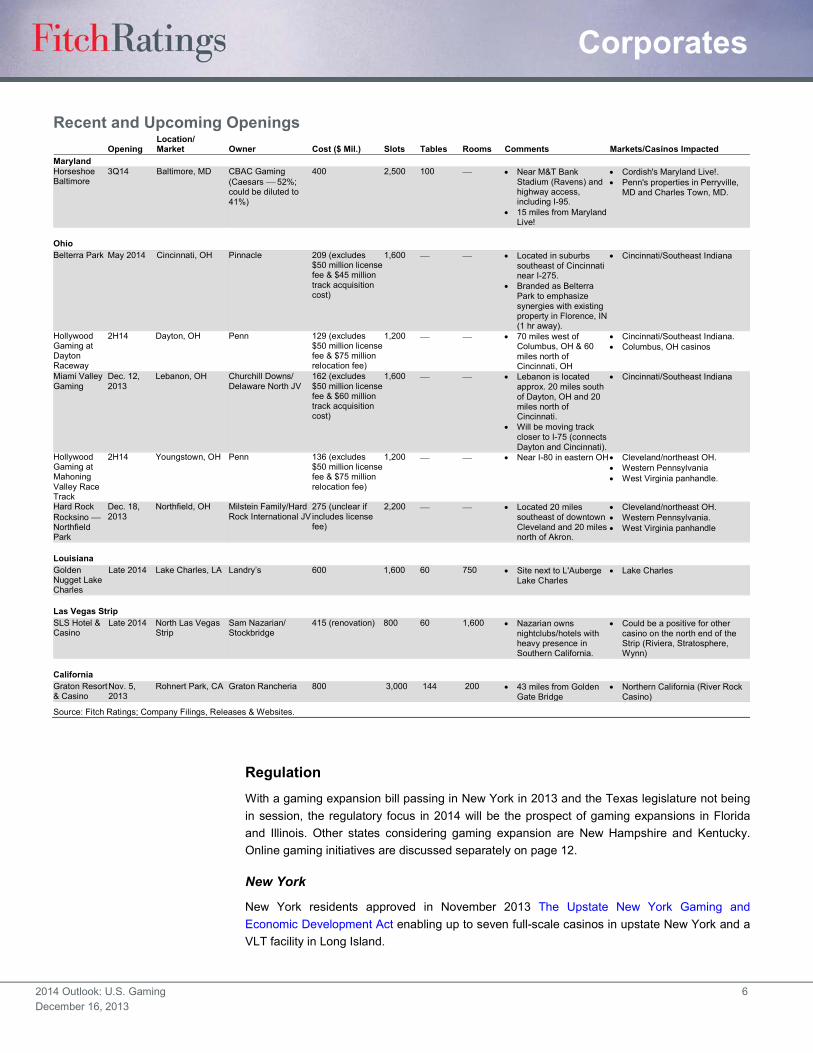
Regulation With a gaming expansion bill passing in New York in 2013 and the Texas legislature not being in session, the regulatory focus in 2014 will be the prospect of gaming expansions in Florida and Illinois. Other states considering gaming expansion are New Hampshire and Kentucky. Online gaming initiatives are discussed separately on page 12.
New York
New York residents approved in November 2013 The Upstate New York Gaming and Economic Development Act enabling up to seven full-scale casinos in upstate New York and a VLT facility in Long Island.
Recent and Upcoming Openings Opening
Location/ Market Owner Cost ($ Mil.) Slots Tables Rooms Comments Markets/Casinos Impacted
Maryland Horseshoe Baltimore
3Q14 Baltimore, MD CBAC Gaming (Caesars � 52%; could be diluted to 41%)
400 2,500 100 � x Near M&T Bank Stadium (Ravens) and highway access, including I-95.
x 15 miles from Maryland Live!
x Cordish's Maryland Live!. x Penn's properties in Perryville,
MD and Charles Town, MD.
Ohio Belterra Park May 2014 Cincinnati, OH Pinnacle 209 (excludes
$50 million license fee & $45 million track acquisition cost)
1,600 � � x Located in suburbs southeast of Cincinnati near I-275.
x Branded as Belterra Park to emphasize synergies with existing property in Florence, IN (1 hr away).
x Cincinnati/Southeast Indiana
Hollywood Gaming at Dayton Raceway
2H14 Dayton, OH Penn 129 (excludes $50 million license fee & $75 million relocation fee)
1,200 � � x 70 miles west of Columbus, OH & 60 miles north of Cincinnati, OH
x Cincinnati/Southeast Indiana. x Columbus, OH casinos
Miami Valley Gaming
Dec. 12, 2013
Lebanon, OH Churchill Downs/ Delaware North JV
162 (excludes $50 million license fee & $60 million track acquisition cost)
1,600 � � x Lebanon is located approx. 20 miles south of Dayton, OH and 20 miles north of Cincinnati.
x Will be moving track closer to I-75 (connects Dayton and Cincinnati).
x Cincinnati/Southeast Indiana
Hollywood Gaming at Mahoning Valley Race Track
2H14 Youngstown, OH Penn 136 (excludes $50 million license fee & $75 million relocation fee)
1,200 � � x Near I-80 in eastern OH x Cleveland/northeast OH. x Western Pennsylvania x West Virginia panhandle.
Hard Rock Rocksino � Northfield Park
Dec. 18, 2013
Northfield, OH Milstein Family/Hard Rock International JV
275 (unclear if includes license fee)
2,200 � � x Located 20 miles southeast of downtown Cleveland and 20 miles north of Akron.
x Cleveland/northeast OH. x Western Pennsylvania. x West Virginia panhandle
Louisiana Golden Nugget Lake Charles
Late 2014 Lake Charles, LA Landry’s 600 1,600 60 750 x Site next to L'Auberge Lake Charles
x Lake Charles
Las Vegas Strip SLS Hotel & Casino
Late 2014 North Las Vegas Strip
Sam Nazarian/ Stockbridge
415 (renovation) 800 60 1,600 x Nazarian owns nightclubs/hotels with heavy presence in Southern California.
x Could be a positive for other casino on the north end of the Strip (Riviera, Stratosphere, Wynn)
California Graton Resort & Casino
Nov. 5, 2013
Rohnert Park, CA Graton Rancheria 800 3,000 144 200 x 43 miles from Golden Gate Bridge
x Northern California (River Rock Casino)
Source: Fitch Ratings; Company Filings, Releases & Websites.
Corporates
2014 Outlook: U.S. Gaming 7 December 16, 2013
The New York bill is a positive for most gaming operators in the Northeast since it contains the expansion to less penetrated regions of the state. The expansion in New York should have minimal negative impact on Atlantic City and Philadelphia casinos, but could have a more material yet manageable impact on casinos in northeast Pennsylvania.
The bill is a relative credit positive for Atlantic City operators like Borgata as New York gaming expansion via tables in Yonkers and Queens or full-scale casinos in New York City would have been more damaging. The bill is also a positive for casino operators in Connecticut, Pennsylvania (with exception of the Pocono area casinos) and prospective casino owners in Massachusetts. There should be minimal impact to upstate Native American casinos, but Oneida’s Turning Stone likely has the greatest risk of a small negative competitive impact.
The Empire Casino in Yonkers, NY, and Resorts World in Queens, NY, VLT facilities are the most disadvantaged because the bill provisions do not allow them to operate table games but increases competition by allowing an additional VLT facility in Long Island.
The bill allows a total of four casinos in three regions of upstate New York that are not subject to exclusivity agreements with Native American tribes: Capital District-Saratoga, Hudson Valley-Catskill and Eastern Southern Tier. No more than two casinos can be built in any one region. The initial licenses have to be awarded within 90-days of the majority of the members being appointed to the gaming commission’s license selection board. Seven years subsequent to the initial four casinos commencing gaming activities the state can accept applications for additional three licenses. No licenses can ever be granted for zone one , which includes all five boroughs of New York City, Long Island and suburbs immediately north of New York City.
The Hudson Valley-Catskill region is likely to be the most hotly contested region with three established groups prepared to apply for licenses.
Florida
In Florida, the state’s Senate Committee on Gaming received a comprehensive study report done by Spectrum Gaming Group in October 2013. The report covers the economic impact of various scenarios from “no expansion” up to a scenario including gaming at all of the state’s racetracks and multiple integrated casino resorts. The study may influence the legislature’s thoughts on expanding gaming in the state beyond the Native American casinos and slots at pari-mutuels in Broward and Miami/Dade Counties. The legislature intends to address gaming expansion in the 2014 session, which spans from March 4 to May 2.
Fitch believes that there is little likelihood of gaming expanding beyond southeast Florida, which would be opposed by the representatives from the more conservative districts in the north, Disney in Orlando and Seminole Tribe of Florida (STOF). STOF pays the state a compact fee equivalent to roughly 12% of its gaming revenues and guarantees the state at least $233 million per year in compact payments through 2015. STOF has the right to suspend or reduce compact payments under certain scenarios that introduce new competition in the state beyond slots at the southeast Florida pari-mutuels.
Table games at southeast Florida pari-mutuels and/or to lesser extent a limited number of integrated resorts in Miami/Fort. Lauderdale metro area seem to be the more plausible scenarios. We think that although new completion could be a negative for STOF, the compact provisions reducing payments in the event of new competition would offset the potential revenue declines by a significant degree. Churchill Downs and Isle of Capri have exposure in southeast Florida, but could potentially stand to benefit from possible approval of table games.
Corporates
2014 Outlook: U.S. Gaming 8 December 16, 2013
Illinois
A gaming expansion bill may come back with more vigor in Illinois’s 2014 legislative session compared to 2013 when the legislature was burdened with pension reform. And although pension reform was passed earlier this month, enactment of a gaming expansion bill remains highly uncertain given the opposition by the governor.
Some efforts were made in 2013 to revive a gaming expansion bill passed by Illinois’ legislature in 2011, but that was ultimately vetoed by the governor in 2012. The bill would have added five new casino licenses including one in downtown Chicago, permitted slots at tracks; and allowed additional positions and reduce gaming tax at the existing casinos. The governor’s veto was largely based on his opposition to slots at tracks although he also cited other concerns including lack of safeguards against corruption. The 2013 bill (SB1739), which passed the Senate 32-20 but did not make it to a vote in the House, was largely unchanged from the 2011 version.
Should the expansion ever pass, the casinos most negatively impacted are those in northwest Indiana (including Caesars’ Horseshoe Hammond and Pinnacle’s Ameristar East Chicago) and southeast Wisconsin (tribal casinos such as the Potawatomi casino in Milwaukee), as these operators will not benefit from reduced tax rates or added positions. The proposed law would be a net negative for existing, Illinois-based, Chicagoland operators. However, the negative impact will be partially offset by the ability to add positions and a reduced gaming tax rate.
Market Outlooks
Las Vegas Strip Fitch is positive concerning the Las Vegas Strip trends for 2014 and projects 3% gaming revenue growth, which is also Fitch’s original forecast for the 2013 Strip gaming revenue growth and slightly above the year-to-date growth of 2.5% through October.
We project 4%–5% RevPAR growth for the Las Vegas Strip relative to the 2.4% year-to-date average daily room rate (ADR) growth and largely unchanged occupancy through October. We project citywide visitation growth of approximately 1% relative to 0.3% decline year-to-date. Visitation growth has underperformed relative our original forecast of 2%.
Low single-digit visitation growth will be supported by occupancy rates that remain low by historical standards; opening of 1,600-room SLS Las Vegas in fall-2014; increased forward convention bookings underpinned by the return of the CONEXPO-CON/AGG convention (120,000 attendees in 2011) and increased flight capacity.
Year-to-date occupancy rates on the Strip are at 88% through September 2013, which is well below the city-wide high reached in 2007 of 94% (Strip stand-alone occupancy is unavailable for 2007). Given that there are slightly more than 90,000 rooms on the Strip and assuming 94% is a full occupancy rate there are almost 2 million available room nights. Further assuming average length of stay of four nights, the Strip can support 500,000 more visitors per year relative to about 40 million citywide visitors per year.
McCarran International Airport’s flight capacity, measured by seats for December 2013, is up by 2.2% from December 2012.
Fitch believes that, similar to 2013, operators on the Las Vegas Strip will emphasize ADR’s over-occupancy. However, we expect to see some, albeit limited, uptick in occupancy given the
2013 Illinois Proposal x Four new casinos in the cities of
Rockford, Danville, Park City, Chicago and one in the south suburbs of Cook County;
x Existing casinos can increase positions to 1,600 from 1,200 and would have to pay a $12,500 license fee per additional position; ($25,000 within Cook County); and
x Tax rates are revised down.
Corporates
2014 Outlook: U.S. Gaming 9 December 16, 2013
healthy convention calendar and forward bookings. Occupancy may ratchet down in fall when SLS Las Vegas opens.
Gaming revenues will continue to be heavily reliant on baccarat, which tends to be volatile month-to-month and represents 23% of the Strip’s gaming revenues for the LTM period ending Oct. 31, 2013. Non-baccarat gaming revenues are up only 0.5% year-to-date with strong blackjack performance (up 12%) offsetting a 1% decline in slot machine revenues. Blackjack is a good proxy for domestic high-end play, while slots represent the low-to-mid segment.
This trend is somewhat by design as the Strip operators have been emphasizing table games over slots. In October 2013, the number of slots on the Strip declined by almost 4% while blackjack tables increased by 2% over the prior-year period.
The increased emphasis on the higher-tier players is not restricted to the Las Vegas Strip. The regional operators are also focusing more on the top tier of their databases, which tends to be less sensitive to macro pressures such as the roll-back in the payroll holiday.
Midwest/South For the Midwest/South region casinos Fitch projects largely flat same store revenue growth and low-single digit growth including new supply (7,800 new gaming machine positions in Ohio alone). Fitch expects the Midwest/South regional markets to fare better relative to 2013, which has been a very disappointing year for regional markets in general with most markets down in midsingle-digit range year-to-date. In line with Fitch’s outlook for the U.S. economy, we think improved housing and employment markets will translate into better consumer sentiment. The anniversary of the sequester and sunset of the payroll tax holiday will also help. However, we still expect same-store regional gaming revenues to remain sluggish in midst of additional competition (especially in and around Ohio) and the average consumer still being cautious when it comes to more discretionary spending.
(15)
(10)
(5)
0
5
10
15
20
25
30
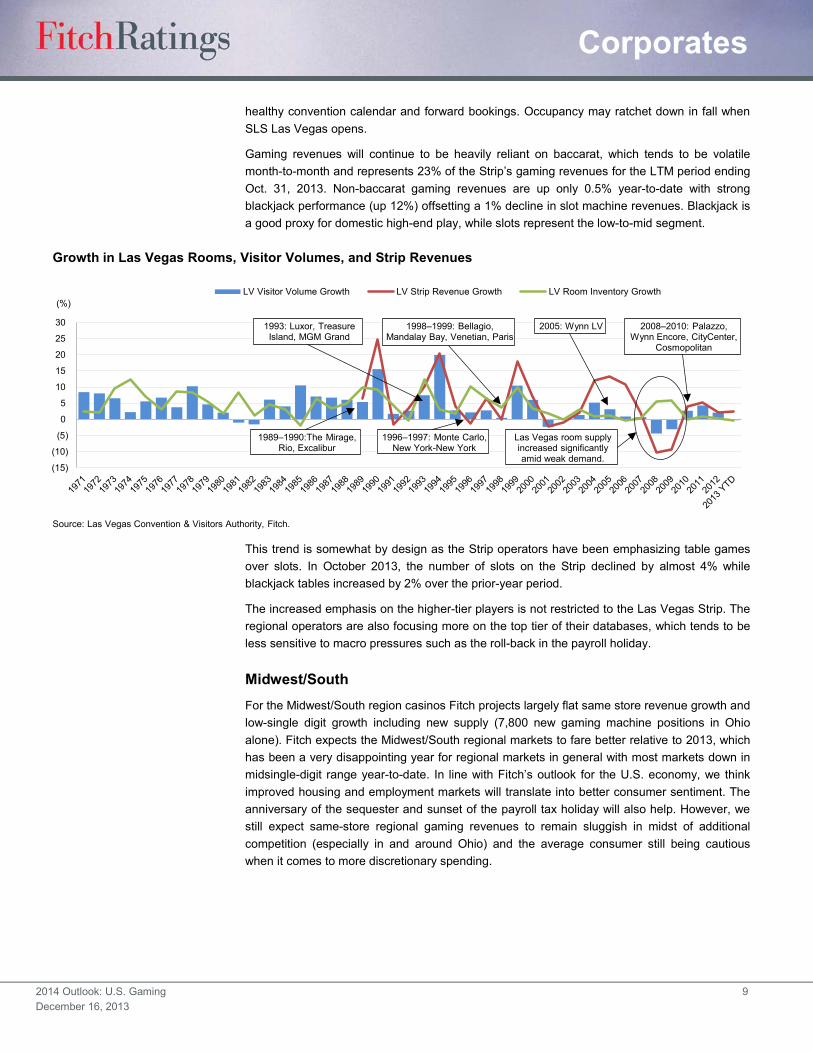
LV Visitor Volume Growth LV Strip Revenue Growth LV Room Inventory Growth
Growth in Las Vegas Rooms, Visitor Volumes, and Strip Revenues
Source: Las Vegas Convention & Visitors Authority, Fitch.
(%)
1989–1990:The Mirage, Rio, Excalibur
1993: Luxor, Treasure Island, MGM Grand
1998–1999: Bellagio, Mandalay Bay, Venetian, Paris
2008–2010: Palazzo, Wynn Encore, CityCenter,
Cosmopolitan
2005: Wynn LV
1996–1997: Monte Carlo, New York-New York
Las Vegas room supply increased significantly amid weak demand.
Corporates
2014 Outlook: U.S. Gaming 10 December 16, 2013
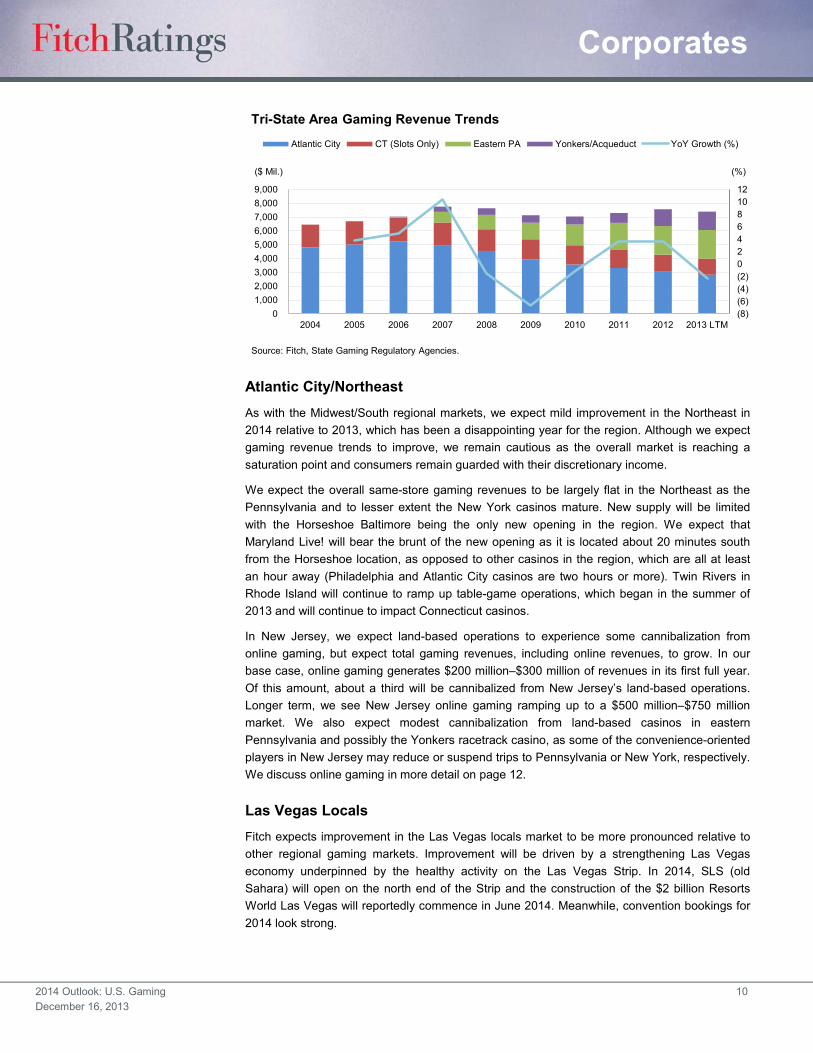
Atlantic City/Northeast As with the Midwest/South regional markets, we expect mild improvement in the Northeast in 2014 relative to 2013, which has been a disappointing year for the region. Although we expect gaming revenue trends to improve, we remain cautious as the overall market is reaching a saturation point and consumers remain guarded with their discretionary income.
We expect the overall same-store gaming revenues to be largely flat in the Northeast as the Pennsylvania and to lesser extent the New York casinos mature. New supply will be limited with the Horseshoe Baltimore being the only new opening in the region. We expect that Maryland Live! will bear the brunt of the new opening as it is located about 20 minutes south from the Horseshoe location, as opposed to other casinos in the region, which are all at least an hour away (Philadelphia and Atlantic City casinos are two hours or more). Twin Rivers in Rhode Island will continue to ramp up table-game operations, which began in the summer of 2013 and will continue to impact Connecticut casinos.
In New Jersey, we expect land-based operations to experience some cannibalization from online gaming, but expect total gaming revenues, including online revenues, to grow. In our base case, online gaming generates $200 million–$300 million of revenues in its first full year. Of this amount, about a third will be cannibalized from New Jersey’s land-based operations. Longer term, we see New Jersey online gaming ramping up to a $500 million–$750 million market. We also expect modest cannibalization from land-based casinos in eastern Pennsylvania and possibly the Yonkers racetrack casino, as some of the convenience-oriented players in New Jersey may reduce or suspend trips to Pennsylvania or New York, respectively. We discuss online gaming in more detail on page 12.
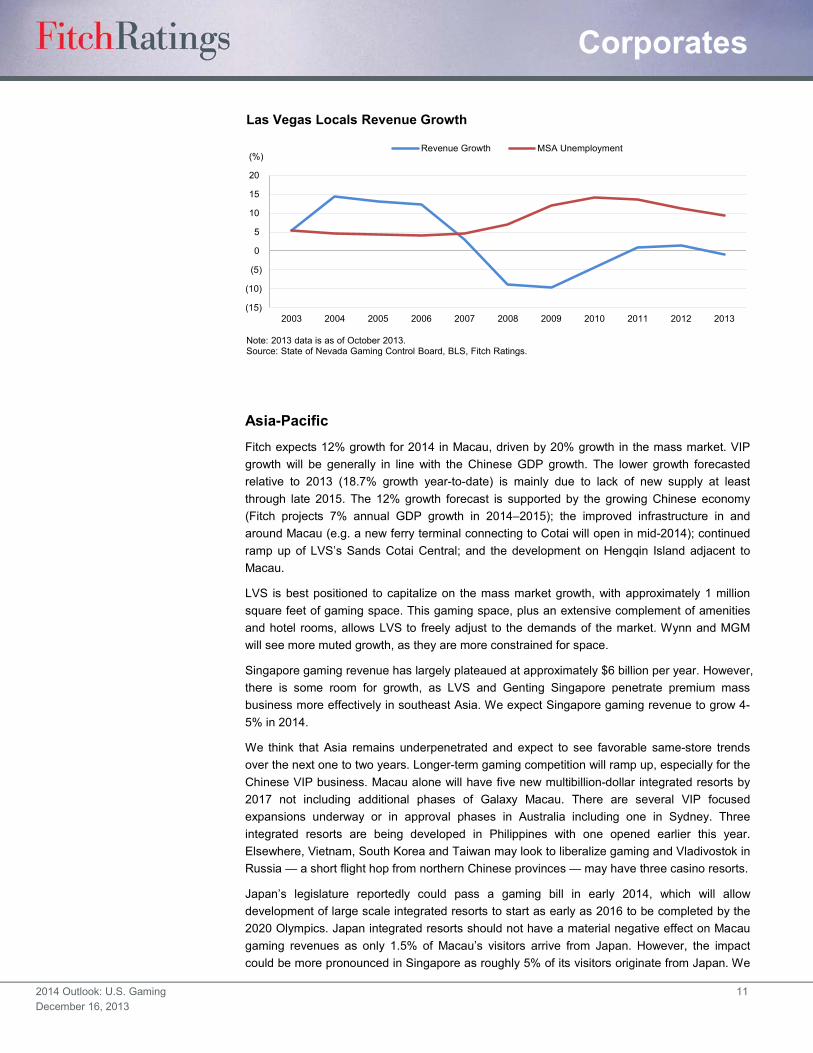
Las Vegas Locals Fitch expects improvement in the Las Vegas locals market to be more pronounced relative to other regional gaming markets. Improvement will be driven by a strengthening Las Vegas economy underpinned by the healthy activity on the Las Vegas Strip. In 2014, SLS (old Sahara) will open on the north end of the Strip and the construction of the $2 billion Resorts World Las Vegas will reportedly commence in June 2014. Meanwhile, convention bookings for 2014 look strong.
(8)(6)(4)(2)024681012
01,0002,0003,0004,0005,0006,0007,0008,0009,000
2004 2005 2006 2007 2008 2009 2010 2011 2012 2013 LTM
Atlantic City CT (Slots Only) Eastern PA Yonkers/Acqueduct YoY Growth (%)
Tri-State Area Gaming Revenue Trends
Source: Fitch, State Gaming Regulatory Agencies.
($ Mil.) (%)
Corporates
2014 Outlook: U.S. Gaming 11 December 16, 2013
Asia-Pacific Fitch expects 12% growth for 2014 in Macau, driven by 20% growth in the mass market. VIP growth will be generally in line with the Chinese GDP growth. The lower growth forecasted relative to 2013 (18.7% growth year-to-date) is mainly due to lack of new supply at least through late 2015. The 12% growth forecast is supported by the growing Chinese economy (Fitch projects 7% annual GDP growth in 2014–2015); the improved infrastructure in and around Macau (e.g. a new ferry terminal connecting to Cotai will open in mid-2014); continued ramp up of LVS’s Sands Cotai Central; and the development on Hengqin Island adjacent to Macau.
LVS is best positioned to capitalize on the mass market growth, with approximately 1 million square feet of gaming space. This gaming space, plus an extensive complement of amenities and hotel rooms, allows LVS to freely adjust to the demands of the market. Wynn and MGM will see more muted growth, as they are more constrained for space.
Singapore gaming revenue has largely plateaued at approximately $6 billion per year. However, there is some room for growth, as LVS and Genting Singapore penetrate premium mass business more effectively in southeast Asia. We expect Singapore gaming revenue to grow 4-5% in 2014.
We think that Asia remains underpenetrated and expect to see favorable same-store trends over the next one to two years. Longer-term gaming competition will ramp up, especially for the Chinese VIP business. Macau alone will have five new multibillion-dollar integrated resorts by 2017 not including additional phases of Galaxy Macau. There are several VIP focused expansions underway or in approval phases in Australia including one in Sydney. Three integrated resorts are being developed in Philippines with one opened earlier this year. Elsewhere, Vietnam, South Korea and Taiwan may look to liberalize gaming and Vladivostok in Russia — a short flight hop from northern Chinese provinces — may have three casino resorts.
Japan’s legislature reportedly could pass a gaming bill in early 2014, which will allow development of large scale integrated resorts to start as early as 2016 to be completed by the 2020 Olympics. Japan integrated resorts should not have a material negative effect on Macau gaming revenues as only 1.5% of Macau’s visitors arrive from Japan. However, the impact could be more pronounced in Singapore as roughly 5% of its visitors originate from Japan. We
(15)
(10)
(5)
0
5
10
15
20
2003 2004 2005 2006 2007 2008 2009 2010 2011 2012 2013
Revenue Growth MSA Unemployment
Las Vegas Locals Revenue Growth
Note: 2013 data is as of October 2013.Source: State of Nevada Gaming Control Board, BLS, Fitch Ratings.
(%)
Corporates
2014 Outlook: U.S. Gaming 12 December 16, 2013
see the opportunity to develop in Japan as a credit positive for the potential bidders as we think the market presents attractive return on investment prospects.
We are publishing a concurrent Asia-Pacific stand-alone outlook report for the Asia-Pacific region. Click here to access it.
Other Key Topics
Online Gaming 2014 will be the test year for U.S. online gaming with New Jersey being the first large state to legalize online gaming. Fitch projects New Jersey online gaming will become a $500 million– $750 million market and generate $200 million–$300 million in 2014. With fewer than 900,000 people, the much smaller Delaware also started online gaming operations earlier this year. Both states allow all major forms of gaming online and tie the licenses to land-based casino licenses. Nevada started poker-only operations with two sites up and running — Caesars’ WSOP and Ultimate Poker by Fertitta Interactive.
We think that Delaware and Nevada do not have a critical mass of potential players to generate meaningful profit. This is more so for Nevada which only permits poker, a game that requires many players playing simultaneously to have a viable product (i.e. “liquidity”). In New Jersey, a state with nearly 9 million people, having enough players should not be an issue and the state is also permitting a broader suite of casino games than just poker. However, the margins could be tight after factoring in fees paid to platform providers and content suppliers, advertising, promotions and bonuses (i.e. free play).
The states with online gaming are looking into potentially pooling players via interstate compacts. This would be a positive development for online gaming. However, we are unsure about the plan’s legality in context of the Unlawful Internet Gambling Enforcement Act (UIGEA), a federal law that made interstate online gaming illegal in 2006. There are also more practical questions as to whether an agreement could be reached that addresses how the profits and tax dollars are split amongst the operators and states, respectively. There is however some precedent for pooling players across state lines in the Powerball lottery games.
We do not expect any other jurisdictions to legalize online gambling in 2014 although we would not rule it out completely. With three states passing online gambling the pressure to legalize will increase for states that are considering it. The most meaningful states to watch in terms of population and probability of passage are California and Pennsylvania. Other states where online gaming may come up in the legislative sessions are Mississippi and Iowa. There was also talk about Illinois possibly tacking on online gaming to a broader gaming bill but, as we discuss on page 8, we think chances of any gaming expansion in that state passing are small.
Native American Gaming Based on public information reported to states, and information disclosed to Fitch and broader investment community, tribal casinos broadly fared better in 2013 relative to regional commercial counterparts. We attribute this to the tribal casinos’ generally more protected and less saturated markets. However, we did see an uptick in promotional activity in Southern California. We expect similar trends to continue into 2014.
On the regulatory front, we expect the Obama administration to continue to take a lenient stance on off-reservation gaming. In 2013, the Department of Interior (DOI) ruled in favor of taking a parcel of land in Kenosha, WI, into trust on behalf of Menominee through a two-part
Corporates
2014 Outlook: U.S. Gaming 13 December 16, 2013
determination process. This was the agency’s fourth positive two-part determination decision since 2011, and arguably its most controversial one to date, given the distance of the site from the reservation and the potential economic impact on surrounding tribes.
In 2014, the DOI may consider other land-into-trust applications, including the Spokane Tribe (affecting the Kalispel Tribe), Los Coyotes Band of California (this would affect San Manuel Band of Mission Indians), and Ho Chunk Nation (near Chicago-area casinos).
We think the DOI’s lenient stance is a positive for the Mashpee Wampanoag Tribe (Mashpee), which recently finalized its compact with Massachusetts for the state’s southeast license. The tribe needs its parcel of land in Taunton, MA, to be placed into trust and approved for gaming purposes. Although the DOI is advancing Mashpee’s application (the DOI completed a draft of the environmental study) and may yet decide to take the land into trust, the process could still get derailed by the opponents of the project. Opponents can argue that the tribe was not under federal jurisdiction in 1934 (the tribe was recognized in 2007), and, pursuant to the 2009 Carcieri v. Salazar ruling, the DOI is not permitted to take the land into trust. This same argument has stalled the Cowlitz Indian Tribe’s efforts in Washington after the DOI positively ruled on Cowlitz’s land-into-trust application in 2010.
Slot Suppliers Fitch’s 2014 outlook for suppliers is stable and supported by generally healthy balance sheets, new openings in Ohio, Las Vegas, Louisiana and Maryland; and a healthier, albeit still tepid, replacement cycle. Also some U.S.-based suppliers are well positioned to capitalize on online gaming. In New Jersey, IGT’s slot content is heavily featured on gaming sites and Bally is the platform provider for the Golden Nugget. These positive factors are offset by encroachment into the historically oligopolistic industry by smaller companies such as Multimedia Gaming and by weak performance in gaming operations (i.e. participation games), which we expect to carry into 2014. IGT’s gaming operations segment has been most exposed with Bally ramping up its gaming operations offering over the last two-three years and more recently Aristocrat making a big push in the space.
2013 Review With the exception of Macau and the Las Vegas Strip, the gaming sector largely underperformed relative to our original expectations. Most regional markets experienced midsingle-digit gaming revenue declines year-to-date through October (see gaming revenue table on page 16) with November looking just as bleak for the states that have reported so far. We attribute this underperformance partially to effects on the consumer from the rollback in the payroll tax holiday and, to lesser extent, the sequester.
As Fitch expected, the cannibalization in markets with new competition was significant, especially in the Cincinnati market where the Horseshoe casino opened last spring. Casinos in Bossier City/Shreveport market were also meaningfully affected by the opening of the Margaritaville although not as bad as the ones in Cincinnati.
Also as we anticipated, industry participants were busy maximizing shareholder value. There were three leveraging M&A transactions (Pinnacle buying Ameristar, Bally buying Shuffle Master, and Scientific Games buying WMS), dividend increases (LVS and IGT) and partially debt funded special dividends (Wynn announcing special dividends shortly after raising $600 million in Macau). Penn spun off its physical assets into a REIT capitalizing both companies with higher leverage compared to the original company when adjusting for rent.

Corporates
2014 Outlook: U.S. Gaming 14 December 16, 2013
Positively, most of these companies’ FCFs will remain healthy and some, such as Pinnacle, committed to use FCF for deleveraging.
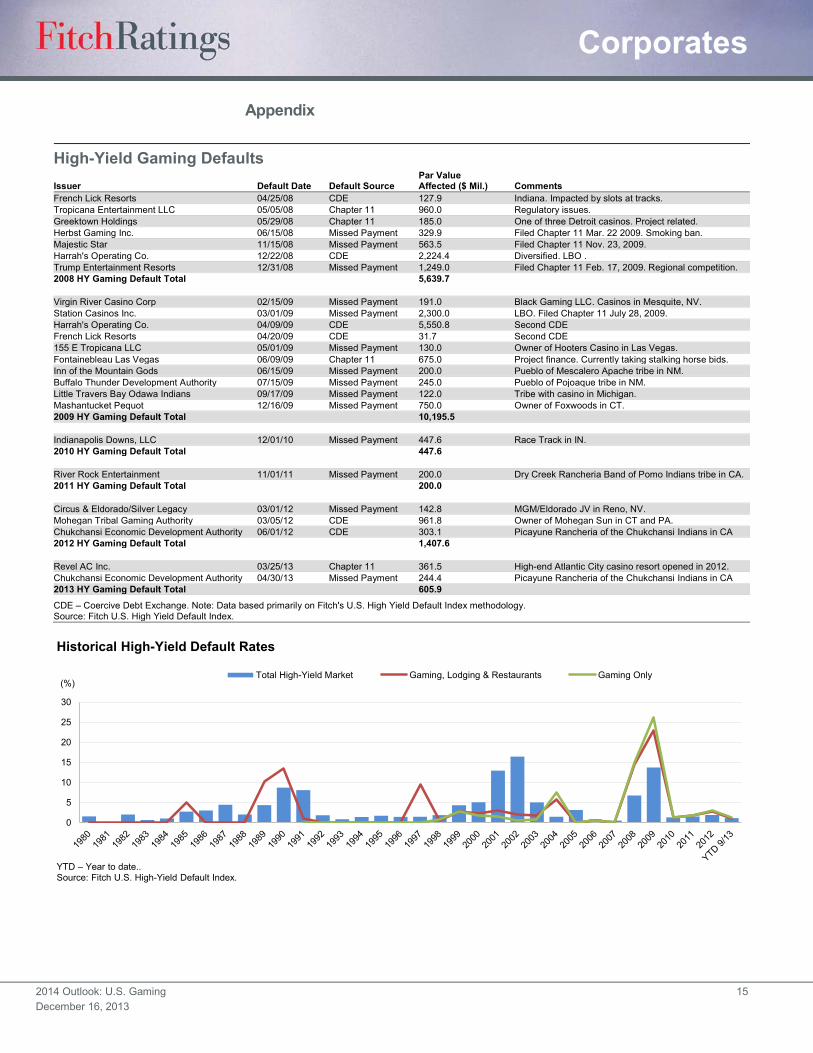
In terms of defaults, 2013 was a tough year for Revel investors. The property defaulted on $1.6 billion of debt with court determined recovery of approximately $450 million (28%), which includes $250 million in cash received by DIP facility lenders. (Note that the table and graph on page 15 only includes high-yield bonds). The property continues to operate with a negative EBITDA and may have to restructure again.
Outside of Revel, Chukchansi Economic Development Authority (CEDA), a tribal casino enterprise outside of Fresno, CA, defaulted on $244 million in notes after missing an interest payment. A tribal political dispute led to uncertainty as to who had control over the casino cash flows leading to the missed payment.
On a positive note for Native American finance, Mashantucket Pequot Tribal Nation (MPTN) finally executed its long-awaited restructuring in 2013 after defaulting in 2009 on approximately $2.3 billion of debt. All things considered, Fitch views the restructuring, which brought total debt down to $1.7 billion, as bondholder friendly. However, we caution that MPTN remains highly leveraged and susceptible to another default.
Corporates
2014 Outlook: U.S. Gaming 15 December 16, 2013
Appendix
High-Yield Gaming Defaults Issuer Default Date Default Source
Par Value Affected ($ Mil.) Comments
French Lick Resorts 04/25/08 CDE 127.9 Indiana. Impacted by slots at tracks. Tropicana Entertainment LLC 05/05/08 Chapter 11 960.0 Regulatory issues. Greektown Holdings 05/29/08 Chapter 11 185.0 One of three Detroit casinos. Project related. Herbst Gaming Inc. 06/15/08 Missed Payment 329.9 Filed Chapter 11 Mar. 22 2009. Smoking ban. Majestic Star 11/15/08 Missed Payment 563.5 Filed Chapter 11 Nov. 23, 2009. Harrah's Operating Co. 12/22/08 CDE 2,224.4 Diversified. LBO . Trump Entertainment Resorts 12/31/08 Missed Payment 1,249.0 Filed Chapter 11 Feb. 17, 2009. Regional competition. 2008 HY Gaming Default Total
5,639.7
Virgin River Casino Corp 02/15/09 Missed Payment 191.0 Black Gaming LLC. Casinos in Mesquite, NV. Station Casinos Inc. 03/01/09 Missed Payment 2,300.0 LBO. Filed Chapter 11 July 28, 2009. Harrah's Operating Co. 04/09/09 CDE 5,550.8 Second CDE French Lick Resorts 04/20/09 CDE 31.7 Second CDE 155 E Tropicana LLC 05/01/09 Missed Payment 130.0 Owner of Hooters Casino in Las Vegas. Fontainebleau Las Vegas 06/09/09 Chapter 11 675.0 Project finance. Currently taking stalking horse bids. Inn of the Mountain Gods 06/15/09 Missed Payment 200.0 Pueblo of Mescalero Apache tribe in NM. Buffalo Thunder Development Authority 07/15/09 Missed Payment 245.0 Pueblo of Pojoaque tribe in NM. Little Travers Bay Odawa Indians 09/17/09 Missed Payment 122.0 Tribe with casino in Michigan. Mashantucket Pequot 12/16/09 Missed Payment 750.0 Owner of Foxwoods in CT. 2009 HY Gaming Default Total
10,195.5
Indianapolis Downs, LLC 12/01/10 Missed Payment 447.6 Race Track in IN. 2010 HY Gaming Default Total
447.6
River Rock Entertainment 11/01/11 Missed Payment 200.0 Dry Creek Rancheria Band of Pomo Indians tribe in CA. 2011 HY Gaming Default Total
200.0
Circus & Eldorado/Silver Legacy 03/01/12 Missed Payment 142.8 MGM/Eldorado JV in Reno, NV. Mohegan Tribal Gaming Authority 03/05/12 CDE 961.8 Owner of Mohegan Sun in CT and PA. Chukchansi Economic Development Authority 06/01/12 CDE 303.1 Picayune Rancheria of the Chukchansi Indians in CA 2012 HY Gaming Default Total
1,407.6
Revel AC Inc. 03/25/13 Chapter 11 361.5 High-end Atlantic City casino resort opened in 2012. Chukchansi Economic Development Authority 04/30/13 Missed Payment 244.4 Picayune Rancheria of the Chukchansi Indians in CA 2013 HY Gaming Default Total
605.9
CDE – Coercive Debt Exchange. Note: Data based primarily on Fitch's U.S. High Yield Default Index methodology. Source: Fitch U.S. High Yield Default Index.
0
5
10
15
20
25
30
Total High-Yield Market Gaming, Lodging & Restaurants Gaming Only
Historical High-Yield Default Rates
YTD – Year to date..Source: Fitch U.S. High-Yield Default Index.
(%)
Corporates
2014 Outlook: U.S. Gaming 16 December 16, 2013
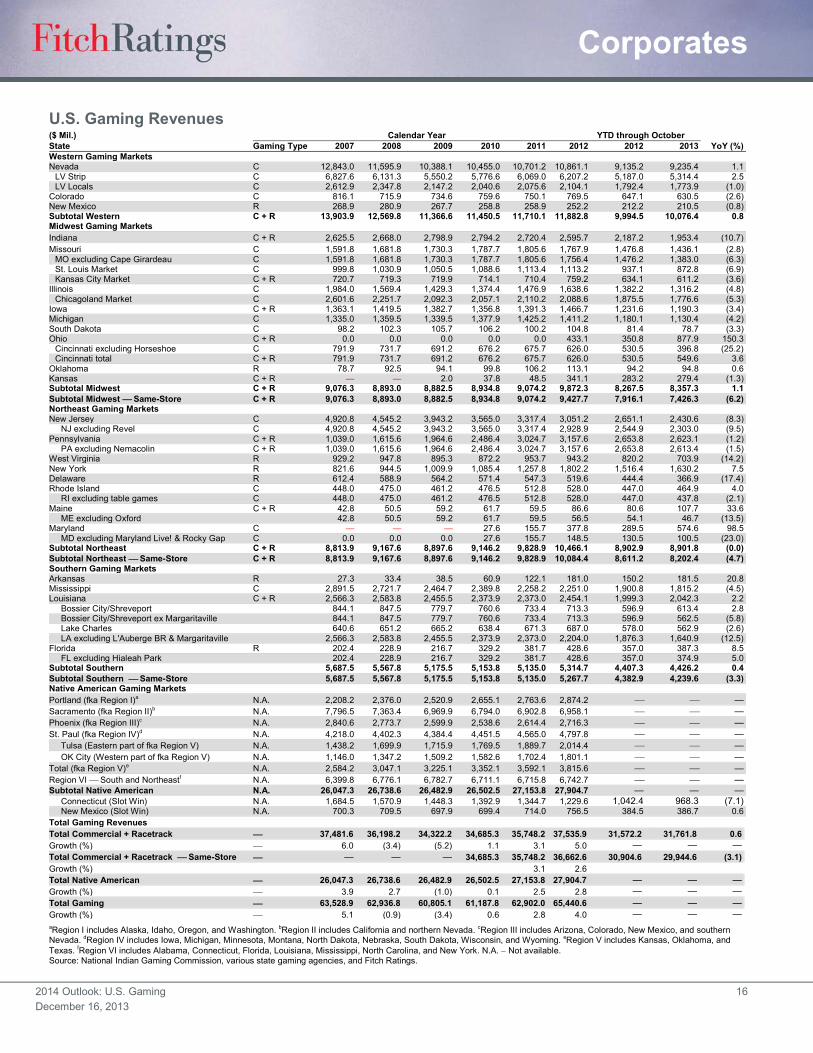
U.S. Gaming Revenues ($ Mil.) Calendar Year YTD through October
State Gaming Type 2007 2008 2009 2010 2011 2012 2012 2013 YoY (%) Western Gaming Markets
Nevada C 12,843.0 11,595.9 10,388.1 10,455.0 10,701.2 10,861.1 9,135.2 9,235.4 1.1 LV Strip C 6,827.6 6,131.3 5,550.2 5,776.6 6,069.0 6,207.2 5,187.0 5,314.4 2.5 LV Locals C 2,612.9 2,347.8 2,147.2 2,040.6 2,075.6 2,104.1 1,792.4 1,773.9 (1.0)
Colorado C 816.1 715.9 734.6 759.6 750.1 769.5 647.1 630.5 (2.6) New Mexico R 268.9 280.9 267.7 258.8 258.9 252.2 212.2 210.5 (0.8) Subtotal Western C + R 13,903.9 12,569.8 11,366.6 11,450.5 11,710.1 11,882.8 9,994.5 10,076.4 0.8 Midwest Gaming Markets
Indiana C + R 2,625.5 2,668.0 2,798.9 2,794.2 2,720.4 2,595.7 2,187.2 1,953.4 (10.7) Missouri C 1,591.8 1,681.8 1,730.3 1,787.7 1,805.6 1,767.9 1,476.8 1,436.1 (2.8)
MO excluding Cape Girardeau C 1,591.8 1,681.8 1,730.3 1,787.7 1,805.6 1,756.4 1,476.2 1,383.0 (6.3) St. Louis Market C 999.8 1,030.9 1,050.5 1,088.6 1,113.4 1,113.2 937.1 872.8 (6.9) Kansas City Market C + R 720.7 719.3 719.9 714.1 710.4 759.2 634.1 611.2 (3.6)
Illinois C 1,984.0 1,569.4 1,429.3 1,374.4 1,476.9 1,638.6 1,382.2 1,316.2 (4.8) Chicagoland Market C 2,601.6 2,251.7 2,092.3 2,057.1 2,110.2 2,088.6 1,875.5 1,776.6 (5.3)
Iowa C + R 1,363.1 1,419.5 1,382.7 1,356.8 1,391.3 1,466.7 1,231.6 1,190.3 (3.4) Michigan C 1,335.0 1,359.5 1,339.5 1,377.9 1,425.2 1,411.2 1,180.1 1,130.4 (4.2) South Dakota C 98.2 102.3 105.7 106.2 100.2 104.8 81.4 78.7 (3.3) Ohio C + R 0.0 0.0 0.0 0.0 0.0 433.1 350.8 877.9 150.3
Cincinnati excluding Horseshoe C 791.9 731.7 691.2 676.2 675.7 626.0 530.5 396.8 (25.2) Cincinnati total C + R 791.9 731.7 691.2 676.2 675.7 626.0 530.5 549.6 3.6
Oklahoma R 78.7 92.5 94.1 99.8 106.2 113.1 94.2 94.8 0.6 Kansas C + R — — 2.0 37.8 48.5 341.1 283.2 279.4 (1.3) Subtotal Midwest C + R 9,076.3 8,893.0 8,882.5 8,934.8 9,074.2 9,872.3 8,267.5 8,357.3 1.1 Subtotal Midwest � Same-Store C + R 9,076.3 8,893.0 8,882.5 8,934.8 9,074.2 9,427.7 7,916.1 7,426.3 (6.2) Northeast Gaming Markets
New Jersey C 4,920.8 4,545.2 3,943.2 3,565.0 3,317.4 3,051.2 2,651.1 2,430.6 (8.3) NJ excluding Revel C 4,920.8 4,545.2 3,943.2 3,565.0 3,317.4 2,928.9 2,544.9 2,303.0 (9.5)
Pennsylvania C + R 1,039.0 1,615.6 1,964.6 2,486.4 3,024.7 3,157.6 2,653.8 2,623.1 (1.2) PA excluding Nemacolin C + R 1,039.0 1,615.6 1,964.6 2,486.4 3,024.7 3,157.6 2,653.8 2,613.4 (1.5)
West Virginia R 929.2 947.8 895.3 872.2 953.7 943.2 820.2 703.9 (14.2) New York R 821.6 944.5 1,009.9 1,085.4 1,257.8 1,802.2 1,516.4 1,630.2 7.5 Delaware R 612.4 588.9 564.2 571.4 547.3 519.6 444.4 366.9 (17.4) Rhode Island C 448.0 475.0 461.2 476.5 512.8 528.0 447.0 464.9 4.0
RI excluding table games C 448.0 475.0 461.2 476.5 512.8 528.0 447.0 437.8 (2.1) Maine C + R 42.8 50.5 59.2 61.7 59.5 86.6 80.6 107.7 33.6
ME excluding Oxford
42.8 50.5 59.2 61.7 59.5 56.5 54.1 46.7 (13.5) Maryland C — — — 27.6 155.7 377.8 289.5 574.6 98.5
MD excluding Maryland Live! & Rocky Gap C 0.0 0.0 0.0 27.6 155.7 148.5 130.5 100.5 (23.0) Subtotal Northeast C + R 8,813.9 9,167.6 8,897.6 9,146.2 9,828.9 10,466.1 8,902.9 8,901.8 (0.0) Subtotal Northeast � Same-Store C + R 8,813.9 9,167.6 8,897.6 9,146.2 9,828.9 10,084.4 8,611.2 8,202.4 (4.7) Southern Gaming Markets
Arkansas R 27.3 33.4 38.5 60.9 122.1 181.0 150.2 181.5 20.8 Mississippi C 2,891.5 2,721.7 2,464.7 2,389.8 2,258.2 2,251.0 1,900.8 1,815.2 (4.5) Louisiana C + R 2,566.3 2,583.8 2,455.5 2,373.9 2,373.0 2,454.1 1,999.3 2,042.3 2.2
Bossier City/Shreveport
844.1 847.5 779.7 760.6 733.4 713.3 596.9 613.4 2.8 Bossier City/Shreveport ex Margaritaville
844.1 847.5 779.7 760.6 733.4 713.3 596.9 562.5 (5.8)
Lake Charles
640.6 651.2 665.2 638.4 671.3 687.0 578.0 562.9 (2.6) LA excluding L'Auberge BR & Margaritaville
2,566.3 2,583.8 2,455.5 2,373.9 2,373.0 2,204.0 1,876.3 1,640.9 (12.5)
Florida R 202.4 228.9 216.7 329.2 381.7 428.6 357.0 387.3 8.5 FL excluding Hialeah Park
202.4 228.9 216.7 329.2 381.7 428.6 357.0 374.9 5.0
Subtotal Southern
5,687.5 5,567.8 5,175.5 5,153.8 5,135.0 5,314.7 4,407.3 4,426.2 0.4 Subtotal Southern � Same-Store
5,687.5 5,567.8 5,175.5 5,153.8 5,135.0 5,267.7 4,382.9 4,239.6 (3.3)
Native American Gaming Markets Portland (fka Region I)a N.A. 2,208.2 2,376.0 2,520.9 2,655.1 2,763.6 2,874.2 � � —
Sacramento (fka Region II)b N.A. 7,796.5 7,363.4 6,969.9 6,794.0 6,902.8 6,958.1 � � — Phoenix (fka Region III)c N.A. 2,840.6 2,773.7 2,599.9 2,538.6 2,614.4 2,716.3 � � — St. Paul (fka Region IV)d N.A. 4,218.0 4,402.3 4,384.4 4,451.5 4,565.0 4,797.8 � � —
Tulsa (Eastern part of fka Region V) N.A. 1,438.2 1,699.9 1,715.9 1,769.5 1,889.7 2,014.4 � � — OK City (Western part of fka Region V) N.A. 1,146.0 1,347.2 1,509.2 1,582.6 1,702.4 1,801.1 � � —
Total (fka Region V)e N.A. 2,584.2 3,047.1 3,225.1 3,352.1 3,592.1 3,815.6 � � — Region VI � South and Northeastf N.A. 6,399.8 6,776.1 6,782.7 6,711.1 6,715.8 6,742.7 � � — Subtotal Native American N.A. 26,047.3 26,738.6 26,482.9 26,502.5 27,153.8 27,904.7 — — —
Connecticut (Slot Win) N.A. 1,684.5 1,570.9 1,448.3 1,392.9 1,344.7 1,229.6 1,042.4 968.3 (7.1) New Mexico (Slot Win) N.A. 700.3 709.5 697.9 699.4 714.0 756.5 384.5 386.7 0.6
Total Gaming Revenues Total Commercial + Racetrack � 37,481.6 36,198.2 34,322.2 34,685.3 35,748.2 37,535.9 31,572.2 31,761.8 0.6
Growth (%) � 6.0 (3.4) (5.2) 1.1 3.1 5.0 — — — Total Commercial + Racetrack � Same-Store � — — — 34,685.3 35,748.2 36,662.6 30,904.6 29,944.6 (3.1) Growth (%)
3.1 2.6
Total Native American � 26,047.3 26,738.6 26,482.9 26,502.5 27,153.8 27,904.7 — — — Growth (%) � 3.9 2.7 (1.0) 0.1 2.5 2.8 — — — Total Gaming � 63,528.9 62,936.8 60,805.1 61,187.8 62,902.0 65,440.6 — — — Growth (%) � 5.1 (0.9) (3.4) 0.6 2.8 4.0 — — — aRegion I includes Alaska, Idaho, Oregon, and Washington. bRegion II includes California and northern Nevada. cRegion III includes Arizona, Colorado, New Mexico, and southern Nevada. dRegion IV includes Iowa, Michigan, Minnesota, Montana, North Dakota, Nebraska, South Dakota, Wisconsin, and Wyoming. eRegion V includes Kansas, Oklahoma, and Texas. fRegion VI includes Alabama, Connecticut, Florida, Louisiana, Mississippi, North Carolina, and New York. N.A. � Not available. Source: National Indian Gaming Commission, various state gaming agencies, and Fitch Ratings.

Corporates
2014 Outlook: U.S. Gaming 17 December 16, 2013
Capital Allocation Summaries for Select Gaming Issuers
U.S. Regionals Isle of Capri Dividends Share Repurchases Growth/Development Other Not applicable. Not applicable. Will manage The Provence project in
Philadelphia if project wins the last gaming license for the city. ISLE committed a $25 million letter of credit to Tower Investments, the project sponsor, that will be used to pay the license fee if the project wins the license. ISLE will then have a choice to either be repaid or roll the $25 million into equity.
�
Notable Credit Facility Covenant
2007 Credit Facility Financial Covenants (including amendments): x Financial Covenants: Total Leverage 7.25x; steps down to 7.00x in May 2014 (covenants relaxed July 2013); Interest Coverage 1.9x x Restricted Payment Basket: $150mm basket; additional $50 million if leverage is less than 5x; no restrictions if leverage is less than 4x. x Cash Flow Sweep: None x Additional Debt: No restrictions on unsecured debt as long as in compliance with financial covenants plus a $50 million general carveout.
Management Comments
Sept. 4, 2013 Earnings Call: "I think we continue to look to be opportunistic with it when we make sense. Until the right opportunities come along, we're focusing on de-leveraging the company. But if we have the right opportunity come up, obviously, we want to try to be as flexible and look at things that makes sense for us. But the focus is on reducing leverage unless the right opportunity comes on board." June 6, 2013 Earnings Call "I don't think that [stock buyback is] something that we would probably entertain until we got closer to 5 times leverage."
Fitch Comments Lack of growth capex opportunities and company's emphasis on deleveraging combined with healthy FCF profile should allow the company to reduce leverage. However, reducing debt meaningfully may take time as the operating headwinds may adversely affect FCFs.
Pinnacle Dividends Share Repurchases Growth/Development Other Not applicable. In July 2012, authorized $100 million
share repurchase program. Repurchased $51 million of stock before suspending the program around the time of announcing the ASCA acquisition.
Acquired ASCA for $2.8 billion. The acquisition was all debt funded increasing PNK's leverage from around 5x to 7x (closer to 6x after asset sales and other adjustments). Growth capex is limited to $209 million River Downs in Cincinnati, OH, which is expected to open May 2014.
�
Notable Credit Facility Covenant
Aug. 2013 Credit Facility Financial Covenants: x Financial Covenants: Total Leverage 8.5x Threshold, Secured Leverage 5.0x Threshold, Interest Coverage 1.75x Threshold. x Restricted Payment Basket: $100 million carveout (secured leverage must be less than 2.75x). x Cash Flow Sweep: 50%. x Additional Debt: May issue unsecured debt as long as leverage remains 0.25 less than the financial covenant threshold. Total debt issued under this
provision is limited to $3.5 billion unless leverage is less than 6x. There is also $125 million general carveout. x In addition to the credit agreement, 7.5% notes due 2021 have restricted payment and debt incurrence covenants.
Management Comments
Nov. 6, 2013 Earnings Call: "..we certainly have been consistent about our goal to get in the 3.5 times to 4 times leverage over the, call it medium term. Certainly, we have started chipping away at that with cash flows from our existing operations. There will be obviously a meaningful paydown when the two divestures close."
Fitch Comments Fitch expects PNK's leverage to decline to mid-5x range by the end of 2015. Boyd Gaming Dividends Share Repurchases Growth/Development Other Not applicable. Not applicable. No major growth initiatives. � Notable Credit Facility Covenant
August 2013 Credit Facility Financial Covenants: x Financial Covenants: Total Leverage 8.0x Threshold, Secured Leverage 3.5x Threshold, Interest Coverage 2.0x Threshold. x Restricted Payment Basket: $100 million carveout if leverage is 5x-6x; unlimited if leverage is less than 5x. x Cash Flow Sweep: 50%. x Additional Debt: May issue unsecured debt as long as compliant with financial covenants.
Management Comments
Oct. 31, 2013 Earnings Call: "..we will continue our focus on strengthening our balance sheet, using free cash flow to reduce debt further."
Fitch Comments Repaid more than $500 million of debt in 2013 using proceeds from sale of non-core assets, FCF and equity issuance.
Continued on next page. Source: Fitch Ratings, Public Filings, FactSet.

Corporates
2014 Outlook: U.S. Gaming 18 December 16, 2013
Capital Allocation Summaries for Select Gaming Issuers (Continued)
Large Cap International Las Vegas Sands Dividends Share Repurchases Growth/Development Other
x In late 2012, LVS increased its regular dividends for 2013 by 40% and declared a $2.3 billion special dividend out of the U.S. parent. LVS drew on its U.S. and Singapore revolvers to partially fund the special dividend.
x In Oct. 2013, LVS announced an increase in dividends to $2 per share for 2014, which is a 43% increase relative to 2013 and would amount to approximately $1.64 billion per year.
In Jun. 2013, LVS announced a $2 billion share repurchase program and has been buying shares at a rate of roughly $75 million per month ($900 million per year).
x The $2.7 billion Parisian is expected to open late 2015.
x Considering development in Spain that could cost up to $36 billion. The project is subject to government approval and finalization of a grants and incentives package.
x Would bid on a license(s) in Japan if casinos resorts bill is passed (possibly 2014).
Notable Credit Facility Covenant
x No major restrictions at the U.S. corporate level or at the U.S. restricted group since the U.S. group counts international dividends in covenant calculations. x In Macau, the credit facility does not limit restricted payments or additional debt if leverage is less than 3.5x (subject to carveouts if above that). Macau
maximum permitted leverage declines to 3x by 2016. x In Singapore, restricted payments are unlimited if leverage is less than 3.5x and are limited to S$500 million per year if leverage is 3.5x-4.0x.
Management Comments
Oct. 17, 2013 Earnings Call (Adelson): "The scale of our business and the strength, reliability and predictability of our cash flows allow us to return capital to shareholders while maintaining balance sheet strength..." Sep. 23, 2013 G2E Investment Forum (Leven): "..there is a dividend bias in the company to continue to increase the yield on our stock, the stock has gone up, so that means we have to increase our dividends to keep the yield at where it should be....As far as specials, we did a special last year because we had a lot of excess cash. The specials are generally unlikely. We need to save some of the cash for development opportunities that are coming up.... And so I think you can look forward to a dividend bias and a stock buyback bias before a special dividend bias over time."
Fitch Comments Company has not publicly stated a target leverage range since the departure of Ken Kay (CFO) in July 2013. Fitch believes that the company is motivated to maintain a healthy balance sheet as a competitive advantage when competing for large scale gaming licenses/concessions.
MGM Resorts Dividends Share Repurchases Growth/Development Other Not applicable. Not applicable. x Sole applicant for the western
Massachusetts region. Project is budgeted at $800 million and the state's gaming commission expects to grant licenses by April 2014.
x One of three applicants for Prince George's County license in Maryland. Project is budgeted at $925 million and the state may award the license in by the year-end 2013.
x Developing a $2.6 billion casino resort on Cotai. Expected to open early-to-mid 2016.
�
Notable Credit Facility Covenant
Dec. 2012 US Credit Facility Financial Covenants: x Financial Covenants: Minimum EBITDA of $1.1B (increasing to $1.2B for period ending 9/30/14). x Restricted Payment Basket: $100 million plus 50% of cumulative net income (excludes MGM China income). x Cash Flow Sweep: No. x Additional Debt: No restriction is leverage is less than 6x; otherwise may issue up to $1 billion of debt (subject to certain restrictions).
Management Comments
Oct. 31, 2013 Earnings Call: "We are planting seeds to grow this company further as we have consistently and determinedly reduced our leverage, improved our balance sheet, and we're happy with our progress thus far...We remain focused on executing on strategies we've laid out to you, both in terms of our operational strategies to drive margins and our capital strategies to improve our properties, increase our market share, and doing so with the lens of always looking towards improving our balance sheet, continue to get stronger financially."
Fitch Comments Heavy growth capex in Macau and U.S. will preclude or slow deleveraging in the near-term but prospects for reducing debt in the more medium term remain good.
Wynn Resorts Dividends Share Repurchases Growth/Development Other Paid a $750 million special dividend in
2012 and $300 million in 2013. The 2012 special dividends was funded largely by debt issued at the U.S. subsidiary. The 2013 special dividend followed a $600 million bond issuance in Macau. Increased regular dividends to $1 per quarter for 2013 and then increased regular dividends by 25% for 2014 ($505 million per year).
In February 2012 redeemed 24.5 million shares held by Kazuo Okada's Aruze USA, Inc. in exchange for $1.9 billion 2% promissory note maturing 2022. Although prompted by governance issues, the transactions effectively represents a discounted repurchase of 20% of the company's outstand stock.
One of two remaining applicants for the eastern Massachusetts region. Project will cost $1.2 billion and the state's gaming commission expects to grant licenses by April 2014. Developing $4.0 billion casino resort on Cotai with an anticipated opening in early 2016. Per Sept. 2013 investor presentation $1.5 billion will be funded out of cash flow.
�
Notable Credit Facility Covenant
x No dividend restrictions at the parent level. x In Macau (70% owned by Wynn Resorts) credit facility does not limit dividends as long as the subsidiary is compliant with the net leverage maintenance
covenant. This starts at 3.75x, steps-up to 5.00x by 2016 and then starts to step-down in 2017 following the Cotai project opening. x At the U.S. operating subsidiary restricted payments are based on a basket per the first mortgage note covenants. The basket builds at 50% net income
(EBITDA minus 1.4x fixed charges in the newer indenture). A 2x fixed charge test governs ability to issue additional debt or pay dividends. Management Comments
Oct. 2013 Earnings Call: "The basis of that growth has been some fundamental ideas about who we are, as a company, the kind of services and the people we employ, and the kind of facilities we built, and we've tempered those simple truths with a fundamental understanding that our balance sheet was a critical part of our ability to grow, maintain service levels, and take care of our employees." "..we take Wynn Las Vegas as a company that's under-leveraged with $3 billion of equity in it...and build Boston and Philadelphia as part of Wynn Las Vegas.."
Fitch Comments Gross leverage is approaching 5x giving Wynn limited flexibility relative to maintaining 'BB' IDR.
Continued on next page. Source: Fitch Ratings, Public Filings, FactSet.
Corporates
2014 Outlook: U.S. Gaming 19 December 16, 2013
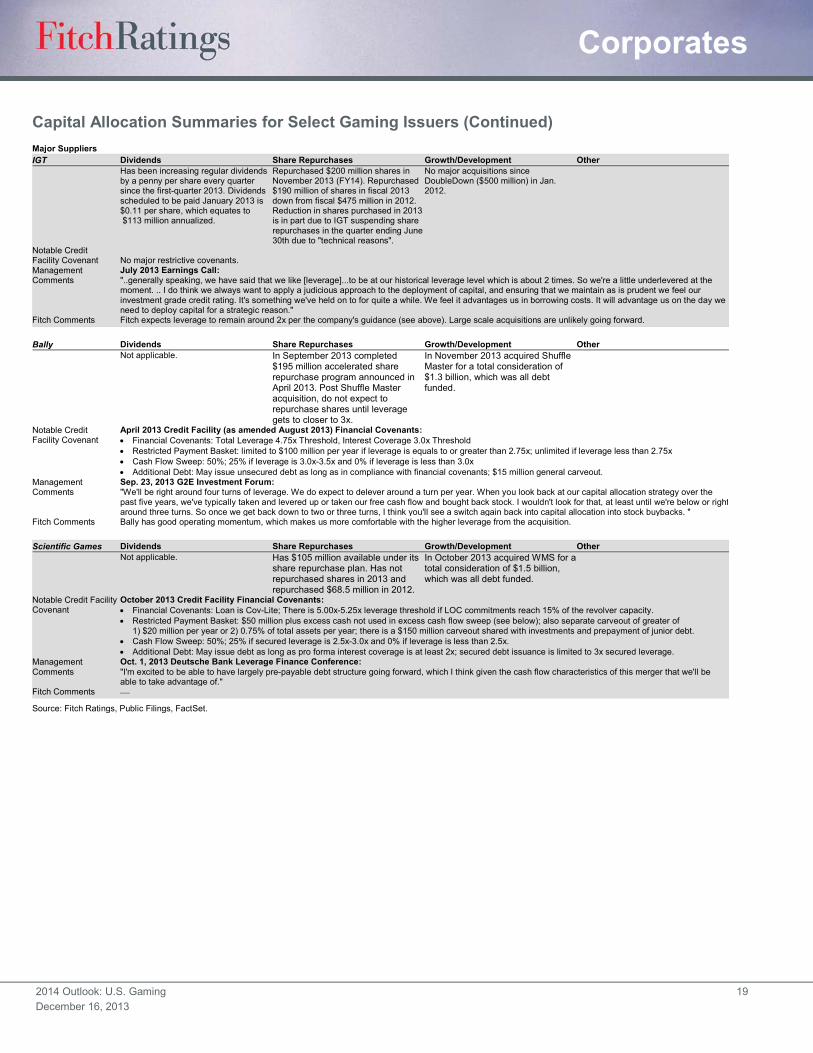
Capital Allocation Summaries for Select Gaming Issuers (Continued) Major Suppliers IGT Dividends Share Repurchases Growth/Development Other Has been increasing regular dividends
by a penny per share every quarter since the first-quarter 2013. Dividends scheduled to be paid January 2013 is $0.11 per share, which equates to $113 million annualized.
Repurchased $200 million shares in November 2013 (FY14). Repurchased $190 million of shares in fiscal 2013 down from fiscal $475 million in 2012. Reduction in shares purchased in 2013 is in part due to IGT suspending share repurchases in the quarter ending June 30th due to "technical reasons".
No major acquisitions since DoubleDown ($500 million) in Jan. 2012.
Notable Credit Facility Covenant No major restrictive covenants. Management Comments
July 2013 Earnings Call: "..generally speaking, we have said that we like [leverage]...to be at our historical leverage level which is about 2 times. So we're a little underlevered at the moment. .. I do think we always want to apply a judicious approach to the deployment of capital, and ensuring that we maintain as is prudent we feel our investment grade credit rating. It's something we've held on to for quite a while. We feel it advantages us in borrowing costs. It will advantage us on the day we need to deploy capital for a strategic reason."
Fitch Comments Fitch expects leverage to remain around 2x per the company's guidance (see above). Large scale acquisitions are unlikely going forward. Bally Dividends Share Repurchases Growth/Development Other Not applicable. In September 2013 completed
$195 million accelerated share repurchase program announced in April 2013. Post Shuffle Master acquisition, do not expect to repurchase shares until leverage gets to closer to 3x.
In November 2013 acquired Shuffle Master for a total consideration of $1.3 billion, which was all debt funded.
Notable Credit Facility Covenant
April 2013 Credit Facility (as amended August 2013) Financial Covenants: x Financial Covenants: Total Leverage 4.75x Threshold, Interest Coverage 3.0x Threshold x Restricted Payment Basket: limited to $100 million per year if leverage is equals to or greater than 2.75x; unlimited if leverage less than 2.75x x Cash Flow Sweep: 50%; 25% if leverage is 3.0x-3.5x and 0% if leverage is less than 3.0x x Additional Debt: May issue unsecured debt as long as in compliance with financial covenants; $15 million general carveout.
Management Comments
Sep. 23, 2013 G2E Investment Forum: "We'll be right around four turns of leverage. We do expect to delever around a turn per year. When you look back at our capital allocation strategy over the past five years, we've typically taken and levered up or taken our free cash flow and bought back stock. I wouldn't look for that, at least until we're below or right around three turns. So once we get back down to two or three turns, I think you'll see a switch again back into capital allocation into stock buybacks. "
Fitch Comments Bally has good operating momentum, which makes us more comfortable with the higher leverage from the acquisition. Scientific Games Dividends Share Repurchases Growth/Development Other Not applicable. Has $105 million available under its
share repurchase plan. Has not repurchased shares in 2013 and repurchased $68.5 million in 2012.
In October 2013 acquired WMS for a total consideration of $1.5 billion, which was all debt funded.
Notable Credit Facility Covenant
October 2013 Credit Facility Financial Covenants: x Financial Covenants: Loan is Cov-Lite; There is 5.00x-5.25x leverage threshold if LOC commitments reach 15% of the revolver capacity. x Restricted Payment Basket: $50 million plus excess cash not used in excess cash flow sweep (see below); also separate carveout of greater of
1) $20 million per year or 2) 0.75% of total assets per year; there is a $150 million carveout shared with investments and prepayment of junior debt. x Cash Flow Sweep: 50%; 25% if secured leverage is 2.5x-3.0x and 0% if leverage is less than 2.5x. x Additional Debt: May issue debt as long as pro forma interest coverage is at least 2x; secured debt issuance is limited to 3x secured leverage.
Management Comments
Oct. 1, 2013 Deutsche Bank Leverage Finance Conference: "I'm excited to be able to have largely pre-payable debt structure going forward, which I think given the cash flow characteristics of this merger that we'll be able to take advantage of."
Fitch Comments �
Source: Fitch Ratings, Public Filings, FactSet.
Corporates
2014 Outlook: U.S. Gaming 20 December 16, 2013
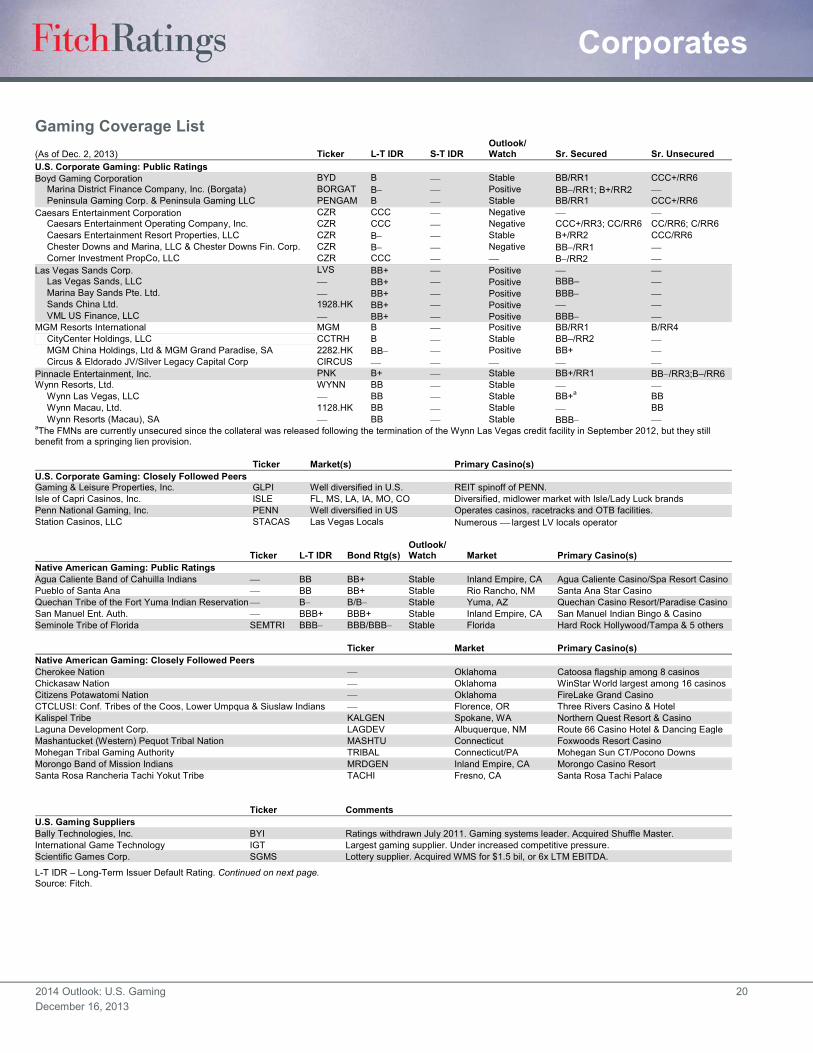
Gaming Coverage List (As of Dec. 2, 2013) Ticker L-T IDR S-T IDR
Outlook/ Watch Sr. Secured Sr. Unsecured
U.S. Corporate Gaming: Public Ratings Boyd Gaming Corporation BYD B � Stable BB/RR1 CCC+/RR6
Marina District Finance Company, Inc. (Borgata) BORGAT B� � Positive BB�/RR1; B+/RR2 � Peninsula Gaming Corp. & Peninsula Gaming LLC PENGAM B � Stable BB/RR1 CCC+/RR6
Caesars Entertainment Corporation CZR CCC � Negative � � Caesars Entertainment Operating Company, Inc. CZR CCC � Negative CCC+/RR3; CC/RR6 CC/RR6; C/RR6 Caesars Entertainment Resort Properties, LLC CZR B� � Stable B+/RR2 CCC/RR6 Chester Downs and Marina, LLC & Chester Downs Fin. Corp. CZR B� � Negative BB�/RR1 � Corner Investment PropCo, LLC CZR CCC � � B�/RR2 �
Las Vegas Sands Corp. LVS BB+ � Positive � � Las Vegas Sands, LLC � BB+ � Positive BBB– � Marina Bay Sands Pte. Ltd. � BB+ � Positive BBB� � Sands China Ltd. 1928.HK BB+ � Positive � � VML US Finance, LLC � BB+ � Positive BBB� �
MGM Resorts International MGM B � Positive BB/RR1 B/RR4 CityCenter Holdings, LLC CCTRH B � Stable BB–/RR2 � MGM China Holdings, Ltd & MGM Grand Paradise, SA 2282.HK BB� � Positive BB+ � Circus & Eldorado JV/Silver Legacy Capital Corp CIRCUS � � � � �
Pinnacle Entertainment, Inc. PNK B+ � Stable BB+/RR1 BB�/RR3;B–/RR6 Wynn Resorts, Ltd. WYNN BB � Stable � �
Wynn Las Vegas, LLC � BB � Stable BB+a BB Wynn Macau, Ltd. 1128.HK BB � Stable � BB Wynn Resorts (Macau), SA � BB � Stable BBB� �
aThe FMNs are currently unsecured since the collateral was released following the termination of the Wynn Las Vegas credit facility in September 2012, but they still benefit from a springing lien provision.
Ticker Market(s) Primary Casino(s) U.S. Corporate Gaming: Closely Followed Peers Gaming & Leisure Properties, Inc. GLPI Well diversified in U.S. REIT spinoff of PENN. Isle of Capri Casinos, Inc. ISLE FL, MS, LA, IA, MO, CO Diversified, midlower market with Isle/Lady Luck brands Penn National Gaming, Inc. PENN Well diversified in US Operates casinos, racetracks and OTB facilities. Station Casinos, LLC STACAS Las Vegas Locals Numerous � largest LV locals operator
Ticker L-T IDR Bond Rtg(s)
Outlook/ Watch Market Primary Casino(s)
Native American Gaming: Public Ratings Agua Caliente Band of Cahuilla Indians � BB BB+ Stable Inland Empire, CA Agua Caliente Casino/Spa Resort Casino Pueblo of Santa Ana � BB BB+ Stable Rio Rancho, NM Santa Ana Star Casino Quechan Tribe of the Fort Yuma Indian Reservation � B� B/B� Stable Yuma, AZ Quechan Casino Resort/Paradise Casino San Manuel Ent. Auth. � BBB+ BBB+ Stable Inland Empire, CA San Manuel Indian Bingo & Casino Seminole Tribe of Florida SEMTRI BBB� BBB/BBB� Stable Florida Hard Rock Hollywood/Tampa & 5 others
Ticker Market Primary Casino(s) Native American Gaming: Closely Followed Peers Cherokee Nation � Oklahoma Catoosa flagship among 8 casinos Chickasaw Nation � Oklahoma WinStar World largest among 16 casinos Citizens Potawatomi Nation � Oklahoma FireLake Grand Casino CTCLUSI: Conf. Tribes of the Coos, Lower Umpqua & Siuslaw Indians � Florence, OR Three Rivers Casino & Hotel Kalispel Tribe KALGEN Spokane, WA Northern Quest Resort & Casino Laguna Development Corp. LAGDEV Albuquerque, NM Route 66 Casino Hotel & Dancing Eagle Mashantucket (Western) Pequot Tribal Nation MASHTU Connecticut Foxwoods Resort Casino Mohegan Tribal Gaming Authority TRIBAL Connecticut/PA Mohegan Sun CT/Pocono Downs Morongo Band of Mission Indians MRDGEN Inland Empire, CA Morongo Casino Resort Santa Rosa Rancheria Tachi Yokut Tribe TACHI Fresno, CA Santa Rosa Tachi Palace
Ticker Comments
U.S. Gaming Suppliers Bally Technologies, Inc. BYI Ratings withdrawn July 2011. Gaming systems leader. Acquired Shuffle Master.
International Game Technology IGT Largest gaming supplier. Under increased competitive pressure. Scientific Games Corp. SGMS Lottery supplier. Acquired WMS for $1.5 bil, or 6x LTM EBITDA.
L-T IDR – Long-Term Issuer Default Rating. Continued on next page. Source: Fitch.

Corporates
2014 Outlook: U.S. Gaming 21 December 16, 2013
Gaming Coverage List (Continued) (As of Dec. 2, 2013)
Country Ticker LT IDR ST IDR
Outlook/ Watch Sr. Secured Sr. Unsecured
Non-U.S. Gaming Public Ratings Crown Limited Australia CWN.AU BBB � Stable � BBB Gala Coral Group Ltd United Kingdom � B � Stable � �
Gala Group Finance plc United Kingdom � � � � BB�/RR2 � Gala Electric Casinos plc United Kingdom � � � � CCC+/RR6 �
Genting Berhad Malaysia GENT.MK A� � Stable � A� Genting Singapore PLC Singapore GENS.SP A� � Stable � � Genting Hong Kong Ltd. Hong Kong 678.HK � � � � � Genting Malaysia Bhd Malaysia GENM.MK � � � � �
Intralot SA Greece INLOT.GA B+ � Stable � � Intralot Finance Luxembourg SA Luxembourg � � � � � BB�/RR3
Ladbrokes plc United Kingdom LAD.LN BB+ B Negative � BB+
Non-U.S.: Closely Followed Peers/Other Notable Credits
Country Ticker Comments
Aristocrat Australia ALL.AU One of four major gaming suppliers to the U.S. market. Echo Entertainment Australia EGP.AU Properties in Queensland/New South Wales. Genting HK owns 7%. Galaxy Entertainment Macau 27.HK Galaxy Macau, StarWorld, and City Clubs. Lui family. GTECH SpA/Lottomatica Italy GTK.IM One of 3 major global lottery providers as well as a gaming supplier. Melco Crown Macau 6883.HK/MPEL City of Dreams, Altira Macau, Studio City. JV between Crown Ltd and Melco Intl. SJM Holdings Ltd. Macau 880.HK Largest Macau concessionairre in terms of revenue and number of casinos. Skycity Ent. Group Ltd. New Zealand SKC.NZ/SKC.AU Operates casinos in New Zealand and Australia.
L-T IDR – Long-Term Issuer Default Rating. Source: Fitch.
Corporates
2014 Outlook: U.S. Gaming 22 December 16, 2013
ALL FITCH CREDIT RATINGS ARE SUBJECT TO CERTAIN LIMITATIONS AND DISCLAIMERS. PLEASE READ THESE LIMITATIONS AND DISCLAIMERS BY FOLLOWING THIS LINK: HTTP://FITCHRATINGS.COM/UNDERSTANDINGCREDITRATINGS. IN ADDITION, RATING DEFINITIONS AND THE TERMS OF USE OF SUCH RATINGS ARE AVAILABLE ON THE AGENCY'S PUBLIC WEB SITE AT WWW.FITCHRATINGS.COM. PUBLISHED RATINGS, CRITERIA, AND METHODOLOGIES ARE AVAILABLE FROM THIS SITE AT ALL TIMES. FITCH'S CODE OF CONDUCT, CONFIDENTIALITY, CONFLICTS OF INTEREST, AFFILIATE FIREWALL, COMPLIANCE, AND OTHER RELEVANT POLICIES AND PROCEDURES ARE ALSO AVAILABLE FROM THE CODE OF CONDUCT SECTION OF THIS SITE. FITCH MAY HAVE PROVIDED ANOTHER PERMISSIBLE SERVICE TO THE RATED ENTITY OR ITS RELATED THIRD PARTIES. DETAILS OF THIS SERVICE FOR RATINGS FOR WHICH THE LEAD ANALYST IS BASED IN AN EU-REGISTERED ENTITY CAN BE FOUND ON THE ENTITY SUMMARY PAGE FOR THIS ISSUER ON THE FITCH WEBSITE. Copyright © 2013 by Fitch Ratings, Inc., Fitch Ratings Ltd. and its subsidiaries. One State Street Plaza, NY, NY 10004.Telephone: 1-800-753-4824, (212) 908-0500. Fax: (212) 480-4435. Reproduction or retransmission in whole or in part is prohibited except by permission. All rights reserved. In issuing and maintaining its ratings, Fitch relies on factual information it receives from issuers and underwriters and from other sources Fitch believes to be credible. Fitch conducts a reasonable investigation of the factual information relied upon by it in accordance with its ratings methodology, and obtains reasonable verification of that information from independent sources, to the extent such sources are available for a given security or in a given jurisdiction. The manner of Fitch’s factual investigation and the scope of the third-party verification it obtains will vary depending on the nature of the rated security and its issuer, the requirements and practices in the jurisdiction in which the rated security is offered and sold and/or the issuer is located, the availability and nature of relevant public information, access to the management of the issuer and its advisers, the availability of pre-existing third-party verifications such as audit reports, agreed-upon procedures letters, appraisals, actuarial reports, engineering reports, legal opinions and other reports provided by third parties, the availability of independent and competent third-party verification sources with respect to the particular security or in the particular jurisdiction of the issuer, and a variety of other factors. Users of Fitch’s ratings should understand that neither an enhanced factual investigation nor any third-party verification can ensure that all of the information Fitch relies on in connection with a rating will be accurate and complete. Ultimately, the issuer and its advisers are responsible for the accuracy of the information they provide to Fitch and to the market in offering documents and other reports. In issuing its ratings Fitch must rely on the work of experts, including independent auditors with respect to financial statements and attorneys with respect to legal and tax matters. Further, ratings are inherently forward-looking and embody assumptions and predictions about future events that by their nature cannot be verified as facts. As a result, despite any verification of current facts, ratings can be affected by future events or conditions that were not anticipated at the time a rating was issued or affirmed. The information in this report is provided “as is” without any representation or warranty of any kind. A Fitch rating is an opinion as to the creditworthiness of a security. This opinion is based on established criteria and methodologies that Fitch is continuously evaluating and updating. Therefore, ratings are the collective work product of Fitch and no individual, or group of individuals, is solely responsible for a rating. The rating does not address the risk of loss due to risks other than credit risk, unless such risk is specifically mentioned. Fitch is not engaged in the offer or sale of any security. All Fitch reports have shared authorship. Individuals identified in a Fitch report were involved in, but are not solely responsible for, the opinions stated therein. The individuals are named for contact purposes only. A report providing a Fitch rating is neither a prospectus nor a substitute for the information assembled, verified and presented to investors by the issuer and its agents in connection with the sale of the securities. Ratings may be changed or withdrawn at anytime for any reason in the sole discretion of Fitch. Fitch does not provide investment advice of any sort. Ratings are not a recommendation to buy, sell, or hold any security. Ratings do not comment on the adequacy of market price, the suitability of any security for a particular investor, or the tax-exempt nature or taxability of payments made in respect to any security. Fitch receives fees from issuers, insurers, guarantors, other obligors, and underwriters for rating securities. Such fees generally vary from US$1,000 to US$750,000 (or the applicable currency equivalent) per issue. In certain cases, Fitch will rate all or a number of issues issued by a particular issuer, or insured or guaranteed by a particular insurer or guarantor, for a single annual fee. Such fees are expected to vary from US$10,000 to US$1,500,000 (or the applicable currency equivalent). The assignment, publication, or dissemination of a rating by Fitch shall not constitute a consent by Fitch to use its name as an expert in connection with any registration statement filed under the United States securities laws, the Financial Services and Markets Act of 2000 of the United Kingdom, or the securities laws of any particular jurisdiction. Due to the relative efficiency of electronic publishing and distribution, Fitch research may be available to electronic subscribers up to three days earlier than to print subscribers.