gambling behavior among high school students in the … · gambling behavior among high school...
TRANSCRIPT

Gambling Behavior among High School Students in the State of Connecticut
A Report Delivered to CT Department of Mental Health and Addiction Services
and CT Department of Education
May 15, 2007

Team Members
Yale University School of Medicine, Department of Psychiatry Rani A. Desai Marc Potenza
Suchitra Krishnan-Sarin Dana Cavallo
Department of Mental Health and Addiction Services
Christopher Armentano Carol Meredith
CT Council on Problem Gambling
Marvin Steinberg
We would also like to acknowledge the following people for their contribution to this study: Laura Kozma, Evie Thigpen, Brandi Fuhr, Michael Bernabeo, Thomas Lissm, Amanda McFetridge, Tricia Dahl, Anne Smith, and Ty Schepis. We would also like to acknowledge the participation of the schools who agreed to administer this survey, and thank the students who shared their life experiences with us.
2

List of Tables
1. Distributions of age, gender, race, ethnicity, income and grade for the total sample
2. Distributions of age, gender, race, ethnicity, income and grade by DMHAS region
3. Distributions of age, gender, race, ethnicity, income and grade by DRG 4. Frequencies of any gambling and each type of gambling, total sample 5. Frequencies of any gambling and each type of gambling by region 6. Frequencies of any gambling and each type of gambling by DRG 7. Median frequency of engaging in each type of gambling, total number of
types endorsed and maximum gambling frequency, total sample 8. Median frequency of engaging in each type of gambling, total number of
types endorsed and maximum gambling frequency by DRG 9. Median frequency of engaging in each type of gambling, total number of
types endorsed and maximum gambling frequency by region 10. Gambling behaviors, reasons and age of onset, total sample 11. Gambling behaviors, reasons and age of onset by region 12. Gambling behaviors, reasons and age of onset by DRG 13. MAGS item frequencies, MAGS score, and problem/pathological gambling
(PPG), total sample 14. MAGS item frequencies, MAGS score, and problem/pathological gambling
(PPG) by region 15. MAGS item frequencies, MAGS score, and problem/pathological gambling
(PPG) by DRG 16. Adult gambling behavior and attitudes, total sample 17. Adult gambling behavior and attitudes by region 18. Adult gambling behavior and attitudes by DRG 19. Prevention attitudes and total number of prevention activities endorsed,
total sample 20. Prevention attitudes and total number of prevention activities endorsed by
region 21. Prevention attitudes and total number of prevention activities endorsed by
DRG 22. Internet and family gambling and peer pressure, total sample 23. Internet and family gambling and peer pressure by region 24. Internet and family gambling and peer pressure by DRG 25. Types of gambling among those with any gambling, total sample 26. Types of gambling among those with any gambling by region 27. Types of gambling among those with any gambling by DRG 28. Adult gambling behavior and attitudes among those with any gambling,
total sample 29. Adult gambling behavior and attitudes among those with any gambling by
region 30. Adult gambling behavior and attitudes among those with any gambling by
DRG
3

31. Prevention attitudes among those with any gambling, total sample 32. Prevention attitudes among those with any gambling by grade 33. Prevention attitudes among those with any gambling by race 34. Prevention attitudes among those with any gambling by gender 35. Problem/pathological gambling (PPG) by demographics 36. Protective factors by Problem/pathological gambling (PPG) and any
gambling 37. Problem/Pathological Gambling (PPG) by types of gambling 38. Problem/Pathological Gambling (PPG) by gambling behavior and age of
onset 39. Problem/Pathological Gambling (PPG) by adult behaviors and attitudes 40. Problem/Pathological Gambling (PPG) by prevention attitudes 41. Problem/Pathological Gambling (PPG) by internet and family gambling 42. Gambling behavior and attitudes among frequent gamblers (weekly or
daily) 43. Adult attitudes and behavior by frequent gambling 44. Internet and family gambling and peer pressure by frequent gambling 45. Association between age of onset of gambling and receiving lottery tickets
as a gift
4

Executive Summary
Methodology The study group contacted all public high schools in the State of CT and invited them to participate in this study. A total of 10 schools participated. With few exceptions, students from all four grades were surveyed at each school. The survey was anonymous and self administered. A total of 4,523 students were surveyed, and the demographics of the sample were similar to the distribution in the State as a whole. Results Demographics
• The sample was 52% female; 15% of minority race (anything other than White) and 15% of Hispanic ethnicity; 88% were between ages 14 and 18; 50% reported their family income as middle, but 31% reported income as unknown • Demographics differed significantly by Region. Region 3 had more students who were 15; Region 1 had more male students who participated; Region 1 had the highest proportion of White participants and Region 4 had the lowest; Region 4 had the highest proportion Hispanic; Region 3 had the lowest proportion who reported middle income; and Regions 2 and 3 had the lowest participation of 12 graders. Demographics also differed significantly by DRG. DRG classifications are utilized by the DOE to generally describe the socioeconomic status of a student body. There are 9 levels of DRG (level A through I), however, we grouped these into three evenly spaced tiers (a through C, D through F, and G through I). High tier DRG schools had younger participants and higher proportions of male respondents; they had higher proportions of white respondents and lower proportions of Hispanic respondents; they were more likely to report family income as high; and had a higher proportion of respondents in 11th and 12 grade.
Gambling Types
• 90% of respondents reported some kind of gambling activity in the previous 12 months
• The three most commonly endorsed types of gambling types included playing cards outside of a casino (81%), betting with a friend for money (60%), and receiving instant lottery or scratch tickets as a gift (42%).
• The likelihood of any gambling did not differ by region. However, region 2 had the highest prevalence of lottery tickets other than instant or scratch tickets; region 5 respondents were the most likely to report receiving lottery tickets as a gift; region 4 respondents were least likely to report playing cards outside of a casino; region 5 respondents were most likely to
5

report gambling on school grounds; region 3 respondents were most likely to report betting with a friend for money; region1 respondents were least likely to play dice outside of a casino; region 5 respondents were most likely to report betting on games of pool; and region 1 respondents were most likely to report some other type of gambling.
• In general, higher tier DRG schools had respondents who reported less gambling in general. However, they also had a higher prevalence of lottery ticket playing, playing cards, and betting with a friend for money.
• The median frequency of types of gambling is low, however, card playing and betting with a friend are endorsed by 50% of respondents as being engaged in more than monthly.
• In general region 5 has the highest endorsed frequency of gambling. The average number of types of gambling endorsed is 4, and there is no difference by region. Lower tier schools endorse significantly fewer types of gambling games.
Gambling time and reasons
• Overall about 15% of gamblers reported gambling for more than an hour per week. This did not differ by region or DRG.
• The most commonly endorsed reasons for gambling included fun and entertainment (30%), to win money (25%), and excitement (18%). These reasons differed significantly by both region and DRG.
• 32% of respondents reported starting to gamble at age 12 or younger, and 37% reported starting between 12 and 14. Region 3 had the youngest ages of onset of gambling. Higher tier DRG schools had older ages of onset of gambling.
• Very few respondents reported gambling alone (4%). Most reported gambling with friends (34%) or with family (16%), particularly siblings (12%). Region 5 had respondents most likely to gamble with friends; regions 1 and 5 had respondents most likely to gamble with family. Higher tier schools had more respondents reporting gambling with friends and family than lower tier schools.
Gambling related problems
• The most commonly endorsed gambling related problems as measured on the Massachusetts Adolescent Gambling Scale (MAGS) include not being able to stop gambling (17%), thinking that they should reduce gambling (13%), and gambling creating problems with friends or family (10%).
• The most commonly endorsed DSM symptoms of problem gambling include chasing losses (22%), tolerance (12%), and lying to friends or family about the extent of gambling (10%).
• 13% of gamblers can be classified as problem or pathological gamblers according to DSM criteria (5% problem gamblers, 7% pathological). This translates to 5.4% and 5.0% of all respondents, respectively. The average MAGS score is 1.82 and 10% of gamblers score as “in transition” or pathological according to the MAGS.
6

• Lower tier DRG schools had respondents who were more likely to say they thought they should reduce gambling, that they could not stop when they wanted to, and that gambling had created problems with friends and family.
• Lower tier DRG schools had respondents who were more likely to report having to gamble increasing amounts in order to achieve the same excitement, but middle tier school respondents were most likely to report lying to friends or family about the extent of their gambling.
• Higher tier schools had respondents with the lowest total MAGS scores. • MAGS and DSM scores differed significantly by region. For example,
region 3 had the highest total MAGS scores. Adult behaviors and attitudes
• 50% of the sample thought their parents would disapprove of their gambling behavior, while 44% reported that they knew at least one peer that they thought gambled too much. 39% reported hearing adults at school discussing their own gambling. 53% reported that a teacher had presented information about the dangers of gambling at least once. Most respondents (55%) did not know what would happen if they were caught gambling at school.
• All of these factors differed by region and DRG, with one exception. There was no difference across DRG in whether respondents had heard adults discussing their gambling at school.
Prevention attitudes
• On average respondents endorsed 12 of the listed 15 prevention efforts as somewhat or very important for preventing teen gambling.
• The most commonly endorsed as very important included fear of losing valuables, close friends, or relatives (67%); adults not involving kids in gambling (53%); and participating activities that are fun and free of gambling (47%).
• There was minimal differences in prevention attitudes by region, however, there was significant differences by DRG tier. Higher tier respondents were less likely to endorse most prevention items than lower tier respondents.
Internet and family gambling and peer pressure
• 28% of respondents had visited an internet gambling website without gambling at least once. This did not differ by region or DRG.
• 12% of respondents reported that the gambling of a close family member caused worry or concern. This did not differ by region but was more prevalent among respondents in lower tier schools.
• 14% of respondents reported that they had experienced peer pressure to gamble at least once. This did not differ by region but was most likely in middle tier schools.
7

Types of gambling endorsed among current gamblers • Among students who gambled in the previous year, the most common
types of gambling that are reported as a daily activity include playing cards outside of a casino, betting with a friend for money, and betting on video or arcade games. These differed significantly by both region and DRG.
• Between 1 and 2% of students reported that they bought lottery or scratch tickets daily, and between 1 and 2% reported receiving tickets as a gift on a daily basis.
Adult behaviors and attitudes as reported by current gamblers
• Current gamblers were evenly split on whether their parents would disapprove (48%) or be neutral/approve of their gambling behavior (52%).
• About 45% of current gamblers reported that they had at least one peer they thought gambled too much.
• 40% of gamblers reported that they had heard adults discussing their own gambling at school.
• 46% of gamblers reported never hearing a teacher present any information on problem gambling or the risks of gambling.
• 54% did not know what would happen if they were caught gambling at school.
• All of these patterns differed significantly by region and DRG. Prevention Attitudes
• Among current gamblers, the most commonly endorsed prevention items included fear of losing possessions, friends, or family (66%); adults not involving kids in gambling (52%), and participating in activities that are fun and free of gambling (46%).
• Prevention attitudes about the most commonly endorsed methods did not differ by grade but did differ by race. African American respondents thought the most important prevention methods beyond fear of losing possessions and adults not involving kids in gambling was having parents who don’t gamble and learning about the risks of gambling from parents.
• Prevention attitudes also differed significantly by gender. Males were less likely than females to endorse any item as very important, but specifically endorsed checking IDs for lottery ticket purchase as third most important. Females endorsed as third most important having parents who don’t gamble. Both males and females thought that fear of losing possessions and adults not involving kids in gambling were the two most important prevention methods.
Characteristics of those with problem/pathological gambling (PPG)
• Those with PPG do not differ by age but are much more likely to be male, more likely to be Hispanic and more likely to report being on public assistance.
8

• Those with PPG were more likely to have low grades and less likely to engage in community or school activities. They are much more likely to be living with a foster family.
• Those with PPG report that the most common types of gambling include betting with a friend for money, playing cards outside of a casino and playing other types of games not listed.
• On average those with PPG report that they engage in 10 different types of gambling.
• 21% of those with PPG report that they gamble 14 or more hours per week.
• 38% report that they feel a growing internal pressure that can only be relieved by gambling, and 35% report having been turned away from a casino.
• The most commonly endorsed reasons for gambling include to win money, fun and entertainment, and excitement.
• 32% had begun gambling before age 8. • Those with PPG are more likely to gamble alone (31%) or with strangers
(36%) than those without PPG. • 19% of those with PPG think their parents would strongly approve of their
gambling, and 26% have 10 or more peers that they think gamble too much.
• Those with PPG are less likely to endorse any of the prevention items as somewhat or very important. The most highly endorsed include fear of losing valuable possessions, not having adults involve kids in gambling, and checking IDs for lottery tickets.
• 69% of those with PPG report visiting a gambling internet site without placing a bet.
• 23% of those with PPG have or have had a close family member whose gambling caused worry or concern.
• 51% of those with PPG have experienced peer pressure to gamble, 18% report experiencing this 7 or more times.
Characteristics of those who engage in any type of frequent gambling (at least weekly)
• Frequent gamblers endorse virtually all reasons for gambling. The least likely to be endorsed was peer pressure.
• 51% of frequent gamblers thought their parents would neither approve nor disapprove of their gambling in the next year.
• 50% of frequent gamblers have at least one peer they think gambles too much, 13% have 10 or more.
• 50% of frequent gamblers have heard adults discussing their own gambling at school, and 50% have ever heard a prevention message about gambling from a teacher.
• 45% of frequent gamblers do not know what would happen if they were caught gambling at school
9
• 44% of frequent gamblers report visiting a gambling internet site without placing a bet.
• 14% of frequent gamblers have or have had a close family member with a potential gambling problem.
• 23% of frequent gamblers have experienced peer pressure to gamble. Lottery tickets as gifts
• Respondents who reported earlier ages of onset of gambling are significantly more likely to also report receiving lottery tickets as gifts.
10

Methodology
This study was approved by the Yale University School of Medicine Human Investigations Committee. Sampling The study team sent out invitation letters by mail to all public 4-year and non-vocational or special education high schools in the State of CT. Letters were followed up by phone calls to principals to see if schools were interested in participating in the survey. Schools were offered a report on their individual school’s data as an incentive to participate. Schools that expressed an interest were then contacted to arrange for obtaining permission from School Boards and/or superintendents as needed. In many cases this required the preparation of a specific proposal to the board that would get reviewed at a regularly scheduled meeting.
Once permission was obtained from all parties a passive consent procedure was set up. Letters were sent through the school to parents telling them about the study and giving instructions on what to do if they wished their child to be excluded from the study. In most cases, parents could call the front office, give their name and the name of their child, and instruct the office that they did not want their child participating. If no message was received from a parent, parental permission was assumed.
After the initial round of letters were mailed, the response from schools was not yet sufficient to ensure that all regions of the state were sufficiently represented. Therefore, targeted contacts were made to schools that were in areas that would ensure a more representative sample.
Although this was not a random sample of public high school students in CT, the sample obtained in this study is similar in demographics to the sample of CT residents enumerated in the 2000 Census ages 14-18. For example, while 22% of our sample was age 17, 20% of CT residents aged 14-18 are age 17. Similarly, while 48% of our sample was male, 51% of CT residents in this age group are male. Finally, while 14% and 16% of this sample, respectively, are Black race and Hispanic ethnicity, the rates of these groups in the CT adolescent population is 13% and 14%. This, combined with the fact that all three tiers of DRG group were represented, make the data generalizable to public high school students across the State.
Study Procedures In most cases, the entire student body was targeted for administration of the survey. Some schools conducted an assembly where surveys were administered, while others had students complete the survey in every health or English class throughout the day. In each case the school was visited on a single day by a number of research assistants who explained the study, distributed the surveys, answered questions, and collected the surveys.
11

Students were told that they could voluntarily refuse to complete the survey if they wished, and were also reminded to keep surveys anonymous by not writing their name or other identifying information anywhere on the survey. Students were given a pen as thanks for their participation. Data were double-entered from the paper surveys into an electronic data base. Data cleaning procedures ensured that data were not out of range. Random spot checks of returned forms was also conducted to ensure the accuracy of data entry. Survey Forms A copy of the survey form that was utilized can be found at the end of this report, consisting of 51 questions concerning demographic characteristics such as age, gender, race, ethnicity, grade, and family income; protective factors such as grades, community activities, employment, and family structure; and gambling behaviors, related problems, and attitudes. The questions utilized to assess gambling behaviors are all instruments that have been previously utilized in gambling studies with adolescents, including the Gambling Impact and Behavior Study, Congressionally mandated study to assess the impact of gambling on the US population in 1997. In addition, the Massachusetts Adolescent Gambling Scale (MAGS), developed by Shaffer et al at Harvard University, was utilized to assess gambling related problems and the DSM criteria for problem and pathological gambling. Data Analysis Frequencies of all variables in the total sample were calculated. Statistical tests were conducted to see whether responses differed significantly by DMHAS region or by DRG tier. Analyses were also conducted to characterize those students that met DSM criteria for problem or pathological gambling. Analyses of prevention efforts were also conducted by race and gender to see whether endorsed prevention efforts differed by those groups.
Regions are geographic catchment areas defined by the Department of Mental Health and Addiction Services (DMHAS), and all five regions were represented in the study sample. DRG classifications are utilized by the Department of Education (DOE) to generally describe the socioeconomic status of a student body. There are 9 levels of DRG (level A through I), however, we grouped these into three evenly spaced tiers (A through C, D through F, and G through I). Additional summary variables were made for the following: the total number of types of gambling endorsed; the maximum endorsed frequency of gambling; total MAGS score; a DSM-defined variable for problem/pathological gambling; and the total number of prevention efforts endorsed.
12

Results Table 1. Distributions of age, gender, race, ethnicity, income and grade for the total sample The sample was primarily between ages 15 and 17, although there were students as young as 13 and as old as 19. The sample was 53% female and 74% white. There were 15% who identified themselves as of Hispanic ethnicity. Half of the sample indicated that their family was of “middle income,” however, 31% reported that they did not know the income level of their family. The sample was fairly evenly split across grade levels, although there were significantly fewer seniors (16%). Table 2. Distributions of age, gender, race, ethnicity, income and grade by DMHAS region There were significant differences in demographic characteristics across DMHAS region. Respondents from regions 1 and 3 were younger than other respondents. Region 1 had significantly more male respondents (57%) and the highest proportion of respondents who were white (91%). Region 4 had the highest proportion of Hispanics (23%). Region 3 had the highest proportion of respondents who reported that their family was on public assistance, however, they also had the highest proportion that did not know their family income. Regions 2 and 3 had the highest proportions of respondents in grades 9 and 10. Table 3. Distributions of age, gender, race, ethnicity, income and grade by DRG There were also significant differences in demographics across tiers of DRG classification. Higher tier schools had younger respondents and more male students. Higher tier schools also had more respondents who were white and fewer that reported Hispanic ethnicity. Lower tier schools had respondents who were more likely to not know their family income level. Table 4. Frequencies of any gambling and each type of gambling, total sample A total of 90% of the sample reported that they had gambled at least once in the previous 12 months. The three most commonly endorsed types of gambling included playing cards outside of a casino (81%), betting with a friend for money (60%), and receiving instant lottery or scratch tickets (42%). The least commonly endorsed included buying lottery tickets other than scratch tickets, placing a bet with a bookie, and gambling at a casino. However, 6% of respondents reported that they had gambled at a casino in the past year.
13

Table 5. Frequencies of any gambling and each type of gambling by region There was no significant difference across region in the prevalence of any gambling. However, there were significant regional differences in certain types of gambling. Region 3 had a significantly lower prevalence of buying lottery tickets (2%). Region 5 had the highest prevalence of receiving lottery tickets (52%). Region 4 had the lowest prevalence of playing cards (77%). Region 5 had a particularly high prevalence of gambling on school grounds (31%) and placing a bet with a bookie (8%). Region 2 had a particularly low prevalence of betting with a friend for money (58%). Region 5 had the highest prevalence of betting on dice (16%) and betting on pool or other game of skill (37%). Regions 1 and 5 had the highest proportions of respondents who reported gambling in some way not already listed. Table 6. Frequencies of any gambling and each type of gambling by DRG There were also significant differences across DRG classification in the types of gambling endorsed. The highest tier schools had the highest prevalence of any gambling (93%) as well as the highest prevalence of playing bingo (34%), playing cards (85%), betting with a friend for money (65%), and any other type of gambling (32%). Middle tier schools had the highest prevalence of buying instant lottery tickets (22%), receiving lottery tickets as a gift (49%), receiving other lottery tickets (26%), playing slot machines (18%), and placing a bet with a bookie (8%). Lower tier schools had the highest prevalence of betting on a video or arcade games (30%) and betting on dice (17%). Table 7. Median frequency of engaging in each type of gambling, total number of types endorsed and maximum gambling frequency, total sample For most types of gambling the median frequency of engaging in any single type was never. However, this also implies that 50% of respondents endorsed most types of gambling as being engaged in at least monthly or more. In addition, playing cards and betting with friends for money was reported as more frequent—50% of respondents reported engaging in these games weekly or more. On average, respondents reported that they engaged in 4 different types of gambling. Table 8. Median frequency of engaging in each type of gambling, total number of types endorsed and maximum gambling frequency by DRG There were significant differences in the frequency of gambling across regions. Region 5 had the highest frequency of receiving instant lottery tickets, gambling on school grounds, placing a bet with a bookie, betting on dice, and betting on pool or other game of skill. Region 3 had the highest frequency of betting with a friend for money. In general regions 1 and 4 consistently reported
14

the lowest frequency of any given type of gambling. There was no significant regional difference in the total number of types of gambling endorsed. Table 9. Median frequency of engaging in each type of gambling, total number of types endorsed and maximum gambling frequency by region There were significant differences across DRG tier in the frequency of reported gambling. Higher tier schools reported highest frequencies for playing bingo, playing cards, betting with a friend for money, and other types of gambling not otherwise listed. Middle tier schools reported higher frequencies of buying instant lottery tickets, receiving instant lottery tickets, receiving other types of lottery tickets, playing slot machines, placing bets on the internet, gambling on school grounds, and placing a bet with a bookie. Lower tier schools reported the highest frequencies of betting on video or arcade games and betting on dice. Table 10. Gambling behaviors, reasons and age of onset, total sample In the total sample, 7% of the sample reported that they had been turned away from a casino and 5% reported that they felt pressure to gamble even when they did want to. In a typical week, most respondents (85%) reported that they gambled for less than an hour, however, 4% reported gambling 14 hours or more per week. The most commonly endorsed reasons for gambling included fun and entertainment (30%), to win money (25%), and excitement (18%). The majority of respondents began gambling when they were older than 12 (68%), however 16% reported starting before the age of 8. Respondents reported that they usually gambled with friends (34%) or family (16%), especially siblings (12%). Table 11. Gambling behaviors, reasons and age of onset by region There were significant regional differences in the reasons for gambling, age of onset, and who respondents usually gambled with. Region 5 respondents were most likely to report playing for fun and entertainment (40%), excitement (26%), boredom (16%), to win money (36%), for the challenge (15%), to socialize with friends (29%), to support a good cause (4%) and because it was a hobby (5%). Region 3 was most likely to report gambling to calm themselves down (7%), to feel good about themselves (9%), because of peer pressure (4%), and as a distraction from problems (5%). Region 3 had the earliest ages of onset of gambling—25% reported beginning to gamble before age 8. Region 5 had the oldest ages of onset, with 42% of respondents reporting starting between age 15 and 17. Region 5 respondents were most likely to report gambling with friends (50%), parents (12%), other adults (9%), family (21%), and siblings (16%). Region 3 respondents were most likely to report gambling alone (5%) or with strangers (5%).
15
Table 12. Gambling behaviors, reasons and age of onset by DRG There were significant differences across DRG tiers in reasons for gambling, age of onset, and who respondents usually gambled with. Higher tier schools were most likely to report gambling for fun and entertainment or to socialize with friends. Middle tier schools had the highest prevalence on all other reasons for gambling. Middle tier schools also had the lowest ages of onset—34% of respondents in middle tier schools reported starting to gamble before age 11. Higher tier schools were most likely to report gambling with friends, family, and siblings. Middle tier schools were most likely to report gambling alone, with parents or other adults, and with strangers. Table 13. MAGS item frequencies, MAGS score, and problem/pathological gambling (PPG), total sample The most commonly endorsed MAGS items included not being able to stop gambling (17%), thinking they should reduce or stop gambling (13%), and gambling creating problems with friends and family (10%). The most common DSM symptoms endorsed included chasing losses (22%), the same amount of gambling having less effect (13%), and having to gamble increasing amounts to achieve the same level of excitement (10%). A total of 13% of the sample that reported gambling met DSM criteria for problem or pathological gambling, and this translated to 5.4% and 5% of all respondents with complete data, respectively. The average MAGS score was 1.82. Table 14. MAGS item frequencies, MAGS score, and problem/pathological gambling (PPG) by region There were significant regional differences in endorsed MAGS items and DSM symptoms. Region 2 respondents had the highest prevalence of being arrested for gambling related activity (6%). Region 3 respondents had the highest reported rates of not being able to stop gambling (11%), gambling creating problems with family (14%), neglecting obligations in order to gamble (13%), going to someone for help about gambling (6%), and gambling to reduce uncomfortable feelings (8%). Region 4 respondents reported the highest rates of committing illegal acts to finance gambling (11%). Region 2 had the highest prevalence of problem and pathological gambling, at 4.3%. Table 15. MAGS item frequencies, MAGS score, and problem/pathological gambling (PPG) by DRG There were significant differences across DRG tier in endorsed MAGS items and DSM symptoms. The lowest tier schools were most likely to endorse feeling guilty about gambling (10%), having a family member worry about their gambling (9%), thought they should stop or reduce gambling (16%), were not able to stop gambling (19%), and gambling creating problems with friends or
16

family (13%). They also had the highest MAGS scores, with an average of 2.0. Middle tier school respondents were most likely to report getting into trouble at work or school for gambling (10%). Lower tier schools were also most likely to report having to gamble increasingly larger amounts to achieve the same effect (12%) and jeopardizing or losing a functional role due to gambling (5%). Middle tier schools had the highest reported prevalence of feeling restless or irritable when unable to gamble (8%), gambling to reduce uncomfortable feelings (7%), and lying to family or friends about gambling (12%). Middle tier schools also had the highest prevalence of problem and pathological gambling (4%). Table 16. Adult gambling behavior and attitudes, total sample In the total sample, 50% of respondents indicated that their parents would disapprove or strongly disapprove of them gambling in the next 12 months. Most respondents (56%) did not have any peers that they thought gambled too much, however, 8% indicated that they have 10 or more such peers. The majority (88%) indicated that they either never heard adults discussing their gambling while at school or only heard such comments a few times a year. 47% of respondents had never heard a prevention message from a teacher regarding gambling. Of those who had heard such a message, the majority had heard such information less than three times. The majority of students (55%) did not know what would happen to them if they were caught gambling at school. Of those who had a thought about what would happen, most indicated a warning or suspension. Table 17. Adult gambling behavior and attitudes by region There was significant regional variation in adult attitudes about gambling. Region 5 respondents were most likely to report that their parents would approve of gambling behavior (9%) and also most likely to indicate that they had 10 or more peers that gambled too much (21%). Region 5 respondents were also most likely to hear adults discussing their gambling at school (47%). However, respondents in region 3 were most likely to report hearing adults discussing gambling every day (4%). Region 1 had the most prevention messages delivered by teachers--82% of respondents had heard such a message at least once. Region 5 respondents were the most likely to know what would happen if students were caught gambling at school (67%), and also reported the most likely consequences to be a warning (20%) or suspension (30%). Table 18. Adult gambling behavior and attitudes by DRG There were significant differences across DRG classification groups in adult attitudes and behavior. Lower tier schools had respondents most likely to say their parents would approve of their gambling behavior (6%) but were also the least likely to have heard a prevention message from a teacher. Conversely, lower tier school respondents also were most aware of the consequences of
17
getting caught gambling at school, and indicated the two most likely consequences suspension (22%) or a warning (16%). Higher tier school respondents were most likely to not know the consequences of gambling at school (66%), but also the most likely to have heard a prevention message from a teacher (63%). Middle tier school respondents were most likely to have 10 or more peers they thought gambled too much (11%). Table 19. Prevention attitudes and total number of prevention activities endorsed, total sample The most commonly endorsed prevention methods endorsed as very important included fear of losing valuable possessions, close friends, and relatives (67%); adults not involving kids in gambling (53%); and participating in activities that are fun and free of gambling (47%). Those considered least important included not having internet gambling access at home, parents not permitting card games for money at home, and hanging out with friends who don’t gamble. On average respondents endorsed 11 of the 15 methods as somewhat or very important. Table 20. Prevention attitudes and total number of prevention activities endorsed by region There were few regional differences in how prevention methods were rated. However, region 3 respondents were most likely to indicate that hanging out with friends that don’t gamble (32%); participating in activities that are fun and free of gambling (26%); and warning from adults in the family (24%) were not important to controlling teen gambling. Region 5 students were most likely to rate learning about the risks of gambling at school (26%) as unimportant. Table 21. Prevention attitudes and total number of prevention activities endorsed by DRG There were significant differences by DRG classification in how prevention methods were rated. High tier schools were most likely to rate hanging out with friends who don’t gamble (28%); parent strictness about gambling (19%); learning about the risks of gambling from peers (22%); and parents not permitting card games at home (34%) as not important in preventing teen gambling. Lower tier school respondents were most likely to indicate that not having internet gambling access at home was unimportant in preventing teen gambling. Table 22. Internet and family gambling and peer pressure, total sample In the total sample, most students (72%) had never visited an internet gambling website without placing a bet. 12% indicated that they have, or had, a
18

close family member whose gambling caused worry or concern. 14% indicated that they had experienced peer pressure to gamble at least once. Table 23. Internet and family gambling and peer pressure by region There were no significant regional differences in these variables. Table 24. Internet and family gambling and peer pressure by DRG There were significant differences in family history and peer pressure by DRG classification group. Lower tier school respondents had the highest rate of reported family members whose gambling caused worry or concern (15%), however, middle tier school respondents are the ones most likely to experience peer pressure to gamble (17%). Table 25. Types of gambling among those with any gambling, total sample Among those respondents who reported gambling in the previous 12 months, the most commonly endorsed types of gambling were playing cards outside of a casino (90%), betting with a friend for money (66%), and receiving instant lottery or scratch tickets (47%).
Most types of gambling were engaged in monthly or less, however, the types most likely to be played daily were playing cards, betting with a friend, and betting on games of pool or other games of skill. Just under 2% of current gamblers indicated that they bet at a casino on a daily basis.
Table 26. Types of gambling among those with any gambling by region There were significant differences across region in the types of gambling endorsed and the frequency of gambling among those respondents with any gambling in the previous year. Regions 2 and 5 had the highest rates of purchase of instant lottery or scratch tickets (24%). Region 5 also had the highest rate of receipt of lottery tickets as a gift (57%). Regions 1 and 5 had the highest rates of playing cards outside of a casino (93% and 92% respectively), however, region 2 had the highest rates of playing cards on a daily basis (9.5%). Region 5 had the highest rate of gambling on school grounds (34%). Region 1 had particularly low rates of betting with a friend for money on a daily basis (1.2%). Regions 1 and 3 had particularly low rates of betting on dice (6% and 9% respectively). However, region 2 had very high rates of betting on dice on a daily basis (4%). Regions 1 and 5 had the highest rates of betting on pool or other game of skill (38% and 40% respectively), while region 2 had the highest rates of betting on pool on a daily basis (4.7%). Finally, regions 1 and 5 had the highest rates of betting on a type of game not otherwise listed (37% and 35% respectively).
19

Table 27. Types of gambling among those with any gambling by DRG There were significant differences in the types of gambling endorsed and frequency of gambling among current gamblers across DRG tiers. The highest tier schools had consistently the lowest rates of any type of gambling on a daily basis. However, the highest tier schools also had the highest rates of any bingo playing and betting with a friend for money. Second tier schools had the highest rates of playing slot machines (19%), gambling on school grounds (27%), and gambling at a casino (7%) but the lowest rates of betting on pool or other game of skill (34%). Third tier schools had the highest rates of betting on video or arcade games (35%) and betting on dice (19%) but the lowest rates of receiving lottery tickets (36%), other types of tickets (19%), playing cards outside of a casino (88%), and other types of gambling (26%). Table 28. Adult gambling behavior and attitudes among those with any gambling, total sample Among respondents who reported gambling in the previous year, 45% indicated that they thought their parents would neither approve or disapprove of their gambling in the next year, while 48% indicated that their parent would disapprove of their gambling. Most (54%) gamblers did not have a peer they thought gambled too much, however 9% reported that they had 10 or more peers that gambled too much. Most respondents had never heard adults at school discussing their own gambling activities, although 7% reported hearing such discussions at least weekly. Most respondents (54%) also reported that they had heard a prevention message from a teacher on gambling at least once. Few respondents (6%) thought nothing would happen to a student caught gambling at school, but many (54%) did not know what would happen. Table 29. Adult gambling behavior and attitudes among those with any gambling by region There were significant differences across region in adult gambling behaviors and attitudes as reported by current gamblers. Regions 1 and 5 had the highest reports that adults would approve of kids’ gambling behavior (9% each). Region 5 had the highest rates of reports of 10 or more peers who gamble too much (21% compared to 6-7% in other regions). Region 5 respondents also reported the highest rates of hearing adults discussing their own gambling at school (48%). Region 1 had by far the highest rates of prevention messages being presented by teachers on the risks of gambling (82% compared to 45-50% elsewhere). Finally, region 5 respondents were the least likely to say they did not know what would happen if a student were caught gambling at school (32%) and most likely to report suspension or a warning as the likely consequence of gambling at school.
20

Table 30. Adult gambling behavior and attitudes among those with any gambling by DRG There were significant differences in reports of adult gambling behavior and attitudes as reported by respondents who had gambled in the previous year. The highest tier schools had respondents who reported hearing more gambling prevention messages (62%) but also had the highest proportion of students who did not know what would happen to a student caught gambling at school. Middle tier schools had respondents who reported hearing the least about adults’ own gambling while at school (40%). Finally, lower tier schools had respondents who reported the most parental disapproval of gambling behavior (54%) but also reported the least number of prevention messages from teachers (54% had never heard a prevention message). Table 31. Prevention attitudes among those with any gambling, total sample The most commonly endorsed prevention efforts as being very important among respondents who had gambled in the previous year were fear of losing valuable possessions, friends, or family; adults not involving kids in gambling; and participating in activities that are fun and free of gambling. The prevention efforts that were considered to be least important were not having access to the internet at home, parent or guardians not allowing card games for money at home; and hanging out with friends who don’t gamble. Table 32. Prevention attitudes among those with any gambling by grade There were significant differences in prevention attitudes by grade. Twelfth graders were most likely to rate advertisements about problem gambling; warnings from family; warnings from peers; having parents who don’t gamble; learning about gambling in school; and learning about risks of gambling from parents as unimportant in preventing teen gambling. These items were more likely to be considered to be important by younger students, particularly ninth graders. Table 33. Prevention attitudes among those with any gambling by race There were significant racial differences in what respondents thought were important to prevention efforts. All racial groups indicated that fear of losing possessions, friends or family was important, as was having parents who don’t gamble. However, African American respondents indicated that adults not involving kids in gambling was important; white respondents indicated that participating in activities that were fun and gambling free was very important; and Asian and other race groups indicated that checking IDs for lottery tickets was very important.
21

Table 34. Prevention attitudes among those with any gambling by gender There were gender differences in how respondents rated prevention efforts. Both groups thought that fear of losing possessions or friends and family, and adults not involving kids in gambling were very important. However, males were most likely to indicate that checking IDs for purchase of lottery tickets was also very important to prevention efforts, and females were most likely to endorse participation in activities that are fun and gambling free. Table 35. Problem/pathological gambling (PPG) by demographics Those with PPG were not significantly different by age or grade, however, they were more likely to be male (80%) and Hispanic (28%). They were also more likely to report that their family was on public assistance (12%). Table 36. Protective factors by Problem/pathological gambling (PPG) and any gambling Those with PPG were more likely to report grades of D’s or lower. They were significantly more likely to report engaging in church activities (22%). They were significantly less likely to live with two parents (59%) and much more likely to be living with a foster family (7%). Table 37. Problem/Pathological Gambling (PPG) by types of gambling The most commonly endorsed types of gambling among those with PPG included betting with a friend for money (90%), playing cards (90%), and playing some other game not listed (79%). Although gambling at a casino was the least endorsed, there were still 40% of those with PPG who reported gambling at a casino. Those with PPG endorsed a significantly higher number of types of gambling (8 compared to 5 among those not at risk). Table 38 Problem/Pathological Gambling (PPG) by gambling behavior and age of onset 35% of those with PPG reported being turned away at a casino, and 21% reported spending 14 hours or more gambling per week. 34% reported that they felt pressure to gamble even when they did not want to, and 38% reported feeling a growing sense of tension that could only be relieved by gambling. Those with PPG were most likely to report gambling to win money, for fun and entertainment, and for excitement. Those with PPG began gambling at earlier ages, with 32% reporting starting to gamble before age 8. Those with PPG were significantly more likely to report gambling alone (31%), with parents (31%), with other adults (32%), and with strangers (36%).
22

Table 39 Problem/Pathological Gambling (PPG) by adult behaviors and attitudes Those with PPG were more likely to report that their parents would disapprove of their gambling (23%), but were also more likely to report that their parents would strongly approve of their gambling (19%). Those with PPG were significantly more likely to know at least one peer who gambled too much (62%), and 26% reported that they had 10 or more such peers. Those with PPG were also more likely to report hearing adults at school discuss their own gambling (50%) and to report hearing frequent prevention messages from teachers (13%). They were also the least likely to not know what would happen to a student caught gambling at school, but listed the most likely consequence as “nothing” (26%). Table 40 Problem/Pathological Gambling (PPG) by prevention attitudes Those with PPG were less likely than other groups to endorse any of the listed prevention methods as very important in preventing teen gambling. However, the three most commonly endorsed methods included fear of losing valuable possessions, close friends, and relatives; adults not involving kids in gambling; and checking IDs for purchase of lottery tickets. The least important method indicated by those with PPG was parents not permitting card games for money at home. Table 41 Problem/Pathological Gambling (PPG) by internet and family gambling Those with PPG were the most likely to visit internet gambling sites without making a bet, and 33% reported doing so 17 or more times. Those with PPG were also most likely to have a family member whose gambling caused worry or concern (23%) and to report feeling peer pressure to gamble (51%). Table 42 Gambling behavior and attitudes among frequent gamblers (weekly or daily) Those who reported engaging in some form of gambling on a weekly basis or more were significantly different from those who are not frequent gamblers. They were more likely to have been turned away from a casino (14%), to feel pressure to gamble (11%), and to spend more time gambling (7% spent 14 hours or more per week). They endorsed every reason for gambling more than non-frequent gamblers, however, the most commonly endorsed reasons included fun and entertainment, to win money, and excitement. 18% reported that gambling was a hobby. They were also more likely to start gambling at an earlier age, with 20% reporting that they started before age 8. Frequent gamblers are more likely to report that they gamble alone (10%), but mostly gamble with friends (59%) and family (28%), particularly siblings (24%).
23

Table 43 Adult attitudes and behavior by frequent gambling Those who gamble frequently are more likely to report that their parents would be neutral (51%) or approve of their gambling (12%). They were also more likely to know peers who gamble too much (50%), with 13% reporting they knew 10 or more such peers. They were more likely to have overheard adults at school discussing their own gambling (50%) and more likely to have heard frequent prevention messages from teachers (6%). They were less likely to not know what would happen to a student caught gambling at school and listed a warning (18%) or a suspension (17%) as the most likely consequence. Table 44 Internet and family gambling and peer pressure by frequent gambling Frequent gamblers were more likely to have visited an internet gambling site without placing a bet (44%), and 13% reporting doing this 17 times or more. 14% reported that they had a family member with a potential gambling problem, and 23% reported that they had experienced peer pressure to gamble. Table 45 Association between age of onset of gambling and receiving lottery tickets as a gift Those who reported receiving a lottery ticket as a gift in the previous 12 months were also significantly more likely to report starting gambling before age 8.
24

CharacteristicAge < 14 years 2.53% 14 years 11.22% 15 years 26.60% 16 years 27.69% 17 years 21.68% 18 years 9.00% 19 and older 1.29%Gender Male 47.53% Female 52.47%Race Black 11.09% White 74.40% Asian 4.09% Other 10.41%Ethnicity Hispanic/Latino(a) 15.02%Income Public assistance 2.06% Low income 5.00% Middle income 50.23% High income 12.04% "Don't Know" 30.67%Grade 9th 30.66% 10th 27.56% 11th 25.74% 12th 16.04%
Table 1. Distributions of age, gender, race, ethnicity, income and
grade for the total sample
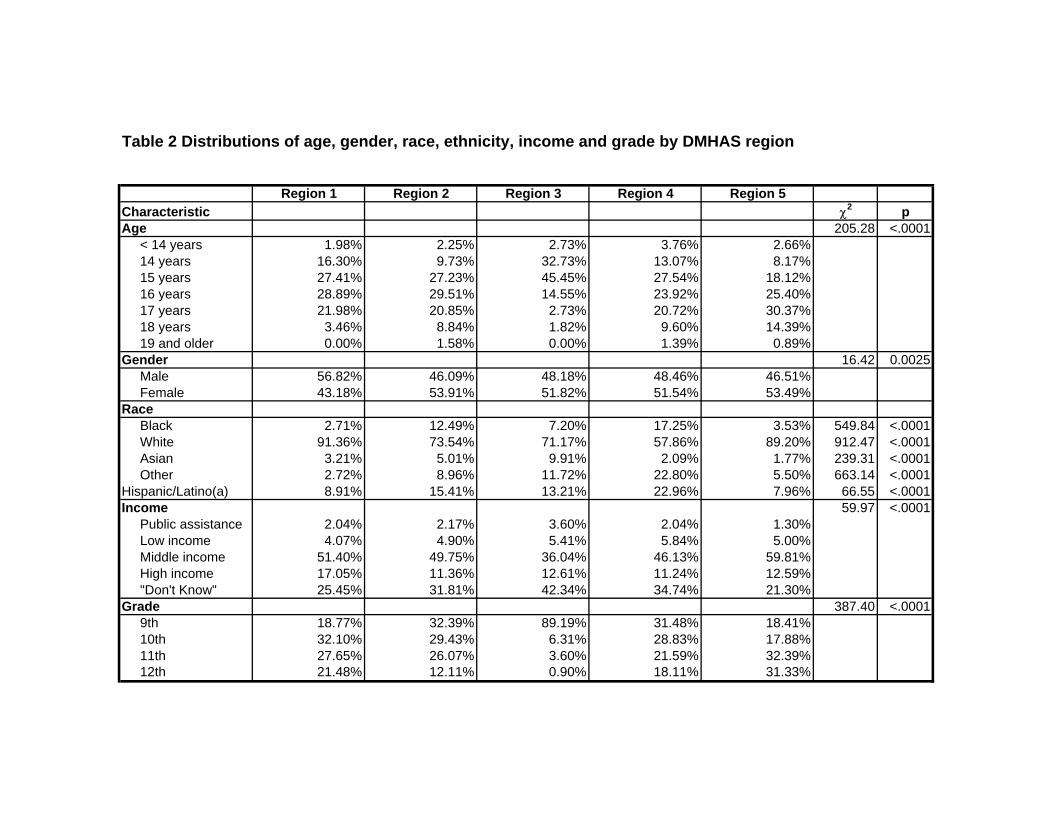
Table 2 Distributions of age, gender, race, ethnicity, income and grade by DMHAS region
Region 1 Region 2 Region 3 Region 4 Region 5Characteristic χ2 pAge 205.28 <.0001 < 14 years 1.98% 2.25% 2.73% 3.76% 2.66% 14 years 16.30% 9.73% 32.73% 13.07% 8.17% 15 years 27.41% 27.23% 45.45% 27.54% 18.12% 16 years 28.89% 29.51% 14.55% 23.92% 25.40% 17 years 21.98% 20.85% 2.73% 20.72% 30.37% 18 years 3.46% 8.84% 1.82% 9.60% 14.39% 19 and older 0.00% 1.58% 0.00% 1.39% 0.89%Gender 16.42 0.0025 Male 56.82% 46.09% 48.18% 48.46% 46.51% Female 43.18% 53.91% 51.82% 51.54% 53.49%Race Black 2.71% 12.49% 7.20% 17.25% 3.53% 549.84 <.0001 White 91.36% 73.54% 71.17% 57.86% 89.20% 912.47 <.0001 Asian 3.21% 5.01% 9.91% 2.09% 1.77% 239.31 <.0001 Other 2.72% 8.96% 11.72% 22.80% 5.50% 663.14 <.0001Hispanic/Latino(a) 8.91% 15.41% 13.21% 22.96% 7.96% 66.55 <.0001Income 59.97 <.0001 Public assistance 2.04% 2.17% 3.60% 2.04% 1.30% Low income 4.07% 4.90% 5.41% 5.84% 5.00% Middle income 51.40% 49.75% 36.04% 46.13% 59.81% High income 17.05% 11.36% 12.61% 11.24% 12.59% "Don't Know" 25.45% 31.81% 42.34% 34.74% 21.30%Grade 387.40 <.0001 9th 18.77% 32.39% 89.19% 31.48% 18.41% 10th 32.10% 29.43% 6.31% 28.83% 17.88% 11th 27.65% 26.07% 3.60% 21.59% 32.39% 12th 21.48% 12.11% 0.90% 18.11% 31.33%

Table 3 Distributions of age, gender, race, ethnicity, income and grade by DRG
A, B or C D, E or F G, H or ICharacteristic χ2 pAge 53.26 <.0001 < 14 years 1.96% 2.36% 3.07% 14 years 14.06% 11.98% 8.62% 15 years 27.26% 26.92% 25.80% 16 years 27.14% 26.97% 29.00% 17 years 22.00% 22.43% 20.44% 18 years 7.21% 8.46% 10.71% 19 and older 0.37% 0.88% 2.35%Gender 16.72 0.0002 Male 54.03% 46.23% 45.91% Female 45.97% 53.77% 54.09%Race Black 3.42% 4.35% 24.82% 253.84 <.0001 White 91.56% 86.40% 48.86% 23.87 <.0001 Asian 2.44% 4.49% 4.44% 67.65 <.0001 Other 2.58% 4.76% 21.88% 174.84 <.0001Hispanic/Latino(a) 6.34% 10.47% 26.35% 225.60 <.0001Income 90.98 <.0001 Public assistance 1.88% 2.43% 1.64% Low income 4.27% 5.25% 5.05% Middle income 54.45% 51.22% 46.52% High income 16.19% 13.11% 8.25% "Don't Know" 23.21% 27.99% 38.54%Grade 54.27 <.0001 9th 23.35% 31.96% 32.75% 10th 30.32% 24.97% 29.74% 11th 24.82% 26.96% 24.51% 12th 21.52% 16.12% 13.01%

Table 4 Frequencies of any gambling and each type of gambling, total sample
Yes NoGambling activityAny gambling in past 12 months 89.58% 10.42%Played cards outside of a casino 81.23% 18.77%Bet with a friend for money 59.82% 40.18%Received instant lottery or scratch tickets 42.41% 57.59%Bet on pool/game of skill 31.27% 68.73%Played bingo 28.51% 71.49%Any other type of gambling 27.78% 72.22%Bet on video/arcade games 24.97% 75.03%Gambled on school grounds 22.55% 77.45%Received other lottery tickets 22.39% 77.61%Bought instant lottery/scratch tickets 20.19% 79.81%Played slot/other machines 15.74% 84.26%Bet on dice outside of a casino 14.22% 85.78%Placed bets on internet 11.61% 88.39%Bought other lottery tickets 8.38% 91.62%Played bingo 7.01% 92.99%Gambled at a casino 5.98% 94.02%

Table 5 Frequencies of any gambling and each type of gambling by region
Region 1 Region 2 Region 3 Region 4 Region 5Gambling activity χ2 pAny gambling in past 12 months 90.77% 89.14% 93.69% 88.25% 91.64% 7.00 0.1361Bought instant lottery/scratch tickets 17.24% 21.12% 17.12% 17.41% 21.93% 8.46 0.0761Bought other lottery tickets 6.88% 9.22% 1.80% 7.45% 8.00% 10.60 0.0315Received instant lottery or scratch tickets 43.12% 42.46% 40.00% 34.05% 52.50% 43.49 <.0001Received other lottery tickets 23.08% 23.14% 21.62% 19.33% 22.40% 4.68 0.322Played bingo 26.98% 27.88% 29.36% 32.60% 27.24% 7.03 0.1342Played slot/other machines 15.08% 16.41% 17.12% 12.19% 17.20% 8.61 0.0717Played cards outside of a casino 84.31% 80.99% 84.55% 76.96% 84.89% 16.38 0.0025Placed bets on internet 12.96% 12.27% 10.91% 8.31% 11.83% 9.13 0.058Gambled on school grounds 18.78% 22.19% 21.82% 19.01% 31.19% 32.23 <.0001Placed a bet with a bookie 3.98% 7.89% 7.34% 4.37% 8.23% 16.94 0.002Bet with a friend for money 60.21% 57.80% 65.45% 62.84% 64.04% 12.61 0.0134Bet on video/arcade games 26.72% 25.48% 28.18% 24.67% 21.15% 5.96 0.202Bet on dice outside of a casino 5.82% 15.44% 8.18% 13.68% 16.16% 30.18 <.0001Bet on pool/game of skill 34.75% 30.51% 28.83% 27.99% 36.98% 15.03 0.0046Gambled at a casino 4.77% 6.44% 4.50% 5.68% 5.35% 2.86 0.5812Any other type of gambling 33.24% 26.91% 26.13% 25.00% 31.84% 13.95 0.0075

Table 6 Frequencies of any gambling and each type of gambling by DRG
A, B or C D, E or F G, H or IGambling activity χ2 pAny gambling in past 12 months 92.78% 90.50% 86.42% 25.81 <.0001Bought instant lottery/scratch tickets 19.85% 22.21% 17.34% 12.56 0.0019Bought other lottery tickets 7.80% 9.00% 7.77% 2.06 0.3569Received instant lottery or scratch tickets 45.29% 48.89% 31.01% 114.16 <.0001Received other lottery tickets 24.97% 25.51% 16.26% 45.26 <.0001Played bingo 34.23% 27.44% 26.92% 15.48 0.0004Played slot/other machines 14.92% 17.53% 13.49% 10.87 0.0044Played cards outside of a casino 84.57% 82.71% 77.11% 24.33 <.0001Placed bets on internet 10.59% 12.88% 10.25% 6.63 0.0364Gambled on school grounds 21.05% 24.22% 20.84% 6.77 0.0339Placed a bet with a bookie 4.09% 8.05% 6.39% 18.22 0.0001Bet with a friend for money 65.05% 58.91% 58.29% 11.03 0.004Bet on video/arcade games 24.14% 21.82% 30.19% 31.78 <.0001Bet on dice outside of a casino 8.94% 14.65% 16.54% 24.35 <.0001Bet on pool/game of skill 33.12% 30.77% 30.99% 1.54 0.4633Gambled at a casino 5.12% 6.46% 5.73% 2.05 0.3585Any other type of gambling 31.54% 29.56% 22.99% 24.76 <.0001

Table 7 Median frequency of engaging in each type of gambling, total number of types endorsed and maximum gambling frequency, total sample
Gambling Activity Median Bought instant lottery/scratch tickets 1 (never)Bought other lottery tickets 1 (never)Received instant lottery or scratch tickets 1 (never)Received other lottery tickets 1 (never)Played bingo 1 (never)Played slot/other machines 1 (never)Played cards outside of a casino 2 (less than monthly)Placed bets on internet 1 (never)Gambled on school grounds 1 (never)Placed a bet with a bookie 1 (never)Bet with a friend for money 2 (less than monthly)Bet on video/arcade games 1 (never)Bet on dice outside of a casino 1 (never)Bet on pool/game of skill 1 (never)Gambled at a casino 1 (never)Any other type of gambling 1 (never)Total number of activities endorsed (mean) 4.19 ± 3.47Maximum gambling frequency 3 (monthly)
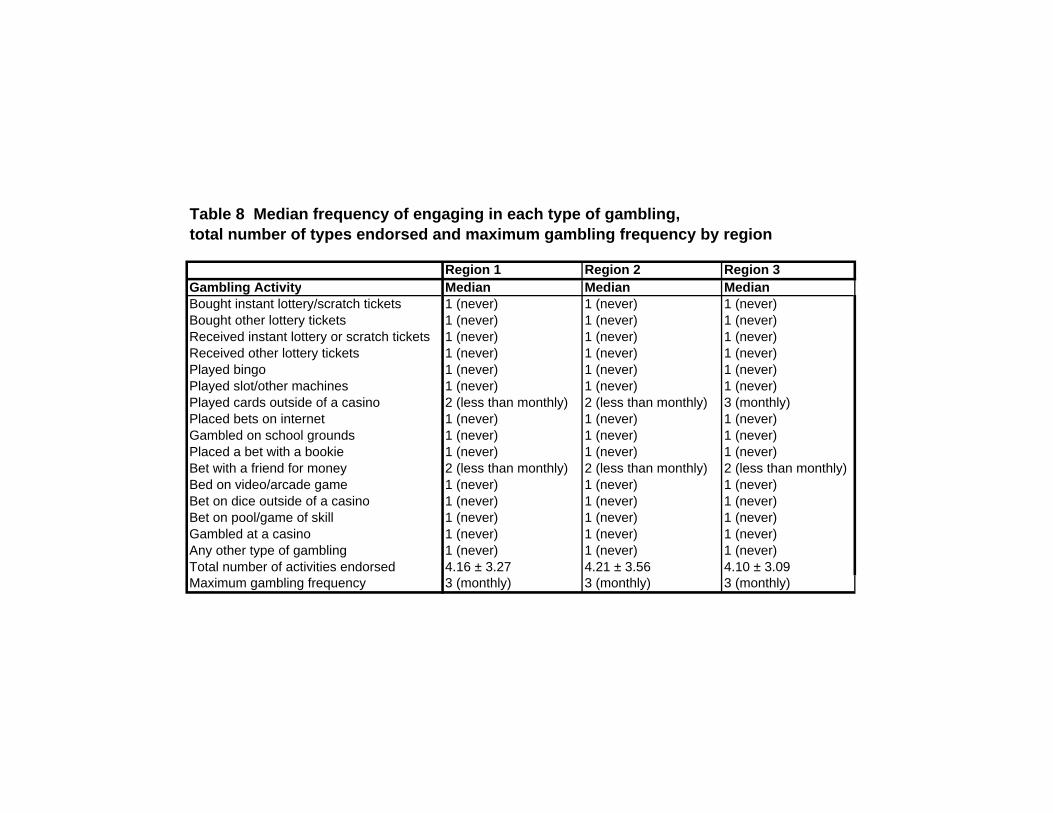
Table 8 Median frequency of engaging in each type of gambling, total number of types endorsed and maximum gambling frequency by region
Region 1 Region 2 Region 3Gambling Activity Median Median Median Bought instant lottery/scratch tickets 1 (never) 1 (never) 1 (never)Bought other lottery tickets 1 (never) 1 (never) 1 (never)Received instant lottery or scratch tickets 1 (never) 1 (never) 1 (never)Received other lottery tickets 1 (never) 1 (never) 1 (never)Played bingo 1 (never) 1 (never) 1 (never)Played slot/other machines 1 (never) 1 (never) 1 (never)Played cards outside of a casino 2 (less than monthly) 2 (less than monthly) 3 (monthly)Placed bets on internet 1 (never) 1 (never) 1 (never)Gambled on school grounds 1 (never) 1 (never) 1 (never)Placed a bet with a bookie 1 (never) 1 (never) 1 (never)Bet with a friend for money 2 (less than monthly) 2 (less than monthly) 2 (less than monthly)Bed on video/arcade game 1 (never) 1 (never) 1 (never)Bet on dice outside of a casino 1 (never) 1 (never) 1 (never)Bet on pool/game of skill 1 (never) 1 (never) 1 (never)Gambled at a casino 1 (never) 1 (never) 1 (never)Any other type of gambling 1 (never) 1 (never) 1 (never)Total number of activities endorsed 4.16 ± 3.27 4.21 ± 3.56 4.10 ± 3.09Maximum gambling frequency 3 (monthly) 3 (monthly) 3 (monthly)

Table 8 Median frequency of engaging in each type of gambling, total number of types endorsed and maximum gambling frequency by region
Region 4 Region 5Gambling Activity Median Median F pBought instant lottery/scratch tickets 1 (never) 1 (never) 8.46 0.0761Bought other lottery tickets 1 (never) 1 (never) 10.60 0.0315Received instant lottery or scratch tickets 1 (never) 2 (less than monthly) 43.49 <.0001Received other lottery tickets 1 (never) 1 (never) 4.68 0.322Played bingo 1 (never) 1 (never) 7.03 0.1342Played slot/other machines 1 (never) 1 (never) 8.61 0.0717Played cards outside of a casino 2 (less than monthly) 2 (less than monthly) 16.38 0.0025Placed bets on internet 1 (never) 1 (never) 9.13 0.058Gambled on school grounds 1 (never) 1 (never) 32.23 <.0001Placed a bet with a bookie 1 (never) 1 (never) 16.94 0.002Bet with a friend for money 2 (less than monthly) 2 (less than monthly) 12.61 0.0134Bet on video/arcade games 1 (never) 1 (never) 5.96 0.202Bet on dice outside of a casino 1 (never) 1 (never) 30.18 <.0001Bet on pool/game of skill 1 (never) 1 (never) 15.03 0.0046Gambled at a casino 1 (never) 1 (never) 2.86 0.5812Any other type of gambling 1 (never) 1 (never) 13.95 0.0075Total number of activities endorsed 3.86 ± 3.24 4.58 ± 3.48 7.00 0.1361Maximum gambling frequency 3 (monthly) 3 (monthly)

Table 9 Median frequency of engaging in each type of gambling, total number of types endorsed and maximum gambling frequency by DRG
A, B or C D, E or F G, H or IGambling Activity Median Median Median F pBought instant lottery/scratch tickets 1 (never) 1 (never) 1 (never) 12.5606 0.0019Bought other lottery tickets 1 (never) 1 (never) 1 (never) 2.0607 0.3569Received instant lottery or scratch tickets 1 (never) 1 (never) 1 (never) 114.1647 <.0001Received other lottery tickets 1 (never) 1 (never) 1 (never) 45.2623 <.0001Played bingo 1 (never) 1 (never) 1 (never) 15.4814 0.0004Played slot/other machines 1 (never) 1 (never) 1 (never) 10.8694 0.0044Played cards outside of a casino 2 (less than monthly) 2 (less than monthly) 2 (less than monthly) 24.3317 <.0001Placed bets on internet 1 (never) 1 (never) 1 (never) 6.6261 0.0364Gambled on school grounds 1 (never) 1 (never) 1 (never) 6.7664 0.0339Placed a bet with a bookie 1 (never) 1 (never) 1 (never) 18.2177 0.0001Bet with a friend for money 2 (less than monthly) 2 (less than monthly) 2 (less than monthly) 11.0273 0.004Bet on video/arcade games 1 (never) 1 (never) 1 (never) 31.7832 <.0001Bet on dice outside of a casino 1 (never) 1 (never) 1 (never) 24.3533 <.0001Bet on pool/game of skill 1 (never) 1 (never) 1 (never) 1.5387 0.4633Gambled at a casino 1 (never) 1 (never) 1 (never) 2.0516 0.3585Any other type of gambling 1 (never) 1 (never) 1 (never) 24.7573 <.0001Total number of activities endorsed 4.32 ± 3.21 4.38 ± 3.61 3.84 ± 3.36 25.8101 <.0001Maximum gambling frequency 3 (montly) 3 (montly) 3 (montly)

Table 10 Gambling behaviors, reasons and age of onset, total sample
Turned away from a casino 6.88%Feel pressure to gamble 5.34%Hours spent gambling in a typical week 1 hour or less 84.93% 2-7 9.78% 8-13 1.44% 14 hours or more 3.85%Tension/anxiety relieved by gambling 5.38%Reasons for gambling Fun and entertainment 29.80% Excitement 17.67% Boredom 11.34% To win money 25.16% It's a challenge 12.03% To calm down 2.54% To feel good about self 4.82% To socialize with friends 17.22% Peer pressure 2.06% To support good causes 3.22% It's a hobby 6.57% As a distraction from problems 2.70%Age first gambled 8 years or younger 16.12% 9-11 years 16.12% 12-14 years 36.72% 15-17 years 29.03% 18 years or older 2.01%Usually gambled with Alone 4.36% With friends 33.63% Parents 8.84% Other adults 6.43% Family 16.18% Strangers 4.13% Brothers and sisters 11.89%

Table 11 Gambling behaviors, reasons and age of onset by region
Region 1 Region 2 Region 3 Region 4 Region 5χ2 p
Turned away from a casino 5.84% 7.04% 7.34% 6.38% 7.35% 1.24 0.8707Feel pressure to gamble 3.73% 5.50% 2.78% 5.70% 5.76% 3.81 0.4317Hours spent gambling in a typical week 20.88 0.0521 1 hour or less 84.82% 84.15% 90.74% 89.87% 82.64% 2-7 12.57% 9.81% 5.56% 5.56% 12.40% 8-13 1.57% 1.45% 1.85% 0.65% 1.93% 14 hours or more 1.05% 4.59% 1.85% 3.92% 3.03%Tension/anxiety relieved by gambling 4.33% 6.27% 6.15% 4.74% 3.36% 6.37 0.1733Reasons for gambling Fun and entertainment 32.35% 27.86% 32.43% 27.82% 39.82% 443.17 <.0001 Excitement 20.25% 16.54% 15.32% 14.46% 26.02% 560.63 <.0001 Boredom 10.37% 10.69% 13.51% 10.43% 16.11% 387.01 <.0001 To win money 24.94% 23.43% 28.83% 23.23% 35.75% 459.30 <.0001 It's a challenge 13.58% 12.16% 12.61% 8.48% 14.87% 421.46 <.0001 To calm down 2.22% 2.76% 7.21% 1.81% 1.77% 127.61 <.0001 To feel good about self 5.19% 5.08% 9.01% 2.78% 5.13% 203.69 <.0001 To socialize with friends 22.22% 15.03% 20.72% 13.07% 29.03% 451.27 <.0001 Peer pressure 1.73% 2.39% 3.60% 1.39% 1.24% 126.71 <.0001 To support good causes 3.21% 3.32% 2.70% 2.64% 3.72% 182.23 <.0001 It's a hobby 7.65% 5.97% 8.11% 5.42% 9.91% 276.36 <.0001 As a distraction from problems 2.22% 3.06% 4.50% 2.09% 1.77% 148.81 <.0001Age first gambled 53.28 <.0001 8 years or younger 13.75% 17.53% 24.53% 15.81% 11.49% 9-11 years 16.25% 16.31% 20.75% 17.39% 13.51% 12-14 years 43.75% 34.96% 39.62% 43.08% 32.77% 15-17 years 25.00% 28.75% 15.09% 20.55% 41.89% 18 years or older 1.25% 2.45% 0.00% 3.16% 0.34%Usually gambled with Alone 3.46% 4.50% 4.50% 4.45% 4.25% 214.94 <.0001 With friends 36.05% 30.88% 31.53% 30.74% 49.73% 491.24 <.0001 Parents 10.12% 8.33% 8.11% 7.65% 12.21% 358.08 <.0001 Other adults 7.41% 5.90% 9.01% 5.42% 9.20% 259.72 <.0001 Family 20.99% 15.14% 13.51% 14.05% 21.24% 535.96 <.0001 Strangers 4.20% 4.46% 4.50% 3.20% 3.72% 205.84 <.0001 Brothers and sisters 13.83% 11.09% 15.32% 10.43% 15.75% 373.49 <.0001

Table 12 Gambling behaviors, reasons and age of onset by DRG
A, B or C D, E or F G, H or Iχ2 p
Turned away from a casino 5.36% 7.76% 6.39% 5.88 0.0529Feel pressure to gamble 4.49% 5.73% 5.23% 1.78 0.4107Hours spent gambling in a typical week 11.50 0.074 1 hour or less 87.07% 83.26% 86.51% 2-7 9.76% 9.99% 9.45% 8-13 1.32% 1.71% 1.05% 14 hours or more 1.85% 5.04% 3.00%Tension/anxiety relieved by gambling 3.70% 6.20% 4.95% 4.19 0.1228Reasons for gambling Fun and entertainment 32.40% 31.27% 26.58% 17.66 0.0001 Excitement 18.34% 20.95% 15.22% 32.73 <.0001 Boredom 10.76% 12.12% 10.65% 34.99 <.0001 To win money 25.92% 26.27% 23.38% 21.67 <.0001 It's a challenge 11.49% 12.53% 11.69% 37.69 <.0001 To calm down 1.47% 3.38% 1.96% 22.73 <.0001 To feel good about self 4.03% 5.46% 4.96% 32.64 <.0001 To socialize with friends 20.29% 19.84% 12.02% 24.53 <.0001 Peer pressure 1.71% 2.59% 1.50% 26.84 <.0001 To support good causes 2.57% 3.84% 2.74% 32.35 <.0001 It's a hobby 7.33% 7.68% 4.64% 32.17 <.0001 As a distraction from problems 1.59% 3.33% 2.42% 28.38 <.0001Age first gambled 29.20 0.0003 8 years or younger 13.79% 17.84% 14.77% 9-11 years 15.67% 16.11% 16.40% 12-14 years 45.45% 31.07% 40.54% 15-17 years 23.51% 32.80% 26.31% 18 years or older 1.57% 2.19% 1.98%Usually gambled with Alone 3.79% 5.41% 3.20% 28.40 <.0001 With friends 35.70% 35.15% 30.63% 16.84 0.0002 Parents 9.29% 9.53% 7.71% 37.10 <.0001 Other adults 5.99% 7.08% 5.81% 34.01 <.0001 Family 17.73% 16.14% 15.55% 38.57 <.0001 Strangers 4.16% 4.58% 3.53% 35.45 <.0001 Brothers and sisters 13.08% 12.26% 10.84% 33.92 <.0001

Table 13 MAGS item frequencies, MAGS score, and problem/pathological gambling (PPG), total sample
MAGS ItemsFeel pressure to gamble when do not gamble 5.34%Feel guilty about gambling 7.86%Member of family worry/complain about gambling 8.39%Ever thought should reduce/stop gambling 12.88%Always able to stop gambling when want to 83.24%Gambling created problems between you and family or friends 9.85%Gotten in trouble at work/school for gambling 8.63%Neglected obligations two or more days in a row because gambling 6.00%Gone to someone for help about gambling 3.52%Been arrested for gambling related activity 4.76%Total MAGS score -0.02 ± 1.32MAGS summary score Non-pathological 90.27% In transition 6.54% Pathological 3.19%DSM ItemsPreoccupied with thinking of ways to get money/reliving past gambling experiences 7.69%Gambled increasingly larger amounts for desired level of excitement 10.16%Same amount of gambling had less of an effect 12.37%Feel restless/irritable is stop or cut down 6.54%Gambled to reduce uncomfortable feelings 6.64%Gambled to escape from problems, relieving guilt, anxiety, depression 7.51%Gambled the next day to win back losing of previous day 22.16%Lied to family/others about extent of gambling 9.72%Committed illegal acts to finance gambling 9.26%Jeopardized/lost relationship, job, opportunity because of gambling 6.09%Relied on other sources to provide money to resolve gambling related financial situation 7.26%Had unsuccessful efforts to limit, reduce or stop gambling 8.94%DSM summary grouping (among gamblers) Not at risk 65.50% At risk 21.34% Problem/pathological gambling 13.16%DSM summary grouping (among all respondents)

Not at risk/low risk 89.60% Problem gambling 5.00% Pathological gambling 5.40%

Table 14 MAGS item frequencies, MAGS score, and problem/pathological gambling (PPG) by DRG
A, B or C D, E or F G, H or IMAGS Items χ2 pFeel pressure to gamble when do not gamble 4.49% 5.73% 5.23% 1.78 0.4107Feel guilty about gambling 4.71% 7.85% 9.55% 7.18 0.0276Member of family worry/complain about gambling 4.78% 9.03% 9.31% 6.90 0.0317Ever thought should reduce/stop gambling 10.06% 11.84% 15.99% 8.60 0.0136Always able to stop gambling when want to 88.45% 82.80% 81.14% 8.48 0.0144Gambling created problems between you and family or friends 6.34% 8.99% 13.09% 12.69 0.0018Gotten in trouble at work/school for gambling 4.93% 10.23% 8.18% 9.38 0.0092Neglected obligations two or more days in a row because gambling 3.54% 6.67% 6.24% 4.50 0.1054Gone to someone for help about gambling 1.47% 3.97% 3.92% 5.05 0.08Been arrested for gambling related activity 2.90% 4.80% 5.70% 3.90 0.1419Total MAGS score -0.24 ± 1.02 0.02 ± 1.36 0.03 ± 1.39 4.91 0.0075MAGS summary score 7.55 0.1095 Nonpathological 17.78% 20.51% 7.02% In transition 50.25% 52.14% 64.91% Pathological 31.97% 27.35% 28.07%DSM ItemsPreoccupied with thinking of ways to get money/reliving past gambling experiences 5.93% 8.66% 7.14% 3.02 0.2205Gambled increasingly larger amounts for desired level of excitement 6.59% 10.40% 11.66% 6.33 0.0423Same amount of gambling had less of an effect 11.31% 13.13% 11.76% 1.06 0.5898Feel restless/irritable is stop or cut down 3.40% 7.88% 6.14% 8.17 0.0168Gambled to reduce uncomfortable feelings 1.83% 7.71% 7.57% 14.76 0.0006Gambled to escape from problems, relieving guilt, anxiety, depression 4.56% 7.88% 8.51% 5.20 0.074Gambled the next day to win back losing of previous day 21.28% 23.09% 21.23% 0.93 0.629Lied to family/others about extent of gambling 7.90% 11.50% 8% 6.74 0.0344Committed illegal acts to finance gambling 8.67% 9.02% 9.87% 0.52 0.7721Jeopardized/lost relationship, job, opportunity because of gambling 4.05% 3.70% 4.91% 8.27 0.016Relied on other sources to provide money to resolve gambling related financial situation 6.78% 8.13% 6.23% 2.24 0.327Had unsuccessful efforts to limit, reduce or stop gambling 6.06% 9.18% 10.11% 4.48 0.1066DSM summary grouping 5.04 0.2828 Not at risk 18.19% 18.52% 12.88% At risk 50.86% 48.15% 54.08% Problem/pathological gambling 30.95% 33.33% 33.05%

Table 15 MAGS item frequencies, MAGS score, and problem/pathological gambling (PPG) by region
MAGS Items Region 1 Region 2 Region 3 Region 4 Region 5 χ2 pFeel pressure to gamble when do not gamble 3.73% 5.50% 2.78% 5.70% 5.76% 3.81 0.4317Feel guilty about gambling 6.43% 8.22% 10.53% 7.17% 7.51% 1.49 0.8276Member of family worry/complain about gambling 6.55% 9.03% 11.11% 5.08% 9.01% 4.58 0.3334Ever thought should reduce/stop gambling 12.20% 13.40% 11.32% 13.68% 11.04% 1.59 0.8106Always able to stop gambling when want to 88.55% 81.22% 76.92% 81.98% 89.30% 16.92 0.002Gambling created problems between you and family or friends 6.63% 11.19% 13.73% 10.68% 5.76% 11.45 0.0219Gotten in trouble at work/school for gambling 5.17% 10.26% 7.69% 6.35% 7.23% 9.39 0.052Neglected obligations two or more days in a row because gambling 2.94% 6.99% 13.21% 5.84% 3.39% 13.93 0.0075Gone to someone for help about gambling 1.76% 4.27% 5.56% 4.70% 0.59% 13.79 0.008Been arrested for gambling related activity 2.29% 5.76% 5.56% 5.61% 2.00% 11.22 0.0242Total MAGS score -0.24 ± 0.11 0.07 ± 0.04 0.08 ± 0.19 -0.02 ± 0.08 -0.2 ± 0.07 3.85 0.0041MAGS summary score 16.48 0.036 Non-pathological 83.87% 73.93% 72.92% 78.11% 79.68% In transition 12.90% 17.91% 20.83% 15.09% 16.83% Pathological 0.0323 0.0816 0.0625 0.0679 0.0349DSM ItemsPreoccupied with thinking of ways to get money/reliving past gambling ex 4.76% 8.17% 5.66% 9.46% 6.40% 4.8063 0.3078Gambled increasingly larger amounts for desired level of excitement 6.02% 11.65% 7.69% 9.56% 8.28% 7.5373 0.1101Same amount of gambling had less of an effect 13.58% 13.04% 10.00% 11.76% 10.43% 2.1607 0.7062Feel restless/irritable is stop or cut down 3.77% 7.69% 8.00% 5.23% 5.00% 6.5367 0.1625Gambled to reduce uncomfortable feelings 0.62% 7.70% 8.16% 7.29% 5.33% 12.5989 0.0134
Gambled to escape from problems, relieving guilt, anxiety, depression 4.91% 8.79% 8.16% 7.29% 4.67% 7.8636 0.0967Gambled the next day to win back losing of previous day 17.18% 22.69% 20.41% 20.63% 24.61% 4.0949 0.3933Lied to family/others about extent of gambling 8.59% 10.25% 14.29% 8.01% 9.35% 2.7504 0.6004Committed illegal acts to finance gambling 9.14% 10.42% 6.25% 11.11% 3.75% 15.2363 0.0042Jeopardized/lost relationship, job, opportunity because of gambling 5.71% 6.67% 12.00% 5.38% 4.06% 6.3227 0.1763Relied on other sources to provide money to resolve gambling related financial situation 9.88% 8.18% 6.12% 5.94% 4.22% 8.5912 0.0722Had unsuccessful efforts to limit, reduce or stop gambling 7.32% 9.67% 6.12% 8.28% 8.41% 1.9629 0.7426DSM summary grouping 10.31 0.2442 Not at risk 69.54% 64.79% 59.57% 65.53% 66.67% At risk 20.53% 20.36% 31.91% 21.59% 23.08% Problem/pathological gambling 9.93% 14.84% 8.51% 12.88% 10.26%

Table 16 Adult gambling behavior and attitudes, total sample
Parents feelings about gambling in next 12 months Strongly disapprove 22.53% Disapprove 28.38% Neither approve or disapprove 42.84% Approve 4.05% Strongly approve 2.20%Number of peers you think gamble too much None 56.02% One 9.42% 2-3 16.95% 4-6 7.06% 7-9 2.23% 10 or more 8.31%Heard adults at school talking about their own gambling Never 61.10% A few times a year 27.16% Once or twice per month 5.39% Once or twice per week 3.82% Once or twice per day 2.53%Teacher presented information about problem gambling and risks of gambling Never 46.82% Once 18.03% 2-3 24.51% 4-6 5.43% 7-9 1.65% 10 or more 3.57%What happens when caught first time for gambling at school Nothing 6.08% Warning from teacher/principal 16.44% Detention 7.07% Suspension 14.60% Expulsion 1.16% Don't know 54.65%

Table 17 Adult gambling behavior and attitudes by region
Region 1 Region 2 Region 3 Region 4 Region 5 χ2 pParents feelings about gambling in next 12 months 45.20 0.0001 Strongly disapprove 16.91% 24.32% 23.16% 23.54% 17.10% Disapprove 28.65% 29.50% 26.32% 26.88% 25.35% Neither approve or disapprove 46.42% 40.32% 45.26% 44.91% 48.69% Approve 6.30% 3.44% 3.16% 3.01% 6.64% Strongly approve 1.72% 2.41% 2.11% 1.67% 2.21%Number of peers you think gamble too much 181.58 <.0001 None 59.09% 57.92% 55.21% 59.80% 40.91% One 7.39% 10.37% 12.50% 9.15% 6.32% 2-3 18.75% 17.41% 17.71% 15.20% 15.61% 4-6 7.95% 5.99% 7.29% 6.21% 12.25% 7-9 1.14% 1.92% 2.08% 2.45% 4.15% 10 or more 5.68% 6.39% 5.21% 7.19% 20.75%Heard adults at school talking about their own gambling 32.63 0.0083 Never 63.92% 62.76% 58.33% 60.82% 52.54% Once or twice per year 26.42% 26.39% 26.04% 25.74% 33.01% Once or twice per month 5.11% 4.64% 6.25% 7.70% 6.05% Once or twice per week 3.41% 3.69% 5.21% 3.44% 4.88% Once or twice per day 1.14% 2.52% 4.17% 2.30% 3.52%Teacher presented information about problem gambling and risks of gambling 221.42 <.0001 Never 17.95% 49.31% 44.79% 55.46% 45.40% Once 18.52% 17.08% 29.17% 19.09% 18.59% 2-3 38.75% 23.38% 21.88% 21.21% 24.27% 4-6 13.68% 5.05% 1.04% 2.45% 5.87% 7-9 3.70% 1.86% 2.08% 0.33% 0.78% 10 or more 7.41% 3.32% 1.04% 1.47% 5.09%What happens when caught first time gambling at school 509.78 <.0001 Nothing 5.10% 6.70% 10.64% 6.36% 2.66% Warning from teacher/principal 10.20% 17.80% 9.57% 13.38% 19.63% Detention 5.95% 3.80% 4.26% 2.61% 29.45% Suspension 12.75% 15.43% 22.34% 11.42% 14.52% Expulsion 1.13% 1.12% 0.00% 1.96% 0.61% Don't know 64.87% 55.14% 53.19% 64.27% 33.13%

Table 18 Adult gambling behavior and attitudes by DRG
A, B or C D, E or F G, H or I χ2 pParents feelings about gambling in next 12 months 69.57 <.0001 Strongly disapprove 15.60% 21.15% 28.93% Disapprove 28.63% 27.55% 29.52% Neither approve or disapprove 49.53% 44.11% 36.29% Approve 4.75% 4.01% 3.68% Strongly approve 1.49% 2.87% 1.59%Number of peers think you gamble too much 58.37 <.0001 None 60.11% 51.60% 60.33% One 8.49% 9.10% 10.49% 2-3 17.79% 17.50% 15.61% 4-6 6.47% 8.14% 5.77% 7-9 1.48% 2.77% 1.87% 10 or more 5.66% 10.90% 5.93%Heard adults at school talking about their own gambling 13.25 0.1034 Never 60.38% 61.28% 61.26% Once or twice per year 28.17% 26.78% 27.12% Once or twice per month 7.01% 5.12% 4.84% Once or twice per week 3.10% 3.75% 4.36% Once or twice per day 1.35% 3.06% 2.42%Teacher presented information about problem gambling and risks of gambling 72.70 <.0001 Never 36.61% 45.73% 54.57% Once 19.25% 18.70% 16.27% 2-3 30.96% 24.50% 20.67% 4-6 7.54% 5.16% 4.57% 7-9 1.75% 1.63% 1.60% 10 or more 3.90% 4.27% 2.32%What happens when caught first time gambling at school 203.44 <.0001 Nothing 4.86% 6.36% 6.39% Warning from teacher/principal 12.96% 18.29% 15.73% Detention 4.59% 11.18% 2.40% Suspension 10.26% 11.66% 21.57% Expulsion 0.94% 0.59% 2.16% Don't know 66.40% 51.93% 51.76%

Table 19 Prevention attitudes and total number of prevention activities endorsed, total sample
Method for preventing gambling Very Important Somewhat Important Not ImportantFear of losing valuable possessions, close friends, and relatives 66.84% 22.80% 10.36%Adults not involving kids in gambling 53.00% 31.43% 15.57%Participating in activities that are fun and free of gambling 47.29% 37.07% 15.64%Having parents who don't gamble 46.94% 34.02% 19.03%Checking IDs for purchasing lottery tickets 45.41% 38.20% 16.40%Parent/Guardian strictness about gambling 40.37% 41.07% 18.56%Learning about the risks of gambling from parents 39.90% 42.97% 17.13%Warnings from, or listening to, peers 38.56% 43.85% 17.59%Warnings from adults in family 38.44% 43.68% 17.88%Learning about the risks of gambling from peers 34.96% 44.47% 20.56%Hanging out with friends who don't gamble 34.86% 39.74% 25.39%Learning about the risks of gambling in school 33.21% 45.28% 21.51%Advertisements that show the problems associated with gambling 32.65% 46.36% 20.99%Parent/Guardian not permitting card games (for money) at home 29.94% 37.45% 32.61%Not having access to Internet gambling at home 27.53% 38.76% 33.71%
mean ± s.d.Total number of Methods Endorsed 11.73 ± 4.22

Table 20 Prevention attitudes and total number of prevention activities endorsed by region
Method for preventing gamblingVery
ImportantSomewhat Important
Not Important
Very Important
Somewhat Important
Not Important
Fear of losing valuable possessions, close friends, and relatives 41.82% 40.75% 17.43% 46.77% 37.12% 16.11%Adults not involving kids in gambling 25.68% 43.44% 30.87% 36.47% 39.82% 23.71%Participating in activities that are fun and free of gambling 38.75% 43.63% 17.62% 49.48% 36.05% 14.47%Having parents who don't gamble 64.27% 24.93% 10.80% 67.57% 22.23% 10.20%Checking IDs for purchasing lottery tickets 31.02% 47.92% 21.05% 33.71% 46.22% 20.07%Parent/Guardian strictness about gambling 25.48% 45.75% 28.77% 28.86% 37.45% 33.69%Learning about the risks of gambling from parents 37.74% 44.63% 17.63% 41.60% 40.56% 17.84%Warnings from, or listening to, peers 35.79% 46.72% 17.49% 40.43% 41.89% 17.68%Warnings from adults in family 35.26% 46.28% 18.46% 39.87% 43.01% 17.11%Learning about the risks of gambling from peers 43.29% 38.36% 18.36% 48.47% 32.98% 18.54%Hanging out with friends who don't gamble 32.32% 51.38% 16.30% 34.53% 44.57% 20.90%Learning about the risks of gambling in school 35.81% 48.21% 15.98% 42.01% 41.43% 16.56%Advertisements that show the problems associated with gambling 33.98% 45.03% 20.99% 36.05% 44.35% 19.61%Parent/Guardian not permitting card games (for money) at home 52.75% 33.24% 14.01% 54.02% 30.32% 15.66%Not having access to Internet gambling at home 26.58% 41.92% 31.51% 31.41% 36.64% 31.95% mean ± s.d. mean ± s.d.Total number of methods endorsed 11.69 ± 4.29 11.81 ± 4.19
Region 1 Region 2

Table 20 Prevention attitudes and total number of prevention activities endorsed by region
Method for preventing gamblingVery
ImportantSomewhat Important
Not Important
Very Important
Somewhat Important
Not Important
Fear of losing valuable possessions, close friends, and relatives 52.00% 33.00% 15.00% 46.60% 37.35% 16.05%Adults not involving kids in gambling 29.00% 39.00% 32.00% 35.35% 40.00% 24.65%Participating in activities that are fun and free of gambling 40.40% 33.33% 26.26% 46.89% 36.80% 16.30%Having parents who don't gamble 68.00% 16.00% 16.00% 63.34% 25.12% 11.54%Checking IDs for purchasing lottery tickets 29.29% 50.51% 20.20% 32.24% 46.32% 21.44%Parent/Guardian strictness about gambling 22.22% 43.43% 34.34% 26.02% 38.40% 35.58%Learning about the risks of gambling from parents 33.33% 42.42% 24.24% 39.69% 39.84% 20.47%Warnings from, or listening to, peers 35.00% 41.00% 24.00% 37.54% 45.43% 17.03%Warnings from adults in family 35.00% 45.00% 20.00% 40.94% 42.20% 16.85%Learning about the risks of gambling from peers 43.43% 32.32% 24.24% 47.02% 34.17% 18.21%Hanging out with friends who don't gamble 29.59% 50.00% 20.41% 33.86% 42.99% 23.15%Learning about the risks of gambling in school 34.00% 45.00% 21.00% 38.52% 42.61% 18.87%Advertisements that show the problems associated with gambling 28.57% 47.96% 23.47% 36.06% 41.42% 22.52%Parent/Guardian not permitting card games (for money) at home 50.51% 31.31% 18.18% 52.67% 31.45% 15.88%Not having access to Internet gambling at home 30.30% 32.32% 37.37% 27.36% 39.31% 33.33%
mean ± s.d. mean ± s.d.Total number of methods endorsed 11.35 ± 4.35 11.67 ± 4.29
Region 3 Region 4

Table 20 Prevention attitudes and total number of prevention activities endorsed by region
Method for preventing gamblingVery
ImportantSomewhat Important
Not Important χ2 p
Fear of losing valuable possessions, close friends, and relatives 38.86% 43.43% 17.71% 15.24 0.0500Adults not involving kids in gambling 34.35% 36.64% 29.01% 25.86 0.0010Participating in activities that are fun and free of gambling 44.93% 38.24% 16.83% 26.16 0.0010Having parents who don't gamble 69.35% 22.41% 8.24% 13.20 0.1051Checking IDs for purchasing lottery tickets 30.04% 45.16% 24.81% 7.94 0.4392Parent/Guardian strictness about gambling 25.73% 39.46% 34.82% 14.07 0.0800Learning about the risks of gambling from parents 38.73% 42.20% 19.08% 8.76 0.3632Warnings from, or listening to, peers 32.95% 48.17% 18.88% 15.89 0.0440Warnings from adults in family 32.49% 47.86% 19.65% 13.68 0.0904Learning about the risks of gambling from peers 43.05% 35.91% 21.04% 10.48 0.2331Hanging out with friends who don't gamble 27.57% 46.21% 26.21% 22.43 0.0042Learning about the risks of gambling in school 35.80% 46.50% 17.70% 15.62 0.0482Advertisements that show the problems associated with gambling 30.49% 47.77% 21.75% 11.14 0.1936Parent/Guardian not permitting card games (for money) at home 49.32% 35.34% 15.34% 6.81 0.5568Not having access to Internet gambling at home 28.63% 36.75% 34.62% 10.41 0.2372
mean ± s.d.Total number of methods endorsed 11.57 ± 4.16
Region 5

Table 21 Prevention attitudes and total number of prevention activities endorsed by DRG
Very Important
Somewhat Important
Not Important
Very Important
Somewhat Important
Not Important
Method for preventing gamblingFear of losing valuable possessions, close friends, and relatives 41.55% 42.06% 16.39% 41.95% 40.98% 17.07%Adults not involving kids in gambling 27.60% 44.01% 28.39% 33.45% 40.15% 26.39%Participating in activities that are fun and free of gambling 40.99% 42.54% 16.47% 45.29% 37.86% 16.85%Having parents who don't gamble 63.98% 25.86% 10.16% 66.55% 23.12% 10.33%
Checking IDs for purchasing lottery tickets 27.89% 51.18% 20.92% 30.49% 47.98% 21.53%
Parent/Guardian strictness about gambling 23.69% 44.24% 32.07% 26.71% 39.86% 33.44%Learning about the risks of gambling from parents 35.26% 45.74% 19.00% 37.65% 34.44% 18.90%Warnings from, or listening to, peers 31.76% 51.18% 17.06% 35.37% 45.24% 19.39%Warnings from adults in family 34.21% 49.08% 16.71% 36.70% 44.89% 18.40%Learning about the risks of gambling from peers 43.46% 38.35% 18.19% 44.58% 35.77% 19.64%
Hanging out with friends who don't gamble 27.56% 51.31% 21.13% 29.38% 47.10% 23.52%Learning about the risks of gambling in school 31.63% 50.79% 17.59% 36.13% 45.34% 18.53%Advertisements that show the problems associated with gambling 32.19% 45.47% 22.34% 32.95% 46.20% 20.85%Parent/Guardian not permitting card games (for money) at home 50.00% 35.08% 14.92% 49.64% 33.77% 16.60%Not having access to Internet gambling at home 22.61% 43.01% 34.38% 28.76% 38.45% 32.80%
mean ± s.d. mean ± s.d.Total number of methods endorsed 11.74 ± 4.02 11.63 ± 4.34
A, B or C D, E or F

Table 21 Prevention attitudes and total number of prevention activities endorsed by DRG
Very Important
Somewhat Important
Not Important
Method for preventing gambling χ2 pFear of losing valuable possessions, close friends, and relatives 52.72% 31.87% 15.41% 46.026 0.0001Adults not involving kids in gambling 41.11% 36.68% 22.21% 43.20 0.0001Participating in activities that are fun and free of gambling 53.87% 32.76% 13.37% 40.11 0.0001Having parents who don't gamble 68.90% 20.59% 10.35% 7.91 0.0948
Checking IDs for purchasing lottery tickets 38.56% 41.21% 20.23% 35.25 0.0001
Parent/Guardian strictness about gambling 30.96% 33.99% 35.05% 25.84 0.0001Learning about the risks of gambling from parents 47.31% 34.90% 17.79% 43.83 0.0001Warnings from, or listening to, peers 46.84% 37.03% 16.12% 66.98 0.0001Warnings from adults in family 43.79% 39.30% 16.91% 27.60 0.0001Learning about the risks of gambling from peers 52.43% 28.95% 18.62% 29.38 0.0001
Hanging out with friends who don't gamble 42.14% 39.08% 18.78% 74.17 0.0001Learning about the risks of gambling in school 50.23% 34.95% 14.82% 94.59 0.0001Advertisements that show the problems associated with gambling 39.53% 41.36% 19.12% 18.64 0.0009Parent/Guardian not permitting card games (for money) at home 59.69% 25.88% 14.43% 38.53 0.0001Not having access to Internet gambling at home 35.95% 32.75% 31.30% 46.44 0.0001
mean ± s.d.Total number of methods endorsed 11.88 ± 4.14
G, H or I

Table 22 Internet and family gambling and peer pressure, total sample
No of times visited gambling website without gambling None 71.96% Once 9.76% 2-6 9.91% 7-11 2.45% 12-16 80.00% 17 or more 5.12%Gambling of a close family member caused worry or concern Never 88.19% Currently a problem 3.24% In the past but not now 8.58%Pressured by peers to gamble Never 85.67% Once 6.79% 2-3 times 4.72% 4-6 times 0.98% 7 or more times 1.84%

Table 23 Internet and family gambling and peer pressure by region
Region 1 Region 2 Region 3 Region 4 Region 5χ2 p
No of times visited gambling website without gambling 23.51 0.2645 None 71.47% 71.53% 70.10% 75.36% 70.49% Once 8.70% 10.12% 4.12% 10.27% 9.32% 2-6 9.78% 10.41% 13.40% 7.90% 9.51% 7-11 2.72% 2.42% 2.06% 1.58% 3.50% 12-16 1.36% 0.79% 1.03% 0.47% 0.78% 17 or more 5.98% 4.72% 9.28% 4.42% 6.41%Gambling of a close family member caused worry or concern 10.04 0.2625 Never 91.17% 87.87% 83.84% 89.41% 86.96% Currently a problem 2.28% 3.36% 5.05% 2.09% 3.11% In the past but not now 6.55% 8.50% 11.11% 8.51% 9.92%Pressured by peers to gamble 25.02 0.0694 Never 89.52% 86.39% 81.63% 85.65% 80.54% Once 4.25% 6.53% 10.20% 7.26% 8.48% 2-3 times 4.53% 4.51% 4.08% 4.68% 5.97% 4-6 times 0.57% 0.93% 2.04% 0.81% 1.54% 7 or more times 1.13% 1.64% 2.04% 1.61% 3.47%

Table 24 Internet and family gambling and peer pressure by DRG
A, B or C D, E or F G, H or Iχ2 p
No of times visited gambling website without gambling 15.94 0.1013 None 70.87% 70.97% 74.08% Once 10.40% 9.04% 10.46% 2-6 9.62% 10.64% 9.00% 7-11 2.34% 3.05% 1.62% 12-16 0.91% 0.83% 0.69% 17 or more 5.85% 5.48% 4.15%Gambling of a close family member caused worry or concern 15.83 0.0033 Never 90.55% 88.98% 85.60% Currently a problem 1.86% 3.33% 3.91% In the past but not now 7.59% 7.69% 10.49%Pressured by peers to gamble 32.71 0.0001 Never 85.77% 83.14% 89.43% Once 6.65% 7.76% 5.40% 2-3 times 5.85% 5.33% 3.13% 4-6 times 0.66% 1.24% 0.78% 7 or more times 1.06% 2.53% 1.25%
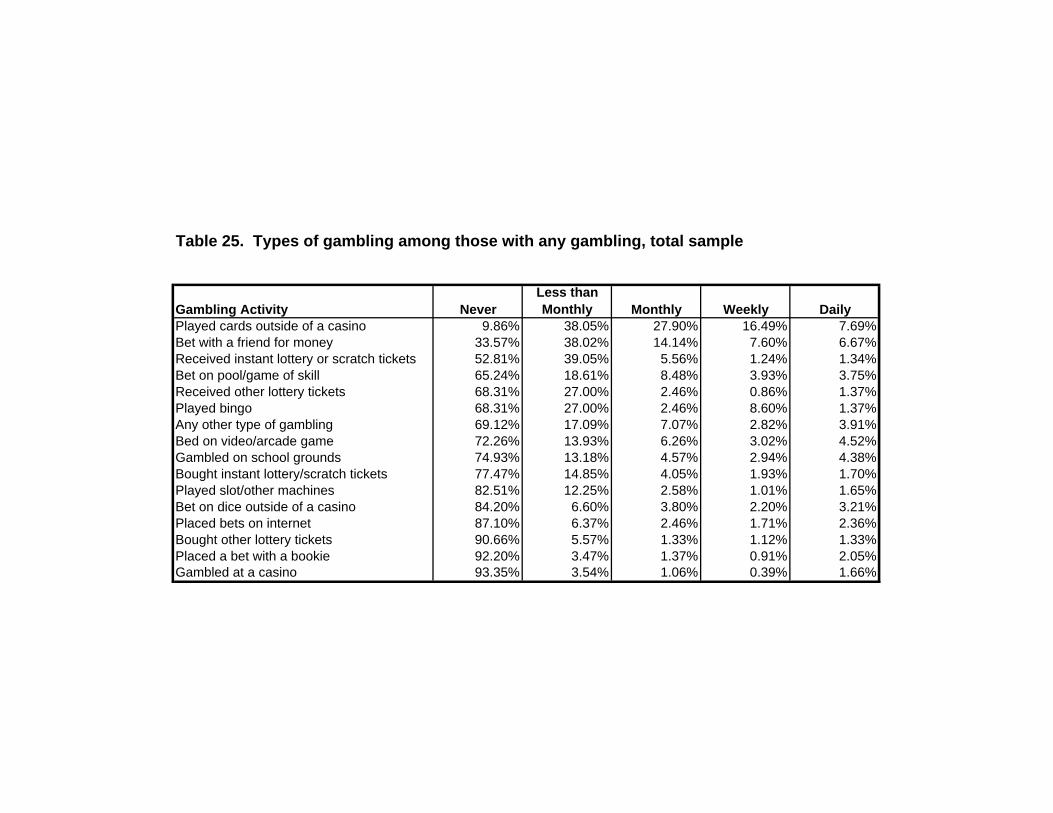
Table 25. Types of gambling among those with any gambling, total sample
Gambling Activity NeverLess than Monthly Monthly Weekly Daily
Played cards outside of a casino 9.86% 38.05% 27.90% 16.49% 7.69%Bet with a friend for money 33.57% 38.02% 14.14% 7.60% 6.67%Received instant lottery or scratch tickets 52.81% 39.05% 5.56% 1.24% 1.34%Bet on pool/game of skill 65.24% 18.61% 8.48% 3.93% 3.75%Received other lottery tickets 68.31% 27.00% 2.46% 0.86% 1.37%Played bingo 68.31% 27.00% 2.46% 8.60% 1.37%Any other type of gambling 69.12% 17.09% 7.07% 2.82% 3.91%Bed on video/arcade game 72.26% 13.93% 6.26% 3.02% 4.52%Gambled on school grounds 74.93% 13.18% 4.57% 2.94% 4.38%Bought instant lottery/scratch tickets 77.47% 14.85% 4.05% 1.93% 1.70%Played slot/other machines 82.51% 12.25% 2.58% 1.01% 1.65%Bet on dice outside of a casino 84.20% 6.60% 3.80% 2.20% 3.21%Placed bets on internet 87.10% 6.37% 2.46% 1.71% 2.36%Bought other lottery tickets 90.66% 5.57% 1.33% 1.12% 1.33%Placed a bet with a bookie 92.20% 3.47% 1.37% 0.91% 2.05%Gambled at a casino 93.35% 3.54% 1.06% 0.39% 1.66%

Table 26. Types of gambling among those with any gambling by region
Gambling Activity Never
Less than
Monthly Monthly Weekly Daily Never
Less than
Monthly Monthly Weekly DailyBought instant lottery/scratch tickets 81.0% 14.6% 2.1% 1.5% 0.9% 76.3% 14.4% 4.9% 2.2% 2.2%Bought other lottery tickets 92.4% 5.5% 0.3% 1.2% 0.6% 89.7% 5.7% 1.8% 1.3% 1.6%Received instant lottery or scratch tickets 52.5% 42.9% 3.5% 0.3% 0.9% 52.6% 37.4% 6.7% 1.7% 1.6%Received other lottery tickets 74.6% 22.5% 1.5% 0.9% 0.6% 74.1% 19.7% 3.9% 0.9% 1.3%Played bingo 70.3% 27.4% 1.2% 0.3% 0.9% 68.9% 25.9% 2.8% 0.9% 1.6%Played slot/other machines 83.4% 13.4% 1.2% 0.9% 1.2% 81.7% 11.9% 3.3% 1.3% 1.9%Played cards outside of a casino 7.0% 44.3% 33.4% 12.3% 2.9% 9.7% 36.1% 27.1% 17.5% 9.5%Placed bets on internet 85.7% 9.0% 2.6% 87.0% 1.8% 86.3% 6.3% 2.4% 2.1% 2.9%Gambled on school grounds 79.3% 15.2% 2.6% 1.2% 1.8% 75.2% 12.2% 4.4% 3.0% 5.2%Placed a bet with a bookie 95.6% 2.3% 0.6% 0.6% 0.9% 91.2% 3.8% 1.5% 1.0% 2.4%Bet with a friend for money 33.8% 40.5% 16.3% 8.2% 1.2% 35.5% 36.0% 13.2% 7.6% 7.8%Bet on video/arcade game 70.6% 15.7% 7.9% 3.8% 2.0% 71.6% 14.3% 5.7% 3.0% 5.4%Bet on dice outside of a casino 93.6% 3.2% 1.2% 0.6% 1.5% 82.8% 6.6% 4.5% 2.2% 4.0%Bet on pool/game of skill 61.7% 26.0% 7.0% 3.8% 1.5% 65.9% 16.4% 9.1% 3.9% 4.7%Gambled at a casino 94.7% 3.2% 0.6% 0.3% 1.2% 92.8% 3.5% 1.4% 0.4% 1.9%Any other type of gambling 63.3% 24.3% 7.6% 2.4% 2.4% 69.9% 15.9% 6.9% 2.9% 4.4%
Region 1 Region 2

Table 26. Types of gambling among those with any gambling by region
Gambling Activity Never
Less than
Monthly Monthly Weekly Daily Never
Less than
Monthly Monthly Weekly DailyBought instant lottery/scratch tickets 81.7% 15.4% 1.9% 1.0% 0.0% 80.3% 14.3% 2.8% 1.5% 1.1%Bought other lottery tickets 98.1% 1.0% 1.0% 0.0% 0.0% 91.6% 5.4% 0.7% 1.2% 1.2%Received instant lottery or scratch tickets 57.3% 35.9% 6.8% 0.0% 0.0% 61.6% 33.7% 3.3% 0.2% 1.3%Received other lottery tickets 76.9% 17.3% 3.9% 1.0% 1.0% 78.2% 18.5% 1.5% 0.7% 1.2%Played bingo 68.6% 27.5% 2.9% 0.0% 1.0% 63.4% 32.5% 2.5% 0.7% 1.0%Played slot/other machines 81.7% 16.4% 1.0% 0.0% 1.0% 86.3% 10.6% 1.8% 0.3% 1.0%Played cards outside of a casino 10.6% 34.6% 37.5% 13.5% 3.9% 13.7% 40.7% 26.2% 13.7% 5.9%Placed bets on internet 88.4% 6.8% 1.9% 1.0% 1.9% 90.7% 5.4% 1.6% 0.7% 1.6%Gambled on school grounds 76.7% 15.5% 2.9% 2.9% 1.9% 78.6% 12.1% 4.4% 2.6% 2.3%Placed a bet with a bookie 92.2% 5.9% 0.9% 0.0% 0.9% 95.1% 2.3% 0.7% 1.0% 1.0%Bet with a friend for money 30.1% 39.8% 17.5% 4.9% 7.8% 29.6% 43.9% 14.5% 6.8% 5.2%Bet on video/arcade game 69.9% 14.6% 9.7% 1.9% 3.9% 72.3% 14.6% 6.1% 3.0% 4.1%Bet on dice outside of a casino 91.4% 4.8% 1.0% 1.0% 1.9% 84.6% 6.9% 3.6% 2.3% 2.6%Bet on pool/game of skill 69.2% 19.2% 5.8% 3.9% 1.9% 68.6% 19.9% 6.7% 2.2% 2.5%Gambled at a casino 95.2% 3.9% 0.0% 0.0% 1.0% 93.6% 3.9% 0.8% 0.2% 1.5%Any other type of gambling 72.1% 17.3% 8.7% 1.0% 1.0% 72.0% 16.4% 5.6% 3.1% 3.0%
Region 3 Region 4

Table 26. Types of gambling among those with any gambling by region
Gambling Activity Never
Less than
Monthly Monthly Weekly Daily χ2 pBought instant lottery/scratch tickets 76.1% 17.3% 3.7% 2.0% 1.0% 27.03 0.0412Bought other lottery tickets 91.3% 6.2% 1.0% 4.0% 1.2% 22.22 0.1362Received instant lottery or scratch tickets 42.7% 51.1% 4.3% 1.2% 0.8% 80.41 0.0001Received other lottery tickets 75.5% 21.3% 2.0% 0.4% 0.8% 23.67 0.0971Played bingo 70.3% 25.0% 2.0% 1.4% 1.4% 21.30 0.1674Played slot/other machines 81.3% 14.1% 1.8% 1.0% 2.0% 25.38 0.0634Played cards outside of a casino 7.6% 40.3% 27.8% 18.6% 5.7% 68.07 0.0001Placed bets on internet 87.1% 6.1% 3.5% 2.2% 1.2% 26.16 0.0518Gambled on school grounds 66.0% 17.1% 7.0% 4.3% 5.6% 52.47 0.0001Placed a bet with a bookie 91.0% 3.7% 2.3% 0.8% 2.1% 25.71 0.0583Bet with a friend for money 30.2% 38.2% 16.0% 83.8% 6.8% 45.87 0.0001Bet on video/arcade game 77.0% 10.4% 7.0% 2.7% 2.9% 25.71 0.0583Bet on dice outside of a casino 82.4% 9.0% 3.3% 3.3% 2.0% 46.55 0.0001Bet on pool/game of skill 59.7% 21.7% 9.4% 6.1% 3.1% 53.46 0.0001Gambled at a casino 94.2% 3.5% 0.2% 0.8% 1.4% 14.68 0.5483Any other type of gambling 65.3% 18.3% 8.8% 2.9% 4.7% 31.09 0.0131
Region 5

Table 27. Types of gambling among those with any gambling by DRG
Gambling Activity NeverLess than Monthly Monthly Weekly Daily Never
Less than Monthly Monthly Weekly Daily
Bought instant lottery/scratch tickets 78.6% 16.1% 3.0% 1.7% 0.7% 75.5% 15.6% 4.5% 2.3% 2.1%Bought other lottery tickets 91.6% 6.1% 0.7% 1.2% 0.4% 90.1% 5.4% 1.6% 1.2% 1.7%Received instant lottery or scratch tickets 51.2% 44.4% 3.6% 0.3% 0.6% 46.1% 44.1% 6.7% 1.5% 1.7%Received other lottery tickets 73.1% 24.3% 1.4% 0.8% 0.4% 71.9% 22.0% 3.8% 0.8% 1.5%Played bingo 63.1% 33.8% 2.1% 0.4% 0.6% 69.7% 25.1% 2.5% 0.7% 1.9%Played slot/other machines 83.9% 13.2% 1.5% 0.7% 0.7% 80.7% 13.1% 2.7% 1.1% 2.3%Played cards outside of a casino 8.9% 40.1% 32.1% 14.0% 4.8% 9.0% 38.1% 27.9% 17.7% 7.3%Placed bets on internet 88.6% 7.4% 2.1% 0.8% 1.1% 85.8% 6.2% 3.1% 2.3% 2.6%Gambled on school grounds 77.3% 15.0% 3.9% 2.1% 1.8% 73.3% 12.9% 4.7% 3.7% 5.5%Placed a bet with a bookie 95.6% 2.2% 0.7% 1.0% 0.6% 90.6% 3.8% 1.9% 1.1% 2.6%Bet with a friend for money 30.1% 43.7% 16.0% 7.7% 2.5% 35.0% 36.9% 13.8% 7.6% 6.7%Bed on video/arcade game 74.0% 14.4% 6.5% 2.9% 2.2% 75.9% 12.8% 5.5% 1.9% 3.6%Bet on dice outside of a casino 90.4% 5.0% 2.2% 1.2% 1.2% 83.9% 7.0% 3.4% 2.4% 3.3%Bet on pool/game of skill 64.4% 23.3% 7.7% 2.9% 1.8% 66.1% 17.3% 8.4% 4.4% 3.9%Gambled at a casino 94.5% 3.9% 0.7% 0.1% 0.8% 92.9% 3.4% 1.2% 0.6% 2.0%Any other type of gambling 66.1% 22.5% 7.0% 2.8% 1.7% 67.4% 17.8% 7.7% 3.0% 4.1%
A, B or C D, E or F
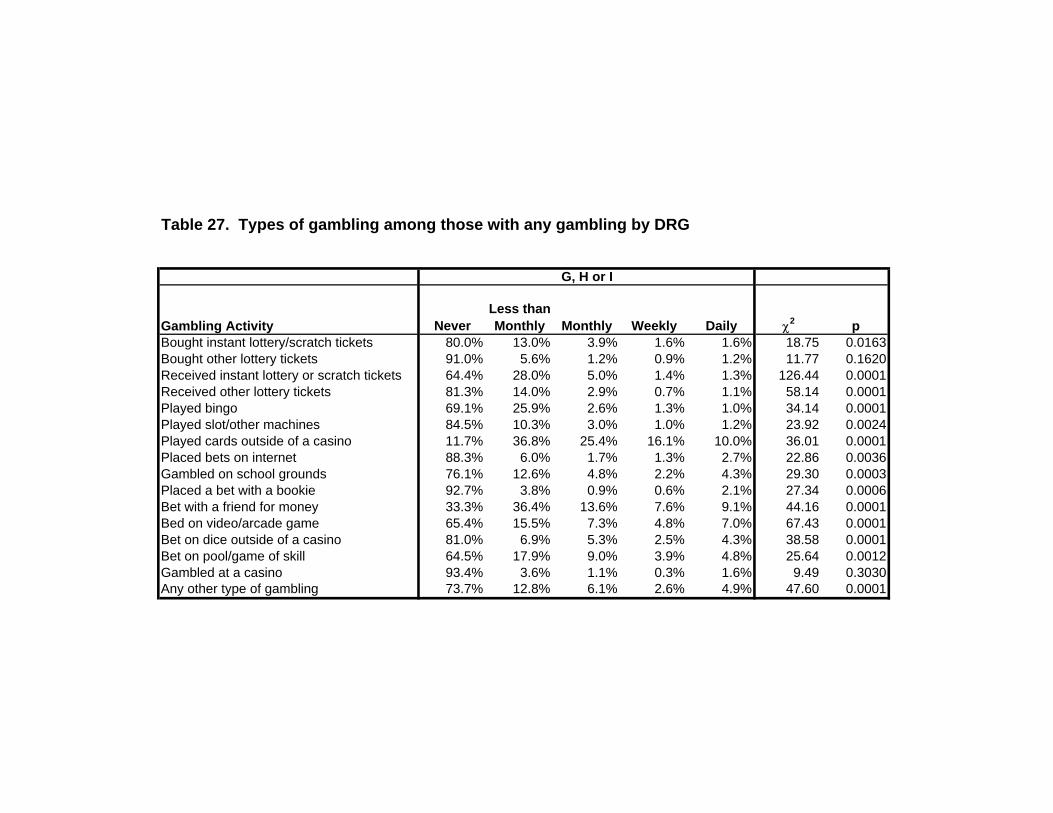
Table 27. Types of gambling among those with any gambling by DRG
Gambling Activity NeverLess than Monthly Monthly Weekly Daily χ2 p
Bought instant lottery/scratch tickets 80.0% 13.0% 3.9% 1.6% 1.6% 18.75 0.0163Bought other lottery tickets 91.0% 5.6% 1.2% 0.9% 1.2% 11.77 0.1620Received instant lottery or scratch tickets 64.4% 28.0% 5.0% 1.4% 1.3% 126.44 0.0001Received other lottery tickets 81.3% 14.0% 2.9% 0.7% 1.1% 58.14 0.0001Played bingo 69.1% 25.9% 2.6% 1.3% 1.0% 34.14 0.0001Played slot/other machines 84.5% 10.3% 3.0% 1.0% 1.2% 23.92 0.0024Played cards outside of a casino 11.7% 36.8% 25.4% 16.1% 10.0% 36.01 0.0001Placed bets on internet 88.3% 6.0% 1.7% 1.3% 2.7% 22.86 0.0036Gambled on school grounds 76.1% 12.6% 4.8% 2.2% 4.3% 29.30 0.0003Placed a bet with a bookie 92.7% 3.8% 0.9% 0.6% 2.1% 27.34 0.0006Bet with a friend for money 33.3% 36.4% 13.6% 7.6% 9.1% 44.16 0.0001Bed on video/arcade game 65.4% 15.5% 7.3% 4.8% 7.0% 67.43 0.0001Bet on dice outside of a casino 81.0% 6.9% 5.3% 2.5% 4.3% 38.58 0.0001Bet on pool/game of skill 64.5% 17.9% 9.0% 3.9% 4.8% 25.64 0.0012Gambled at a casino 93.4% 3.6% 1.1% 0.3% 1.6% 9.49 0.3030Any other type of gambling 73.7% 12.8% 6.1% 2.6% 4.9% 47.60 0.0001
G, H or I

Table 28. Adult gambling behavior and attitudes among those with any gambling, total sample
%Parents feelings about gambling in next 12 months Strongly disapprove 20.33% Disapprove 27.88% Neither approve or disapprove 45.11% Approve 4.28% Strongly approve 2.41%Number of peers you think gamble too much None 54.63% One 9.71% 2-3 17.44% 4-6 6.96% 7-9 2.31% 10 or more 8.94%Heard adults at school talking about their own gambling Never 59.54% A few times a year 27.99% Once or twice per month 5.75% Once or twice per week 4.04% Once or twice per day 2.68%Teacher presented information about problem gambling and risks of gambling Never 46.34% Once 18.05% 2-3 24.61% 4-6 5.53% 7-9 1.73% 10 or more 3.73%What happens when caught first time gambling at school Nothing 6.20% Warning from teacher/principal 17.10% Detention 7.42% Suspension 14.43% Expulsion 1.13% Don't know 53.73%
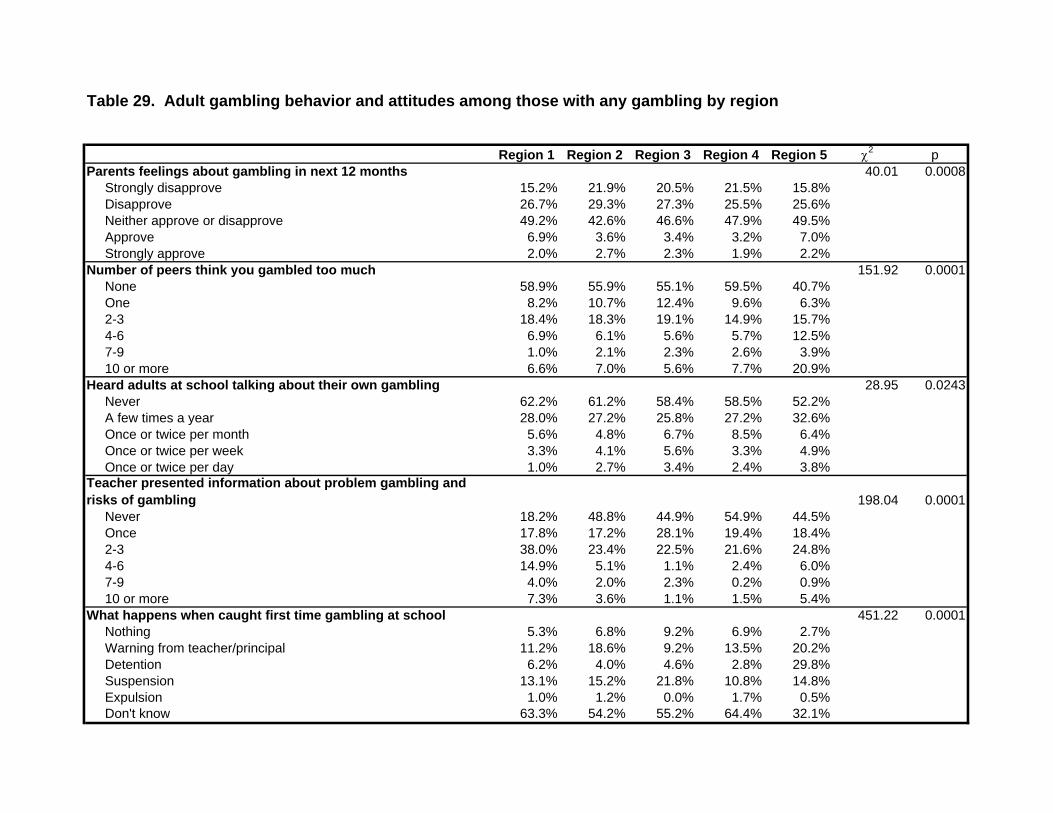
Table 29. Adult gambling behavior and attitudes among those with any gambling by region
Region 1 Region 2 Region 3 Region 4 Region 5 χ2 pParents feelings about gambling in next 12 months 40.01 0.0008 Strongly disapprove 15.2% 21.9% 20.5% 21.5% 15.8% Disapprove 26.7% 29.3% 27.3% 25.5% 25.6% Neither approve or disapprove 49.2% 42.6% 46.6% 47.9% 49.5% Approve 6.9% 3.6% 3.4% 3.2% 7.0% Strongly approve 2.0% 2.7% 2.3% 1.9% 2.2%Number of peers think you gambled too much 151.92 0.0001 None 58.9% 55.9% 55.1% 59.5% 40.7% One 8.2% 10.7% 12.4% 9.6% 6.3% 2-3 18.4% 18.3% 19.1% 14.9% 15.7% 4-6 6.9% 6.1% 5.6% 5.7% 12.5% 7-9 1.0% 2.1% 2.3% 2.6% 3.9% 10 or more 6.6% 7.0% 5.6% 7.7% 20.9%Heard adults at school talking about their own gambling 28.95 0.0243 Never 62.2% 61.2% 58.4% 58.5% 52.2% A few times a year 28.0% 27.2% 25.8% 27.2% 32.6% Once or twice per month 5.6% 4.8% 6.7% 8.5% 6.4% Once or twice per week 3.3% 4.1% 5.6% 3.3% 4.9% Once or twice per day 1.0% 2.7% 3.4% 2.4% 3.8%Teacher presented information about problem gambling and risks of gambling 198.04 0.0001 Never 18.2% 48.8% 44.9% 54.9% 44.5% Once 17.8% 17.2% 28.1% 19.4% 18.4% 2-3 38.0% 23.4% 22.5% 21.6% 24.8% 4-6 14.9% 5.1% 1.1% 2.4% 6.0% 7-9 4.0% 2.0% 2.3% 0.2% 0.9% 10 or more 7.3% 3.6% 1.1% 1.5% 5.4%What happens when caught first time gambling at school 451.22 0.0001 Nothing 5.3% 6.8% 9.2% 6.9% 2.7% Warning from teacher/principal 11.2% 18.6% 9.2% 13.5% 20.2% Detention 6.2% 4.0% 4.6% 2.8% 29.8% Suspension 13.1% 15.2% 21.8% 10.8% 14.8% Expulsion 1.0% 1.2% 0.0% 1.7% 0.5% Don't know 63.3% 54.2% 55.2% 64.4% 32.1%

Table 30. Adult gambling behavior and attitudes among those with any gambling by DRG
A, B, or C D, E or F G, H, or I χ2 pParents feelings about gambling in next 12 months 47.86 0.0001 Strongly disapprove 14.6% 19.2% 26.0% Disapprove 26.9% 28.0% 28.3% Neither approve or disapprove 52.0% 45.7% 39.5% Approve 5.0% 4.0% 4.2% Strongly approve 1.7% 3.0% 1.9%Number of peers you think gamble too much 47.20 0.0001 None 60.1% 50.4% 58.0% One 9.0% 9.2% 11.0% 2-3 17.3% 18.1% 16.4% 4-6 6.0% 8.2% 5.6% 7-9 1.4% 2.7% 2.3% 10 or more 6.3% 11.3% 6.8%Heard adults at school talking about their own gambling 16.39 0.0372 Never 58.9% 60.2% 58.6% A few times a year 29.3% 27.4% 28.1% Once or twice per month 7.6% 5.3% 5.3% Once or twice per week 2.8% 3.9% 5.0% Once or twice per day 1.4% 3.1% 2.8%Teacher presented information about problem gambling and risks of gambling 58.46 0.0001 Never 37.6% 44.9% 54.4% Once 19.0% 19.0% 15.9% 2-3 30.0% 24.6% 21.1% 4-6 7.9% 5.4% 4.3% 7-9 1.8% 1.8% 1.7% 10 or more 3.7% 4.4% 2.6%What happens when caught first time gambling at school 185.02 0.0001 Nothing 5.1% 6.5% 6.5% Warning from teacher/principal 13.2% 18.7% 17.1% Detention 4.8% 11.5% 2.4% Suspension 9.9% 11.8% 21.7% Expulsion 0.9% 0.5% 2.2% Don't know 66.2% 51.0% 50.1%

Table 31. Prevention attitudes among those with any gambling, total sample
Method for preventing gamblingVery
ImportantSomewhat Important
Not Important
Fear of losing valuable possessions, close friends, and relatives 66.9% 22.4% 10.7%Adults not involving kids in gambling 51.6% 32.3% 16.2%Participating in activities that are fun and free of gambling 45.8% 37.9% 16.3%Having parents who don't gamble 45.5% 34.7% 19.8%Checking IDs for purchasing lottery tickets 43.7% 39.0% 17.3%Parent/Guardian strictness about gambling 39.3% 41.5% 19.3%Learning about the risks of gambling from parents 38.7% 43.5% 17.8%Warnings from, or listening to, peers 37.5% 44.3% 18.3%Warnings from adults in family 37.3% 44.0% 18.8%Learning about the risks of gambling from peers 33.8% 44.8% 21.4%Hanging out with friends who don't gamble 33.5% 39.9% 26.7%Learning about the risks of gambling in school 31.9% 45.8% 22.3%Advertisements that show the problems associated with gambling 31.8% 46.6% 21.6%Parent/Guardian not permitting card games (for money) at home 28.5% 37.6% 33.9%Not having access to Internet gambling at home 26.4% 38.8% 34.8%
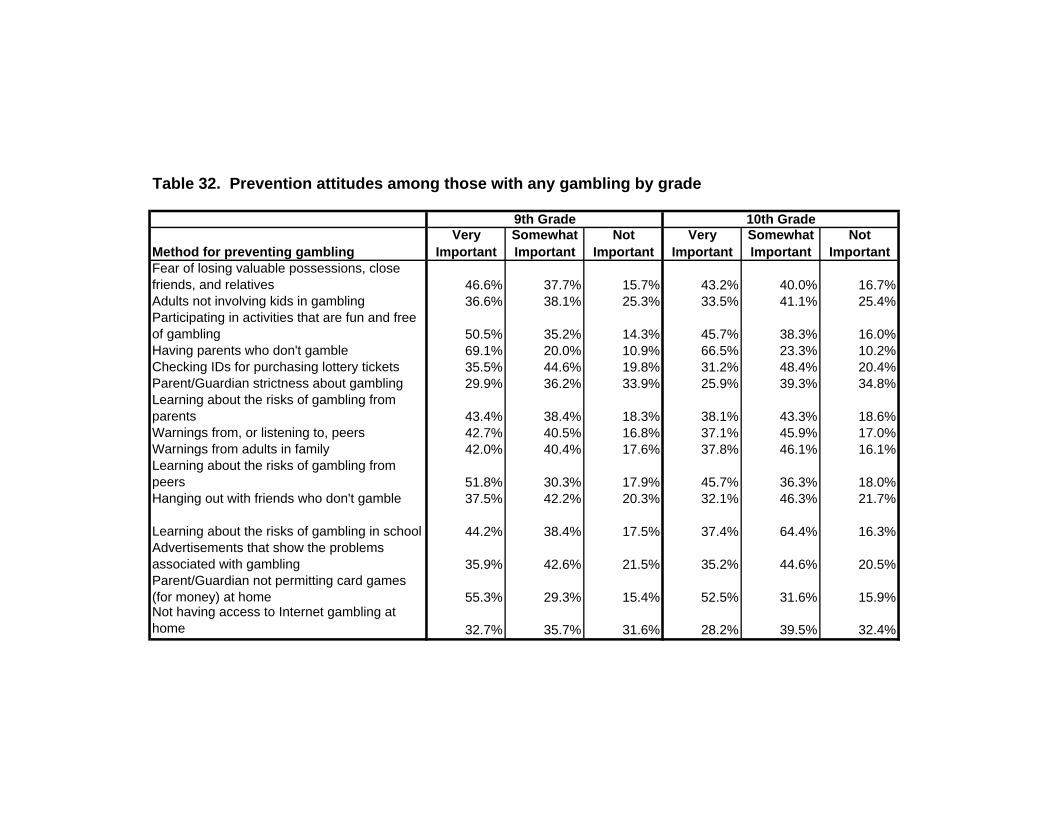
Table 32. Prevention attitudes among those with any gambling by grade
Method for preventing gamblingVery
ImportantSomewhat Important
Not Important
Very Important
Somewhat Important
Not Important
Fear of losing valuable possessions, close friends, and relatives 46.6% 37.7% 15.7% 43.2% 40.0% 16.7%Adults not involving kids in gambling 36.6% 38.1% 25.3% 33.5% 41.1% 25.4%Participating in activities that are fun and free of gambling 50.5% 35.2% 14.3% 45.7% 38.3% 16.0%Having parents who don't gamble 69.1% 20.0% 10.9% 66.5% 23.3% 10.2%Checking IDs for purchasing lottery tickets 35.5% 44.6% 19.8% 31.2% 48.4% 20.4%Parent/Guardian strictness about gambling 29.9% 36.2% 33.9% 25.9% 39.3% 34.8%Learning about the risks of gambling from parents 43.4% 38.4% 18.3% 38.1% 43.3% 18.6%Warnings from, or listening to, peers 42.7% 40.5% 16.8% 37.1% 45.9% 17.0%Warnings from adults in family 42.0% 40.4% 17.6% 37.8% 46.1% 16.1%Learning about the risks of gambling from peers 51.8% 30.3% 17.9% 45.7% 36.3% 18.0%Hanging out with friends who don't gamble 37.5% 42.2% 20.3% 32.1% 46.3% 21.7%
Learning about the risks of gambling in school 44.2% 38.4% 17.5% 37.4% 64.4% 16.3%Advertisements that show the problems associated with gambling 35.9% 42.6% 21.5% 35.2% 44.6% 20.5%Parent/Guardian not permitting card games (for money) at home 55.3% 29.3% 15.4% 52.5% 31.6% 15.9%Not having access to Internet gambling at home 32.7% 35.7% 31.6% 28.2% 39.5% 32.4%
9th Grade 10th Grade

Table 32. Prevention attitudes among those with any gambling by grade
Method for preventing gamblingVery
ImportantSomewhat Important
Not Important
Very Important
Somewhat Important
Not Important χ2 p
Fear of losing valuable possessions, close friends, and relatives 47.0% 36.2% 16.9% 44.4% 39.5% 16.2% 5.37 0.50Adults not involving kids in gambling 35.3% 41.3% 23.4% 33.1% 38.6% 28.3% 8.48 0.21Participating in activities that are fun and free of gambling 47.6% 37.5% 15.0% 43.6% 38.4% 18.0% 11.35 0.08Having parents who don't gamble 66.1% 24.4% 9.6% 64.7% 24.7% 10.7% 9.17 0.16Checking IDs for purchasing lottery tickets 32.4% 47.3% 20.3% 30.0% 45.2% 24.8% 13.08 0.04Parent/Guardian strictness about gambling 28.1% 39.8% 32.2% 25.0% 21.4% 33.6% 9.72 0.14Learning about the risks of gambling from parents 41.4% 41.3% 17.4% 36.9% 42.6% 20.5% 12.34 0.05Warnings from, or listening to, peers 38.3% 43.9% 17.7% 32.8% 45.9% 21.3% 21.79 0.00Warnings from adults in family 38.0% 44.6% 17.4% 34.0% 46.1% 19.9% 16.32 0.01Learning about the risks of gambling from peers 45.1% 35.5% 19.4% 42.7% 35.2% 22.1% 21.82 0.00Hanging out with friends who don't gamble 32.1% 47.6% 20.3% 28.7% 46.2% 25.1% 20.96 0.00
Learning about the risks of gambling in school 39.5% 45.0% 15.6% 36.5% 43.4% 20.2% 25.04 0.00Advertisements that show the problems associated with gambling 36.2% 45.6% 18.2% 30.8% 47.0% 22.2% 10.30 0.11Parent/Guardian not permitting card games (for money) at home 53.9% 32.2% 13.9% 48.5% 34.1% 17.4% 10.51 0.10Not having access to Internet gambling at home 30.2% 37.0% 32.8% 26.9% 38.7% 34.4% 9.94 0.13
12th Grade11th Grade

Table 33 Prevention attitudes among those with any gambling by race
Very Important
Somewhat Important Not Important
Very Important
Somewhat Important Not Important
Method for preventing gamblingFear of losing valuable possessions, close friends, and relatives 46.63% 32.21% 21.15% 44.10% 40.47% 15.43%Adults not involving kids in gambling 40.10% 33.09% 26.81% 33.14% 41.50% 25.36%Participating in activities that are fun and free of gambling 49.15% 32.69% 18.16% 46.55% 39.16% 14.29%Having parents who don't gamble 63.44% 20.10% 16.46% 68.13% 22.63% 9.24%Checking IDs for purchasing lottery tickets 37.84% 37.84% 24.32% 30.71% 48.96% 20.33%Parent/Guardian strictness about gambling 27.90% 34.07% 38.02% 27.03% 40.14% 32.83%Learning about the risks of gambling from parents 44.20% 34.32% 21.48% 38.75% 43.31% 17.93%Warnings from, or listening to, peers 45.54% 35.40% 19.06% 36.13% 46.39% 17.48%Warnings from adults in family 42.04% 36.07% 21.89% 37.02% 46.13% 16.85%Learning about the risks of gambling from peers 51.12% 24.94% 23.94% 45.89% 35.77% 18.34%Hanging out with friends who don't gamble 39.95% 35.48% 24.57% 30.59% 47.81% 21.60%Learning about the risks of gambling in school 48.89% 32.59% 18.52% 37.14% 45.82% 17.04%Advertisements that show the problems associated with gambling 37.50% 37.50% 25.00% 33.66% 46.42% 19.92%Parent/Guardian not permitting card games (for money) at home 53.62% 24.69% 21.70% 53.18% 32.73% 14.09%Not having access to Internet gambling at home 36.50% 28.75% 34.75% 28.05% 39.64% 32.31%
African American White

Table 33 Prevention attitudes among those with any gambling by race
Very Important
Somewhat Important Not Important
Method for preventing gamblingFear of losing valuable possessions, close friends, and relatives 48.18% 37.96% 13.87%Adults not involving kids in gambling 41.48% 37.04% 21.48%Participating in activities that are fun and free of gambling 43.70% 34.07% 22.22%Having parents who don't gamble 52.24% 33.58% 14.18%Checking IDs for purchasing lottery tickets 34.81% 41.48% 23.71%Parent/Guardian strictness about gambling 25.93% 43.70% 30.37%Learning about the risks of gambling from parents 37.50% 45.59% 16.91%Warnings from, or listening to, peers 44.03% 36.57% 19.40%Warnings from adults in family 43.28% 38.06% 18.66%Learning about the risks of gambling from peers 48.18% 29.93% 21.90%Hanging out with friends who don't gamble 28.89% 50.37% 20.74%Learning about the risks of gambling in school 37.50% 47.06% 15.44%Advertisements that show the problems associated with gambling 33.82% 45.59% 20.59%Parent/Guardian not permitting card games (for money) at home 42.54% 37.31% 20.15%Not having access to Internet gambling at home 33.33% 34.07% 32.59%
Asian
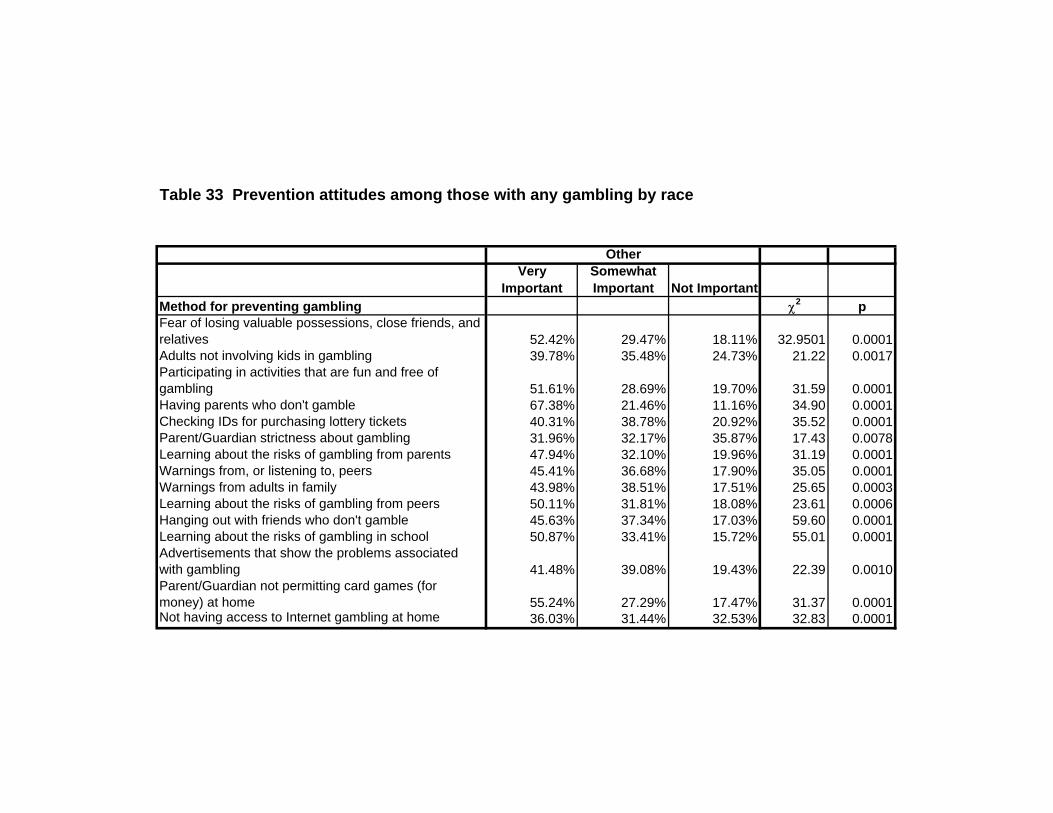
Table 33 Prevention attitudes among those with any gambling by race
Very Important
Somewhat Important Not Important
Method for preventing gambling χ2 pFear of losing valuable possessions, close friends, and relatives 52.42% 29.47% 18.11% 32.9501 0.0001Adults not involving kids in gambling 39.78% 35.48% 24.73% 21.22 0.0017Participating in activities that are fun and free of gambling 51.61% 28.69% 19.70% 31.59 0.0001Having parents who don't gamble 67.38% 21.46% 11.16% 34.90 0.0001Checking IDs for purchasing lottery tickets 40.31% 38.78% 20.92% 35.52 0.0001Parent/Guardian strictness about gambling 31.96% 32.17% 35.87% 17.43 0.0078Learning about the risks of gambling from parents 47.94% 32.10% 19.96% 31.19 0.0001Warnings from, or listening to, peers 45.41% 36.68% 17.90% 35.05 0.0001Warnings from adults in family 43.98% 38.51% 17.51% 25.65 0.0003Learning about the risks of gambling from peers 50.11% 31.81% 18.08% 23.61 0.0006Hanging out with friends who don't gamble 45.63% 37.34% 17.03% 59.60 0.0001Learning about the risks of gambling in school 50.87% 33.41% 15.72% 55.01 0.0001Advertisements that show the problems associated with gambling 41.48% 39.08% 19.43% 22.39 0.0010Parent/Guardian not permitting card games (for money) at home 55.24% 27.29% 17.47% 31.37 0.0001Not having access to Internet gambling at home 36.03% 31.44% 32.53% 32.83 0.0001
Other

Table 34 Prevention attitudes among those with any gambling by gender
Very Important
Somewhat Important
Not Important
Very Important
Somewhat Important
Not Important
Method for preventing gambling χ2 pFear of losing valuable possessions, close friends, and relatives 42.09% 37.84% 20.08% 48.54% 38.36% 13.11% 39.2018 <.0001Adults not involving kids in gambling 32.39% 38.10% 29.51% 37.15% 41.07% 21.78% 32.2033 <.0001Participating in activities that are fun and free of gambling 39.25% 40.34% 20.41% 54.28% 34.36% 11.36% 109.6511 <.0001Having parents who don't gamble 60.77% 25.31% 13.91% 72.26% 20.47% 7.27% 72.0924 <.0001Checking IDs for purchasing lottery tickets 28.13% 45.56% 26.32% 36.58% 47.11% 16.31% 69.2884 <.0001Parent/Guardian strictness about gambling 24.32% 37.57% 38.12% 30.40% 39.71% 29.89% 34.2538 <.0001Learning about the risks of gambling from parents 38.01% 39.87% 22.12% 42.60% 42.05% 15.35% 30.8545 <.0001Warnings from, or listening to, peers 35.22% 43.06% 21.72% 41.31% 44.34% 14.36% 39.9698 <.0001Warnings from adults in family 32.84% 44.99% 22.17% 43.41% 43.13% 13.46% 71.9825 <.0001Learning about the risks of gambling from peers 39.14% 36.61% 24.24% 53.63% 32.06% 14.31% 101.5318 <.0001Hanging out with friends who don't gamble 28.37% 44.37% 27.27% 37.43% 46.17% 16.40% 79.2423 <.0001
Learning about the risks of gambling in school 36.77% 41.38% 21.84% 42.72% 44.36% 12.92% 56.8401 <.0001Advertisements that show the problems associated with gambling 29.42% 44.02% 26.56% 39.61% 45.21% 15.18% 92.0721 <.0001Parent/Guardian not permitting card games (for money) at home 45.14% 34.05% 20.81% 59.93% 29.22% 10.85% 111.1373 <.0001Not having access to Internet gambling at home 28.10% 36.06% 35.84% 31.60% 38.66% 29.73% 17.0781 0.0002
Male Female

Table 35 Problem/pathological gambling (PPG) by demographics
Characteristic Not at risk At riskProblem/
pathological χ2 pAge 11.97 0.4483 < 14 years 2.34% 2.65% 1.72% 14 years 9.87% 10.05% 9.44% 15 years 24.16% 28.57% 23.61% 16 years 27.45% 24.60% 26.61% 17 years 24.50% 20.63% 24.89% 18 years 10.65% 11.38% 10.73% 19 and older 1.04% 2.12% 3.00%Gender Male 56.52% 79.41% 79.91% 91.87 0.0001 Female 43.48% 20.59% 20.09%Race Black 8.79% 13.23% 17.60% 22.98 0.0008 White 75.00% 73.81% 61.80% 21.81 0.0013 Asian 4.48% 3.70% 8.15% 14.73 0.0225 Other 15.69% 14.02% 20.17% 12.31 0.0554Hispanic/Latino(a) 14.79% 13.41% 27.85% 25.6 0.0001Income Public assistance 1.24% 1.63% 12.44% 101.37 0.0001 Low income 6.11% 4.62% 7.56% Middle income 52.04% 51.90% 39.11% High income 13.19% 14.40% 18.67% "Don't Know" 27.43% 27.45% 22.22%Grade 5.5 0.4811 9th 28.94% 33.60% 30.17% 10th 24.61% 24.34% 25.86% 11th 27.82% 22.49% 25.43% 12th 18.63% 19.58% 18.53%
DSM Summary group

Table 36 Protective factors by Problem/pathological gambling (PPG) and any gambling
Not at risk At riskProblem/
pathological χ2 pGrade Average 72.21 0.0001 Mostly A's 22.37% 17.81% 18.83% Mostly B's 32.18% 32.60% 21.97% B's and C's 33.16% 33.70% 36.32% C's and D's 10.17% 12.05% 9.42% D's or lower 2.12% 3.84% 13.45%Regular Activities Community service/volunteer work 25.34% 20.37% 24.46% 6.92 0.3287 Team sports 53.10% 62.17% 53.22% 43.3 0.0001 School clubs 28.45% 21.16% 22.32% 24.22 0.0005 Church activities 14.40% 16.40% 21.89% 18.75 0.0046Paid part-time job 53.60% 52.94% 59.65% 3.13 0.2089Lives with 65.81 0.0001 Two parents 69.59% 73.51% 59.29% One parent 24.98% 20.00% 24.34% Foster family 0.53% 1.89% 6.64% Grandparents 1.67% 1.62% 3.10% Other relatives 1.67% 1.89% 1.77% Other 1.58% 1.08% 4.87%
DSM Summary group

Table 37 Problem/Pathological Gambling (PPG) by types of gambling
Gambling activity Not at risk At riskProblem/
pathological χ2 pBet with a friend for money 77.44% 90.48% 90.09% 44.73 0.0001Played cards outside of a casino 89.26% 94.96% 89.57% 11.03 0.004Any other type of gambling 39.71% 62.03% 79.22% 149.47 0.0001Bet on pool/game of skill 43.96% 67.47% 78.79% 131.2 0.0001Gambled on school grounds 30.54% 61.17% 73.17% 213.44 0.0001Bet on video/arcade game 30.30% 53.64% 68.26% 150.26 0.0001Bet on dice outside of a casino 17.27% 34.67% 65.09% 235.56 0.0001Received instant lottery or scratch tickets 50.56% 58.62% 62.66% 15.77 0.0004Received other lottery tickets 25.15% 38.03% 52.59% 76.85 0.0001Bought instant lottery/scratch tickets 25.54% 36.83% 52.36% 71.01 0.0001Placed bets on internet 13.98% 26.01% 51.97% 169.09 0.0001Played slot/other machines 20.66% 29.68% 50.65% 91.38 0.0001Placed a bet with a bookie 6.07% 16.71% 45.02% 255.4 0.0001Bought other lottery tickets 9.47% 14.36% 44.00% 176.55 0.0001Played bingo 29.31% 31.91% 41.92% 14.1 0.0009Gambled at a casino 6.23% 9.12% 39.66% 218.48 0.0001Average number of types endorsed 5.14 ± 0.10 7.20 ± 0.17 9.77 ± 0.21 217.16 0.0001
DSM Summary group

Table 38 Problem/Pathological Gambling (PPG) by gambling behavior and age of onset
Not at risk At riskProblem/
pathological χ2 pTurned away from a casino 6.90% 11.38% 34.76% 147.85 0.0001Feel pressure to gamble 4.74% 10.58% 33.48% 182.12 0.0001Hours spent gambling 317.14 0.0001 1 hour or less 91.42% 77.35% 46.22% 2-7 6.31% 17.13% 26.22% 8-13 0.66% 2.49% 6.22% 14 hours or more 1.60% 3.04% 21.33%Tension/anxiety relieved by gambling 1.42% 3.76% 37.50% 400.8 0.0001Reasons for gambling Fun and entertainment 64.31% 83.07% 77.25% 2347.21 0.0001 Excitement 31.47% 59.79% 65.67% 1491.5 0.0001 Boredom 22.07% 29.89% 42.49% 793.42 0.0001 To win money 49.57% 77.51% 77.68% 1986.96 0.0001 It's a challenge 21.72% 35.98% 46.78% 903.52 0.0001 To calm 1.98% 5.82% 23.61% 537.35 0.0001 To feel good about self 6.72% 11.90% 31.76% 567.04 0.0001 To socialize with friends 36.81% 51.06% 50.21% 1298.72 0.0001 Peer pressure 2.33% 2.12% 20.60% 490.44 0.0001 To support good causes 4.48% 8.99% 20.17% 382.99 0.0001 It's a hobby 8.79% 21.69% 39.48% 761.56 0.0001 As a distraction from problems 1.81% 5.56% 27.90% 675.39 0.0001Age first gambled 81.91 0.0001 8 years or younger 12.69% 12.13% 32.00% 9-11 years 14.87% 17.79% 19.56% 12-14 years 37.46% 44.20% 25.33% 15-17 years 21.51% 25.61% 21.33% 18 years or older 2.48% 0.27% 1.78%Usually gambled with Alone 5.69% 10.58% 30.90% 590.54 0.0001 With friends 77.84% 88.62% 75.97% 2832.67 0.0001 Parents 17.76% 26.46% 31.33% 676.63 0.0001 Other adults 10.43% 20.37% 32.19% 615.61 0.0001 Family 37.93% 46.83% 33.05% 1202.82 0.0001 Strangers 4.31% 10.32% 35.62% 770.27 0.0001 Brothers and sisters 24.74% 37.57% 33.91% 868.72 0.0001
DSM Summary group

Table 39 Problem/Pathological Gambling (PPG) by adult behaviors and attitudes
Not at risk At riskProblem/
pathological χ2 p
Parents feelings about gambling in next 12 months 150 0.0001 Strongly disapprove 12.18% 8.28% 22.92% Disapprove 19.39% 22.39% 22.40% Neither approve or disapprove 58.07% 58.59% 29.17% Approve 7.92% 7.98% 6.25% Strongly approve 2.44% 2.76% 19.27%Number of peers you think gamble too much 80.78 0.0001 None 56.46% 46.95% 37.93% One 10.37% 8.54% 6.90% 2-3 15.46% 21.04% 12.32% 4-6 7.24% 8.54% 12.32% 7-9 2.15% 4.27% 4.93% 10 or more 8.32% 10.67% 25.62%Heard adults at school talking about their own gambling 119.01 0.001 Never 58.56% 44.55% 35.15% A few times a year 27.46% 34.24% 25.25% Once or twice per month 6.20% 10.61% 11.88% Once or twice per week 5.02% 6.36% 10.40% Once or twice per day 2.76% 4.24% 17.33%Teacher presented information about problem gambling and risks of gambling 34.36 0.0002 Never 49.26% 47.71% 49.51% Once 16.06% 16.21% 11.17% 2-3 21.77% 24.16% 15.05% 4-6 6.21% 5.50% 8.74% 7-9 2.27% 2.75% 2.91% 10 or more 4.43% 3.67% 12.62%What happens when caught first time gambling at school 81.35 0.0001 Nothing 7.88% 5.86% 26.13% Warning from teacher/principal 19.64% 22.53% 15.58% Detention 8.67% 10.19% 8.54% Suspension 14.16% 18.52% 16.08% Expulsion 1.40% 1.54% 2.01% Don't know 48.26% 41.36% 31.66%
DSM Summary group
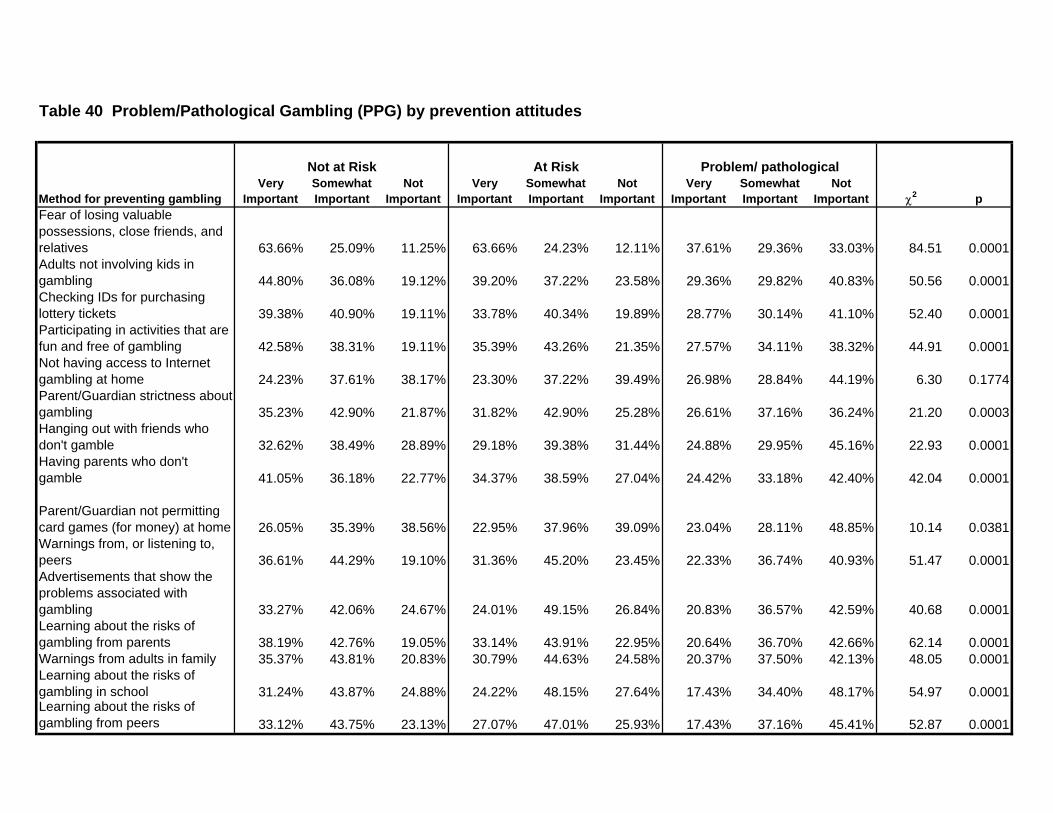
Table 40 Problem/Pathological Gambling (PPG) by prevention attitudes
Method for preventing gamblingVery
ImportantSomewhat Important
Not Important
Very Important
Somewhat Important
Not Important
Very Important
Somewhat Important
Not Important χ2 p
Fear of losing valuable possessions, close friends, and relatives 63.66% 25.09% 11.25% 63.66% 24.23% 12.11% 37.61% 29.36% 33.03% 84.51 0.0001Adults not involving kids in gambling 44.80% 36.08% 19.12% 39.20% 37.22% 23.58% 29.36% 29.82% 40.83% 50.56 0.0001Checking IDs for purchasing lottery tickets 39.38% 40.90% 19.11% 33.78% 40.34% 19.89% 28.77% 30.14% 41.10% 52.40 0.0001Participating in activities that are fun and free of gambling 42.58% 38.31% 19.11% 35.39% 43.26% 21.35% 27.57% 34.11% 38.32% 44.91 0.0001Not having access to Internet gambling at home 24.23% 37.61% 38.17% 23.30% 37.22% 39.49% 26.98% 28.84% 44.19% 6.30 0.1774Parent/Guardian strictness about gambling 35.23% 42.90% 21.87% 31.82% 42.90% 25.28% 26.61% 37.16% 36.24% 21.20 0.0003Hanging out with friends who don't gamble 32.62% 38.49% 28.89% 29.18% 39.38% 31.44% 24.88% 29.95% 45.16% 22.93 0.0001Having parents who don't gamble 41.05% 36.18% 22.77% 34.37% 38.59% 27.04% 24.42% 33.18% 42.40% 42.04 0.0001
Parent/Guardian not permitting card games (for money) at home 26.05% 35.39% 38.56% 22.95% 37.96% 39.09% 23.04% 28.11% 48.85% 10.14 0.0381Warnings from, or listening to, peers 36.61% 44.29% 19.10% 31.36% 45.20% 23.45% 22.33% 36.74% 40.93% 51.47 0.0001Advertisements that show the problems associated with gambling 33.27% 42.06% 24.67% 24.01% 49.15% 26.84% 20.83% 36.57% 42.59% 40.68 0.0001Learning about the risks of gambling from parents 38.19% 42.76% 19.05% 33.14% 43.91% 22.95% 20.64% 36.70% 42.66% 62.14 0.0001Warnings from adults in family 35.37% 43.81% 20.83% 30.79% 44.63% 24.58% 20.37% 37.50% 42.13% 48.05 0.0001Learning about the risks of gambling in school 31.24% 43.87% 24.88% 24.22% 48.15% 27.64% 17.43% 34.40% 48.17% 54.97 0.0001Learning about the risks of gambling from peers 33.12% 43.75% 23.13% 27.07% 47.01% 25.93% 17.43% 37.16% 45.41% 52.87 0.0001
Not at Risk At Risk Problem/ pathological

Table 41 Problem/Pathological Gambling (PPG) by internet and family gambling
Not at risk At risk
Problem/ pathological χ2 p
No of times visited gambling website without gambling 202.16 0.0001 None 67.89% 48.71% 30.95% Once 9.70% 11.46% 11.43% 2-6 12.34% 19.48% 14.29% 7-11 3.30% 5.44% 6.67% 12-16 1.13% 3.15% 3.33% 17 or more 5.65% 11.75% 33.33%Gambling of a close family member caused worry or concern 64.55 0.0001 never 90.22% 83.52% 76.78% currently a problem 2.16% 2.56% 11.85% in the past but not now 7.62% 13.92% 11.37%Pressured by peers to gamble 229.71 0.0001 never 86.86% 74.07% 49.05% once 6.24% 11.11% 11.43% 2-3 times 4.82% 9.12% 16.19% 4-6 times 1.23% 1.71% 5.71% 7 or more times 0.85% 3.99% 17.62%
DSM Summary group

Table 42 Gambling behavior and attitudes among frequent gamblers (weekly or daily)
No Yes χ2 pTurned away from a casino 3.58% 14.39% 166.8 0.0001Feel pressure to gamble 2.75% 11.23% 129.13 0.0001Hours spent gambling 1 hour or less 96.95% 69.43% 315.7 0.0001 2-7 1.73% 20.17% 8-13 0.16% 3.08% 14 hours or more 1.15% 7.32%Tension/anxiety relieved by gambling 1.88% 10.68% 90.26 0.0001Reasons for gambling Fun and entertainment 19.83% 53.85% 520.07 0.0001 Excitement 9.57% 37.18% 495.48 0.0001 Boredom 6.94% 21.95% 217.62 0.0001 To win money 15.11% 49.40% 586.75 0.0001 It's a challenge 5.79% 27.07% 404.79 0.0001 To calm 0.94% 6.41% 118.52 0.0001 To feel good about self 1.91% 11.84% 203.36 0.0001 To socialize with friends 10.51% 33.41% 345.85 0.0001 Peer pressure 0.59% 5.58% 119.07 0.0001 To support good causes 1.47% 7.47% 112.17 0.0001 It's a hobby 1.81% 18.02% 402.68 0.0001 As a distraction from problems 0.84% 7.16% 147.93 0.0001Age first gambled 34.11 0.0001 8 years or younger 12.31% 19.84% 9-11 years 14.29% 17.91% 12-14 years 38.33% 35.15% 15-17 years 32.06% 26.08% 18 years or older 3.02% 1.02%Usually gambled with Alone 2.06% 9.88% 145.84 0.0001 With friends 23.27% 58.60% 5256.41 0.0001 Parents 5.19% 17.65% 193.11 0.0001 Other adults 2.69% 15.46% 263.04 0.0001 Family 11.35% 27.83% 193.35 0.0001 Strangers 1.19% 11.24% 247.62 0.0001 Brothers and sisters 6.94% 23.83% 264.23 0.0001
Frequent Gambler

Table 43 Adult attitudes and behavior by frequent gambling
No Yes χ2 p
How parents would feel about gambling in next year 192.38 0.0001 Strongly disapprove 25.36% 15.36% Disapprove 31.01% 21.72% Neither approve or disapprove 39.68% 50.84% Approve 3.25% 6.09% Strongly approve 0.70% 5.99%How many of peers think gamble too much 62.28 0.0001 None 58.56% 49.63% One 9.28% 9.78% 2-3 17.01% 16.82% 4-6 6.96% 7.31% 7-9 1.78% 3.38% 10 or more 6.42% 13.07%How often have heard adults at school talk about their gambling 167.46 0.0001 Never 65.33% 50.36% A few times a year 26.60% 28.56% Once or twice per month 4.21% 8.39% Once or twice per week 2.81% 6.39% Once or twice per day 1.04% 6.30%
Times in middle/high school teacher presented information on problem gambling and risks of gambling 45.84 0.0001 Never 45.47% 50.27% Once 18.96% 15.63% 2-3 26.15% 20.29% 4-6 5.30% 5.76% 7-9 1.47% 2.10% 10 or more 2.65% 5.94%What happens when caught first time gambling at school 79.96 0.0001 Nothing 4.61% 9.87% Warning from teacher/principal 15.94% 17.71% Detention 6.44% 8.67% Suspension 13.49% 17.44% Expulsion 1.01% 1.57% Don't know 58.51% 44.74%
Frequent Gambler
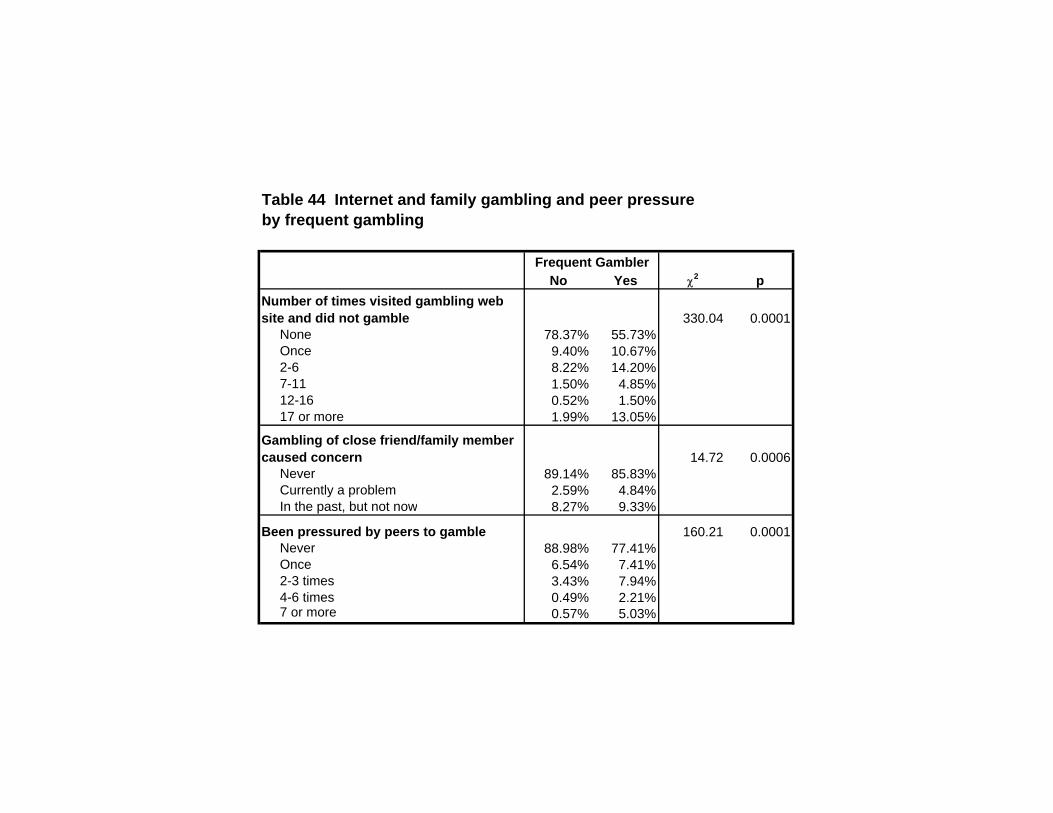
Table 44 Internet and family gambling and peer pressure by frequent gambling
No Yes χ2 pNumber of times visited gambling web site and did not gamble 330.04 0.0001 None 78.37% 55.73% Once 9.40% 10.67% 2-6 8.22% 14.20% 7-11 1.50% 4.85% 12-16 0.52% 1.50% 17 or more 1.99% 13.05%
Gambling of close friend/family member caused concern 14.72 0.0006 Never 89.14% 85.83% Currently a problem 2.59% 4.84% In the past, but not now 8.27% 9.33%
Been pressured by peers to gamble 160.21 0.0001 Never 88.98% 77.41% Once 6.54% 7.41% 2-3 times 3.43% 7.94% 4-6 times 0.49% 2.21% 7 or more 0.57% 5.03%
Frequent Gambler

Age at first gambling Yes No χ2 p35.843 0.0001
8 years or younger 41.88% 58.12%9-11 years 40.86% 59.14%12-14 years 33.33% 66.67%15-17 years 24.40% 75.60%18 years or older 23.53% 76.47%
Received lottery tickets as a gift
Table 45 Association between age of onset of gambling and receiving lottery tickets as a gift