gallagher et al 1998
DESCRIPTION
geocronologiaTRANSCRIPT

P1: NBL/RPK/dat/ary P2: ARK/plb QC: ARK/abe T1: ARK
March 25, 1998 14:59 Annual Reviews AR055-15
Annu. Rev. Earth Planet. Sci. 1998. 26:519–72Copyright c© 1998 by Annual Reviews. All rights reserved
FISSION TRACK ANALYSISAND ITS APPLICATIONS TOGEOLOGICAL PROBLEMS
Kerry GallagherT. H. Huxley School of Environment, Earth Science, and Engineering, ImperialCollege of Science, Technology and Medicine, South Kensington, London, EnglandSW7 2AS United Kingdom; e-mail: [email protected]
Roderick BrownDepartment of Earth Sciences, La Trobe University, Bundoora, Victoria, Australia3083; e-mail: [email protected]
Christopher JohnsonT. H. Huxley School of Environment, Earth Science, and Engineering, ImperialCollege of Science, Technology and Medicine, South Kensington, London, EnglandSW7 2AS United Kingdom; e-mail: [email protected]
KEY WORDS: thermochronology, denudation, provenance, sedimentary basins, thermal historymodeling, orogenic belts, passive margins
ABSTRACT
Fission track analysis as a geological dating tool was first proposed in the early1960s. The past 10 years has seen a major expansion in application to more generalgeological problems. This reflects advances in understanding the temperaturedependence of fission track annealing and of the information contained in fissiontrack length distributions. Fission track analysis provides detailed informationon the low-temperature thermal histories of rocks, below∼120◦C for tracks inapatite and below∼350◦C for zircon. Fission track analysis has been appliedto a variety of geological problems, including sedimentary provenance, thermalhistory modeling of sedimentary basins, structural evolution of orogenic belts,and long-term continental denudation.
5190084-6597/98/0515-0519$08.00

P1: NBL/RPK/dat/ary P2: ARK/plb QC: ARK/abe T1: ARK
March 25, 1998 14:59 Annual Reviews AR055-15
520 GALLAGHER ET AL
FISSION TRACKS AND FISSION TRACK ANALYSIS
When charged nuclear particles travel through insulating solids, they leave lin-ear trails of disrupted atoms, which reflect intense damage on the atomic scale.Fission tracks are such damage features, and fission track analysis is the studyand characterization of these features in minerals. Natural or “spontaneoustracks” in geological samples are produced nearly exclusively by the sponta-neous fission of the isotope238U, as the fission half-lives of all other naturallyoccurring heavy isotopes such as235U and 232Th are too long to produce asignificant number of tracks.
The currently preferred model for the formation of fission tracks is the ionspike explosion model (Fleischer et al 1975), summarized in Figure 1. Al-though this is probably the most widely accepted model of track formation,Chadderton (1988) considered the physical processes operating at the momentof track formation in terms of classical and quantum mechanics. He empha-sized the difficulties associated with accounting for all the possible eventuali-ties in fragment-atom collisions along the track trajectory. Moreover, in orderto predict the anatomy of an unetched, or latent track, an accurate crystallo-graphic model of the solid in which it forms is needed. For these reasons, theion spike explosion model should be regarded as a first approximation of thetrack-forming process, and much work clearly remains for development of acomprehensive theory of track formation.
The application of fission track analysis in a wide variety of fields, includinggeology, was pioneered in the early 1960s by Fleischer, Price, and Walker atGeneral Electric Company’s Research Laboratories in New York State. Theirseminal text,Nuclear Tracks in Solids; Principles and Applications, publishedin 1975, summarized 15 years of research in the subject. This research wasmotivated by the first transmission electron microscope observations of latentfission tracks in mica by Silk & Barnes in 1959. The immense progress madeby Fleischer, Price, and Walker was triggered by the discovery that spontaneous
−−−−−−−−−−−−−−−−−−−−−−−−−−−−−−−−−−−−−−−−−−−−−−−−−−−−−−→Figure 1 Cartoon representation of the ion spike explosion model and the formation of fissiontracks in a mineral. (a) Trace amounts of radioactive238U are present in the crustal lattice (darkcircles). These are inherently unstable as a result of the atomic structure of238U. (b) Spontaneousfission of238U produces two highly charged heavy particles and releases about 200 MeV of energy.The frequency of fission events is low, about 1 for every 2× 10⁶ alpha-particle decay events. Themasses of the two highly charged particles generally differ, with mass numbers in the ranges∼85–105 and∼130–150. The highly charged particles recoil as a result of Coulomb repulsion andinteract with other atoms in the lattice initially by electron stripping or ionization. This leads tofurther deformation of the lattice as the ionized lattice atoms repel each other. (c) As the fissionparticles capture electrons, they slow down and begin to interact by atomic collisions, furtherreducing the particles’ energy until they come to rest, leaving a damage trail or fission track. Thesecannot be observed optically unless chemically etched.

P1: NBL/RPK/dat/ary P2: ARK/plb QC: ARK/abe T1: ARK
March 25, 1998 14:59 Annual Reviews AR055-15
FISSION TRACK ANALYSIS 521
fission tracks in natural micas could be observed optically after etching in hy-drofluoric acid. Latent (i.e. unetched) fission tracks, observed with a transmis-sion electron microscope, are generally only between 3 and 14 nm in width(Figure 2a; Paul & Fitzgerald 1992). However, the process of chemical etchingopens up the track so that they can be observed optically (Figure 2b). Theetchable width and length of a fission track depends on the actual mineraland the nature of the chemical etchant. It is extremely important to develop awell-calibrated and consistent sample preparation technique, and all published

P1: NBL/RPK/dat/ary P2: ARK/plb QC: ARK/abe T1: ARK
March 25, 1998 14:59 Annual Reviews AR055-15
522 GALLAGHER ET AL
(b)
(a)
Figure 2 (a) Transmission electron microscope images of an unetched fission track in fluorapatite(from Paul & Fitzgerald 1992; reproduced with permission from the Mineralogical Society ofAmerica). (b) Photomicrograph of a polished and etched prismatic section through an apatitecrystal, showing etched surface intersecting tracks and a horizontal confined track (arrow). Theacid etchant reached the confined track through a large fracture. The long axis of the grain is∼150µm.

P1: NBL/RPK/dat/ary P2: ARK/plb QC: ARK/abe T1: ARK
March 25, 1998 14:59 Annual Reviews AR055-15
FISSION TRACK ANALYSIS 523
data should be accompanied by an adequate description of the etching proce-dure (e.g. Hurford 1990a,b). The details of the etching process are beyond thescope of our review, but useful summaries are given in chapter 3 of Fleischeret al (1975) and chapter 2 of Wagner & Van den Haute (1992).
FISSION TRACK DATING AND FISSIONTRACK AGE DATA
Given that fission tracks could be readily observed optically, albeit under highmagnification (∼×1200), and that the fission process occurs at a statisticallyconstant rate, it soon became apparent that fission tracks provided a practicalmethod of dating minerals. The major difference between fission track datingand other conventional isotopic dating methods is that the daughter product isphysical damage to the crystal lattice, rather than another isotope. In order tobe useful as a dating method, there needs to be a sufficient concentration of theparent (i.e.238U) to produce a detectable number of fission events. On the otherhand, too high a concentration of238U can result in so much fission-induceddamage that it is not possible to distinguish individual tracks. Fortunately,the appropriate range in concentration for accumulation over geological timescales (∼1–1000 ppm) is typical of relatively common minerals such as apatite[Ca5(PO4)3(F,Cl,OH)], zircon (ZrSiO4), and sphene [CaTiO(SiO4)].
Determining a Fission Track AgeFission track dating relies on the same general equation as any radioactivedecay scheme: It requires an estimate of the relative abundance of the parent anddaughter product, i.e. the number of238U atoms and the number of spontaneousfission tracks per unit volume. The latter is relatively straightforward—wecount the number of spontaneous fission tracks on a given surface of a mineralgrain. To determine the238U abundance, a similar track-counting approachis used. The sample is irradiated with low-energy thermal neutrons, whichinduce fission in235U. Higher energy neutrons induce unwanted fission from232Th and238U, for example, and this needs to be avoided. Provided we monitorthe thermal neutron flux, the number of “induced tracks” is indicative of theabundance of235U, and as the ratio235U/238U is constant in nature, we canestimate the abundance of238U.
In terms of the analytical procedure for age determination, two techniquesare in common usage—the population and external detector methods. The pop-ulation method (e.g. Carp´ena & Mailhe 1993; chapter 3 of Wagner & Van denHaute 1992) relies on measuring the spontaneous and induced track densitiesseparately on two aliquots from the same sample. This method implicitly as-sumes that the uranium distribution is uniform in the several hundred grains

P1: NBL/RPK/dat/ary P2: ARK/plb QC: ARK/abe T1: ARK
March 25, 1998 14:59 Annual Reviews AR055-15
524 GALLAGHER ET AL
analyzed. Moreover, this method neglects the useful geological informationcontained in distribution of single grain or crystal ages for an individual sam-ple, which is a severe limitation.
In our opinion, the preferred method is the external detector zeta (ζ ) calibra-tion. This method (see Figure 3) relies on the etching requirement for opticalrevelation of fission tracks. It avoids the assumption of uniform uranium dis-tribution in population of grains analyzed and also the uncertainties inherent inthe thermal flux and the fission decay constants (see Bigazzi 1981, Gleadow1981, Hurford & Green 1982, 1983, Green & Hurford 1984). Furthermore,this method is the Internation Union of Geological Sciences Working Group’srecommended approach (Hurford 1990a,b). A major advantage of the externaldetector method is that grains or crystals can be dated individually.
For the external detectorζ method, the fission track age equation is written as
t = 1
λdLn
(λdρs
ρiρdζg+ 1
), (1)
wheret is the age;ρs andρ i are the spontaneous and induced track densities(number of tracks/unit area);λd is theα decay constant of238U; ρd is the trackdensity in a dosimeter (a glass of known uranium concentration), which is usedto monitor the neutron flux in the reactor; g is known as the geometry factor(which allows for the fact that the spontaneous tracks intersecting the surfaceof observation represent a sample from twice the effective volume than theinduced tracks represent); andζ is a constant of proportionality made up ofthe other parameters, including the fission decay constant and neutron capturecross section. Theζ calibration factor is determined from a sample of knownage by rearranging Equation 1. In practice, an individual analyst will under-take around 30–50 calibrations to determine their own particularζ value for a
−−−−−−−−−−−−−−−−−−−−−−−−−−−−−−−−−−−−−−−−−−−−−−−−−−−−−−→Figure 3 The external detector method, after Hurford & Carter (1991). The surface of a givenmineral is polished and etched under appropriate conditions to reveal spontaneous (surface) tracksintersecting what was an internal surface. Tracks (confined) below the surface can also be revealedif there is a pathway for the etchant (a surface track, cleavage, or fracture). Then an essentiallyuranium-free detector (typically a plastic foil or muscovite mica) is sealed against this surface,and this sandwich is sent to a nuclear reactor. The sample is irradiated with low-energy thermalneutrons, which induces fission in235U. During the fission process, some heavy particles cross theinterface between the mineral and the mica, producing a mirror image of the original grain. Whenthe sample is returned to the laboratory, only the mica is etched to reveal the induced tracks. Bycounting the number of induced tracks in the mica, we estimate the uranium, or parent, concentrationof the mineral grain, whereas by counting the number of spontaneous tracks in the mineral, weestimate the concentration of the daughter product. A major advantage of this method is that fissiontrack ages are determined on individual grains.

P1: NBL/RPK/dat/ary P2: ARK/plb QC: ARK/abe T1: ARK
March 25, 1998 14:59 Annual Reviews AR055-15
FISSION TRACK ANALYSIS 525

P1: NBL/RPK/dat/ary P2: ARK/plb QC: ARK/abe T1: ARK
March 25, 1998 14:59 Annual Reviews AR055-15
526 GALLAGHER ET AL
given dosimeter. Thus,ζ also absorbs some of the vagaries of the observationprocess.
Typically, the fission track age is reported as some kind of average estimateof the individual (typically 20–40) single grain ages. There are three “mean”age estimates in common use: the mean, pooled, and central ages. As the rawdata are counts (i.e. numbers of induced and spontaneous tracks), then theappropriate probability distribution for the data is Poissonian. The pooled ageis simply the sum of the spontaneous counts divided by the sum of the inducedcounts, while the mean age is the arithmetic mean of the individual ratios ofspontaneous to induced tracks. The latter has been used when the distributionof counts are inconsistent with purely Poissonian variation (assessed with aconventionalχ2 test statistic). The central age is a more recent development(Galbraith & Laslett 1993) and is essentially the weighted mean of the lognormal distribution of single grain ages. When the variation in the count popu-lation is consistent with a Poisson distribution, then all three age estimates areessentially the same. Overall, the central age is the preferred sample age esti-mate, as it is more robust to outliers and non-Poissonian variations. In addition,however, the modern fission track analysis method can yield a large amount ofinformation in terms of the distribution of single grain age data. We discuss thecharacterization of single grain age distributions in a subsequent section.
FISSION TRACK LENGTH DATA
Fission tracks are metastable features that fade or anneal, which leads to short-ening of individual tracks. As a consequence of this track shortening, thefundamental parameter in fission track analysis is the track length.
When tracks form, they are randomly oriented in three-dimensional space.However, the measurements of track density used in age determinations isbased on a two-dimensional sample of tracks intersecting an internal surface(Figure 3). The importance of this sampling in terms of the meaning of a fissiontrack age was pointed out by Laslett et al (1982, 1984). In essence, the key pointis this: The probability of a long track intersecting a randomly selected surfaceis greater than the probability of a short track intersecting the same surface.Thus, as the fission track age is determined by counting the number of tracksintersecting a surface, we expect to get an older age for a sample with longertracks (all else being equal). This is why fission track ages are reduced astemperature increases. Tracks are shortened with increasing temperature; theprobability of seeing them decreases, so we count fewer; and the age estimatebecomes younger. Clearly, then, to understand what a fission track age means,we need to know the underlying track length distribution. Early experimentalwork identified several factors that may cause annealing, including temperature,

P1: NBL/RPK/dat/ary P2: ARK/plb QC: ARK/abe T1: ARK
March 25, 1998 14:59 Annual Reviews AR055-15
FISSION TRACK ANALYSIS 527
time, pressure, chemical solutions, and ionizing radiation (Fleischer et al 1965,Ahrens et al 1970, Gleadow 1978, Tagami et al 1990). Of these, temperature isthe most important for the minerals used commonly in geological applicationsand, combined with a secondary influence of time, leads to an Arrhenius-typerelationship for track length evolution after initial formation. Therefore, theshape of the distribution contains significant thermal history information.
Confined and Projected Track LengthsTracks lengths are typically measured using a digitizing tablet, with a cursorequipped with a high-intensity light-emitting diode (LED). The image of theLED can be seen in the microscope via a drawing tube attachment (e.g. Dumitru1993). By calibrating the digitizing tablet against a stage micrometer, it isstraightforward to measure the length of individual tracks observed under themicroscope.
There are two types of track length measurements: surface and confined (seeFigure 3). Surface tracks intersect the surface of observation for a particularcrystal. The true length of the remaining track (semi-track length) or its lengthprojected vertically up to the surface of the crystal (projected track length) isreadily measured, but there is the problem of how much of the track has beentruncated. Wagner (1988) and Wagner & Hejl (1991) have argued qualitativelythat the projected track length distribution contains detailed thermal historyinformation. However, Galbraith et al (1990) and Laslett et al (1994) posedthe problem mathematically and demonstrated that, in general, the amount ofthermal history information retrievable from projected track length distributionsis limited.
Confined tracks are those entirely below the surface (e.g. Bhandari et al1971, Laslett et al 1982, Gleadow et al 1986). The etchant reaches these tracksthrough some conduit such as a crack, cleavage, or surface intersecting track.There is an implicit bias against sampling shorter tracks, but the confined tracklength distribution yields the most direct and reproducible representation ofthe true track length distribution (Gleadow et al 1986, Green et al 1989b).Theconvention is to measure lengths of horizontal confined tracks (or tracks within∼15◦ of horizontal). These tracks are readily identified, as they have a dis-tinctive appearance in reflected light (a strong backscattered image) and tendto be more or less simultaneously in focus along the total length. The obviousadvantage of using confined horizontal tracks is that we see the full etchablelength of the track.
As well as measuring the length, it is becoming more common to measure theangle of the track with respect to some reference orientation (e.g. Laslett et al1982, Green et al 1986, Galbraith & Laslett 1988, Galbraith et al 1990, Donelick1991). This is because both the etching and track shortening, or annealing,

P1: NBL/RPK/dat/ary P2: ARK/plb QC: ARK/abe T1: ARK
March 25, 1998 14:59 Annual Reviews AR055-15
528 GALLAGHER ET AL
processes can be anisotropic with respect to the crystallographic axes. In apatite,for example, annealing is relatively slow, but etching is relatively fast for tracksparallel to the c-crystallographic axis. To date, relatively little has been done toquantify this anisotropy, and it remains an area for future experimental work.
Individual confined track length data can be measured to a precision of∼0.2µm (Green et al 1986), and typically 50–150 individual track length mea-surements are made. The data are usually reported in terms of the mean standarddeviation and a representative length distribution, generally a histogram, binnedat 1-µm intervals.
FISSION TRACK ANNEALING
Fission tracks shorten irreversibly, or anneal, when the host mineral is at anelevated temperature, as a consequence of a thermally activated diffusion pro-cess that is poorly understood. The temperature range over which annealingoccurs varies for different minerals and also depends on the heating rate (seeAppendix B of Wagner & Van den Haute 1992). The most commonly analyzedminerals are apatite, zircon, and sphene, with the emphasis on the first two. Weonly consider these two here and focus specifically on apatite.
The concept of a closure temperature (e.g. Dodson 1973) for the fission tracksystem, i.e. the temperature of the system at the time given by its apparent age,is generally an oversimplification. For example, 110± 10◦C is commonlyadopted for the nominal closure temperature of apatite, yet geological examplesindicate that significant annealing occurs over a temperature range of at least60◦C (e.g. Gleadow & Duddy 1981), and this range is generally referred to asthe partial annealing zone, or PAZ (e.g. Wagner 1979b). The 60◦C range forapatite is a minimum range, as it is well known that the mean of a distribution ofinduced tracks in apatite is 1–1.5µm longer than spontaneous tracks measuredfrom samples that are considered to have been at near-surface temperatures sincetheir formation (e.g. Green 1988). This suggests that some annealing occursat near-surface temperatures over geological time scales. Donelick et al (1990)demonstrated that some annealing of induced tracks in apatite occurs at roomtemperature over time scales of minutes to a few weeks, although the length oftracks seems to stabilize after this. Overall, the rate of annealing depends ontemperature, time, and the track length through a strongly nonlinear relationship(e.g. Laslett et al 1987, Carlson 1990, Crowley et al 1991, Laslett & Galbraith1996), and it is likely that the dominant process changes as annealing progresses.
Annealing Characteristics of ApatiteA landmark for the application of apatite fission track data to geological prob-lems was a comprehensive suite of well-controlled laboratory experiments,

P1: NBL/RPK/dat/ary P2: ARK/plb QC: ARK/abe T1: ARK
March 25, 1998 14:59 Annual Reviews AR055-15
FISSION TRACK ANALYSIS 529
which were conducted to constrain the annealing characteristics of track lengthsin apatite, in particular Durango apatite from Mexico (Green et al 1986, 1989a,b,Laslett et al 1987, Duddy et al 1988). The experiments were performed underboth isothermal and variable temperature conditions, with heating durationsbetween 20 min and 500 days and temperatures between 95◦ and 400◦C.
The basic outcome of this work was a quantitative, albeit empirical, predic-tive model of fission track annealing, expressed in terms of the reduction intrack length for a given temperature over a particular time interval. The basicformulation is an Arrhenius-type model (i.e. dependent on inverse absolutetemperature and log of time) and is given by Laslett et al (1987). Extrapola-tion of Laslett et al’s (1987) Durango apatite model to geological time scales(106–108 years) predicts a partial annealing temperature range from∼60◦ to∼110◦C, with an uncertainty of about 10◦C.
Apatite composition may be an important control on annealing rate, partic-ularly the relative proportions of Cl, F, and OH. It has been known for sometime that Cl-apatite seems to be more resistant to annealing than F-apatite(Gleadow & Duddy 1981, Green et al 1986, Donelick 1991, O’Sullivan &Parrish 1995). Crowley et al (1991) have presented results of laboratory an-nealing experiments on F-apatite. Extrapolation of their preferred annealingmodel to geological time scales predicts F-apatite to be more resistant than themore Cl-rich Durango apatite (F/Cl ratio of∼0.1; Young et al 1969), in contrastto the geological observations. More recently, Laslett & Galbraith (1996) useda slightly different model parameterization than Crowley et al’s (1991), and thisnew model is consistent with the general observation that F-apatite is expectedto anneal more easily than the Durango apatite.
Relatively little is known about the role of other species such as OH andMn (Ravenhurst et al 1992, Bergman & Corrigan 1996). Burtner et al (1994)have presented data relating the degree of annealing to Cl composition and theetching characteristics of apatite (quantified in terms of the size and geometry ofetch pits). Recently, RA Donelick & RA Ketcham (personal communication)have developed an annealing model incorporating these factors, although thishas not been published at the time of writing. Barbarand et al (1997), usingcathodoluminescence spectroscopy, have recently identified an apparent controlin terms of lattice structure rather than F/Cl composition. They argue that thereare controls in addition to the compositional effects, such as crystallographicimperfections, and these are reflected in the etch pit geometries. It is still amatter of debate as to which annealing algorithm is most appropriate, and it islikely that no single model will be universally applicable. Currently, it is difficultto assess the importance of apatite chemistry and crystal structure quantitatively,and sufficient details of these factors, which may allow them to be incorporatedinto a single generalized annealing model, have not yet been published.

P1: NBL/RPK/dat/ary P2: ARK/plb QC: ARK/abe T1: ARK
March 25, 1998 14:59 Annual Reviews AR055-15
530 GALLAGHER ET AL
Annealing Characteristics of ZirconA limited number of similar annealing experiments have been performed onzircon (e.g. Hasebe et al 1994, Yamada et al 1995a,b, Tagami et al 1997). Thesewere based on zircons separated from the Nisatai Dacite, and the experimen-tal conditions were isothermal for temperatures between 350◦ and 750◦C fortime scales of 4.5 min to∼416 days). The most recent model formulation waspresented in Tagami et al (1997), who also examined the extrapolation of themodels to geological time scales (106–108 years; see Tagami et al 1996, Tagami& Shimada 1996). The extrapolation gave a range of temperatures for the PAZ(i.e. from 10 to 50% reduction in track length relative to the unannealed sample)of between 200◦ and∼350◦C. These estimates and additional recent experi-mental and geological evidence (Foster et al 1996, Green et al 1996, Johnson1996) are considerably higher than the∼175◦C effective closure temperaturereported by Harrison et al (1979), based on a comparison of the zircon data withother geochronological systems, but similar to the estimate of 240◦ ± 50◦C byHurford (1986). It is clear that not only more laboratory experimental workis desirable, but well-defined natural annealing case studies also are requiredto constrain the annealing characteristics of zircon before these models can bereliably applied in a geological context.
Application of Apatite Annealing Modelsto Geological Time ScalesOne of the problems inherent in current annealing models for apatite (beyondthe chemistry and crystallographic issues) is the extrapolation of laboratorymeasurements to geological time scales. Some geological studies are used tojustify the models a posteriori, but these arguments are somewhat unsatisfactory,as it is necessary to assume the geological thermal history. Consequently, somedebate still surrounds the details of which model is the most acceptable (Vrojliket al 1992, Carlson 1993a,b, Corrigan 1993, Crowley 1993a, Green et al 1993,Burtner et al 1994, Bergman & Corrigan 1996, Green 1996, Barbarand et al1997).
Accepting these limitations, predictive annealing models for apatite do allowquantitative reconstruction of thermal histories in the upper several kilometersof the Earth’s crust [i.e. up to temperatures of 120◦–130◦C on time scales of1–100 million years (My)]. These reconstructions can be generated by forwardmodeling (e.g. Duddy et al 1988, Green et al 1989a,b, Willet 1992, Crowley1993b) or, preferably, by some optimization procedure using the observed dataas constraints (e.g. Corrigan 1991, Lutz & Omar 1991, Gallagher 1995, Willet1997). The details of these methods can be found in the cited papers. The

P1: NBL/RPK/dat/ary P2: ARK/plb QC: ARK/abe T1: ARK
March 25, 1998 14:59 Annual Reviews AR055-15
FISSION TRACK ANALYSIS 531
important attribute of the fission track system is that it records information overa protracted temperature range, rather than just an estimate of the timing of aclosure temperature. In addition, because tracks are being formed continuously,each track experiences a different proportion of the total thermal history andtherefore contains different information. Figure 4 illustrates predicted apatitefission track parameters (age and length distribution) for a variety of thermalhistory scenarios, demonstrating how diagnostic the track length distributiondata can be. In principle, therefore, a relatively detailed thermal history can bequantified from one single fission track analysis, i.e. the single grain age andtrack length data. This is a significant advance in the application of the techniqueto understanding rates of geological processes in the upper few kilometers ofthe Earth’s crust.
APPLICATIONS OF FISSION TRACK ANALYSISTO GEOLOGICAL PROBLEMS
A variety of applications of fission track analysis exists, including the obviousapplication to dating rocks. Perhaps the most common application of fissiontrack analysis as a conventional dating method is for tephrachronology, i.e.dating Cenozoic volcanic glasses and glass shards (recent papers include thoseby Westgate 1989, Bigazzi et al 1993, Shane et al 1996). Fission track analysisof glasses has become popular because of a general lack of suitable phases onwhich to perform conventional isotopic dating. We do not consider this ap-plication further in this paper. Rather we concentrate on the applications thatexploit some of the features that were traditionally regarded as hindrances tothe fission track method as an absolute dating technique, i.e. the relatively lowtemperature stability of tracks and the fact that a single closure temperatureis generally inappropriate when interpreting fission track ages. We considerfour basic applications—provenance studies, thermal history analysis in sedi-mentary basins, the evolution of orogenic or mountain belts, and applicationsin nonorogenic settings. Dumitru (1997) provides a recent overview of theapplication of fission track data to Quaternary geochronology.
APPLICATION TO PROVENANCE STUDIES
Many sediments are derived from erosion of preexisting rocks, and therefore de-trital apatite and zircon grains can contain fission tracks that accumulated in theoriginal source rock. Weathering and physical erosion do not affect the reten-tion and stability of fission tracks (Gleadow & Lovering 1974), but the preser-vation of provenance-related tracks does depend on the temperature history

P1: NBL/RPK/dat/ary P2: ARK/plb QC: ARK/abe T1: ARK
March 25, 1998 14:59 Annual Reviews AR055-15
532 GALLAGHER ET AL
experienced by eroding source regions and subsequently by the sediment as thebasin evolves. The relatively low temperature stability of apatite means that thismineral has limited application, although it has been used in certain situations(e.g. Corrigan & Crowley 1992, Rohrmann et al 1995, Lonergan & Johnson1998). The problem is that the system is dominated by the burial history oncetemperatures of 60◦–70◦C are reached in the basin (typically equivalent to∼2km of burial). The higher temperature stability and generally robust resistance tophysical transport of zircon means it has been more widely used in provenance-related studies (e.g. McGoldrick & Gleadow 1977, Hurford et al 1984, Baldwin

P1: NBL/RPK/dat/ary P2: ARK/plb QC: ARK/abe T1: ARK
March 25, 1998 14:59 Annual Reviews AR055-15
FISSION TRACK ANALYSIS 533
et al 1986, Kowallis et al 1986, Cerveny et al 1988, Hurford & Carter 1991,Brandon & Vance 1992, Garver & Brandon 1994, Carter et al 1995a,b).
The external detector method (Figure 3) is particularly suited to provenancestudies because a fission track age can be obtained from individual grains (e.g.Hurford & Carter 1991). Provided enough single grains are analyzed, it ispossible to use fission track analysis to identify different age components insediments and relate these directly to source regions. The identification of dif-ferent sources allows some inferences about denudation rates and paleodrainagedirections (e.g. Hurford et al 1984, Baldwin et al 1986, Cerveny et al 1988,Garver & Brandon 1994, Carter et al 1995a). In order to achieve statisticallyuseful results, an adequate number of single grain ages should be obtained for agiven sample. Hurford et al (1984) and Garver & Brandon (1994), for example,use 50–100 grains, although Kowallis et al (1986) have suggested that as fewas 5–10 grains are sufficient if the provenance is simple. The optimal numberof grains is not fixed and depends on the degree of separation between modalages, the differing precision inherent in each mode, and the relative proportionsof grains in each population.
Age Component AnalysisEarly studies that considered provenance and sediment source regions reliedon a qualitative or graphical estimate of the different component ages in theoverall age distribution (e.g. Hurford et al 1984, Yim et al 1985, Baldwin et al
←−−−−−−−−−−−−−−−−−−−−−−−−−−−−−−−−−−−−−−−−−−−−−−−−−−−−−−Figure 4 Some simple thermal histories (heavy linesin upper panels) and the predicted tracklength parameters (lower panels) for Durango apatite, using the annealing model of Laslett et al(1987). These model simulations have 20 tracks, formed at equal time increments over the totalduration of the thermal history. The evolving reduced track lengths are shown (refer to the upperpanel right axis labeled l/lo, i.e. present track length divided by the initial length). Thetwohorizontal linesat 60◦ and 110◦C are typical of the range of the partial annealing zone (PAZ) andare included here primarily as a guide to the eye. See Duddy et al (1988), Green et al (1989a,b),Corrigan (1991), and Crowley (1993b) for details of the calculation procedure. (a) Linear heating.All tracks have more or less the same length at present, as they all experience the same maximumpaleotemperature. The track length distribution is unimodal, symmetrical, and has a short meanlength. The fission track age does not relate to any discrete event. (b) Linear cooling. Each trackexperiences a different maximum paleotemperature as cooling progresses, and this is reflected in thecharacteristic negatively skewed length distribution. Again, the age does not relate to any discreteevent. (c) Rapid cooling. As nearly all tracks are formed after the cooling episode, they all arerelatively long. In this case, the fission track age is a reasonable indication of the timing of cooling,compared with the age estimate for (b), for example. (d) Heating/cooling. The tracks formedduring the heating period have similar lengths, while those formed after reflect the progressivecooling. The track length distribution is typically bimodal, and once again, the fission track agedoes not relate directly to the timing of cooling or timing of maximum paleotemperature.

P1: NBL/RPK/dat/ary P2: ARK/plb QC: ARK/abe T1: ARK
March 25, 1998 14:59 Annual Reviews AR055-15
534 GALLAGHER ET AL
1986, Kowallis et al 1986). These graphical methods apply a Gaussian kernel toeach datum to generate a total probability density function for visual inspection.This graphical approach is restricted in that overlap of different age componentstends to shift peaks and masks low-amplitude peaks (e.g. Brandon 1992), andthe approach requires some experimentation with the kernel width applied toeach observation (e.g. Hurford et al 1984, Silverman 1986).
The radial plot introduced by Galbraith (1988, 1990) is a more useful graph-ical method for assessing the distribution of single grain ages, at least in aqualitative sense. On this plot, the x and y coordinates are given as
xj = 1/σj
yj = (Aj − Ar)/σj,
whereσj is the precision of the age estimate Aj, and Ar is some reference age(typically the mean age of all grains). On a radial plot (see Figure 5a), the moreprecise data plot farther from the origin, all data have a common normalizederror, and a line joining a given data point to the origin has a slope (y/x) equi-valent to the age (or age-reference age).
Quantification of a finite number of discrete age components is a well-definedstatistical problem (e.g. Titterington et al 1985), and particular applicationsto geochronological data have been discussed by Galbraith & Green (1990),Brandon (1992), Galbraith & Laslett (1993), and Sambridge & Compston(1994). These authors’ approaches differ slightly in statistical assumptions.Brandon (1992) and Galbraith & Green (1990) both assume Gaussian distri-butions for the age component populations, whereas Sambridge & Compston(1994) allow for more general probability distributions to reduce the influenceof outliers. Galbraith & Laslett (1993) present a method that identifies a singleminimum age component and the proportion of grains from that population.The remaining spread in the age data may be attributable to multiple sedimentsources or differences in the degree of annealing between grains. When thegrains have undergone postdepositional annealing, the minimum age can beparticularly useful to establish the timing of maximum paleotemperature forthe host sediment.
The difference between the depositional age and the timing of a provenance-related peak identified by an age component analysis (or even from individualgrain ages) is referred to as the lag time (e.g. Cerveny et al 1988, Brandon &Vance 1992, Garver & Brandon 1994). This provides an estimate of the fissiontrack age of the mineral grains at the time of deposition. To determine thelag time, Cerveny et al (1988) removed the expected number of spontaneoustracks formed since deposition and recalculated the fission track age, whereasGarver & Brandon (1994) and Brandon & Vance (1992) just took the difference

P1: NBL/RPK/dat/ary P2: ARK/plb QC: ARK/abe T1: ARK
March 25, 1998 14:59 Annual Reviews AR055-15
FISSION TRACK ANALYSIS 535
T R AC K LE N G T H µm
MTL : 12.36SD : 2.47N = 29
10
20
30
40
5 10 15 20
N
T R AC K LE N G T H µm
MTL : 14.39SD : 1.11N = 11
10
20
30
40
5 10 15 20
N
Young componentT R AC K LE N G T H µm
MTL : 11.12SD : 2.24N = 18
10
20
30
40
5 10 15 20
N
Old component
-2 0
2
12.7
62.1
111.5 210.3
165±24 Ma
20±2 Ma
13.5 6.7 4.5 3.4 2.7 Error in Age
1194
(d)
176
17
93
245
321
123±12 Ma
67±10 Ma
28±6 Ma
213±12 Ma
29.3 14.6 9.8 7.3 5.8
915
N
0
2
4
6
8
10
0 100 200 300
P 0.13 ± 0.08
P 0.18 ± 0.08
P 0.26 ± 0.08
P 0.43 ± 0.10
Error in Age
-2 0 2
(a)
(b)
T R AC K LE N G T H µm
MTL : 12.36SD : 2.47N = 29
10
20
30
40
5 10 15 20
N
T R AC K LE N G T H µm
MTL : 14.39SD : 1.11N = 11
10
20
30
40
5 10 15 20
N
Young componentT R AC K LE N G T H µm
MTL : 11.12SD : 2.24N = 18
10
20
30
40
5 10 15 20
N
Old component
-2 0
2
12.7
62.1
111.5 210.3
165±24 Ma
20±2 Ma
13.5 6.7 4.5 3.4 2.7 Error in Age
1194
(d)
176
17
93
245
321
123±12 Ma
67±10 Ma
28±6 Ma
213±12 Ma
29.3 14.6 9.8 7.3 5.8
915
N
0
2
4
6
8
10
0 100 200 300
P 0.13 ± 0.08
P 0.18 ± 0.08
P 0.26 ± 0.08
P 0.43 ± 0.10
Error in Age
-2 0 2
(a)
(b)
Figure 5 (a) Radial plot (see Galbraith 1988, 1990) and single-grain age histogram for a sedimentfrom southern Spain (Lonergan & Johnson 1998). The more precise data plot further from thex origin, and each datum has the same±2σ error, given on the y axis. The data have been modeledin terms of four age components (using the approach of Sambridge & Compston 1994). The discreteage components are shown on the radial plot (assolid lines, with the 1σ uncertainty asdotted lines).The relative proportions and predicted age distribution are shown on the age histogram. Notice thereis no obvious 123-Ma peak on the age distribution, demonstrating the limitation of this graphicalrepresentation. (b) A two-component age distribution for a sediment from southern Spain and theassociated track length distributions (Lonergan & Johnson 1998). These data enable the thermalhistory of each age component to be constrained independently.

P1: NBL/RPK/dat/ary P2: ARK/plb QC: ARK/abe T1: ARK
March 25, 1998 14:59 Annual Reviews AR055-15
536 GALLAGHER ET AL
between the time of deposition and measured fission ages. The lag time canbe used to infer the denudation rate in the source region; i.e. it is a measure ofhow long it takes the sample to pass through an effective closure temperature,until it is redeposited. The results obtained by these studies seem reasonable,e.g. rates of 100–1000 m/My, though limited in that no account is made forfission track annealing during denudation cooling, and also it is unlikely thatthe geotherm would be unperturbed during erosion, leading to an overestimateof the depth of the effective closure temperature (e.g. Parrish 1985, Brown1992, Brown & Summerfield 1997).
Additional geological data can be incorporated in provenance studies to aidin identifying age components, although they do not contain direct informa-tion on timing of denudation. These data include zircon crystal morphologyand color, heavy mineral associations, and geochemical and lithological varia-tions (e.g. Yim et al 1985, Baldwin et al 1986, Kowallis 1986, Garver &Brandon 1994). As a recent example of a multiple technique provenance study,Lonergan & Johnson (1998) sought to identify the source of the analyzed min-erals at the scale of structurally and metamorphically discrete elements or unitswithin the Betic Orogen, in southern Spain. They established petrological andheavy mineral characteristics for each fission track analysis sample, togetherwith garnet and chloritoid geochemistry of both detrital minerals and mineralsin potential source terrains in the orogenic hinterland. In this way, a ther-mochronology of unroofing for each tectonic unit could be established. Theyused the approach of Sambridge & Compston (1994) to estimate different agecomponents in the apatite and zircon age populations (Figure 5a). The grainsbelonging to the youngest age population in those samples that contained thefirst appearance of detritus from a newly emergent tectonic unit were assumedto have been sourced from that terrain. Unlike previously published studies,Lonergan & Johnson (1998) also measured track lengths on individual grainsthat had been used for age analysis (Figure 5b), which enabled them to iden-tify the track length distributions associated with each component. Therefore,they could model the thermal histories of individual components with someconfidence, and variations in cooling rate for different tectonic units couldbe linked with changes in source region, denudation rates, and denudationprocesses.
Stratigraphic DatingFission track dating and age component analysis can provide a maximum agefor the sediment host. For example, Carter et al (1995b) analyzed zircon and ap-atite grains from a biostratigraphically barren red sandstone in Scotland, whichhad been variously suggested to be Precambrian (>545 Ma), Devonian (∼400–450 Ma), and Permo-Triassic (∼300–200 Ma) in age. The zircon single grain

P1: NBL/RPK/dat/ary P2: ARK/plb QC: ARK/abe T1: ARK
March 25, 1998 14:59 Annual Reviews AR055-15
FISSION TRACK ANALYSIS 537
age data had two resolvable age components of 220± 20 and 330± 18 Ma,and the apatite data had a mean age of 267± 26 Ma, with a track length dis-tribution indicative of minor postdepositional annealing. Given that there areapatite ages older than zircon ages, the youngest component age for the zir-cons must represent a maximum age for the sediment, which therefore must bePermo-Triassic in age. Similar approaches have been used to estimate maxi-mum deposition ages by Baldwin et al (1986) in Barbados, Carter et al (1995a,b)in Thailand, Kowallis et al (1986) in Mexico and Utah, and Hurford et al (1984)in southern England.
APPLICATION TO THERMAL HISTORY ANALYSISIN SEDIMENTARY BASINS
The recognition that fission track data are a sensitive indicator of temperatureand time has led to the widespread application of the technique to thermalhistory studies in sedimentary basins. Most studies have concentrated on ap-atite because the fission track system in this mineral is sensitive to the sametemperature range (∼50◦–130◦C) over which hydrocarbons are generated ongeological time scales (e.g. Gleadow et al 1983). Consequently, apatite fissiontrack analysis is now almost a routine method in hydrocarbon exploration andmaturation modeling. Arne (1992) has summarized the application of fissiontrack analysis to ore mineral deposits, in particular Mississippi Valley–type de-posits, although the application has been more limited, generally because thecommon carbonate host rocks often do not contain sufficient apatite or zircon.
One of the earliest discussions of fission track analysis in the basin analysiscontext was by Naeser (1979), who described the trends expected in apatitefission track data. Shallow low-temperature samples should reflect sedimentprovenance, whereas the deeper and hotter samples would reflect the thermalhistory of the basin. A later study by Gleadow & Duddy (1981) of the OtwayBasin sediments in southeast Australia provided a convincing demonstrationof this and has become a classic reference study for long-term annealing ofapatite.
Simple Burial and the Apatite Partial Annealing Zone (PAZ)A major advantage of the Otway Basin is that the sediments were derivedfrom contemporaneous volcanics. Therefore, “time zero” for the fission trackclock is effectively the stratigraphic age of the sediments, with no provenance-related complications. In addition, the burial history is relatively simple, sothe temperature history of the sediments can be reconstructed reasonably well(e.g. Green et al 1989a). The data discussed by Gleadow & Duddy (1981) aresummarized in Figure 6. The trends in the fission track age data reflect variations

P1: NBL/RPK/dat/ary P2: ARK/plb QC: ARK/abe T1: ARK
March 25, 1998 14:59 Annual Reviews AR055-15
538 GALLAGHER ET AL
Figure 6 Apatite fission track data from the Otway Basin, southeast Australia (after Gleadow &Duddy 1981, Green et al 1989a,b, Brown et al 1994b, Dumitru 1997), and selected length and agedistributions and radial plots. The stratigraphic age of all the samples is∼120 Ma (shown on theradial plots as agray band). The mean age and the mean track length decrease with increasingpresent-day temperature, while the length distributions become progressively broader and thespread in single-grain ages increases. This latter effect, in particular, is attributed to differences inthe annealing characteristics of apatite with variable Cl and F contents (Green et al 1989a,b).

P1: NBL/RPK/dat/ary P2: ARK/plb QC: ARK/abe T1: ARK
March 25, 1998 14:59 Annual Reviews AR055-15
FISSION TRACK ANALYSIS 539
in the track length distributions. Thus, the shallow samples (temperatures lessthan∼50◦–60◦C) with narrow length distributions and long mean track lengths(∼14 µm) have ages more or less equivalent to the stratigraphic age, whileprogressively deeper samples show shorter mean track lengths and broaderlength distributions; the age reduces accordingly to reach zero by about 125◦C(Green et al 1989a).
As mentioned above, the zone over which the track lengths and fission trackage decrease is referred to as the partial annealing zone (PAZ). This zoneis an approximation, as annealing is a heating rate–dependent process on allgeological time scales (e.g. Naeser 1993). Also, the complexity introducedthrough chemical composition and crystal structure further tends to blur thedefinition of a single temperature range for the PAZ. As can be seen fromFigure 6, the spread in single grain ages increases with temperature. Therange in equivalent total annealing temperature of∼25◦–30◦C is attributed to avariation in the chemistry of the apatites, specifically Cl-F contents, such thatthe grains richer in Cl are more resistant to annealing and so retain fission tracksup to a temperature of about 125◦C (e.g. Green et al 1989a,b).
Naeser et al (1990) report nonzero fission track ages in Tertiary sediments ofthe Basin Block in San Joaquin, California, which are currently at temperaturesof∼140◦C. They infer that the present-day thermal conditions must have beenoperative for<1 My, a conclusion that is in agreement with heating durationsinferred from40Ar/39Ar data (Harrison & Be 1983). The temperature rangeover which total annealing occurs (i.e. from the first zero fission track ageto all zero ages) is relatively limited (∼6◦C) in comparison with the OtwayBasin data. Naeser et al (1990) conclude that this inhibited annealing is not acompositional effect. The extremely rapid burial in the San Joaquin Basin (e.g.in excess of 3000 m of post-Miocene sediments) provides a physical mecha-nism for reducing the geothermal gradient, which is about 22◦C/km at present.However, it is not clear that this disequilibrium would lead to temperature in-creases of 10◦–20◦C on time scales of 1 My, and some other mechanism may beinvolved.
Basin Inversion and Maximum PaleotemperaturesMost data types used to constrain thermal histories in sedimentary basins effec-tively represent a one-way reaction or conversion and as such, act as a recordof the maximum paleotemperature of the sediment. In contrast, fission trackanalysis provides information on both paleotemperature and timing. It becomesmost useful when the basin has undergone a period of uplift or inversion, dur-ing which some section has been removed by erosion, with contemporaneouscooling of the underlying strata (e.g. Kamp & Green 1990, Bray et al 1992,Green et al 1995, Hill et al 1995).

P1: NBL/RPK/dat/ary P2: ARK/plb QC: ARK/abe T1: ARK
March 25, 1998 14:59 Annual Reviews AR055-15
540 GALLAGHER ET AL
In practice, many authors have advocated the combined use of multiple ther-mal indicators for thermal history modeling, including apatite fission trackanalysis, vitrinite reflectance, clay mineralogy, and fluid inclusions (e.g.Feinstein et al 1989, Bray et al 1992, Arne & Zentilli 1994, Burnter et al 1994,Wang et al 1994, Kamp et al 1996, Tseng et al 1996, Zhao et al 1996, Armstronget al 1997, Pagel et al 1997). This approach is primarily based on the infer-ence that these different techniques provide complementary information. Forexample, vitrinite reflectance data record primarily maximum postburial paleo-temperatures that can often exceed the apatite fission track stability. Vitrinitedata can also potentially constrain the contribution of inherited fission tracks inapatites that have not been totally annealed, by providing an independent esti-mate of the maximum postdepositional temperature. Fluid inclusions providepressure-temperature data, which are generally related to diagenesis and fluidflow. Fission track analysis provides time-temperature histories, particularlythe time and rate of cooling from the maximum paleotemperature and prove-nance information. A further motivation for using more than one technique isthe availability of material. Thus, vitrinite is extracted from mudstones, whiledetrital apatite is typically concentrated in sandstones or crystalline basementrocks.
Bray et al (1992), Arne & Zentilli (1994), Kamp et al (1996), and Armstronget al (1997) have focused particularly on the integration of apatite fission trackdata with vitrinite reflectance. This application is motivated by an apparentconsistency in the predicted levels of vitrinite reflectance and track lengthreduction in apatite, based on Burnham & Sweeney’s (1989) kinetic modelfor vitrinite and Laslett et al’s (1987) annealing algorithm for Durango ap-atite (Bray et al 1992, Arne & Zentilli 1994). The outcome of this model-specific comparison is that total annealing of fission tracks in apatite seemsto coincide with reflectances of 0.7–0.9% for heating durations of 1–100 My,a first-order relationship that seems to hold up in a variety of different casestudies.
Bray et al (1992) and Green et al (1995) discussed case studies using fis-sion track and vitrinite reflectance data to constrain the thermal histories andinversion chronology of individual wells from eastern England, the southernNorth Sea, the Taranaki Basin in New Zealand, and the onshore Otway Basinof southeast Australia. If the thermal history modeling implies that the sam-ples from a given well experienced their maximum temperatures at the sametime, then these data (and model results) define the paleotemperature gradientat this time (at least in terms of a linear regression). The extrapolation of thispaleogradient to surface temperature conditions provides an estimate of theburial depth of the section prior to erosion. This assumes that the variations

P1: NBL/RPK/dat/ary P2: ARK/plb QC: ARK/abe T1: ARK
March 25, 1998 14:59 Annual Reviews AR055-15
FISSION TRACK ANALYSIS 541
in paleotemperature were caused solely by greater burial depth and that thetemperature gradient (or thermal conductivity) in the eroded section was thesame as that in the underlying strata. Furthermore, it is necessary to considerthe potential for other factors to contribute to temporal variations in tempera-ture such as fluid flow, surface temperature, and crustal heat flow (Issler et al1990, Brown et al 1994a, Duddy et al 1994, O’Sullivan 1996). The ability todiscriminate among these various processes depends to a large degree on thedata quality and distribution and on the incorporation of additional independentgeological information.
Zircon Fission Track Analysis in Sedimentary BasinsZircon fission track analysis has been used relatively little in the context ofbasin analysis and thermal history, primarily because of its higher temperaturestability. The recent advances in terms of predictive models for fission trackannealing in zircon, based on both laboratory and natural annealing experi-ments referred to above, suggest that zircon fission track analysis will provemore useful in thermal history and quantitative basin studies in future. Thisis particularly so in regions where potential hydrocarbon source rocks are nowat temperatures that exceed the stability zone for apatite, such as the southernNorth Sea Gas Basin.
APPLICATION TO OROGENIC BELTS
Continental convergence is accommodated in orogenic belts by crustal thick-ening, lateral and radial expulsion, and erosion. England & Molnar (1990)have argued that surface uplift over crustal length scales is the fundamentaldisplacement to be measured during orogeny. Uplift of this kind requires workagainst gravity that is comparable in magnitude to the work done overcomingshear stresses along major thrust faults. Where horizontal shortening acrosszones of continental collision is the principal cause of crustal thickening, therate of mean surface uplift reflects the rate of plate convergence. An alterna-tive mechanism involves changes in the density distribution within the mantlelithosphere below an orogenic belt that result in surface uplift (Houseman et al1981, Platt & England 1993). In this case, rates of surface uplift are not directlycontrolled by plate convergence rates and conceivably could be much higherthan those compatible with simple crustal shortening. However, measuringsurface uplift rate, and changes in rate over geological time scales, is particu-larly difficult. Useful constraints can be placed upon these variables if time andrate information is obtained on erosion and on the lateral and radial expulsion ofcrustal section along high and low angle faults, within the orogenic hinterland.

P1: NBL/RPK/dat/ary P2: ARK/plb QC: ARK/abe T1: ARK
March 25, 1998 14:59 Annual Reviews AR055-15
542 GALLAGHER ET AL
Orogenic belts form broad zones in which deformation is heterogeneously dis-tributed in such a way that its kinematics do not relate in any simple fashion tothose of the bounding lithospheric plates. Therefore, information on the timingand kinematics of deformation obtained from the orogen itself, together withinformation on its erosional history, can reveal the character of the dynamicsof the mountain building process.
Fission track analysis yields quantitative information on cooling and so hasthe potential to provide estimates of erosional and tectonic denudation. Toextract this information, we need to consider how the interpretation of fissiontrack data is approached. In the context of collisional mountain belts, it is ap-propriate to consider three possible reference frames—thermal, elevation, andstructural/kinematic—which have been used to interpret fission track data (bothages and track length distributions). We consider these in turn, incorporatingdiscussion of various relevant studies.
Thermal Reference FrameCooling histories obtained using different radiometric techniques on cogeneticminerals from a single sample often include zircon and apatite fission track agesas low-temperature bounds to a temperature interval of several hundred degrees(e.g. Wagner et al 1977, Harrison et al 1978, Zeitler et al 1982, Zeitler 1985,Hurford 1986, Hunziker et al 1992). An example of this approach, taken fromHurford (1986), is shown in Figure 7. Notwithstanding the general criticismsof the closure temperature concept as applied to radiometric ages (Villa &Puxeddu 1994), there are specific problems in adopting the closure temperatureapproach when interpreting fission track data.
Relating a fission track age to a closure temperature is only plausible whenit can be demonstrated that no significant annealing has occurred post–closuretime. This requires rapid cooling (e.g. Dokka et al 1986), which should bereflected in the track length distribution (e.g. Figure 4). The example givenin Figure 7 has the lower portion of the cooling curve defined by an apatiteanalysis with a much reduced mean track length and evidence of bimodalityto the distribution. The calculated age therefore does not reflect the timingof a 110◦–120◦C closure temperature, but it indicates a more complex low-temperature cooling history than that shown in the diagram. The zircon closuretemperature inferred from this cooling history seems reasonable in the light ofmore recent data, as referred to above. However, it is clear that track lengthinformation is critical to fully understanding the lower temperature coolinghistory information contained in fission track data. Even in the absence of areliable quantitative annealing model (e.g. as for zircon), track length data allowfor qualitative assessment of the validity of inferred cooling rates. This does notreveal the process responsible for unroofing a sample, but it provides valuable

P1: NBL/RPK/dat/ary P2: ARK/plb QC: ARK/abe T1: ARK
March 25, 1998 14:59 Annual Reviews AR055-15
FISSION TRACK ANALYSIS 543
Figure 7 A cooling curvebased on a variety of different thermochronometers, each of which hasbeen assigned a different closure temperature (Hurford 1986). The confined track length distributionof the apatite indicates that this sample experienced a complex low-temperature cooling history,which makes the adoption of a closure temperature of∼120◦C inappropriate. Also shown is theestimate for the closure temperature of zircon inferred by Hurford (1986), which is actually inreasonable agreement with more recent estimates.
information on the time when cooling commences and the rate at which coolingproceeds.
Though we can model fission track data in terms of a quantitative thermalhistory, subject to the vagaries of the empirical annealing models, the conversionof a best-fit temperature history to an equivalent depth requires another level ofinterpretation. We address some aspects of this in the next section.
Elevation Reference FrameIt has been known for some time that samples collected over significant reliefin mountain belts often yield apatite fission track ages that exhibit a positivecorrelation with sample elevation (e.g. Wagner & Reimer 1972, Wagner et al1977). This spatial (vertical) frame of reference was used to estimate rate ofuplift (Figure 8). These are more correctly referred to as estimates of denudation

P1: NBL/RPK/dat/ary P2: ARK/plb QC: ARK/abe T1: ARK
March 25, 1998 14:59 Annual Reviews AR055-15
544 GALLAGHER ET AL
Figure 8 Apatite fission track age elevation profiles from the European Alps, after Wagner et al(1977). They used the slopes to estimate rates of uplift, indicated by thekeyin the top left. Thesedata reflect denudational cooling, and the rate estimates do not allow for annealing. However, tracklength measurements were not routinely used until the mid-1980s.
(equivalent to the exhumation by England & Molnar 1990). Despite a numberof serious shortcomings, age-elevation plots are often used to infer denudationand uplift rates (e.g. Miller & Lakatos 1983, Grundmann & Morteani 1985,Benjamin et al 1987, Plafker et al 1991, Laubacher & Naeser 1994, Copelandet al 1995, Baker & Seward 1996). Some of the typical problems with thesesimplified interpretations include 1. the assumption that cooling is solely theresult of erosion; 2. the neglect of paleo-PAZ; 3. the implicit assumption that arock sample is transported perpendicularly to isotherms; and 4. changes in thespatial relationship between samples that cause elevation to no longer reflectoriginal sample depth in the crust. We consider each of these in turn, citingexamples of different applications of the fission track method.
1. Near-invariant apatite and zircon fission track ages over elevation ranges of1000–2000 m have been interpreted as the result of very high rates of erosion(e.g. Foster et al 1994) and further interpreted as evidence for the presence ofhigh mountains at the time of rapid cooling (e.g. Searle et al 1997). However,cooling can occur below crustal-scale shear zones and detachment faults as aresult of normal faulting of variable geometry (e.g. Wernicke 1985, Dokka et al1986, Johnson et al 1997). This cooling does not require erosional denudation,with the dominant process referred to as tectonic denudation. Samples cooled

P1: NBL/RPK/dat/ary P2: ARK/plb QC: ARK/abe T1: ARK
March 25, 1998 14:59 Annual Reviews AR055-15
FISSION TRACK ANALYSIS 545
as a consequence of tectonic denudation, collected over a range in footwallelevation, can yield a similar cooling age (with long mean track lengths), butthe steep gradient of the age-elevation plot does not imply very high rates oferosion, nor does it require these samples to be part of high mountains at thetime that they cooled. However, the thermal record of this process can be usedto reconstruct paleothermal gradients, slip rates, and in some cases the initialfault geometry/dip (Foster et al 1993, Lee 1995, Howard & Foster 1996, Milleret al 1997, Johnson et al 1997).
2. Following a period of accelerated erosion, samples from a preexisting PAZmay be exposed in the topography of a mountain belt. The general conceptis illustrated in Figure 9, and part of the final age-elevation profile reflects anexhumed PAZ (Fitzgerald & Gleadow 1988, Brown et al 1994b, Fitzgerald et al1995). Thus there are at least two gradients present in the age-elevation profile,and the change in gradient is referred to as the break in slope. Samples fromabove the break in slope have fission tracks accumulated both before and afterthe onset of erosive denudation; i.e. these are from the preexisting or paleo-PAZ.The lower part of the profile contains samples that accumulated tracks only afterdenudation was initiated. This section yields direct information on the rate ofdenudation. It is therefore critical to identify which trends are represented in asuite of samples. Again, the key information lies in the samples’ track lengthdistribution.
Many apatite fission track studies do not provide track length information(e.g. Nelson 1982, Plafker et al 1991, Laubacher & Naeser 1994), and conse-quently, the significance of the reported ages is ambiguous. Others report tracklength distributions indicative of protracted annealing in a paleo-PAZ (e.g.Hurford 1986, Kamp et al 1989, Stump & Fitzgerald 1992, Tippett & Kamp1993, Roberts & Burbank 1993, Baker & Seward 1996) that are sometimeserroneously interpreted in terms of denudation rate (e.g. Roberts & Burbank1993, Baker & Seward 1996).
Some ambitious studies have sought to use the “backstacking” approachof Brown (1991) in an orogenic setting, based on the recognition of a lowerbound of a paleo-PAZ (e.g. Kamp & Tippett 1993, Tippett & Kamp 1993,Fitzgerald et al 1995). In principle, eroded section can be backstacked ontotopography: Where an initial mean surface elevation can be estimated (basedon independent geological evidence), the difference between the isostaticallyadjusted mean surface elevation and the calculated elevation should reflect thetectonic uplift component. The success of this approach has been variable,which reflects the validity of the assumptions made during the interpretation ofthe fission track data.

P1: NBL/RPK/dat/ary P2: ARK/plb QC: ARK/abe T1: ARK
March 25, 1998 14:59 Annual Reviews AR055-15
546 GALLAGHER ET AL
Old FT Age
Young FT Age
0 t1 t0 + t1
Apparent apatite FT age
Base of fossil PAZ indicates timing of
exhumation
*
*~110
~60
Pre-exhumation surface
Negligible Annealing
Total Annealing
Partial Annealing Zone
Apparent apatite FT age
0 t0
Temperature (°C)
*N
10 20µm
Figure 9 The concept of exhumed PAZ (adapted from Fitzgerald et al 1995). Theleft panelillustrates the predenudation apatite fission track age crustal profile (which is similar to the present-day Otway Basin data; see Figure 6), with the initial age ast0. Denudation at timet1 exposesdifferent levels of this precooling profile, while the deeper samples begin to retain tracks (centralpanel). Theright panelshows the expected trend in the fission track data with respect to elevation;i.e. age increases. The length distribution has two components—tracks formed prior to cooling(dark shading) and those formed after cooling (light shading). The latter are all long, and thecomposite length distribution depends on the relative proportion of these two components. Onlythe data below the break in slope (marked by anasterisk) reflect a cooling/uplift event.

P1: NBL/RPK/dat/ary P2: ARK/plb QC: ARK/abe T1: ARK
March 25, 1998 14:59 Annual Reviews AR055-15
FISSION TRACK ANALYSIS 547
Tippett & Kamp (1993) and Kamp & Tippett (1993), for example, usedfission track data to estimate the amount of denudation in the southern Alpsof New Zealand. Their estimates seem low relative to those based on sim-ple mass balance calculations that equate plate convergence with surface upliftand erosion of the New Zealand continental crust (Koons 1995, Walcott 1997).There are three possible reasons for this. First, they estimated predenudationpaleo-PAZ temperatures from a loose calibration against the Otway Basin fis-sion track data (Figure 6). Second, they assumed an inappropriate value for thehigh temperature bound to the zircon PAZ (265◦C), which is possibly as muchas 100◦C too low. Third, they assumed that an estimated predenudation sam-ple temperature permits the amount of missing section to be calculated. Thisapproach implicitly assumes vertical transport (perpendicular to an isotherm),while the true particle pathway is more likely to contain a significant horizontalcomponent (e.g. Willett et al 1993, Koons 1995).
In contrast, Fitzgerald et al (1995), in a study of the Central Alaska Range,avoided these difficulties by estimating the regional distribution in elevationof the break in slope, rather than calculating point temperatures, and by usingonly the better-calibrated apatite fission track system. They were also helped byinvestigating a region that has undergone less convergence and regional erosionthan the New Zealand Alps. Their sampling ranged over nearly 5000 m ofrelief, and they could identify the paleo-PAZ and timing of initiation of rapiddenudation-induced cooling at around 5–6 Ma (Figure 10). The preservation ofthe apatite PAZ in the highest peaks implies that particle pathways subparallelto the isotherms are not significant.
3. The advection of heat during denudation, the associated increase in near-surface geotherms, and the overestimation of denudation rates in the context offission track analysis in mountain belts have been discussed by Parrish (1985),Brown (1992), and Brown & Summerfield (1997). In terms of uncertaintiesin denudation estimates from fission track data, the magnitude of this effectdepends on the predenudation geotherm and both the rate and duration of thecooling episode. Brown (1992) has shown that estimates of the timing ofdenudation from apatite fission track data are relatively insensitive to the rateof denudation, but the estimate of the depth to 100◦C can be overestimatedby as much as 1 km (see also Hubbard et al 1991, Mancktelow & Grasemann1997).
Another complication in interpreting low-temperature thermochronologicaldata is the effect of topography on subsurface isotherms. Topography leads todifferential compression of isotherms, such that the geotherm is higher under avalley than under mountain peaks or interfluves. The magnitude of this effect

P1: NBL/RPK/dat/ary P2: ARK/plb QC: ARK/abe T1: ARK
March 25, 1998 14:59 Annual Reviews AR055-15
548 GALLAGHER ET AL
Figure 10 Apatite fission track age as a function of elevation and selected track length distributionsfrom Denali in Alaska. The break in slope (asterisk) at∼6 Ma and the long track lengths indicatethe timing of initiation of rapid cooling. Above the break in slope the data reflect a fossil PAZ.(From Fitzgerald et al 1995.)
decreases with increasing depth. However, it can be significant for a low-temperature stability system, such as fission tracks in apatite, and age-elevationgradients again may give overestimates the true rate of erosional denudation(e.g. Stuwe et al 1994, Mancktelow & Grasemann 1997).
An additional factor to consider in orogenic belts is the relative timing oferosion and deformation. Rapid deformation may result in a large thermalperturbation in the upper crust. However, the resulting signature may not bepreserved in surface rocks as a consequence of thermal relaxation and/or laterdenudation (e.g. Thompson & Ridley 1987). Selverstone (1988) and Selverstoneet al (1995) documented the extensional unroofing of the Tauern Window, east-ern Alps, in which relative footwall uplift from beneath the Austroalpine unitsalong the Simplon Fault Zone may have been as high as 4.6 mm/year duringthe early Miocene (Grasemann & Mancktelow 1993). However, following thisphase of rapid unroofing,∼6 km of erosion removed the structurally uppermostsections of the Tauern Window, which had contained a record of the transientthermal disturbance caused by deformation. Rocks at the Earth’s surface todayonly retain a record of this subsequent period of erosion. The fission track

P1: NBL/RPK/dat/ary P2: ARK/plb QC: ARK/abe T1: ARK
March 25, 1998 14:59 Annual Reviews AR055-15
FISSION TRACK ANALYSIS 549
thermochronological evidence for extension has been lost, as evidenced bythe late Miocene apatite ages and positive age-elevation correlations, whichare consistent with erosive denudation, obtained by Grundmann & Morteani(1985).
4. A vertical sequence of samples cannot directly give a denudation-related age-elevation correlation if the samples have been rotated after cooling. However,in mountain belts, such late-stage deformation is to be expected. Examples ofthis are documented by Fitzgerald et al (1991) and Dokka (1993) from the west-ern Cordillera of the United States and Rahn et al (1997) from the Swiss Alps.Fitzgerald et al (1991) correlated apatite age with sample depth below an un-conformity, which was taken to represent the paleohorizontal prior to Mioceneerosive denudation, rotation, and faulting. This reveals the age profile charac-teristic of an exhumed PAZ, which enables estimation of the time for the onsetof denudation. Similarly, Dokka (1993) inferred that a present-day shallow-angled normal fault had originated at a much higher angle, whereas Rahn et al(1997) showed that a shallow dipping thrust had been rotated to its presentposition from a higher angle and constrained the time at which this occurred.
Folding on the scale of tens of kilometers can also control erosional historiesin orogenic belts. Johnson (1997) has shown that Pliocene folding of the core tothe Betic Orogen (Spain), which drove contemporaneous erosive denudation,resulted in a negative age-elevation relationship that clearly cannot be used tocalculate a denudation rate. Similarly, asymmetric unroofing of the northernmargin to the Tian Shan (China) has resulted in apatite ages uncorrelated withsample elevation, but which show a simple trend with respect to their relativestratigraphic position, reflecting their original depth of burial (Hendrix et al1994).
Structural/Kinematic Reference FrameCrustal scale structural discontinuities often provide a framework for discus-sion of fission track data (e.g. the Insubric Line in the European Alps; Hurfordet al 1991). The most complete studies integrating detailed structural analy-sis with fission track and other radiometric techniques have been focused onthe western US Cordilleran metamorphic core complexes. They provide athree-dimensional and kinematic frame of reference because of the intimaterelationship between deformation and denudation (achieved largely by crustalscale extension).
John & Foster (1993) and Foster et al (1993) have used kinematic datato obtain the hanging-wall slip direction, following Dokka et al (1986) andFoster et al (1991), who had constrained the timing of the detachment faulting.Based on the observed decrease in fission track ages (having mean track lengths

P1: NBL/RPK/dat/ary P2: ARK/plb QC: ARK/abe T1: ARK
March 25, 1998 14:59 Annual Reviews AR055-15
550 GALLAGHER ET AL
>14µm) with distance down-dip, they inferred average strain rates. Further-more, they have used dike and normal/strike-slip fault orientation, togetherwith fault rock types and mineral deformation mechanisms, to constrain theinitial angle of the detachment that marks the boundary between the upper andlower plates, which is a fundamental control of the initiation and evolution oflow-angle normal faults.
Compressional orogenic belts, such as the European Alpine mountain belt,also contain regions bounded by crustal scale structural discontinuities in whichrelatively high-grade metamorphic rocks are overlain by low-grade rocks, whichis similar in many ways to metamorphic core complexes (e.g. Ratschbacheret al 1989). Establishing that the high-grade rocks have undergone tectonicdenudation involves the integration of at least two of the following: kinematic,thermochronologic, and geobarometric data (Wheeler & Butler 1994). Johnsonet al (1997), using kinematic and fission track thermochronologic data, haveshown that orogen-parallel hanging-wall transport in the middle Miocene wasresponsible for the tectonic denudation of the medium- to high-grade Nevado-Filabride Complex in the Betic Cordillera. Blythe et al (1996) used balancedcross sections to relate the thermochronological data (apatite and zircon fissiontrack and40Ar/39Ar data) to the structural evolution of the central Brooks Rangein Alaska. Similarly, Dumitru et al (1995) explicitly incorporated structural datain their interpretation of fission track data from the Bering Strait region, demon-strating a clear correlation of fission track parameters with structural position.
Not only tectonic denudation in orogenic belts requires integration of the fis-sion track data with kinematic and other structural information. Johnson (1997)has used kinematic and foliation data to reconstruct the three-dimensional spa-tial relationship between a group of samples prior to crustal-scale folding, aswell as erosion of the developing fold anticline. From this, an upper MiocenePAZ was identified, and the timing for the onset of a major phase of erosionestablished. The inherent complexity associated with the evolution of orogenicbelts is manifested in the shallow crustal thermal history and therefore in thefission track data. Consequently, careful geological analysis, particularly inrelation to structural position, is required to extract this information in a robustand useful form.
APPLICATION TO NONOROGENIC SETTINGS
Passive Continental Margins and Continental InteriorsIn contrast to orogenic terrains, where topography is attributable to crustalthickening, passive continental margins are formed within a regional exten-sional environment dominated by crustal thinning and subsidence. However,a complete model of passive margin evolution must account for the evolution

P1: NBL/RPK/dat/ary P2: ARK/plb QC: ARK/abe T1: ARK
March 25, 1998 14:59 Annual Reviews AR055-15
FISSION TRACK ANALYSIS 551
of the subaerial topography of the margins, as well as for the subsidence ofoffshore marginal basins. Unlike the offshore basins, which record verticalmotion in the stratigraphy (e.g. Steckler & Watts 1978), the subaerial part of apassive margin commonly preserves no direct record of its topographic history.As a result of erosion, evidence for changes in paleoelevation (such as elevatedmarine deposits or paleoshorelines of various ages) is likely to be lost duringthe initial stages of margin development.
The abundance of high-resolution seismic reflection data provides a methodof calculating offshore sediment volumes. This type of data has been used in anumber of cases to reconstruct generalized denudation histories for the adjacentonshore regions (e.g. Mathews 1975, Poag & Sevon 1989, Rust & Summerfield1990, Seidl et al 1996). A major limitation of this approach is that the sourcearea of the sediment is unknown. Apatite fission track analysis can help resolvethis problem because it provides a direct method for estimating the spatial andtemporal distribution of onshore denudation. Combining these complementarydata sets provides an extremely powerful approach to quantifying the amount,pattern, and chronology of the denudational history of continental margins andthe interior.
Rifting-Related Heating Versus Denudational CoolingThe thermal regime in nonorogenic environments is such that the vertical-component heat transfer dominates within the upper crust (<∼10 km). Further-more, the subsurface thermal effects of extension and associated magmatismrelated to the process of continental rifting are largely restricted to the re-gion undergoing extension, crustal thinning, and subsidence (Buck et al 1988,Gallagher et al 1994, 1995, Brown et al 1994a, Feinstein et al 1996, Kohn et al1997). Onshore, where the fission track samples are collected, the thermalgradients in the shallow crust (i.e.≤∼10 km) are largely unaffected by therifting process (Morgan et al 1985, Makris et al 1991, Gallagher et al 1994,Feinstein et al 1996). The low-temperature thermal history of rocks in theseenvironments is primarily controlled by their vertical displacement relative tothe Earth’s surface along a near–steady-state geotherm. Denudation is thereforethe major controlling process in this context, so the rate of cooling is determinedby the rate of denudation (Gallagher et al 1994, 1995, Brown et al 1994a, 1997).
Passive Margin Topography and Modesof Landscape DevelopmentSubaerial passive margins display great variation in topographic morphology,which reflects complex interactions between denudation, drainage, lithologi-cal, and tectonic controls. This complexity suggests that a single model ofpassive margin formation is unlikely to provide a satisfactory explanation for

P1: NBL/RPK/dat/ary P2: ARK/plb QC: ARK/abe T1: ARK
March 25, 1998 14:59 Annual Reviews AR055-15
552 GALLAGHER ET AL
all margins. There are numerous geophysical models that can explain the ori-gin of the long-term topography of passive margins (e.g. Gallagher & Brown1997), but few of them attempt to explain how the topography evolves withtime. Similarly, many geomorphological models provide explanations for howthe landscape may have changed on a geological time scale but fail to providea sound physical basis for how the model works (e.g. Ollier 1985, Partridge &Maud 1987, Ollier & Pain 1997). The power of apatite fission track analysis isits potential for measuring the pattern and chronology of denudation across thesubaerial margin topography and consequently for testing models by analyzingthe characteristic denudational histories that they predict.
Currently, three distinct classes of landscape evolution model describe pas-sive margins exhibiting a high-elevation escarpment that separates a low-eleva-tion coastal region from a high-elevation interior plateau. We refer to these asthe downwarp, scarp retreat, and pinned divide models (Figure 11). We referto A, B, and C in Figure 11 to illustrate different locations discussed below.
The downwarp models (e.g. King 1962, Ollier & Pain 1997; Figure 11a)propose that the margin is initially formed by long wavelength flexure of thelithosphere, which produces minimal faulting and margin topography charac-terized by a broad monocline with a very low gradient (∼1◦ slope). A significantphysical limitation of these models is that they do not incorporate the isostaticresponse to the denudational unloading (over the wavelength of the margin).The lithosphere is implicitly considered infinitely rigid. Denudation is limitedto moderate amounts occurring between remnants of the initial landsurface pre-served along the coast and the crest of the escarpment (B). Negligible amounts
Figure 11 Cartoons of different models for the evolution of passive margin models and thepredicted spatial trend in apatite fission track data. A, B, and C indicate specific locations discussedin the text (seePassive Margin Topography and Modes of Landscape Developmentin text).

P1: NBL/RPK/dat/ary P2: ARK/plb QC: ARK/abe T1: ARK
March 25, 1998 14:59 Annual Reviews AR055-15
FISSION TRACK ANALYSIS 553
of denudation occur inland of the escarpment (C). This denudation produces apattern of apatite fission track age that is characterized by old ages (at least asold or older than the initial surface) that occur at the coast (A) and inland of theescarpment (C), with only moderately reduced ages in between (B).
Scarp retreat models (e.g. Gilchrist & Summerfield 1991, Gilchrist et al1994, Tucker & Slingerland 1994; Figure 11b) incorporate a steep (10◦–15◦
slope) escarpment formed at the new continental margin by differential verticaldisplacement. This occurs across normal faults that separate the subsiding riftbasin from the subaerial margins. Progressive denudation of the margin occursby scarp retreat. The highest rates of vertical denudation (500–1000 m/My)occur immediately seaward of the scarp (B), while the seaward coastal region(A) is characterized by moderate rates (10–20 m/My) and the interior (C) bymuch lower rates (<10 m/My). This class of model predicts a maximum amountof denudation near the coast and moderate to low amounts of denudation inthe interior, which produce a strong gradient in apatite fission track age, withthe oldest ages occurring inland of the scarp and decreasing toward the coast (seeGallagher et al 1995). The youngest ages may be similar to, or younger than, thetiming of rifting and continental break-up, and the time of peak denudation rateoccurs later inland from the coast toward the final position of the escarpment.
The pinned divide class of model (Kooi & Beaumont 1994, Gilchrist et al1994; Figure 11c) is similar to the scarp retreat class in that the initial margintopography also incorporates a steep escarpment that formed during continen-tal rifting (Figure 11c). The key difference between these two classes is theincorporation of a preexisting drainage divide inland of the initial escarpment.The location of the drainage divide (B) is typically on the order of 100 km fromthe initial scarp and is defined by a very low gradient slope (<∼1◦) toward therift scarp. The inland drainage divide allows rapid incision of streams drainingseaward of the divide (A), with essentially uniform rates of denudation. Thisproduces a new scarp close to the initial position of the drainage divide. Theimportant difference between the pinned divide and scarp retreat models is thatthe former produces a “down wearing” rather than a scarp retreat pattern ofdenudation. Furthermore, if the base level of the interior drainage is loweredduring the formation of the initial scarp, then a significant depth of denudationis also predicted inland of the drainage divide (C). In this case, the new scarp isstill formed and is “pinned” at the position of the initial drainage divide (Kooi& Beaumont 1994). The important differences between the scarp retreat andthe pinned divide models are the predictions of denudation and its timing acrossthe margin and the amount occurring inland of the escarpment’s final position.
Testing Landscape ModelsRegional apatite fission track data sets now exist for numerous passive mar-gins around the world. Five such data sets are summarized in Figures 12a–e

P1: NBL/RPK/dat/ary P2: ARK/plb QC: ARK/abe T1: ARK
March 25, 1998 14:59 Annual Reviews AR055-15
554 GALLAGHER ET AL
140˚
E14
4˚E
148˚
E15
2˚E
44˚S
44˚S
40˚S
40˚S
36˚S
36˚S
32˚S
32˚S
020
040
0
km
>35
025
015
0 50 <25Ma
0300
600
900
1200
1500
met
ers
52˚W
48˚W
44˚W
32˚S
32˚S
28˚S
28˚S
24˚S
24˚S
20˚S
20˚S
020
040
0
km
>35
025
015
0 50 <25Ma
0300
600
900
1200
1500
met
ers
(a)
(b)

P1: NBL/RPK/dat/ary P2: ARK/plb QC: ARK/abe T1: ARK
March 25, 1998 14:59 Annual Reviews AR055-15
FISSION TRACK ANALYSIS 555
12˚E
16˚E
20˚E
24˚E
28˚E
32˚E
36˚E
40˚E
36˚S
36˚S
32˚S
32˚S
28˚S
28˚S
24˚S
24˚S
20˚S
20˚S
16˚S
16˚S
>35
025
015
0 50 <25Ma030
0
600
900
1200
1500
met
ers
020
040
0
km
Fig
ure
12A
patit
efis
sion
trac
kag
eda
taan
dpr
esen
t-da
yto
pogr
aphy
forv
ario
uspa
ssiv
eco
n-tin
enta
lmar
gins
.The
circ
les
are
indi
cativ
eof
the
apat
itefis
sion
trac
kag
e.(a
)Sou
thea
stA
ustr
alia
(Moo
reet
al19
86,
Dum
itru
etal
1991
);(b
)so
uthe
astB
razi
l(G
alla
gher
etal
1994
,199
5);(
c )so
uthe
rnA
fric
a(B
row
n19
92,B
row
net
al19
97);
(d)
Yem
en(M
enzi
eset
al19
97);
(e)
wes
tern
Indi
a(M
Wid
dow
son,
AJ
Hur
ford
,Y
Gun
nell,
unpu
blis
hed
data
).
(c)

P1: NBL/RPK/dat/ary P2: ARK/plb QC: ARK/abe T1: ARK
March 25, 1998 14:59 Annual Reviews AR055-15
556 GALLAGHER ET AL
72˚E
76˚E
80˚E
8˚N
8˚N
12˚N
12˚N
16˚N
16˚N
20˚N
20˚N
010
020
030
0
km
>35
025
015
0 50 <25
0300
600
900
1200
1500
met
ers
40˚E
44˚E
48˚E
8˚N
8˚N
12˚N
12˚N
16˚N
16˚N
20˚N
20˚N
010
020
030
0
km
>35
025
015
0 50 <25Ma
0300
600
900
1200
1500
met
ers
(d)
(e)

P1: NBL/RPK/dat/ary P2: ARK/plb QC: ARK/abe T1: ARK
March 25, 1998 14:59 Annual Reviews AR055-15
FISSION TRACK ANALYSIS 557
0
100
200
300
400A
pat
ite
FT
Ag
e (M
a)SE Australia
0
100
200
300
400
Ap
atit
e F
T A
ge
(Ma)
SW Africa
0
100
200
300
400
0 50 100 150 200 250 300
Ap
atit
e F
T A
ge
(Ma)
Distance to coast (km)
W. India
SE Brazil
Distance to coast (km)0 50 100 150 200 250 300
Yemen
Figure 13 Apatite fission track age as a function of distance from the present-day coast for thedata sets illustrated in Figure 12. Thegray bandsrepresent the approximate timing of full oceanspreading, based on magnetic anomalies. Some data show reasonably well-defined geographicaltrends (e.g. Brazil, Australia), while others do not (southern Africa, Yemen).
and 13. Despite the significant variation in ages and the complex spatial pat-terns, useful general observations common to all data sets can be made. Theyoungest ages tend to occur along the present coastline, and the oldest agesare invariably restricted to the higher elevations within the interior of the con-tinents. However, the younger ages are not restricted to the coastal regionsand also occur within the interior, which is particularly evident in southernAfrica. Furthermore, the youngest fission track ages are typically similar to oryounger than the age of rifting. The youngest ages from western India werecollected from samples close to the Deccan Traps, a major volcanic province

P1: NBL/RPK/dat/ary P2: ARK/plb QC: ARK/abe T1: ARK
March 25, 1998 14:59 Annual Reviews AR055-15
558 GALLAGHER ET AL
formed at the time of continental break-up. Several samples from southeastBrazil were also collected either from or within a few meters of the Paranabasalt province, a similarly extensive break-up–related flood basalt province.These samples yield similar or younger ages to the basaltic volcanism. In bothwestern India and southeast Brazil, the total thickness of low thermal con-ductivity basalts was 1–2 km, which was sufficient to reset the apatite fissiontrack system in the nearby basement (Gallagher et al 1994). The basalt subse-quently has eroded away. Overall, none of the example data sets conforms topredictions by the downwarping class of passive margin models. The generalincrease in age, with increasing distance and elevation inland, is consistent withthe denudation histories predicted by the scarp retreat and/or the pinned dividemodels.
An effective graphical method for analyzing regional fission track data setsis a plot of measured fission track age against the mean track length, empha-sizing the importance of the track length data. Green (1986) demonstrated thatif a region experiences a discrete phase of accelerated denudation, then theapatite fission track ages and the mean track lengths define a distinctive pattern,provided that the samples have experienced different amounts of cooling (i.e.different amounts of denudation). This pattern is characterized by an initialdecrease in the mean track length with decreasing age to a minimum meanlength for intermediate ages, followed by a progressive increase in mean lengthfor successively younger ages. This concave-up pattern is often referred to asa boomerang plot, and the mechanics and interpretation of the diagram havebeen described in detail by Green (1986), Brown et al (1994b), and Gallagher& Brown (1997). Boomerang plots for the five data sets from southeastAustralia, southern Africa, Yemen, southeast Brazil, and western India areshown in Figure 14.
Some important information can be derived directly from these boomerangplots. First, if the data do not show this distinctive pattern, a more complexdenudation history is indicated than coeval cooling from a range of predenuda-tion paleotemperatures. Otherwise, the boomerang plot can be used to estimatethe timing of the last major cooling episode. This timing is indicated by theyoungest fission track ages, provided the mean confined track lengths are onthe order of 14–15µm. Samples with these characteristics are inferred to havecooled from maximum paleotemperatures in excess of∼110◦C and thereforeonly preserve tracks that formed after the initiation of the last phase of cooling.Intermediate ages with shortened mean track lengths reflect a mixture of pre-and postcooling track accumulation. These indicate cooling from successivelylower maximum paleotemperatures but at a similar time to the younger samples.The oldest ages are associated with a larger proportion of older tracks with along mean length, which reflects the lowest precooling paleotemperatures.

P1: NBL/RPK/dat/ary P2: ARK/plb QC: ARK/abe T1: ARK
March 25, 1998 14:59 Annual Reviews AR055-15
FISSION TRACK ANALYSIS 559
10
11
12
13
14
15SE Australia
MT
L (
µm
)
10
11
12
13
14
15
MT
L (
µm
)
SW Africa
10
11
12
13
14
15
0 100 200 300 400 500
W. India
MT
L (
µm
)
Apatite FT Age (Ma)
SE Brazil
0 100 200 300 400 500
Apatite FT Age (Ma)
Yemen
Figure 14 Boomerang plots for the data sets illustrated in Figure 13. The Yemen data form acoherent pattern on this plot, indicating that they are consistent with a relatively simple coolinghistory, while the data from Brazil, southern Africa, and Australia reveal more complexity.
A boomerang plot is really just another way of looking at an exhumed PAZ(Fitzgerald et al 1995, Dumitru 1997). The range of measured fission track agesdefining a boomerang array simply reflects a variation in the proportions of twopopulations of tracks that formed before and after a cooling episode. Gallagher& Brown (1997) showed how these boomerang plots can be calibrated so that anestimate of the maximum paleotemperature experienced by each sample priorto cooling can be read directly from the plot.
The fission track data from Yemen (Figure 14; Menzies et al 1997) mostclearly conform to the boomerang trend and show a coherent reduction in age

P1: NBL/RPK/dat/ary P2: ARK/plb QC: ARK/abe T1: ARK
March 25, 1998 14:59 Annual Reviews AR055-15
560 GALLAGHER ET AL
from a maximum of∼450 Ma to a minimum of∼20 Ma, with the expectedvariation in mean track length. This pattern is very similar to that shown byfission track data from the western margin of the Gulf of Suez and the northernRed Sea margin (Omar et al 1989, Omar & Steckler 1995) and from the easternRed Sea margin of Saudi Arabia (Bohannon et al 1989). Collectively, these dataindicate that a major phase of accelerated denudation was initiated along bothmargins of the Red Sea during or shortly after rifting during the Late Miocene–Oligocene (Omar et al 1989, Steckler & Omar 1994, Omar & Steckler 1995,Menzies et al 1997). Although the distribution of ages within the coastal regionsof the Red Sea and Gulf of Suez has been complicated by vertical offset acrossbrittle normal faults in many places, it is clear that the maximum amount ofdenudation (>∼5 km) occurred along the initial rift margin and diminisheswith increasing distance inland toward the present escarpment (Steckler &Omar 1994). Significantly, the fission track data along the western Red Searift (Steckler & Omar 1994) indicate∼2 km of postrift Oligocene denudationinland of the present escarpment. This pattern of denudation, and the ubiquitousoccurrence of normal faults along the coastal region (e.g. Garfunkel 1988), isclearly best described by the scarp retreat or pinned divide class of landscapedevelopment models, but it is incompatible with the downwarp models.
The data set from southeast Australia (Moore et al 1986, Dumitru et al 1991)conforms broadly to the boomerang trend expected for a simple single-stagecooling history, in which the onset of cooling is approximately coeval with thetime of rifting. There is, however, some complexity that cannot be accomo-dated within the simple boomerang trend. The data from both southeast Brazil(Gallagher et al 1994, 1995) and southern Africa also indicate that the youngestages are significantly younger than the age of the rifting that led to the formationof these margins. This difference clearly indicates that a substantial amount ofpostrift denudation has occurred along these margins. Again, these data sets donot conform to the idealized boomerang trend, indicating a denudation historymore complex than a single-stage rift-related event.
Extracting Quantitative Denudation Estimatesfrom Fission Track DataObtaining optimum thermal histories for each sample in a large regional dataset is straightforward using the annealing models and optimization methodsdiscussed above. Paleotemperature maps for the region can then be constructedfor any chosen time simply by contouring the predicted paleotemperature forthat time from the optimum thermal history calculated for each sample. Thesepaleotemperatures can then be converted to estimates of denudation since thechosen time by dividing by an estimate of the paleogeothermal gradient at eachof the sample sites.

P1: NBL/RPK/dat/ary P2: ARK/plb QC: ARK/abe T1: ARK
March 25, 1998 14:59 Annual Reviews AR055-15
FISSION TRACK ANALYSIS 561
Well-constrained estimates of the paleogeothermal gradient are particularlydifficult to obtain. Paleogeothermal gradients can be estimated directly bymodeling the fission track parameters for a vertical sequence of samples, col-lected either from a deep bore hole or from a steep topographic profile (Brownet al 1994b, Gleadow & Brown 1997), using a similar philosophy to that de-scribed for sedimentary basin applications. However, as argued above, withinsubaerial passive margin settings, the thermal gradient is unlikely to have beensignificantly elevated during rifting. If this is the case, then an estimate of thepresent thermal gradient based on down-hole temperature measurements and/orregional heat flow measurements may be adequate.
To demonstrate the potential of this approach, Brown et al (1997) determinedoptimum thermal histories for all samples from the southern African data setwest of 24◦E, using the modeling procedure described by Gallagher (1995).From these thermal histories, they determined the total amount of synrift (158–118 Ma) and postrift (118–0 Ma) cooling for each of the sample sites. Thethermal gradient for each site was estimated by interpolation of the available heatflow data for southern Africa (Pollack et al 1993) and by assuming an effectiveaverage thermal conductivity of 2.2 W m−1 K−1. The results are presented ascontour maps of predicted synrift and postrift denudation in Figure 15.
These maps clearly show the large variability in the amount of predicteddenudation across the margin and within the interior of southern Africa. Ingeneral, the model predicts the largest amount of postrift denudation along thecoastal region, with decreasing amounts further inland. However, distinctiveanomalies are evident. For example, over 4 km of postrift denudation is pre-dicted for a relatively restricted region that is more than 400 km inland of themargin near 22◦E, 29◦S. According to the model thermal histories for the sam-ples in this region, the majority of this denudation occurs between 100–60 Ma,which postdates the time of rifting by∼50–60 My (Brown et al 1997). Thelocation of the anomaly broadly coincides with a complex, northwest-trendingstructural zone marking the western boundary of the Kaapvaal craton (Tankardet al 1982). The location, the restricted areal distribution of the anomaly,and the timing of the predicted denudation suggest that the anomaly is un-related to the initial formation of the margin but rather may be associatedwith later tectonic reactivation of the craton boundary during the LateCretaceous.
The availability of large regional fission track data sets from the subaerialsectors of passive margins and the abundance of high-resolution seismic reflec-tion data for many of the adjacent offshore basins are increasing. With thisgrowth comes enormous potential for combining these complementary datasources to develop, for the first time in many instances, quantitative models forthe formation and subsequent long-term development of passive margins.
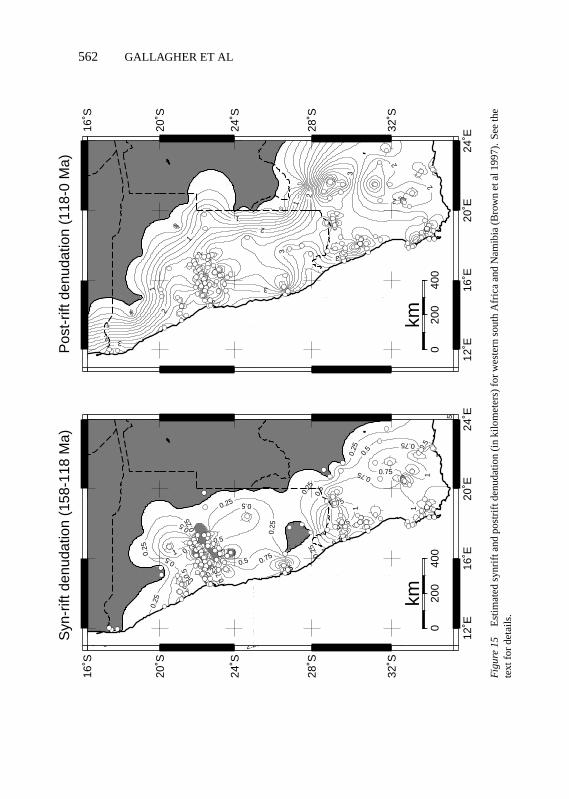
P1: NBL/RPK/dat/ary P2: ARK/plb QC: ARK/abe T1: ARK
March 25, 1998 14:59 Annual Reviews AR055-15
562 GALLAGHER ET AL
0.25
0.25
0.25
0.25
0.25
0.25
0.25
0.25
0.25
0.25
0.25
0.25
0.25
0.25
0.25
0.25
0.5
0.50.50.5
0.5
0.5
0.5
0.5
0.5
0.5
0.5
0.5
0.5 0.
5
0.5
0.5
0.75
0.75
0.75
0.75
0.75
0.75
0.75
0.75
0.75
0.75 0.75
0.75
0.75
0.75
1
11
1
1
1
1
1
1
1
1.25
1.251.25
1.25
1.25
1.5
1.51.5
1.5
1.5
1.75
1.751.75 2
22 2.25
2.252.25
12˚E
16˚E
20˚E
24˚E
32˚S
28˚S
24˚S
20˚S
16˚S
020
040
0
km
1
1
1
1
1
2
2
2
2
2
2
2
2
2
2
333
3
3
3
3
3
12˚E
16˚E
20˚E
24˚E
32˚S
28˚S
24˚S
20˚S
16˚S
020
040
0
km
Syn
-rift
den
udat
ion
(158
-118
Ma)
Pos
t-rif
t den
udat
ion
(118
-0 M
a)
Fig
ure
15E
stim
ated
synr
ifta
ndpo
stri
ftde
nuda
tion
(in
kilo
met
ers)
forw
este
rnso
uth
Afr
ica
and
Nam
ibia
(Bro
wn
etal
1997
).Se
eth
ete
xtfo
rde
tails
.

P1: NBL/RPK/dat/ary P2: ARK/plb QC: ARK/abe T1: ARK
March 25, 1998 14:59 Annual Reviews AR055-15
FISSION TRACK ANALYSIS 563
CONCLUDING STATEMENTS
Fission track analysis has come a long way since the early 1960s, when Fleischer,Price, and Walker first considered the relevance of the technique to geologicalproblems. The past 10 years or so have seen a great expansion in its geologicalapplications, primarily because of the improved understanding of the informa-tion contained in the data. The recognition that track length data are criticalto understanding fission track ages and the subsequent development of quanti-tative annealing models were two significant advances. The very fact that theclosure temperature concept is not generally valid has proved a positive bonus.In practice, this means that from a single fission track analysis, a thermal historycan be constructed that is considerably more detailed than the basic interpre-tation of an age as the time when the sample cooled through a single closuretemperature.
In this review, we touch briefly on still unresolved issues. These include atruly physically based understanding of the mechanisms of track formation andannealing and a complete characterization of the factors that can influenceannealing, such as chemical composition and crystal structure. In comparisonwith apatite, the annealing characteristics of zircon are poorly understood, whilevirtually nothing is known for sphene. The extrapolation of laboratory anneal-ing experiments to geological time scales will always involve a degree of faiththat the dominant mechanism does not change; more intermediate to long time-scale (e.g. 103–108 years) case studies for the different minerals, includingapatite, are required. A final issue is that the analytical procedure is relativelylabor intensive. In principle, the process can be improved by automation andimage analysis. Some ongoing work is focused in this area, but to date nopractical system has been produced.
The technique has a lot to offer as it stands, provided that it is used in theappropriate context and generally not in isolation. The increasing applicationof fission track analysis as an exploration tool in the hydrocarbon industry at-tests to this. In the regional tectonic context, well-designed detailed samplingstrategies linked with structural mapping can provide key information for under-standing the evolution of fault systems and for resolving tectonic and erosionalcontributions to denudation and cooling. As more regional fission track datasets are generated, there is great scope for understanding long-term landscapeevolution in general and how the long-term inferences relate to both the inter-mediate time-scale cosmogenic isotopic estimates (104–106 year) (e.g. Cerling& Craig 1994, Nishiizumi et al 1993, Gillespie & Bierman 1995) and short-term historical estimates (less than 100 years) (Summerfield & Hulton 1994).Recently, Wolf et al (1997) demonstrated the application of (U-Th)/He datingof apatite in thermochronology and denudation studies. This system has great

P1: NBL/RPK/dat/ary P2: ARK/plb QC: ARK/abe T1: ARK
March 25, 1998 14:59 Annual Reviews AR055-15
564 GALLAGHER ET AL
promise, particularly because of its low-temperature sensitivity (40◦–75◦C),and should provide complementary information to the apatite fission track data.These combined data will then provide some insight into the general applica-bility of short-term controls (e.g. denudation rates are proportional to reliefand discharge) that operate on geological time scales. In the general contextof continental mass and chemical recycling, the application of regional fissiontrack–derived denudation histories (rock/sediment volumes) has considerablescope in mass and geochemical balance calculations that seek to understand thefeedback relationship between continental weathering/denudation rates (river-ine fluxes), plate tectonics (mid-ocean ridge fluxes), climate change, and oceanchemistry. Perhaps it is surprising that microscopic-scale fission tracks cancontribute unique data for understanding macro- to continental-scale processesoperating over geological time scales.
ACKNOWLEDGMENTS
We acknowledge numerous discussions with and comments from many col-leagues who are from or have passed through the fission track groups inMelbourne and London over the years and, in particular, Andy Carter, TrevorDumitru, Paul Fitzgerald, Andy Gleadow, Chris Hawkesworth, Tony Hurford,Marta Mantovani, Mike de Wit, and Mike Summerfield. Kevin Burke alsoprovided useful criticism of an earlier draft of the manuscript. Some of thework reported here has been supported by the Natural Environmental ResearchCouncil, the Royal Society, the University of London Central Research Fund,the Nuffield Foundation, and Anglo-American (De Beers, SOPEMI—Pesquisae Exploracao de Mineros SIA).
Visit the Annual Reviews home pageathttp://www.AnnualReviews.org.
Literature Cited
Ahrens TJ, Fleischer RL, Price PB, Woods RT.1970. Erasure of fission tracks in glasses andsilicates by shock waves.Earth Planet. Sci.Lett.8:420–26
Armstrong PA, Kamp PJJ, Allis RG, ChapmanDS. 1997. Thermal effects of intrusion belowthe Taranaki Basin (New Zealand): evidencefrom combined apatite fission track age andvitrinite reflectance data.Basin Res.9:151–69
Arne D. 1992. The application of fission trackthermochronology to the study of ore de-posits. InShort Course Handbook on LowTemperature Thermochronology, ed. M Zen-tilli, PH Reynolds, 20:21–42. Toronto: Min.Soc. Can.
Arne D, Zentilli M. 1994. Apatite fission trackthermochonology integrated with vitrinite re-flectance. InVitrinite Reflectance as a Matu-rity Parameter, ed. PK Mukhopadhyay, WGDow,ACS Symp. Ser., 570:249–68. Washing-ton, DC: Am. Chem. Soc.
Baker J, Seward D. 1996. Timing of Cretaceousextension and Miocene compression in north-east South Island, New Zealand: constraintsfrom Rb-Sr and fission-track dating of an ig-neous pluton.Tectonics15:976–83
Baldwin SL, Harrison TM, Burke K. 1986. Fis-sion track evidence for the source of accretedsandstones, Barbados.Tectonics5:457–68
Barbarand J, Pagel M, Blanc P, BraunJ-J, Chaussidon M, et al. 1997. Combined

P1: NBL/RPK/dat/ary P2: ARK/plb QC: ARK/abe T1: ARK
March 25, 1998 14:59 Annual Reviews AR055-15
FISSION TRACK ANALYSIS 565
cathodoluminecence spectra, fission-trackage and chemistry of detrital apatite grains:towards a better understanding of fissiontrack annealing. Preprint
Benjamin MT, Johnson NM, Naeser CW. 1987.Recent rapid uplift in the Bolivian Andes:evidence from fission-track dating.Geology15:680–83
Bergman SC, Corrigan J. 1996. Composi-tional variation of natural apatites subjectedto fission track analysis.8th Int. WorkshopFission-Track Dating, Gent. 7(Abstr.)
Bhandari N, Bhat SG, Lal D, Rajagopalan G,Tamhane AS, Venkatavaradan VS. 1971. Fis-sion fragments in apatite: recordable tracklengths.Earth Planet. Sci. Lett.13:191–99
Bigazzi G. 1981. The problem of the decay con-stantλf of 238U. Nucl. Tracks5:35–44
Bigazzi G, Bonadonna FP, Laurenzi MA, Tonar-ini S. 1993. A test sample for FT dating ofglass shards.Nucl. Tracks21:489–97
Blythe AE, Bird J, Omar GI. 1996. De-formational history of the central BrooksRange, Alaska: results from fission-track and40Ar/39Ar analyses.Tectonics15:440–55
Bohannon RG, Naeser CW, Schmidt DL, Zim-mermann RA. 1989. The timing of uplift, vol-canism and rifting peripheral to the Red Sea:a case for passive rifting?J. Geophys. Res.94:1683–701
Brandon MT. 1992. Decomposition of fissiontrack grain-ages distributions.Am. J. Sci.292:535–64
Brandon MT, Vance JA. 1992. Fission track agesof detrital zircons: implications for the tec-tonic evolution of the Cenozoic Olympic sub-duction complex.Am. J. Sci.292:565–636
Bray RJ, Green PF, Duddy IR. 1992. Thermalhistory reconstruction using apatite fissiontrack analysis and vitrinite reflectance; a casestudy from the UK East Midlands and south-ern North Sea. InExploration Britain; Geo-logical Insights for the Next Decade, ed. RFPHardman,Geol. Soc. London Spec. Publ.67:2–25. London: Geol. Soc. London
Brown RW. 1991. Backstacking apatite fission-track ‘stratigraphy’: a method for resolv-ing the erosional and isostatic rebound com-ponents of tectonic uplift histories.Geology19:74–77
Brown RW. 1992.A fission track study of thesub-aerial continental margins of southernAfrica.PhD thesis. Univ. Melbourne. 407 pp.
Brown RW, Gallagher K, Duane M. 1994a. Aquantitative assessment of the effects of mag-matism on the thermal history of the Ka-roo sedimentary sequence.J. Afr. Earth Sci.18:227–43
Brown RW, Gallagher K, Gleadow AJW, Sum-merfield MA. 1997. Morphotectonic evo-lution of the South Atlantic margins of
Africa and South America. InGeomorphol-ogy and Global Tectonics, ed. MA Summer-field. Chichester: Wiley & Sons. In press
Brown RW, Summerfield MA. 1997. Someuncertainties in the derivation of rates ofdenudation from thermochronologic data.Earth Surf. Process. Land.22:239–48
Brown RW, Summerfield MA, Gleadow AJW.1994b. Apatite fission track analysis: its po-tential for the estimation of denudation ratesand implications of long-term landscape de-velopment. InProcess Models and Theoreti-cal Geomorphology, ed. MJ Kirkby, pp. 23–53. New York: Wiley & Sons
Buck WR, Martinez F, Steckler MS, CochranJR. 1988. Thermal consequences of litho-spheric extension: pure and simple.Tectonics7:213–34
Burnham AK, Sweeney JJ. 1989. A chemicalkinetic model of vitrinite reflectance matura-tion.Geochim. Cosmochim. Acta53:2649–57
Burtner R, Nigrini A, Donelick RA. 1994. Ther-mochronology of Lower Cretaceous Sourcerocks in the Idaho-Wyoming Thrust belt.Bull. Am. Assoc. Petrol. Geol.78:1613–36
Carlson WD. 1990. Mechanisms and kinetics ofapatite fission-track annealing.Am. Mineral.75:1120–39
Carlson WD. 1993a. Mechanisms and kinet-ics of apatite fission-track annealing—replyto Kevin D. Crowley.Am. Mineral.78:213–15
Carlson WD. 1993b. Mechanisms and kineticsof apatite fission-track annealing—reply toGreen and others.Am. Mineral.78:446–49
Carpena J, Mailh´e D. 1993. Fission-track dat-ing: its importance in geology. InNuclearMethods of Dating, ed. E Roth, B Poty, pp.189–233. Dordrecht: Kluwer Acad.
Carter A, Bristow C, Hurford AJ. 1995a. Con-straints on the thermal history and prove-nance of the Khorat Group in Thailand usingfission track analysis.Geol. Soc. Vietnam J.Geol.B5–6:341–53
Carter A, Bristow C, Hurford AJ. 1995b. Theapplication of fission track analysis to dat-ing of barren sequences: examples fromred beds in Scotland and Thailand. InNon-Biostratigraphical Methods of Dating andCorrelation, ed. RE Dunay, EA Hailwood,Geol. Soc. London Spec. Publ.89:57–68.London: Geol. Soc. London
Cerling TE, Craig H. 1994. Geomorphologyand in-situ cosmogenic isotopes.Annu. Rev.Earth Planet. Sci.22:273–317
Cerveny PF, Naeser ND, Zeitler PK, NaeserCW, Johnson NM. 1988. History of uplift andrelief of the Himalaya during the last 18 mil-lion years: evidence from fission-track agesof detrital zircons from sandstones of the Si-walik group. InNew Perspectives in Basin

P1: NBL/RPK/dat/ary P2: ARK/plb QC: ARK/abe T1: ARK
March 25, 1998 14:59 Annual Reviews AR055-15
566 GALLAGHER ET AL
Analysis, ed. KL Kleinspehn, C Paola, pp.43–61. New York: Springer-Verlag
Chadderton LT. 1988. On the anatomy of a fis-sion track.Nucl. Tracks15:11–29
Copeland P, Harrison TM, Yun P, Kidd WSF,Roden M, Yukuan Z. 1995. Thermal evolu-tion of the Gangdese batholith, southern Ti-bet: a history of episodic unroofing.Tectonics14:223–36
Corrigan J. 1991. Inversion of fission track datafor thermal history information.J. Geophys.Res.96:10347–60
Corrigan JD. 1993. Apatite fission track anal-ysis of Oligocene strata in South Texas,U.S.A.: testing annealing models.Chem.Geol.104:227–49
Corrigan JD, Crowley KD. 1992. Unroofing ofthe Himalayas; a view from apatite fission-track analysis of Bengal Fan sediments.Geo-phys. Res. Lett.19:2345–48
Crowley KD. 1993a. Mechanisms and ki-netics of apatite fission-track annealing—discussion.Am. Mineral.78:210–12
Crowley KD. 1993b. Lenmodel: a forwardmodel for calculating length distributions andfission-track ages in apatite.Comp. Geosci.19:619–26
Crowley KD, Cameron M, Schaefer RL. 1991.Experimental studies of annealing of etchedtracks in fluorapatite.Geochim. Cosmochim.Acta55:1449–65
Dodson MH. 1973. Closure temperature incooling geochronological and petrologicalsystems.Contrib. Mineral. Petrol.40:259–74
Dokka RK. 1993. Original dip and subsequentmodification of a Cordilleran detachmentfault, Mojave extensional belt, California.Geology21:711–14
Dokka RK, Mahaffie MJ, Snoke AW. 1986.Thermochronologic evidence of major tec-tonic denudation associated with detach-ment faulting, northern Ruby Mountains-East Humboldt Range, Nevada.Tectonics5:995–1006
Donelick RA. 1991. Crystallographic orien-tation dependence of mean etchable tracklength in apatite: a physical model and exper-imental observations.Am. Mineral.76:83–91
Donelick RA, Roden MK, Mooers JD, Carpen-ter BS, Miller DS. 1990. Etchable length re-duction of induced fission tracks in apatite atroom temperature (∼23◦C): crystallographicorientation effects and “initial” mean lengths.Nucl. Tracks17:261–65
Duddy IR, Green PF, Bray RJ, Hegarty KA.1994. Recognition of the thermal effects offluid flow in sedimentary basins. InGeoflu-ids; Origin, Migration and Evolution of Flu-ids in Sedimentary Basins, ed. J Parnell,Geol.Soc. London Spec. Publ.78:325–45
Duddy IR, Green PF, Laslett GM. 1988. Ther-
mal annealing of fission tracks in apatite 3.Variable temperature behaviour.Chem. Geol.73:25–38
Dumitru TA. 1993. A new computer-automatedmicroscope stage system for fission trackanalysis.Nucl. Tracks Radiat. Meas.21:575–80
Dumitru TA. 1997. Fission-track geochronol-ogy. In Quaternary Geochronology: Appli-cations to Quaternary Geology and Paleo-seismology, ed. JS Noller, JM Sowers, WRLettis,Geol. Soc. Am. Spec. Publ.In press
Dumitru TA, Hill KC, Coyle DA, Duddy IR,Foster DA, et al. 1991. Fission track ther-mochronology: application to continentalrifting of south-eastern Australia.Aust. Pet.Explor. Assoc. J.31:131–42
Dumitru TA, Miller EL, O’Sullivan PB, AmatoJM, Hannula KA, et al. 1995. Cretaceous toRecent extension in the Bering Strait region,Alaska.Tectonics14:549–63
England PC, Molnar P. 1990. Surface uplift, up-lift of rocks, and exhumation of rocks.Geol-ogy18:1173–77
Feinstein S, Kohn BP, Eyal M. 1989. Signifi-cance of combined vitrinite reflectance andfission-track studies in evaluating thermalhistory of sedimentary basins; an examplefrom southern Israel. InThermal History ofSedimentary Basins, ed. ND Naeser, TH Mc-Culloh, pp. 197–216. New York: Springer-Verlag. 319 pp.
Feinstein S, Kohn BP, Steckler MS, Eyal M.1996. Thermal history of the eastern marginof the Gulf of Suez, I. reconstruction fromborehole temperature and organic maturitymeasurements.Tectonophysics266:203–20
Fitzgerald PG, Fryxel JE, Wernicke BP. 1991.Miocene crustal extension and uplift in south-eastern Nevada; constraints from fission trackanalysis.Geology19:1013–16
Fitzgerald PG, Gleadow AJW. 1988. Fission-track geochronology, tectonics and structureof the Transantarctic Mountains in North-ern Victoria Land, Antactica.Chem. Geol.73:169–98
Fitzgerald PG, Sorkhabi RB, Redfield TF,Stump E. 1995. Uplift and denudation of thecentral Alaska Range; a case study in the useof apatite fission track thermochronology todetermine absolute uplift parameters.J. Geo-phys. Res.100:20175–91
Fleischer RL, Price PB, Walker RM. 1965. Ef-fects of temperature, pressure and ionizationon the formation and stability of fission tracksin minerals and glasses.J. Geophys. Res.70:1497–502
Fleischer RL, Price PB, Walker RM. 1975.Nu-clear Tracks in Solids.Berkeley: Univ. Calif.Press. 605 pp.
Foster DA, Gleadow AJW, Mortimer G. 1994.

P1: NBL/RPK/dat/ary P2: ARK/plb QC: ARK/abe T1: ARK
March 25, 1998 14:59 Annual Reviews AR055-15
FISSION TRACK ANALYSIS 567
Rapid Pliocene exhumation in the Karako-ram (Pakistan), revealed by fission-track ther-mochronology of the K2 gneiss.Geology22:19–22
Foster DA, Gleadow AJW, Reynolds SJ,Fitzgerald PG. 1993. Denudation of meta-morphic core complexes and the reconstruc-tion of the transition zone, west centralArizona: constraints from apatite fissiontrack thermochronology.J. Geophys. Res.98:2167–85
Foster DA, Kohn BP, Gleadow AJW. 1996.Sphene and zircon fission track closuretemperatures revisited: empirical calibra-tions from 40Ar/39Ar diffusion studies ofK-feldspar and biotite.8th Int. WorkshopFission-Track Dating, Gent.37 (Abstr.)
Foster DA, Miller DS, Miller CF. 1991. Ter-tiary extension in the Old Women Mountainsarea, California: evidence from apatite fis-sion track analysis.Tectonics10:875–86
Galbraith RF. 1988. Graphical display of esti-mates having different standard errors.Tech-nometrics30:271–81
Galbraith RF. 1990. The radial plot: graphicalassessment of spread in ages.Nucl. Tracks17:207–14
Galbraith RF, Green PF. 1990. Estimating thecomponent ages in a finite mixture.Nucl.Tracks17:197–206
Galbraith RF, Laslett GM. 1988. Some calcula-tions relevant to thermal annealing of fissiontracks in apatite.Proc. R. Soc. London Ser. A419:305–21
Galbraith RF, Laslett GM. 1993. Statisticalmodels for mixed fission track ages.Nucl.Tracks21:459–70
Galbraith RF, Laslett GM, Green PF, Duddy IR.1990. Apatite fission track analysis; geologi-cal thermal history analysis based on a three-dimensional random process of linear radi-ation damage.Proc. R. Soc. London Ser. A332:419–38
Gallagher K. 1995. Evolving temperature his-tories from apatite fission-track data.EarthPlanet. Sci. Lett.136:421–35
Gallagher K, Brown RW. 1997. The onshorerecord of passive margin evolution.J. Geol.Soc. London154:451–57
Gallagher K, Hawkesworth C, Mantovani M.1994. The denudation history of the onshorecontinental margin of S.E. Brazil inferredfrom fission track data.J. Geophys. Res.99:18117–45
Gallagher K, Hawkesworth C, Mantovani M.1995. Denudation, fission track analysis andthe long-term evolution of passive margin to-pography: application to the S.E. Brazilianmargin.J. South Am. Earth Sci.8:65–77
Garfunkel Z. 1988. The relation between con-tinental rifting and uplifting: evidence from
the Suez rift and northern Red Sea.Tectono-physics150:33–49
Garver JL, Brandon MT. 1994. Erosional de-nudation of the British Columbia CoastRanges as determined from fission-track agesof detrital zircon from the Tofino Basin.Bull.Geol. Soc. Am.106:1398–412
Gilchrist AR, Kooi H, Beaumont C. 1994. Post-Gondwana geomorphic evolution of south-western Africa: implications for the controlson landscape development from observationsand numerical experiments.J. Geophys. Res.99:12211–28
Gilchrist AR, Summerfield MA. 1991. Differ-ential denudation and flexural isostasy in theformation of rifted margin upwarps.Nature346:739–42
Gillespie AR, Bierman PR. 1995. Precision ofterrestrial exposure ages and erosion ratesestimated from analysis of cosmogenic iso-topes produced in-situ.J. Geophys. Res.100:24637–49
Gleadow AJW. 1978. Anisotropic and vari-able etching characteristic in natural sphenes.Nucl. Track Detect.2:105–17
Gleadow AJW. 1981. Fission track dating meth-ods: What are the real alternatives?Nucl.Tracks5:3–14
Gleadow AJW, Brown RW. 1997. Fission trackthermochronology and the long-term denuda-tional response to tectonics. InGeomorphol-ogy and Global Tectonics, ed. MA Summer-field. Chichester: Wiley & Sons. In press
Gleadow AJW, Duddy IR. 1981. A natural longterm annealing experiment for apatite.Nucl.Tracks5:169–74
Gleadow AJW, Duddy IR, Green PF, LoveringJF. 1986. Confined track lengths in apatite: adiagnostic tool for thermal history analysis.Contrib. Mineral. Petrol.94:405–15
Gleadow AJW, Duddy IR, Lovering JF. 1983.Apatite fission-track analysis as a palaeotem-perature indicator for hydrocarbon explo-ration.Aust. Petrol. Explor. Soc. J.23:93–102
Gleadow AJW, Lovering JF. 1974. The effectof weathering on fission track dating.EarthPlanet. Sci. Lett.22:163–68
Gleadow AJW, Lovering JF. 1978. Fission trackgeochronology of King Island, Bass Straight,Australia: relationship to continental rifting.Earth Planet. Sci. Lett.37:429–37
Grasemann B, Mancktelow NS. 1993. Two-dimensional thermal modelling of normalfaulting: the Simplon Fault Zone, CentralAlps, Switzerland.Tectonophysics225:155–65
Green PF. 1986. On the thermo-tectonic evo-lution of Northern England: evidence fromfission track analysis.Geol. Mag.153:493–506
Green PF. 1988. The relationship between track

P1: NBL/RPK/dat/ary P2: ARK/plb QC: ARK/abe T1: ARK
March 25, 1998 14:59 Annual Reviews AR055-15
568 GALLAGHER ET AL
shortening and fission track age reduction inapatite; combined influences of inherent in-stability, annealing anisotropy, length biasand system calibration.Earth Planet. Sci.Lett.89:335–52
Green PF. 1996. The importance of composi-tional influence on fission track annealing inapatite.8th Int. Workshop Fission-Track Dat-ing, Gent.43 (Abstr.)
Green PF, Duddy IR, Bray RJ. 1995. Appli-cations of thermal history reconstruction ininverted basins. InBasin Inversion, ed. JGBuchanan, PG Buchanan,Geol. Soc. LondonSpec. Publ.88:149–65
Green PF, Duddy IR, Gleadow AJW, LoveringJF. 1989a. Apatite fission track analysis aspalaeotemperature indicator for hydrocarbonexploration. InThermal History of Sedimen-tary Basins, ed. ND Naeser, TH McCulloh,pp. 181–95. New York: Springer-Verlag. 319pp.
Green PF, Duddy IR, Gleadow AJW, TingatePR, Laslett GM. 1986. Thermal annealing offission tracks in apatite, 1. A qualitative de-scription.Chem. Geol.59:237–53
Green PF, Duddy IR, Laslett GM, Hegarty KA,Gleadow AJW, Lovering JF. 1989b. Ther-mal annealing of fission tracks in apatite 4.Quantitative modelling techniques and exten-sion to geological timescales.Chem. Geol.79:155–82
Green PF, Hegarty KA, Duddy IR, Foland SS,Gorbachev V. 1996. Geological constraintson fission track annealing in zircon.8th Int.Workshop Fission-Track Dating, Gent.44(Abstr.)
Green PF, Hurford AJ. 1984. Thermal neu-tron dosimetry for fission track dating.Nucl.Tracks9:231–41
Green PF, Laslett GM, Duddy IR. 1993.Mechanisms and kinetics of apatite fission-track annealing—discussion.Am. Mineral.78:441–45
Grundmann G, Morteani G. 1985. The younguplift and thermal history of the central east-ern Alps (Austria/Italy), evidence from ap-atite fission track ages.Jahrb. Geol. Bunde-sant. A128:197–216
Harrison TM, Armstrong RL, Clarke GKC.1978. Thermal models and cooling histo-ries from fission-track, K-Ar, Rb-Sr, and U-Pb mineral dates, northern Coast PlutonicComplex, British Columbia. InShort Papersof the Fourth International Conference onGeochronology, Cosmochronology, and Iso-tope Geolology, ed. RE Zartman,Open FileRep. US Geol. Surv., pp. 167–70. Reston, VA:US Geol. Surv.
Harrison TM, Armstrong RL, Naeser CW,Harakal JE. 1979. Geochronology and ther-mal history of the Coast Plutonic Complex,
near Prince Rupert, British Columbia.Can.J. Earth Sci.16:400–10
Harrison TM, Be K. 1983. 40Ar/39Ar spec-trum analysis of detrital microclines from thesouthern San Joaquin Basin, California: anapproach to determining the thermal evolu-tion of sedimentary basins.Earth Planet. Sci.Lett.64:244–56
Hasebe N, Tagami T, Nishimura S. 1994. To-wards zircon fission-track thermochronol-ogy; reference framework for confined tracklength measurements.Chem. Geol.112:169–78
Hendrix MS, Dumitru TA, Graham SA. 1994.Late Oligocene-early Miocene unroofing inthe Chinese Tian Shan; an early effect of theIndia-Asia collision.Geology22:487–90
Hill KC, Hill KA, Cooper GT, O’Sullivan AJ,O’Sullivan PB, Richardson MJ. 1995. Inver-sion around the Bass Basin, SE Australia.In Basin Inversion, ed. JG Buchanan, PGBuchanan,Geol. London Spec. Publ.88:525–47
Howard KA, Foster DA. 1996. Thermal and un-roofing history of a thick, tilted Basin-and-Range crustal section in the Tortilla Moun-tains, Arizona.J. Geophys. Res.101:511–22
Houseman GA, McKenzie DP, Molnar P. 1981.Convective instability of a thickened bound-ary layer and its relevance for the thermalevolution of continental convergent belts.J.Geophys. Res.86:6115–32
Hubbard MS, Royden L, Hodges KV. 1991.Constraints on unroofing rates in the HighHimalaya, eastern Nepal.Tectonics10:287–98
Hunziker JC, Desmons J, Hurford AJ. 1992.Thirty-two years of geochronological workin the Central and Western Alps: a review onseven maps.Mem. Geol. (Lausanne)13:59
Hurford AJ. 1986. Cooling and uplift patternsin the Lepontine Alps, south central Switzer-land, and an age of vertical movement onthe Insubric fault line.Contrib. Min. Petrol.92:413–27
Hurford AJ. 1990a. International Union ofGeological Sciences Subcommission onGeochronology recommendation for thestandardization of fission track dating cali-bration and data reporting.Nucl Tracks17:233–36
Hurford AJ. 1990b. Standardization of fission-track dating calibration: recommendationby the Fission Track Working Group of theI.U.G.S. Subcommission on Geochronology.Chem. Geol.80:171–78
Hurford AJ, Carter A. 1991. The role of fissiontrack dating in discrimination of provenance.In Developments in Sedimentary ProvenanceStudies, ed. AC Morton, SP Todd, PDW

P1: NBL/RPK/dat/ary P2: ARK/plb QC: ARK/abe T1: ARK
March 25, 1998 14:59 Annual Reviews AR055-15
FISSION TRACK ANALYSIS 569
Haughton,Geol. Soc. London Spec. Publ.57:67–78
Hurford AJ, Fitch FJ, Clarke A. 1984. Reso-lution of the age structure of detrital zirconpopulations of two lower Cretaceous sand-stones from the Weald of England by fissiontrack dating.Geol. Mag.121:285–317
Hurford AJ, Green PF. 1982. A users’ guide tofission track dating.Earth Planet. Sci. Lett.59:343–54
Hurford AJ, Green PF. 1983. The zeta age cal-ibration of fission-track dating.Chem. Geol.1:285–317
Hurford AJ, Hunziker JC, Stockhert B. 1991.Constraints on the late thermotectonic evo-lution of the Western Alps: evidence forepisodic rapid uplift.Tectonics10:758–69
Issler DR, Beaumont C, Willett SD, DonelickRA, Mooers J, Grist A. 1990. Preliminaryevidence from apatite fission track data con-cerning the thermal history of the Peace RiverArch region, Western Canada SedimentaryBasin.Bull. Can. Petrol. Soc.38A:250–69
John BE, Foster DA. 1993. Structural and ther-mal constraints on the initiation angle ofdetachment faulting in the southern Basinand Range: the Chemehuevi Mountains casestudy.Geol. Soc. Am. Bull.105:1091–108
Johnson C. 1996. Zircon fission track anneal-ing and quantitative thermal history mod-elling. 8th Int. Workshop Fission-Track Dat-ing, Gent.60 (Abstr.)
Johnson C. 1997. Resolving denudational histo-ries in orogenic belts with apatite fission trackthermochronology and structural data: an ex-ample from southern Spain.Geology25:623–26
Johnson C, Harbury N, Hurford AJ. 1997. Therole of extension in the Miocene denuda-tion of the Nevado-Fil´abride Complex, BeticCordillera (SE Spain).Tectonics16:189–204
Kamp PJJ, Green PF. 1990. Thermal and tec-tonic history of selected Taranaki Basin (NewZealand) wells assessed by apatite fissiontrack analysis.Bull. Am. Assoc. Petrol. Geol.74:1401–19
Kamp PJJ, Green PF, White SH. 1989. Fissiontrack analysis reveals character of collisionaltectonics in New Zealand.Tectonics8:169–95
Kamp PJJ, Tippet JM. 1993. Dynamics of Pa-cific plate crust in the South Island (NewZealand) zone of oblique continent-continentconvergence.J. Geophys. Res.98:16105–18
Kamp PJJ, Webster KS, Nathan S. 1996. Ther-mal history analysis by integrated mod-elling of apatite fission track and vitrinitereflectance data: application of an invertedbasin (Buller Coalfield, New Zealand).BasinRes.8:383–402
King LC. 1962.The Morphology of the Earth.Edinburgh: Oliver & Boyd (2nd. ed., 1967)
Kohn BP, Feinstein S, Foster DA, Steckler MS,Eyal M. 1997. Thermal history of the easternGulf of Suez, II. Reconstruction from apatitefission track and40Ar/39Ar K-feldspar mea-surements.Tectonophysics.In press
Kooi H, Beaumont C. 1994. Escarpment evo-lution on high-elevation rifted margins: in-sights derived from a surface processes modelthat combines diffusion, advection, and reac-tion. J. Geophys. Res.99:12191–209
Koons PA. 1995. Modeling the topographic evo-lution of collisional mountain belts.Annu.Rev. Earth Planet. Sci.23:375–408
Kowallis BJ, Heaton JS, Bringhurst K. 1986.Fission-track dating of volcanically derivedsedimentary rocks.Geology14:19–22
Laslett GM, Galbraith R. 1996. Statisticalmodelling of thermal annealing of fissiontracks in apatite.Geochim. Cosmochim. Acta60:5117–31
Laslett GM, Galbraith R, Green PF. 1994. Theanalysis of projected fission track lengths,Nucl. Tracks23:103–23
Laslett GM, Gleadow AJW, Duddy IR. 1984.The relationship between fission track lengthand track density in apatite.Nucl. Tracks9:29–38
Laslett GM, Green PF, Duddy IR, GleadowAJW. 1987. Thermal annealing of fissiontracks in apatite, 2. A quantitative analysis.Chem. Geol.65:1–13
Laslett GM, Kendall WS, Gleadow AJW,Duddy IR. 1982. Bias in measurement of fis-sion track length distributions.Nucl. Tracks6:79–85
Laubacher G, Naeser CW. 1994. Fission-trackdating of granitic rocks from the EasternCordillera of Peru: evidence for Late Jurassicand Cenozoic cooling.J. Geol. Soc. London151:473–83
Lee J. 1995. Rapid uplift and rotation of my-lonitic rocks from beneath a detachment fault:insights from potassium feldspar40Ar/39Arthermochronology, northern Snake Range,Nevada.Tectonics14:54–77
Lonergan L, Johnson C. 1998. A novel approachfor reconstructing the denudation histories ofmountain belts: with an example from theBetic Cordillera (S. Spain).Basin Res.Sub-mitted
Lutz TM, Omar GI. 1991. An inverse methodof modelling thermal histories from apatitefission-track data.Earth Planet. Sci. Lett.104:181–95
Makris J, Tsironidis J, Richter H. 1991. Heat-flow density distribution in the Red Sea.Tectonophysics198:383–93
Mancktelow NS, Grasemann B. 1997. Time-dependent effects of heat advection and

P1: NBL/RPK/dat/ary P2: ARK/plb QC: ARK/abe T1: ARK
March 25, 1998 14:59 Annual Reviews AR055-15
570 GALLAGHER ET AL
topography on cooling histories during ero-sion.Tectonophysics270:167–95
Mathews WH. 1975. Cenozoic erosion and ero-sion surfaces of eastern North America.Am.J. Sci.275:818–24
McGoldrick PJ, Gleadow AJW. 1977. Fissiontrack dating of Lower Palaeozoic sandstonesat Tatong, North Central Victoria.J. Geol.Soc. Aust.12:295–332
Menzies MA, Gallagher K, Hurford AJ, Yel-land A. 1997. Red Sea and Gulf of Adenrifted margins, Yemen: denudational histo-ries and margin evolution.Geochim. Cos-mochim. Acta61:2511–27
Miller DS, Lakatos S. 1983. Uplift rate ofAdirondack anorthosite measured by fission-track analysis of apatite.Geology11:284–86
Miller EL, Dumitru TA, Brown RW, Gans PB.1997. Fission track dating of Miocene slip onthe Snake Range d´ecollement.Geol. Soc. Am.Bull. In press
Moore ME, Gleadow AJW, Lovering JF. 1986.Thermal evolution of rifted continental mar-gins: new evidence from fission tracks inbasement apatites from southeastern Aus-tralia.Earth Planet. Sci. Lett.78:255–70
Morgan P, Boulos FK, Hennin SF, El-Sherif AA,El-Sayed AA, et al. 1985. Heat flow in easternEgypt: the thermal signature of a continentalrift. J. Geodyn.4:107–31
Naeser CW. 1979. Thermal history of sedimen-tary basins: fission track dating of subsur-face rocks. InAspects of Diagenesis, ed. PAScholle, PR Schluger,Soc. Econ. Paleontol.Mineral. Spec. Publ.26:109–12
Naeser ND. 1993. Apatite fission-track analysisin sedimentary basins—a critical appraisal.In Basin Modelling: Advances and Applica-tions, ed. AG Dore, JH Auguston, C Her-manrud, DJ Stewart, ø Sylta,Nor. Petrol.Soc. (NPF) Spec. Publ.3:147–60. Amster-dam: Elsevier
Naeser ND, Crowley KD, McCulloh TH.1990. Thermal history of rocks in south-ern San Joaquin Valley, California; evidencefrom fission-track analysis.Bull. Am. Assoc.Petrol. Geol.74:13–29
Nelson EP. 1982. Post-tectonic uplift of theCordillera Darwin orogenic core complex:evidence from fission track geochronologyand closing temperature-time relationships.J. Geol. Soc. London139:755–61
Nishiizumi K, Kohl CP, Arnold JR, Dorn R,Klein J, et al. 1993. Role of in-situ cosmo-genic nuclides10Be and26Al in the studyof diverse geomorphic processes.Earth Surf.Process. Landf.18:407–25
Ollier CD. 1985. Morphotectonics of passivemargins with great escarpments. InTectonicGeomorphology, ed. M Morisawa, JT Hack,pp. 4–25. Boston: Allen & Unwin
Ollier CD, Pain CF. 1997. Equating the basal un-conformity with the palaeoplain: a model forpassive margins.Geomorphology19:1–15
Omar GI, Steckler MS. 1995. Fission-track evi-dence on the initial rifting of the Red Sea: twopulses, no propagation.Science270:1341–44
Omar GI, Steckler MS, Buck WR, Kohn BP.1989. Fission-track analysis of basement ap-atites at the western margin of the Gulf ofSuez rift, Egypt: evidence for synchroneityof uplift and subsidence.Earth Planet. Sci.Lett.94:316–28
O’Sullivan PB. 1996. Late Mesozoic and Ceno-zoic thermotectonic evolution of the ColvilleBasin, North Slope, Alaska. InThermal Evo-lution of Sedimentary Basins in Alaska, ed.MJ Johnsson, DG Howell.US Geol. Surv.Bull. 2142:45–79
O’Sullivan PB, Parrish RR. 1995. The impor-tance of apatite composition and single-grainages when interpreting fission track data fromplutonic rocks: a case study from the CoastRanges, British Columbia.Earth Planet. Sci.Lett.132:213–24
Pagel M, Braun JJ, Disnar JR, Martinez L,Renac C, Vasseur G. 1997. Thermal historyconstraints from studies of organic matter,clay minerals, fluid inclusions and apatite fis-sion tracks at the Ardeche paleo-margin (BA1Drill Hole, GPF program), France.J. Sedi-ment. Res.67:235–45
Parrish RR. 1985. Some cautions which shouldbe exercised when interpreting fission trackand other dates with regard to uplift rate cal-culations.Nucl. Tracks10:425
Partridge TC, Maud RR. 1987. Geomorphicevolution of southern Africa since the Meso-zoic.S. Afr. J. Geol.90:179–208
Paul T, Fitzgerald PF. 1992. Transmissionelectron microscope investigation of fissiontracks in apatite.Am. Mineral.77:336–44
Plafker G, Naeser CW, Zimmermann RA, LullJS, Hudson T. 1991. Cenozoic uplift historyof the Mount McKinley area in the CentralAlaska Range based on fission track dating.US Geol. Surv. Bull.2041:202–12
Platt JP, England PC. 1993. Convective removalof lithosphere beneath mountain belts: ther-mal and mechanical consequences.Am. J.Sci.294:307–36
Poag CW, Sevon WD. 1989. A record of Ap-palachian denudation in postrift Mesozoicand Cenozoic sedimentary deposits of theU.S. middle Atlantic continental margin.Ge-omorphology2:119–57
Pollack HN, Hurter SJ, Johnson JR. 1993. Heatflow from the Earth’s interior: analysis of theglobal data set.Rev. Geophys.31:267–80
Rahn MK, Hurford AJ, Frey M. 1997. Rota-tion and exhumation of a thrust plane: apatite

P1: NBL/RPK/dat/ary P2: ARK/plb QC: ARK/abe T1: ARK
March 25, 1998 14:59 Annual Reviews AR055-15
FISSION TRACK ANALYSIS 571
fission track data from the Glarus thrust,Switzerland.Geology25:599–602
Ratschbacher L, Frisch W, Neubauer F, SchmidSM, Neugebauer J. 1989. Extension in com-pressional orogenic belts: the eastern Alps.Geology17:404–7
Ravenhurst C, Roden MK, Willett SD, MillerDS. 1992. Dependence of fission track an-nealing on apatite crystal chemistry.7th Int.Workshop Fission-Track Thermochronology,Philadelphia.11 (Abstr.)
Roberts SV, Burbank DW. 1993. Uplift and ther-mal history of the Teton Range (northwesternWyoming) defined by apatite fission-trackdating.Earth Planet. Sci. Lett.118:295–308
Rohrmann M, Andriessen PAM, van der BeekP. 1995. The relationship between basin andmargin thermal evolution assessed by fissiontrack thermochronology: an application tooffshore southern Norway.Basin Res.8:45–63
Rust DJ, Summerfield MA. 1990. Isopach andborehole data as indicators of rifted marginevolution in southwestern Africa.Marine Pet.Geol.7:277–87
Sambridge MS, Compston W. 1994. Mixturemodelling of multi-component data sets withapplication to ion-probe zircon ages.EarthPlanet. Sci. Lett.128:373–90
Searle MP, Parrish RR, Hodges KV, HurfordAJ, Ayres MW, Whitehouse MJ. 1997. ShishaPangma Leucogranite, South Tibetan Hi-malaya: field relations, geochemistry, age,origin, and emplacement.J. Geol.105:295–317
Seidl MA, Weissel JK, Pratson LF. 1996. Thekinematics and pattern of escarpment retreatacross the rifted continental margin of SEAustralia.Basin Res.12:301–16
Selverstone J. 1988. Evidence for east-westcrustal extension in the Eastern Alps: impli-cations for the unroofing history of the TauernWindow.Tectonics7:87–105
Selverstone J, Axen GJ, Bartley JM. 1995. Fluidinclusion constraints on kinematics of foot-wall uplift beneath the Brenner Line normalfault, eastern Alps.Tectonics14:264–78
Shane PAR, Black TM, Alloway BV, West-gate JA. 1996. Early to middle Pleistocenetephrachronology of North Island, NewZealand; implications for volcanism, tecton-ism, and paleoenvironments.Geol. Soc. Am.Bull. 108:915–25
Silk ECH, Barnes RS. 1959. Examination offission fragment tracks with an electron mi-croscope.Phil. Mag.4:970–71
Silverman BW. 1986.Density Estimation forStatistics and Data Analysis.London: Chap-man & Hall. 175 pp.
Steckler MS, Omar GI. 1994. Controls on ero-sional retreat of the uplifted rift flanks at the
Gulf of Suez and northern Red Sea.J. Geo-phys. Res.99:12159–73
Steckler MS, Watts AB. 1978. Subsidence ofthe Atlantic-type continental margin off NewYork. Earth Planet. Sci. Lett.42:1–13
Stump E, Fitzgerald PG. 1992. Episodic up-lift of the Transantarctic Mountains.Geology20:161–64
Stuwe K, White L, Brown R. 1994. The influ-ence of eroding topography on steady-stateisotherms. Application to fission track anal-ysis.Earth Planet. Sci. Lett.124:63–74
Summerfield MA, Hulton NJ. 1994. Naturalcontrols of fluvial denudation rates in ma-jor world drainage basins.J. Geophys. Res.99:13871–83
Tagami T, Carter A, Hurford AJ. 1996. Natu-ral long-term annealing of the zircon fission-track system in Vienna Basin deep bore-hole samples; constraints upon the partial an-nealing zone and closure temperature.Chem.Geol.130:147–57
Tagami T, Galbraith RF, Yamada R, Laslett GM.1997. Revised annealing kinetics of fissiontracks in zircon and geological implications.Chem. Geol.In press
Tagami T, Ito H, Nishimura S. 1990. Thermalannealing characteristics of spontaneous fis-sion tracks in zircon.Chem. Geol.80:159–69
Tagami T, Shimada C. 1996. Natural long-termannealing of the zircon fission track systemaround a granitic pluton.J. Geophys. Res.101:8245–55
Tankard AJ, Jackson MP, Eriksson KA, HobdayDK, Hunter DR, Minter WEL. 1982.CrustalEvolution of Southern Africa: 3.8 BillionYears of Earth History.New York: Springer-Verlag. 523 pp.
Thompson AB, Ridley JR. 1987. Pressure-temperature-time (P-T-t) histories of oro-genic belts.Philos. Trans. R. Soc. London Ser.A 321:27–45
Tippet JM, Kamp PJJ. 1993. Fission track analy-sis of the late Cenozoic vertical kinematics ofcontinental Pacific crust, South Island, NewZealand.J. Geophys. Res.98:16119–48
Titterington DM, Smith AFM, Makov UE.1985.Statistical Analysis of Finite MixtureDistributions.New York: Wiley & Sons. 243pp.
Tseng HY, Onstott TC, Burrus RC, MillerDS. 1996. Constraints on the thermal his-tory of Taylorsville Basin, Virginia, U.S.A.,from fluid-inclusion and fission-track anal-yses; implications for subsurface geomicro-biology experiments.Chem. Geol.127:297–311
Tucker GE, Slingerland RL. 1994. Erosional dy-namics, flexural isostasy, and long-lived es-carpments: a numerical modeling study.J.Geophys. Res.99:12229–43

P1: NBL/RPK/dat/ary P2: ARK/plb QC: ARK/abe T1: ARK
March 25, 1998 14:59 Annual Reviews AR055-15
572 GALLAGHER ET AL
Villa IM, Puxeddu M. 1994. Geochronology ofthe Larderello geothermal field: new dataand the “closure temperature issue.”Contrib.Mineral. Petrol.115:415–26
Vrojlik P, Donelick RA, Queng J, Cloos M.1992. Testing models of fission track anneal-ing in apatite in a simple thermal setting: site800, leg 129.Proc. Ocean Drilling Program,Sci. Results, ed. R Larson, Y Lancelot, AFisher, L Abrams, R Behl, et al, 129:169–76.College Station, TX: Ocean Drill. Prog.
Wagner GA. 1979a. Archaeometric dating. InLectures in Isotope Geology, ed. E Jager,JC Hunziker, pp. 178–88. Berlin: Springer-Verlag
Wagner GA. 1979b. Correction and interpreta-tion of fission track ages InLectures in Iso-tope Geology, ed. E Jager, JC Hunziker, pp.170–77. Berlin: Springer-Verlag
Wagner GA. 1988. Apatite fission-track geo-chrono-thermometer to 60◦C: projectedlength studies.Chem. Geol.72:145–53
Wagner GA, Hejl E. 1991. Apatite fission-trackage-spectrum based on projected track lengthanalysis.Chem. Geol.87:1–9
Wagner GA, Reimer GM. 1972. Fission tracktectonics: the tectonic interpretation of fis-sion track ages.Earth Planet. Sci. Lett.14:263–68
Wagner GA, Reimer GM, J¨ager E. 1977. Cool-ing ages derived by apatite fission track, micaRb-Sr, and K-Ar dating: the uplift and cool-ing history of the central Alps.Mem. Inst.Geol. Mineral. Univ. Padova30:1–27
Wagner G, Van den Haute P. 1992.Fission-Track Dating.Dordrecht: Kluwer Acad. 285pp.
Walcott RI. 1997. Modes of oblique compres-sion: Late Cenozoic tectonics of the South Is-land of New Zealand.Rev. Geophys.In press
Wang HF, Crowley KD, Nadon GC. 1994. Ther-mal history of the Michigan Basin from ap-atite fission-track analysis and vitrinite re-flectance. InBasin Compartments and Seals,ed. PJ Ortoleva,Mem. Am. Assoc. Petrol.Geol.61:167–77
Wernicke B. 1985. Uniform-sense normal sim-ple shear of the continental lithosphere.Can.J. Earth Sci.22:108–25
Westgate JA. 1989. Isothermal plateau fission-track ages of hydrated glass shards from
silicic tephra beds.Earth Planet. Sci. Lett.95:858–61
Wheeler J, Butler RWH. 1994. Criteria for iden-tifying structures related to true crustal exten-sion in orogens.J. Struct. Geol.16:1023–28
Willet SD. 1992. Modelling thermal anneal-ing of fission tracks in apatite. InShortCourse Handbook on Low Temperature Ther-mochronology, ed. M Zentilli, PH Reynolds,20:43–72. Toronto: Min. Soc. Can.
Willett SD. 1997. Inverse modeling of anneal-ing of fission tracks in apatite, 1. A controlledrandom search method.Am. J. Sci.In press
Willet SD, Beaumont C, Fullsack P. 1993. Me-chanical model for the tectonics of dou-bly vergent compressional orogens.Geology21:371–74
Wolf RA, Farley KA, Silver LT. 1997. Assess-ment of (U-Th)/He thermochronometry: thelow-temperature history of the San JacintoMountains, California.Geology25:65–68
Yamada R, Tagami T, Nishimura S. 1995a.Confined fission-track length measurementof zircon; assessment of factors affectingthe paleotemperature estimate.Chem. Geol.119:293–306
Yamada R, Tagami T, Nishimura S, Ito H.1995b. Annealing kinetics of fission tracks inzircon; an experimental study.Chem. Geol.122:249–58
Yim WWS, Gleadow AJW, van Moort JC. 1985.Fission track dating of alluvial zircons andheavy mineral provenance in Northeast Tas-mania.J. Geol. Soc. London142:351–56
Young E, Myers AT, Munson EL, Conklin NM.1969. Mineralogy and geochemistry of flu-orapatite from Cerro de Mercado, Durango,Mexico.US Geol. Surv. Prof. Pap.650-D:84–93
Zeitler PK. 1985. Cooling history of the NWHimalaya, Pakistan.Tectonics4:127–51
Zeitler PK, Johnson NM, Naeser CW,Tahirkheli RAK. 1982. Fission track evi-dence for Quaternary uplift of the NangaParbat region, Pakistan.Nature298:255–57
Zhao MW, Behr HJ, Ahrendt H, Wemmer K,Ren Z, Zhao Z. 1996. Thermal and tectonichistory of the Ordos Basin, China; evidencefrom apatite fission track analysis, vitrinitereflectance, and K-Ar dating.Am. Assoc.Petrol. Geol. Bull.80:1110–34