gaging streams
DESCRIPTION
gaging streamTRANSCRIPT

Techniques of Water-Resources Investigations
of the United States Geological Survey
Chapter A6
GENERAL PROCEDURE FOR GAGING STREAMS
By R. W. Carter and Jacob Davidian
Book 3
APPLICATIONS OF HYDRAULICS
DEPARTMENT OF THE INTERIOR
DONALD PAIJL HODEL, Secretary
U.S. CEOLO<;ICAL SURVEY
Dallas L. Peck., Director
First printing 1968 Second printing 1969 Third printing 1977 Fourth printing 1989
UNITED STATES GOVERNMENT PRINTING OFFICE : 1968
For sale by the Books and Open-File Reports Section U.S. Geological Survey Federal Center, Elox 25425 Denver, CO 802;!5

PREFACE
The series of manuals on techniques describes procedures for planning and executing specialized work in water-resources investigations. The material is grouped under major subject headings called books and further subdivided into sections and chapters; section A of book 3 is on surface- water techniques.
The unit of publication, the chapter, is limited to a narrow field of subject matter. This format permits flexibility in revision and publication as the need arises.
Provisional drafts of chapters are distributed to field offices of the U.S. Geological Survey for their use. These drafts are subject to revision because of experience in use or because of advancement in knowledge, techniques, or equipment. After the technique described in a chapter is sufficiently developed, the chapter is published and is sold by the U.S. Geological Survey Books and Open-File Reports Section, Federal Center, Box 25425, Denver, CO 80225 (authorized agent of Superintendent of Documents, Government Printing Office). 111

TECHNIQUES OF WATER-RESOURCES INVESTIGATIONS OF THE UNITED STATES GEOLOGICAL SURVEY
The U.S. Geological, Survey publishes a series of manuals describing procedures for planning and conducting specialized work in water-resources investigations. The manuals published to date are listed below and may be ordered by mail from the U.S. Geological Survey, Books and Open-File Reports, Federal Center, Box 25425, Denver, Colorado 80225 (an authorized agent of the Superintendent of Documents, Government Printing Office).
Prepayment is required. Remittance should be sent by check or money order payable to U.S. Geological Survey. Prices are not included in the listing below as they are subject to change. Current prices can be obtained by writing to the USGS, Books and Open File Reports. Prices include cost of domestic surface transportation. For transmittal outside the U.S.A. (except to Canada and Mexico) a surcharge of 25 percent of the net bill should be included to cover surface transportation. When ordering any of these publications, please give the title, book number, chapter number, and “U.S. Geological Survey Techniques of Water-Resources Investigations.”
TWI l-Dl.
TWI l-D2.
TWI 2-Dl. TWI 2-D2. TWI 2-El. TWI 3-Al. TWI 3-A2. TWI 3-A3. TWI 3-A4. TWI 3-AS. TWI 3-A6. TWI 3-A7. TWI 3-A8. TWI 3-A9.
TWI 3-AlO. TWX 3-All. TWI 3-A12.
TWI 3-A13. TWI 3-A14. TWI 3-A15. TWI 3-A16. TWI 3-A17. TWI 3-Bl. TWI 3-B2.1 TWI 3-B3. TWI 3-B?+.
TWI 3-B6.
TWI 3X1. TWI 3-C2. TWI 3x3. TWI 4-Al. TWI 4-A2. TWI 4-Bl. TWI 4-B2. TWI 4-B3. TWI 4-Dl. TWI S-Al.
Water temperature-influential factors, field measurement, and data presentation, by H.H. Stevens, Jr., J.F. Ficke, and G.F. Smoot. 1975. 6.5 pages.
Guidelines for collection and field analysis of ground-water samples for selected unstable constituents, by W.W. Wood. 1976. 24 pages.
Application of surface geophysics to ground water investigations, by A.A.R. Zohdy, G.P. Eaton, and D.R. Mabey. 1974.116 pages. Application of seismic-refraction techniques to hydrologic studies, by F.P. Haeni. 1988. 86 p. Application of borehole geophysics to water- resources investigations, by W.S. Keys and L.M. MacCary. 1971. 126 pages. General field and office procedures for indirect discharge measurement, by M.A. Benson and Tate Dalrymple. 1967. 30 pages. Measurement of peak discharge by the slope-area method, by Tate Dahymple and M.A. Benson. 1967. 12 pages. Measurement of peak discharge at culverts by indirect methods, by G.L. Bodhaine. 1968. 60 pages. Measurement of peak discharge at width contractions by indirect methods, by H.F. Matthai. 1967. 44 pages. Measurement of peak discharge at dams by indirect methods, by Harry Hulsing. 1967. 29 pages. General procedure for gaging streams, by R.W. Carter and Jacob Davidian. 1968. 13 pages. Stage measurements at gaging stations, by T.J. Buchanan and W.P. Somers. 1968. 28 pages. Discharge measurements at gaging stations, by T.J. Buchanan and W.P. Somers. 1969. 6.5 pages. Measurement of time of travel and dispersion in streams by dye tracing, by E.F. Hubbard, F.A. Kilpatrick, L.A. Martens, and 0
J.F. Wilson, Jr. 1982. 44 pages. Discharge ratings at gaging stations, by E.J. Kennedy. 1984. 59 pages. Measurement of discharge by moving-boat method, by G.F. Smoot and C.C. Novak. 1969. 22 pages. Fluorometric procedures for dye tracing, Revised, by James F. Wilson, Jr., Ernest D. Cobb, and Frederick A. Kilpatrick. 1986. 41
pages. Computation of cclntinuous records of streamflow, by Edward J. Kennedy. 1983. 53 pages. Use of flumes in measuring discharge, by F.A. Kilpatrick, and V.R. Schneider. 1983. 46 pages. Computation of water-surface profiles in open channels, by Jacob Davidian. 1984. 48 pages. Measurement of discharge using tracers, by F.A. Kilpatrick and E.D. Cobb. 198.5. 52 pages. Acoustic velocity meter systems, by Antonius Laenen. 198.5. 38 pages. Aquifer-test design, obsewation, and data analysis, by R.W. Stallman. 1971. 26 pages. Introduction to ground-water hydraulics, a programmed text for self-instruction, by G.D. Bennett. 1976. 172 pages. Type curves for selected problems of flow to wells in confined aquifers, by J.E. Reed. 1980. 106 pages. Definition of boundary and initial conditions in the analysis of saturated ground-water flow systems-an introduction, by 0. Lehn
Franke, Thomas E. Reilly, and Gordon D. Bennett. 1987. 15 pages. The principle of superposition and its application in ground-water hydraulics, by Thomas E. Reilly, 0. Lehn Franke, and Gordon
D. Bennett. 1987. 28 pages. Fluvial sediment concepts, by H.P. Guy. 1970. 55 pages. Field methods of rneasurement of fluvial sediment, by H.P. Guy and V.W. Norman. 1970. 59 pages. Computation of fluvial-sediment discharge, by George Porterfield. 1972. 66 pages. Some statistical tc’ols in hydrology, by H.C. Riggs. 1968. 39 pages. Frequency cures, by H.C. Riggs, 1968. 15 pages. Low-flow investigations, by H.C. Riggs. 1972. 18 pages. Storage analyses for water supply, by H.C. Riggs and C.H. Hardison. 1973. 20 pages. Regional analyses of streamflow characteristics, by H.C. Riggs. 1973. 15 pages. Computation of rate and volume of stream depletion by wells, by C.T. Jenkins. 1970. 17 pages. Methods for determination of inorganic substancesin water and fluvial sediments, by M.W. Skougstad and others, editors. 1979.626
pages.
‘Spanish translation also available.
N
TWI S-A2. TWI s-A3.
0 TWI S-A4.
TWI S-AS.
TWI S-A6.
TWI S-Cl. TWI 6-Al.
TWI 7x1.
TWI 7-C2.
TWI 7-c3.
TWI S-Al. TWI 8-A2. TWI 8-B2.
Determination of minor elements in water by emission spectroscopy, by P.R. Barnett and E.C. Mallory, Jr. 1971. 31 pages. Methods for the determination of organic substances in water and fluvial sediments, edited by R.L. Wershaw, M.J. Fishman, R.R.
Grabbe, and L.E. Lowe. 1987. 80 pages. This manual is a revision of “Methods for Analysis of Organic Substances in Water” by Donald F. Goerlitz and Eugene Brown, Book 5, Chapter A3, published in 1972.
Methods for collection and analysis of aquatic biological and microbiological samples, edited by P.E. Greeson, T.A. Ehlke, G.A. Irwin, B.W. Lium, and K.V. Slack. 1977.332 pages.
Methods for determination of radioactive substances in water and fluvial sediments, by L.L. Thatcher, V.J. Janzer, and K.W. Edwards. 1977. 95 pages.
Quality assurance practices for the chemical and biological analyses of water and fluvial sediments, by L.C. Friedman and D.E. Erdmann. 1982. 181 pages.
Laboratory theory and methods for sediment analysis, by H.P. Guy. 1969. 58 pages. A modular three-dimensional finite-difference ground-water flow model, by Michael G. McDonald and Arlen W. Harbaugh. 1988.
586 pages. Finite difference mode1 for aquifer simulation in two dimensions with results of numerical experiments, by P.C. Trescott, G.F.
Pinder, and S.P. Larson. 1976. 116 pages. Computer mode1 of two-dimensional solute transport and dispersion in ground water, by L.F. Konikow and J.D. Bredehoeft. 1978.
90 pages. A model for simulation of flow in singular and interconnected channels, by R.W. Schaffranek, R.A. Baltzer, and D.E. Goldberg.
1981. 110 pages. Methods of measuring water levels in deep wells, by M.S. Garber and F.C. Koopman. 1968. 23 pages. Installation and service manual for U.S. Geological Survey monometers, by J.D. Craig. 1983. 57 pages. Calibration and maintenance of vertical-axis type current meters, by G.F. Smoot and C.E. Novak. 1968. 15 pages.

CONTENTS Page
Preface_--_________-____________________--- III Discharge measurements-Continued Abstract ______-__-________-_______________ - 1 Indirect discharge measurements-. _ _ _ - _ _ - _ Introduction_-__-__-____________________--- 1 Dilutionmethod_-..-- ______________ -__-_ General objective and procedures_-_--_-_--___ 1 Discharge ratings-- ___ _-_-_ _____ __ _ __ ___ __ __ Selection of gaging site_-_-___-__-_-__- ______ 2 Stage-discharge relations.- __ __ _ __ -_ _ __ _ _ _
Artificial controls- _ _ _ _ _ _ _ _. _ . _ _ _ - _ - - _ - _ - _ _ _ . 3 Complex discharge ratings- ____________ -_
Measurement of stage ________ -__-__-_-_-__-_ 5 Computation and preparation of discharge
Methods of sensing stage-. . _. _ _ _ _ _. _ ___ __ records_-____________-_-----_-_---_-_____
5 Water-stage recorders.. -_ ._________ -__-__
Station analysis_ _ _ _-_ __ _ __ __ __ _ __ ____ __ 6 Manual computations-- -__ ___ __ __ __ _ _ ___
Referencegages----__- ________ -__----__ 6 Automatic computations. _ _ _ _ - - - __ _____ _ Dischargemeasurements __.___ -_-----_-_- ____ 6 Publication of records __-_ _- ___ __ -_ ____ __ ____
Current-meter measurements._-_-__-__-__ 7 References- _ __ _____ _- __ __ _ __ __ _ __ __ __ _. __ __
Page
7 9
10 10 12
12 12 12 13 13 13
FIGURES
I-10. Photographs: 1. Gage and natural control, Little Spokane River at Elk, Wash-_ _ _-__ 2. Gage, concrete control, outside gage on bridge, and an engineer making
a wading measurement, Kaskaskia River at Bondville, Ill--- _ _ _ _ _ _ 3. Concrete artificial control on Mill Creek near Coshocton, Ohio- _ _ _ __ 4. Artificial control on Delaware River near Red Bluff, N. Mex., with
shallow V-notch in the broad-crested weir _______________________ 5. Bubble-gage digital-recorder arrangement. Gas tank on right; digital-
punch recorder onleft ____ -_- ____ - ____ - _____ - _____ -_--_--_--_- 6. Measuring discharge with current meter by wading- _ _ _- __ -_ _ - __ __ _ 7. Measuring discharge with current meter from bridge over the Hudson
RiveratPoughkeepsie,N.Y--- _____ -__- _____ - __________ - _____ 8. VADA (velocity-azimuth-depth-assembly) equipment in USC for meas-
urcmentfrom bridge----_--__-- ._____._______________________ 9. Pressurized constant-rate injection tanks for injection of dye into
strcams__-__-_-_-__----~---------~--~----~--~-----------~--- 10. Equipment for fluorometer testing of water samples in the field___ -- _
Page
2
4 5
5
6 8
9
9
10 11
VII

GENERAL PROCEDURE FOR GAGING STREAMS
By R. W. Carter and Jacob Davidian
Abstract
This chapter briefly describes the objectives and pro- cedures used in obtaining streamflow records. It is considered an introduction to other chapters on sur- face-water techniques which treat individual prow- dures in greater detail.
Introduction
Measurement of the flow of streams was be- gun by the U.S. Geological Survey in 1888 as part of special studies relating to the irrigation of public lands. Since that ‘time systematic records of streamflow have been obtained at more than 16,000 places in the United States by the Geological Survey. In 1967 the stream- gaging network comprised about 9,000 eonltinu- ous-record stat,ions. In additi’on, there were Itbout 7,200 partial-record stations where data on only floodflow or low flow were obtained.
Stream gaging is the largest operation among the various hydrologic networks. Sit,reamflow is 4he only part of the hydrologic cycle in which moisture is so confined as to permit reasona- bly accurate measurements of the volumes in- volved. All other measurements in the hydro- logic cycle are at best only inadequate samples of the whole.
Water in streams serves man in many ways; it provides water supply for man and animals, irrigation water for plants, dilu(tion and t,rans- port for removal of waste, energy for produc- tion of power, channels for water transport, and a medium of recreation. Records of stream- flow arc important in each of these uses.
Water in streams can also be a hazard. Floods NUSP extensive damage and hardship. Records of flood evelits ol>tnined at, gaging s~atioiis serve as the Isis for the design of highway bridge8 and cul\.erts, dams, :~nd flood-control reservoirs
and for flood-plain delineation and flood- warning systems.
The network of stream-gaging stations is de- signed to meet ‘the various needs for informa- tion on streamflow. Many stations are operated to provide current information for use in the day-by-day management of water supplies or for use in forecasting flood events. Most of the stations, however, are operated as a par;t of the hydrologic network. Records for these stations reflect the natural hydrologic characteristics of the basins a.nd can thus be used as samples of the variations of streamflow in time and space.
The design of streamflow networks is gov- erned to some extent by the ability to measure stage and discharge at a given site to the re- quired degree of accuracy. The continued de- velopment of new instrumentation and analyti- cal techniques has improved the capabilihy of obtaining streamflow records under difficult conditions.
This chapter describes in general terms the techniques used in obtaining continuous stream- flow records-fromrselection of site ito publica- tion of records. 6t is considered an introduction t,o four other chapters in book 3, section A, surface-water techniques, which describe in de- t,ail the instruments and techniques used in making specific measurements. This series of chapters may be considered an updating of Water-Supply Paper 888, “Stream Gaging Procedure.”
General Objective and Procedures
The objective in operating a gaging station is to obtain a continuous record of stage and discharge at the site. The exact location of the station is chosen to take advantage of the best
1
2 TECHNIQUES OF WATER-RESOURCES INVESTIGATIONS
available condition for stage and discharge measurements and for developing discharge ratings.
A continuous record of stage is obtained by installing instruments that sense and record the mater-surface elevation in the stream. Dis- charge measureme& are initially made at vari- ous stages to define. the relation between stage nncl discharge. Discharge measurements are then made at periodic intervals, usually mont~hly, to verify the stage-discharge relation or to define any change in the relation owing to changes in channel geometry.
At many sites the discharge is not a unique function of stage; variables other than stage also must be continuously measured to obtain a discharge record. For example, stream slope is measured by the installation of an auxiliary stage gage downstream if variable backwater occurs. ,4t other sit,es a continuous measure of stream velocity at a point in the cross section is obtained and used as an additional variable in the discharge rating. The rate of change of stage cm bc an important variable at sites hav- ing considerable misteadiness of flow.
Low weirs and dams are constructed at some stations to stabilize the stage-discharge rcla- tions in the low-flow range. These control struc- t urcs arc calibrated by stage and discharge measurements in the field.
The data obtainecl at the gaging station are wviewed :~iid analyzed by engineering ~WI-SOIII~C~~ :lt. the encl of the wltcr year. Discharge ratings are established, and the gage-height record is reduced to mean values for selected time peri- ods. The mean discharge for each day and ex- tremes of discharge for the year are computed. The data are then prepared for publication,
Selection OF Gaging Site The selection of gaging sites is dictated by
the needs of water management. or by the re- quirements of the hydrologic network. In ful- tilling \~*ilte~-lll;lll~l~~elllellt needs there is little or no freedom of choice in selecting gaging sites, and frequently records must be obtained Imder \-ery :~clvcrse hydraulic conditions. For example, many of the principal streams in the TJnited States have been converted into a series of pools by the const,ruction of dams; yet, very
precise records are needed for operation. Rec- ords are also needed in tidal reaches of stream channels in connection with water supply, salin- ity contamination, or waste disposal.
Hydrologic network requirements allow more choice in selecting good sites for gaging, al- though in some places gaging conditions are poor throughout an entire region. For example, all streams in a given region may have unstable beds and banks, which result in continually changing stage-discharge relations. However, before a stream-gaging station is constructed, a general reconnaissance is made in order that the most suitable site for the gage may be se- lected. This reconnaissance is facilitated by an examination of geologic, topographic, and other maps of the area. Tentative sites for gaging sta- tions may be indicated on the maps, each site being subject to critical examination of the phy- sical characteristics of the stream channel. In selecting a site consideration should be given to the following items : I. Channel characteristics relative to a fixed
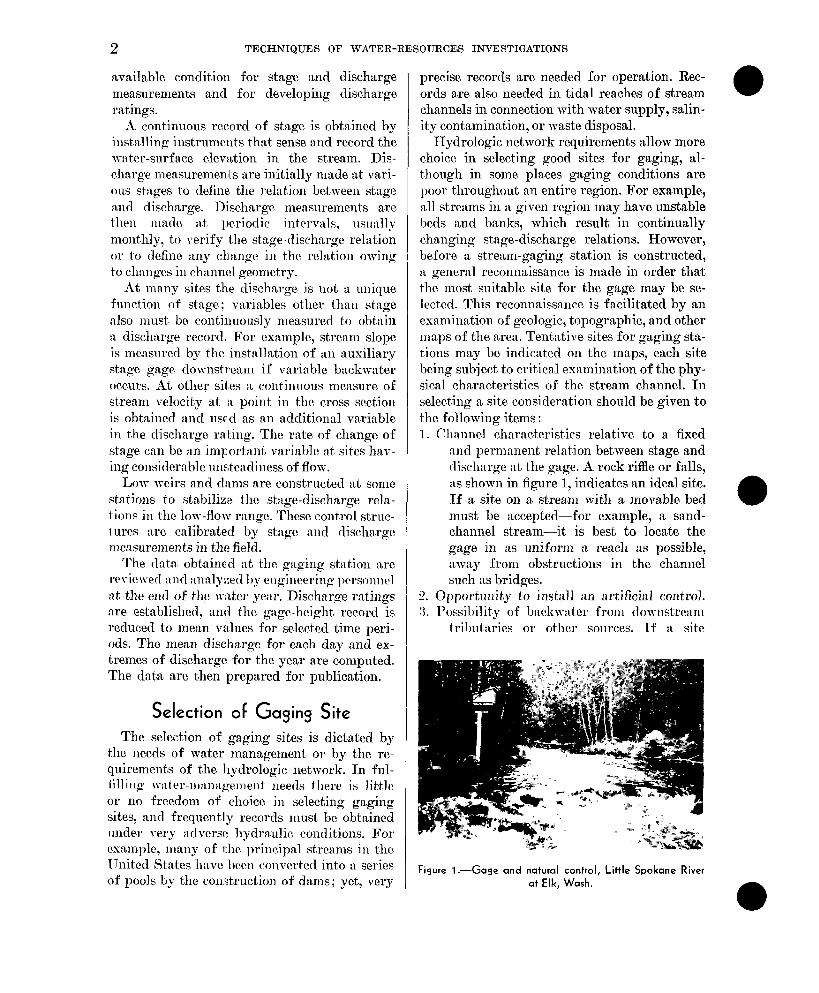
2nd permanent relation between stage and discharge at the gage. A rock riffle or falls, as shown in figure 1, indicates an ideal site. If a site on a stream with a movable bed must be accepted-for example, a sand- cha,nnel stream-it is best to locate the gage in as uniform a reach as possible, away from obstructions in the channel such as bridges.
2. Opportunity to install an artificial control. 3. 1’ossibilit.y of backwater from downstream
tribut,nries or 0t;her sources. If a site
Figure l.-Gage and natural control, Little Spokane River at Elk, Wash.

GENERAL PROCEDURE FOR GAGING STREAMS 3
where backwater occurs must be accepted, a uniform reach for measurement of slope
stage-discharge relation at low stages may gen- erally be eliminated or alleviated by the con- struction of an artificial control. The structure is seldom designed to function as a complete control throughout the entire range of stage. Generally it is impracticable to build it high enough to eliminate the effects of downstream conditions at high stages unless there is a steep fall below the gage. If the downstream slope is flat, so that with an increase in discharge the water below the control rises faster than the water above it, the control may be completely effective only for low and medium stages. Fig- ure 3 shows the artficial control on Mill Creek near Coshocton, Ohio. A differently shaped artificial control is shown in figure 4, for the gage on the Delaware River near Red Bluff, N. Mex. Note the shallow V-notch in the broad- crested weir, to improve sensitiveness.
Alt,hough the artificial control is usually con- structed in the form of a dam or a weir, it is seldom if ever desirable to attempt the use of a weir formula as its rating. The rating for each station should be determined lby a current- meter or other met,hod of measuring discharge. The conditions or facilities for the accurate measurement of small streams and for the measurement of the low-water flow of larger streams commonly can be improved by the use of artifical controls.
a
0
should be sought, in addition to the proper placement of an auxiliary gage. Un- steady flow such as occurs in tide-affected stream channels requires similar considera- tion but, in addition, line power must be available to insure simultaneous record- ing of stage at the two gages.
4. Availability of a nearby cross section where good discharge measurements can be made.
5. Proper placement of a stage gage with re- spect t.o the measuring se&on and to that part of the channel which controls the stage-discharge relation.
6. Suitability of existing structures for use in making high-flow discharge measure- ments, or the proper placement, of a cable- way for this purpose.
7. Possibility of flow bypassing the site in ground water or in flood channels.
8. Availability of line power or telephone lines where needed, for special instrumentation or for Telemark units.
9. Accessibility of the site by roads, particu- larly during flood periods.
The gage on Kaskaskia River at Bondville, Ill., shown in figure 2, satisfies several of the above requirements. Low-flow measurements are made by wading upstream from the artifi- cial control, and high-flow measurements are made from the bridge. The bridge site provides accessibility, convenience to power lines, and a good location for an outside gage, shown on the downstream handrail.
Artificial Controls
Art,ificial controls are structures built in a stream channel to stabilize the stage-discharge relation and thereby simplify the procedure of obtaining accurate records of discharge. They may be low dams, broad-crested weirs con- forming to the general shape and height of the streambed, or flumes similar in design to the Parshall flume. The adverse effects of unstable conditions due to shifting bed or banks, the formation of ice in winter, progressive growth of aquatic vegetation during the summer, and other phenomena which at times affect the
In ,the design of artificial controls the follow- ing four major points should be considered : 1. The shape of the structure should permit the
the passage of water without creating un- desirable disturbance+s in the channel above or below the control.
2. The structure must be of sufficient height to eliminate the effects of varikble down- stream conditions.
3. The profile of the crest of the control should be designed so that a small change in dis- charge at low stages will cause a measura- ble change in stage, and the reldion of changes in stage to changes in discharge should produce a rating curve of a shape that may be extended to peak stages with- out serious error.
4. The control should ha,ve structural sta:bility and should be permanent.
The artificial control should be self-cleaning and

4 TECHNIQUES OF WATER-RESOURCE,S INVESTIGATIONS

GENERAL PROCEDURE FOR GAGING STREAMS 5
0
0
Figure 3.-Concrete artificial control on Mill Creek near Coshocton, Ohio.
Figure 4.-Artificial control on Delaware River near Red Bluff, N. Mex., with shallow V-notch in the broad-crested weir.
should not be subject to obstruction by debris and ice or to deposits of sand, gravel, or silt in its immediate vicinity, either upstream or down- stream.
Measurement OF Stage
The stage o’f a stream is the height of ithe water surface a.bove an established datum plane. Measurements of stream stage are used in de’- termining records of stream discharge. In ad- dit.ion, records of stream stage are useful in themselves, such as in the design of strucgtures afiected by stream elevation or in the planning of the use of flood plains.
A record of stage can be obtained by system- atic observations of a nonrecording gage. In the early days of the Geological Survey, this was
,the means generally used, bL+t now ,the water- stage recorder is used at practically all gaging
stations. The advantages of the nonrecording ga.ge are the low initial cost and the ease of in- stall&on. The disadvantages are the need for an observer and the la,ck of accuracy of t:he esti- mated continuous stage graph sketched through the points of 6bservation. For long-term ‘opera- tion the advantages of the recording gage far outweigh those of the nonrecording gage, and *thus ‘the use of the nonrecording gage is no longer considered a feasible method of obtain- ing a stage record.
Methods of sensing stage
Stage is usually sensed by a float in a stilling well that is comlected to the stream by intake pipes. The stillin, u well protects :&e float and dampens the fluctuation in the stream caused by wind and turbulence. Stilling wells, though usually placed in the bank of the stream, a.re often placed directly in ‘the stream as in figure 4, attached to a bridge pier or albutments. The bottom of the stilling well should be below t,he minimum anticipated stage and its tip above ,the maximum ‘anticipated stage. The in- ta,ke to the well must be of proper size and loca- tion to prevent lag during periods of rapid change in stage and to prevent velocity-head effects at, its end.
Stage may also be sensed by a gas-purge sys- tem known as a bubble gage. This system does not require a stilling well. A gas is fed through a tube and bubbled freely through an orifice that is permanently mounted in the &ream. The gas pressure in the tube is equal to tihe piezo- metric head on the bubble orifice at any gage height. The pressure in the Itube is measured by a zero-displacement mercury tianometer wi& the associated electrical components to drive a stage recorder.
The bubble gage is used primarily at sites where it would be expensive to install a stilling well. It is also used on sand-channel streams be- cause the gas <tends to keep the orifice from be- ing co’vered with sand and the tube may be easily extended to follow a stream cha.nnel that shifts its location. However, the float stilling- well installation is cheaper ito install at most sites, and its performance is more reliable than is that of the bL$bble gage. The Itwo systems have about the same accuracy--to.01 foot. The

6 TECHNIQUES OF WATER-RESOURCES INVESTIGATIONS
choice of systems thus depends on the charac- teristics of the site.
Water-stage recorders
Both strip-chart and digital-Itape water-level recorders are in general use. Eit,her recorder may be actuated by the float or bubble-gage system. Figure ,5 shows a bubble-gage digital- punc~h arrangement.
Figure S.-Bubble-gage digital-recorder arrangement. Gas tank on right; digital-punch recorder on left.
A strip-chwt recorder produces a graphic 1w0rd of the rise and fall of the water surface wilth respect. to time. A gage-height, scale of 1: 6 and a time scale,of one day being equal to 2.4 inches are commonly used. Continuous re- corders such as the Stevens A-35 will operate unattended for periods of GO-90 days and pro- vide a very satisfactory record of stage.
A digital stage rectorder punches coded values of stage on paper tape at preselected time inter- vals. A t’inie interval of 15 minutes is normally used. The Fischer-Porter recorder is battery operated and will run unattended for periods of GO-90 clays. The code consists of four groups of four punches each ; the four punches repre- sent 1, 2, 4, and 8 in each group. The punching of a stage requires only a O.l-inch advance of paper tape. The rewrder is actuated by a ca,m on a battery-driven mechanical clock.
Digital recorders are gradually replacing strip-chart recorders at gaging stations in the TJnited States. The two recorders are about equal in accuracy, reliability, and cost, but the
digital recorder is compatible with the use of electronic computers in computing discharge rec,ords. This automated system as developed by the Geological Survey offers greater economy and flexibility in the computation-publication process than do manual methods associated with graphical recording. However, the use of graphical recorders will be continued at those sites where a graphical record is necessary to detect ice effects, backwater, or frequent mal- functions of the recording system.
Reference gages
Because of the possibility of plugged intakes or other ma.lfunctions, a nonrecording gage is installed so that the water level in the stream can be directly measured. Compar&ive readings on the inside and outside gages are taken dur- ing each visit to the station by engineering per- sonnel. Datum of all gages is checked at peri- odic intervals-usually every 2 or 3 years. In figure 2, the outside gage is on the bridge. Out- side staff gages are visible in figures 3 and 4 in the pools near the gage structures.
Discharge Measurements
Discharge measurements are made at each gaging station to define the discharge rating for the site. The discharge rating may consist of a simple relation between stage and discharge or a more complex relation in which discharge is a function of stage, slope, rate of change of stage, or other factors.
Discharge measurements are normally made by the current-meter method, which consists of determinations of velocity and area in the parts of a stream cross section. However, indirect me,thods are frequently used in determining flood peak discharges. These methods utilize hydraulic equations in conjunction with the in- formation on channel characteristics and flood- marks obtained in a field survey after the flood event.
Discharge measurements may also be made by the dilution method. This method depends on determination of the degree of dilution of an added tracer solution by the Aowing water.
GENERAL PROCEDURE
Current-meter measurements
In the making of a discharge measurement the cross section is divided into 20-30 partial sections, and the area and mean velocity of each is determined separately. A partial section is a rectangle whose depth is equal to t.he sounded depth at a meter location (a vertical) and whose width is equal to the sum of half the distances to the adjacent, verticals. At each vertical the following observations are made : (1) The dis- tance to a reference point on the bank, (2) the depth of flow, and (3) the velocity as indicated by current meter at one or two points in the vertical. These points are at either the 0.2 and 0.8 depths (two-point method) or the 0.6 depth (one-point method) from the mater surface. The average of the two velocities, or the single velocity at 0.6 depth, is taken to be the mean velocity in the vertical. The discharge in each partial section is computed as the product of mean velocity times depth at the vertical times the sum of half the distances to adjacent verti- cals. The sum of the discharges in all the par- Gal sections is the total discharge of the stream.
The measurement can be made by wading the stream with a current meter which slides on a graduated depth rod as ~shown in figures 2 and 6, or it, can be made from a supporting structure such as a bridge (see fig. ‘7)) cableway, or boat, the meter being suspended by :I cable.
The Price current meter is used to observe velocity, except in shallow depths where the pygmy current meter is used. The rotor on both these meters has a vertical axis and six cone- shaped cups. Each meter is individually cali- brated in the rating flume at the National Bu- reau of Standards. Figure 8 shams a vclocity- azimut,h-depth assembly, which has been in use since 1958, primarily on large rivers and in estuarine studies.
These methods and the associated equip- ment llave been developed by the Geological LSurvey over a period of 60 years. Satisfactory results have been obtained in measuring dis- charges ranging from the trickle of a small stream to t,he 7,500,000-cfs flow of the ,4mazon River. Methods and equipment used in making discharge measurements by the current-meter
FOR GAGING STREAMS 7
method are described in detail in book 3, chap- ter AS, of this series, by Buchanan and S0mers.I
Indirect discharge measurements
During floods, it is frequently impossible 01 impractical to measure the peak discharges when they occur, because of conditions beyond control. Roads may be impassable; structures from which current- meter measurements might have been made may be nonexistent, not suitably located, or destroyed; knowledge of the flood rise may not be available sufficiently in advance to permit reaching the site near the time of the peak; the peak may be so sharp that, a satisfac- tory current-meter measurement could not be made eren with au engineer present at the time; the flow of debris or ice may be such as to pre- vent use of a current meter; or limitations of personnel might make it impossible to obtain direct measurements of high-stage discharge at numerous locations during a short flood period. Consequently, many peak discharges must be determined after the passage of the flood by indirect. methods such ns slope-area, contract,ed- opening, flow-over-dam, or flow-through-cul- vert, rather than by direct current-meter meas- nrement .
To evaluate the accuracy of indirect methods, comparisons have been made at every opportu- nity. When it has been possible to compare peak d,ischarge computed by indirect means with peak discharge measured by current, meter or other direct, means, the agreement, in general, has supported confidence in the auxiliary methods.
Indirect, measurements make use of the energy equation for computing discharge. The specific equations differ for different t,ypes of flow, such as open-channel flow, flow over clams, and flow through culverts. These equations re- late the discharge to the water-surface profiile and the geometry of the channel. A field survey is made after the flood to determine t,he location :ulcl elevation of high-water marks aud the geometry of the channel.

8 TECHNIQUES OF WATER-RESOURCES INVESTIGATIONS
0
.
Figure 6.-Measuring discharge with current meter by wading.

GENERAL PROCEDURE FOR GAGING STREAMS 9
Figure T.-Measuring discharge with current meter from bridge over the Hudson River at Poughkeepsie, N.Y
Detailed descriptions of the procedures used in collecting field data and in computing the discharge are given in Benson and Dalrymple (1967)) Dalrymple and Benson (1967)) Bocl- haine (1968)) Matthai (1967)) and Hulsing (1967)) which are book 3, chapters Al-A5, of
this series. The use of electronic computers in these computations is explained by Anderson and Anderson 2 and by Somers and Selner.”
Dilution method
Measurement of discharge by this method depends on determination of the degree of di- lution of an added tracer solution by the flowing water. A solution of a stable or radioactive chemical is injected into the stream as either a constant rate or all at once. The solution be- comes diluted by the discharge of the stream. Measurement of the rate of injection, the con- centration of the tracer in the injected solution, and the concentration of the tracer at a cross
~Andcrson, D. E., and Bnderson, W. L., Computation of water-surface profiles in open cbnnnels; U.S. Geol. Suryeg Techniques Wnter-Resources In\‘., unpub. data.
:s Sonwrs, K. I’., and Sclner, G. I., Computation of atage- discharge relntionshiIm at culverts nnd Computer tcchniqw for slope-area mensurementn : U.S. Geol. Survey Techniques Water-Resources Inr., unlpub. data.
Figure 8.-VADA (velocity-azimuth-depth-assembly) equipment in use for measurement from bridge.
10 TECHNIQUES OF WATER-RESOURCES INVESTIGATIONS -
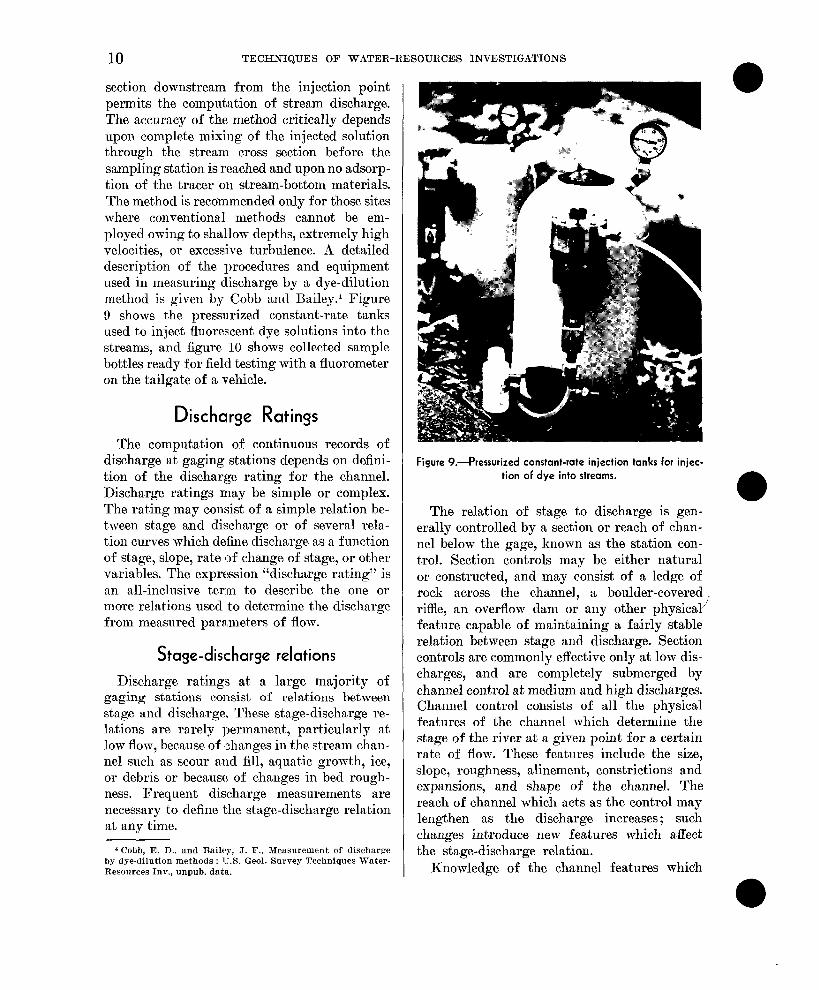
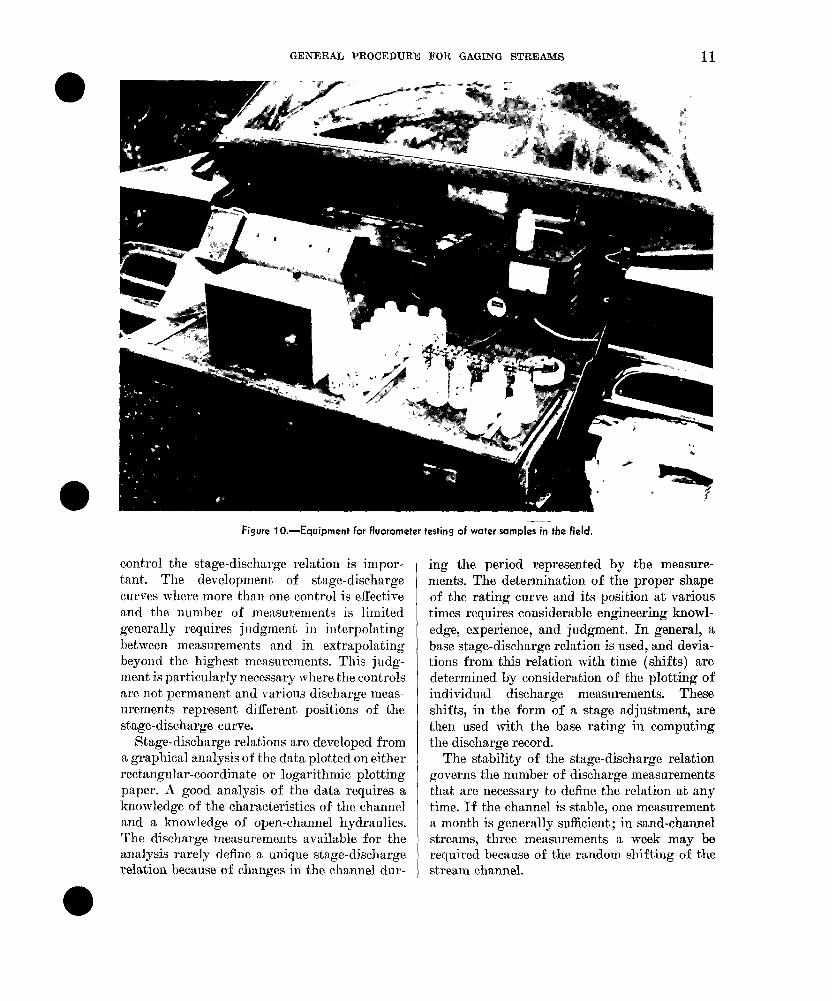
section downstream from the injection point permits the computation of stream discharge. The accuracy of the method critically depends upon complete mixing of the injected solution through the stream cross section before the sampling station is reached and upon no adsorp- tion of the tracer on stream-,bottom materids. The method is recdmmended only for those sites where conventional methods cannot be em- ployed owing to shallow depths, extremely high velocities, or excessive turbulence. A detailed description of the procedures and equipment used in measuring discharge by a, dye-dilution method is given by Cobb and Bailey.4 Figure 9 shows the pressurized constant-rate tanks used to inject fluorement dye solutions into the streams, and figure 10 shows collected sample bottles ready for field testing with a fluorometer on the tailgate of a vehicle.
Discharge Ratings
The computation of continuous records of discharge at gaging stations depends on defini- tion of the discharge rating for the channel. Discharge ratings may be simple or complex. The rating may consist of a simple relation be- tween st~age and discharge or of several rela- tion curves which define discharge as a function of stage, slope, rate of change of stage, or other variables. The expression “discharge rating” is an all-inclusive ter:m to describe the one or more relations used to determine the discharge from measured parameters of flow.
Stage-discharge relations
Discharge ratings at a large majority of gaging stations consist of relations between stage and discharge. These stage-discharge re- lations are rarely permanent, particularly at low flow, because of changes in the stream chan- nel such as scour and fill, aquatic growth, ice, or debris or because of changes in bed rough- ness. Frequent discharge measurements are necessary to define the stage-discharge relation at any time.
4 Cobb, E. D., and Bailey, J. F., Measurement of discharge by dye-dilution methods : lJ.S. Geol. Survey Techniques Water- Resonrces In\*., unpub. data.
Figure 9.-Pressurized constant-rate injection tanks for injec- tion of dye into streams.
The relation of stage to discharge is gen- erally controlled by a section or reach of chan- nel below the gage, known as the station con- trol. Section controls may be either natural or constructed, and may consist of a ledge of rock across the channel, a boulder-covered , riffle, an overflow dam or any other physical/ feature capable of maintaining a fairly stable relation between stage and discharge. Section controls are commonly effective only at low dis- charges, and are completely submerged by channel control at medium and high discharges. Channel control consists of all the physical features of the channel which determine the stage of the river at a given point for a certain rate of flow. These features include the size, slope, roughness, alinement, constrictions and expansions, and shape of t,he channel. The reach of channel which acts as the control may lengthen as the discharge increases ; such changes introduce new features which affect the stage-discharge relation.
Knowledge of the channel features which
GENERAL PROCEDURE FOR GAGING STREAMS
Figure 1 O.-E quipment for fluorometer testing of water samples in the field.
control the stage-discharge relation is impor- tant. The development of stage-discharge curves where more than one control is effective and the number of measurements is limited generally requires judgment in interpolating between measurements and in extrapolating beyond the highest measurements. This judg- ment is particularly necessary where the controls are not permanent and various discharge meas- urements represent different positions of the stage-discharge curve.
Stage-discharge relations are developed from a graphical analysis of the data plotted on either rectangular-coordinate or logarithmic plotting paper. A good analysis of the data requires a knowledge of the characteristics of the channel and a knowledge of open-channel hydraulics. The discharge measurements available for the analysis rarely define a unique stage-discharge relation because of changes in the channel dur-
ing the period represented by the measure- ments. The determination of the proper shape of the rating curve and its position at various times requires considerable engineering knowl- edge, experience, and judgment. In general, a base stage-discharge relation is used, and devia- tions from this relation with time (shifts) are determined by consideration of the plotting of individual discharge measurements. These shifts, in the form of a ,stage adjustment, are then used with the base rating in computing the discharge record.
The stability of the stage-discharge relation governs the number of discharge measurements that are necessary to define the relation at any time. If the channel is stable, one measurement a month is generally sufficient ; in sand-channel streams, three measurements a week may be required because of the random shifting of the stream channel.

12 TECHNIQUES OF WATER-RESOURCES INVESTIGATIONS
Complex discharge ratings
If variable backwater or highly unsteady flow exists at a gaging station, the discharge rating cannot be d’escribed by stage alone.
Variable backwater may be caused by a tribu- tary stream that enters the control reach down- stream from the gage, by manipulation of gates at a dam, or by flow of water into and from overbank storage created by natural constric- tions in the stream channel. The discharge un- der these conditions is a function of both stage and the slope of the energy gradient, which is approximated by the slope of the water sur- face between two stage gages. Stage-fall-dis- charge ratings are usually determined empir- ically from observations of (1) discharge, (2) stage at the base gage, and (3) the fall of the water surface bet\T:een the base gage and an auxiliary stage gage downstream. The general procedures used in developing these ratings are described in book 3, chapter A9, of this series;, by Carter a,nd Davidian.”
If the flow is very unsteady, as in a tidal reach, the acceleratiion head governs the energy slope. Under this condition unsteady-flow equa- tions must be used to describe the variation of discharge with time. This method is described by Davidian.
-4 special type of unsteady flow is tzeated under the heading “Uniformly progressive flow” in Carter and Davidian. For such flow the stage and rate of change of stage observed at a single gage are used to establish the dis- charge rating.
Computation and Preparation OF
Discharge Records
h continuous record of flow at a gaging sta- tion is computed from records of stage #and the discharge rating l’or the station. The type of stage recorder use-d at the station determines whether the computations are done manually or
6 Carter, R. \V.. and Davidian, Jacob, Discharge ratings nt gaging stations: U.S. Geol. Survey Techniques \Vnter- Resourcw Inr., book 3, clmp. AB, unwb. data.
0 Dnridim, Jncob, C’omputation of discharge in tidal re;tclws : U.S. Geol. Survey Techniques Water-Resources Inv., unl,ub. data.
by an electronic computer. In either system the enginee,ti must study the data and prepare what is termed a station analysis,before computations are performed.
Station analysis
A station analysis, which documents the re- sult. of ,the study of the data, is prepared for each station at the end of each water year. The study includes the following items : 1. A review of field surveys of gage datum and
a determination of the datum corrections, if any, to be applied to gage re,adings taken during the year.
2. A review of discharge-measurement notes. 3. An analysis of the discharge rating and the
determination of the rating (or shifts) ap- plicable during each period of t,he year.
1. The preparat.ion of tables which express the discharge rating.
Manual computations
If stage is recorded at the station on a strip- chart recorder, all computations are performed manually in the following order : 1. Determination and application of gage-
height and time corrections to the gage- height chart.
2. Cmmpultation of lthe mean gage height for each day, or for shorter periods if the range. in discharge during the day is large. Sub- division is necessary because of curvature in the discharge rating.
3. Computation of discharge for each period from mean values of stage and the dis- charge rating, including any shift correc- tions.
4. Computation of peak values of gage height and discharge.
5. Listing of the values of mean daily gage heights and discharge and momentary peaks.
6. Computation of mean flow for each month and the year in cubic feet per second and in inches.
7. Review and comparison of the record of dis- charge with that of nearby streams.

GENERAL PROCEDURE
Automatic computations
If stage is recorded on a digital tape at the station, the computations just outlined are per- formed by an electronic computer. The input to the computer is t’he digital record of stage, with a list of any datum corrections, and the discharge rating, with a list of any nwessary shift corrections. For stations at which the &age-fall-discharge type of rating is applica- ble, the digital-tape records of stage from ‘both the primary and the auxilia.ry gages are fur- nished to the computer. In addition to the stage- discharge rela,tion, supplementary information such as the stage-fall relation and the relation of fall ratio versus discharge ratio are supplied.
The output from the computer consists of two forms. The first includes a listing of the maxi- mum, the minimum, and the mean gage height for ea,ch day, bihourly gage heights for each day, and the mean ‘discharge for each day. The second form includes a listing of mean daily discharges and ,t,he mont,hly and yearly sum- maries in the same format as is used for publi- cation. Besides being published, the daily dis- charges and yearly summaries are stored on magnetic tape. Corrections are made on the tape wllere necessary after the computed records are I+eviowed by engineering personnel in the dis- trict, offices.
Publication of Records
Through September 30, 1960, the records of discharge of streams and contents of lakes ‘or reservoirs were published in an annual series
FOR GAGING STREAMS 13
of Geological Survey water-supply papers en- titled “Surface Water Supply of the United States.” Each volume in the series covered an area whose boundaries coincided wibh those of certain natural drainage basins.
Beginning with the 1961 w&r year, stream- flow records and related data have been released by the Geological Survey in annual reports on a State-boundary basis. These reports are pre- pared and released by the district offices soon after the close of the water year.
Daily discharges and annual summaries are also being published in water-supply papers at intervals of 5 years. The first series to she pub- lished covers the period 1961-65.
References
Benson, M. A., and Dalrymple, Tate, 1!%7, General field and office procedures for indirect measure- ,ments: US. Geol. Survey Teclhniques Water-Re- sources Inv., book 3, chap. Al, 30 p.
Bodhaine, G. L., 1968, Measurement of peak dis&arge at culverts ‘by indirect methods : U.S. Geol. Survey ‘Techniques Water-Resources Inv., book 3, chap. A3, 60 p.
Dalrymple, Tate, and Benson, M. A., 1967, Measure- ment of peak discharge ‘by the slope-area method : U.S. Geol. Survey Techniques Water-Resources Inv., book 3, chap. A2, 12 p.
Hulsing, Harry, X867, Measurement of peak discharge at dams by indirect metihods: US. Geol. Survey Techniques Water-Resources Inv., book 3, chap. A5, 29 D.
Matthai, H. F., 1967, Measurement of peak discharge at ‘width contractions ,by indirect methods: US. Geol. Survey Techniques Water-Resources Inv., book 3, chap. A4,44 p.
