(gadus morhua) ( and stored using traditional and · new fish ·handling sy~tems j.r. botta, ......
TRANSCRIPT

LIBRARY'S ONLY COpy•
Assessed Quality of InshoreNewfoundland 'Trap-Caught Cod (Gadus morhua) Landed, Transported and Stored Using Traditional and( New Fish ·Handling Sy~tems
J.R. Botta, W. Balsom, and A.P~ Downey
Inspection Oivision Department of Fisheries and Oceans P.O. Box 5667 St. John's, Newfoundland A 1 C 5X1
September 1 982
Canadian Technical Report of Fisheries and Aquatic Sciences No.1121

.' .
Canadian Technical Report of
Fisheries and Aquatic Sciences
These reports contain scientific and technical information that represents an important contribution to existing knowledge but which for some reason may not be appropriate for primary scientific (i .e. Journal) publication. Technical Reports are directed primarily towards a worldwide audience and have an international distribution. No restriction is placed on subject matter and the series reflects the broad interests and policies of the Department of Fisheries and Oceans, namely, fisheries management, technology and development, ocean sciences, and aquatic environments relevant to Canada .
Technical Reports may be cited as full publications . The correct citation appears above the abstract of each report. Each report will be abstracted in Aquatic Sciences and Fisheries Abstracts and will be indexed annually in the Department's index to scientific and technical publications.
Numbers 1-456 in this series were issued as Technical Reports of the Fisheries Research Board of Canada . Numbers 457-714 were issued as Department of the Environment, Fisheries and Marine Service, Research and Development Directorate Technical Reports . Numbers 715-924 were issued as Department of Fisheries and the Environment, Fisheries and Marine Service Technical Reports. The current series name was changed with report number 925 .
Details on the availability of Technical Reports in hard copy may be obtained from the issuing establishment indicated on the front cover.
Rapport technique canadien des
sciences haJieutiques et aquatiques
Ces rapports contiennent des renseignements scientifiques et techniques qui constituent une contribution importante aux connaissances actuelles mais qui, pour une raison ou pour une autre, ne semblent pas appropries pour la publication dans un journal scientifique. II n'y a aucune restriction quant au sujet, de rait, la serie renete la vaste gamme des inten~ ts et des politiques du Ministere des Peches et des Oceans, notamment gestion des peches , techniques et developpement, sciences oceaniques et environnements aquatiques, au Canada .
Les Rapports techniques peuvent etre consideres comme des publications completes. Le titre exact paraitra au haut du resume de chaque rapport, qui sera publie dans la revue Aquatic Sciences and Fisheries Abstracts et qui figurera dans I'index annuel des publications scientifiques et techniques du Ministere.
Les numeros 1-456 de cette serie ont ete publies atitre de Rapports techniques de l'Office des recherches sur les pecheries du Canada. Les numeros 457-714, a titre de Rapports techniques de la Direction generale de la recherche et du developpement, Service des peches et de la mer, ministere de l'Environnement. Les numeros 715-924 ont ete publies a titre de Rapports techniques du Service des peches et de la mer, Ministere des Peches et de l'Environnement. Le nom de la serie a ete modifie a partir du numero 925.
La page couverture porte Ie nom de l'etablissement auteur ou I'on peut se procurer les rapports sous couverture cartonnee.

1
Canadian Technical Report of
Fisheries and Aquatic Sciences 1121
September 1982
ASSESSED QUALITY OF INSHORE-NEWFOUNDLAND
TRAP-CAUGHT COD (GADUS MORHUA) LANDED,
AND NEW FISH HANDLING
by
J.R. Botta, W. Balsam, and A.P. Downey Inspection Division
Department of Fisheries and Oceans
P.O. Box 5667
St. John's, Newfoundland AIC 5Xl
SYSTEMS

11
(c) Minister of Supply and Services Canada 1982
Cat. No. Fs 97-6/1121 ISSN 0706-6457
Correct citation for this publication:
Botta, J.R., W. Balsom, and A.P. Downey. 1982. Assessed quality of inshore-newfoundland trap-caught cod (Gadus morhua) landed, transported and stored using traditional and new fish handling systems. Can. Tech. Rep. Fish Aquat. Sci. 1121: iv + 2S p.

iii
CONl'mnS
Abstract/Resume iv
Introduction .... 1
;·Iaterials and methods 1
Raw materials 1
Assessment of raw fish ., 3
Assessment of cooked fish . 4
Assessment of data 8
Results and discussion .. 8
Quality of raw unprocessed fish. 8
Quality of raw final product 10
Quality of cooked fillets 10
Output and yield of final products 14
General discussion 14
Conclusions 23
AcknO\vl edgmen t s 23
References ... 24

IV
ABSTRACT
Gotta, J.R., W. Balsom, and A.P. Downey. 1982. Assessed quality of inshore-Newfoundland trap-caught cod (Gadus morhua) landed, transported and stored using traditional and new fish handling systems. Can. Tech. Rep. Fish. Aquat. Sci. 1121: iv + 25 p.
Commercial inshore-Newfoundland trap-caught cod was landed, transported and stored using traditional methods, alternate methods involving the Newfoundland Inshore Fish Handling System, and a method involving gutting and icing the fish at sea. The effect on quality was measured upon arrival at the wharf, arrival at the processing plant 112 km away, immediately prior to processing and immediately after processing. The output and yield of raw final product and quality of cooked fillets was also determined. The effect upon quality depended greatly upon where the quality was evaluated. In general, the traditional methods yielded unacceptable quality, the alternate methods moderate quality and gutting and icing at sea good quality which was usually substantially reduced during processing. Output and yield of raw product was extremely low with the traditional methods and poor with all other methods. The quality of cooked fillets was also greatly affected b;" method 0 f handl ing.
Key Words: Atlantic cod, Gadus ~orhua, gutting, handling systems, icing, output, quality, stored, transported, yield.
'" J'RESUME
Botta, J.R., W. Balsom, and A.P. Downey. 1982. Assessed quality of inshore-Newfoundland trap-caught cod (Gadus morhua) landed, transported and stored using traditional and new fish handling systems. Can. Tech. Rep. Fish. Aquat. Sci. 1121: iv + 25 p.
La morue pechee pour Ie commerce dans des pieges sur les rivages de Terra-Neuve, a et~ debarquee, transport~e et emmagasin€e par les methodes conventionelles, et, egalement par Ie systeme de manipulation manuelle du poisson riverain de Terre-Neuve et par une m~thode utilisant vidage et congelation. Ces effets sur la qualit~ ont ete mesures des l'arrivee au port, et a l'arrivee a l'usine sitvee a 112 km du port, juste avant et apr€s manufacture. Le rendement des produits crus finaux et la qualite des filets cuisines one ete egalement determines. Ces effets sur la qualite etaient tr €s dependant du lieu ou la qualite avait €t~ evalu€e. En general, les methodes conventionelles produisaient des qualites inacceptables, les autres methodes moderaient la qualite, qui etaient habituellement reduit durant la manufacture. Le rendement des produits crus etaient bas avec les methodes traditionelles et pauvre avec tdute les autres methodes. La qualite des filets cuisines etait fortement affect€e par les methodes de manipulation.

1
INTRODUCTION
Inshore-Newfoundland caught fish have a reputation for poor quality (Anon. 1980; Blackwood 1976; Combden 1976; Newbury and Amaria 1974; Pottle 1976; Robillard 1976; and Wicks 1976). Newbury (1976) stated that at time of processing, more than half of all inshore landings were of inferior quality and even if the quality were good when the fish were landed at dockside, it was often poor when the fish arrived at the processing plant (Combden 1976; Newbury 1976; Pottle 1976; and Wicks 1976), due to poor landing facilities, unsuitable transportation and inadequate ice supply (Anon. 1980).
To improve the quality of inshore-caught fish at time of processing, the Canada Department of Fisheries and Oceans has recently established a new system of landing, transporting and storing fish (the Newfoundland Inshore Fish Handling System, NIFHS) and is in the process of implementing quality standards and procedures recommended by an independent committee (Anon. 1980).
The present investigation is concerned with the sensory quality, product output and product yield from commercial inshoreNewfoundland trap-caught cod handled by both new and traditional systems.
MATERIALS AND METHODS
RAW. MATERIALS
The experiments outlined in Table I were initiated July 8, 1982, using trap-caught cod caught by commercial fishermen of the Gooseberry Cove area, Nfld.
Immediately after catching, the fish were handled by five di fferen t methods: (a) t radi t ional sys tern us ing round fi sh, TSRd; (b) traditional system using gutted fish, TSG; (c) new system using round fish, NSRd; (d) new system using gutted fish, NSG, and (e) system similar to that advocated by the Canada Department of Fisheries and Oceans, Quality Improvement Program, whereby the fish were gutted alive and immediately iced at sea, GIS.
In both traditional methods, round unbled fish were placed neither iced nor covered in the bottom of the boats as soon as they were caught. When the boats reached dockside, the fish were forked onto the dock and then weighed. While half the fish were being gutted, the other half were left round, neither iced nor covered, on the dock for approximately 3.5 h. The fish were forked, but not iced, onto a tandum dump truck, covered with a tarpaulin, trucked 112 km to the

2
Table 1. Outline of fish handling systems investigated during July 1981.
I I Store Store in loose in net bags boat (rotmd) (rotmd)
I I
Prong to wharf, weigh, stored loose on the wharf (rotmd)
Prong fish to dump truck, transport to plant loose and not iced (rotmd)
I Dump fish onto conveyor, ice, place in boxes, store h1 holding room (rotmd)
Empty containers after 1, 3 and 6 d, process if quality permits
...-")
TSG
I Gut &Ice, store in net bags (gutted)
I Off-load with jib-crane, deice, weigh, re-ice, place in container(gurtedl
Load containers with a forklift, transport to plant on flatbed truck (gutted)
I Off-load with forklift , store containers in holding room (gutted)
Open containers after 1, 3 and 6 d, process if quality pennits
GIS
I Prong to shore, gut, weigh, store loose on the wharf (gutted)
Prong gutted fish to dump truc~, transport to plant loose and not iced (gutted)
I Dump fish onto conveyor, ice, place in boxes, store in holding room (gutted)
Empty containers after 1, 3 and 6 d, process if quality permits
c--TSRd
Remove cod from trap (rotmd)
I
I Off-load and weigh with jib-crane inline scale, ice, place in container (rotmd)
ILoad containers with a forklift, transport to plant on flatbed truck (rotmd)
I
Method
NSRd
I .Off-load wIth forklift, gut, re-ice, replace in containers, store in holding room (gutted.)
Open containers after 1, 3 and 6 d, process if quality pennits
I Off-load with forklift, store containers in holding room (rotmd)
Open containers after 1, 3 and 6 d, process if quality pennits
NSG

3
processing plant and unloaded onto a conveyor. The fish were weighed and placed in non-insulated, uncovered plastic corrugated containers (1.0 m x 1.0 m x 0.5 m) while being iced two parts fish to one part ice then stored up to 6 d. In general, the fish were iced within 8-10 h of being caught and gutted (TSG) within 4-5 h of being caught.
Cod handled by the : new systems were placed inside 450 kg capacity net bags in the bottom of the boat(s) immediately after they were caught. The fish were neither iced nor covered. When the boat(s) reached dockside, the round fish were immediately hoisted up and weighed, and approximately 365 kg were placed inside insulated (with 6.3 cm thick polyurethane) plastic containers (1.0 m x 1.0 m x 1.0 m) with fitted insulated covers, while being iced two parts fish to one part ice. The partially-filled covered containers were placed on a single axel flatbed truck and driven approximately 112 km to the processing plant where the containers were unloaded and stored in the holding room for up to 6 d. Upon arrival at the processing plant, half of the insulated containers were emptied, one by one, and the cod gutted, weighed and immediately re-iced at a ratio of two parts fish to one part ice. Except when fish were gutted, no new ice was added to the insulated containers after arrival at the plant. Fish in the round state were iced within 4 h of being caught. Gutted fish handled by the new system (NSG) were not iced in the gutted state until 10-12 h after catching although they were iced in the round state within 4 h of being caught. All fish were iced for up to 6 d.
Immediately after catching and while still alive, some fish were gutted and well iced inside 450-kg capacity net bags placed on the bottom of the boat(s). These fish (GIS), upon reaching dockside, were hoisted up~ de-iced, weighed and iced (two parts fish to one part
mjice) inside 1 capacity insulated containers. The fish were transported to the processing plant and stored in the holding room for up to 6 d.
Each combination of storage time and method was repeated three times and, with any replication of any of the three different storage times, all five handling methods were conducted on fish caught the same day.
:'\SSESS~IENT or: RAW FISH
During the course of the study, air, fish and water temperatures were taken when the fish were brought aboard; air and fish temperatures were taken upon arrival at dockside; and fish temperatures were taken upon arrival at the processing plant. In addition, weights for the different batches of fish were determined at various stages and used to calculate both outputs and yields.

4
Upon arrival at dockside and after 1, 3, and 6 d of iced storage, random samples were obtained from all five handling procedures (TSRd, TSG, NSRd, NSG and GIS) and graded by two trained and experienced Federal Fish Inspectors using the Canada Department of Fisheries and Oceans proposed dockside grading standards for groundfish (Table 2). Upon arrival at the processing plant, random samples from only TSRd, TSG and NSG were graded. Samples were not obtained from the NSRd and GIS methods since the containers involved were not to be opened uptil 1, 3, or 6 d of storage had passed. In general, if more than 30 % of the samples from any handling method were rated reject, then all fish handled in that manner were not processed. After processing, random samples were obtained and graded using the Department of Fisheries and Oceans proposed final product grade standards (Table 3).
ASSESS:-IENT OF COOKED FISH
Random samples of final product, from any treatment that was processed, were placed in 0.5 kg capacity waxed cardboard boxes, plate frozen, transported to St. John's and stored at -40 oC until analyzed. Samples of fish of high, medium and low quality were hand filleted, skinned, washed, placed in 0.5 kg capacity waxed cardboard boxes, plate frozen, transported to St. John's and stored at -40 oC until used as training and control samples during sensory evaluation.
The contents of each 0.5 kg capacity box were trimmed, sawn into equal-sized (1.5 cm x 2.8 cm x 7.5 cm) pieces, placed into an aluminum pan~ covered with aluminum foil, baked at 204 0 C for 45 min in a conventional oven, transferred to coded glass petri dishes and served hot using an electric warming tray. Evaluations were made in partitioned booths with daylight fluorescent light, using roomtemperature tap water for rinsing. In general, samples were evaluated within 15 min of cooking.
An analytical panel of seven judges, all trained in the assessment of appearance, texture, odor, flavor and overall acceptability of trap-caught cod, scored each sample using a 5-point descriptive scale (Table 4). Twelve sessions with high, medium and low quality trap-caught cod were used to train the judges and ensure that they agreed with the terms shown in Table 4. A score of 5 indicated the highest quality, a score of 1 indicated the lowest and an overall acceptability score of 2 represented unacceptability for human consumption. At each session, each judge evaluated a good control sample and three unknown samples. The scores of the seven judges were averaged for each box of frozen fillets, thus producing 30 observations per storage time, per handling method, except in those cases where fish were rejected prior to processing.

5
)
Table 2. Proposed dockside grading form developed by Canada Department of Fisheries and Oceans, Inspection Division, used to assess quality of cod immediately prior to and after being unloaded.
Specles Date Date landed inspected
Name of Name of CFV vessel fisherman number Name of Inspectlon Type of landing site location gear used Handling methods [::::» Round [> Bled [> Gutted [> Washed I> Iced [> Uniced
QUALITY FACTOR
TEXTURE (record as firm, mod. soft, soft or flabby)
ODOR AT NECK 1. WHEN BROKEN
(Reject for 5 points)
.., ODOR OF GILLS' . (Reject for 5 points)
3. GENERAL APPEARANCE _.
4. EYES
S. COLOR OF GILLS
TOTAL POINTS
AVE. OF FACTORS I to 5
GRADE
DESTRUCTIVE SAMP. BLOOD CLOTS
DISCOLORATIONS
JELLY/CHALKY
FINAL GRADE
I

Table 3. Proposed final product grading form, developed by Canada Department of Fisheries and Oceans, Inspection Division, used to assess quality of fresh trimmed skinned cod fillets.
PLANT DATE OF PRODUCTION
ADDRESS PACK SIZE SPECIES LOT SIZE
PACK FRESH B SKINLESS BONELESS B PACK FILLET [J BLOCK []FORM: FROZEN SKIN-ON BONED TYPE:
j
B MINCED 0 DEFECT CODE D[ SCRIPTION LINE
SAMPLE NO. I. S~IALL PIECES z. BONES i) Each Bone
il) Crltlcal Bone 3. FINS OR PART FINS 4. BRUISES OR BLOOD CLOTS
5. DISCOLORATION a) Abnormal b) Melanin
6 . SKIN (SKINLESS FILLETS) ..., BLACK ME~1BRANEi •
s. BL EMISHES (MINCED FISH ONLY) 9 . PARASITES 10. SCALES II. OBJECTIONABLE a) Viscera
~!ATTER b) Roe c) Frllls
12. FOREIGN MATTER TOTAL NUMBER OF DEFECTS GRADE BASED ON DEFECTS
13. COLOR GRADE 14. ODOR AND/OR FLAVOR GRADE
15. TEXTURE GRADE
OVERALL SAMPLE UNIT GRADE I DETERMINATION OF LOT
. -
GRADE NUMBER OF DEFECTIVES
Total No. sample units [] Acceptance No. [J Grade 'A' [J Standard [J Utility 0
O\T RALL LOT QUI\LITY: INSPECTED BY: DATE INSPECTED:

7
Table 4. Form used to evaluate sensory quality of cooked Newfoundland trap-caught cod.
SENSORY ANALYSIS OF NFLD. TRAP-CAUGHT COD
ODOR Fresh fish Sl loss of Sl ammonical Putrid odor, fresh freshness, sl Bland Sl fishy (lMA) Annnonical seawatE~r odor seawater odor Stale Rancid Aromatic odor Sl aromatic Musky Peasant odor, sl bland
Sample 1 2 3 -
APPEAR- Smooth & Sl loss of Sl discol- Possible irrid- Strong irrid-A\CE ~hite whiteness ored (yellow escence esence. Stringy
Flaky & Sl loss of or greyish) Fibrous &pulpy &mushy oist moisture Sl moist/
sl dry
Sample 1 2 3
TE~11JRE V. smooth & Mod. smooth Sl smooth Sl Soft & Pulpy Stringy tender Sl tender Sl rubbery stringy mushy &mushy tough & Juicy & Sl juicy Sl fibrous or fibrous flaky Springy CJ1.ewy
Sample 1 7
3
FL-\VOR Semlater Sl loss of Bland Sl bitter & Sour putrid fresh freshness harsh Bitter rancid Sweet flavor Sl loss of Sl ammonical Ammonical flavor Juicy sweetness flavor Strong aftertaste
Mtertaste
Sample 1 2 3
- OVERALL Good Fair Neither Sl TotallyACCEPTABILITY like nor undesirable undesirable
dislike
Sample 1 ')
'" 3

8
ASSESS:'-IENT OF DATA
Observed frequency distributions (the percentages of times each treatment combination received each of the scores) were calculated for all scores assigned to raw fish, raw product and cooked fillets. These frequency distributions were then evaluated.
Mean output, temperature and yield values were calculated and evaluated.
RESULTS AND DISCUSSION
QUALITY OF RAW UNPROCESSED FISH
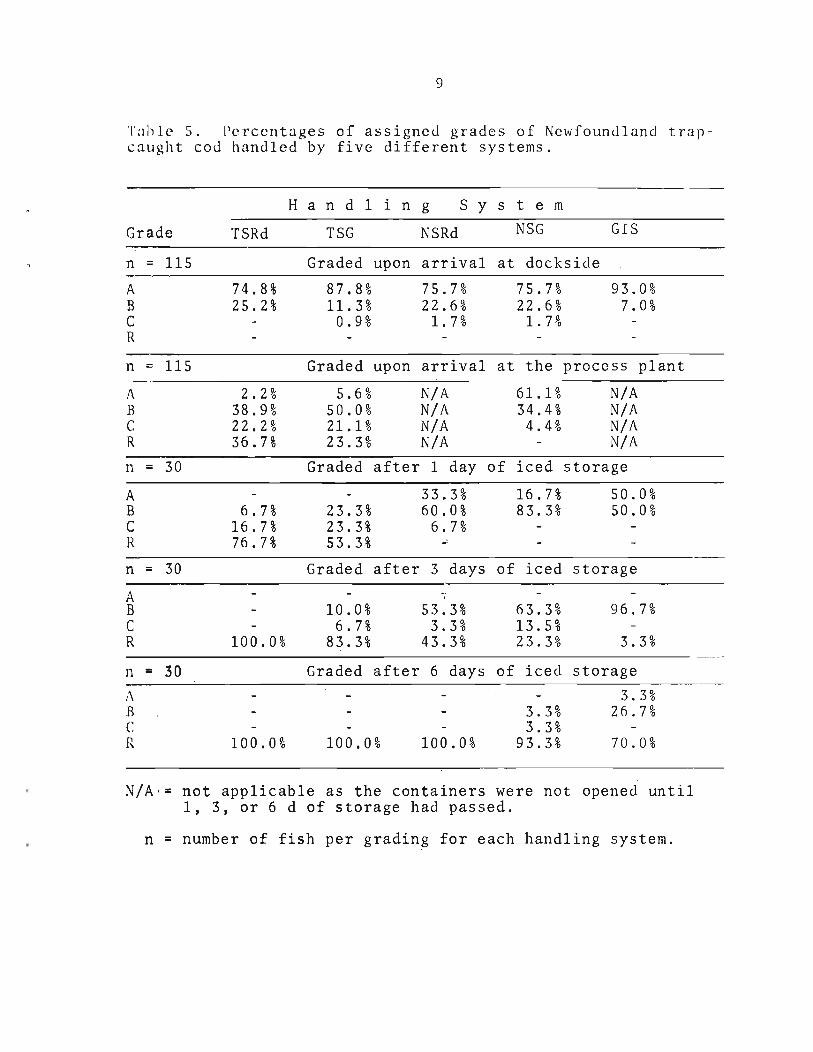
Fish that were handled using the TSRd method were of quite high quality (74.8% grade A and 25.2% grade B) when assessed at the wharf, but upon arrival at the processing plant, the quality was unacceptable, with only 2.2% grade A while 36.7% were of reject grade (Table 5). After 1, 3, and 6 d of iced storage, 76.7%, 100% and 100%, respectively, were reject (Table 5).
A similar trend was observed with fish handled using the TSG method. Upon arrival at the dock, the vast majority of fish were grade A with only a moderate number grade B and none reject grade; but upon arrival at the processing plant, the overall quality was unacceptable with only a moderate amount grade A, 21.1% grade C and almost one quarter reject (Table 5). Fish handled by the TSG method, iced for 1, 3, and 6 d were likewise totally unacceptable with 53.3%, 83.3% and 100% respectively, reject grade (Table 5).
The NSRd method yielded fish whose quality at the wharf was almost identical to the TSRd fish; but after 1 d of iced storage, the quali·ty was obviously superior to that produced by both traditional methods as there was 33.3% grade A, 60.0% grade B, and 6.7% grade C. Although there were no reject grade fish, after 1 d of iced storage, 43.3% and 100% of NSRd fish iced 3 and 6 d, respectively, was reject (Table 5).
\fuen landed at the wharf, fish handled by the NSG method were of quite high quality (75.7% grade A, 22.6% grade B, 1.7% grade C and no reject grade) (Table 5). Transportation to the plant caused a noticeable decrease in quality, there being 61.1% grade A, 34.4% gradeB, and 4.4% reject grade upon arrival. After 1 d of iced storage, the quality was moderate to good, with no reject grade, no grade C, 83.3% grade B and only 16.7% grade A (Table 5). After 3 and 6 d of iced storage, there were 23.3% and 93.3% reject, respectively, when the fish were handled by the TSG method (Table 5).
9
Tahle S. Percentages of assignctl grades of Newfountlland trapcaught cod handled by five different systems.
H a n d 1 i n g S Y s t e m
NSG GISGrade TSRd TSG NSRd
n = 115 Graded upon arrival at dockside
A 74.8% 87.8% 75.7% 75.7% 93.0% B 25.2% 11. 3% 22.6% 22.6% 7.0% C 0.9% 1. 7% 1. 7% R
n = 115 Graded upon arrival at the process plant
A 2.2% 5.6% N/A 61.1% N/A B 38.9% 50.0% N/A 34.4% N/A C R
22.2% 36.7%
21.1 % 23.3%
N/A N/A
4.4% N/A N/A
n = 30 Graded after 1 day of iced storage
A 33.3% 16.7% 50.0% B 6.7% 23.3% 60.0% 83.3% 50.0% C 16.7% 23.3% 6.7% R 76.7% 53.3% -'
n = 30 Graded after 3 days of iced storage
A ", B 10.0% 53.3% 63.3% 96.7% C 6.7% 3.3% 13.5% R 100.0% 83.3% 43.3% 23.3% 3.3%
n = 30 Graded after 6 days of iced storage
1\ 3.3% R 3.3% 26.7% C 3.3% R 100.0% 100.0% 100.0% 93.3% 70.0%
N/A ' : not applicable as the containers were not opened until 1 , 3, or 6 d of storage had passed.
n = number of fish per grading for each handling system.

10
Fish gutted and iced at sea, then iced in insulated containers (GIS method) always received grades that were noticeably superior to those received by fish handled by any of the other methods. Quality of fish handled by the GIS method was: upon the wharf, 93.0% grade A and 7.0% grade B; after 1 d of iced storage, 50% grade A and 50% grade B; after 3 d of iced storage, 96.7% grade B and only 3.3% reject; and after 6 d of iced storage, 3.3% grade A, 26.7% grade B, and 70.0% reject (Table 5). In addition, the temperatures of fish handled by the GIS method were always substantially lower than those of fish handled by other methods (Table 6).
QUALITY OF RAW FINAL PRODUCT
Although the five different handling methods produced substantial differences in the quality of the raw unprocessed fish (Table 5), this was not true of the quality of the raw final product (Table 7). Regardless of the quality of fish entering the processing line, the product coming off the line was always utility grade, with a very slight amount (if any) of standard grade (Table 7). During the course of the entire study, no raw final product was ever assessed as grade A, even when fish entering the processing line were 50.0% grade A and 50.0% grade B (Tables 5 and 7). The highest percentage of standard grade was 10%, even when fish entering the processing line were 50% grade A and 50% grade B or 96.7% grade Band 3.3% reject grade (Tables 5 and 7).
QUALITY OF COOKED FILLETS
The frequency distributions of overall acceptability scores of all fillets evaluated are presented in Table 8.
No fillets from fish handled by the TSRd method were evaluated because such fish were rejected prior to processing. Similarly, fillets from fish that were handled by the TSG method and iced for 3 and 6 d were not evaluated, although fillets from some fish iced 1 d were. In general, the judges either had no preference (neither lik~d nor disliked) for these fillets, or considered such fillets slightly spoiled.
With the NSRd method, fish iced 3 or 6 d were also rejected prior to processing. Fillets from fish iced 1 d were of low overall acceptability; a substantial minority was considered spoiled, a very substantial minority was neither liked nor disliked and only a small number were considered fair.

11
lah1e 6. Temperature at various locations during the period between time of catching and arrival at processing plant.
Temperature Repli Temperature Repliof: cation of: cation n
~ir when 1 fish were 2 taken 3 aboard 4
5 6
48 44 32 36 50 51
14.1+2.7 14.8+3.8 12.1+2.3 13.5+2.2 12.8+2.0 13.0+2.0
round fish 1 upon arrival 2 at dockside 3
4 5 6
48 48 36 48 48 48
1l.3+0.8 12.1+l. 3 10.1+1.4 10.9+l.3 10.8+1.2 12.2+2.0
sea when 1 fish were 2 taken 3 aboard 4
5 6
48 44 32 51 54 48
9.3+0.6 9.7+0.7 9.1+2.2
10.4+0.8 9.6+1.0 9.0+1.8
gutted and 1 iced fish 2 upon arrival 3 at dockside 4
5 6
48 48 36 48 48 48
7.5+2.6 6.4+0.9 4.9+5.4 3.1+2.1 2. 8+l. 6 2. 9+l. 5
fish when 1 taken 2 aboard 3
4 5 6
48 44 32 44 48 48
9.0+l.1 9.7+0.6 9. 7+l. 6
10.1+0.7 8.6+1.5 9.2+1.6
TSRd fish 1 upon arrival 2 at process 3 Ing plant 4
5 6
12 12 12 12 12 12
18.4+4.4 19.7+2.4 15.8+0.3 16.7+1.1 15.6+0.2 15.2+0.5 1
air upon 1 48 18.9+0.7 TSG fish 1 12 16.0+0.7 arrival at 2 48 16.0+2.1 upon arrival 2 12 19.2+0.4 dockside 3 36 14.7+1.9 at process 3 12 15.8+0.3
4 48 14.4+2.7 ing plant 4 12 15.3+0.8 5 48 17.5+1.3 5 12 15.3+0.5 6 48 15.7+0.4 6 12 14.0+0.6
NSG fish 1 12 1.3+2.1 upon arrival at processing plant
2 3 4 5
12 12 12 12
2.2+1. 4 3.0+2.6 2.9+1.1 o . 8+1.1
6 12 0.4+0.4
n = number of observations per replication per location.

12
Table 7. Percentage of assigned final product grade of Newfoundland trap-caught cod handled by five different systems.
Crade of H a n d 1 i n g S Y s t e m
final product TSRd TSG NSRd NSG GIS
n = 30 Processed after 1 d of iced storage
A S 3.3% 10.0% 11 33.3% 100.0% 96.7% 90.0% R 100.0%* 66.7%*
n = 30 Processed after 3 d of iced storage
A S U R 100.0%* 100.0%* 100.0%*
100.0% 10.0% 90.0%
N/A Processed after 6 d of iced storage
A S U R 100.0%* 100.0%* 100.0%* 100.0%* 100.0%*
n number of samples graded for each handling system
Fish were rejected prior to processing.*

13
Table 8. Percentage of overall acceptability scores assigned cooked fillets from Newfoundland trap-caught cod handled by five different methods.
Overall acceptability score TSRd
H a n d 1
TSG
1 n g S Y
NSRd
s t e m
NSG GIS
n = 30 Processed after 1 d of iced storage
5 3.3% 6.7% 4 16.7% 16.7% 60.0% 3 23.3% 43.3% 63.3% 30.0% 2 10.0% 33.3% 16.7% 3.3% 1 100.0%* 66.7%* 6.7%
n = 30 Processed after 3 d of iced storage
5 4 10.0% 33.3% 3 50.0% 63.3% 2 40.0% 3.3% 1 100.0%* 100.0%* 100.0%*
N/A Processed after 6 d of iced storage
5 4 3 2 1 100.0%* 100.0%* 100.0%* 100.0%* 100.0%*
n = number of samples evaluated for each handling system.
* Fish were rejected prior to processing.
14
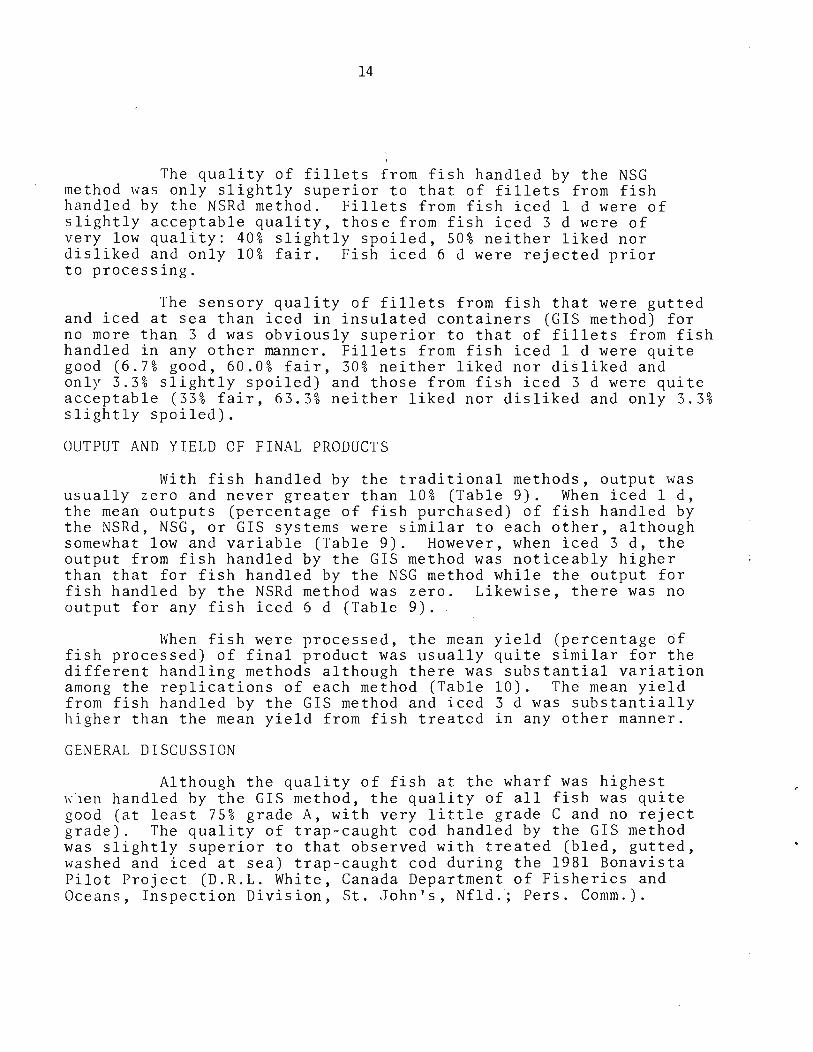
The quality of fillets from fish handled by the NSG method was only slightly superior to that of fillets from fish handled by the NSRd method. Fillets from fish iced 1 d were of slightly acceptable quality, those from fish iced 3 d were of very low quality: 40% slightly spoiled, 50% neither liked nor disliked and only 10% fair. Fish iced 6 d were rejected prior to processing.
The sensory quality of fillets from fish that were gutted and iced at sea than iced in insulated containers (GIS method) for no more than 3 d was obviously superior to that of fillets from fish handled in any other manner. Fillets from fish iced 1 d were quite good (6.7% good, 60.0% fair, 30% neither liked nor disliked and only 3.3% slightly spoiled) and those from fish iced 3 d were quite acceptable (33% fair, 63.3% neither liked nor disliked and only 3.3% slightly spoiled).
OUTPUT AND YIELD OF FINAL PRODUCTS
With fish handled by the traditional methods, output was usually zero and never greater than 10% (Table 9). When iced 1 d, the mean outputs (percentage of fish purchased) of fish handled by the NSRd, NSG, or GIS systems were similar to each other, although somewhat low and variable (Table 9). However, when iced 3 d, the output from fish handled by the GIS method was noticeably higher than that for fish handled by the NSG method while the output for fish handled by the NSRd method was zero. Likewise, there was no output for any fish iced 6 d (Table 9).
When fish were processed, the mean yield (percentage df fish processed) of final product was usually quite similar for the different handling methods although there was substantial variation among the replications of each method (Table 10). The mean yield from fish handled by the GIS method and iced 3 d was substantially higher than the mean yield from fish treated in any other manner.
GENERAL DISCUSSION
Although the quality of fish at the wharf was highest ~hen handled by the GIS method, the quality of all fish was quite good (at least 75% grade A, with very little grade C and no reject grade). The quality of trap-caught cod handled by the GIS method was slightly superior to that observed with treated (bled, gutted, washed and iced at sea) trap-caught cod during the 1981 Bonavista Pilot Project (D.R.L. White, Canada Department of Fisheries and Oceans, Inspection Division, St. John's, Nfld.; Pers. Comm.).

lS
Table 9. Output (percentage of purchased fish) of final product (trimmed fillets) of Newfoundland trap-caught cod handled by five different systems.
H a n d 1 i n g S Y s t e m
TSRd I TSG NSRd NSG GIS
Output of fish processed after 1 d of iced storage
0.0+0.0 1 9 . 1:':15.8 31.8+1.7 31.6+7.9 32.3+6.4
Output of fish processed after 3 d of iced storage
0.0+0.0 0.0+0.0 31.2+1.7 36.4+0.81°. 0:':0.0
Output of fish processed after 6 d of iced storage
0.0+0.0 0.0+0.0 0.0+0.0 0.0+0.0 0.0+0.0

16
Table 10. Yield (percentage of fish processed) of final product (trimmed fillets) of Newfoundland trap-caught cod handled by five different systems.
Han d 1 i n g S Y s t e m
~ TSG NSRd TSG I GIS ------------------------~------------~--------------
Yield of fish processed after 1 d of iced storage
~/A I 32.5~3.2 30.2+5.2 32.2+4.6
Yield of fish processed after 3 d of iced storage
N/A N/A 32.8+1.3 36.3+1.0I N/A
Yield of fish processed after 6 d of iced storage
':';/A N/A N/A
N/A = not applicable as the fish were rejected prior to processing.
a Only one replication was processed, fish of the other two replications were rejected prior to processing.

17
With the traditional handling methods, the difference between quality at the wharf (at least 75% grade A) and quality upon arrival at the processing plant (approximately 4% grade A and 30% reject) was caused by the high temperature of the fish, and lack of gutting in the case of the TSRd method (Table 6). This is not surprising as it has been known for a long time that in order to obtain consistently high quality fish, one must gut, wash and ice most groundfish as soon as they are caught (Anon. 1962; Bowman and Larsen 1970; Castell 1953; Huntsman 1931; and Waterman 1963). The results of the present study at least partially confirm the comments of Anon. (1980), Combden (1976), Newbury (1976), Pottle (1976), and Wicks (1976).
In general, the quality of cod handled by the GIS method, although similar when landed at the wharf to that previously observed by Locke 1& Walters (1973), deteriorated slightly more quickly. The difference may be related to differences in location of catching (Love 1976), differences in the size of fish (those in the present study bej.ng quite small) or differences in handling (those in the present study having been trucked 112 km).
The low quality of the final raw product is very surprising, particularly considering the quality of some of the fish that entered the processing line. Although in the present study the quality of fish at the wharf was at least equal to that observed during the 1981 Bonavista Pilot Project, the quality of raw final product observed during the Pilot Project was very much higher (mostly grade A and standard grade with no utility grade and only a slight amount of reject grade) (D.R.L. White, Canada Department of Fisheries and Oceans, Inspection Division, St. John's, Nfld.; Pers. Comm.). The fish used in the Pilot Project were also iced 1 d. However, it should be noted that the plants from which the final product data were collected did not include the plant at which the present study was conducted.
Soft texture (frequently resulting in small pieces) was the major contributor to the low overall grades of the final raw product, although usually the texture of the fillets did not become objectionably soft until the fillets were skinned. In general, with the TSG, NSRd, and NSG methods, color was usually rated as standard with some grade A, ~hereas with the GIS methDd, color was usually rated grade A with some standard. The odor of almost all final products was rated grade A. Thus, a good quality product may have been produced if the fillets had been skinned differently or not skinned at all.

18
With the cooked fillets, odor, not texture, was generally the limiting factor (Tables 5 and 11-14). Overall acceptability scores were usually lower than the grades of the fish immediately prior to processing, but higher than the grades of the raw final product, even though evaluations were conducted on the same fillets.
Although the output and yield were low, this is not surprising considering the effect the processing had on the quality of some of the fish. However, the low and variable yield may have been, at least partially, due to the small and variable size of the fish.
Was the GIS method worth the extra cost of 6¢ per pound that was paid the fishermen to handle their fish in this manner? The yields and grades of the final raw product indicate that it was not, but the grades of the fish immediately prior to processing and the overall acceptability scores of the cooked fillets would indicate that it was.
It should be stressed that the values presented in Tables 5, 7, 8, and 11-14 are mean values of three replications per handling method, with no indication of variability. Considerable variability did exist; however, before any conclusions were drawn or statements made, this variability was taken into consideration.
Although the Canada Department of Fisheries and Oceans proposed standards for dockside and final product grading of groundfish were used when assessing quality, the standards used were those which existed during July 1981, not those presently being tested. Since this was an experimental study, the fish were not automatically downgraded for not being bled, gutted, washed or iced st sea.
It should be stressed that these results were obtained in a laboratory-type study under well-defined conditions using relatively small amounts of fish. Under commercial conditions, the results would not necessarily be the same. In addition, it should be remembered that the sensory quality of the cooked fillets was evaluated, not by a consumer panel or through test marketing, but by a laboratory panel whose assessment will not necessarily agree with that of the general public . . Consequently, this report should be viewed as an intermediate one.

19
Table 11. Percentage of appearance scores assigned cooked fillets from Newfoundland trap-caught cod handled by five different methods.
H a n d 1 i n g S Y s t e m
Score TSRd TSG NSRd NSG GIS
n = 30 Processed after 1 d of iced storage
5 10.0% 4 13.3% 33.3% 23.3% 53.3% 3 20.0% 63.3% 73.3% 36.7% 2 3.3% 3.3% 1 100.0%* 66.7%*
n = 30 Processed after 3 d of iced storage
5 4 3 2 1 100.0%* 100.0%* 100.0%*
20.0% 70.0% 10.0%
60.0% 40.0%
~/A Processed after 6 d of iced storage
5 4 3 2 1 100.0%* 100.0%* 100.0%* 100.0%* 100.0%*
n = number of samples evaluated for each handling system.
* Fish were rejected prior to processing.

20
Table 12. Percentage of odor scores assigned cooked fillets from Newfoundland trap-caught cod handled by five different methods.
Odor H a n d 1 1 n g S Y s t e m
Score TSRd TSG NSRd NSG GIS
n = 30 Processed after 1 d of iced storage
5 10.0% 4 6.7% 10.0% 13.3% 40.0% 3 20.0% 56.7% 73.3% 46.7% 2 6.7% 33.3% 13.3% 3.3% 1 100.0%* 66.6%*
n = 30 Processed after 3 d of iced storage
5 4 10.0% 20.0% 3 46.7% 76.7% 2 43.3% 3.3% 1 100.0%* 100.0%* 100.0%*
N/A Processed after 6 d of iced storage
5 4 3 2 1 100.0%* 100.0%* 100.0%* 100.0%* 100.0%*
n = number of samples evaluated for each handling system.
* Fish were rejected prior to processing.

21
lahle 13. [)erccntage of flavor scores assigned cooket! fillets from Newfound1ant! trap-caught cot! handled by five different methods .
• H a n d 1 i n g S Y s t e m
Flavor score TSRd TSG NSRd NSG GIS
11 = 30 Processed after 1 d of iced storage
5 10.0% 4 13.3% 26.7% 50.0% 3 30.0% 53.3% 60.0% 33.3% 2 3.3% 33.3% 13.3% 6.7% 1 100.0%* 66.7%*
n = 30 Processed after 3 d of iced storage
5 4 13.3% 40.0% 3 53.3% 60.0% ') 33.3% 1 100.0%* 100.0%* 100.0%*
N/A Processed after 6 d of iced storage
5 4 3 2 1 100.0%* 100.0%* 100.0%* 100.0%* 100.0%*
n = number of samples evaluated for each handling method.
* Fish were rejected prior to processing.

22
Table 14. Percentage of texture scores assigned cooked fillets from Newfoundland trap-caught cod handled by five different methods.
Han d 1 i n g S Y s t e m Texture score TSRd TSG NSRd NSG GIS
n = 30 Processed after 1 d of iced storage
5 4 23.3% 13.3% 63.3% 3 33.3% 56.7% 83.3% 36.7% 2 20.0% 3.3% 1 100.0%* 66.7%*
n = 30 Processed after 3 d of iced storage
5 4 13.3% 26.7% 3 63.3% 70.0% 2 23.3% 3.3% 1 100.0%* 100.0%* 100.0%*
N/A Processed after 6 d of iced storage
5 4 3 2 1 100.0%* 100.0%* 100.0%* 100.0%* 100.0%*
n = number of samples evaluated for each handling method.
* Fish were rejected prior to processing.

23
CONCLUSIONS
, A laboratory-type study was conducted to assess the effects of variOtlS traditional and new handling systems on the quality of trap-caught cod.
When fish were graded at the wharf, the effect of handling was only 'slight to moderate; when graded upon arrival at the processing plant, the effect was very great and when graded prior to processing, the effect was often very great but depended on the length of time the fish were stored in ice.
The quality of cooked fillets was also greatly affected by handling methods.
In general, the traditional methodS did not produce fish of acceptable quality; the newer systems definitely improved quality, with fish gutted and iced at sea being obviously superior to those handled by any other method.
Excluding the traditional methods, handling did not substantially affect the quality, output or yield of the final raw product, all of which were usually poor.
The study clearly indicated that when handled properly, trap-caught cod, placed on a processing line over 100 km from where they were landed and 1 d after being caught, were of good quality. But it also indicated that, if the quality of the final product is to be respectable, more attention to handling the fish within the plant must be given.
ACKNOWLEDGMENTS
The authors thank H.B. Nickerson and Sons Ltd. for the use of their facilities at Gooseberry Cove, and Charleston, Nfld.
• The assistance of the management and staff at both locations was greatly appreciated.
The authors sincerely thank G. Balsom, B. Squires, and G. Squires for their technical assistance.
Appreciation is extended to all those who served as members of the sensory evaluation panel.
The authors are grateful to all those who assisted in the preparation of the manuscript.

24
REFERENCES
Anon. 1962. Take care of your catch. U.K. Dept. of Sci. and Ind. Res. Torry Research Station, Torry Advisory Note No.4, 5 p.
1980. Report of the committee to develop standards for fish quality improvement in the Province of Newfoundland, St. John's, Nfld., June 4, 1980, 74 p.
Blackwood, C.M. 1976. The importance of fish quality in the rehabilitation of the fishery - Role of the fishermen, fish buyers, and processors. p. 2-7. In Fish quality workshops, 1976, Newfoundland Region.--Environment Canada, Fisheries and Marine Service, Inspection Branch, St. John's, Nfld., 94 p.
Bowman, E.W., and A. Larsen. 1970. Recommended practices for vessel sanitation and fish handling. U.S. Dept. of Interior, Fish and Wildlife Service, Circular 333, 27 p.
Castell, C.H. 1953. A note to the fishing skippers regarding the factors that hasten deterioration of fish in boats at sea. Fisheries Res. Board of Canada, Atlantic Fisheries Experimental Station Halifax, N.S., New Series Circular No.1, 6 p.
C6mbden, G.R. 1976. Care of the catch, p. 41-45. In Fish quality workshops, 1976, Newfoundland Region. Environment Canada, Fisheries and Marine Service, Inspection Branch, St. John's, Nfld., 94 p.
Huntsman, A.G. 1931. The processing and handling of frozen fish, as exemplified by ice fillets. Biological Board of Canada, Bull. No. 20, 58 p.
Locke, H., and G. Walters. 1973. Report on 1973 summer program to investigate methods of handling fish catches on small boats. Summer student report for Canadian Fisheries Service, Inspection Branch, St. John's, Nfld. Unpublished report, 38 p.
Love, R.M. 1976. Processing of cod: The influence of season and fishing ground. Ministry of Agriculture, Fisheries and Food, Torry Research Station, Torry Advisory Note No. 71, 8 p.

25
NCI"bury, A.I>. 1976. Handling fish on-board vessels and off-loading and transportation systems, p. 31-40. In Fish quality workshops, 1976, Newfoundland Region. Environment Canada, Fisherie.s -and Marine Service, Inspection Branch, St.. John's, Nfld., 94 p. .
• Newbury, A.D., and P.J. Amaria. 1974. Productivitity studies in fish processing: Development of inshore fish handling system to increase productivity. Presented at: Atlantic Fisheries Technological Conference, Quebec City, Que., Sept. 1974.
Pottle, L.M. 1976. The Newfoundland fishery and its problems relating to quality in the markets, p. 15-19. In Fish quality workshops, 1976, Newfoundland Region. Environment Canada, Fisheries and Marine Service, Inspection Branch, St. John's Nfld., 94 p.
Robillard, R. 1976. The importance of fish quality in the marketplace, p. 8-14. In Fish quality workshops, 1976, Newfoundland Region, EnVIronment Canada, Fisheries and Marine Service, Inspection Branch, St. John's, Nfld., 94 p.
Waterman, J.J. 1963. Handling inshore fish. U.K. Dept. of Sci. and Ind. Res. Torry Research Station, Torry Advisory Note No. 11, 4 p.
Wicks, A. 1976. Quality control, p. 49-53. In Fish quality workshops 1976, Newfoundland Region. Environment Canada, Fisheries and Marine Service, Inspection Branch, St. John's, Nfld., 94 p .
•
•

•
•