gaap 2014 fs - municipal securities rulemaking board · mayo clinic florida: ... those standards...
TRANSCRIPT

Mayo Clinic Consolidated Financial Report December 31, 2014

Contents Independent Auditor’s Report on the Financial Statements 1 Financial Statements
Consolidated statements of financial position 2 Consolidated statements of activities 3 Consolidated statements of cash flows 4 Notes to consolidated financial statements 5-40
Independent Auditor’s Report on the Supplemental
Information 41 Supplemental Information
Mayo Clinic Florida:
Statements of financial position 42
Statements of activities 43

1
Independent Auditor’s Report on the Financial Statements Board of Trustees Mayo Clinic Report on the Consolidated Financial Statements We have audited the accompanying consolidated financial statements of Mayo Clinic and its subsidiaries, which comprise the consolidated statements of financial position as of December 31, 2014 and 2013, the related consolidated statements of activities and cash flows for the years then ended, and the related notes to the consolidated financial statements. Management’s Responsibility for the Financial Statements Management is responsible for the preparation and fair presentation of these consolidated financial statements in accordance with accounting principles generally accepted in the United States of America; this includes the design, implementation and maintenance of internal control relevant to the preparation and fair presentation of consolidated financial statements that are free from material misstatement, whether due to fraud or error. Auditor’s Responsibility Our responsibility is to express an opinion on these consolidated financial statements based on our audits. We conducted our audits in accordance with auditing standards generally accepted in the United States of America. Those standards require that we plan and perform the audit to obtain reasonable assurance about whether the consolidated financial statements are free from material misstatement. An audit involves performing procedures to obtain audit evidence about the amounts and disclosures in the consolidated financial statements. The procedures selected depend on the auditor’s judgment, including the assessment of the risks of material misstatement of the consolidated financial statements, whether due to fraud or error. In making those risk assessments, the auditor considers internal control relevant to the entity’s preparation and fair presentation of the consolidated financial statements in order to design audit procedures that are appropriate in the circumstances, but not for the purpose of expressing an opinion on the effectiveness of the entity’s internal control. Accordingly, we express no such opinion. An audit also includes evaluating the appropriateness of accounting policies used and the reasonableness of significant accounting estimates made by management, as well as evaluating the overall presentation of the consolidated financial statements. We believe that the audit evidence we have obtained is sufficient and appropriate to provide a basis for our audit opinion. Opinion In our opinion, the consolidated financial statements referred to above present fairly, in all material respects, the financial position of Mayo Clinic and its subsidiaries as of December 31, 2014 and 2013, and the changes in their net assets and their cash flows for the years then ended in accordance with accounting principles generally accepted in the United States of America.
Minneapolis, Minnesota March 2, 2015

2
Mayo Clinic
Consolidated Statements of Financial PositionDecember 31, 2014 and 2013 (In Millions)
Assets 2014 2013Current Assets
Cash and cash equivalents 54.5$ 47.2$ Accounts receivable for medical services, less allowances for
uncollectible accounts of $514.1 in 2014 and $441.9 in 2013 (Note 2) 1,495.2 1,414.4Securities lending collateral (Note 5) 85.2 78.7Other receivables (Notes 10 and 15) 242.3 252.4Other current assets (Note 15) 160.7 146.3
Total current assets 2,037.9 1,939.0
Investments (Note 4) 7,178.7 6,304.1
Investments Under Securities Lending Agreement (Note 5) 90.8 78.9
Other Long-Term Assets (Notes 10, 13 and 15) 649.1 907.7
Property, Plant and Equipment, net (Note 6) 4,056.8 3,978.2 Total assets 14,013.3$ 13,207.9$
Liabilities and Net Assets
Current LiabilitiesAccounts payable 411.2$ 400.4$ Accrued payroll 555.2 511.9 Accrued employee benefits 127.6 128.7 Deferred revenue 42.8 44.1 Long-term variable-rate debt (Note 8) 360.0 240.0 Securities lending payable (Note 5) 85.2 78.7 Other current liabilities (Notes 13, 14 and 15) 321.3 284.0
Total current liabilities 1,903.3 1,687.8
Long-Term Debt (Note 8) 2,450.3 2,321.2
Accrued Pension and Postretirement Benefits, net of current (Note 13) 1,611.1 739.9
Other Long-Term Liabilities (Notes 9, 14 and 15) 857.1 805.5 Total liabilities 6,821.8 5,554.4
Net Assets (Notes 10 and 11)Unrestricted 4,761.4 5,414.6 Temporarily restricted 1,322.6 1,250.0 Permanently restricted 1,107.5 988.9
Total net assets 7,191.5 7,653.5 Total liabilities and net assets 14,013.3$ 13,207.9$
See Notes to Consolidated Financial Statements.

3
Mayo Clinic
Consolidated Statements of ActivitiesYears Ended December 31, 2014 and 2013 (In Millions)
Temporarily Permanently Temporarily Permanently
Unrestricted Restricted Restricted Total Unrestricted Restricted Restricted TotalRevenue, gains and other support:
Net medical service revenue (Note 2) 8,165.0$ -$ -$ 8,165.0$ 7,902.1$ -$ -$ 7,902.1$ Grants and contracts 375.2 - - 375.2 371.5 - - 371.5 Investment return allocated to current activities (Note 4) 156.3 16.6 - 172.9 149.2 20.7 - 169.9 Contributions available for current activities 36.4 142.7 - 179.1 49.2 182.3 - 231.5 Premium revenue 131.7 - - 131.7 115.3 - - 115.3 Other (Notes 3 and 16) 736.7 - - 736.7 630.5 - - 630.5 Net assets released from restrictions (Note 10) 179.8 (179.8) - - 166.1 (166.1) - -
Total revenue, gains and other support 9,781.1 (20.5) - 9,760.6 9,383.9 36.9 - 9,420.8
Expenses (Note 12):Salaries and benefits 5,871.5 - - 5,871.5 5,930.2 - - 5,930.2 Supplies and services 2,289.4 - - 2,289.4 2,138.8 - - 2,138.8 Facilities 669.1 - - 669.1 649.6 - - 649.6 Finance and investment 96.3 - - 96.3 90.1 - - 90.1
Total expenses 8,926.3 - - 8,926.3 8,808.7 - - 8,808.7
Income (loss) from current activities 854.8 (20.5) - 834.3 575.2 36.9 - 612.1
Noncurrent and other items:Contributions not available for current activities, net (11.2) 4.8 103.9 97.5 (15.4) 25.6 142.4 152.6 Unallocated investment return, net (Note 4) 133.8 95.9 - 229.7 258.9 174.2 - 433.1 Income tax expense (Note 7) (32.2) - - (32.2) (22.1) - - (22.1) Reclassifications and other (8.5) (7.6) 14.7 (1.4) 9.2 - - 9.2
Total noncurrent and other items 81.9 93.1 118.6 293.6 230.6 199.8 142.4 572.8
Increase in net assets before otherchanges in net assets 936.7 72.6 118.6 1,127.9 805.8 236.7 142.4 1,184.9
Pension and other postretirement benefit adjustments (Note 13) (1,589.9) - - (1,589.9) 1,782.3 - - 1,782.3
Increase (decrease) in net assets (653.2) 72.6 118.6 (462.0) 2,588.1 236.7 142.4 2,967.2
Net assets at beginning of year 5,414.6 1,250.0 988.9 7,653.5 2,826.5 1,013.3 846.5 4,686.3 Net assets at end of year 4,761.4$ 1,322.6$ 1,107.5$ 7,191.5$ 5,414.6$ 1,250.0$ 988.9$ 7,653.5$
See Notes to Consolidated Financial Statements.
2014 2013
4
Mayo Clinic
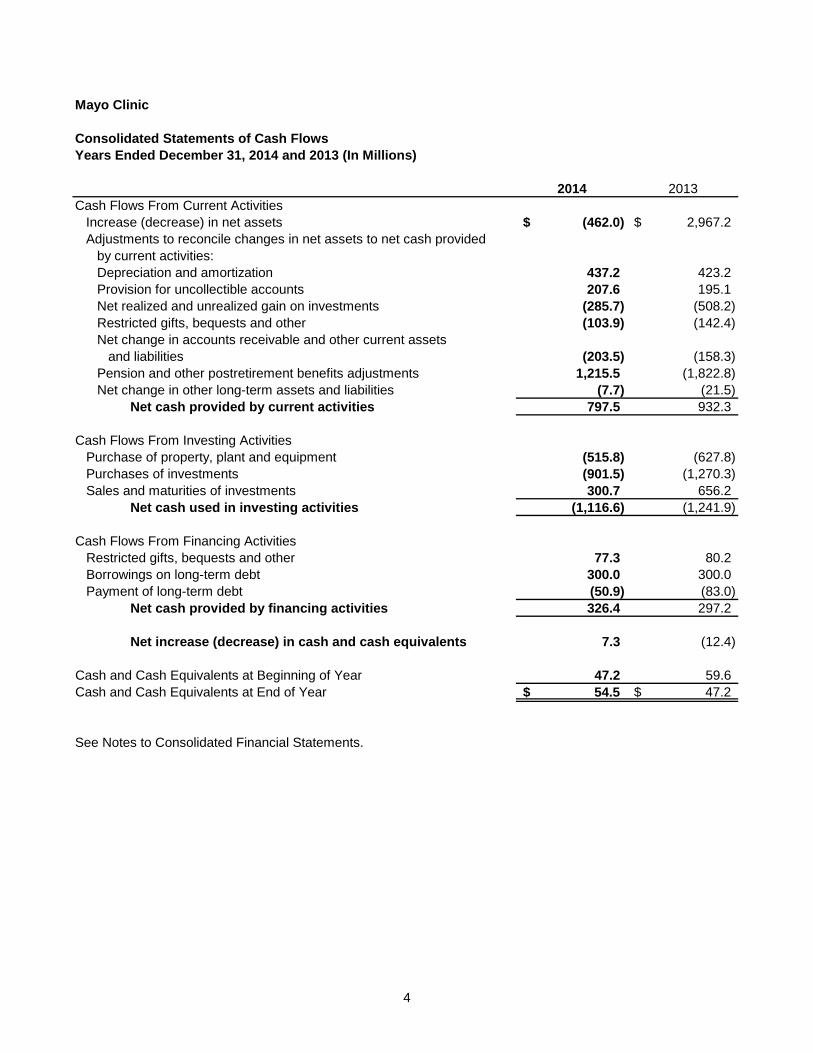
Consolidated Statements of Cash FlowsYears Ended December 31, 2014 and 2013 (In Millions)
2014 2013Cash Flows From Current Activities
Increase (decrease) in net assets (462.0)$ 2,967.2$ Adjustments to reconcile changes in net assets to net cash provided
by current activities:Depreciation and amortization 437.2 423.2 Provision for uncollectible accounts 207.6 195.1 Net realized and unrealized gain on investments (285.7) (508.2) Restricted gifts, bequests and other (103.9) (142.4) Net change in accounts receivable and other current assets
and liabilities (203.5) (158.3) Pension and other postretirement benefits adjustments 1,215.5 (1,822.8) Net change in other long-term assets and liabilities (7.7) (21.5)
Net cash provided by current activities 797.5 932.3
Cash Flows From Investing ActivitiesPurchase of property, plant and equipment (515.8) (627.8) Purchases of investments (901.5) (1,270.3) Sales and maturities of investments 300.7 656.2
Net cash used in investing activities (1,116.6) (1,241.9)
Cash Flows From Financing ActivitiesRestricted gifts, bequests and other 77.3 80.2 Borrowings on long-term debt 300.0 300.0 Payment of long-term debt (50.9) (83.0)
Net cash provided by financing activities 326.4 297.2
Net increase (decrease) in cash and cash equivalents 7.3 (12.4)
Cash and Cash Equivalents at Beginning of Year 47.2 59.6 Cash and Cash Equivalents at End of Year 54.5$ 47.2$
See Notes to Consolidated Financial Statements.

Mayo Clinic Notes to Consolidated Financial Statements (In Millions)
5
Note 1. Organization and Summary of Significant Accounting Policies
Organization: Mayo Clinic (Clinic) and its Arizona, Florida, Georgia, Iowa, Minnesota and Wisconsin affiliates provide comprehensive medical care and education in clinical medicine and medical sciences and conduct extensive programs in medical research. The Clinic and its affiliates also provide hospital and outpatient services, and at each major location, the clinical practice is closely integrated with advanced education and research programs. The Clinic and most of its subsidiaries have been determined to qualify as a tax-exempt organization under Section 501(c)(3) of the Internal Revenue Code (Code) and as a public charity under Section 509(a)(2) of the Code. Basis of presentation: Included in the Clinic’s consolidated financial statements are all of its wholly owned or wholly controlled subsidiaries. All significant intercompany transactions have been eliminated in consolidation. In addition, these statements follow generally accepted accounting principles applicable to the not-for-profit industry as described in the Financial Accounting Standards Board’s FASB Accounting Standards Codification (ASC) Topic 958. New accounting pronouncement: In May 2014, the FASB issued Accounting Standards Update (ASU) No. 2014-09, Revenue from Contracts with Customers (Topic 606), which converged and replaced existing revenue recognition guidance, including industry-specific guidance. This ASU requires revenue to be recognized in an amount that reflects the consideration the entity expects to be entitled in an exchange of goods or services. The update is effective during interim and annual periods beginning on or after January 1, 2017, for the Clinic. Early application is not permitted. The ASU allows for full or modified retrospective adoption. Under the full retrospective application, an entity will apply the standard to each prior reporting period presented. Under the modified retrospective application, an entity recognizes the cumulative effect of initially applying the new standard as an adjustment to the opening balance of net assets at the date of initial application. Revenue in periods presented before that date will continue to be reported under guidance in effect before the change. The Clinic is evaluating this new guidance and has not yet determined which approach it will adopt to apply the amendments or the impact that the adoption of this update will have on its consolidated financial statements. Use of estimates: The preparation of financial statements in conformity with generally accepted accounting principles requires management to make estimates and assumptions that affect the reported amounts of assets and liabilities at the date of the financial statements. Estimates also affect the reported amounts of revenue and expenses during the reporting period. Actual results could differ from those estimates. Cash and cash equivalents: Cash and cash equivalents include currency on hand, demand deposits with banks or other financial institutions, and short-term investments with maturities of three months or less from the date of purchase, which are not managed by the Clinic’s investment managers. Accounts receivable for medical services: Accounts receivable for medical services are stated at estimated net realizable value. The Clinic estimates the allowances for uncollectible accounts based on historic write-offs and the aging of the accounts. Accounts are written off when collection efforts have been exhausted. Inventories: Inventories, consisting primarily of medical supplies and pharmaceuticals, are stated at the lower of cost or market, determined using the first-in, first-out method.

Mayo Clinic Notes to Consolidated Financial Statements (In Millions)
6
Note 1. Organization and Summary of Significant Accounting Policies (Continued)
Investments: Investments in equity and debt securities, including alternative investments, are recorded at fair value (Note 4). Fair value is the price that would be received to sell an asset or paid to transfer a liability in an orderly transaction between market participants at the measurement date. Realized gains and losses are calculated based on the average cost method. Investment income or loss (including realized and unrealized gains and losses on investments, interest and dividends) are included in the consolidated statements of activities. The investments in alternative investments may individually expose the Clinic to securities lending, short sales, and trading in futures and forward contract options and other derivative products. The Clinic’s risk is generally limited to the investment’s carrying value. It is the Clinic’s intent to maintain a long-term investment portfolio to support research, education and other activities. Accordingly, the total investment return is reported in the consolidated statements of activities in two categories. The investment return allocated to current activities is determined by a formula, which involves allocating five percent of a three-year moving average of investments related to endowments and additionally entails the matching of financing costs for the assets required for operations. Management believes this return is approximately equal to the real return that the Clinic expects to earn on its investments over the long term. The unallocated investment return, included in noncurrent and other items in the consolidated statements of activities, represents the difference between the total investment return and the amount allocated to current activities. Property, plant and equipment: Property, plant and equipment are carried at cost if purchased or at fair value on the date received through affiliation or donation, less accumulated depreciation. Plant and equipment are depreciated over estimated useful lives ranging from three to fifty years using the straight-line method. Depreciation expense is reflected in facilities expense and was $437.2 and $423.2 in 2014 and 2013, respectively, and includes amortization of assets recorded under capital leases. Costs associated with the development and installation of internal-use software are accounted for in accordance with the Intangibles—Goodwill and Other, Internal Use Software subtopic of the FASB ASC. Accordingly, internal-use software costs are expensed or capitalized according to the provisions of the accounting standard. Deferred compensation: The Clinic offers eligible employees a nonqualified, tax-deferred compensation retirement plan. Employees defer compensation into the plan on a pretax basis. For the most part, the plan operates similar to a defined contribution plan. Asset retirement obligations: The Clinic accounts for the estimated cost of legal obligations associated with long-lived asset retirements in accordance with the Asset Retirement and Environmental Obligations topic of the FASB ASC. The asset retirement liability, recorded in other long-term liabilities, is accreted to the present value of the estimated future costs of these obligations at the end of each period. Net assets: Resources are classified for reporting purposes into three net asset categories (unrestricted, temporarily restricted and permanently restricted) according to the absence or existence of donor-imposed restrictions. Temporarily restricted net assets are those assets, including contributions and accumulated investment returns, whose use has been limited by donors to specific purposes or time periods. Permanently restricted net assets are those for which donors require the principal of the gifts to be maintained in perpetuity and provide a permanent source of income. Reclassifications of net assets are primarily the result of donor redesignations.

Mayo Clinic Notes to Consolidated Financial Statements (In Millions)
7
Note 1. Organization and Summary of Significant Accounting Policies (Continued)
Net medical service revenue: Net medical service revenue is recognized when services are provided. The Clinic has agreements with third-party payors that provide for payments to the Clinic at amounts different from its established rates. Payment arrangements include prospectively determined rates per discharge, reimbursed costs, discounted charges, and per diem rates. Net medical service revenue is reported at the estimated net amounts due from patients and third-party payors for services rendered. For patients that do not qualify for charity care, the Clinic recognizes revenue on the basis of its standard rates for services provided less an allowance for uncollectible accounts (or on the basis of discounted rates, if negotiated or provided by policy). Based on historical experience, a portion of the Clinic’s patients will be unable or unwilling to pay for the services provided. Thus, the Clinic records a provision for uncollectible accounts related to patients in the period the services are provided. Grants and contracts: Reciprocal grants and contracts revenue is recognized when the expenses have been incurred for the purpose specified by the grantor or in accordance with the terms of the agreement. Payments received in advance are reported as deferred revenue. Grant and contract amounts due to the Clinic are included in other receivables. Premium revenue: Premium revenue represents capitated health premiums received by a managed care subsidiary from third parties and is recognized as revenue in the period in which enrollees are entitled to health care services. Charity and uncompensated care: The Clinic provides health care services to patients who meet certain criteria under its Charity Care Policy without charge or at amounts less than established rates. Since the Clinic does not pursue collection of these amounts, they are not reported as revenue. The estimated cost of providing these services was $75.9 and $84.4 in 2014 and 2013, respectively, calculated by multiplying the ratio of cost to gross charges for the Clinic by the gross uncompensated charges associated with providing care to charity patients. In addition to the charges related to the direct patient care provided under the Clinic’s Charity Care Policy, the Clinic has programs offered to benefit the broader community and other governmental reimbursement programs. The Clinic also participates in various state Medicaid programs for indigent patients. The estimated unreimbursable cost of providing services related to Medicaid programs totaled $385.4 and $353.2 in 2014 and 2013, respectively. Contributions: The Clinic classifies unrestricted contributions and temporarily restricted contributions that are available for current activities as revenue, based on the lack of specific donor restriction or the presence of donor restrictions and the ability of the Clinic to meet those restrictions within the fiscal year. Permanently restricted contributions and temporarily restricted contributions that are not available for current activities are classified in noncurrent and other items in the consolidated statements of activities. Development expenses of $37.1 and $36.8 are allocated between current ($25.2 and $21.4) and noncurrent ($11.9 and $15.4) activities in 2014 and 2013, respectively. The current portion is recorded in expenses, and the noncurrent portion is netted against unrestricted contributions not available for current activities in the consolidated statements of activities. Unconditional promises to give and contributions are reported at fair value at the time of the gift. An allowance for uncollectible pledges receivable is estimated based on a combination of historical experience and specific identification. Conditional promises to give are recognized at fair value when the conditions on which they depend are substantially met or the probability that the condition will not be met is remote. The Clinic does not imply a time restriction that expires over the useful life for gifts of long-lived assets. The Clinic periodically receives works of art from various benefactors. These items are unique in nature and are held on display for the benefit and enjoyment of the Clinic’s patients. It is the Clinic’s policy to neither capitalize contributed works of art nor record the related contribution revenue.

Mayo Clinic Notes to Consolidated Financial Statements (In Millions)
8
Note 1. Organization and Summary of Significant Accounting Policies (Continued)
Income from current activities: The Clinic’s policy is to include in income from current activities all net medical service and other revenue, grants and contracts, investment return allocated to current activities, contributions available for current activities, premium revenue, net assets released from restrictions, and substantially all expenses. Contributions not available for current activities, unallocated investment return, and those items not expected to recur on a regular basis are included in noncurrent and other items in the consolidated statements of activities. Subsequent events: The Clinic evaluated events and transactions occurring subsequent to December 31, 2014, through March 2, 2015, the date of issuance of the consolidated financial statements. During this period, there were no subsequent events requiring recognition in the consolidated financial statements. Additionally, there were no unrecognized events requiring disclosure, except the Clinic has an initiative with a major health care software company to consolidate onto a single, integrated, patient-centered electronic medical record and revenue cycle management platform. The project is highly complex and integral to operations. Operating and capital expenditures are estimated to exceed $1 billion with a project timeline of approximately five years for implementation at all Clinic locations. Successful installation will enhance the Clinic’s ability to further standardize patient care and administrative activities that will improve outcomes and experiences for all patients.
Note 2. Net Medical Service Revenue, Contractual Arrangements With Third-Party Payors, and Allowance for Doubtful Accounts
The Clinic provides care to patients under the Medicare program and contractual arrangements with other third-party payors. The Medicare program pays for inpatient and most outpatient services at predetermined rates. Certain hospital services are reimbursed based on allowable costs as reported in cost reports, which are subject to retroactive audit and adjustment. Adjustments arising from reimbursement arrangements with third-party payors are accrued on an estimated basis in the period in which the services are rendered. Estimates for recognized cost report settlements can differ from actual reimbursement based on the results of subsequent reviews and cost report audits. The impact to net medical service revenue of such items was not significant in 2014 and 2013. Future changes in the Medicare program and reduction of funding levels could have an adverse effect on the Clinic. Net medical service revenue under the Medicare program represented approximately 25 percent of total net medical service revenue for 2014 and 2013. At December 31, 2014 and 2013, approximately 16 percent and 17 percent, respectively, of accounts receivable for medical services was due from the Medicare program.

Mayo Clinic Notes to Consolidated Financial Statements (In Millions)
9
Note 2. Net Medical Service Revenue, Contractual Arrangements With Third-Party Payors, and Allowance for Doubtful Accounts (Continued)
As a service to the patient, the Clinic bills third-party payors directly and bills the patient when the patient’s liability is determined. Accounts receivable are reduced by an allowance for doubtful accounts. In evaluating the collectibility of accounts receivable, the Clinic analyzes its past history and identifies trends for each of its major payor sources of revenue to estimate the appropriate allowance for doubtful accounts and provision for bad debts. Management regularly reviews data about these major payor sources of revenue in evaluating the sufficiency of the allowance for doubtful accounts. For receivables associated with services provided to patients who have third-party coverage, the Clinic analyzes contractually due amounts and provides contractual allowances based on these amounts. Additionally, an allowance for doubtful accounts and a provision for uncollectible accounts is provided for expected uncollectible deductibles and copayments on accounts for which the patient is responsible. For receivables associated with self-pay patients, the Clinic records a significant provision for uncollectible accounts in the period of service on the basis of its past experience, which indicates that many patients are unable or unwilling to pay the portion of their bill for which they are financially responsible. The difference between the standard rates (or the discounted rates if negotiated) and the amounts actually collected after all reasonable collection efforts have been exhausted is charged off against the allowance for doubtful accounts. The Clinic’s allowance for doubtful accounts was 25.6 percent and 23.8 percent of accounts receivable at December 31, 2014 and 2013, respectively. In addition, the Clinic’s write-offs were $132.6 and $139.9 for the years ended December 31, 2014 and 2013, respectively. The Clinic has not significantly changed its charity care policies in 2014. Net medical service revenue for the years ended December 31 consisted of the following:
2014 2013Medical service revenue (net of contractual allowances and
discounts) 8,369.8$ 8,094.2$ Provision for uncollectible accounts (204.8) (192.1) Net medical service revenue 8,165.0$ 7,902.1$ The Clinic recognizes patient service revenue associated with services provided to patients who have third-party payor coverage on the basis of contractual rates for the services rendered. Medical service revenue, net of contractual allowances and discounts (but before the provision for uncollectible accounts), recognized in the years ended December 31 from these major payor sources, is as follows:
2014 2013
Third-party payors 7,968.7$ 7,676.1$ Self-pay 401.1 418.1 Total all payors 8,369.8$ 8,094.2$

Mayo Clinic Notes to Consolidated Financial Statements (In Millions)
10
Note 3. Incentive Revenue
The Health Information Technology for Economic and Clinic Health (HITECH) portion of the American Recovery and Reinvestment Act of 2009 included $27.0 billion in incentives through Medicare and Medicaid reimbursement systems to foster electronic health record (EHR) adoption. In order to be eligible for EHR incentive funding, eligible hospitals and professionals must use a certified EHR, report quality measures, and achieve “meaningful use,” as defined by HITECH. The Clinic is entitled to receive Medicare and Medicaid incentive payments for the adoption of certified EHR technology for its eligible hospitals and employed physicians, as the Clinic believes it has satisfied the statutory and regulatory requirements. The Clinic applies the gain contingency model for recognizing incentive revenue. As a result, incentives earned totaled $36.4 and $54.7 for the years ended December 31, 2014 and 2013, respectively, and are included in other revenue. Income from incentive payments is subject to retrospective adjustments as the incentive payments are calculated using Medicare cost report data that is subject to audit. Additionally, the Clinic’s compliance with the meaningful use criteria is subject to audit by the federal government.
Note 4. Fair Value Measurements, Investments and Other Financial Instruments
The Clinic holds certain financial instruments that are required to be measured at fair value on a recurring basis. The valuation techniques used to measure fair value under the Fair Value Measurements and Disclosures topic of the FASB ASC are based upon observable and unobservable inputs. The standard establishes a three-level valuation hierarchy for disclosure of fair value measurements. The valuation hierarchy is based upon the transparency of inputs to the valuation of an asset or liability as of the measurement date. The three levels are defined as follows: Level 1: Inputs to the valuation methodology are quoted prices (unadjusted) for identical assets or
liabilities in active markets. Level 2: Inputs to the valuation methodology include quoted prices for similar assets or liabilities in active
markets, and inputs that are observable for the asset or liability, either directly or indirectly, for substantially the same term of the financial instrument.
Level 3: Inputs to the valuation methodology are unobservable and significant to the fair value
measurement. A financial instrument’s categorization within the valuation hierarchy is based upon the lowest level of input that is significant to the fair value measurement. The Clinic’s policy is to recognize transfers in and transfers out as of the actual date of the event or change in circumstances that caused the transfer. There were no transfers in 2014 or 2013.

Mayo Clinic Notes to Consolidated Financial Statements (In Millions)
11
Note 4. Fair Value Measurements, Investments and Other Financial Instruments (Continued)
The following tables present the financial instruments carried at fair value as of December 31, 2014 and 2013, by caption on the consolidated statements of financial position categorized by the valuation hierarchy defined above:
TotalLevel 1 Level 2 Level 3 Fair Value
Assets:Securities lending collateral 85.2$ -$ -$ 85.2$
Investments: Cash equivalents 1,145.0 - - 1,145.0 Fixed-income securities:
U.S. government - 108.6 - 108.6 U.S. government agencies - 225.2 - 225.2 U.S. corporate - 319.0 20.3 339.3 Foreign - 89.9 - 89.9
Common and preferred stocks: U.S. 410.7 - - 410.7 Foreign 390.8 - - 390.8
Funds: Fixed-income 348.8 - - 348.8 Equities 398.1 110.9 - 509.0
Alternative investments: Absolute return and hedge funds - - 2,239.5 2,239.5 Private equity, real estate and natural
resources funds - - 1,458.2 1,458.2 Other investments 4.5 - - 4.5
Less securities under lending agreement (90.8) - - (90.8) Total investments 2,607.1 853.6 3,718.0 7,178.7
Investments under securities lendingagreement 90.8 - - 90.8
Other long-term assets:Trust receivables 94.8 34.6 55.5 184.9 Technology-based ventures - - 29.8 29.8
Total other long-term assets 94.8 34.6 85.3 214.7 Total assets at fair value 2,877.9$ 888.2$ 3,803.3$ 7,569.4$
Liabilities:Securities lending payable 85.2$ -$ -$ 85.2$
Total liabilities at fair value 85.2$ -$ -$ 85.2$
December 31, 2014

Mayo Clinic Notes to Consolidated Financial Statements (In Millions)
12
Note 4. Fair Value Measurements, Investments and Other Financial Instruments (Continued)
TotalLevel 1 Level 2 Level 3 Fair Value
Assets:Securities lending collateral 78.7$ -$ -$ 78.7$
Investments: Cash equivalents 1,012.8 - - 1,012.8 Fixed-income securities:
U.S. government - 73.7 - 73.7 U.S. government agencies - 358.0 - 358.0 U.S. corporate - 139.2 26.6 165.8 Foreign - 69.6 - 69.6
Common and preferred stocks: U.S. 381.6 - - 381.6 Foreign 294.5 - - 294.5
Funds: Fixed-income 335.4 - - 335.4 Equities 406.2 116.0 - 522.2
Alternative investments: Absolute return and hedge funds - - 2,043.9 2,043.9 Private equity, real estate and natural
resources funds - - 1,125.0 1,125.0 Other investments 0.5 - - 0.5
Less securities under lending agreement (78.9) - - (78.9) Total investments 2,352.1 756.5 3,195.5 6,304.1
Investments under securities lendingagreement 78.9 - - 78.9
Other long-term assets:Trust receivables 93.4 32.9 53.9 180.2 Technology-based ventures - - 19.6 19.6
Total other long-term assets 93.4 32.9 73.5 199.8 Total assets at fair value 2,603.1$ 789.4$ 3,269.0$ 6,661.5$
Liabilities:Securities lending payable 78.7$ -$ -$ 78.7$
Total liabilities at fair value 78.7$ -$ -$ 78.7$
December 31, 2013

Mayo Clinic Notes to Consolidated Financial Statements (In Millions)
13
Note 4. Fair Value Measurements, Investments and Other Financial Instruments (Continued)
Following is a description of the Clinic’s valuation methodologies for assets and liabilities measured at fair value. Fair value for Level 1 is based upon quoted market prices. Fair value for Level 2 is based on quoted prices for similar instruments in active markets, quoted prices for identical or similar instruments in markets that are not active, and model-based valuation techniques for which all significant assumptions are observable in the market or can be corroborated by observable market data for substantially the full term of the assets. Inputs are obtained from various sources, including market participants, dealers and brokers. Level 3, which primarily consists of alternative investments (principally limited partnership interests in absolute return, hedge, private equity, real estate and natural resources funds), represents the Clinic’s ownership interest in the net asset value (NAV) of the respective partnership obtained from fund manager statements and historical audited financial statements. Investments held by the partnerships consist of marketable securities as well as securities that do not have readily determinable fair values. The fair values of the securities held by partnerships that do not have readily determinable fair values are determined by the general partner and are based on historical cost, appraisals, or other estimates that require varying degrees of judgment. If no public market exists for the investment securities, the fair value is determined by the general partner, taking into consideration, among other things, the cost of the securities, prices of recent significant placements of securities of the same issuer, and subsequent developments concerning the companies to which the securities relate. Alternative investments are redeemable with the investee fund at NAV under the original terms of the subscription agreement. Due to the nature of these investments, changes in market conditions and the overall economic environment may significantly impact the NAV of the funds and, therefore, the value of the Clinic’s interest. It is therefore reasonably possible that, if the Clinic were to sell all or a portion of its alternative investments, the transaction value could be significantly different than the fair value reported as of December 31. The trusts receivable are recorded at fair value based on the underlying value of the assets in the trust or discounted cash flow of the expected payment streams. The trusts reported as Level 3 are primarily perpetual trusts managed by third parties invested in stocks, mutual funds and fixed-income securities that are traded in active markets with observable inputs, which would result in Level 1 and 2 hierarchal reporting. However, since the Clinic will never receive the trust assets, these perpetual trusts are reported as Level 3. The methods described above may produce a fair value calculation that may not be indicative of net realizable value or reflective of future fair values. Furthermore, while the Clinic believes its valuation methods are appropriate and consistent with other market participants, the use of different methodologies or assumptions to determine the fair value of certain financial instruments could result in a different estimate of fair value at the reporting date.

Mayo Clinic Notes to Consolidated Financial Statements (In Millions)
14
Note 4. Fair Value Measurements, Investments and Other Financial Instruments (Continued)
The following tables are a rollforward of the consolidated statement of financial position amounts for financial instruments classified by the Clinic within Level 3 of the valuation hierarchy defined above:
Absolute Private Return Equity
Investments Investments Other Total
Fair value December 31, 2012 1,577.0 $ 986.1 $ 81.1 $ 2,644.2 $ Realized gain (loss) (438.1) 53.5 (20.6) (405.2) Unrealized gain 777.4 33.2 4.3 814.9 Purchases 352.1 256.4 35.3 643.8 Issuances and settlements (224.5) (204.2) - (428.7) Fair value December 31, 2013 2,043.9 1,125.0 100.1 3,269.0 Realized gain 20.3 63.0 2.1 85.4 Unrealized gain 100.0 95.0 10.3 205.3 Purchases 126.7 394.4 8.0 529.1 Issuances and settlements (51.4) (219.2) (14.9) (285.5) Fair value December 31, 2014 2,239.5 $ 1,458.2 $ 105.6 $ 3,803.3 $ The following information pertains to those alternative investments recorded at net asset value in accordance with the Fair Value Measurements and Disclosures topic of the FASB ASC. At December 31, 2014, alternative investments recorded at NAV consisted of the following:
Redemption RedemptionFair Unfunded Frequency (If Notice
Value Commitment Currently Eligible) Period
Absolute return/hedge funds (a) 2,239.5$ -$ Monthly to annually 30–90 daysPrivate partnerships (b) 1,458.2 913.1
3,697.7$ 913.1$ At December 31, 2013, alternative investments recorded at NAV consisted of the following:
Redemption RedemptionFair Unfunded Frequency (If Notice
Value Commitment Currently Eligible) Period
Absolute return/hedge funds (a) 2,043.9$ -$ Monthly to annually 30–90 daysPrivate partnerships (b) 1,125.0 819.0
3,168.9$ 819.0$

Mayo Clinic Notes to Consolidated Financial Statements (In Millions)
15
Note 4. Fair Value Measurements, Investments and Other Financial Instruments (Continued)
(a) This category includes investments in absolute return/hedge funds, which are actively managed commingled investment vehicles that derive the majority of their returns from factors other than the directional flow of the markets in which they invest. Representative strategies include high-yield credit, distressed debt, merger arbitrage, relative value, and long-short equity strategies. The fair values of the investments in this category have been estimated using the net asset value per share of the investments. Investments in this category generally carry “lockup” restrictions that do not allow investors to seek redemption in the first year after acquisition. Following the initial lockup period, liquidity is generally available monthly, quarterly or annually following a redemption request. Over 90 percent of the investments in this category have at least annual liquidity.
(b) This category includes limited partnership interests in closed-end funds that focus on venture capital,
private equity, real estate and resource-related strategies. The fair values of the investments in this category have been estimated using the net asset value of the Clinic’s ownership interest in partners’ capital. Distributions from each fund will be received as the underlying investments of the funds are liquidated. It is estimated that the underlying assets of most funds will generally be liquidated over a seven- to 10-year period.
From time to time, the Clinic invests directly in certain derivative contracts that do not qualify for hedge accounting and are recorded at fair value in investments. Changes in fair value are reported as a component of net unrealized gains in the investment returns. These contracts are used in the Clinic’s investment management program to minimize certain investment risks. At December 31, 2014 and 2013, the Clinic did not hold any significant derivative contracts. The carrying values of cash, cash equivalents, short-term investments, accounts receivable, accounts payable and accrued expenses are reasonable estimates of their fair values due to the short-term nature of these financial instruments. The estimated fair value of long-term debt (Note 8), based on quoted market prices for the same or similar issues (Level 2), was approximately $126.7 more than its carrying value at December 31, 2014, and $86.4 less than its carrying value at December 31, 2013. The Clinic uses various external investment managers to diversify the investments in alternative assets. The largest allocation to any alternative investment strategy manager as of December 31, 2014 and 2013, is $275.8 (7.3 percent) and $278.8 (8.8 percent), respectively. The Clinic is required to maintain funds held by trustees under bond indentures and other arrangements. The trustee-held investments, which primarily consist of mutual funds, were $482.3 and $354.2, respectively, at December 31, 2014 and 2013, which includes segregated investments for deferred compensation plans of $402.5 and $349.3 at December 31, 2014 and 2013, respectively. At December 31, 2014 and 2013, cash and mutual funds included segregated investments owned by Mayo Foundation for Medical Education and Research, a wholly owned subsidiary of Mayo Clinic, for gift annuity reserves of $102.9 and $104.2, respectively. The Clinic has internally designated investment balances of $1,764.9 and $1,441.2 at December 31, 2014 and 2013, respectively, for research, education, and capital replacement and expansion.

Mayo Clinic Notes to Consolidated Financial Statements (In Millions)
16
Note 4. Fair Value Measurements, Investments and Other Financial Instruments (Continued)
Investment return consisted of the following for the years ended December 31:
2014 2013
Dividends and interest 116.9$ 94.8$ Net realized gains 166.4 172.1 Net change in unrealized gains 119.3 336.1
402.6$ 603.0$ Investment return (Note 1) is reported in the consolidated statements of activities as follows for the years ended December 31:
2014 2013
Investment return allocated to current activities 172.9$ 169.9$ Unallocated investment return, net 229.7 433.1
402.6$ 603.0$
Note 5. Securities Lending
The Clinic has an arrangement with its investment custodian to lend Clinic securities to approved brokers in exchange for a fee. Among other provisions that limit the Clinic’s risk, the securities lending agreement specifies that the custodian is responsible for lending securities and obtaining adequate collateral from the borrower. Collateral is limited to cash, government securities, and irrevocable letters of credit. Investments are loaned to various brokers and are returnable on demand. In exchange, the Clinic receives collateral. The cash collateral is shown as both an asset and a liability on the consolidated statements of financial position. At December 31, 2014 and 2013, the aggregate market value of securities on loan under securities lending agreements totaled $90.8 and $78.9, respectively, and the total value of the collateral supporting the securities is $93.7 and $80.7, respectively, which represents 103 percent and 102 percent of the value of the securities on loan at December 31, 2014 and 2013, respectively. The cash portion of the collateral supporting the securities as of December 31, 2014 and 2013, is $85.2 and $78.7, respectively. Noncash collateral provided to the Clinic is not recorded in the consolidated statements of financial position, as the collateral may not be sold or re-pledged. The Clinic’s claim on such collateral is limited to the market value of loaned securities. In the event of nonperformance by the other parties to the securities lending agreements, the Clinic could be exposed to some loss.
Mayo Clinic Notes to Consolidated Financial Statements (In Millions)
17
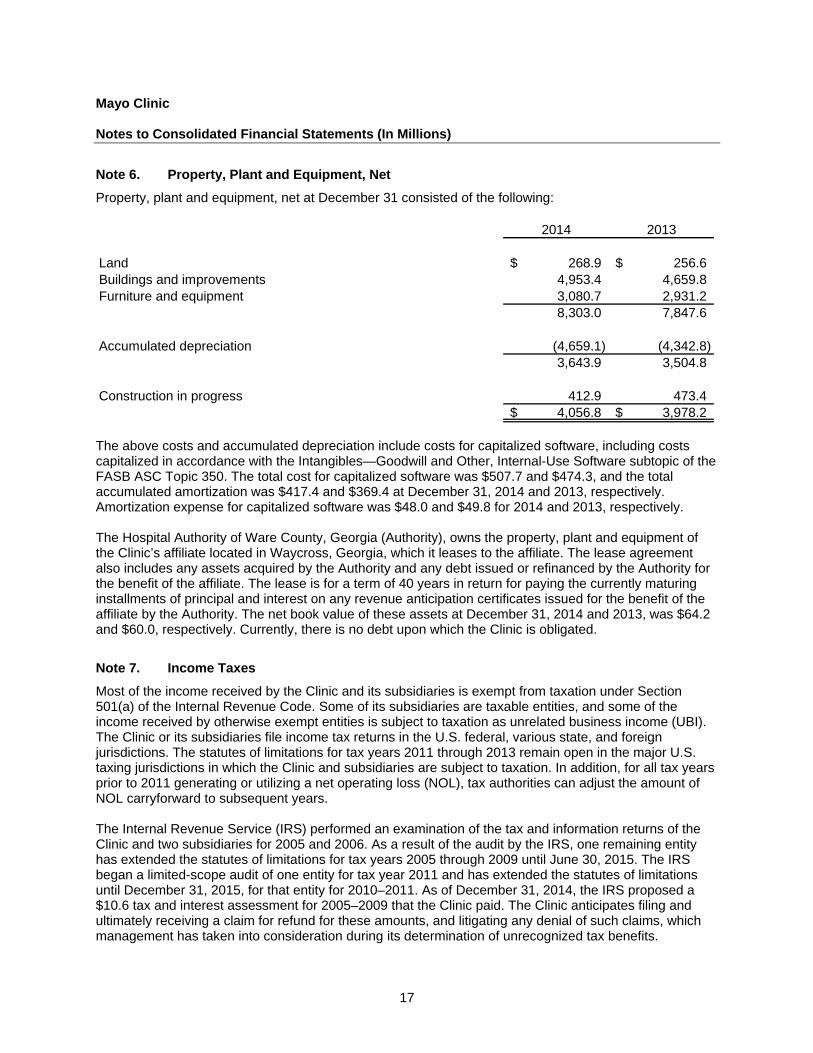
Note 6. Property, Plant and Equipment, Net
Property, plant and equipment, net at December 31 consisted of the following:
2014 2013
Land 268.9$ 256.6$ Buildings and improvements 4,953.4 4,659.8 Furniture and equipment 3,080.7 2,931.2
8,303.0 7,847.6
Accumulated depreciation (4,659.1) (4,342.8) 3,643.9 3,504.8
Construction in progress 412.9 473.4 4,056.8$ 3,978.2$
The above costs and accumulated depreciation include costs for capitalized software, including costs capitalized in accordance with the Intangibles—Goodwill and Other, Internal-Use Software subtopic of the FASB ASC Topic 350. The total cost for capitalized software was $507.7 and $474.3, and the total accumulated amortization was $417.4 and $369.4 at December 31, 2014 and 2013, respectively. Amortization expense for capitalized software was $48.0 and $49.8 for 2014 and 2013, respectively. The Hospital Authority of Ware County, Georgia (Authority), owns the property, plant and equipment of the Clinic’s affiliate located in Waycross, Georgia, which it leases to the affiliate. The lease agreement also includes any assets acquired by the Authority and any debt issued or refinanced by the Authority for the benefit of the affiliate. The lease is for a term of 40 years in return for paying the currently maturing installments of principal and interest on any revenue anticipation certificates issued for the benefit of the affiliate by the Authority. The net book value of these assets at December 31, 2014 and 2013, was $64.2 and $60.0, respectively. Currently, there is no debt upon which the Clinic is obligated.
Note 7. Income Taxes
Most of the income received by the Clinic and its subsidiaries is exempt from taxation under Section 501(a) of the Internal Revenue Code. Some of its subsidiaries are taxable entities, and some of the income received by otherwise exempt entities is subject to taxation as unrelated business income (UBI). The Clinic or its subsidiaries file income tax returns in the U.S. federal, various state, and foreign jurisdictions. The statutes of limitations for tax years 2011 through 2013 remain open in the major U.S. taxing jurisdictions in which the Clinic and subsidiaries are subject to taxation. In addition, for all tax years prior to 2011 generating or utilizing a net operating loss (NOL), tax authorities can adjust the amount of NOL carryforward to subsequent years. The Internal Revenue Service (IRS) performed an examination of the tax and information returns of the Clinic and two subsidiaries for 2005 and 2006. As a result of the audit by the IRS, one remaining entity has extended the statutes of limitations for tax years 2005 through 2009 until June 30, 2015. The IRS began a limited-scope audit of one entity for tax year 2011 and has extended the statutes of limitations until December 31, 2015, for that entity for 2010–2011. As of December 31, 2014, the IRS proposed a $10.6 tax and interest assessment for 2005–2009 that the Clinic paid. The Clinic anticipates filing and ultimately receiving a claim for refund for these amounts, and litigating any denial of such claims, which management has taken into consideration during its determination of unrecognized tax benefits.

Mayo Clinic Notes to Consolidated Financial Statements (In Millions)
18
Note 7. Income Taxes (Continued)
The Clinic’s practice is to recognize interest and/or penalties related to income tax matters in income tax expense. The components of tax expense are as follows:
December 312014 2013
Current—federal 25.9$ 19.2$ Current—state 2.0 3.1
27.9 22.3
Deferred—federal 4.0 15.9 Deferred—state 0.9 (1.9) Change in valuation allowance (0.6) (14.2)
4.3 (0.2) Total 32.2$ 22.1$ Cash payments for income taxes were $47.0 and $19.6 for the years ended December 31, 2014 and 2013, respectively. The Clinic records deferred income taxes due to temporary differences between financial reporting and tax reporting for certain assets and liabilities of its taxable activities. Following is a summary of the components of deferred taxes as of December 31:
2014 2013
Deferred compensation 20.9$ 20.6$ Pension 16.2 6.0 Postretirement benefits 2.9 4.1 Other 4.9 4.8 Total deferred tax asset 44.9 35.5
Deferred tax liability (3.8) - Valuation allowance, net of effects from affiliation (0.8) (1.4) Net deferred tax asset 40.3$ 34.1$
Current 2.6$ 2.4$ Noncurrent 37.7 31.7
40.3$ 34.1$ As of December 31, 2014, the Clinic had no federal net operating losses.

Mayo Clinic Notes to Consolidated Financial Statements (In Millions)
19
Note 8. Financing
Long-term debt at December 31 consisted of the following:
2014 2013City of Rochester, Minnesota Revenue Bonds issued in various
series, subject to variable interest rates to a maximum rate of 15.00% (the average rate was 0.07% in 2014 and 0.11% in 2013),principal due in varying amounts from 2019 through 2052 810.0$ 690.0$
City of Rochester, Minnesota Revenue Bonds issued in various series with fixed rates of interest ranging from 4.00% to 5.00%, principal due in varying amounts from 2028 through 2041 690.0 690.0
Industrial Development Authority of the City of Phoenix, Arizonaissued in various series, subject to variable interest rates toa maximum rate of 10.00% (the average rate was 0.04% in 2014), principal due in varying amounts from 2048 through 2052 180.0 -
Industrial Development Authority of the County of Maricopa HospitalRevenue Bonds issued in various series, interest rate at 5.00%,principal due in varying amounts from 2031 through 2036 50.0 50.0
Jacksonville Economic Development Commission Health Care Facilities Revenue Bonds issued in various series, interest rateat 5.00%, principal due in varying amounts from 2031 to 2036 125.0 125.0
Wisconsin Health and Educational Facilities Authority Revenue Bonds, Series 2008, issued in various series, with fixed interest rates ranging from 4.00% to 5.75%, principal due in varying amounts through 2030 77.7 81.0
Mayo Clinic Taxable Bonds issued with fixed interest ranging from 3.774% to 4.0%, principal due in varying amounts from2039 to 2047 600.0 600.0
Fixed-rate notes, payable to banks, interest rate at 2.01%, principal due in varying amounts through 2016 90.0 135.0
Fixed-rate notes, payable to an insurance company, interest rate at4.71%, principal due in equal amounts from 2042 through 2046 215.0 215.0
Other notes payable 17.2 19.3 Unamortized discounts and premiums, net 5.1 5.4
2,860.0 2,610.7
Long-term variable-rate debt classified as current (360.0) (240.0) Current maturities included in other current liabilities (49.7) (49.5)
2,450.3$ 2,321.2$ The Clinic’s outstanding revenue bond issues are limited obligations of various issuing authorities payable solely by the Clinic pursuant to loan agreements between the borrowing entities and the issuing authorities. Under various financing agreements, the Clinic must meet certain operating and financial performance covenants.

Mayo Clinic Notes to Consolidated Financial Statements (In Millions)
20
Note 8. Financing (Continued)
At December 31, 2014, the $990.0 of variable-rate bonds consist of variable-rate demand revenue bonds. In conjunction with the issuance of the variable-rate demand revenue bonds, the Clinic has entered into various bank standby purchase and credit agreements in the amount of $630.0 that expire at various dates commencing January 2016. Under the terms of these agreements, the bank will make liquidity loans to the Clinic in the amount necessary to purchase a portion of the variable-rate demand revenue bonds if not remarketed. The liquidity loans would be payable over a three- to five-year period, with the first payment due after December 31, 2015. The Clinic has provided self-liquidity for the remaining $360.0 of variable-rate demand revenue bonds, which have been classified as current in the accompanying consolidated statements of financial position. In May 2014, the Clinic issued tax-exempt, variable-rate demand revenue bonds in the aggregate principal amount of $300.0 (Industrial Development Authority of the City of Phoenix, Arizona for $180.0 and City of Rochester, Minnesota Revenue Bonds for $120.0), due November 15, 2052. The bonds are redeemable prior to maturity at par. The bond proceeds will be used for the construction of proton beam radiation therapy centers located in Rochester, Minnesota, and Phoenix, Arizona, and other capital projects involving renovations or acquisition of capital equipment and construction. All fixed-rate interest revenue bonds are callable from 2015 to 2046 at the option of the Clinic, at a redemption price of 100 percent of the principal amount or at a price based on U.S. Treasury rates at the time of redemption. The following are scheduled maturities of long-term debt for each of the next five years, assuming the variable-rate demand revenue bonds are remarketed and the standby purchase agreements renewed. As described above, if such bonds are not remarketed, $360.0 may be due in 2015 and $630.0 may be due in years from 2016 to 2020. Years Ending December 31,
2015 49.7$ 2016 49.0 2017 4.1 2018 4.4 2019 6.3 Interest payments on long-term debt, net of amounts capitalized for 2014 and 2013, totaled $80.7 and $79.8, respectively. The amount of interest capitalized, net of related interest income, was $5.4 and $10.1 during 2014 and 2013, respectively. Interest expense totaled $80.4 and $80.2 for 2014 and 2013, respectively. At December 31, 2014 and 2013, the Clinic had unsecured lines of credit available with banks totaling $325.0, with varying renewable terms and interest up to 0.25 percent over various published rates. There were no amounts drawn at December 31, 2014 and 2013.

Mayo Clinic Notes to Consolidated Financial Statements (In Millions)
21
Note 9. Lease Commitments
Certain leases are classified as capital leases. The leased assets are included as part of property, plant and equipment (Note 6), and the capital lease obligations of $27.8 and $28.2 as of December 31, 2014 and 2013, respectively, are recorded in other current and long-term liabilities. Other leases are classified as operating and are not capitalized. The payments on such leases are recorded as expense. Details of the capitalized lease assets, excluding the Waycross, Georgia, lease, are as follows at December 31:
2014 2013
Buildings and equipment 34.3$ 35.1$ Furniture and equipment 4.0 3.9
38.3 39.0
Accumulated depreciation (9.5) (7.7) 28.8$ 31.3$
Rental expense incurred for operating leases was $26.9 and $27.4 for the years ended December 31, 2014 and 2013, respectively. At December 31, 2014, the estimated future minimum lease payments under noncancellable operating leases and capital leases, excluding the Waycross, Georgia, lease, were as follows: Years Ending December 31, Operating Capital
2015 22.8$ 3.2$ 2016 18.9 2.6 2017 15.5 2.5 2018 11.6 2.2 2019 7.2 1.7 Thereafter 34.8 22.2 Minimum lease payments 110.8$ 34.4
Less amount representing interest (6.6) Net minimum lease payments under capital leases 27.8$

Mayo Clinic Notes to Consolidated Financial Statements (In Millions)
22
Note 10. Contributions and Restricted Expenditures
The Clinic receives unrestricted, temporarily restricted, and permanently restricted contributions in support of research, education and clinical activities. Temporarily restricted net assets were available for the following at December 31:
2014 2013
Research 554.1$ 508.2$ Education 274.5 258.2 Buildings and equipment 23.6 21.9 Charity care 50.8 45.7 Clinical 91.5 83.6 Other 36.5 33.2 Pledges and trusts 291.6 299.2
1,322.6$ 1,250.0$ Permanently restricted net assets at December 31 are summarized below, the income from which is expendable to support the following:
2014 2013
Research 620.1$ 541.9$ Education 187.7 168.6 Charity care 11.8 9.8 Clinical 51.5 43.3 Other 17.5 33.0 Pledges and trusts 218.9 192.3
1,107.5$ 988.9$ Net assets were released from donor restrictions as expenditures were made, which satisfied the following restricted purposes for the years ended December 31:
2014 2013
Research 123.9$ 113.1$ Education 20.8 20.8 Buildings and equipment 11.6 16.9 Other 23.5 15.3
179.8$ 166.1$

Mayo Clinic Notes to Consolidated Financial Statements (In Millions)
23
Note 10. Contributions and Restricted Expenditures (Continued)
At December 31, outstanding pledges from various corporations, foundations and individuals, included in other receivables and other long-term assets, were as follows:
2014 2013Pledges due:
In less than one year 106.7$ 108.3$ In one to five years 218.7 198.0 In more than five years 26.3 22.4
351.7 328.7
Allowance for uncollectible pledges and discounts (15.8) (14.3) 335.9$ 314.4$
Estimated cash flows from pledge receivables due after one year are discounted using a risk-adjusted rate, ranging from 0.92 percent to 6.52 percent, that is commensurate with the pledges’ due dates and established in the year the pledge is received. The Clinic has received interests in various split-interest, perpetual, and charitable remainder trusts from donors, which are included in other long-term assets. The trusts, which are recorded at fair value based on the underlying value of the assets in the trust or discounted cash flow of the expected payment streams, were $184.9 and $180.2 at December 31, 2014 and 2013, respectively.
Note 11. Endowment
The Clinic’s endowment consists of approximately 1,500 individual funds established for a variety of purposes. The endowment includes both donor-restricted endowment funds and funds designated by the Board of Trustees to function as endowments (board-designated funds). Net assets associated with endowment funds, including funds designated by the Board of Trustees to function as endowments, are classified and reported based on the existence or absence of donor-imposed restrictions. The Board of Trustees retains the right to re-designate board-designated funds. The Board of Trustees of the Clinic has interpreted the Minnesota State Prudent Management of Institutional Funds Act (SPMIFA) as requiring the preservation of the fair value of the original gift as of the gift date of the donor-restricted endowment funds absent explicit donor stipulations to the contrary. As a result of this interpretation, the Clinic classifies as permanently restricted net assets (a) the original value of gifts donated to the permanent endowment, (b) the original value of subsequent gifts to the permanent endowment, and (c) accumulations to the permanent endowment made in accordance with the direction of the applicable donor gift instrument at the time the accumulation is added to the fund. The remaining portion of the donor-restricted endowment fund that is not classified in permanently restricted net assets is classified as temporarily restricted net assets until those amounts are appropriated for expenditure by the organization in a manner consistent with the standard of prudence prescribed by SPMIFA.
Mayo Clinic Notes to Consolidated Financial Statements (In Millions)
24
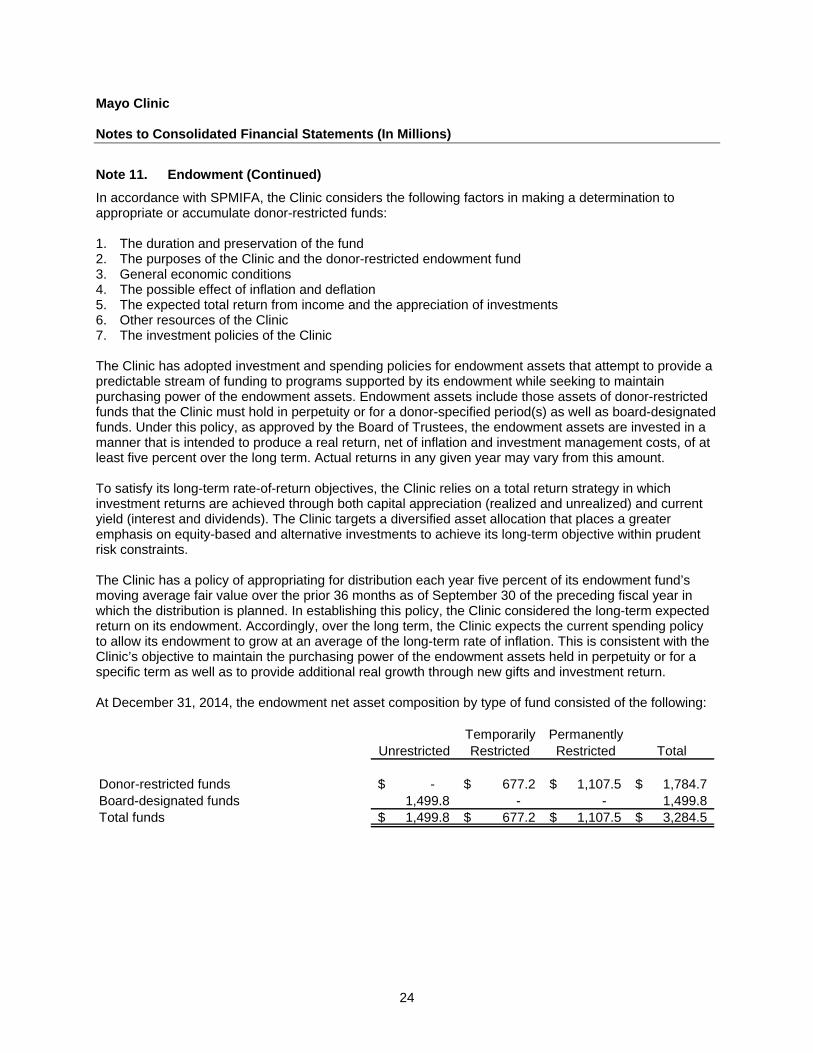
Note 11. Endowment (Continued)
In accordance with SPMIFA, the Clinic considers the following factors in making a determination to appropriate or accumulate donor-restricted funds: 1. The duration and preservation of the fund 2. The purposes of the Clinic and the donor-restricted endowment fund 3. General economic conditions 4. The possible effect of inflation and deflation 5. The expected total return from income and the appreciation of investments 6. Other resources of the Clinic 7. The investment policies of the Clinic The Clinic has adopted investment and spending policies for endowment assets that attempt to provide a predictable stream of funding to programs supported by its endowment while seeking to maintain purchasing power of the endowment assets. Endowment assets include those assets of donor-restricted funds that the Clinic must hold in perpetuity or for a donor-specified period(s) as well as board-designated funds. Under this policy, as approved by the Board of Trustees, the endowment assets are invested in a manner that is intended to produce a real return, net of inflation and investment management costs, of at least five percent over the long term. Actual returns in any given year may vary from this amount. To satisfy its long-term rate-of-return objectives, the Clinic relies on a total return strategy in which investment returns are achieved through both capital appreciation (realized and unrealized) and current yield (interest and dividends). The Clinic targets a diversified asset allocation that places a greater emphasis on equity-based and alternative investments to achieve its long-term objective within prudent risk constraints. The Clinic has a policy of appropriating for distribution each year five percent of its endowment fund’s moving average fair value over the prior 36 months as of September 30 of the preceding fiscal year in which the distribution is planned. In establishing this policy, the Clinic considered the long-term expected return on its endowment. Accordingly, over the long term, the Clinic expects the current spending policy to allow its endowment to grow at an average of the long-term rate of inflation. This is consistent with the Clinic’s objective to maintain the purchasing power of the endowment assets held in perpetuity or for a specific term as well as to provide additional real growth through new gifts and investment return. At December 31, 2014, the endowment net asset composition by type of fund consisted of the following:
Temporarily PermanentlyUnrestricted Restricted Restricted Total
Donor-restricted funds -$ 677.2$ 1,107.5$ 1,784.7$ Board-designated funds 1,499.8 - - 1,499.8 Total funds 1,499.8$ 677.2$ 1,107.5$ 3,284.5$

Mayo Clinic Notes to Consolidated Financial Statements (In Millions)
25
Note 11. Endowment (Continued)
Changes in endowment net assets for the fiscal year ended December 31, 2014, consisted of the following:
Temporarily PermanentlyUnrestricted Restricted Restricted Total
Endowment net assets, beginning of year 1,156.3$ 625.3$ 988.9$ 2,770.5$
Investment return:Investment income 21.4 23.5 - 44.9 Net appreciation (realized and unrealized) 76.2 85.1 - 161.3
Total investment return 97.6 108.6 - 206.2
Contributions - - 103.9 103.9
Appropriation of endowment assets forexpenditure (56.3) (56.7) - (113.0)
Other changes:Transfers to create board-designated
endowment funds 309.2 - - 309.2 Reclassifications (7.0) - 14.7 7.7
Endowment net assets, end of year 1,499.8$ 677.2$ 1,107.5$ 3,284.5$ At December 31, 2013, the endowment net asset composition by type of fund consisted of the following:
Temporarily PermanentlyUnrestricted Restricted Restricted Total
Donor-restricted funds -$ 625.3$ 988.9$ 1,614.2$ Board-designated funds 1,156.3 - - 1,156.3 Total funds 1,156.3$ 625.3$ 988.9$ 2,770.5$

Mayo Clinic Notes to Consolidated Financial Statements (In Millions)
26
Note 11. Endowment (Continued)
Changes in endowment net assets for the fiscal year ended December 31, 2013, consisted of the following:
Temporarily PermanentlyUnrestricted Restricted Restricted Total
Endowment net assets, beginning of year 958.3$ 479.8$ 846.5$ 2,284.6$
Investment return:Investment income 15.0 18.4 - 33.4 Net appreciation (realized and unrealized) 143.6 177.3 - 320.9
Total investment return 158.6 195.7 - 354.3
Contributions - - 142.4 142.4
Appropriation of endowment assets forexpenditure (41.6) (50.2) - (91.8)
Other changes:Transfers to create board-designated
endowment funds 81.0 - - 81.0 Endowment net assets, end of year 1,156.3$ 625.3$ 988.9$ 2,770.5$
Note 12. Functional Expenses
The expenses reported in the consolidated statements of activities supported the following:
2014 2013
Patient care 6,849.6$ 6,818.8$ Lab and technology ventures 833.9 754.0 Research 642.3 645.5 Graduate and other education 274.0 266.1 General and administrative 142.0 139.9 Development expenses 25.2 21.4 Other activities 159.3 163.0
8,926.3$ 8,808.7$
Mayo Clinic Notes to Consolidated Financial Statements (In Millions)
27
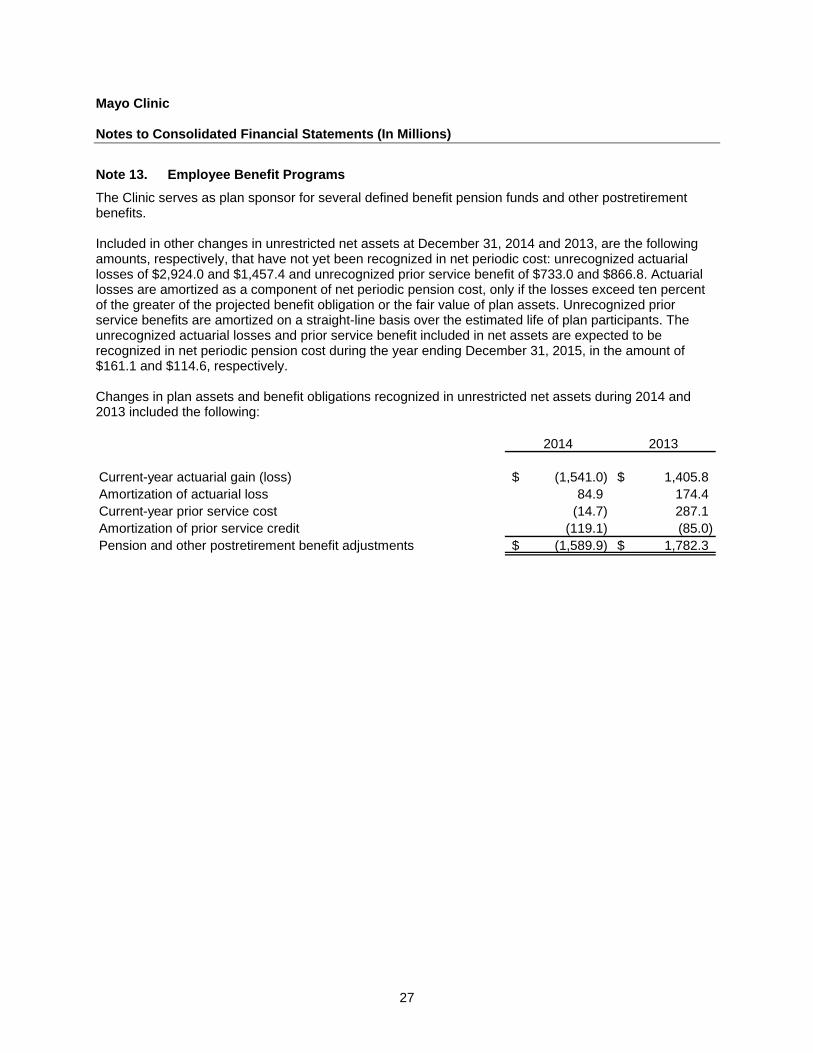
Note 13. Employee Benefit Programs
The Clinic serves as plan sponsor for several defined benefit pension funds and other postretirement benefits. Included in other changes in unrestricted net assets at December 31, 2014 and 2013, are the following amounts, respectively, that have not yet been recognized in net periodic cost: unrecognized actuarial losses of $2,924.0 and $1,457.4 and unrecognized prior service benefit of $733.0 and $866.8. Actuarial losses are amortized as a component of net periodic pension cost, only if the losses exceed ten percent of the greater of the projected benefit obligation or the fair value of plan assets. Unrecognized prior service benefits are amortized on a straight-line basis over the estimated life of plan participants. The unrecognized actuarial losses and prior service benefit included in net assets are expected to be recognized in net periodic pension cost during the year ending December 31, 2015, in the amount of $161.1 and $114.6, respectively. Changes in plan assets and benefit obligations recognized in unrestricted net assets during 2014 and 2013 included the following:
2014 2013
Current-year actuarial gain (loss) (1,541.0)$ 1,405.8$ Amortization of actuarial loss 84.9 174.4 Current-year prior service cost (14.7) 287.1 Amortization of prior service credit (119.1) (85.0) Pension and other postretirement benefit adjustments (1,589.9)$ 1,782.3$

Mayo Clinic Notes to Consolidated Financial Statements (In Millions)
28
Note 13. Employee Benefit Programs (Continued)
Pension plans: Obligations and funded status: Following is a summary of the changes in the benefit obligation and plan assets, the resulting funded status of the qualified and nonqualified pension plans, and accumulated benefit obligation as of and for the years ended December 31:
Qualified Nonqualified Qualified NonqualifiedChange in projected benefit obligation:
Benefit obligation, beginning of year 5,839.6$ 2.4$ 6,527.9$ 2.6$ Service cost 220.1 - 258.1 0.1 Interest cost 295.3 0.1 273.5 0.1 Actuarial loss (gain) 1,460.9 0.3 (883.8) (0.1) Benefits paid (462.5) (0.3) (336.1) (0.3)
Estimated benefit obligation at end of year 7,353.4$ 2.5$ 5,839.6$ 2.4$
Change in plan assets:Fair value of plan assets, beginning of year 6,181.3$ -$ 5,486.3$ -$
Actual return on plan assets 427.2 - 770.9 - Employer contributions 410.0 0.3 260.2 0.3 Benefits paid (462.5) (0.3) (336.1) (0.3)
Fair value of plan assets at end of year 6,556.0$ -$ 6,181.3$ -$
2014 2013
Funded status of the plan (797.4)$ (2.5)$ 341.7$ (2.4)$
Accumulated benefit obligation 7,288.6$ 2.5$ 5,677.1$ 2.4$ Amounts recognized in the consolidated statements of financial position consist of the following at December 31:
Qualified Nonqualified Qualified Nonqualified
Noncurrent asset -$ -$ 344.3$ -$ Current liabilities - (0.3) - (0.3) Noncurrent liabilities (797.4) (2.2) (2.6) (2.1) Net amount recognized (797.4)$ (2.5)$ 341.7$ (2.4)$
2014 2013

Mayo Clinic Notes to Consolidated Financial Statements (In Millions)
29
Note 13. Employee Benefit Programs (Continued)
Components of net periodic benefit cost are as follows at December 31:
Qualified Nonqualified Qualified Nonqualified
Service cost 220.1$ -$ 258.1$ 0.1$ Interest cost 295.3 0.1 273.5 0.1 Expected return on plan assets (465.9) - (427.6) - Amortization of unrecognized:
Prior service benefit (60.3) - (60.3) - Net actuarial loss 82.0 0.1 162.5 -
Net periodic benefit cost 71.2$ 0.2$ 206.2$ 0.2$
2014 2013
Plan assets: The largest of the pension funds is the Mayo Clinic Master Retirement Trust Plan, which holds $6,447.4 of the $6,556.0 in combined plan assets at December 31, 2014. The investment policies described below apply to the Mayo Clinic Master Retirement Trust Plan (the Plan). The Plan employs a global, multi-asset approach in managing its retirement plan assets. This approach is designed to maximize risk-adjusted returns over a long-term investment horizon, consistent with the nature of the pension liabilities being funded. The plan asset portfolio’s target allocation for total return investment strategies, which include public equities, private equities, absolute return, and real assets, is 80.0 percent. The portfolio’s target fixed-income exposure is 20.0 percent. The fixed-income exposure may include the use of long-term interest rate swap contracts structured to increase the portfolio’s interest rate sensitivity and thereby provide a hedge of the plan liabilities resulting from falling long-term interest rates. Investments in private equities, real assets, and absolute return strategies are held to improve diversification and thereby enhance long-term, risk-adjusted returns. However, recognizing that these investments are not as liquid as publicly traded stocks and bonds, portfolio investment policies limit overall exposure to these assets. The portfolio’s allocation to private equities and real assets is limited to a maximum of 25.0 percent (with a target allocation of 20.0 percent), and exposure to absolute return strategies is limited to a maximum of 35.0 percent (with a target of 27.5 percent). The Clinic reviews performance, asset allocation, and risk management reports for plan asset portfolios on a monthly basis.

Mayo Clinic Notes to Consolidated Financial Statements (In Millions)
30
Note 13. Employee Benefit Programs (Continued)
The fair values of the Plan’s assets at December 31, 2014, by asset category are as follows:
Quoted Pricesin Active Significant Significant
Markets for Observable UnobservableIdentical Assets Inputs Inputs
Assets (Level 1) (Level 2) (Level 3) Total
Cash and cash equivalents 240.6$ 9.9$ -$ 250.5$ Fixed-income securities:
U.S. government - 136.3 - 136.3 U.S. government agencies 23.2 111.4 - 134.6 U.S. corporate - 244.3 - 244.3 Foreign - 55.0 - 55.0
Common and preferred stocks:U.S. 478.2 0.2 26.1 504.5 Foreign 407.8 - - 407.8
Funds:Fixed-income 170.4 - - 170.4 Equities 144.7 190.0 - 334.7
Alternative investments:Absolute return and hedge funds - - 2,670.8 2,670.8 Private equity, real estate and
natural resources funds - - 1,538.5 1,538.5 Other investments - - - -
Total investments 1,464.9$ 747.1$ 4,235.4$ 6,447.4$
Mayo Clinic Notes to Consolidated Financial Statements (In Millions)
31
Note 13. Employee Benefit Programs (Continued)
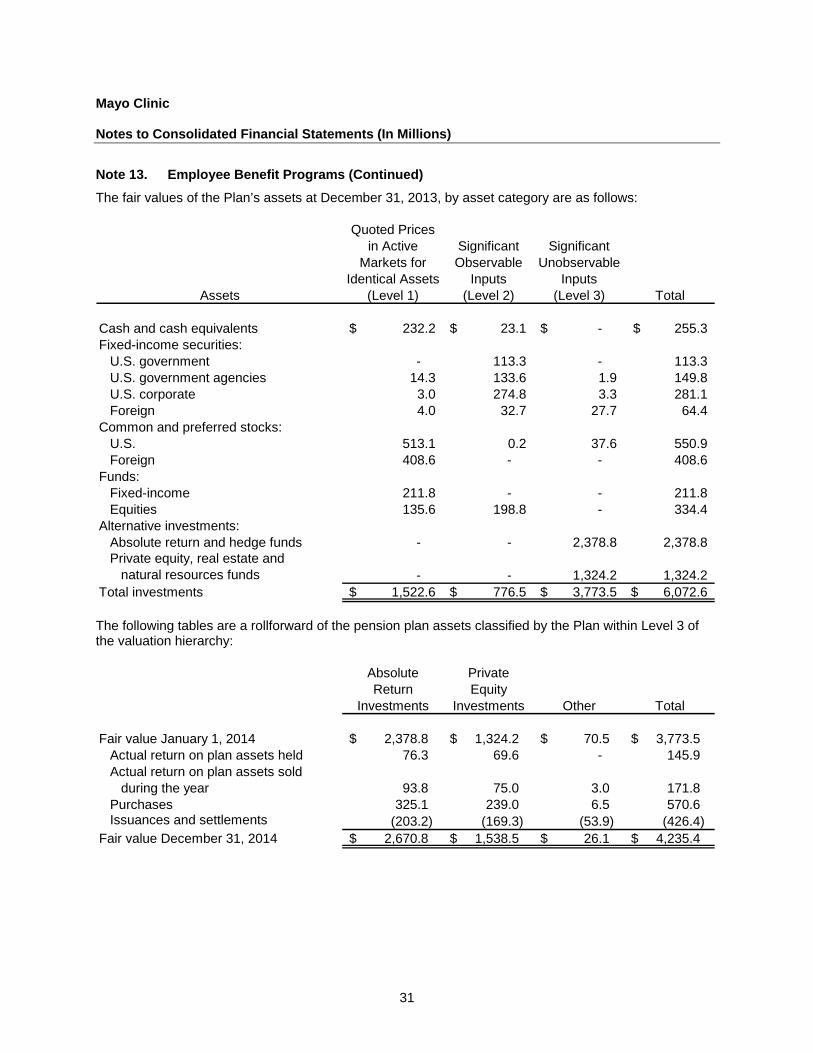
The fair values of the Plan’s assets at December 31, 2013, by asset category are as follows:
Quoted Pricesin Active Significant Significant
Markets for Observable UnobservableIdentical Assets Inputs Inputs
Assets (Level 1) (Level 2) (Level 3) Total
Cash and cash equivalents 232.2$ 23.1$ -$ 255.3$ Fixed-income securities:
U.S. government - 113.3 - 113.3 U.S. government agencies 14.3 133.6 1.9 149.8 U.S. corporate 3.0 274.8 3.3 281.1 Foreign 4.0 32.7 27.7 64.4
Common and preferred stocks:U.S. 513.1 0.2 37.6 550.9 Foreign 408.6 - - 408.6
Funds:Fixed-income 211.8 - - 211.8 Equities 135.6 198.8 - 334.4
Alternative investments:Absolute return and hedge funds - - 2,378.8 2,378.8 Private equity, real estate and
natural resources funds - - 1,324.2 1,324.2 Total investments 1,522.6$ 776.5$ 3,773.5$ 6,072.6$ The following tables are a rollforward of the pension plan assets classified by the Plan within Level 3 of the valuation hierarchy:
Absolute Private Return Equity
Investments Investments Other Total
Fair value January 1, 2014 2,378.8 $ 1,324.2 $ 70.5 $ 3,773.5 $ Actual return on plan assets held 76.3 69.6 - 145.9 Actual return on plan assets sold
during the year 93.8 75.0 3.0 171.8 Purchases 325.1 239.0 6.5 570.6 Issuances and settlements (203.2) (169.3) (53.9) (426.4)
Fair value December 31, 2014 2,670.8 $ 1,538.5 $ 26.1 $ 4,235.4 $

Mayo Clinic Notes to Consolidated Financial Statements (In Millions)
32
Note 13. Employee Benefit Programs (Continued)
Absolute Private Return Equity
Investments Investments Other Total
Fair value January 1, 2013 2,097.1 $ 1,121.1 $ 17.6 $ 3,235.8 $ Actual return on plan assets held 171.1 116.4 14.9 302.4 Actual return on plan assets sold
during the year 77.3 52.3 1.0 130.6 Purchases 190.7 299.4 50.9 541.0 Issuances and settlements (157.4) (265.0) (13.9) (436.3)
Fair value December 31, 2013 2,378.8 $ 1,324.2 $ 70.5 $ 3,773.5 $ Following is a description of the Plan’s valuation methodologies for assets and liabilities measured at fair value. Fair value for Level 1 is based upon quoted market prices. Fair value for Level 2 is based on quoted prices for similar instruments in active markets, quoted prices for identical or similar instruments in markets that are not active, and model-based valuation techniques for which all significant assumptions are observable in the market or can be corroborated by observable market data for substantially the full term of the assets. Inputs are obtained from various sources, including market participants, dealers and brokers. Level 3, which primarily consists of alternative investments (principally limited partnership interests in absolute return, hedge, private equity, real estate and natural resources funds), represents the Plan’s ownership interest in the net asset value (NAV) of the respective partnership obtained from fund manager statements and audited financial statements. Investments held by the partnerships consist of marketable securities as well as securities that do not have readily determinable fair values. The fair values of the securities held by partnerships that do not have readily determinable fair values are determined by the general partner and are based on historical cost, appraisals, or other estimates that require varying degrees of judgment. If no public market exists for the investment securities, the fair value is determined by the general partner, taking into consideration, among other things, the cost of the securities, prices of recent significant placements of securities of the same issuer, and subsequent developments concerning the companies to which the securities relate. Alternative investments are redeemable with the investee fund at NAV under the original terms of the subscription agreement. Due to the nature of these investments, changes in market conditions and the overall economic environment may significantly impact the NAV of the funds and, therefore, the value of the Plan’s interest. It is therefore reasonably possible that, if the Plan were to sell all or a portion of its alternative investments, the transaction value could be significantly different than the fair value reported as of December 31. The methods described above may produce a fair value calculation that may not be indicative of net realizable value or reflective of future fair values. Furthermore, while the Plan believes its valuation methods are appropriate and consistent with other market participants, the use of different methodologies or assumptions to determine the fair value of certain financial instruments could result in a different estimate of fair value at the reporting date. The following information pertains to those alternative investments recorded at net asset value in accordance with the Fair Value Measurements and Disclosures topic of the FASB ASC.

Mayo Clinic Notes to Consolidated Financial Statements (In Millions)
33
Note 13. Employee Benefit Programs (Continued)
At December 31, 2014, alternative investments recorded at net asset value consisted of the following:
Redemption RedemptionFair Unfunded Frequency (If Notice
Value Commitment Currently Eligible) Period
Absolute return/hedge funds (a) 2,670.8$ -$ Monthly to annually 30–90 daysPrivate partnerships (b) 1,538.5 921.1
4,209.3$ 921.1$ At December 31, 2013, alternative investments recorded at net asset value consisted of the following:
Redemption RedemptionFair Unfunded Frequency (If Notice
Value Commitment Currently Eligible) Period
Absolute return/hedge funds (a) 2,378.8$ -$ Monthly to annually 30–90 daysPrivate partnerships (b) 1,324.2 889.0
3,703.0$ 889.0$ (a) This category includes investments in absolute return/hedge funds, which are actively managed
commingled investment vehicles that derive the majority of their returns from factors other than the directional flow of the markets in which they invest. Representative strategies include high-yield credit, distressed debt, merger arbitrage, relative value, and long-short equity strategies. The fair values of the investments in this category have been estimated using the net asset value per share of the investments. Investments in this category generally carry “lockup” restrictions that do not allow investors to seek redemption in the first year after acquisition. Following the initial lockup period, liquidity is generally available monthly, quarterly or annually following a redemption request. Over 90 percent of the investments in this category have at least annual liquidity.
(b) This category includes limited partnership interests in closed-end funds that focus on venture capital,
private equity, real estate and resource-related strategies. The fair values of the investments in this category have been estimated using the net asset value of the Plan’s ownership interest in partners’ capital. These investments cannot be redeemed with the funds. Distributions from each fund will be received as the underlying investments of the funds are liquidated. It is estimated that the underlying assets of most funds will generally be liquidated over a seven- to ten-year period.
No plan assets are expected to be returned to the employer during 2015.

Mayo Clinic Notes to Consolidated Financial Statements (In Millions)
34
Note 13. Employee Benefit Programs (Continued)
Other postretirement benefits: In 2013, the Clinic amended the Retiree Medical Plan stating eligible employees who retire on or after January 1, 2015, will not participate in the Clinic self-insured group retiree medical benefits. Instead, the Clinic will provide an employer subsidy through contributions to a Health Reimbursement Account (HRA) that the participant can use to purchase individual medical and/or prescription drug coverage. The effects of this plan amendment were reflected in the December 31, 2013, benefit obligation. Obligations and funded status: A summary of the changes in the benefit obligation and plan assets and the resulting funded status of the other postretirement plans is as follows as of and for the years ended December 31:
2014 2013Change in projected benefit obligation:
Benefit obligation at beginning of year 768.0$ 1,204.6$ Service cost 11.4 31.4 Interest cost 38.5 50.8 Plan participants’ contributions 14.4 11.2 Plan change 14.7 (289.8) Medicare subsidy 2.5 2.4 Actuarial loss 51.6 (191.8) Benefits paid (57.9) (50.8)
Estimated benefit obligation at end of year 843.2$ 768.0$
Change in plan assets:Fair value of plan assets at beginning of year -$ -$
Employer contributions 41.0 37.2 Plan participants’ contributions 14.4 11.2 Medicare subsidy 2.5 2.4 Benefits paid (57.9) (50.8)
Fair value of plan assets at end of year -$ -$
Funded status of the plan (843.2)$ (768.0)$ Amounts recognized in the consolidated statements of financial position for postretirement benefits consist of the following at December 31:
2014 2013
Current liabilities (31.7)$ (32.8)$ Noncurrent liabilities (811.5) (735.2) Net amount recognized (843.2)$ (768.0)$

Mayo Clinic Notes to Consolidated Financial Statements (In Millions)
35
Note 13. Employee Benefit Programs (Continued)
Components of net periodic benefit cost for other postretirement benefits are as follows for the years ended December 31:
2014 2013
Service cost 11.4$ 31.4$ Interest cost 38.5 50.8 Amortization of:
Unrecognized prior service benefit (58.8) (24.7) Unrecognized net actuarial loss 2.8 11.9
Net periodic benefit cost for other postretirement benefits (6.1)$ 69.4$ The Clinic has concluded that the prescription drug benefits under its defined benefit postretirement plan are actuarially equivalent to Medicare Part D under the Medicare Modernization Act (the Act) and that the Clinic will receive the subsidy available under the Act. The following reflects the expected future Medicare Part D subsidy receipts: Years Ending December 31,
2015 4.0$ 2016 4.3 2017 4.5 2018 4.7 2019 4.9 2020–2024 26.5 A one-percentage-point change in the assumed health care cost trend rate would have the following effects:
One-Percentage- One-Percentage-Point Increase Point Decrease
Effect on total service and interest cost components in 2014 1.4$ (1.2)$ Effect on postretirement benefit obligation at December 31, 2014 34.6 (29.1) Pension and postretirement benefits: Assumptions: Weighted-average assumptions used to determine pension and postretirement benefit obligations at the measurement date are as follows:
2014 2013 2014 2013
Discount rate 4.28% 5.17% 4.20% 5.13%Rate of compensation increase 3.44% 3.52% N/A N/A
Pension Benefits Postretirement Benefits

Mayo Clinic Notes to Consolidated Financial Statements (In Millions)
36
Note 13. Employee Benefit Programs (Continued)
Weighted-average assumptions used to determine net periodic pension and postretirement benefit cost are as follows:
2014 2013 2014 2013
Discount rate 5.17% 4.27% 5.13% 4.27%Expected long-term return on plan assets 8.00% 8.00% N/A N/ARate of compensation increase 3.52% 3.53% N/A N/A
Pension Benefits Postretirement Benefits
The Clinic utilizes a building block approach in determining the expected long-term rate of return for its plan assets. First, historical data on individual asset class returns are studied. Next, the historical correlation among and between asset class returns is studied under both normal conditions and in times of market turbulence. Then, various mixes of asset classes are considered under multiple long-term investment scenarios. Finally, after considering liquidity concerns related to the use of certain alternative asset classes, the plan sponsor selects the portfolio blend that it believes will produce the highest expected long-term return on a risk-adjusted basis. In October 2014, the Society of Actuaries issued a new base mortality table (RP-2014) and new mortality improvement scale (MP-2014). The Clinic has adopted the RP-2014 mortality table, which is consistent with the Clinic’s observed mortality experience. The Clinic adopted a modified version of the improvement scale, with the following modifications: Reduced the short-term improvement rates to reflect recent slowdown in rates observed from broad
population databases, Converged from short-term improvement rates to long-term improvement rates by 2020, to reflect
recent reduction in observed improvement rates and proximity to ultimate rate, Used long-term improvement rate of 0.75 percent, consistent with Social Security Administration’s
historical data, long-term estimates, and consideration of contributing factors impacting future mortality improvement, and
Reduced long-term improvement rate from 0.75 percent at age 85 to 0 percent at age 95 to reflect
lack of expected improvement at advanced ages. Cash flows: Contributions: The Clinic expects to contribute $552.8 to its pension plans in 2015.

Mayo Clinic Notes to Consolidated Financial Statements (In Millions)
37
Note 13. Employee Benefit Programs (Continued)
Estimated future benefit payments: The following benefit payments, which reflect expected future service, as appropriate, are expected to be paid:
PostretirementYears Ending December 31, Qualified Nonqualified Benefits
2015 335.4$ 0.3$ 28.3$ 2016 352.5 0.3 29.1 2017 383.2 0.2 30.5 2018 415.3 0.2 32.8 2019 425.8 0.2 35.1 2020–2024 2,381.6 0.9 206.5
Pension Benefits
In addition to the defined benefit plans, the Clinic sponsors various defined contribution benefit plans. Expense recognized by the Clinic for those plans was $44.3 and $42.3 for 2014 and 2013, respectively.
Note 14. General and Professional Liability Insurance
The Clinic insures substantially all general and professional liability risks through a combination of a wholly owned captive insurance company and self-insurance. The insurance program combines various levels of self-insured retention with excess commercial insurance coverage. Actuarial consultants have been retained to assist in the estimation of outstanding general and professional liability loss. The Clinic’s general and professional liability as reported in the accompanying consolidated statements of financial position was $102.7 and $112.6 at December 31, 2014 and 2013, respectively. Provisions for the general and professional liability risks are based on an actuarial estimate of losses using the Clinic’s actual loss data adjusted for industry trends and current conditions and considering an evaluation of claims by the Clinic’s legal counsel. The provision includes estimates of ultimate costs for both reported claims and claims incurred but not reported. Activity in the liability is summarized as follows for the years ended December 31:
2014 2013
Balance, beginning of year 112.6$ 122.7$
Incurred related to captive insurance company liability:Current year 23.1 25.3 Prior years (16.2) (14.1)
Total incurred 6.9 11.2
Paid related to captive insurance company liability:Current year (0.4) - Prior years (14.6) (14.8)
Total paid (15.0) (14.8)
Net change in self-insurance liability (1.8) (6.5) Balance, end of year 102.7$ 112.6$

Mayo Clinic Notes to Consolidated Financial Statements (In Millions)
38
Note 15. Other Receivables, Other Current and Long-Term Assets, and Other Current and Long-Term Liabilities
At December 31, other receivables consisted of the following:
2014 2013
Pledges receivable 106.7$ 108.3$ Grants receivable 48.3 51.1 Other 87.3 93.0
242.3$ 252.4$ At December 31, other current assets consisted of the following:
2014 2013
Inventories 114.1$ 100.3$ Prepaid expenses 44.0 43.6 Current portion of deferred tax asset 2.6 2.4
160.7$ 146.3$ At December 31, other long-term assets consisted of the following:
2014 2013
Pledges receivable 229.2$ 206.1$ Trust receivables 184.9 180.2 Oil and gas interests 51.4 24.8 Long-term portion of deferred tax asset 37.7 31.7 Technology-based ventures 29.8 19.6 Noncurrent pension asset - 344.3 Other 116.1 101.0
649.1$ 907.7$ At December 31, other current liabilities consisted of the following:
2014 2013
Current maturities of long-term debt 49.7$ 49.5$ Current pension and postretirement benefit 32.0 33.1 Other taxes 31.6 29.2 Short-term disability 27.9 19.4 Current portion of professional and general liability 26.1 26.3 Real estate tax accrual 23.7 20.0 Current portion of long-term disability 19.6 20.4 Current portion of workers’ compensation liability 13.9 14.2 Other 96.8 71.9
321.3$ 284.0$

Mayo Clinic Notes to Consolidated Financial Statements (In Millions)
39
Note 15. Other Receivables, Other Current and Long-Term Assets, and Other Current and Long-Term Liabilities (Continued)
At December 31, other long-term liabilities consisted of the following:
2014 2013
Deferred compensation 399.9$ 348.6$ Long-term disability 110.6 104.0 Professional and general liability 76.6 86.3 Gift annuities 46.4 47.2 Trust obligations 45.0 41.2 Retirement community obligations 36.3 35.7 Workers’ compensation liability 26.8 24.8 Lease agreement liability 26.4 26.9 Asset retirement obligation 22.2 23.2 Contract deposit 22.0 22.0 Other 44.9 45.6
857.1$ 805.5$
Note 16. Other Revenue
For the years ended December 31, other revenue consisted of the following:
2014 2013
Retail pharmacy sales 251.4$ 164.2$ Technology commercialization, health information, and medical
products 66.8 60.2 Royalties 52.0 38.4 Graduate medical and other education revenue 41.3 66.4 Cafeteria revenue 37.5 38.0 Incentive revenue 36.4 54.7 Oil- and gas-producing activities 23.8 0.7 Retail stores 20.0 24.8 Third-party administrative revenue 16.2 13.7 Other 191.3 169.4
736.7$ 630.5$
Note 17. Commitments and Contingencies
The Clinic has various construction projects in progress related to patient care, research, and educational facilities. The estimated costs committed to complete the various projects at December 31, 2014, approximated $437.9, all of which is expected to be expended over the next three to four years.
Mayo Clinic Notes to Consolidated Financial Statements (In Millions)
40
Note 17. Commitments and Contingencies (Continued)
One of the Clinic’s affiliation agreements limits the involvement of a third party in operations of a consolidated affiliate. A process exists to resolve disputes; however, in the event of an irreconcilable dispute between the parties, the agreement further provides for a one-time payment of approximately $86.7 by the consolidated affiliate to release the third party from the affiliation. Such payment would be subordinate to other debtors of the consolidated affiliated entity. No amount has been accrued in the consolidated financial statements for this contingency. While the Clinic is self-insured for a substantial portion of its general and workers’ compensation liabilities, the Clinic maintains commercial insurance coverage against catastrophic loss. Additionally, the Clinic maintains a self-insurance program for its long-term disability coverage. The provision for estimated self-insured claims includes estimates of the ultimate costs for both reported claims and claims incurred but not reported. Laws and regulations concerning government programs, including Medicare, Medicaid and various research grant programs, are complex and subject to varying interpretation. As a result, there is at least a reasonable possibility that recorded estimates will change by a material amount in the near term. As a result of nationwide investigations by governmental agencies, various health care organizations have received requests for information and notices regarding alleged noncompliance with those laws and regulations, which, in some instances, have resulted in organizations entering into significant settlement agreements. Compliance with such laws and regulations may also be subject to future government review and interpretation as well as significant regulatory action, including fines, penalties, and potential exclusion from the related programs. The Clinic expects that the level of review and audit to which it is subject will increase. There can be no assurance that regulatory authorities will not challenge the Clinic’s compliance with these laws and regulations, and it is not possible to determine the impact (if any) such claims or penalties would have upon the Clinic. The Clinic is a defendant in various lawsuits arising in the ordinary course of business and records an estimated liability for probable claims. Although the outcome of these lawsuits cannot be predicted with certainty, management believes the ultimate disposition of such matters will not have a material effect on the Clinic’s consolidated financial position or statement of activities.

Supplemental Information

41
Independent Auditor’s Report on the Supplemental Information Board of Trustees Mayo Clinic We have audited the consolidated financial statements of Mayo Clinic and its subsidiaries (the Clinic) as of and for the years ended December 31, 2014 and 2013, and have issued our report thereon, dated March 2, 2015, which contained an unmodified opinion on those consolidated financial statements. Our audits were performed for the purpose of forming an opinion on the consolidated financial statements as a whole. The accompanying supplemental information is presented for purposes of additional analysis and is not a required part of the consolidated financial statements. Such information is the responsibility of management and was derived from and relates directly to the underlying accounting and other records used to prepare the consolidated financial statements. The information has been subjected to the auditing procedures applied in the audits of the consolidated financial statements and certain additional procedures, including comparing and reconciling such information directly to the underlying accounting and other records used to prepare the consolidated financial statements, or to the consolidated financial statements themselves, and other additional procedures in accordance with auditing standards generally accepted in the United States of America. In our opinion, the information is fairly stated in all material respects in relation to the consolidated financial statements as a whole.
Minneapolis, Minnesota March 2, 2015

42
Mayo Clinic
Mayo Clinic FloridaStatements of Financial PositionDecember 31, 2014 and 2013 (In Millions)
Assets 2014 2013Current Assets
Accounts receivable for medical services, less allowances foruncollectible accounts of $34.9 in 2014 and $35.1 in 2013 98.3$ 100.9$
Inventories and other current assets 10.1 7.7 Due from affiliates 207.7 139.0
Total current assets 316.1 247.6
Property, Plant and Equipment, net, and other long-term assets 246.4 251.2 Total assets 562.5$ 498.8$
Liabilities and Net Assets
Current LiabilitiesAccrued expenses 19.4$ 21.1$ Due to affiliates 40.1 47.4
Total current liabilities 59.5 68.5
Long-Term Debt 126.8 126.9
Other Long-Term Liabilities 2.8 3.2 Total liabilities 189.1 198.6
Net Assets Unrestricted 373.2 300.0 Temporarily restricted 0.1 0.1 Permanently restricted 0.1 0.1
Total net assets 373.4 300.2 Total liabilities and net assets 562.5$ 498.8$

43
Mayo Clinic
Mayo Clinic FloridaStatements of ActivitiesYears Ended December 31, 2014 and 2013 (In Millions)
Temporarily Permanently Temporarily Permanently Unrestricted Restricted Restricted Total Unrestricted Restricted Restricted Total
Revenue, gains and other support:Net medical service revenue 435.0$ -$ -$ 435.0$ 432.9$ -$ -$ 432.9$ Other 10.4 - - 10.4 10.9 - - 10.9 Net assets released from restrictions - - - - - - - -
Total revenue, gains and other support 445.4 - - 445.4 443.8 - - 443.8
Expenses:Salaries and benefits 102.2 - - 102.2 106.8 - - 106.8 Supplies and services 234.8 - - 234.8 228.7 - - 228.7 Facilities 29.3 - - 29.3 27.0 - - 27.0 Finance and investment 5.9 - - 5.9 5.1 - - 5.1
Total expenses 372.2 - - 372.2 367.6 - - 367.6
Income from current activities 73.2 - - 73.2 76.2 - - 76.2
Inter-affiliate transfers - - - - - - - - Increase in net assets 73.2 - - 73.2 76.2 - - 76.2
Net assets at beginning of year 300.0 0.1 0.1 300.2 223.8 0.1 0.1 224.0 Net assets at end of year 373.2$ 0.1$ 0.1$ 373.4$ 300.0$ 0.1$ 0.1$ 300.2$
2014 2013