g. israelian1, a. ecuvillon , r. rebolo - arxiv.org · 3 departamento de astrof´ısica,...
TRANSCRIPT

arX
iv:a
stro
-ph/
0405
049v
1 4
May
200
4Astronomy & Astrophysics manuscript no. nitro November 4, 2018(DOI: will be inserted by hand later)
Galactic Evolution of Nitrogen.
G. Israelian1, A. Ecuvillon1, R. Rebolo1,2, R. Garcıa-Lopez1,3, P. Bonifacio4 and P. Molaro4
1 Instituto de Astrofısica de Canarias, E–38200 La Laguna, Tenerife, Spain2 Consejo Superior de Investigaciones Cientıfcas, Spain3 Departamento de Astrofısica, Universidad de La Laguna, Av. Astrofısico Francisco Sanchez s/n, E-38206 LaLaguna, Tenerife, Spain
4 Osservatorio Astronomico di Trieste, via G. B. Tiepolo 11, 34131 Trieste, Italy
Received / Accepted
Abstract. We present detailed spectroscopic analysis of nitrogen abundances in 31 unevolved metal-poor starsanalysed by spectral synthesis of the near-UV NH band at 3360 A observed at high resolution with varioustelescopes. We found that [N/Fe] scales with that of iron in the metallicity range −3.1 <[Fe/H]< 0 with the slope0.01±0.02. Furthermore, we derive uniform and accurate (N/O) ratios using oxygen abundances from near-UVOH lines obtained in our previous studies. We find that a primary component of nitrogen is required to explainthe observations. The NH lines are discovered in the VLT/UVES spectra of the very metal-poor subdwarfs G64-12 and LP815-43 indicating that these stars are N rich. The results are compared with theoretical models andobservations of extragalactic HII regions and Damped Lyα systems. This is the first direct comparison of the(N/O) ratios in these objects with those in Galactic stars.
Key words. stars: abundances – stars: nucleosynthesis – Galaxy: evolution Galaxy: halo
1. Introduction
Elemental abundance studies are important tracers ofgalaxy formation and evolution. The yields and origin ofsome important elements, such as nitrogen, are still a mat-ter of serious debate. The stable isotope 14N is synthesizedfrom 12C and 16O through the CNO cycles in a hydrogen-burning layer of a star. Knowledge of the origin of nitrogenis very important since, for example, this element can beused to derive the primordial helium abundance (Pagel& Kazlauskas 1992). We call nitrogen “primary” when itis produced solely from the original hydrogen and heliumin a star, either directly or through successive stages ofnucleosynthesis. When the effective yield of nitrogen de-pends on the previous enrichment of C and O, the nitrogenis considered as “secondary”. Which stars produce sec-ondary nitrogen is fairly well understood: non-zero metal-rich intermediate mass stars in the H-shell during the AGBphase (van den Hoek & Groenewegen 1997). Freshly pro-duced nitrogen may be brought to the surface by the thirddredge-up and released in the interstellar medium by thestellar wind. Instead there are at least two possible sourcesof primary nitrogen:
Send offprint requests to: e-mail: [email protected]
1. intermediate mass which either undergo Hot BottomBurning (Marigo 2001) or rotate (Meynet & Maeder2002);
2. metal-poor fast rotating massive stars where primaryN is produced during the He-burning phase by ro-tational diffusion of 12C into the He-burning layer(Meynet & Maeder 2002).
The relative weight of secondary and primary com-ponents depends on the interplay between secondary en-richment caused by dredge up episodes and the primarycontribution given by the CNO cycle during the enve-lope burning. It is well known that oxygen and perhapsalso carbon are produced by massive stars (Maeder 1992).Several observations of the Galactic halo stars providedsome support on the primary origin of N at low metallic-ities (Edmunds & Pagel 1978; Pagel & Edmunds 1981;Bessel & Norris 1982; Tomkin & Lambert 1984; Laird1985; Carbon et al. 1987). However, it is commonly ac-cepted that the main observational evidence of primarynitrogen at low metallicities is provided from abundancestudies of O and N in H II regions of nearby metal-poor galaxies. Sargent & Searle (1970) proposed that themost metal-poor galaxies are young systems experienc-ing their first star formation phase. At metallicities lowerthan log(O/H)≤ −4.0 nitrogen is mostly primary withlog(N/O)≃ −1.5 (see Henry et al. 2000, and references

2 G. Israelian et al.: Galactic Evolution of Nitrogen.
therein). This fact has led Thuan, Izotov & Lipovetsky(1995) to propose that N in these galaxies has been pro-duced by massive stars as a primary element, and thattherefore these stellar systems are young. However, re-cent spectrophotometric studies (e.g. Schulte-Ladbeck etal. 2001) of some metal-poor blue compact dwarf galax-ies (BCGs) revealed old stellar populations. The cases ofI Zw 18 and SBS 0335–052 are still a matter of debate (i.e.Hunt, Thuan & Izotov 2003). We also note that Henry etal. (2000) have proposed a different explanation for thelow metallicity (N/O) plateau. These authors suggestedthat a very low star formation rate with massive stars pro-ducing O and intermediate mass stars producing primaryN with a time-lag of ∼ 250 Myr may produce a constant(N/O) as well. In fact, using the yields of N (van den Hoek& Groenewegen 1997) and O (Maeder 1992) for a stan-dard IMF, one obtains log(N/O)∼ −1.5 at log(O/H)< −4(Henry et al. 2000). Several authors have concluded thatthe contribution by massive stars to nitrogen is generallyvery low and the dominant primary N contributor is inter-mediate mass stars (Henry et al. 2000; Liang et al. 2001).However, others support the origin of primary nitrogen inmassive stars (e.g. Thuan et al. 1995; Izotov et al. 2001)because of the low scatter of (N/O) ratios in galaxies ob-served at different stages of their evolution, which wouldimply no time delay between injection of nitrogen andoxygen. The scatter of (N/O) is large in high redshift lowmetallicity damped Ly α systems (DLAs) (Centurion etal. 1998; Lu, Sargent & Barlow 1998; Pettini et al. 2002).However the sample can be split into two groups, each onewith a relatively small dispersion (Centurion et al. 2003).The group with lower (N/O) ratio (log(N/O)= −2.3) isabout ten times lower than the bulk of DLAs and H IIregions of BCGs.
The goal of this article is to perform a uniform and un-biased analysis of nitrogen and (N/O) ratios in a sampleof Galactic metal-poor stars and compare them with the-oretical models and many measurements available for ex-tragalactic systems. We employed spectral synthesis of NHband in near-UV high-resolution spectra. Different spec-tral features can be used to measure the nitrogen abun-dance in solar-type stars. Weak high excitation (χ=10.34eV) near-infrared N i lines at 7468.31, 8216.34, 8683.4,8703.25 and 8718.83 A disappear at metallicities [Fe/H]<−1 and for the analysis of N in metal-poor stars one isleft with the CN and NH molecular bands centered at 3883and 3360 A, respectively. The first studies of the NH bandby Sneden (1973), Bessell & Norris (1982) showed that onecan use this spectral feature as an independent abundanceindicator. Observations of the NH band at 3360 A haveallowed many investigators to delineate the Galactic evo-lution of N down to [Fe/H]∼ −3 (Laird 1985; Carbon etal. 1987; Tomkin & Lambert 1984; Israelian, Garcıa-Lopez& Rebolo 2000). Laird (1985) obtained constant [N/Fe]=−0.67 ± 0.14 in the metallicity range −2.5 < [Fe/H]< 0from the intermediate resolution spectra of 116 stars whileCarbon et al. (1987) found [N/Fe]= ±0.113±0.063 froma similar-quality spectra of 76 subdwarfs. Unfortunately,
NH lines are blended with several strong Ti and Sc linesand it is preferable to use high resolution spectra in orderto avoid any systematics caused by the overabundance ofTi (an α-element) and Sc in metal-poor stars. Tomkin &Lambert (1984) used high resolution spectra of 14 metal-poor stars in the range −2.3 < [Fe/H]< −0.3 and found[N/Fe]≃ −0.25.
2. Observations
The near-UV spectra of our targets listed in Table 1 wereobtained with the UES spectrograph, at the 4.2 m WHT(Observatorio del Roque de los Muchachos, La Palma), theUVES spectrograph, at the VLT/UT2 Kueyen Telescope(ESO,Chile), CASPEC at the 3.6 m ESO telescope (LaSilla, Chile) and UCLES at the 3.9 m AAT (Australia).The spectra for these metal-poor stars have been col-lected and used to derive Be, O, Cu and Zn abundancesin a series of papers (e.g. Molaro et al. 1987; Israelianet al. 1998, 2001; Garcıa Lopez et al. 1995,1998; Bihainet al. 2004). The high resolution spectra (R ≥ 50000 inall the spectra except CASPEC which had R ∼ 35000)near NH band 3360 A have S/N ratios normally higherthan 80. The S/N ratio was in the range 250–350 in theVLT/UVES spectra of G64-12, G275-4 and LP815-43. Thespectra were normalized using a 5th order polynomial ofthe CONTINUUM task of IRAF. This normalization wasgood enough in all our targets with [Fe/H]< −1. However,the spectra of more metal-rich stars were normalized withregard to the solar spectrum of Kurucz et al. (1984) asdescribed in Ecuvillon et al. (2004).
3. Analysis
3.1. Rationale
Our goal is to perform a uniform and unbiased analysisof the (N/O) ratio. Abundances of these elements can bedetermined from several molecular and atomic features.Both elements have high excitation atomic lines in thenear IR and low excitation diatomic molecular bands inthe near-UV. Many authors have compared abundancesfrom O i against OH and C i against CH (Israelian etal. 1998, 2001; Boesgaard et al. 1999; Nissen et al. 2002;Tomkin et al. 1992) in metal-poor stars. While some au-thors found good agreement and others did not, it wasrealized that such comparisons are very sensitive to thestellar parameters. In fact, both O and C have abundanceindicators that are less sensitive to the stellar parame-ters and almost independent on the non-LTE effects (i.e.[O i] 6300 and [C i] 8727 A). A careful comparison of allthree abundance indicators of O has been carried out foronly few stars and positive results have been obtained(Israelian et al. 2001; Nissen et al. 2002). No detailedanalysis has ever been carried out for Nitrogen becausethe high excitation lines of N i disappear at metallicitiesbelow [Fe/H]< −1. We note a good agreement found be-tween the near-UV NH band and the high excitation N i
G. Israelian et al.: Galactic Evolution of Nitrogen. 3
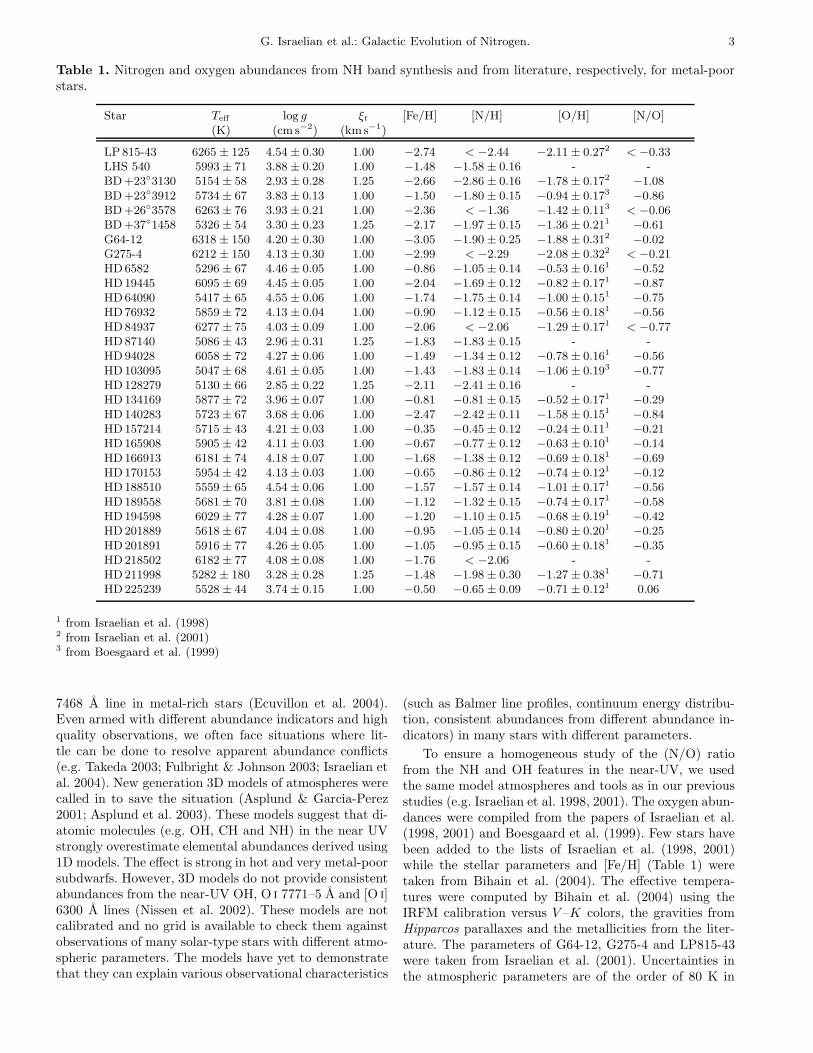
Table 1. Nitrogen and oxygen abundances from NH band synthesis and from literature, respectively, for metal-poorstars.
Star Teff log g ξt [Fe/H] [N/H] [O/H] [N/O](K) (cm s−2) (km s−1)
LP 815-43 6265 ± 125 4.54± 0.30 1.00 −2.74 < −2.44 −2.11± 0.272 < −0.33LHS 540 5993± 71 3.88± 0.20 1.00 −1.48 −1.58± 0.16 - -BD+23◦3130 5154± 58 2.93± 0.28 1.25 −2.66 −2.86± 0.16 −1.78± 0.172 −1.08BD+23◦3912 5734± 67 3.83± 0.13 1.00 −1.50 −1.80± 0.15 −0.94± 0.173 −0.86BD+26◦3578 6263± 76 3.93± 0.21 1.00 −2.36 < −1.36 −1.42± 0.113 < −0.06BD+37◦1458 5326± 54 3.30± 0.23 1.25 −2.17 −1.97± 0.15 −1.36± 0.211 −0.61G64-12 6318 ± 150 4.20± 0.30 1.00 −3.05 −1.90± 0.25 −1.88± 0.312 −0.02G275-4 6212 ± 150 4.13± 0.30 1.00 −2.99 < −2.29 −2.08± 0.322 < −0.21HD6582 5296± 67 4.46± 0.05 1.00 −0.86 −1.05± 0.14 −0.53± 0.161 −0.52HD19445 6095± 69 4.45± 0.05 1.00 −2.04 −1.69± 0.12 −0.82± 0.171 −0.87HD64090 5417± 65 4.55± 0.06 1.00 −1.74 −1.75± 0.14 −1.00± 0.151 −0.75HD76932 5859± 72 4.13± 0.04 1.00 −0.90 −1.12± 0.15 −0.56± 0.181 −0.56HD84937 6277± 75 4.03± 0.09 1.00 −2.06 < −2.06 −1.29± 0.171 < −0.77HD87140 5086± 43 2.96± 0.31 1.25 −1.83 −1.83± 0.15 - -HD94028 6058± 72 4.27± 0.06 1.00 −1.49 −1.34± 0.12 −0.78± 0.161 −0.56HD103095 5047± 68 4.61± 0.05 1.00 −1.43 −1.83± 0.14 −1.06± 0.193 −0.77HD128279 5130± 66 2.85± 0.22 1.25 −2.11 −2.41± 0.16 - -HD134169 5877± 72 3.96± 0.07 1.00 −0.81 −0.81± 0.15 −0.52± 0.171 −0.29HD140283 5723± 67 3.68± 0.06 1.00 −2.47 −2.42± 0.11 −1.58± 0.151 −0.84HD157214 5715± 43 4.21± 0.03 1.00 −0.35 −0.45± 0.12 −0.24± 0.111 −0.21HD165908 5905± 42 4.11± 0.03 1.00 −0.67 −0.77± 0.12 −0.63± 0.101 −0.14HD166913 6181± 74 4.18± 0.07 1.00 −1.68 −1.38± 0.12 −0.69± 0.181 −0.69HD170153 5954± 42 4.13± 0.03 1.00 −0.65 −0.86± 0.12 −0.74± 0.121 −0.12HD188510 5559± 65 4.54± 0.06 1.00 −1.57 −1.57± 0.14 −1.01± 0.171 −0.56HD189558 5681± 70 3.81± 0.08 1.00 −1.12 −1.32± 0.15 −0.74± 0.171 −0.58HD194598 6029± 77 4.28± 0.07 1.00 −1.20 −1.10± 0.15 −0.68± 0.191 −0.42HD201889 5618± 67 4.04± 0.08 1.00 −0.95 −1.05± 0.14 −0.80± 0.201 −0.25HD201891 5916± 77 4.26± 0.05 1.00 −1.05 −0.95± 0.15 −0.60± 0.181 −0.35HD218502 6182± 77 4.08± 0.08 1.00 −1.76 < −2.06 - -HD211998 5282 ± 180 3.28± 0.28 1.25 −1.48 −1.98± 0.30 −1.27± 0.381 −0.71HD225239 5528± 44 3.74± 0.15 1.00 −0.50 −0.65± 0.09 −0.71± 0.121 0.06
1 from Israelian et al. (1998)2 from Israelian et al. (2001)3 from Boesgaard et al. (1999)
7468 A line in metal-rich stars (Ecuvillon et al. 2004).Even armed with different abundance indicators and highquality observations, we often face situations where lit-tle can be done to resolve apparent abundance conflicts(e.g. Takeda 2003; Fulbright & Johnson 2003; Israelian etal. 2004). New generation 3D models of atmospheres werecalled in to save the situation (Asplund & Garcia-Perez2001; Asplund et al. 2003). These models suggest that di-atomic molecules (e.g. OH, CH and NH) in the near UVstrongly overestimate elemental abundances derived using1D models. The effect is strong in hot and very metal-poorsubdwarfs. However, 3D models do not provide consistentabundances from the near-UV OH, O i 7771–5 A and [O i]6300 A lines (Nissen et al. 2002). These models are notcalibrated and no grid is available to check them againstobservations of many solar-type stars with different atmo-spheric parameters. The models have yet to demonstratethat they can explain various observational characteristics
(such as Balmer line profiles, continuum energy distribu-tion, consistent abundances from different abundance in-dicators) in many stars with different parameters.
To ensure a homogeneous study of the (N/O) ratiofrom the NH and OH features in the near-UV, we usedthe same model atmospheres and tools as in our previousstudies (e.g. Israelian et al. 1998, 2001). The oxygen abun-dances were compiled from the papers of Israelian et al.(1998, 2001) and Boesgaard et al. (1999). Few stars havebeen added to the lists of Israelian et al. (1998, 2001)while the stellar parameters and [Fe/H] (Table 1) weretaken from Bihain et al. (2004). The effective tempera-tures were computed by Bihain et al. (2004) using theIRFM calibration versus V –K colors, the gravities fromHipparcos parallaxes and the metallicities from the liter-ature. The parameters of G64-12, G275-4 and LP815-43were taken from Israelian et al. (2001). Uncertainties inthe atmospheric parameters are of the order of 80 K in
4 G. Israelian et al.: Galactic Evolution of Nitrogen.
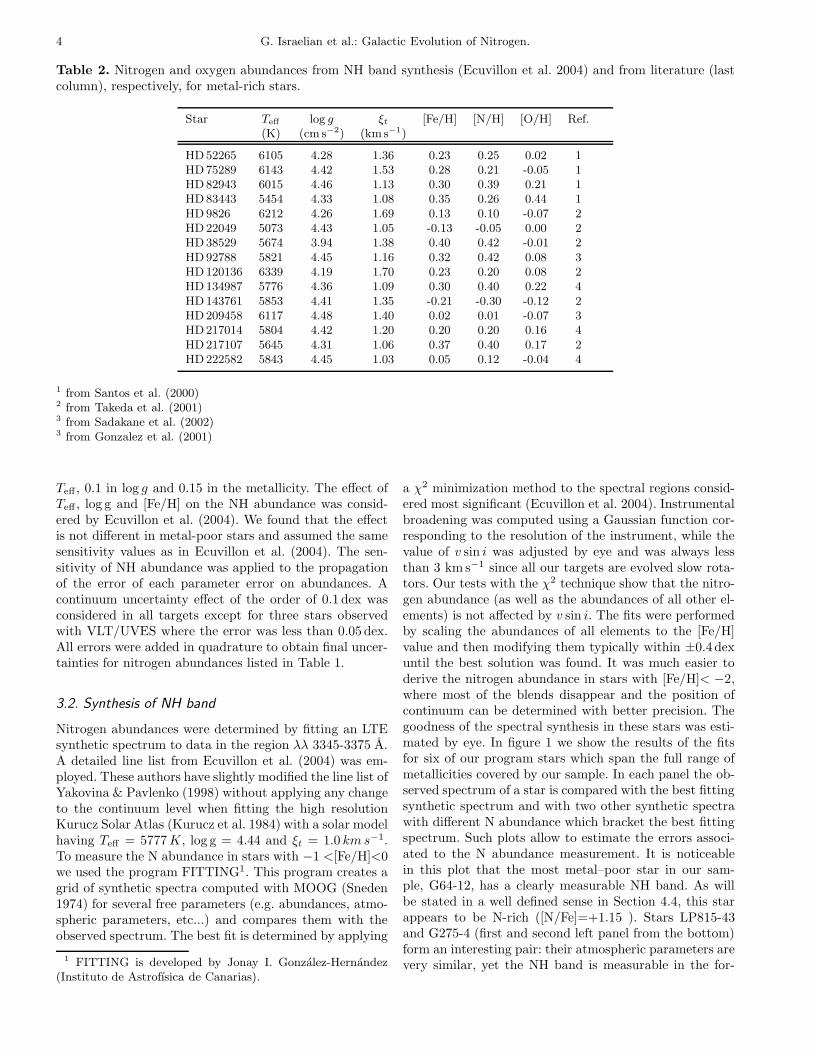
Table 2. Nitrogen and oxygen abundances from NH band synthesis (Ecuvillon et al. 2004) and from literature (lastcolumn), respectively, for metal-rich stars.
Star Teff log g ξt [Fe/H] [N/H] [O/H] Ref.(K) (cm s−2) (km s−1)
HD52265 6105 4.28 1.36 0.23 0.25 0.02 1HD75289 6143 4.42 1.53 0.28 0.21 -0.05 1HD82943 6015 4.46 1.13 0.30 0.39 0.21 1HD83443 5454 4.33 1.08 0.35 0.26 0.44 1HD9826 6212 4.26 1.69 0.13 0.10 -0.07 2HD22049 5073 4.43 1.05 -0.13 -0.05 0.00 2HD38529 5674 3.94 1.38 0.40 0.42 -0.01 2HD92788 5821 4.45 1.16 0.32 0.42 0.08 3HD120136 6339 4.19 1.70 0.23 0.20 0.08 2HD134987 5776 4.36 1.09 0.30 0.40 0.22 4HD143761 5853 4.41 1.35 -0.21 -0.30 -0.12 2HD209458 6117 4.48 1.40 0.02 0.01 -0.07 3HD217014 5804 4.42 1.20 0.20 0.20 0.16 4HD217107 5645 4.31 1.06 0.37 0.40 0.17 2HD222582 5843 4.45 1.03 0.05 0.12 -0.04 4
1 from Santos et al. (2000)2 from Takeda et al. (2001)3 from Sadakane et al. (2002)3 from Gonzalez et al. (2001)
Teff , 0.1 in log g and 0.15 in the metallicity. The effect ofTeff , log g and [Fe/H] on the NH abundance was consid-ered by Ecuvillon et al. (2004). We found that the effectis not different in metal-poor stars and assumed the samesensitivity values as in Ecuvillon et al. (2004). The sen-sitivity of NH abundance was applied to the propagationof the error of each parameter error on abundances. Acontinuum uncertainty effect of the order of 0.1 dex wasconsidered in all targets except for three stars observedwith VLT/UVES where the error was less than 0.05 dex.All errors were added in quadrature to obtain final uncer-tainties for nitrogen abundances listed in Table 1.
3.2. Synthesis of NH band
Nitrogen abundances were determined by fitting an LTEsynthetic spectrum to data in the region λλ 3345-3375 A.A detailed line list from Ecuvillon et al. (2004) was em-ployed. These authors have slightly modified the line list ofYakovina & Pavlenko (1998) without applying any changeto the continuum level when fitting the high resolutionKurucz Solar Atlas (Kurucz et al. 1984) with a solar modelhaving Teff = 5777K, log g = 4.44 and ξt = 1.0 kms−1.To measure the N abundance in stars with −1 <[Fe/H]<0we used the program FITTING1. This program creates agrid of synthetic spectra computed with MOOG (Sneden1974) for several free parameters (e.g. abundances, atmo-spheric parameters, etc...) and compares them with theobserved spectrum. The best fit is determined by applying
1 FITTING is developed by Jonay I. Gonzalez-Hernandez(Instituto de Astrofısica de Canarias).
a χ2 minimization method to the spectral regions consid-ered most significant (Ecuvillon et al. 2004). Instrumentalbroadening was computed using a Gaussian function cor-responding to the resolution of the instrument, while thevalue of v sin i was adjusted by eye and was always lessthan 3 km s−1 since all our targets are evolved slow rota-tors. Our tests with the χ2 technique show that the nitro-gen abundance (as well as the abundances of all other el-ements) is not affected by v sin i. The fits were performedby scaling the abundances of all elements to the [Fe/H]value and then modifying them typically within ±0.4 dexuntil the best solution was found. It was much easier toderive the nitrogen abundance in stars with [Fe/H]< −2,where most of the blends disappear and the position ofcontinuum can be determined with better precision. Thegoodness of the spectral synthesis in these stars was esti-mated by eye. In figure 1 we show the results of the fitsfor six of our program stars which span the full range ofmetallicities covered by our sample. In each panel the ob-served spectrum of a star is compared with the best fittingsynthetic spectrum and with two other synthetic spectrawith different N abundance which bracket the best fittingspectrum. Such plots allow to estimate the errors associ-ated to the N abundance measurement. It is noticeablein this plot that the most metal–poor star in our sam-ple, G64-12, has a clearly measurable NH band. As willbe stated in a well defined sense in Section 4.4, this starappears to be N-rich ([N/Fe]=+1.15 ). Stars LP815-43and G275-4 (first and second left panel from the bottom)form an interesting pair: their atmospheric parameters arevery similar, yet the NH band is measurable in the for-

G. Israelian et al.: Galactic Evolution of Nitrogen. 5
1
Fig. 1. Observations and synthesis of the NH band in the high-resolution near-UV spectra of several metal-poor stars.
6 G. Israelian et al.: Galactic Evolution of Nitrogen.
mer, but not in the latter. Neither of these stars is knownto be in a binary system. LP815-43 ([N/Fe] = + 0.63),like G64-12, belongs to the group of N-rich stars. Fromthe upper right panel one can see that we can confirmthe detection of NH band in HD140283 (Bessell & Norris1982; Tomkin & Lambert 1984). From the spectrum ofHD225239 (lower right panel) it appears clear how theanalysis of the NH is more difficult at higher metallcitiesdue to the strong blending with metallic lines and satura-tion of the NH lines.
The solar abundance of nitrogen was assumed logǫ(N)=8.05 (on the customary scale in which log ǫ(H)=12)from Anders & Grevesse (1989). There is, however, somedebate over the oxygen abundance in the Sun (AllendePrieto et al. 2001; Nissen et al. 2002; Asplund et al. 2003).The latest value, log ǫ(O)=8.66, from 3D models is about0.3 dex smaller than the original value from Anders &Grevesse (1989). The solar oxygen abundance used for thedifferential analysis of OH lines by Israelian et al. (1998)was log ǫ(O)=8.93 from Anders & Grevesse (1989). Inorder to be consistent with the solar gf values used byIsraelian et al. (1998) and with 1D model analysis in gen-eral, we have decided to use the same value in this arti-cle. This assumption will not introduce any errors sinceone can always switch to the scale where log ǫ(O)=8.66or any other value discussed in the literature and accord-ingly modify solar gf values of the OH lines from Israelianet al. (1998). The oxygen abundances in our targets comefrom the near-UV OH lines analysed by Israelian et al.(1998, 2001) and Boesgaard et al. (1999). The oxygenabundances listed in these articles were updated for theparameters listed in the Table 1, using the sensitivity ofOH to Teff , log g and [Fe/H] given in Israelian et al. (1998).
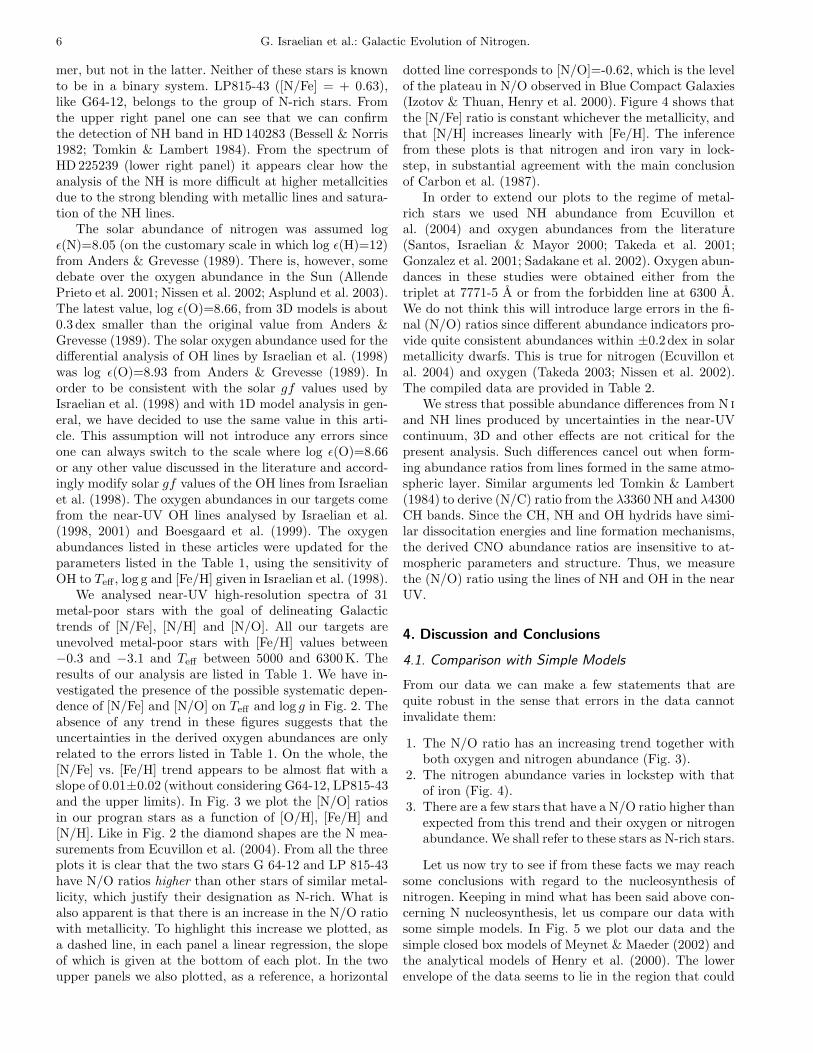
We analysed near-UV high-resolution spectra of 31metal-poor stars with the goal of delineating Galactictrends of [N/Fe], [N/H] and [N/O]. All our targets areunevolved metal-poor stars with [Fe/H] values between−0.3 and −3.1 and Teff between 5000 and 6300K. Theresults of our analysis are listed in Table 1. We have in-vestigated the presence of the possible systematic depen-dence of [N/Fe] and [N/O] on Teff and log g in Fig. 2. Theabsence of any trend in these figures suggests that theuncertainties in the derived oxygen abundances are onlyrelated to the errors listed in Table 1. On the whole, the[N/Fe] vs. [Fe/H] trend appears to be almost flat with aslope of 0.01±0.02 (without considering G64-12, LP815-43and the upper limits). In Fig. 3 we plot the [N/O] ratiosin our progran stars as a function of [O/H], [Fe/H] and[N/H]. Like in Fig. 2 the diamond shapes are the N mea-surements from Ecuvillon et al. (2004). From all the threeplots it is clear that the two stars G 64-12 and LP 815-43have N/O ratios higher than other stars of similar metal-licity, which justify their designation as N-rich. What isalso apparent is that there is an increase in the N/O ratiowith metallicity. To highlight this increase we plotted, asa dashed line, in each panel a linear regression, the slopeof which is given at the bottom of each plot. In the twoupper panels we also plotted, as a reference, a horizontal
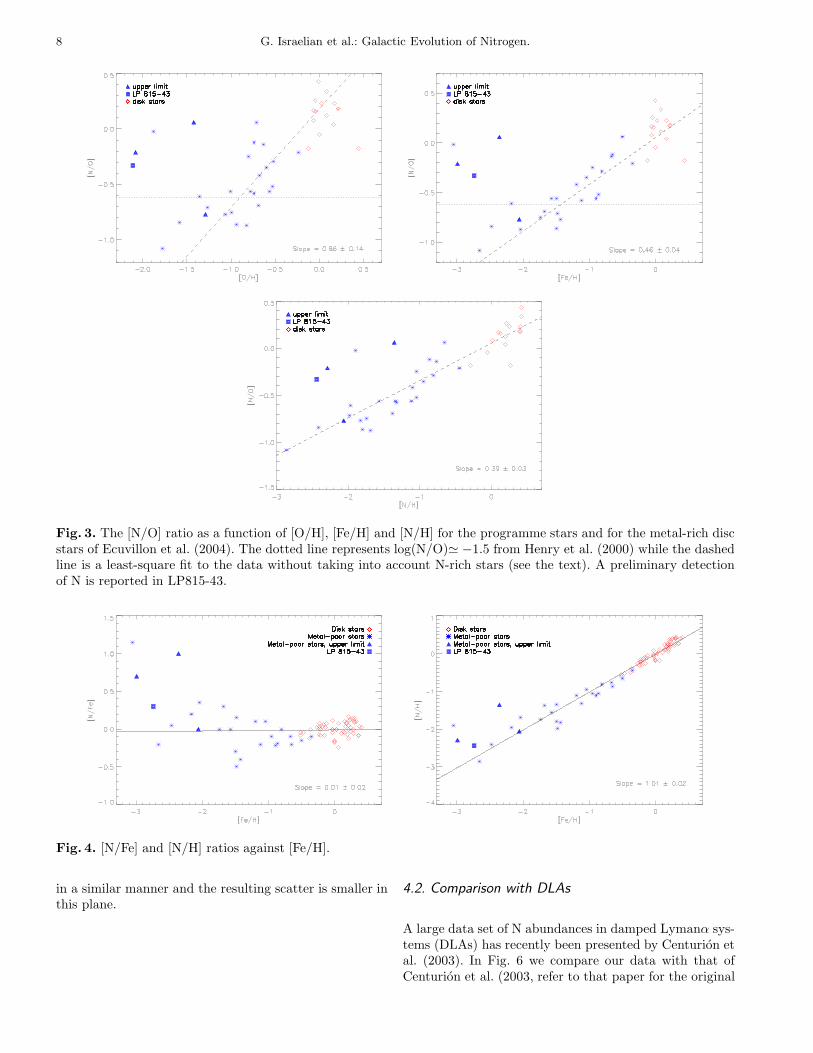
dotted line corresponds to [N/O]=-0.62, which is the levelof the plateau in N/O observed in Blue Compact Galaxies(Izotov & Thuan, Henry et al. 2000). Figure 4 shows thatthe [N/Fe] ratio is constant whichever the metallicity, andthat [N/H] increases linearly with [Fe/H]. The inferencefrom these plots is that nitrogen and iron vary in lock-step, in substantial agreement with the main conclusionof Carbon et al. (1987).
In order to extend our plots to the regime of metal-rich stars we used NH abundance from Ecuvillon etal. (2004) and oxygen abundances from the literature(Santos, Israelian & Mayor 2000; Takeda et al. 2001;Gonzalez et al. 2001; Sadakane et al. 2002). Oxygen abun-dances in these studies were obtained either from thetriplet at 7771-5 A or from the forbidden line at 6300 A.We do not think this will introduce large errors in the fi-nal (N/O) ratios since different abundance indicators pro-vide quite consistent abundances within ±0.2 dex in solarmetallicity dwarfs. This is true for nitrogen (Ecuvillon etal. 2004) and oxygen (Takeda 2003; Nissen et al. 2002).The compiled data are provided in Table 2.
We stress that possible abundance differences from N i
and NH lines produced by uncertainties in the near-UVcontinuum, 3D and other effects are not critical for thepresent analysis. Such differences cancel out when form-ing abundance ratios from lines formed in the same atmo-spheric layer. Similar arguments led Tomkin & Lambert(1984) to derive (N/C) ratio from the λ3360 NH and λ4300CH bands. Since the CH, NH and OH hydrids have simi-lar dissocitation energies and line formation mechanisms,the derived CNO abundance ratios are insensitive to at-mospheric parameters and structure. Thus, we measurethe (N/O) ratio using the lines of NH and OH in the nearUV.
4. Discussion and Conclusions
4.1. Comparison with Simple Models
From our data we can make a few statements that arequite robust in the sense that errors in the data cannotinvalidate them:
1. The N/O ratio has an increasing trend together withboth oxygen and nitrogen abundance (Fig. 3).
2. The nitrogen abundance varies in lockstep with thatof iron (Fig. 4).
3. There are a few stars that have a N/O ratio higher thanexpected from this trend and their oxygen or nitrogenabundance. We shall refer to these stars as N-rich stars.
Let us now try to see if from these facts we may reachsome conclusions with regard to the nucleosynthesis ofnitrogen. Keeping in mind what has been said above con-cerning N nucleosynthesis, let us compare our data withsome simple models. In Fig. 5 we plot our data and thesimple closed box models of Meynet & Maeder (2002) andthe analytical models of Henry et al. (2000). The lowerenvelope of the data seems to lie in the region that could

G. Israelian et al.: Galactic Evolution of Nitrogen. 7
Fig. 2. [N/Fe] and [N/O] ratios versus Teff and log g.
be adequately described by the models without any ef-fect of stellar rotation. The remaining data, however, seemto require models with rotation to be explained. At lowmetallicities the Galactic stars clearly deviate from the(N/O) plateau which characterizes extragalactic H II re-gions (i.e. BCGs) and is described by the middle curveof the three analytical models of Henry et al. (2000).The data however could be described by the Henry etal. (2000) with a rather high star formation efficiency (thelowest of the three curves). Since both the Henry et al.(2000) and Meynet & Maeder (2002) models include ni-trogen of both primary and secondary origin, we believeit is safe to conclude that some primary N production isnecessary to explain the data. By looking at the modelsof Meynet & Maeder (2002) alone it might be temptingto conclude that inclusion of stellar rotation is necessary.However this is not necessarily so; in fact in the models ofHenry et al. (2000) the yields for massive stars are takenfrom Maeder (1992), which do not include rotation. It isbeyond the scope of this paper to make a detailed compar-ison with chemical evolution models; however, we believethat it is quite likely that any model with both primaryand secondary nitrogen production would be able of re-producing the low metallicity data simply by tuning starformation and infall. In Fig. 5 there is a group of starsaround log(O/H)+12 = 8.2, log(N/O)=−1.1 which seems
to stand above all the models, and, although the errors aresuch that it is not inconsistent with the models.
The comparison with the models also suggests thatthere might be some intrinsic dispersion in N/O ratiosat any given O abundance. The existence of such a dis-persion would support the fact that AGB stars are themain contributor of primary nitrogen at low metallicities(Pagel & Edmunds 1981; Pettini et al. 2002). This wouldalso would support the role of rotation in N production;in fact, different N yields are predicted for different start-ing rotational velocities. Therefore, scatter in N/O ratioswould naturally arise from a distribution of initial rota-tional velocities. Differences in star formation history willintroduce a scatter as well. The errors on the data, how-ever, are too large to decide whether such an intrinsicdispersion exists. A mild hint in this direction comes fromthe inspection of the behaviour of the N/O ratio as a func-tion of O and N (Fig. 3), the scatter about the fitting lineis larger in the [N/O] vs. [O/H] plane than in the [N/O]vs. [N/H] plane. If the scatter were caused purely by ob-servational error, it should be the same for both planes. If,on the other hand, there were intrinsic scatter caused byrotation, the [O/H] would not depend on rotation while[N/O] would, and this plane shows the full effect of thisscatter. Instead both [N/H] and [N/O] depend on rotation
8 G. Israelian et al.: Galactic Evolution of Nitrogen.
Fig. 3. The [N/O] ratio as a function of [O/H], [Fe/H] and [N/H] for the programme stars and for the metal-rich discstars of Ecuvillon et al. (2004). The dotted line represents log(N/O)≃ −1.5 from Henry et al. (2000) while the dashedline is a least-square fit to the data without taking into account N-rich stars (see the text). A preliminary detectionof N is reported in LP815-43.
Fig. 4. [N/Fe] and [N/H] ratios against [Fe/H].
in a similar manner and the resulting scatter is smaller inthis plane.
4.2. Comparison with DLAs
A large data set of N abundances in damped Lymanα sys-tems (DLAs) has recently been presented by Centurion etal. (2003). In Fig. 6 we compare our data with that ofCenturion et al. (2003, refer to that paper for the original

G. Israelian et al.: Galactic Evolution of Nitrogen. 9
Fig. 5. Comparison of N/O ratios for programme stars (filled circles) with the simple models of Meynet & Maeder(2002), both including stellar rotation (dotted lines) and with no stellar rotation (dashed lines) and with the analyticalmodels of Henry et al. (2000, solid lines) which were computed to fit the N/O ratios observed in extragalactic H IIregions (blue compact galaxies). Empty boxes are metal-rich stars listed in Table 2 discussed in the text.
references to all the data). What is plotted is [N/Si] sincethe Si measurements in DLAs are more reliable than Omeasurements. The [N/O] ratios of DLAs seem to lie inthe same region occupied by Galactic stars with two dif-ferences: i) the DLAs extend to lower [N/O] ratios thangalactic stars; ii) although there are some DLAs with“high” N/O ratios they never reach the very high valuesdisplayed by a few Galactic stars at comparable metal-licity. The conclusion is that the N production history issimilar in our Galaxy and DLAs, but different in BCGs.
Among the DLAs there is a group of 5 which have avery low [N/Si] (∼ −1.4) and Molaro et al. (2003) claimthat these represent a second plateau in nitrogen abun-dance. The proposed interpretation of this is that thesegalaxies are very young and are observed before intermedi-ate mass stars had time to contribute to the N abundance.If our Galaxy has passed such a phase there should besome stars with such a low [N/α]; moreover, no star witha lower [N/α] ratio should be observed. The lowest pointwith [N/O]=−1.08 corresponds to the star BD+23◦3130and is therefore above the “low N/α” group of DLAs, al-though the errors in abundances (of both the stars and theDLAs) are such that the two are consistent at less than1σ. It would clearly be of great importance to extend thestellar observations at lower metallicities to see whetherthe N/O ratio persists in its linear decrease or whether itflattens out and reaches values similar to those of the “lowN/α” DLAs.
4.3. N-Rich Stars
Several definitions could be made of what is N-rich or N-normal, and some stars might be classified differently ac-cording to the definition chosen. However, two stars in oursample that would surely be ascribed to this group and areG64-12 and LP 815-43. Neither of these two well-knownmetal-poor stars shows any serious chemical anomaly.Both stars have a Li abundance (Bonifacio & Molaro1997; Ryan, Norris & Beers 1999; Bonifacio 2001) thatplaces them on the lithium plateau. This places seriousconstraints on the process that enriches them in N, sinceLi is destroyed at the temperatures at which the CNOcycle is operating Li. The problem is not new and sev-eral other N-rich field stars are known (Bessell & Norris1982; Laird 1985), all of which are lithium-normal (Spite& Spite 1986). Likewise, the globular cluster NGC6397 isN-rich although Li-normal (Bonifacio et al. 2002). In theirpioneering survey Carbon et al. (1987) pointed out thatthe number of N-rich stars is very limited; however, in ourexample there are at least two clear examples which aresimilar to the previously five known (HD25329, HD74000,HD 97916, HD160617 and HD166913). We believe thesestars are the exception rather than the rule, although theyare perhaps less rare than previously thought.

10 G. Israelian et al.: Galactic Evolution of Nitrogen.
Fig. 6. The [N/O] as a function of [O/H] for the programme stars (filled circles) and for the damped Lymanα systems(DLAs) from Centurion et al. (2003, crossed squares). We chose to show [N/Si] rather than [N/O] since there are moredata points available and the measurements of Si are more reliable than those of O. However, we should bear in mindthat different groups of objects (e.g. DLAs, BCGs and Galactic stars) may have different star formation histories.
4.4. Nitrogen Nucleosynthesis and Final Remarks
Nitrogen is one of the most abundant elements in theUniverse. With C and O, it shares an important nucle-osynthetic role as a key ingredient in hydrogen-burningthrough the CNO cycle. However while for carbon andoxygen the dominant production modes are the α-chainreactions, which start from the carbon-producing triple-α reaction, for nitrogen the dominant production modelies in the re-arrangement of nuclei which occurs in theCNO cycle. In CNO-cycled material 14N is increased atthe expense of 12C and 16O. However, there is still con-siderable uncertainty as to where and when this processtakes place. Hydrogen-burning operates mainly throughthe CNO cycle during the core H-burning (main sequence)phase of stars slightly more massive than the Sun and dur-ing shell H-burning phases. The latter include: the firstascent along the red giant branch (RGB), the horizon-tal branch (HB) and the asymptotic giant branch (AGB).The first question to ask is under which of these condi-tions the nuclear-processed material is more readily shedinto the interstellar medium. Our targets are unevolveddwarfs and therefore the N and O abundances discussedin this paper reflect conditions in the ISM at the time ofstar formation. The second question is where the C and Onuclei, used to form N, come from. Were these synthesizedby a previous stellar generation or by the star itself ?
In standard stellar models the material processed inthe core of a massive star does not reach the surface.Therefore, core H-burning should not provide any nitro-gen. However, if we add some extra mixing, e.g. becauseof rotation, a part of the core material may reach the sur-face (see the discussion in Meynet & Maeder 2002 andtheir table 2).
Concerning shell-H burning, according to the stan-dard models, it is only the AGB phase, through the thirddredge-up mechanism in which it is possible to bring nu-cleosynthesis products to the surface. Also, in this caseinclusion of rotation allows surface enrichment even priorto the third dredge-up (Meynet & Maeder 2002).
The second question we have posed is usually found inthe literature as: Is nitrogen primary or secondary? Sincenitrogen needs C and O to be formed, if nitrogen is formedfrom the C and O already existing at the time the starformed then it is called “secondary”. If, instead, the C andO are formed in the star itself and then used for N produc-tion then N is called “primary”. According to the standardmodels, primary production can take place in the AGBphase of stars that undergo hot bottom burning (Marigo2001); therefore, it takes place in intermediate mass stars.In models which include rotational mixing, production ofprimary nitrogen can instead take place both in interme-diate mass and massive stars. Moreover, in intermediatemass stars the mechanism may be different from that inthe standard models: in an H-shell burning star the He-

G. Israelian et al.: Galactic Evolution of Nitrogen. 11
processed material, containing C and O, may reach theH-burning shell through rotational diffusion, thus givingrise to primary nitrogen.
It thus appears reasonably clear, from the theoreticalpoint of view, that any stellar population will producesome primary, as well as some secondary, nitrogen. Wethus expect this element to show a behavior that is neitherpurely primary nor purely secondary.
Spectral syntheses presented in this article are subjectto many uncertainties. Stellar parameters and line listsare questioned first of all. While we did our best to obtainreliable stellar parameters and a well calibrated line list,two more uncertainties could still affect the final results:the effects of granulation/3D and the opacity uncertain-ties in the near UV. Both effects can be greatly minimizedor perhaps even canceled if we measure the (N/O) ratiosfrom the near-UV bands of NH and OH and plot themagainst [Fe/H] derived from the Fe ii lines (Nissen et al.2002). However, these effects may not be masked on thegraphs which plot (N/0) against (O/H) (or (N/H)) sincethe latter will be affected. While it is still impossible tocarry out NH analysis with 3D models in a large numberof metal-poor stars, we can guess what the general effectwould be. The 3D effect on OH increases with decreasing[Fe/H] (Asplund & Garcıa Perez 2001). Thus, the lowestmetallicity points on Fig. 5 will be shifted horizontallyto the right and the signature of primary Nitrogen foundin 1D models (i.e. the flattening at low (O/H)) will dis-appear. Finally, we note that even this “guess” is veryuncertain since 3D models still do not resolve the oxygenconflict in metal-poor stars, and more work is needed toachieve consistent abundance analysis.
Acknowledgements. We would like to thank Andre Maeder andGeorges Meynet for many important discussions and commentson this paper. The referee Richard Henry is thanked for manyvalueable suggestions and comments.
References
Anders, E., & Grevesse, N. 1989, Geochim et.Cosmochim. Acta 53, 197Allende Prieto, C., Lambert, D. C. & Asplund, M. 2001,ApJ, 556, L63Asplund, M. & Garcıa Perez, A. 2001, A&A, 372, 601Asplund, M., Grevesse, N., Sauval, J., Allende Prieto, C.& Kiselman, D. 2003, A&A, in pressBessell, M. S. & Norris, J. 1982, ApJ, 263, L29Bihain, G., Israelian, G., Rebolo, R., Bonifacio, P. &Molaro, P. 2004, A&A, acceptedBoesgaard, A.M., King, J.R., Deliyannis, C. P., & Vogt,S.S. 1999, AJ, 117, 492P. Bonifacio 2001, in “The link between stars and cos-mology”, Eds. M. Chavez and D. Mayya, (Dordrecht:Kluwer) ,p. 77Bonifacio, P. et al. 2002, A&A, 390, 91Bonifacio, P. & Molaro, P. 1997, MNRAS, 285, 847Carbon, D. F., Barbuy, B., Kraft, R. P., Friel, E. D., &Suntzeff, N. B. 1987, PASP, 99, 335
Centurion, M, Bonifacio, P., Molaro, P. & Vladilo, G.1998, ApJ, 509, 620Centurion, M., Molaro, P., Vladilo, G., Peroux, C.,Levshakov, S. A., & D’Odorico, V. 2003, A&A, 403, 55Ecuvillon, A., Israelian, G., Santos, N., Mayor, M.,Garcıa Lopez, R. J. & Randich, S. 2003, A&A, 418, 703Edmunds, M. G. & Pagel, B. E. 1978, MNRAS, 185, 78PFulbright, J. & Johnson, J. 2003, ApJ, 595, 115Garcıa Lopez, R. J., Lambert, D. L., Edvardsson, B.,Gustafsson, G., Kiselman, D. & Rebolo, R. 1998, ApJ,500,241Garcıa Lopez, R. J., Severino, G. & Gomez, M. T. 1995,a, 297,787Gonzalez G., Laws, C., Tyagi, S. & Reddy, B. E. 2001,AJ 285, 403Henry, R. B. C., Edmunds, M. G., & Koppen, J. 2000,ApJ, 541, 660Israelian, G., Garcıa Lopez, R. J. & Rebolo, R. 1998,ApJ, 507, 805Israelian, G., Garcıa Lopez, R. J. & Rebolo, R. 2000,in “The Evolution of the Milky Way: stars versus clus-ters”, Eds. F. Matteucci and F. Giovannelli, (Dordrecht:Kluwer) ,p. 35Israelian, G., Rebolo, R., Garcıa Lopez, R., Bonifacio, P.,Molaro, P., Basri, G., & Shchukina, N. 2001, ApJ, 551,833Israelian, G., Shchukina, N., Rebolo, R., Basri, G.,Gonzalez Hernandez & Kajino, T. 2004, A&A, acceptedIzotov, Y. I., Schaerer, D. & Charbonnel, C. 2001, ApJ,549, 878Kurucz, R. L. 1993, CD-ROMs, ATLAS9 StellarAtmospheres Programs and 2 km s−1 Grid (Cambridge:Smithsonian Astrophys. Obs.)Kurucz, R. L., Furenlid, I., Brault, J., Testerman, L.1984, Solar Flux Atlas from 296 to 1300 nm, NOAOAtlasNo. 1Laird, J. B. 1985, ApJ, 289, 556Liang, Y. C., Zhao, G., & Shi, R. J. 2001, A&A, 374, 936Lu, L., Sargent, W., & Barlow, T. A. 1998, AJ, 115, 55Maeder, A. 1992, A&A, 264, 1Marigo, P. 2001, A&A, 370, 194Meynet, G. & Maeder, A. 2002, A&A, 390, 561Molaro, P., Bonifacio, P., Castelli, F. & Pasquini, L. 1997,a, 319, 593Molaro, P., Centurion, M., D’Odorico, V., & Peroux, C.2003, ArXiv Astrophysics e-prints, 7173Nissen, P.E., Primas, F., Asplund, M. & Lambert, D.L.2002, A&A, 235, 251Pagel, B. E. J., & Edmunds, M. G. 1981, Ann. Rev. Astr.Ap., 19, 77Pagel, B. & Kazlauskas, A. 1992, MNRAS, 256, 49PPettini, M., Ellison, S. L., Bergeron, J. & Petitjean, P.2002, A&A, 391, 21Sadakane, K., et al. 2002, PASJ, 54, 911Santos N.C., Israelian, G., Mayor M., 2000, A&A 363,228Sargent, W. & Searle, L. 1970, ApJ, 162, 155
12 G. Israelian et al.: Galactic Evolution of Nitrogen.
Schulte-Ladbeck, R., Ulrich, H., Greggio, L., Crone, M.& Drozdovsky, I. 2001, AJ, 121, 3007Sneden C. 1974, ApJ, 189, 493Spite, F. & Spite, M. 1986, A&A, 163, 140Ryan, S. G., Norris, J. E., & Beers, T. C. 1999, ApJ, 523,654Takeda, Y., et al. 2001, PASJ, 53, 1211Takeda, Y. 2003, A&A, 402, 343Thuan, T. X., Izotov, Y. I. & Lipovetsky, V. A. 1995,ApJ, 445, 108Tomkin, J., & Lambert, L. 1984, ApJ, 279, 220Tomkin, J., Lemke, M., Lambert, D. L., & Sneden, C.1992, AJ, 104, 1568Yakovina L. A., & Pavlenko Ya. V. 1998, Kinematics andPhysics of Celestial Bodies,14, 195van den Hoek, L. B. & Groenewegen, M. A. T. 1997,A&AS, 123, 305
List of Objects
‘LP 815-43’ on page 3‘LHS 540’ on page 3‘BD+23◦3130’ on page 3‘BD+23◦3912’ on page 3‘BD+26◦3578’ on page 3‘BD+37◦1458’ on page 3‘G64-12’ on page 3‘G275-4’ on page 3‘HD 6582’ on page 3‘HD 19445’ on page 3‘HD 64090’ on page 3‘HD 76932’ on page 3‘HD 84937’ on page 3‘HD 87140’ on page 3‘HD 94028’ on page 3‘HD 103095’ on page 3‘HD 128279’ on page 3‘HD 134169’ on page 3‘HD 140283’ on page 3‘HD 157214’ on page 3‘HD 165908’ on page 3‘HD 166913’ on page 3‘HD 170153’ on page 3‘HD 188510’ on page 3‘HD 189558’ on page 3‘HD 194598’ on page 3‘HD 201889’ on page 3‘HD 201891’ on page 3‘HD 218502’ on page 3‘HD 211998’ on page 3‘HD 225239’ on page 3‘HD 52265’ on page 4‘HD 75289’ on page 4‘HD 82943’ on page 4‘HD 83443’ on page 4‘HD 9826’ on page 4‘HD 22049’ on page 4
‘HD 38529’ on page 4‘HD 92788’ on page 4‘HD 120136’ on page 4‘HD 134987’ on page 4‘HD 143761’ on page 4‘HD 209458’ on page 4‘HD 217014’ on page 4‘HD 217107’ on page 4‘HD 222582’ on page 4‘G64-12’ on page 4‘LP815-43’ on page 4‘G275-4’ on page 4‘LP815-43’ on page 6‘G64-12’ on page 6‘HD 140283’ on page 6‘HD 225239’ on page 6