fyp ratio analysis krishak bharat ash
DESCRIPTION
project report on RATIO ANALYSIS kribhcoTRANSCRIPT

7/18/2019 FYP Ratio Analysis Krishak Bharat ASH
http://slidepdf.com/reader/full/fyp-ratio-analysis-krishak-bharat-ash-56d51c337daec 1/69
1
A PROJECT REPORT
ON
RATIO ANALYSIS
UNDERTAKEN AT
KRISHAK BHARATI CO-OPERATIVE LIMITED
SURAT
MASTER OF BUSINESS ADMINISTRATION (FINANCE)
SUBMITTED IN PARTIAL FULFILLMENT OF
THE REQUIREMENTS FOR AWARD OF
MASTER OF BUSINESS ADMINISTRATION OF
TILAK MAHARASHTRA UNIVERSITY, PUNE.
SUBMITTED BY
HUZAIFA A SOPARIWALA
PRN: 07208013498
OF
PAI INTERNATIONAL CENTER FOR MANAGEMENT
EXECELLENCE
TILAK MAHARASHTRA UNIVERSITY
GULTEKDI, PUNE 411037.
www.final-yearproject.com | www.finalyearthesis.com

7/18/2019 FYP Ratio Analysis Krishak Bharat ASH
http://slidepdf.com/reader/full/fyp-ratio-analysis-krishak-bharat-ash-56d51c337daec 2/69
2
PREFACE
I have really enjoyed working on this project. In the starting phase,
I found this work difficult, but with ample guidance of all staff members
of the Krishak Bharati Cooperative Limited, Surat. I was able to
complete my work successfully.
It is the responsibility of the Management of an organization to
guide each newly joined individual to remove his anxiety in an
organizational environment and help him in settling down.
In this project I have covered the aspect relating to training
followed by the management of an organization. Under this study I have
put in my best efforts to make this project successful.
While working on this project I got exposure to the training
practice use by the organization.
www.final-yearproject.com | www.finalyearthesis.com

7/18/2019 FYP Ratio Analysis Krishak Bharat ASH
http://slidepdf.com/reader/full/fyp-ratio-analysis-krishak-bharat-ash-56d51c337daec 3/69
3
ACKNOWLEDGEMENT
Man’s quest for knowledge never ends. Theory and practice are
essential and complementary to each other I am thankful for the
assistance received from various individuals in making this project
successfull. I find no words to express my gratitude towards those who
are constantly involved with us throughout my project in PAI
INTERNATIONAL CENTER FOR MANAGEMENT EXECELLENCE.
I would like to give my special thanks and regards to
“Mr.T.S.Thomas” (General Manager, Surat Who has helped me to carry
out this project as my project in charge under his guidance and blessing
I was able to fulfill the requirements of my university.
I would also like to thanks Mr.A.M.S.Belim, Mr.M.A,Patwa (F&A
Department), for their most precious contribution and their help in my
project. I am very much thankful to other staff members of “Kribhco,
Surat”. Without their help I am not able to finish this project.
I am highly obliged to the management of Pai international
center for management execellence For allocating me a very
interesting and challenging project. I am sincerely thankful to my project
guide Prof. Prashant Gundawar and our Director Prof. R.Ganeshan for
providing the resources for the project. Their guidance and support was aconstant source of inspiration for me.
www.final-yearproject.com | www.finalyearthesis.com

7/18/2019 FYP Ratio Analysis Krishak Bharat ASH
http://slidepdf.com/reader/full/fyp-ratio-analysis-krishak-bharat-ash-56d51c337daec 4/69
4
EXECUTIVE SUMMARY
This summer project report is prepared at “KRISHAK BHARATI
COOPERATIVE LIMITED.” at Surat on “RATIO ANALYSIS” as a part of
curriculum of the MBA program.
I have selected this topic to measures the financial position of the
company and firm profit ability as well as its credit policy with the help of
ratio analysis. Ratio analysis is a widely used of financial analysis. It is
defined as the systematic use of ratio to interpret the financial
statements so that strengths and weakness of a firm as well as its
historical performance and current financial condition can be
determined.
The main Objectives are: To know the financial condition of the company.
To know the strength and weakness of the company
To know that company has enough asset compare to its liabilities
To study inventory management.
To study company’s ability to earn profit compare to its sales
To analyze the liquidity position of the company.
To study receivable management and company ’s credit policy. To achieve these objectives, I have studied fifteen ratio
analysis which are as below…
www.final-yearproject.com | www.finalyearthesis.com

7/18/2019 FYP Ratio Analysis Krishak Bharat ASH
http://slidepdf.com/reader/full/fyp-ratio-analysis-krishak-bharat-ash-56d51c337daec 5/69
5
Ratio analysis :
o
Current Ratioo Quick Ratio
o Inventory Ratio
o Inventory turnover Ratio
o Debtor turnover ratio
o Debtors conversion period
o Current assets turn over ratio
o Cash Ratio
o Debt-equity ratio
o Net-profit ability ratio
o Gross-profit ability ratio
o Return on capital employed
o Inventory conversion period
o Raw material conversion period
o Work in progress conversion period
o Finished good conversion period
Methodology:
Descriptive research design has been used and data are collected
through secondary data collection method.
I have use Microsoft Excel for the data analysis.
www.final-yearproject.com | www.finalyearthesis.com

7/18/2019 FYP Ratio Analysis Krishak Bharat ASH
http://slidepdf.com/reader/full/fyp-ratio-analysis-krishak-bharat-ash-56d51c337daec 6/69
6
TABLE OF CONTENTS
CHAPTER
NO.
TOPIC PAGE
NO.
1.Industry profile
8
2.Company profile
13
3. Theory of Ratio Analysis
19
4.Literature Review
24
5.
Research Methodology
26
6.Data analysis & inference
30
7.Conclusion & Recommendation
66
8.Suggestions & Limitation
68
9.Bibliography
70
www.final-yearproject.com | www.finalyearthesis.com

7/18/2019 FYP Ratio Analysis Krishak Bharat ASH
http://slidepdf.com/reader/full/fyp-ratio-analysis-krishak-bharat-ash-56d51c337daec 7/69
7
INDUSTRY PROFILE
www.final-yearproject.com | www.finalyearthesis.com

7/18/2019 FYP Ratio Analysis Krishak Bharat ASH
http://slidepdf.com/reader/full/fyp-ratio-analysis-krishak-bharat-ash-56d51c337daec 8/69
8
IINNTTR R OODDUUCCTTIIOONN OOFF FFEER R TTIILLIIZZEER R IINNDDUUSSTTR R YY
Before introducing organization
KRIBHCO (a Fertilizer producing unit). I feel
necessary to give an overview of the Indian
Fertilizer Industries.
“India lives in villages,” said Mahatma
Gandhi decades ago. It is true even today. Like
every developing economy, the economy of
India is also agro-based. Agriculture accounts for nearly 1/4th of India's GDP and more
importantly, about 2/3rd
of the country's population is dependent on agriculture and allied
activities for their livelihood. As per statistics nearly 175 lakhs MT of fertilizer nutrients
are required every year in this country. The demand of fertilizers was so high that India
had to import almost 30% of its requirement from other countries. Therefore, to achieve
the economic growth, agriculture base of the country must be strengthened. To attain this
objective, agriculture practices have to be improved from their traditional pattern to a
higher technological track involving better irrigation and use of better quality seeds,
fertilizers, insecticides & pesticides. Therefore, chemical fertilizers are key player in this
process and fertilizer industries plays quite a major role in increasing food production in
the country and also helps to modernize the out look of the common farmers and make
them innovative and respective to the new technology change.
India is basically an agricultural country which economy depends largely upon its
agrarian produce. Agricultural sphere contributes about 25% to the country's GDP. As a
result, Indian fertilizer industry has tremendous scope in and outside the country as it is
one of the allied parts of agriculture.
Today, Indian Fertilizer Industry is developing in terms of technology. Indian
manufacturers are adopting advanced manufacturing processes to prepare innovative new
products for Indian agriculture.
www.final-yearproject.com | www.finalyearthesis.com

7/18/2019 FYP Ratio Analysis Krishak Bharat ASH
http://slidepdf.com/reader/full/fyp-ratio-analysis-krishak-bharat-ash-56d51c337daec 9/69
9
Growth of Fertilizer Industry
One of the most significant achievement of the post Independence period of our Country
has been the ability to achieve self-sufficiency in food grain production. This
achievement is due to the rapid growth and improvement of Fertilizer industry. The
Fertilizer industry is growing at the rate of 4% for the last 10 years and has been
contributing a significant part of G.D.P.
The growth and importance of Fertilizer industry in India can be divided in to three
distinct phases, these are given below.
1. Pro Green Revolution Period:
This period is described in 1952-1953 era where increased growth of food grains took
place however this increased production in food grains took place due to increased
irrigation methods. In this phase the land under agriculture was made more, during this
period about 80% of the country's population was involved in Agriculture either directly
or indirectly. During this period the fertilizer's which were manufactured were Super
Phosphate & Ammonium Sulphate. Irrigation was thought to be heart of Agriculture.
2. Green Revolution Period:
During this phase Government stated the programmed aimed at making our country self
sufficient in Food Products. This was the period between the years 1959-1960. This plan
laid the emphasis on production of High Yielding Varieties. To make this plan a success
there was a high need to make soil fertile by providing it with nutrients like Phosphorus,
Nitrogen and Potassium.
During this phase Fertilizer industry tried to play a vital role, became one of the most
important, and inherits part of our economy.
www.final-yearproject.com | www.finalyearthesis.com

7/18/2019 FYP Ratio Analysis Krishak Bharat ASH
http://slidepdf.com/reader/full/fyp-ratio-analysis-krishak-bharat-ash-56d51c337daec 10/69
10
3. The Post Green Revolution Period:
The world's population along with Indian population has kept on growing at an alarming
rate; the fertilizer companies all over India are trying to expand their scale of operations
in order to increase the production rate. The demand for fertilizers per year is increasing.The current demand of fertilizers in India is 18 million tones.
- According to Fertilizer Association of India.
Fertilizer Industry Scenario in India
In India, First of all in 1906, A Single Super Phosphate (SSP) manufacturing unit was set
up at Ranipat near Chennai (Madras) with annual capacity of 6000 tones per annum.
1. Public Sector
The Fertilizer And Chemicals Travancore Ltd. (FACT)
Hindustan Fertilizer Corporation Ltd. (HFC)
Madras Fertilizer Ltd. (MFL)
Hindustan Copper Ltd. (HCL)
Naively Lignite Corporation Ltd. (NLC)
Pyrites, Phosphates And Chemicals Ltd. (PPCL)
Pradeep Phosphates Ltd. (PPL)
Rashtriya Chemicals And Fertilizers Ltd. (RCFL)
National Fertilizer Ltd. (NFL)
www.final-yearproject.com | www.finalyearthesis.com

7/18/2019 FYP Ratio Analysis Krishak Bharat ASH
http://slidepdf.com/reader/full/fyp-ratio-analysis-krishak-bharat-ash-56d51c337daec 11/69
11
2. Co-operative Sector
There are only two fertilizer manufacturing societies in Co-operative sector.
Indian Farmers Fertilizers Co-Operative Ltd. (IFFCO)
Krishak Bharati Co-Operative Ltd. (KRIBHCO)
3. Private Sector
There are 17 companies in private sector, which are producing fertilizer.
Gujarat Narmada Valley Fertilizer Co. Ltd. (GNFC)
Hindustan Lever Ltd. (HLL)
Hari Fertilizer
ICI India Ltd.
Indo Gulf Fertilizers & Chemicals Corporation Ltd.
Mangalore Chemicals & Fertilizers Ltd. (MCFL)
Southern Petro Chemicals Industries Corporations Ltd.
Nagarjuna Fertilizer & Chemical Ltd. (NFCL) Shri Ram Fertilizer & Chemicals Ltd.
Tuticorian Alkali Chemicals & Fertilizer Ltd.
Zuari Agro Chemicals Ltd.
Bindali Agro Chemicals Ltd.
Chambal Fertilizer & Petrochemical Corporations Ltd. (DEPCL)
E.D.I. PASSY (I) LTD.
Gujarat State Fertilizer Company (GSFC
www.final-yearproject.com | www.finalyearthesis.com

7/18/2019 FYP Ratio Analysis Krishak Bharat ASH
http://slidepdf.com/reader/full/fyp-ratio-analysis-krishak-bharat-ash-56d51c337daec 12/69
12
COMPANY PROFILE
www.final-yearproject.com | www.finalyearthesis.com

7/18/2019 FYP Ratio Analysis Krishak Bharat ASH
http://slidepdf.com/reader/full/fyp-ratio-analysis-krishak-bharat-ash-56d51c337daec 13/69
13
KRISHAK BHARTI CO-OPERATIVE LTD
Introduction:-
Name: - K K K r r r iiissshhhaaak k k BBBhhhaaar r r aaatttiii CCCooo---ooo p p peeer r r aaatttiiivvveee LLLtttddd...
Joint Sector: - Government, IFFCO and NCDC.
Foundation stone laid by smt.Indira Gandhi: - 5th February1982
Trial production of Urea: - 26TH November , 1985
Start of commercial Production: - 1st March 1986
Year of Business: - 25 years
Legal Status: - Multi state co-operative society
No. of Employees: - 2567
Manufacturing and Marketing: - Urea, Ammonia and Bio-fertilizer.
Urea – Ammonia Plant Location: - Distance from Surat, Hazira Guj.
www.final-yearproject.com | www.finalyearthesis.com

7/18/2019 FYP Ratio Analysis Krishak Bharat ASH
http://slidepdf.com/reader/full/fyp-ratio-analysis-krishak-bharat-ash-56d51c337daec 14/69
14
KRIBHCO Network: -
A. Head office
B. (i) Plant
(ii) Bio fertilizer plant
(iii) Seed processing plant
C. Zonal offices
D. State marketing offices
Fertilizer plant, Noida, Delhi
Surat (Gujarat)
Surat (Gujarat)
Andhra Pradesh, Gujarat, Haryana, U.P.
M.P, Punjab, Rajasthan,
Bhopal, Bangalore, Lucknow and
Chndigarh
Jaipur, Ahmedabad, Chennai,
Mumbai, Banglore, Patna, Lucknow,
Chandigarh, Bhopal, Hyderabad, Guwahati,
Dehurdun, Kolkata.
www.final-yearproject.com | www.finalyearthesis.com

7/18/2019 FYP Ratio Analysis Krishak Bharat ASH
http://slidepdf.com/reader/full/fyp-ratio-analysis-krishak-bharat-ash-56d51c337daec 15/69
15
OBJECTIVES OF KRIBHCO
MAIN:-
1. To increase the urea installed capacity, maintaining its market share.
2. To ensure optimum utilization of existing plant and machinery, through
proper maintenance.
3. To diversify into other core sector like power, LPG terminal/port,
chemicals etc.
OTHERS:-
1. To enlarge product mix through product development
2. To continue and intensify efforts towards rural development and Co-
operative movements.
MISSION
1. To contribute to agriculture & rural development in the regions.
2. Services to members of cooperatives society by selecting financing.
Managing society desirable and commercial profitable investment
opportunity preferable at multiple locations.
www.final-yearproject.com | www.finalyearthesis.com

7/18/2019 FYP Ratio Analysis Krishak Bharat ASH
http://slidepdf.com/reader/full/fyp-ratio-analysis-krishak-bharat-ash-56d51c337daec 16/69
16
VISION
We want to be a world class organization that represents the farmer community and
maximizes returns to them through specialization in agricultural inputs and products
and other diversified businesses that maximize stakeholder value.
MILESTONES / RECORDS:-
KRIBHCO has achieved a milestone in handling of OMIFCO urea:
- Total quantity received up to 12.08.2006 - 1001133.890 MT
- Total quantity dispatched up to 08.09.2006 - 1002323.700 MT
First, achieve record capacity utilization in the first year of commercial
production - 93.5% and 97.4% for Ammonia and Urea plants.
First, achieve highest net profit of Rs. 126.80 Crore in the year 1987- 88 by
any fertilizer organization.
First, to achieve 10 and 20 million tones of Urea production milestone within a
short period of 6.4 years and 12.6 years from commencement of production.
First, the country to achieve 10 million tones of Ammonia production milestone
within a period of 10.7 years from commencement of production.
www.final-yearproject.com | www.finalyearthesis.com

7/18/2019 FYP Ratio Analysis Krishak Bharat ASH
http://slidepdf.com/reader/full/fyp-ratio-analysis-krishak-bharat-ash-56d51c337daec 17/69
17
AWARDS:-
KRIBHCO receives Gold star award of Excellence from Institute of Economic Studies
for its overall excellent performance.
KRIBHCO receives the Rajbhasha Award from Honb'le Minister of Chemical and
Fertilizers for 2002-03, 2003-04, 2004-05.
KRIBHCO was awarded First prize for Production, Promotion, and marketting of
Bio-fertilizers for the year 2004-05 on 1st of December '05 by FAI.
IIIE - ENTERPRISE EXCELLENCE Award for the year 2003-04
KRIBHCO has won INDIRA GANDHI RAJBHASHA PURUSKAR (2nd) for 2003-04.
KRIBHCO -Hazira - Pot Plants exhibition received the 2nd prize in the first National
Horticulture exhibition and flower show for the year 2002.
FAI – Best Video Film Award 1987, 1990, 1991, 1992, 1993, 1994, 1995, 1996 and 1998
FAI Technical Innovation Award: 2001-02 to two KRIBHCO Officers.
SHIELD & CERTIFICATE awarded by Rajbhasha Vibhag, Home Ministry, GOI for
PROMOTION OF HINDI AS AN OFFICIAL LANGUAGE for the year 1993-94.
"RAJBHASHA SHIELD" for OUTSTANDING WORK IN OFFICIAL LANGUAGE
for the year 1994-95 by Official Language Implementation Committee, Surat.
'Best House Keeping' Award to KRIBHCO’s Hazira Complex from Baroda
Productivity Council – Awarded 5 times from 1988-89 to 1991-92.
www.final-yearproject.com | www.finalyearthesis.com

7/18/2019 FYP Ratio Analysis Krishak Bharat ASH
http://slidepdf.com/reader/full/fyp-ratio-analysis-krishak-bharat-ash-56d51c337daec 18/69
18
RATIO ANALYSIS
www.final-yearproject.com | www.finalyearthesis.com

7/18/2019 FYP Ratio Analysis Krishak Bharat ASH
http://slidepdf.com/reader/full/fyp-ratio-analysis-krishak-bharat-ash-56d51c337daec 19/69
19
1. RATIO ANALYSIS
Ratio analysis is a widely used of financial analysis. It is defined as the systematic use of
ratio to interpret the financial statements so that strengths and weakness of a firm as well
as its historical performance and current financial condition can be determined. The term
ratio refers to the numerical or quantitative relationship between two items variables.
The alternative, methods of expressing items, which are related to each other , are for
purposes of financial analysis, referred to as ratio analysis. It should be noted that
computing the ratio does not add any information not already inherent in the above
figures of profits and sales. What ratios do is that they reveal the relationship in a more
meaningful way so as to enable us to draw conclusions from them.
The rational of ratio analysis lies in the fact that it makes related information comparable.
A single figure by itself has no meaning but when expressed in terms of a related figure,
it yields significant inferences. For instance, the fact that net profits of a firm amount to
say, Rs. 10 lacks throws no light on its adequacy or otherwise. Figure of net profit has to
be considered in relation to other variables. How does it stand relation to sales? What
does it represent by way of return on total assets used or total capital employed? If
therefore net profits are shown in terms of their relationship with items such as sales,
assets, capital employed equity capital and so on; meaningful conclusions can be drawn
regarding their adequacy.
Ratio is very useful to for grasping the message of the financial statement and
understanding them. It helps to enlarge and understand the financial health and travel of
the business, it past performance makes it possible to forecast about future state of the
business. The ratio use to measure the effectiveness of the employment of resources is
termed as Activity Ratio or Turnover Ratio.
www.final-yearproject.com | www.finalyearthesis.com

7/18/2019 FYP Ratio Analysis Krishak Bharat ASH
http://slidepdf.com/reader/full/fyp-ratio-analysis-krishak-bharat-ash-56d51c337daec 20/69
20
These ratios are important measures of ratio analysis.
Ratio Formulae Result Interpretation
Stock
Turnover
(in days)
Average
Stock * 365/
Cost of
Goods Sold
= x
days
On average, you turn over the value of your entire
stock every x days. You may need to break this
down into product groups for effective stock
management.
Obsolete stock, slow moving lines will extend
overall stock turnover days. Faster production,
fewer product lines, just in time ordering will
reduce average days.
Receivables
Ratio
(in days)
Debtors *
365/
Sales
= x
days
It takes you on average x days to collect monies
due to you. If you’re official credit terms are 45
day and it takes you 65 days... why?
One or more large or slow debts can drag out the
average days. Effective debtor management will
minimize the days.
Payables
Ratio
(in days)
Creditors *
365/
Cost of Sales
(or
Purchases)
= x
days
On average, you pay your suppliers every x days.
If you negotiate better credit terms this will
increase. If you pay earlier, say, to get a discount
this will decline. If you simply defer paying your
suppliers (without agreement) this will also
increase - but your reputation, the quality of
service and any flexibility provided by your
suppliers may suffer.
www.final-yearproject.com | www.finalyearthesis.com

7/18/2019 FYP Ratio Analysis Krishak Bharat ASH
http://slidepdf.com/reader/full/fyp-ratio-analysis-krishak-bharat-ash-56d51c337daec 21/69
21
Current
Ratio
Total
Current
Assets/
Total
Current
Liabilities
= x
times
Current Assets are assets that you can readily turn
in to cash or will do so within 12 months in the
course of business. Current Liabilities are amount
you are due to pay within the coming 12 months.
For example, 1.5 times means that you should be
able to lay your hands on $1.50 for every $1.00
you owe. Less than 1 time e.g. 0.75 means that
you could have liquidity problems and be under
pressure to generate sufficient cash to meet
oncoming demands.
Quick Ratio
(Total
Current
Assets -
Inventory)/
Total
Current
Liabilities
= x
times
Similar to the Current Ratio but takes account of
the fact that it may take time to convert inventory
into cash.
Working
Capital
Ratio
(Inventory +
Receivables
- Payables)/
Sales
As %
Sales
A high percentage means that working capital
needs are high relative to your sales.
www.final-yearproject.com | www.finalyearthesis.com

7/18/2019 FYP Ratio Analysis Krishak Bharat ASH
http://slidepdf.com/reader/full/fyp-ratio-analysis-krishak-bharat-ash-56d51c337daec 22/69
22
Bad debts expressed as a percentage of sales.
Cost of bank loans, lines of credit, invoice discounting etc.
Debtor concentration - degree of dependency on a limited number of customers.
Once ratios have been established for your business, it is important to track them over
time and to compare them with ratios for other comparable businesses or industry sectors.
When planning the development of a business, it is critical that the impact of working
capital be fully assessed when making cash flow forecasts. Our financial planning
software packages - Ex-Plan and Cash flow Plan - can facilitate this task as they provide
for the setting of targets for receivables, payables and inventory.
ADVANTAGES OF RATIO ANALYSIS:
With the help of the ratio you can predict financial position of the company.
After showing the ratio its easy for bank to work with a company
We can compare two firm after seen there ratio
Its help to forecasting and make future plan of the company
With the help of the ratio we can locate the weak spot or problem of the company
Its also help in cost control in the firm
With the help of the ratio employee can know about the company and its helping
in their job.
www.final-yearproject.com | www.finalyearthesis.com

7/18/2019 FYP Ratio Analysis Krishak Bharat ASH
http://slidepdf.com/reader/full/fyp-ratio-analysis-krishak-bharat-ash-56d51c337daec 23/69
23
LITRERATURE REVIEW
www.final-yearproject.com | www.finalyearthesis.com

7/18/2019 FYP Ratio Analysis Krishak Bharat ASH
http://slidepdf.com/reader/full/fyp-ratio-analysis-krishak-bharat-ash-56d51c337daec 24/69
24
Review of previous study
Ratio-analysis is a concept or technique which is as old as accounting
concept. Financial analysis is a scientific tool. It has assumed important role as a
tool for appraising the real worth of an enterprise, its performance during a period
of time and its pit falls. Financial analysis is a vital apparatus for the interpretation
of financial statements. It also helps to find out any cross-sectional and time series
linkages between various ratios.
Unlike in the past when security was considered to be sufficient
consideration for banks and financial institutions to grant loans and advances,
nowadays the entire lending is need-based and the emphasis is on the financial
viability of a proposal and not only on security alone. Further all business
decision contains an element of risk. The risk is more in the case of decisions
relating to credits. Ratio analysis and other quantitative techniques facilitate
assessment of this risk.
Trend ratio involve a comparison of the ratio of a firm over time, that is present
ratio are compared with past ratio for the same firm. The comparison of the profitability
of a firm, say year 1 though 5 is an illustration of a trend ratio. Trend ratio indicate the
direction of change in the performance-improvement, deterioration or constancy-over the
years.
www.final-yearproject.com | www.finalyearthesis.com
7/18/2019 FYP Ratio Analysis Krishak Bharat ASH
http://slidepdf.com/reader/full/fyp-ratio-analysis-krishak-bharat-ash-56d51c337daec 25/69
25
RESEARCH METHODOLOGY
www.final-yearproject.com | www.finalyearthesis.com

7/18/2019 FYP Ratio Analysis Krishak Bharat ASH
http://slidepdf.com/reader/full/fyp-ratio-analysis-krishak-bharat-ash-56d51c337daec 26/69
26
Problem Statement:
How to measure the financial position of the company with the help of ratio
analysis?
Objective of Study:
To know the financial condition of the company.
Interpret the financial statement so that the strength and weakness of a firm
Historical performance and current financial condition can be determined.
To analyze the liquidity position of the company.
Throw light on a long term solvency of a firm.
Research Design:
A research design is the specification of method and procedure for accruing the
information needed. It is overall operational pattern of frame work of project that
stipulates what information is to be collected for source by that procedures
Descriptive Research design is appropriate for this study.
Descriptive study is used to study the situation. This study helps to describe the
situation. A detail descriptive about present and past situation can be found out by
the descriptive study. In this involves the analysis of the situation using the
secondary data.
www.final-yearproject.com | www.finalyearthesis.com

7/18/2019 FYP Ratio Analysis Krishak Bharat ASH
http://slidepdf.com/reader/full/fyp-ratio-analysis-krishak-bharat-ash-56d51c337daec 27/69
27
Data Collection:
This research study is based on secondary data, means data that are already
available i.e. the data which have been already collected and analyzed by some one else.
Secondary data are used for the study of Ratio analysis of this company. To
collect the data I have refer – Company annual report, annual magazine, last 5 year
balance sheet, and cash flow statements.
Another source of secondary data was in the form of reference books and Literature
Review published by third parties but available to the public. The World Wide Web
(Internet) was also an important source of information related to inventory
management.
Secondary Data Sources
Internal
Sources
External
Sources
Procedure
Manuals
ERP
Reports
Other
Reports
Reference
Books
World
Wide Web
www.final-yearproject.com | www.finalyearthesis.com

7/18/2019 FYP Ratio Analysis Krishak Bharat ASH
http://slidepdf.com/reader/full/fyp-ratio-analysis-krishak-bharat-ash-56d51c337daec 28/69
28
Method of Analysis:
Ratio analysis :
o Current Ratio
o Quick Ratio
o Inventory Ratio
o Inventory turnover Ratio
o Debtor turnover ratio
o Current assets turn over ratio
o Cash Ratio
o Debt equity ratio
o Debtor’s conversion period
o Net profit ability ratio
o Gross profit ability ratio
o Return on capital employed
o Inventory conversion period
o Raw material conversion period
o Work in progress conversion period
o Finished goods conversion period
www.final-yearproject.com | www.finalyearthesis.com

7/18/2019 FYP Ratio Analysis Krishak Bharat ASH
http://slidepdf.com/reader/full/fyp-ratio-analysis-krishak-bharat-ash-56d51c337daec 29/69
29
DATA ANALYSIS
AND
INTERPRETATION
www.final-yearproject.com | www.finalyearthesis.com

7/18/2019 FYP Ratio Analysis Krishak Bharat ASH
http://slidepdf.com/reader/full/fyp-ratio-analysis-krishak-bharat-ash-56d51c337daec 30/69
30
1) Ratio Calculations
{1.1} Current Ratio
Current Ratio =Current Assets
Current Liabilities
Current Assets
For year 04-05 = 171,204.66
05-06 = 142,100.26
06-07 = 157,699.67
07-08 = 185,178.30
Current Liabilities
For year 04-05 = 29,982.54
05-06 = 29,724.31
06-07 = 34,234.82
07-08 = 49,858.31
Current Ratio
For year 04 - 05 =171,204.66
= 5.71 : 129,982.54
05 - 06 =142,100.26
= 4.78 : 129,724.31
06 - 07 =157,699.67
= 4.61: 1
34,234.82
07 - 08 =185,178.30
= 3.71: 149,858.31
www.final-yearproject.com | www.finalyearthesis.com

7/18/2019 FYP Ratio Analysis Krishak Bharat ASH
http://slidepdf.com/reader/full/fyp-ratio-analysis-krishak-bharat-ash-56d51c337daec 31/69
31
Interpretation:
The ideal level of current ratio is 2:1.we shown too much higher ratio its good for the
company. Higher the current ratio, the larger is the amount of rupees available per rupees
of current liabilities, the more is the firm’s ability to meet current obliga tion and greater
is safety of fund of short term creditors.
Company’s current ratio is far better than its ideal level. So kribhco may take
some liabilities like bank overdraft, it’s not necessary but if management want. Overall
higher the better for company prestige
5.71
4.78 4.61
3.71
0
1
2
3
4
5
6
2004-05 2005-06 2006-07 2007-08
V a l u e
Year
Current Ratio
Ratio
www.final-yearproject.com | www.finalyearthesis.com

7/18/2019 FYP Ratio Analysis Krishak Bharat ASH
http://slidepdf.com/reader/full/fyp-ratio-analysis-krishak-bharat-ash-56d51c337daec 32/69
32
{1.2} Quick Ratio
Quick Ratio =Quick Assets
Current Liabilities- Bank OD
Quick Assets = Current asset – Inventories
For year 04 - 05 = 171,204.66 – 14,670.07 = 156,534.59
05 - 06 = 142,100.26 – 15,289.98 = 126,810.28
06 - 07 = 157,699.67 – 25,090.64 = 132,609.03
07 - 08 = 185,178.30 – 21,404.82 = 163,773.48
Quick Ratio
For year 04 – 05 =156,534.59
= 5.22 : 129,982.54
05 - 06 =126,810.28
= 4.27 : 129,724.31
06 – 07 =132,609.03
= 3.87 : 134,234.82
07 – 08 =
163,773.48
= 3.28 : 149,858.31
www.final-yearproject.com | www.finalyearthesis.com

7/18/2019 FYP Ratio Analysis Krishak Bharat ASH
http://slidepdf.com/reader/full/fyp-ratio-analysis-krishak-bharat-ash-56d51c337daec 33/69
33
Interpretation:
Ideal level of this ratio is 1:1.compare to current ratio stock is deducted from current
assets because we can’t convert stock into cash in short period of time. we can predict the
position more accurately compare to current ratio, Higher the ratio higher the company
liquidity position.
We can see that Quick ratio of the year 2008 is 3.28:1 which is lesser then all previous
years indicate company’s bad liquidity position.
5.22
4.273.87
3.28
0
1
2
3
4
5
6
2004-05 2005-06 2006-07 2007-08
V a l u e
Year
Quick Ratio
Ratio
www.final-yearproject.com | www.finalyearthesis.com

7/18/2019 FYP Ratio Analysis Krishak Bharat ASH
http://slidepdf.com/reader/full/fyp-ratio-analysis-krishak-bharat-ash-56d51c337daec 34/69
34
{1.3} Debt equity Ratio
Debt equity ratioLong term debt
Share holders equity
Long term debt=total liabilities-current liabilities
For years 04-05= 2095.42
05-06=2204.01
06-07=2312.54
07-08=2603.26
Share holders equity=equity/preference share capital+ discount on share
For year 04 - 05 = 2,691.57 + 5,519.91 / 2 = 4,105.74
05 - 06 = 5,519.91 + 6,376.20/ 2 = 5,948.05
06 - 07 = 6,376.20 + 14,696.98/ 2 = 10,536.59
07 - 08 = 14,696.98 + 11,020.20/ 2 = 12,858.59
Debt equity Ratio
For year 04 – 05 =
2095.42
= 0.514105.74
05 – 06 =2204.01
= 0.375,948.05
06 – 07 =2312.54
= 0.2210,536.59
07 – 08 =2603.26
= 0.2012,858.59
www.final-yearproject.com | www.finalyearthesis.com

7/18/2019 FYP Ratio Analysis Krishak Bharat ASH
http://slidepdf.com/reader/full/fyp-ratio-analysis-krishak-bharat-ash-56d51c337daec 35/69
35
Interpretation:
The D/E ratio is an important tool of financial analysis to appraise the financial
structure of a firm. It has important implication from the view point of the creditors,
owners, and the firm itself. The ratio reflect the relative contribution of creditors and
owners of business in its financing. A high ratio shows a large share of financing by
the creditors of the firm, a low ratio implies a small claim of creditors.
We can see that in above ratio that in 2004 ratio is 0.51 it implies that every
rupee of outside liabilities, the firm has two rupees owners capital. in 2005 ratio
decrease to 0.37 after every year its decreasing 0.22 and 0.20 respectively.
0
0.1
0.2
0.3
0.4
0.5
0.6
debt equity ratio
ratio
year
www.final-yearproject.com | www.finalyearthesis.com

7/18/2019 FYP Ratio Analysis Krishak Bharat ASH
http://slidepdf.com/reader/full/fyp-ratio-analysis-krishak-bharat-ash-56d51c337daec 36/69
36
{1.4} Inventory Ratio
Inventory Ratio =Inventory
Current Assets
Inventory Ratio
For year 04 - 05 =14,670.07
=0.09:1171,204.66
05 - 06 =15,289.98
=0.11:1142,100.26
06 - 07 =25,090,64
=0.16:1157,699.67
07 - 08 =21,404.82
=0.12:1185,178.30
0.09
0.11
0.16
0.12
0
0.02
0.04
0.06
0.08
0.1
0.12
0.14
0.16
0.18
2004-05 2005-06 2006-07 2007-08
V a l u e
Year
Inventory Ratio
Ratio
www.final-yearproject.com | www.finalyearthesis.com

7/18/2019 FYP Ratio Analysis Krishak Bharat ASH
http://slidepdf.com/reader/full/fyp-ratio-analysis-krishak-bharat-ash-56d51c337daec 37/69
37
Interpretation:
This ratio shows a relation between sales and inventory. It shows the no of time an
inventory is converted in to sales over a year. Altogether the inventory turnover ratio
means lesser the stock as compare to sales where as lesser the inventory turnover ratio
means more inventory in stock.
As we can see that in the year 2006-07 ratio is 16 % that is higher than 2004-05 &
2005-06 that is 11 % and 9 % respectively and also 2007-08 is 12 %. That means
investment in inventory is increase over the last 2 years, which gives bad indication and
in 2007-08 is good indication because investment is increase from 2004 to 2006 year.The
position of year shows a downward trend, which means that the enterprise is investing
more in its inventories as compare to its sale. Taking 1998 -99 has shown a 7.63 % of
down fall whereas the investment in inventory for the same year has shown a mere 4.19
% of downfall. This means there is proportionately more fall in sales in inventory. A
similar position follows in the year 1999 - 00 and 2000 - 01. In 1999 -00 the decrease in
sale 11.45 % where the inventory is increase with 23.17 %. In 2000 - 01 the pies is
decrease with 0.85 % and inventory is increase with 39.52 %. This shows that the
enterprise is fail to control the inventory which is not good for enterprise.
Here the inventory ratio decreases during the year here the inventory turnover
ratio decrease from 8.86 times to 6.31 times. This is not a good sign for the enterprise.
The number of days the inventory is held is increase. Presently it is about 57 days Where
as it was about its days in 1997 -'98 so we can say that the enterprise is suffering for its
position. The ratio is not -satisfactory.
www.final-yearproject.com | www.finalyearthesis.com

7/18/2019 FYP Ratio Analysis Krishak Bharat ASH
http://slidepdf.com/reader/full/fyp-ratio-analysis-krishak-bharat-ash-56d51c337daec 38/69
38
{1.5} Current Asset Turnover Ratio
Current Asset Turnover Ratio =Total Sales
Current Asset
Current Assets
For year 04-05 = 171,204.66
05-06 = 142,100.26
06-07 = 157,699.67
07-08 = 185,178.30
Total Sales
For year 04 -05 = 92,421.96
05 - 06 = 125,729.74
06 - 07 = 134,397.10
07 - 08 = 138,488.33
Current Asset Turnover Ratio
For year 04 – 05 =92,421.96
= 0.54 : 1
171,204.66
05 – 06 =125,729.74
= 0.88: 1142,100.26
06 – 07 =134,397.10
= 0.85 : 1157,699.67
07 – 08 =138,488.33
= 0.75 : 1185,178.30
www.final-yearproject.com | www.finalyearthesis.com

7/18/2019 FYP Ratio Analysis Krishak Bharat ASH
http://slidepdf.com/reader/full/fyp-ratio-analysis-krishak-bharat-ash-56d51c337daec 39/69
39
Interpretation: This ratio indicates the efficiency with which current asset turn intosales. A higher ratio implies by and large more efficient use of fund. Thus a high turnover
ratio indicates reduced lock-up of fund in current assets. An analysis of this ratio over a
period of time reflects working capital management of a firm.
Current assets turn over ratio is good for the years of 2005-06, 2006-07, 2007-08 that is
0.88:1, 0.85:1 and 0.75:1 respectively. For the year 2004-05 it was decrease because
company’s current assets are higher than its liability.
But we can say that the company’s position is better then the last few years that is 2005-
06 and 2006-07.
0.54
0.88 0.850.75
00.1
0.20.30.40.50.60.70.80.91
2004-05 2005-06 2006-07 2007-08
V a l u e
Year
Current assets Turn over Ratio
Ratio
www.final-yearproject.com | www.finalyearthesis.com

7/18/2019 FYP Ratio Analysis Krishak Bharat ASH
http://slidepdf.com/reader/full/fyp-ratio-analysis-krishak-bharat-ash-56d51c337daec 40/69
40
{1.6} Cash Ratio
Cash Ratio =Cash in Hand + Cash at bank + Current investment
Liquid Assets
Cash in Hand + Cash at bank + Current investment
For year 04 - 05 = 124,761.99+14,670.07 = 139,432.06
05 - 06 = 93,558.64 +15,289.98 = 108,848.62
06 - 07 = 80,241.37 +25,090.64 = 105,332.01
07 - 08 = 90,504.27 +21,404.82 = 111,909.09
Liquid Assets = Current Liabilities – Proposed Dividend – Tax on Dividend
For year 04 - 05 = 29,982.54-7,450.02 = 22,532.5205 - 06 = 29,724.31-7,846.69 = 21,877.62
06 - 07 = 34,234.82-7,891.44 = 26,343.38
07 - 08 = 49,858.31-7,920.50 = 41,937.81
Cash Ratio
For year 04 – 05 =139,432.06
= 6.18:122,532.52
05 – 06 =108,848.62
= 4.98:121,877.62
06 – 07 =105,332.01
= 3.99(8):126,343.38
07 – 08 =
111,909.09
=2.67:141,937.81
www.final-yearproject.com | www.finalyearthesis.com

7/18/2019 FYP Ratio Analysis Krishak Bharat ASH
http://slidepdf.com/reader/full/fyp-ratio-analysis-krishak-bharat-ash-56d51c337daec 41/69
41
Interpretation:
The cash ratio is perhaps the most stringent measure of liquidity indeed. One can argue
that it is overly stringent lack of immediate can may not matter it. The firm can starch its
payment or borrow many of short notice cash and bank balance and short term
marketable security and liable assets of firm financial analysis looks at cash ratio which is
define.
Management has to maintain a level of cash ratio so that cash is required urgently
they can get it. Too high level of cash loss the opportunity to earn interest on that capital.
We can see that Cash ratio is initially high in the year of 2004-05 that is 6.18.
But its start decreasing from next year. it was 4.98. and next years also decrease. In
current year is 2.67:1 thought its cash and bank balance is high. This level is well and
good for the company.
6.18
4.98
3.99
2.67
0
1
2
3
4
5
6
7
2004-05 2005-06 2006-07 2007-08
V a l u e
Year
Cash Ratio
Ratio
www.final-yearproject.com | www.finalyearthesis.com

7/18/2019 FYP Ratio Analysis Krishak Bharat ASH
http://slidepdf.com/reader/full/fyp-ratio-analysis-krishak-bharat-ash-56d51c337daec 42/69
42
{1.7} Debtor’s Turnover Ratio
Debtor’s Turnover Ratio = Credit Sales
Ave. Debtors
Credit Sales= Credit sale are 75% 0f Total sale.
For year 04 - 05 = 55,453.18
05 - 06 = 75,443.84
06 - 07 = 80,638.26
07 - 08 = 83,093
Ave. Debtors = (Opening of debtors + Closing of Debtors) / 2
For year 04 - 05 = 20,719.65 + 7,723.20 / 2 = 14,221.43
05 - 06 = 7,723.20 + 14,079.60 / 2 = 10,901.40
06 - 07 = 14,079.60 + 35,736.84 / 2 = 24,908.22
07 - 08 = 35,736.84 + 61,285.98 / 2 = 20,961.41
Debtor’s Turnover Ratio
For year 04 – 05 =55,453.18
= 3.90 : 114,221.43
05 – 06 =75,443.84
= 6.92 : 110,901.40
06 – 07 =80,638.26
= 3.24 : 124,908.22
07 – 08 =83,093
= 3.96: 120,961.41
www.final-yearproject.com | www.finalyearthesis.com
7/18/2019 FYP Ratio Analysis Krishak Bharat ASH
http://slidepdf.com/reader/full/fyp-ratio-analysis-krishak-bharat-ash-56d51c337daec 43/69
43
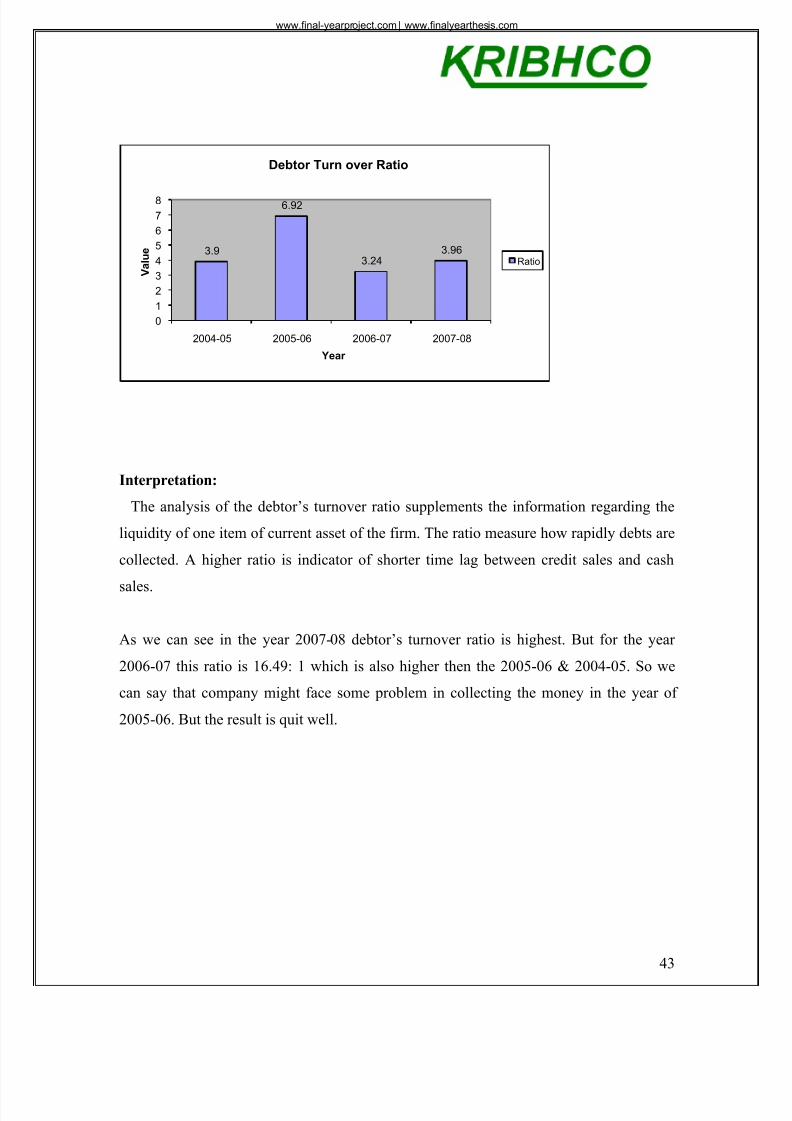
Interpretation:
The analysis of the debtor’s turnover ratio supplements the information regarding the
liquidity of one item of current asset of the firm. The ratio measure how rapidly debts are
collected. A higher ratio is indicator of shorter time lag between credit sales and cash
sales.
As we can see in the year 2007-08 debtor’s turnover ratio is highest. But for the year
2006-07 this ratio is 16.49: 1 which is also higher then the 2005-06 & 2004-05. So we
can say that company might face some problem in collecting the money in the year of
2005-06. But the result is quit well.
3.9
6.92
3.243.96
0
1
2
3
4
5
6
7
8
2004-05 2005-06 2006-07 2007-08
V a l u e
Year
Debtor Turn over Ratio
Ratio
www.final-yearproject.com | www.finalyearthesis.com

7/18/2019 FYP Ratio Analysis Krishak Bharat ASH
http://slidepdf.com/reader/full/fyp-ratio-analysis-krishak-bharat-ash-56d51c337daec 44/69
44
(1.8) Debtors conversion Period:
Debtors Conversion Period =Debtors
x 360Credit Sales
Debtors
For year 04 – 05 = 7,723.20
05 – 06 = 15,252.95
06 – 07 = 35,736.84
07 – 08 = 61,285.98
Credit Sales = 60% 0f Total sale
For year 04 – 05 = 55,453.18
05 – 06 = 75,443.84
06 – 07 = 80,638.26
07 – 08 = 83,093
Debtors Conversion Period
For year 04 - 05 = 7723.20 x 360 = 50.14 Days55,453.18
05 - 06 =15252.95
x 360 = 72.78 Days75,443.84
06 - 07 =35736.84
x 360 = 159.54 Days80,638.26
07 – 08 =
61285.98
83,093 x 360 = 265.52 Days
www.final-yearproject.com | www.finalyearthesis.com

7/18/2019 FYP Ratio Analysis Krishak Bharat ASH
http://slidepdf.com/reader/full/fyp-ratio-analysis-krishak-bharat-ash-56d51c337daec 45/69
45
Interpretation:
It measures how long it takes to collect amounts from debtors. The actual collection
period can be compared with the stated credit terms of the company. If it is longer than
those terms, then this indicates some insufficiency in the procedures for collection debts.
This ratio indicates the speed with which debtors/accounts receivable are being
collected. The higher the turnover ratio and the shorter the average collection period, the
better is the trade credit management and the better is the liquidity of debtors. On the
other hand, low turnover ratio and long collection period reflect delayed payment by
debtors. In general, therefore, short collection period (high turnover ratio) is preferable.
Here we can see that for the year 2007-08 debtors conversion period is 266
days, which is higher compare to others. But here we can see that for the last three years
company receive the money within their decided well specified period. Here for the year
2004-05 Debtors conversion period is less. But for the year 2005-06 debtor’s conversion
period increase by 23 days and than increase year by year. Company need to control
receivable management.
3044
96
159
0
20
40
60
80100
120
140
160
180
2004-05 2005-06 2006-07 2007-08
D a y s
Years
Debtor's conversion period
Days
www.final-yearproject.com | www.finalyearthesis.com

7/18/2019 FYP Ratio Analysis Krishak Bharat ASH
http://slidepdf.com/reader/full/fyp-ratio-analysis-krishak-bharat-ash-56d51c337daec 46/69
46
{1.9} Inventory Turnover Ratio
Inventory Turnover Ratio =Cost of Goods Sold
Ave. Inventory
Cost of Goods Sold = Total Sales – Gross Profit
For year 04 -05 = 92,421.96 – 20,551.76 = 71,870.20
05 - 06 = 125,729.74 – 29,730.20 = 95,999.54
06 - 07 = 134,397.10 – 24,916.88 = 1,09,480.22
07 - 08 = 138,488.33 – 29,492.74 = 1,08,995.59
Ave. Inventories = (Opening stock of inventory + Closing stock of Inventory)/ 2
For year 04 - 05 = 2,691.57 + 5,519.91 / 2 = 4,105.74
05 - 06 = 5,519.91 + 6,376.20/ 2 = 5,948.05
06 - 07 = 6,376.20 + 14,696.98/ 2 = 10,536.59
07 - 08 = 14,696.98 + 11,020.20/ 2 = 12,858.59
Inventory Turnover Ratio
For year 04 – 05 =71,870.20
= 17.50 : 14,105.74
05 – 06 =95,999.54
= 16.14 : 15,948.05
06 – 07 =1,09,480.22
= 10.39 : 110,536.59
07 – 08 =1,08,995.59
= 8.48 : 112,858.59
www.final-yearproject.com | www.finalyearthesis.com

7/18/2019 FYP Ratio Analysis Krishak Bharat ASH
http://slidepdf.com/reader/full/fyp-ratio-analysis-krishak-bharat-ash-56d51c337daec 47/69
47
Interpretation:
Inventory stock turnover ratio measure how quickly inventory is sold. It is a test of
efficient inventory management. To judge whether the ratio of a firm is satisfactory or
not, higher ratio shows efficient use of inventory.
As we can see from the graph that in the year 2004-05 ratio is 17.50: 1 which higher then
all the previous years, so we can say that inventory is converted into finished goods
highest in this year which indicate the highest efficient use of the inventory. But in case
of Kribhco the Ratio is decreased year by year.
17.516.14
10.398.48
02468
101214161820
2004-05 2005-06 2006-07 2007-08
V a l u e
Year
Inventory Turn over Ratio
Ratio
www.final-yearproject.com | www.finalyearthesis.com

7/18/2019 FYP Ratio Analysis Krishak Bharat ASH
http://slidepdf.com/reader/full/fyp-ratio-analysis-krishak-bharat-ash-56d51c337daec 48/69
48
{1.10} Net profit ability Ratio
Net Profit Ability RatioNet profit
Total sales
Net profit for the year 04-05= 140.59
05-06=192.45
06-07=193.24
07-08=209.24
Sales for the year 04-05=924.22
05-06=1257.30
06-07=1343.97
07-08=1384.88
04-05
140.59
15.21924.22
05-06192.45
15.301257.30
06-07193.24
14.381343.97
07-08209.20
15.101384.88
www.final-yearproject.com | www.finalyearthesis.com

7/18/2019 FYP Ratio Analysis Krishak Bharat ASH
http://slidepdf.com/reader/full/fyp-ratio-analysis-krishak-bharat-ash-56d51c337daec 49/69
49
Interpretation:
The net profit margin is indicate of managment’s ability to operate the business
with sufficient success not only to recover from revenues of the period, the cost of
merchandise or services, the expenses of operating the business and the cost of the
borrowed funds, but also to leave a margin of reasonable compensation to the owners for
providing their capital at risk. The ratio of net profit to sales essential expresses the cost
price effectiveness of the operation.
In 2004 company’s profit is 15% and after 4 also they maintain this profit
margin.so company has stable profit margin in this 4 years.
0
2
4
6
8
10
12
14
16
18
net profit
ratio ratio
ratio ratio
ratio year
www.final-yearproject.com | www.finalyearthesis.com

7/18/2019 FYP Ratio Analysis Krishak Bharat ASH
http://slidepdf.com/reader/full/fyp-ratio-analysis-krishak-bharat-ash-56d51c337daec 50/69
50
{1.11} Gross profit ability Ratio
Gross Profit Ability RatioGross profit
Total sales
Gross profit for the year 04-05= 272.14
05-06=231.53
06-07=280.20
07-08=185.83
Sales for the year 04-05=924.22
05-06=1257.30
06-07=1343.97
07-08=1384.88
04-05272.14
29%924.22
05-06231.53
18%1257.30
06-07280.20
21%1343.97
07-08185.83
13%1384.88
www.final-yearproject.com | www.finalyearthesis.com

7/18/2019 FYP Ratio Analysis Krishak Bharat ASH
http://slidepdf.com/reader/full/fyp-ratio-analysis-krishak-bharat-ash-56d51c337daec 51/69
51
Interpretation:
Gross profit is the result of the relationship between prices, sales volume and
costs. A change in the gross margin can be brought about by changes in any of these
factors. The gross margin represent the limit beyond which fall in sales prices are
outside the tolerance limit.
In this company in 2004-05 gross profit margin is 29%,its good for the
every company, but after one year its was fallen down to 18%. In 2007-08 margin
was very low compare to previous year.
0
5
10
15
20
25
30
35
1 2 3 4 5 6
Series3
Series2
Series1
www.final-yearproject.com | www.finalyearthesis.com

7/18/2019 FYP Ratio Analysis Krishak Bharat ASH
http://slidepdf.com/reader/full/fyp-ratio-analysis-krishak-bharat-ash-56d51c337daec 52/69
52
(1.12)Return on capital employed
Return on capital employednet profit
Share capital
Net profit for the year 04-05= 140.59
05-06=192.45
06-07=193.24
07-08=209.20
Share capital=equity/ preference share capital+ discount on share
For the year 04-05= 2691.57+5519.91/2=4105.74
05-06=5519.91+6376.20/2=5948.05
06-07=6376.20+14698.98/2=10536.59
07-08=14696.98+11020.20/2=12858.59
04-05140.59
3.44105.74
05-06192.45
3.25948.05
06-07193.24
1.8
10536.59
07-08209.20
1.612858.59
www.final-yearproject.com | www.finalyearthesis.com

7/18/2019 FYP Ratio Analysis Krishak Bharat ASH
http://slidepdf.com/reader/full/fyp-ratio-analysis-krishak-bharat-ash-56d51c337daec 53/69
53
Interpretation:
Here the profit related to the total capital employed. The term capital employed
refers to long term funds supplied by the creditors and owners of the firm. It can be
computed in two ways. First, It is equal to non-current liabilities plus owners of the firm.
The Higher the ratio, the more efficient is the use of capital employed.
in 2004-05 ratio of capital employed is 3.4% its better than other year. In
2007-08 ratio was decrease to 1.6%. its was half compare to 2004-05.
0
0.5
1
1.5
2
2.5
3
3.5
4
capital employed
ratio
year
www.final-yearproject.com | www.finalyearthesis.com

7/18/2019 FYP Ratio Analysis Krishak Bharat ASH
http://slidepdf.com/reader/full/fyp-ratio-analysis-krishak-bharat-ash-56d51c337daec 54/69
54
(1.14) Inventory Conversion Period
Inventory Conversion Period =Ave. Inventory
x 360Cost of Good Sold
Ave. Inventories = (Opening stock of inventory + Closing stock of Inventory) / 2
For year 04 - 05 = (2691.57 + 5519.91 ) / 2 = 4105.74
05 – 06 = (5519.91 + 6376.20 ) / 2 = 5948.05
06 – 07 = (6376.20 + 14696.98 ) / 2 = 10536.59
07 – 08 = (14696.98 + 11020.20 ) / 2 = 12858.59
Cost of Sales = Total Sales – Gross Profit
For year 04 – 05 = 92421.96 – 20551.76 = 71870.20
05 – 06 = 125729.74 – 29730.20 = 95999.54
06 – 07 = 134397.10 – 24916.88 = 109480.22
07 – 08 = 138488.33 – 29492.74 = 108995.59
Inventory Conversion Period
For year 04 - 05 =4105.74
x 360 = 42.47 Days71870.20
05 - 06 =5948.05
x 360 = 34.65 Days95999.54
06 - 07 =10536.59
x 360 = 22.30 Days109480.22
07 - 08 =12858.59
x 360 = 20.57 Days108995.59
www.final-yearproject.com | www.finalyearthesis.com

7/18/2019 FYP Ratio Analysis Krishak Bharat ASH
http://slidepdf.com/reader/full/fyp-ratio-analysis-krishak-bharat-ash-56d51c337daec 55/69
55
Interpretation:
Inventory conversion period means, time taken to convert raw material in to finished
goods to goods sold. It indicates how effectively and efficiently an inventory is
controlled. Lesser the inventory conversion period more efficient and effective use of
inventory.
Here we can see that for the year 2004-05 inventory conversion periods is 21 days which
is less then the rest of year. As we can see from the graph for the year 2007-08 inventory
conversion period is 42 days which is highest among the collected data. But as year
passing it increases. And we can find that it was maximum for the year 2007-08. So we
can say that they are able to substantially increase the inventory holding period from 21
days to 42 days. It may happen because the average inventory holding period has been
increase and also the cost of goods sold decrease.
0
5
10
15
2025
30
35
40
45
Year 2004-05 2005-06 2006-07 2007-08
Inventory Conversion period
Series1
Series2
www.final-yearproject.com | www.finalyearthesis.com

7/18/2019 FYP Ratio Analysis Krishak Bharat ASH
http://slidepdf.com/reader/full/fyp-ratio-analysis-krishak-bharat-ash-56d51c337daec 56/69
56
(1.14) Raw material conversion period
Raw Material Conversion Period = Raw material Inventory ÷Raw Material consumption
360
Raw Material Inventories
For year 04 - 05 = 5,519.91
05 - 06 = 6,376.20
06 - 07 = 14,696.98
07 - 08 = 11,020.20
Raw Material Consumption
For year 04 - 05 = 39,150.61
05 - 06 = 47,231.80
06 - 07 = 47,310.96
07 - 08 = 65,404.97
Raw Material Conversion Period
For year 04 - 05 = 5,519.91 ÷39,150.61
= 50.75 Days360
05 - 06 = 6,376.20 ÷47,231.80
= 48.60 Days360
06 - 07 = 14,696.98 ÷
47,310.96
= 80.98 Days360
07 - 08 = 11,020.20 ÷65,404.97
= 60.65 Days360
www.final-yearproject.com | www.finalyearthesis.com

7/18/2019 FYP Ratio Analysis Krishak Bharat ASH
http://slidepdf.com/reader/full/fyp-ratio-analysis-krishak-bharat-ash-56d51c337daec 57/69
57
Interpretation:
Raw material conversion period indicate the smoothness of the production or we can say
that how much time taken by the production to convert raw material in to finished good.
Smaller the raw material conversion period higher the efficiency of production.
In this case we can say that for the year of 2004-05 and 2005-06 raw material conversion
periods are 51 days and 49 days respectively which is lower then the others years. Lowest
conversion period is recorded for the year of 2004-05 because in this year raw material
inventories is less and raw material consumption is highest. But as we can see that in the
year 2006-07 & 2007-08 raw material inventories increase dramatically compare to
previous year and consumption per day was reduced so here raw material conversion
period is increase but we can control this by holding the inventories lower and increase
the raw material consumption per day.
Raw Material Conversion Period
50.75 48.6
111.83
60.65
0
20
40
60
80
100
120
2004- 05 2005-06 2006- 07 2007-08
Year
D a y s
Days
www.final-yearproject.com | www.finalyearthesis.com

7/18/2019 FYP Ratio Analysis Krishak Bharat ASH
http://slidepdf.com/reader/full/fyp-ratio-analysis-krishak-bharat-ash-56d51c337daec 58/69
58
(1.15) work in process conversion period
Work in Process Conversion Period =Work in process
Inventory÷
Cost of Production
360
Work in Process Inventories
For year 04 - 05 = 36.96
05 - 06 = 40.94
06 - 07 = 46.13
07 - 08 = 61.77
Cost of Production
For year 04 - 05 = 61,732.20
05 - 06 = 1,03,463.13
06 - 07 = 1,28,279.30
07 - 08 = 1,48,885.75
Work in Process Conversion Period
For year 04 - 05 = 36.96 ÷61,732.20
= 0.22 Days360
05 - 06 = 40.94 ÷1,03,463.13
= 0.14 Days360
06 - 07 = 46.13 ÷ 1,28,279.30 = 0.13 Days
360
07 - 08 = 61.77 ÷1,48,885.75
= 0.15 Days360
www.final-yearproject.com | www.finalyearthesis.com

7/18/2019 FYP Ratio Analysis Krishak Bharat ASH
http://slidepdf.com/reader/full/fyp-ratio-analysis-krishak-bharat-ash-56d51c337daec 59/69
59
Interpretation:
It indicates the work-in-process inventory (can say semi-finished good) converted in to
finished goods. Its also contain the production cost holding by it.
Here we can say that for the year 2004-05 due to high work in process inventory. Work in
process conversion period is low even though the cost of production is too high compare
to others. For next years it was decreased by day to day because, work in process
inventory is high compare to all previous year. Work in process conversion period can becontrolled by keeping work in process inventory low.
But in case of Kribhco the Work-in-process conversion periods are not a single day r say
it is minor because in Kribhco the duration in convert Semi finished goods to finished
goods is very less
Work in Process Conversion Period
0.22
0.14 0.13 0.15
0
0.05
0.1
0.15
0.2
0.25
2004- 05 2005- 06 2006- 07 2007- 08
Year
D a y s
Days
www.final-yearproject.com | www.finalyearthesis.com

7/18/2019 FYP Ratio Analysis Krishak Bharat ASH
http://slidepdf.com/reader/full/fyp-ratio-analysis-krishak-bharat-ash-56d51c337daec 60/69
60
(1.16 )finished good conversion period
Finished Goods Conversion Period = Finished Goods Inventory ÷Cost of Goods Sold
360
Finished Goods Inventories
For year 04 - 05 = 5,548.10
05 - 06 = 6,399.69
06 - 07 = 14,650.85
07 - 08 = 10,958.76
Cost of Goods Sold
For year 04 - 05 = 58,870.52
05 - 06 = 1,02,611.14
06 - 07 = 1,02,028.14
07 - 08 = 1,52,577.84
Finished Goods Conversion Period
For year 04 - 05 = 5,548.10 ÷58,870.52
=33.93 Days360
05 - 06 = 6,399.69 ÷1,02,611.14
=22.45 Days360
06 - 07 = 14,650.85 ÷1,02,028.14
=43.94 Days360
07 - 08 = 10,958.76 ÷1,52,577.84
=25.85 Days360
www.final-yearproject.com | www.finalyearthesis.com

7/18/2019 FYP Ratio Analysis Krishak Bharat ASH
http://slidepdf.com/reader/full/fyp-ratio-analysis-krishak-bharat-ash-56d51c337daec 61/69
61
Inventory Conversion =
Raw material Conversion period
+ Work in progress conversion period
+ Finish goods conversion period
For year 04 - 05 = 50.75 + 0.22 + 33.93 = 84.90 Days
05 - 06 = 48.60 + 0.14 + 22.45 = 71.19 Days
06 – 07 = 80.83 + 0.13 + 43.94 = 124.90 Days
07 - 08 = 60.65 + 0.15 + 25.85 = 86.65 Days
www.final-yearproject.com | www.finalyearthesis.com

7/18/2019 FYP Ratio Analysis Krishak Bharat ASH
http://slidepdf.com/reader/full/fyp-ratio-analysis-krishak-bharat-ash-56d51c337daec 62/69
62
Debtors Conversion Period
For year 04 - 05 =7,723.20
x 360 =50.14 Days55,453.18
05 - 06 =15,252.84
x 360 = 72.78 Days75,443.84
06 - 07 =35,736.84
x 360 =159.54 Days80,638.26
07 - 08 = 61,285.98 x 360 =265.52 Days83,093
Gross Operating Cycle Period = Inventory Conversion Period +
Debtors’ conversion period
For year 04 - 05 = 351.65 + 50.14 = 106.4 Days
05 - 06 = 283.90 + 72.78 = 74.95 Days
06 - 07 = 144.19 + 159.54 = 57.22 Days
07 - 08 = 134.90 + 265.52 = 74.30 Days
www.final-yearproject.com | www.finalyearthesis.com

7/18/2019 FYP Ratio Analysis Krishak Bharat ASH
http://slidepdf.com/reader/full/fyp-ratio-analysis-krishak-bharat-ash-56d51c337daec 63/69
63
Conclusion
And
Recommendations
www.final-yearproject.com | www.finalyearthesis.com

7/18/2019 FYP Ratio Analysis Krishak Bharat ASH
http://slidepdf.com/reader/full/fyp-ratio-analysis-krishak-bharat-ash-56d51c337daec 64/69
64
Conclusion
From the study of ratio analysis, I have found that it is a very difficult task to
maintain ideal ratios in such a big organization. There are various factorsaffecting while managing ratio analysis like credit policy, inventory management
system , production cycle etc. But it is very important to manage it every
situation.
Fertilizer is a product whose price is highly controlled by Government. of India
Where by it may not be easily possible to increase the sales. Because the product
is sold as per Government of India allocated area. But efforts can surely be made
to reduce the cost factors. It is suggested that cost may highly be control through
effective budgeting and continuous analysis there off.
IFFCO playing a big role in deciding price factors, so kribhco can’t set its own
price and sale to directly to farmers
Kribhco’s current ratio is far more better than its ideal ratio, so in the future if
kribhco can borrow some money from the market, if It’s necessary.
Kribhco’s net profit is almost 15% every year its very good for the company
who’s main objective is to not earn a profit
In Kribhco all financial year have the double current assets compare to current
liabilities & all years satisfy sound financial condition requirement & more
liquidity of company indicate safe and sound position.
Inventory conversion period has continuously decreased from the year 2004-05 to
2007-08.
KRIBHCO have fix inventory management system.
www.final-yearproject.com | www.finalyearthesis.com

7/18/2019 FYP Ratio Analysis Krishak Bharat ASH
http://slidepdf.com/reader/full/fyp-ratio-analysis-krishak-bharat-ash-56d51c337daec 65/69
65
Liquidity position of a company can be ensured by the current ratio, it can be said
that if the ratio is 2: 1 then the company’s liquidity position is sound. In the year
2004-05 only the company liquidity position is good.
KRIBHCO strongly follows the credit policy but Receivable period is more
Compare to Creditor’s period.
www.final-yearproject.com | www.finalyearthesis.com

7/18/2019 FYP Ratio Analysis Krishak Bharat ASH
http://slidepdf.com/reader/full/fyp-ratio-analysis-krishak-bharat-ash-56d51c337daec 66/69
66
Suggestions:
If KRIBHCO can directly contact to the farmers and sell them
without interfere of government or IFFCO. So it can increase its
profit margin
In case of KRIBHCO they need to change their credit policy, because in this case
we can see that the average creditor’s credit period is 30 days in raw materials and
10 days in case of spares. Where as debtor’s credit period (Bills receivable) is for
45 days. Here debtor’s credit period is more then creditor’s credit period which
need to be modified.
It is possible because KRIBHCO is the only company in SAARC countries who
are producing Urea and also have biggest Ammonia plant all over India. So we
can say they have the monopoly in urea and also they are the market leader in
case of Ammonia. So either they can increase the period of creditor’s credit
period or decease the debtor’s credit period, they can shorten collection period.
KRIBHCO have the 60:40 ratio of credit to cash sales which also can be modified
by taking advance payment from the customer and it can be used to maintain
liquidity for daily cash need raw material conversion period.
Net operating cycle period was increase which need to be maintain as low as
possible by reduce raw material conversion period, debtor’s conversion period ,
finish good conversion period ect. It helps to keep down the Net operating cycle
www.final-yearproject.com | www.finalyearthesis.com

7/18/2019 FYP Ratio Analysis Krishak Bharat ASH
http://slidepdf.com/reader/full/fyp-ratio-analysis-krishak-bharat-ash-56d51c337daec 67/69
67
.
Limitations of Study:
During the study of this project some limitation I have found which are as below,
This research is based on the secondary data and during the study of working
capital there are so many data required from various department which was not
disclosed by the respective department, for example budget of the current
financial year.
Some approx data provided from the various departments for the calculation
purpose, e.g. Carrying cost, Ordering cost ECT, inter firm comparision which
were not calculated by the respective departments.
Available information for the study of ratio analysis is limited,
www.final-yearproject.com | www.finalyearthesis.com

7/18/2019 FYP Ratio Analysis Krishak Bharat ASH
http://slidepdf.com/reader/full/fyp-ratio-analysis-krishak-bharat-ash-56d51c337daec 68/69
68
BIBLIOGRAPHY
Books
1) I.M.PANDEY- 2000,FINANCIAL MANAGEMENT, EIGHT EDITION
VIKASH PUBLISING HOUSE PRIVATE LTD.
2) R.S.N.PILLAI & BAGHAVATHI, – DEC. 2005, MANAGEMENT
ACCOUNTING THIRD EDITION S.CHAND PUBLICATION.
3) DONALD R. COOPER & PAMELA S. SCHINDLER ,BUSINESS
RESEARCH METHODS EIGHT EDITION , TATA Mc. GRAW-HILL
EDITION.
4) M Y KHAN, P K JAIN 2008,FINANCIAL MANAGEMENT FIFTH
EDITION-,TATA MCGRAW-HILL PUBLISHING COMPANY LIMITED.
Reports
Company Annual Report from 2004-05 to 2007-08.
Inventory statues report maintain by stores
Purchase Order records
Cash flow statements.
Websites
www.kribhco.net
www.kribhcoindia.com
www.kribhco.org.
WWW.KRIBHCOSURAT .COM
WWW.WIKIPEDIA.COM
www.final-yearproject.com | www.finalyearthesis.com

7/18/2019 FYP Ratio Analysis Krishak Bharat ASH
http://slidepdf.com/reader/full/fyp-ratio-analysis-krishak-bharat-ash-56d51c337daec 69/69
www.final-yearproject.com | www.finalyearthesis.com