fyffes plcinvestors.fyffes.com/fyffesplc/uploads/finreports/...april/may 2016 fyffes plc investor...
TRANSCRIPT

Investor RelationsApril/May 2016
Fyffes plc

Investor Relations | April/May 2016
Fyffes overview
Operates in the international fresh produce sector- Portfolio products – bananas, pineapples, melons, mushrooms
- Areas of activity – Europe, US, Canada, Central & South America
Market leader in 3 of our 4 product categories
Integrated supply chain – production, procurement, shipping, ripening, distribution and marketing
Oldest fruit brand in the world dating back to 1929History extends to 125+ years
Dual listing on Irish (ESM) and London (AIM) stock exchanges
1

Investor Relations | April/May 2016
2016 Acquisition activity | Highline Produce
2
• Fits Fyffes strategic objective of adding a 4th product to our portfolio
• Fits criteria of being an established, successful, integrated operator in a category with significant scale
• Fully integrated Eastern Canada based mushroom business
• Experienced management team. 55 year history
• 4 owned production facilities and 1 leased distribution centre
• Debt free valuation of CAD$145m (€98m)
• Equivalent to 8.1 times pro forma annualised EBITDA of CAD$18m (€12m)
• Immediately accretive
• Net debt post acquisition less than 2.5 times EBITDA. Will reduce to less than 2 times within 2 years

Investor Relations | April/May 2016 3
Purchased additional melon farming assets in Guatemala
• Comprises 2,500 hectares of leased land and 4 packaging stations
• Adds c.25% to existing capacity in melon category
• Investment of US$18.3m plus US$10m-US$12m incremental working capital
Purchased banana farm in Costa Rica
• Investment of US$15m
• Have been operating farm since early 2014 under lease arrangement
• Accounts for c.3% of Fyffes banana volumes
2015 Acquisition activity | Farming assets

Investor Relations | April/May 2016 44
EPS - € cent
15.320.7 21.3
23.2
30.5 32.7
45.8
49.0-55.0
0
10
20
30
40
50
60
70
2008 2009 2010 2011 2012 2013 2014 2015 2016
EBITA - €’M
40.1
Growth rate 2008 - 2015
Absolute CAGR
EBITDA 198% 16.9%
EBITA 200% 17.0%
EPS 222% 18.2%
18.9
25.7 26.929.6
40.0 40.0
56.1
63.0-69.0
0
10
20
30
40
50
60
70
80
2008 2009 2010 2011 2012 2013 2014 2015 2016
48.2
EBITDA - €’M
3.95
5.19 5.506.05
8.55 8.82
12.73
12.80-14.50
0.00
2.00
4.00
6.00
8.00
10.00
12.00
14.00
16.00
18.00
2008 2009 2010 2011 2012 2013 2014 2015 2016
11.17
2016 target ranges updated 29 April 2016, including impact of Highline for 9 months post acquisition
Fyffes earnings history & 2016 targets

Investor Relations | April/May 2016
Fyffes | Market position
5
Europe North AmericaMarket size
(Cases)Market size(Cases/lbs)
Fyffes 46m 10m (JV)
Fyffes 7m 3m
Fyffes N/A 17m
#1
#3
-
300m
75m
-
250m
80m
50m
#3
#1
#4
Fyffes N/A 58m
- - 1,100m lbs#4

Investor Relations | April/May 2016
Competitive advantages
• Scale of business
• Relationships with “best in class” suppliers
• Strong brand recognition
• Valuable asset base
• State of the art infrastructural network
• Strong customer relationships
6

Investor Relations | April/May 2016
Focus on efficient capital allocation
Increasing dividend
Sharebuy-backs
Acquisitions at all points in the
supply chain and organic growth
7
• Key medium term focus is on growing the business through M&A• Believe further consolidation is needed in industry

Investor Relations | April/May 2016
Shareholder return
8
Dividends€’M
Buybacks€’M
Total€’M
2007 5.3 1.7 7.0
2008 5.2 5.3 10.6
2009 5.7 - 5.7
2010 5.9 5.3 11.2
2011 5.9 12.7 18.6
2012 5.9 - 5.9
2013 6.2 - 6.2
2014 6.6 3.0 9.6
2015 7.3 - 7.3
Total 54.0 28.1 82.1
• 2015 dividend 2.745 cent (+15.0%)
• Compound annual growth in dividend 2008-2015 of 9.0%
• Dividend yield 1.7% based on 160 cent share price

Investor Relations | April/May 2016
Summary
Strong 2015 result. EBITA up 14.2% to €45.8m
Acquisition of Highline Produce Limited for CAD$145m (€98m)
Revised 2016 target EBITA range of €49m-€55m(including Highline for 9 months post acquisition)
Focus on future development and shareholder value
9

Investor Relations | April/May 2016 10
Overview of operations
Investor Relations | April/May 2016
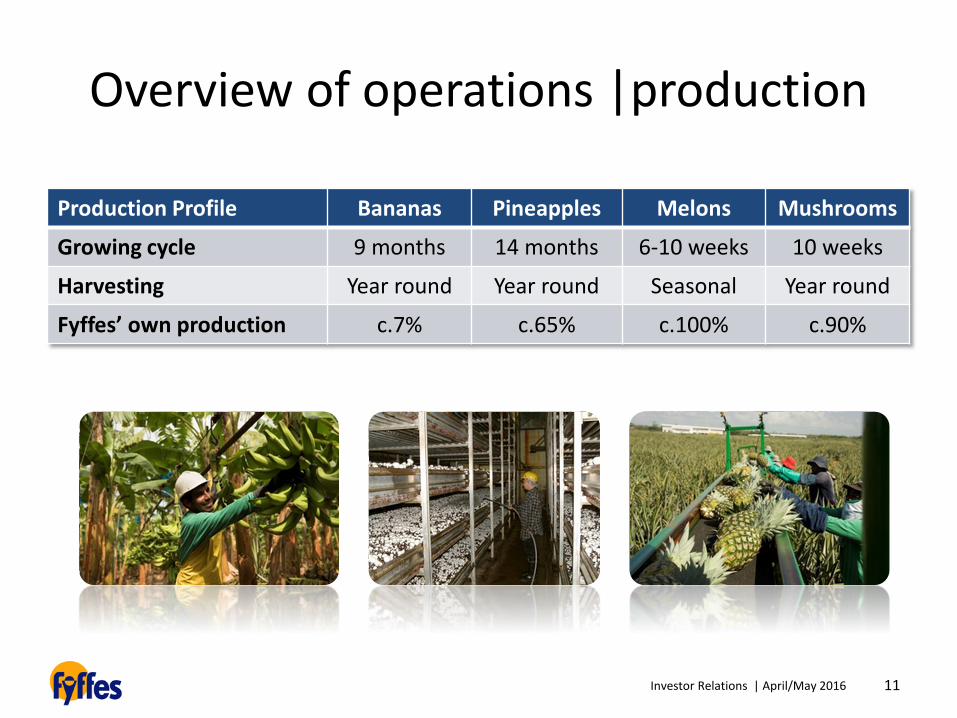
Overview of operations |production
Production Profile Bananas Pineapples Melons Mushrooms
Growing cycle 9 months 14 months 6-10 weeks 10 weeks
Harvesting Year round Year round Seasonal Year round
Fyffes’ own production c.7% c.65% c.100% c.90%
11

Investor Relations | April/May 2016 12
Banana category

Investor Relations | April/May 2016
Key drivers of short term performance
• Influenced by many factors, particularly volume
• UK market – medium term pricing
• Continental market – short term pricing more prevalent, but trend towards medium term deals
Selling price
• Annual pricing and production costs
Cost of fruit
• Long term container shipping deal in place
• Fuel purchased weekly
Shipping / fuel
• Costs US Dollar denominated
• Revenue in Euro and Sterling
Exchange rates
• Programmed reduction in banana import duty
Import duty
13

Investor Relations | April/May 2016
Overview of operations
14
Logistics
• Fruit shipped in container ships in reefer containers
• Ensures freshness of produce and delays banana ripening process
• 4 week round trip to / from Tropics. Routing tailored to our requirements
• Weekly deliveries to multiple European ports
• Bunker fuel a significant factor

Investor Relations | April/May 2016
Overview of operations
15
Distribution
• Supply ripened (yellow) bananas to customers in UK / Ireland, mainly larger retailers
• Fyffes only operator in UK with national distribution coverage
• Ripening process takes 5-9 days
• Traditionally only unripened (green) bananas sold to customers in Continental Europe
• Increasing amount of Continental ripening including by Weichert and vanWylick JVs

Investor Relations | April/May 2016 16
Key Producers
Ecuador 280m
Guatemala 115m
Costa Rica 100m+
Philippines 100m+
Colombia 90m+
Key Distributors - Global
Chiquita 125m
Fresh Del Monte 117m
Dole (post disposal) 110m
Fyffes 56m
Key Distributors - Europe
Fyffes 46m
Chiquita 33m
Fresh Del Monte 23m
Dole 19m
Bananas | Global marketplace
N America250m casesmarketed
Europe300m casesmarketed
Russiac.60m cases
marketed
Asia120m casesmarketed
Middle Eastc.60m cases
marketed
China*500m cases
15% imported
* Fyffes has new ripening JV in China. Targeting 3m+ cases per annum

Investor Relations | April/May 2016 17
Pineapple category

Investor Relations | April/May 2016
Pineapples | Global marketplace
c.190 million cases marketed annually
• North America – largest market with 80 million cases annually
• Europe – 2nd largest market with 75+ million
18
Key producers Cases ‘M
Costa Rica (80%) 150
Philippines (10%) 20
Key distributors Cases ‘M
Fresh Del Monte 60
Dole 35
Fyffes 10

Investor Relations | April/May 2016 19
Melon category

Investor Relations | April/May 2016
Melons
20
● US imports c.50m cases of melons from November – May
● #1 in this category –importing c.17m cases- before recent acquisition which is expected to add 20-25% to volumes
● Volumes / sales doubled since acquisition
● Production capacity increased in Honduras and Guatemala each year
US market

Investor Relations | April/May 2016 21
Mushroom category
Investor Relations | April/May 2016
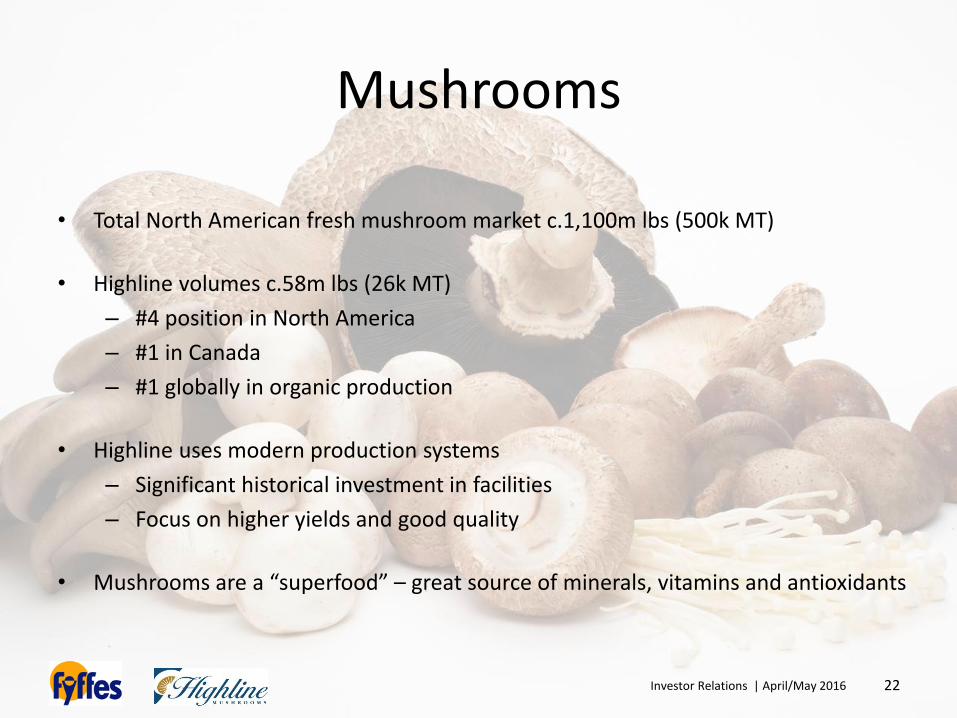
Mushrooms
22
• Total North American fresh mushroom market c.1,100m lbs (500k MT)
• Highline volumes c.58m lbs (26k MT)
– #4 position in North America
– #1 in Canada
– #1 globally in organic production
• Highline uses modern production systems
– Significant historical investment in facilities
– Focus on higher yields and good quality
• Mushrooms are a “superfood” – great source of minerals, vitamins and antioxidants

Investor Relations | April/May 2016
Increased focus on production
23
• Farmed land in Central America – bananas, pineapples and melons
• Land values appreciating in Central America

Investor Relations | April/May 2016 24
Appendix
Investor Relations | April/May 2016
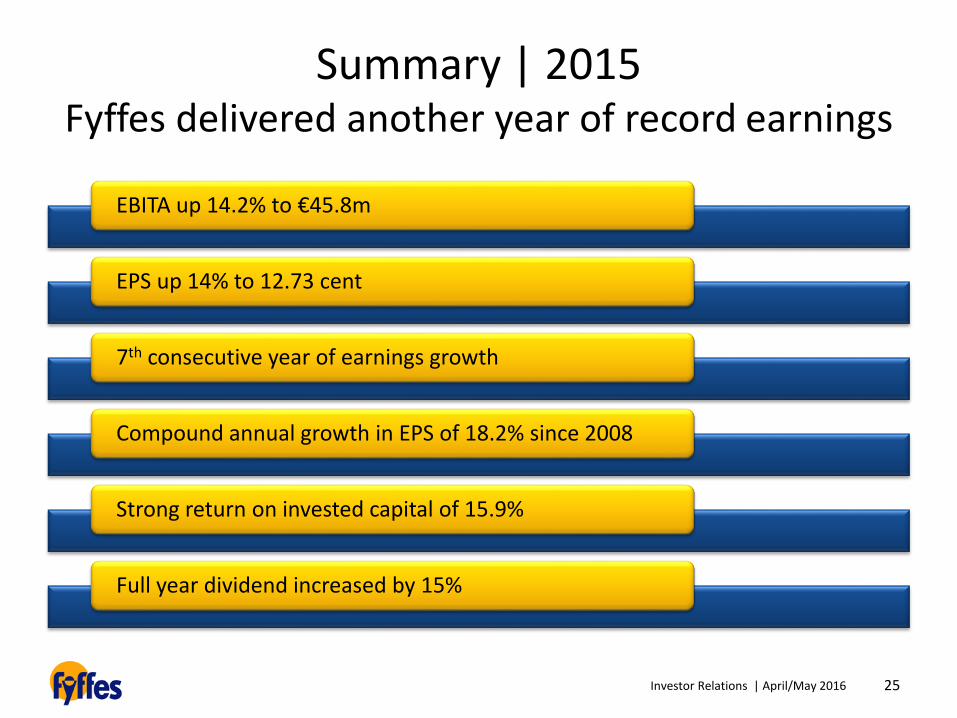
Summary | 2015Fyffes delivered another year of record earnings
EBITA up 14.2% to €45.8m
EPS up 14% to 12.73 cent
7th consecutive year of earnings growth
Compound annual growth in EPS of 18.2% since 2008
Strong return on invested capital of 15.9%
Full year dividend increased by 15%
25

Investor Relations | April/May 2016
Financial highlights | 2015
Total revenue
EBITDA1
EBITA1
EBIT1
EPS2
Total dividendper share
ROIC3
2015
€1,222.5m
€56.1m
€45.8m
€45.8m
12.73c
2.745c
15.9%
2014
€1,090.9m
€48.2m
€40.1m
€40.1m
11.17c
2.387c
18.4%
% Change
+12.1%
+16.4%
+14.2%
+14.2%
+14.0%
+15.0%
-
26
1. Before exceptional items and share of joint venture tax.
2. Before exceptional items.
3. ROIC after tax, including JVs.

Investor Relations | April/May 2016
Operating performance | 2015
2015€’M
2014€’M %
Total turnover 1,222.5 1,090.9 +12.1%
EBITDA 56.1 48.2 +16.4%
Depreciation (10.3) (8.1)
EBITA 45.8 40.1 +14.2%
Amortisation - -
EBIT 45.8 40.1 +14.2%
27
• 12% increase in turnover. Excluding translation impact underlying sales growth was 7%. Mainly mid single digit organic volume growth in bananas and melons.
• €5.7m (14.2%) increase in Adjusted EBITA – analysed by category on following slides.
• No amortisation charges in either year.
• Excludes €12m net exceptional charges comprising €11.1m impact of closing Irish DB pension scheme, €2.9m fine paid by joint venture, less €2m write-back of costs accrued in 2014 in relation to proposed Chiquita merger.

Investor Relations | April/May 2016
Operating performance | 2015
28
Bananas
• Strong performance in banana category with mid-teens percentage increase in EBITA
• Significant adverse exchange rate movement year on year – USD/EUR and USD/GBP rates 16% and 7% down respectively
• Reduction in key input costs including logistics (particularly fuel), other import costs and operating overheads
• Secured necessary increases in selling prices
• Further mid single digit organic volume growth
• Exchange rates remain unfavourable in early 2016. Targeting increases in selling prices as a result

Investor Relations | April/May 2016
Operating performance | 2015
29
Pineapples
• Strong performance in pineapple category
• As in banana category, exchange rates a significant headwind due to USD strength
• Secured necessary increases in selling prices, helped by supply constraints
• Costs also lower, particularly logistics, including fuel
• Improved efficiency on own farms
• Volumes marginally lower, mainly due to adverse weather in key production region (Costa Rica)
• Positive outlook for 2016 on continuing supply constraints

Investor Relations | April/May 2016
Operating performance | 2015
30
Melons
• Satisfactory result in melon category. Profits down on very strong result in prior year
• Result impacted by adverse weather conditions in production regions early in year. Knock-on impact on quality and average selling prices
• Production costs also higher as a result. Partly offset by lower logistics costs, particularly fuel
• Translation benefit on USD denominated earnings
• Acquired additional farming assets in Guatemala towards the end of 2015. Expected to increase volumes by 25% in 2016
• Pleased with initial integration of new farms. Positive start to 2015/16 US import season

Investor Relations | April/May 2016
Summary cash flow | 2015
31
€’M €’M
Operating cash flows
Adjusted EBITDA 56.1
Exclude JV EBIT (1.7)
Dividends from JV’s 1.5 55.9
Recurring investment and other expenditure
Maintenance Capex (9.6)
Tax paid (4.3)
Pension deficit payments incl MNOPF/MNRPF (1.9)
Working capital / other (7.5) (23.3)
Free cash flow before dividends 32.6
Dividends paid (7.4)
Non recurring investment and other expenditure
Acquisition of farming businesses (26.8)
Farm purchase (2.7)
Termination of Irish DB pension scheme (20.0)
Non-recurring MNOPF/MNRPF payments (3.3) (52.8)
Net cash outflow (27.6)
Opening net debt (11.7)
Closing net debt (39.3)
• Strong cash generation in period. Operating cash flows of €55.9m, equivalent to 18.6 cent per share
• Significant investment expenditure in 2015 including €29.5m purchase of farming assets in banana and melon categories
• €20m paid to eliminate deficit in Irish DB pension scheme and all future liability. Accelerated pay down of new MNRPF liability
• Seasonal working capital compounded by acquisitions at end of year. Reduced by €6m repayment of supplier loans
• Closing net debt of €39.3m. Equivalent to 0.7 times Adjusted EBITDA

Investor Relations | April/May 2016
Balance sheet
32
2015€’M
2014€’M
Intangible assets 39.9 24.5
Property, plant and equipment 128.6 101.6
Investment in joint ventures 36.3 40.1
Investment in Balmoral 0.1 0.1
Working capital / hedging 87.6 77.9
Current / deferred tax (8.4) (10.2)
Provisions (3.5) (4.0)
Pension deficit (net of DT) (25.7) (34.0)
Net debt (39.3) (11.7)
215.6 184.2
Shareholders’ funds 213.9 182.7
Minority interests 1.7 1.6
215.6 184.2
• Significant high quality asset base – own c.5,000 hectares of land in Central America
• Also owns 4 large distribution centres– 3 in UK and 1 in Florida
• Reduction in pension deficit due to closure of Irish DB pension scheme. Also in process of closing larger UK DB pension scheme to future accrual
• €31.2m increase in shareholders’ funds, includes €17.1m translation gain on Sterling and US Dollar denominated net assets, plus €27.4m retained profits before €7.4m dividend

Investor Relations | April/May 2016
Attributable profit
33
2015€’M
2014€’M
Adjusted EBITA 45.8 40.1
Net interest expense (incl joint ventures) (1.2) (1.1)
Adjusted PBT 44.6 39.0
Exceptional items (12.0) 0.1
Amortisation - -
Profit before tax 32.6 39.1
Taxation (incl share of joint ventures) (5.1) (5.0)
Minority interest (0.1) (0.2)
Profit attributable to shareholders 27.4 33.9
• Underlying tax rate 13.8% (2014: 12.7%). Slight increase due to geographic mix of profits.

Investor Relations | April/May 2016
Adjusted earnings per share | 2015
34
2015€’M %
Adjusted profit before tax 44.6 +14.5%
Less:
- Underlying tax (6.2)
- Minority interests (0.1)
Adjusted earnings 38.3 +13.4%
Diluted weighted average shares (M) 301.2
Adjusted fully diluted earnings per share (cent) 12.73 +14.0%
• Excludes exceptional items and, in earlier years, amortisation charges and share of Balmoral result

Investor Relations | April/May 2016
Major shareholders
35
Holder No. of ordinary shares
% of shares in issue(excl treasury shares)
InterTech – South Carolina 39.0m 13.1%
Balkan Investment Company(& related companies)
37.2m 12.1%
Fidelity International – Boston 31.2m 10.5%
Invesco Limited – USA 14.3m 4.8%
BlackRock, Inc. – London 13.6m 4.6%
BNP Paribas – Paris 11.9m 4.0%
Farringdon Capital Management – Copenhagen 11.4m 3.8%

Investor Relations | April/May 2016 36
Contact:
Seamus KeenanCompany SecretaryTel: +353 1 8872700
Email: [email protected]