fy2021 district of columbia highway safety plan
TRANSCRIPT

District of Columbia FY 2021 Highway Safety Plan
i
Contents Highway Safety Plan ...................................................................................................................................... 1
Highway Safety Planning Process .................................................................................................................. 2
Data Sources and Processes .......................................................................................................................... 2
Problem Identification ................................................................................................................................... 2
Target-setting Process ................................................................................................................................... 2
Processes Participants ................................................................................................................................... 3
Description of Highway Safety Problems ....................................................................................................... 3
Methods for Project Selection ....................................................................................................................... 7
Information and Data Sources ....................................................................................................................... 9
District Strategic Highway Safety Plan (SHSP).............................................................................................. 11
Performance Report .................................................................................................................................... 13
FY2021 Performance Plan ........................................................................................................................... 20
Program Areas ............................................................................................................................................. 38
Program Area: Aggressive Driving ........................................................................................................... 38
Program Area: Impaired Driving (Drug and Alcohol) ............................................................................... 49
Program Area: Nonmotorized (Pedestrians and Bicyclists) ..................................................................... 71
Program Area: Occupant Protection (Adult and Child Passenger Safety) ............................................... 90
Program Area: Planning and Administration ......................................................................................... 106
Program Area: Safe Communities ......................................................................................................... 107
Program Area: Traffic Records .............................................................................................................. 109
Evidence-based Traffic Safety Enforcement Program (TSEP) .................................................................... 114

1
Highway Safety Plan NATIONAL PRIORITY SAFETY PROGRAM INCENTIVE GRANTS
The District applied for the following incentive grants:
S. 405(b) Occupant Protection: Yes
S. 405(e) Distracted Driving: No
S. 405(c) State Traffic Safety Information System Improvements: Yes
S. 405(f) Motorcyclist Safety Grants: No
S. 405(d) Impaired Driving Countermeasures: Yes
S. 405(g) State Graduated Driver Licensing Incentive: No
S. 405(d) Alcohol Ignition Interlock Law: No
S. 405(h) Nonmotorized Safety: Yes
S. 405(d) 24–7 Sobriety Programs: No
S. 1906 Racial Profiling Data Collection: No
2
Highway Safety Planning Process Data Sources and Processes Problem Identification
The District of Columbia Department of Transportation (DDOT) Highway Safety Office (HSO) administers the Federally funded State and Community Highway Safety Program, which was established under the Highway Safety Act of 1966, 23 USC Chapter 4, Section 402 to reduce motor vehicle crashes and the resulting fatalities and injuries prompted by unsafe roadway-user behaviors. Under this mandate and to receive funding, States are required to identify their most critical traffic safety problems and develop a framework for creating a safer, more efficient transportation system by submitting a Highway Safety Plan (HSP) to the National Highway Traffic Safety Administration (NHTSA). This District of Columbia HSP for Fiscal Year (FY) 2021 serves as the District’s application to NHTSA for Federal funds available under Section 402 State and Community Highway Safety grant program and the Section 405 National Priority Safety Program of the Fixing America’s Surface Transportation (FAST) Act.
The District HSO follows guidelines outlined in the NHTSA Traffic Safety Performance Measures for States and Federal Agencies and the Governors Highway Safety Association (GHSA) Guidelines for Developing Highway Safety Performance Plans to complete its identification of unsafe behaviors. This is a crucial step in solving the problem and determining which projects to implement that would be most effective and efficient in addressing the District’s roadway crashes, injuries, and fatalities. An initial review of the data highlights factors that contribute to a high percent of fatalities and injuries.
The HSO used the most recent data available to complete this analysis, including:
Fatalities (NHTSA/FARS 2018, preliminary 2019 FARS/MPD)
Crash Data (MPD, March 2020)
License Data ( DMV, January 2020)
Population Data (Census, July 2019)
Seatbelt Survey (DDOT, June 2019)
The results of the analysis will ensure that resources are directed to areas identified as most efficient, affective, and appropriate for achieving the HSO primary goals.
Target-setting Process The overall goal of the HSO is zero deaths from traffic-related crashes in the Nation’s Capital. However, when setting the performance targets, participants must ensure targets are obtainable and follow the SMART principle: S–Specific, M–Measurable, A–Action-oriented, R–Realistic, and T–Time-frame. Performance measures and goals are consistent with both NHTSA requirements and the Strategic Highway Safety Plan (SHSP) goals are aligned with the Highway Safety Improvement Plan (HSIP).
Goals used 2012 to 2019 data, as well as the 5-year rolling average trends to set realistic goals. The District numbers are small, which makes it even more difficult to project. Using the averages

3
helps reduce some of these fluctuations. The lowest number of fatalities occurred in 2012 (15), but have been increasing, similar to the patterns observed in most other similar size cities. The HSO projects the current trends and considers the effects of potential strategies to develop appropriate goals in 2021.
Processes Participants The HSO collaborates with law enforcement, judicial personnel, private sector organizations, and community advocates to coordinate activities and initiatives relating to behavioral issues affecting traffic safety. These partners work together to achieve the HSO vision for a safe, efficient transportation system that has zero traffic-related deaths and injuries. The following are the public sector and community partners for FY2021:
District Department of Transportation (DDOT)
Metropolitan Police Department (MPD)
Office of the Attorney General (OAG)
Metropolitan Washington Council of Governments (MWCOG)
Office of the Chief Medical Examiner (OCME)
Office of Chief Technology and Officer (OCTO)
Office of Information Technology and Innovation (OITI)
Department of Motor Vehicles (DMV)
Washington Regional Alcohol Program (WRAP)
Washington Area Bicyclist Association (WABA)
Howard University
McAndrew Company, LLC
KLS Engineering, LLC
Description of Highway Safety Problems The District of Columbia is located in the mid-Atlantic region of the U.S. East Coast and is bordered by Montgomery County, Maryland, to the northwest; Prince George’s County, Maryland, to the east; and Arlington and Alexandria, Virginia, to the south and west. As the Nation’s Capital, the District is independent and is not part of a state.
The District is comprised of eight wards, the most populous of which are Wards 2 and 3. Ward 2 covers a significant portion of the District’s downtown. It comprises both business and residential areas. The ward is also the location of several important museums, theaters, and a major sports venue. Ward 3 consists of many diverse neighborhoods, including American University Park, Klingle, Cathedral Heights, Chevy Chase, Cleveland Park, Forest Hills, Foxhall, Friendship Heights, Glover Park, and Woodley Park. Local attractions in Ward 3 are Fort Reno Park, Mazza Gallerie/Chevy Chase Pavilion,

4
Forest Hills Park, Chevy Chase Park, Avalon Theatre, Uptown Theatre, and the 4th of July Palisades Parade.
The following factors were considered when setting the performance targets for FY2021. Note: This report predates any effect from the coronavirus pandemic.
The District is the center of all three branches of the Federal government and the home of many national monuments and museums. It also is the location of nearly 200 foreign embassies and headquarters of many international organizations, trade unions, nonprofit organizations, lobbying groups, and professional associations, which results in an ethnically diverse, cosmopolitan, midsize capital city.
The District of Columbia Department of Employment Services states the total number of jobs in the District in February 2020 was 799,500, reflecting an increase of 1,900 jobs from March 2019. Government employees make up 29.6 percent of the District’s workforce (236,600 workers). Some of the other largest employers are medical institutions. There are 14 hospitals (four are accredited trauma centers), including the George Washington University, Georgetown University, Washington Hospital Center, and Howard University Hospital, which together employ a workforce of approximately 27,400. Professional, scientific, technical, and business services employ more than 168,000 people. During the workweek, however, the number of commuters from the suburbs into the city swells the District’s daytime population to more than 1.5 million people, or more than 2.5 times the resident population. Therefore, unlike any other state in the Nation, solving the District’s crash problem is a regional issue.
The U.S. Census Bureau estimates the District's population at 705,749, as of July 1, 2019, an increase of more than 100,000 people since the 2010 U.S. Census. The increase continues a growth trend since 2000, following a half century of population decline.
The District Department of Motor Vehicles (DMV) reports, as of January 2020, the total number of licensed District drivers was 482,829—female drivers 245,874 and male drivers 236,955, which represents a 0.5 percent decrease from April 2019 of 485,051. There are 305,520 registered vehicles (0.8 percent decrease from April 2019 of 307,983 vehicles) in the District, as of January 2020.
A larger percentage of the District population use public transportation, bike, or walk as their primary mode of transportation. The District ranks No. 7 for the most walkable cities in the Nation—receiving a 75.9 walk score and the Gold Bicycle Friendly Community Award in 2018.
The District (2019 facts) has 266.8 miles of bike facilities; 77.1 miles of bicycle lanes, 60 miles of bike trails, 11.8 miles of cycle tracks, 21.2 miles of shared lanes, 96.7 miles of signed bike routes, and well over 300 bike racks. The District is currently working on adding approximately 22 miles of bike lanes in 2020/2021.

5
In September 2010, the District joined the Capital Bikeshare program with Arlington County, Virginia, with 400 bicycles at 49 stations. To date the program has been expanded to include Alexandria, Virginia and Montgomery County, Maryland, and has more than 500 stations and 4,500 bikes. The ridership graph below shows that almost 3.4 million trips made in 2019.
In October 2017, the District began dockless bikes and dockless scooters and plans to increase the number of dockless vehicles from 6,210 in 2019 to 20,000 in 2020/2021. The graph below shows the generated trips in 2019.
Jan Feb Mar Apr May June July Aug Sept Oct Nov Dec
2019 CaBi (500+ stations) 150,780 158,130 253,811 347,993 337,705 350,144 356,645 360,044 360,226 337,552 223,512 161,878
2018 CaBi (269 stations) 149,317 161,412 214,110 292,077 330,857 345,595 358,920 355,511 286,662 343,021 221,059 158,853
2017 CaBi (264 stations) 155,058 199,501 218,069 323,948 297,707 348,482 348,576 352,497 342,118 338,162 222,066 157,584
2016 CaBi (233 stations) 111,823 131,294 252,647 254,216 256,278 324,978 324,762 315,877 303,898 302,855 229,820 150,176
-
50,000
100,000
150,000
200,000
250,000
300,000
350,000
400,000
Rid
ersh
ip

6
The Streetcar service on H Street commenced in March 2016, with daily weekday passenger averaging 2,419 passengers (67,853/month). Currently ridership has reached of 96,000 riders per month.
In February 2015, it became legal in the District for adults 21 years and older to use up to 2 ounces of marijuana and grow up to six plants in their homes for personal use. This has increased the potential for drug-impaired driving in the District, as indicated by OCME.
As Table 1 indicates, speeds were the most frequent contributing factor involved in a crash on District roadways, followed by pedestrian involved and impaired driving. The highest number of traffic injuries resulted from aggressive driving behavior and pedestrian involved. The highest number of traffic fatalities resulted from impaired driving behavior, followed by aggressive driving and pedestrian involved.
Table 1: Crash Data by Highest Injuries Causes in 2019
2018 Fatalities (FARS)* Injuries (2019) Total Crashes (2019) Pedestrian 11 447 1,071 Bicyclists 3 334 689
Aggressive Driving 15 503 4,112
Impaired Driving 19 94 885 Occupant Protection 1 41 444
Motorcyclists 5 71 209 *FARS 2019 data is not yet available
The District is committed to mitigating these problems and providing a safe transportation system for all road users.
Jan Feb Mar Apr May June July Aug Sept Oct Nov Dec
2019 98,761 93,394 110,19 93,644 90,359 87,411 90,628 88,176 78,689
2018 87,816 95,178 97,346 102,00 100,94 97,728 88,566 97,095 93,321 102,27 93,015 95,042
2017 92,902 84,123 93,909 84,176 97,965 100,52 108,64 111,02 99,915 114,70 103,03 93,794
2016 67,853 68,420 63,979 69,917 70,778 72,423 73,582 88,021 79,675 80,391
-
20,000
40,000
60,000
80,000
100,000
120,000
140,000
Streetcar Service - H Street Ridership

7
Methods for Project Selection Each year, the HSO uses the problem-identification process to identify its highway safety programs; it identifies the top priority areas and sends out a request for grant proposals to address these issues. As noted previously, the District HSO administers the Federally funded State and Community Program. The DDOT HSO Chief, Carole Lewis, coordinates the program. The HSO uses the SHSP, NHTSA’s Countermeasures that Work: A Highway Safety Countermeasure Guide for State Highway Safety Offices (9th Edition, 2017), other best practices, and past experience to select strategies, countermeasures, and projects that could best help the District achieve its safety goals.
Because the District’s program is city based, it allows for a less-structured and more open-grants solicitation process. Program Coordinator experience and knowledge, as well as the ongoing partnerships, further allow for direct solicitation of grant proposals. For example, all enforcement-based grants go directly to the MPD, as it is the only law enforcement agency in the City eligible to receive Federal grant funds. Grant proposal requests posted in the D.C. Register and the HSO website had a due date of May 1, 2020. The FY2021 Grant Application, along with other grant-related forms, is posted on the HSO website (www.ddot-hso.com) and on the DC Register.
The following questions are considered when selecting projects for funding:
Is the problem adequately identified?
Is the problem identification supported by accurate and relevant data?
Is the project directly related to the problem identified?
Are the objectives appropriate to the problem?
Are the goals and objectives realistic and achievable?
Are the Performance Measures and Targets appropriate to the Objectives?
Will this project save lives and reduce serious crashes?
Are the strategies implemented proven?
Is this project cost-effective?
Is the evaluation plan sound? (Is the performance/progress measurable?)
Is there a realistic plan for self-sustainability (if applicable)?
The HSO review all traffic safety grant applications to ensure the completeness of the application
packages and that they clearly identify their problems, goals, and objectives, and use evidence-
based strategies and activities and performance measures. Their goals and objectives must
support the HSO, confirm activities, measure their effectiveness, and ensure estimated costs
justify the anticipated results.
Who Can Apply
Any District Government agency or nonprofit organization that can show a plan that addresses an identified highway safety problem may apply for Federal funding. The problem must fall within one of the District’s emphasis/priority areas or in an area where there is documented

8
evidence of a safety problem. Each nonprofit organization’s project director must submit a Grant Application and comply with the grant program guidelines, as follows:
All funding must be for highway safety purposes only.
All funding must be necessary and reasonable.
All funding is based on implementing evidence-based strategies.
All funding is passed through from the Federal government and is subject to both Federal and District regulations.
All projects must be behavioral and performance-based in reducing crashes, injuries and fatalities.
Projects are only approved for one full or partial fiscal year at a time.
Funds cannot be used to replace or supplant existing expenditures, nor can they be used to carry out general operating expenses of the grantee.
All funding is on a reimbursement basis. The grantee must pay all expenses up front and then submit a reimbursement request with the necessary backup documentation to receive the funds.
The designated project director must ensure project/program objectives are met, expenditures are within the approved budget, and reimbursements and required reports are submitted in a timely manner.
Risk Assessment
As required by 2 CFR Parts 200.331(b), a Risk Assessment is conducted for each grantee prior to awarding any NHTSA funds. The objective of this assessment is to provide the District a tool with which to better monitor the performance of each grantee. This assessment will evaluate each grantee and identify each as a high-, medium-, or low-risk designation. This allows the HSO to focus its monitoring efforts on the higher risk entities and ensure they meet program requirements and objectives. The risk assessment may include information such as past performance of the grantee during previous grants and review timeliness of claim submissions and progress reports.
The HSO may notify grantees during the assessment of the need to answer or explain any identified deficiencies. Based on the risk level (high, medium, or low), the HSO will determine the level or type of monitoring during the grant period to better track the project progress. Any grantee receiving more than $200,000 will be subject to onsite monitoring.
Pre-award Notice and Reporting Requirements
Quarterly Progress Reports
Period Due Date
October to December January 15 January to March April 15
April to June July 15 Final Performance Report November 1

9
Upon final approval, the HSO Coordinator notifies each project director of the approved amount of funding and reviews individual fiscal and administrative reporting/evaluation requirements.
The HSO monitors all projects on a regular basis, which includes onsite monitoring. Additional monitoring may be required for grantees where the HSO determines that the organization is a medium- or high-risk grantee. Project directors are required to submit a monthly/quarterly progress report, which outlines activities from the grant application and submit an equipment record when purchasing equipment. The HSO will perform a biannual onsite monitoring of equipment for any grantee who has purchased equipment under the grant. If the grantee is not achieving project goals, then the HSO reserves the right to terminate the project or require changes to the project action plan.
All grants are reimbursable in nature, meaning that the agency must first spend the funds and then submit a reimbursement voucher and request reimbursement from the HSO. This reimbursement voucher indicates the amount of Federal funding spent. Agencies must attach backup documentation to the submitted reimbursement voucher to include receipts, timesheets, etc. Agencies must submit a final performance report at the end of the project period; it must also provide an in-depth cumulative summary of the tasks performed and goals achieved during the project period. This final report is due no later than November 1 of each year that the grant is in place.
Information and Data Sources
Traffic Crash Data The HSO obtains fatality data through the NHTSA Fatality Analysis Reporting Systems (FARS). The FY2021 Highway Safety Plan uses FARS data from 2012 to 2018 and preliminary 2019 fatality data from MPD. The District’s fatality numbers are relatively small and, therefore, HSO uses injury data to get a clearer picture of the District’s traffic safety problems. Injury data is based on data available as of March 31, 2020 from MPD and TARAs2 database.
The HSO, through an agreement with the MPD, has access to the MPD Cobalt-RMS/Traffic Crash system. The access to the crash data is through a REST API called CLERK; HSO can obtain all crash data, including injury-related data. The Cobalt-RMS/Traffic Crash system interfaces with the District Department of Motor Vehicles (DMV) DMV Destiny system to retrieve driver- and vehicle-related information based on either the Tag or VIN numbers. The HSO can also access the DMV and obtain number of registered of vehicles, number of licensed drivers, as well as moving citations.
Prior to 2016, the Metropolitan Police Department (MPD) database defined injury data as “disabling and non-disabling.” In 2016, the MPD changed the injury severity level coding in its new crash-reporting system (COBALT) that captures injury data based on MMUCC 4th Edition, as required by Federal regulation under MAP-21[1]. This plan identifies an injury as:
Suspected Serious Injury. Any injury other than fatal that results in one or more of the following: severe laceration; broken or distorted extremity (arm or leg); suspected skull,

10
chest, or abdominal injury other than bruises or minor lacerations; significant burns; unconsciousness when taken from the crash scene; and other major injuries.
Suspected Minor Injury. Any injury that is evident at the scene of the crash other than fatal or serious injuries. Examples include lump on the head, abrasions, bruises, and minor lacerations (cuts on the skin surface with minimal bleeding and no exposure of deeper tissue/muscle).
The identification process examines the following variables: crash severity (fatality and injuries); time of day; day of the week; driver gender and age; contributing circumstances (speed, impaired, seatbelt use, etc.); and location by Ward.
The problem-identification process uses FARS fatality data and MPD data for injuries. The data queried determines:
1. Who is involved in a crash (e.g., age, gender, seatbelt use, impairment, etc.);
2. When crashes occur (e.g., time of day, day of the week, month);
3. What is the cause of the crash (e.g., speed, alcohol, other); and
4. Where crashes occur in the District.
Understanding the data helped the HSO and its stakeholders identify the District safety problems and potential focus areas to improve traffic safety and decrease injuries and fatalities in the District.
Enforcement Data
MPD is the primary law enforcement agency for the District of Columbia and the HSO works closely with the agency throughout the year. The HSO has access to daily enforcement activities and reports on crashes and number of citations issued during campaigns and overtime enforcement.
Seatbelt Use Observational Survey
The 2019 Seatbelt Usage Survey, conducted by Howard University, found a 95.4 percent seatbelt compliance rate—a 0.3 percent increase from 95.1 percent in 2018. The District’s seatbelt use rate has been above the national average of 86 percent since 2012. Because of the covid-19 pandemic, the 2020 observation survey originally scheduled for May/June was rescheduled to November 2020.
Vision Zero Plan
In February 2015, District Mayor Muriel Bowser launched Vision Zero in response to U.S. Department of Transportation Secretary Anthony Foxx’s Mayors’ Challenge for Safer People and Safer Streets. Vision Zero marks a new approach to the District’s challenges and a renewed sense of urgency within our city. The goal of Vision Zero is to realize zero fatalities by 2024. More than thirty District agencies and safety partners worked to develop the plan that better educates stakeholders and grows a safety culture; more efficiently enforces life-saving laws; enhances the design of complete streets; and collects, leverages, and shares crucial safety data.

11
District Traffic Records Coordinating Committee (TRCC)
In 2007, the District of Columbia established its Traffic Records Coordinating Committee (TRCC), which is comprised of nine District agencies (DDOT, MPD, FEMS, DMV, OCTO, OAG, DCSC, OCME and DOH). The HSO is also the TRCC Coordinator. The TRCC included policy-level representatives from each major system owner (crash, roadway, enforcement/adjudication, driver, vehicle, injury surveillance system/emergency medical system).
The vision of the District’s TRCC is to enhance transportation safety and reduce crashes and crash-related injuries through a coordinated approach that will provide timely, accurate, complete, integrated, uniform, and accessible traffic records data. The TRCC developed the following goals:
Provide an ongoing District-wide forum for traffic records and support the coordination of multiagency initiatives and projects.
Leverage technology and appropriate government and industry standards and to improve the timely collection, dissemination, and analysis of traffic records data.
Improve the interoperability and exchange of local and regional traffic records data among systems and stakeholders for increased efficiency and enhanced integration.
Create a user-friendly data system that incorporates public and private data sources to better inform traffic-related policy and program decision makers.
Participants prioritized and vetted projects during their quarterly meetings and this process becomes the following year’s spending plan for the District’s Section 405c (traffic records) funding.
In 2016, NHTSA conducted a comprehensive assessment of the District’s traffic records system and updated the previous traffic records assessment (TRA) conducted in 2012. The District of Columbia received the final report for the 2016 Assessment on June 27, 2016, and is not due for another Assessment until 2021. Currently, the District is in the process of updating the 2017 Traffic Records Strategic Plan. The updated Traffic Records Strategic Plan will serve as a guiding document for traffic records improvements over a 5-year period, 2021 through 2026, and is due to be completed by March 2021.
District Strategic Highway Safety Plan (SHSP) The SHSP is a District-wide coordinated safety plan that provides a comprehensive framework to reduce highway fatalities and serious injuries on public roads. This document links directly to the District’s Strategic Highway Safety Plan (SHSP); the last major update was in September 2014 (updates were completed through 2017). The SHSP includes strategies in the 4Es of traffic safety—engineering, enforcement, education, and emergency medical services—to target distinct emphasis areas believed to significantly reduce the number of deaths and injuries in the District. This HSP addresses three of the emphasis areas outlined in the SHSP—High-Risk Drivers (Impaired and Aggressive Drivers), Pedestrian and Bicycle Safety, and Occupant Protection. A major update of the SHSP is ongoing and expected out by the end of 2020.
12
The FY2021 HSP aligns with the District’s vision Toward Zero Deaths and the Highway Safety Improvement Program (HSIP). A Team comprised of DDOT (HSIP, HSP, SHSP) works to establish specific targets based on the variety of data sources mentioned in this report and address the District traffic safety problems. The Team established the methodology and targets for C-1: Fatalities, C-2: Serious Injuries and C-3: Fatality rate per 100 million vehicle-miles traveled (VMT); these are identical for the HSP and HSIP for FY2021.

13
Performance Report Progress toward meeting State performance targets from the previous fiscal year's HSP (FY2019)
Sort Order
Performance measure name Progress
1 C-1) Number of traffic fatalities (FARS) Met
2 C-2) Number of serious injuries in traffic crashes (State crash data files) Met
3 C-3) Fatalities/VMT (FARS, FHWA) Met
4 C-4) Number of unrestrained passenger vehicle-occupant fatalities, all seat positions (FARS)
Met
5 C-5) Number of fatalities in crashes involving a driver or motorcycle operator with a BAC of .08 and above (FARS)
Met
6 C-6) Number of speeding-related fatalities (FARS) Not Met
7 C-7) Number of motorcyclist fatalities (FARS) Met
8 C-8) Number of unhelmeted motorcyclist fatalities (FARS) Met
9 C-9) Number of drivers age 20 or younger involved in fatal crashes (FARS) Met
10 C-10) Number of pedestrian fatalities (FARS) Not Met
11 C-11) Number of bicyclist fatalities (FARS) Not Met
12 B-1) Observed seatbelt use for passenger vehicles, front-seat outboard occupants (survey)
Met
13 Number of injuries involving an impaired driver Met
14 Number of injuries involving an aggressive driver Not Met
15 Number of pedestrian-related injuries Met
16 Number of bicyclist-related injuries Met
17 Number of unrestrained-related injuries Met
Performance Measure: C-1. Number of traffic fatalities (FARS) Progress: Met
Program Area-Level Report
FY2019 GOAL: Reduce the number of serious and fatal injuries in the District by 50 percent by 2025. Intermediate Goal: Limit expected increase in fatalities to 31 from the 5-year average (2015–2019) by December 31, 2019. * Preliminary 2019 data: 27 traffic-related fatalities.
23
27
31 31
27
-
5
10
15
20
25
30
35
2015 2016 2017 2018 2019*
14
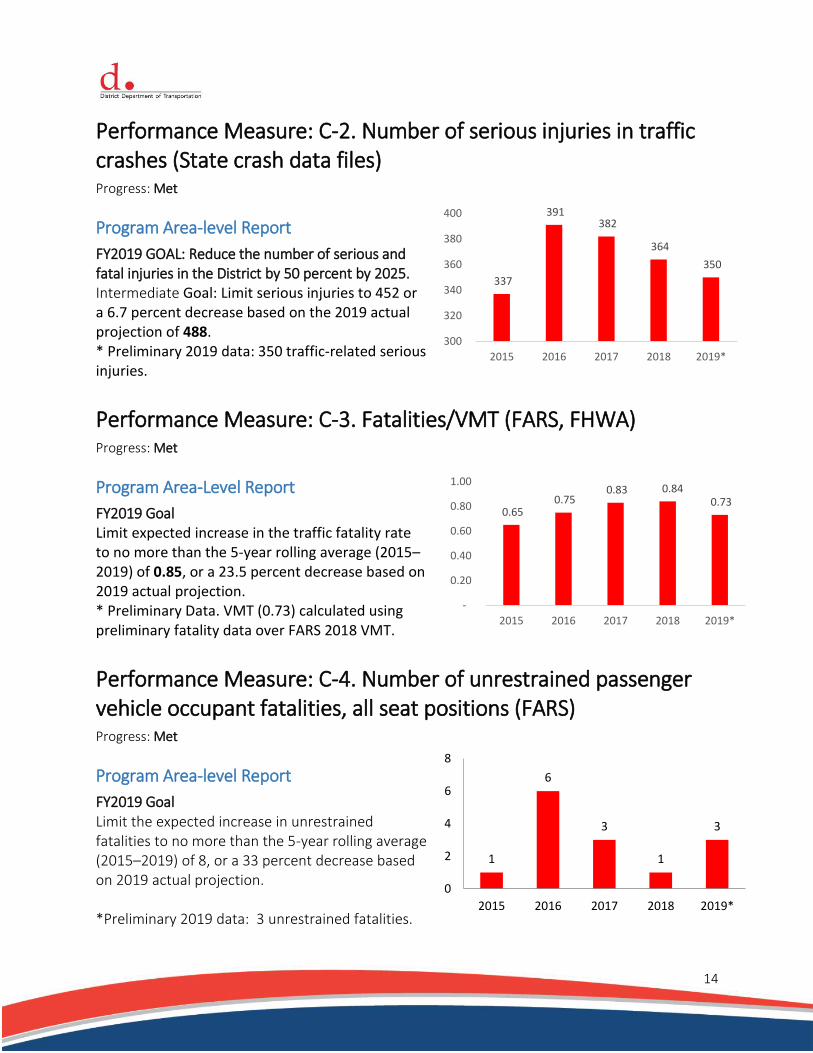
Performance Measure: C-2. Number of serious injuries in traffic crashes (State crash data files) Progress: Met
Program Area-level Report
FY2019 GOAL: Reduce the number of serious and fatal injuries in the District by 50 percent by 2025. Intermediate Goal: Limit serious injuries to 452 or a 6.7 percent decrease based on the 2019 actual projection of 488. * Preliminary 2019 data: 350 traffic-related serious injuries.
Performance Measure: C-3. Fatalities/VMT (FARS, FHWA) Progress: Met
Program Area-Level Report
FY2019 Goal Limit expected increase in the traffic fatality rate to no more than the 5-year rolling average (2015–2019) of 0.85, or a 23.5 percent decrease based on 2019 actual projection. * Preliminary Data. VMT (0.73) calculated using preliminary fatality data over FARS 2018 VMT.
Performance Measure: C-4. Number of unrestrained passenger vehicle occupant fatalities, all seat positions (FARS) Progress: Met
Program Area-level Report
FY2019 Goal Limit the expected increase in unrestrained fatalities to no more than the 5-year rolling average (2015–2019) of 8, or a 33 percent decrease based on 2019 actual projection. *Preliminary 2019 data: 3 unrestrained fatalities.
337
391 382
364
350
300
320
340
360
380
400
2015 2016 2017 2018 2019*
1
6
3
1
3
0
2
4
6
8
2015 2016 2017 2018 2019*
0.65 0.75
0.83 0.84 0.73
-
0.20
0.40
0.60
0.80
1.00
2015 2016 2017 2018 2019*
15
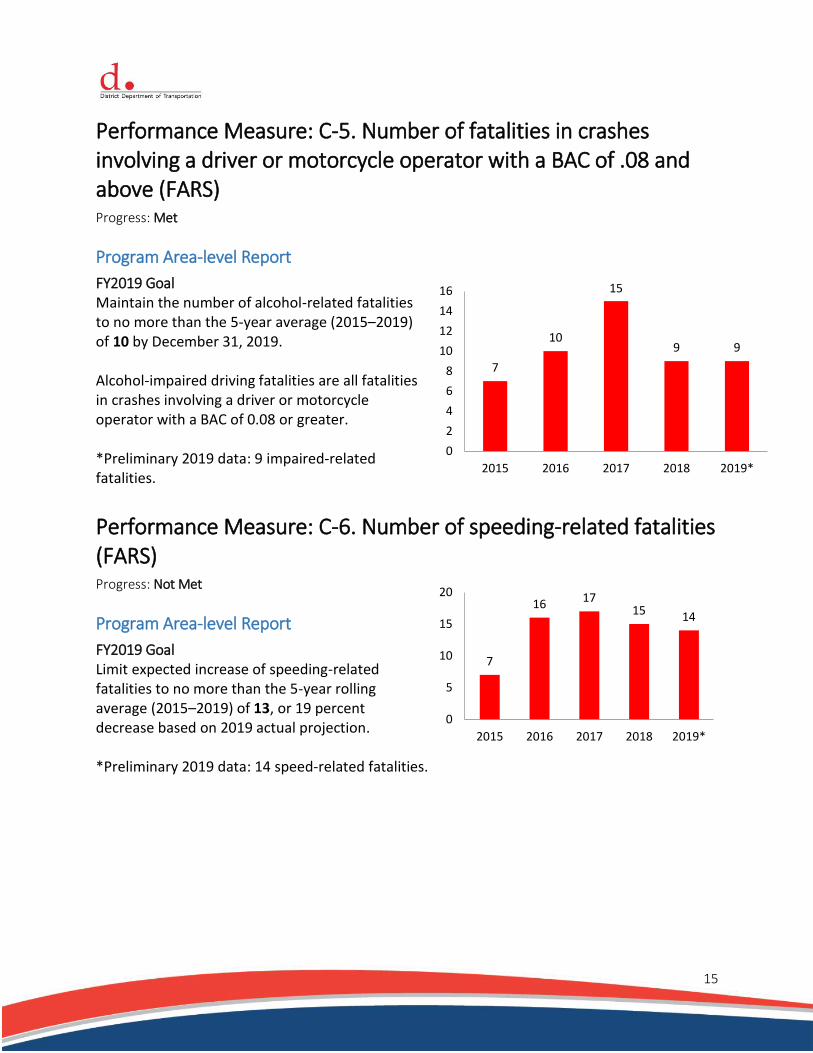
Performance Measure: C-5. Number of fatalities in crashes involving a driver or motorcycle operator with a BAC of .08 and above (FARS) Progress: Met
Program Area-level Report
FY2019 Goal Maintain the number of alcohol-related fatalities to no more than the 5-year average (2015–2019) of 10 by December 31, 2019. Alcohol-impaired driving fatalities are all fatalities in crashes involving a driver or motorcycle operator with a BAC of 0.08 or greater. *Preliminary 2019 data: 9 impaired-related fatalities.
Performance Measure: C-6. Number of speeding-related fatalities (FARS) Progress: Not Met
Program Area-level Report
FY2019 Goal Limit expected increase of speeding-related fatalities to no more than the 5-year rolling average (2015–2019) of 13, or 19 percent decrease based on 2019 actual projection. *Preliminary 2019 data: 14 speed-related fatalities.
7
16 1715 14
0
5
10
15
20
2015 2016 2017 2018 2019*
7
10
15
9 9
0
2
4
6
8
10
12
14
16
2015 2016 2017 2018 2019*

16
Performance Measure: C-7. Number of motorcyclist fatalities (FARS) Progress: Met
Program Area-level Report
FY2019 Goal Limit expected increase of motorcyclist fatalities to no more than the 5-year rolling average (2015–2019) of 5. *Preliminary 2019 data: 3 motorcyclist-related fatalities.
Performance Measure: C-8. Number of unhelmeted motorcyclist fatalities (FARS) Progress: Met
Program Area-level Report
Not a District emphasis area
Performance Measure: C-9. Number of drivers age 20 or younger involved in fatal crashes (FARS) Progress: Met
Program Area-Level Report
FY2019 Goal To maintain the number of drivers age 20 or under involved in a fatal crash to no more than the 5-year average (2015–2019) of 1 by December 2019. *Preliminary 2019 data: 1 fatality involving a driver under age of 20.
3
6
4
8
3
0
2
4
6
8
10
2015 2016 2017 2018 2019*
-
1
2
3
1
-
1
1
2
2
3
3
4
2015 2016 2017 2018 2019*

17
Performance Measure: C-10. Number of pedestrian fatalities (FARS) Progress: Not Met
Program Area-level Report
FY2019 Goal Limit expected increase of pedestrian-related fatalities to no more than the 5-year rolling average (2015–2019) of 10, or a 9 percent decrease based on 2019 actual projection. *Preliminary 2019 data: 12 pedestrian fatalities.
Performance Measure: C-11. Number of bicyclists fatalities (FARS) Progress: Not Met
Program Area-level Report
FY2019 Goal. Maintain the number of bicyclist-related fatalities to no more than the 5-year average (2015–2019) of 1 by December 2019. *Preliminary 2019 data – 2 bicyclist-related fatalities.
Performance Measure: B-1. Observed seatbelt use for passenger vehicles, front seat outboard occupants (survey) Progress: Met
Program Area-level Report
FY2019 Goal Maintain observation belt use to more than 90 percent.
13
8
11 1112
0
2
4
6
8
10
12
14
2015 2016 2017 2018 2019*
1
2
3
2
0
0.5
1
1.5
2
2.5
3
3.5
2016 2017 2018 2019*
95.5
94.1
93.6
95.195.4
92.5
93
93.5
94
94.5
95
95.5
96
2015 2016 2017 2018 2019

18
Performance Measure: Number of injuries involving impaired driver Progress: Met
Program Area-level Report
FY2019 Goal Limit expected increase of impaired-related injuries to 169 (average of both linear and 5-year rolling average models) by December 31, 2019. *Preliminary 2019 data: 94 impaired-related injuries.
Performance Measure: Number of injuries involving an aggressive driver Progress: Not Met
Program Area-level Report
FY2019 Goal Limit expected increase of aggressive-related injuries to no more than 143 (average of both linear and 5-year rolling average models) by December 31, 2019. *Preliminary 2019 data: 309 aggressive-related injuries.
122110
10294
0
20
40
60
80
100
120
140
2016 2017 2018 2019
296
182 204
167
309
0
50
100
150
200
250
300
350
2015 2016 2017 2018 2019
19
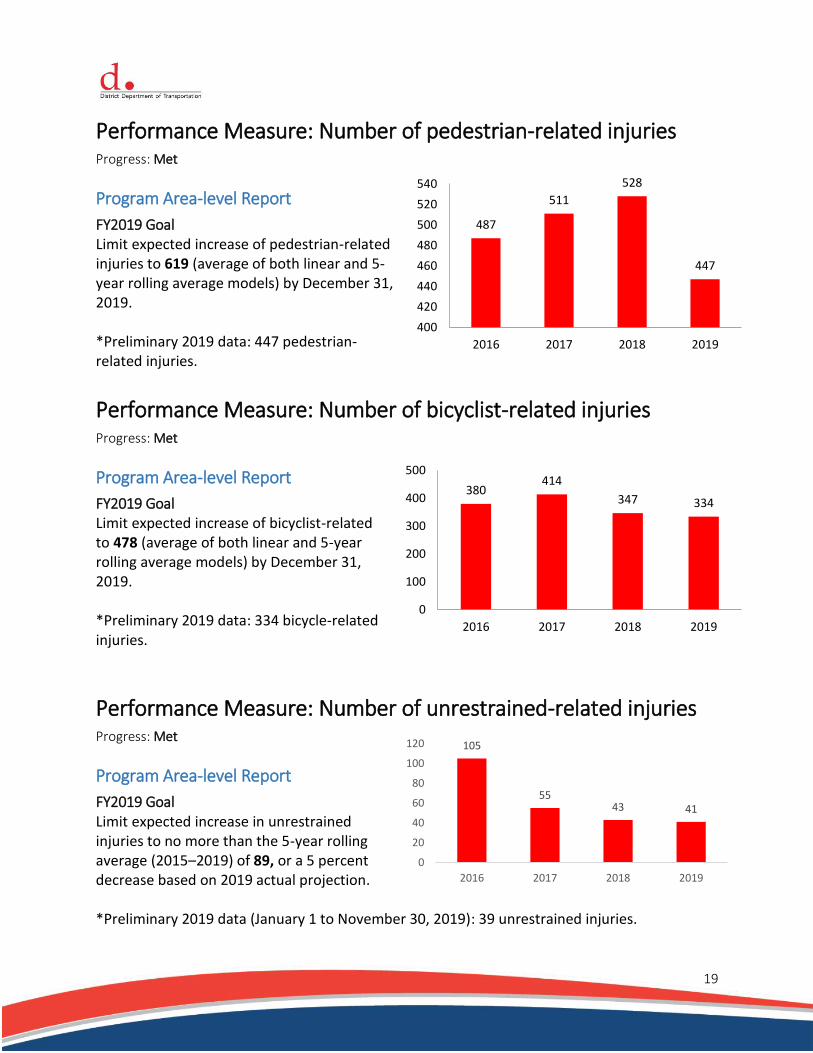
Performance Measure: Number of pedestrian-related injuries Progress: Met
Program Area-level Report
FY2019 Goal Limit expected increase of pedestrian-related injuries to 619 (average of both linear and 5-year rolling average models) by December 31, 2019. *Preliminary 2019 data: 447 pedestrian-related injuries.
Performance Measure: Number of bicyclist-related injuries Progress: Met
Program Area-level Report
FY2019 Goal Limit expected increase of bicyclist-related to 478 (average of both linear and 5-year rolling average models) by December 31, 2019. *Preliminary 2019 data: 334 bicycle-related injuries.
Performance Measure: Number of unrestrained-related injuries Progress: Met
Program Area-level Report
FY2019 Goal Limit expected increase in unrestrained injuries to no more than the 5-year rolling average (2015–2019) of 89, or a 5 percent decrease based on 2019 actual projection.
*Preliminary 2019 data (January 1 to November 30, 2019): 39 unrestrained injuries.
487
511
528
447
400
420
440
460
480
500
520
540
2016 2017 2018 2019
380414
347 334
0
100
200
300
400
500
2016 2017 2018 2019
105
5543 41
0
20
40
60
80
100
120
2016 2017 2018 2019

20
FY2021 Performance Plan Sort Order
Performance measure name Target Period
Target Start Year
Target End Year
Target Value
1 C-1) Number of traffic fatalities (FARS) 5 Year 2017 2021 30
2 C-2) Number of serious injuries in traffic crashes (State crash data files)
5 Year 2017 2021 365
3 C-3) Fatalities/VMT (FARS, FHWA) 5 Year 2017 2021 0.81
4 C-4) Number of unrestrained passenger vehicle occupant fatalities, all seat positions (FARS)
5 Year 2017 2021 3
5 C-5) Number of fatalities in crashes involving a driver or motorcycle operator with a BAC of .08 and above (FARS)
5 Year 2017 2021 12
6 C-6) Number of speeding-related fatalities (FARS) 5 Year 2017 2021 16
7 C-7) Number of motorcyclist fatalities (FARS) 5 Year 2017 2021 6
8 C-8) Number of unhelmeted motorcyclist fatalities (FARS)
5 Year 2017 2021 1
9 C-9) Number of drivers age 20 or younger involved in fatal crashes (FARS)
5 Year 2017 2021 2
10 C-10) Number of pedestrian fatalities (FARS) 5 Year 2017 2021 12
11 C-11) Number of bicyclists fatalities (FARS) 5 Year 2017 2021 2
12 B-1) Observed seatbelt use for passenger vehicles, front seat outboard occupants (survey)
Annual 2021 2021 90.0
13 Number of injuries involving an impaired driver 5 Year 2017 2021 105
14 Number of injuries involving an aggressive driver 5 Year 2017 2021 600
15 Number of pedestrian-related injuries 5 Year 2017 2021 470
16 Number of bicyclist-related injuries 5 Year 2017 2021 380
17 Number of unrestrained-related injuries 5 Year 2017 2021 55
21
Performance Measure: C-1) Number of traffic fatalities (FARS) Performance Target details
Performance Target Target Metric Type
Target Value
Target Period
Target Start Year
C-1) Number of traffic fatalities (FARS): 2021 Numeric 30 5 Year 2017
Performance Target Justification
Traffic fatalities have been on an upward trend since 2012 (15) to 2018 (31). However, preliminary data indicate that 2019 traffic fatalities are lower at 27 persons. Using the 5-year rolling average and a power model (R2 = 0.99), the District has the 2021 goal to maintain the 5-year rolling average (2017–2021) of 30 by December 31, 2021, which is approximately 10 percent less than the fatality annual trend.
15
20
23 23
27
31 31
27 y = 15.499x0.3308
R² = 0.91
-
5
10
15
20
25
30
35
2012 2013 2014 2015 2016 2017 2018 2019* 2020 2021
Fatality Annual (FARS) Trend
22
25 27 28
y = 21.698x0.1874
R² = 0.9911
-
5
10
15
20
25
30
35
2016 2017 2018 2019* 2020 2021
Fatality FARS 5-year Rolling Average

22
Performance Measure: C-2) Number of serious injuries in traffic crashes (State crash data files) Performance Target details
Performance Target Target Metric Type
Target Value
Target Period
Target Start Year
C-2) Number of serious injuries in traffic crashes (State crash data files): 2021
Numeric 365 5 Year 2017
Performance Target Justification
Serious injuries have decreased slightly since 2016, from at a high of 391. However, all trends indicate a slight increase in future years. Using the 5-year rolling average and a power model (R2 = 0.97), the District 2021 goal would be to reduce the number of traffic-related serious injuries by 2 percent from the 5-year rolling average (2017–2021) of 372 to 365 by December 31, 2021.
336 305 311
337
391 382 364 350
y = 312.76x0.0757
R² = 0.3527
-
50
100
150
200
250
300
350
400
450
2012 2013 2014 2015 2016 2017 2018 2019 2020 2021
Serious Injuries
336
345
357
365
y = 334.43x0.0594
R² = 0.9664
310
320
330
340
350
360
370
380
2016 2017 2018 2019 2020 2021
Serious Injuries5 year Rolling Average
23
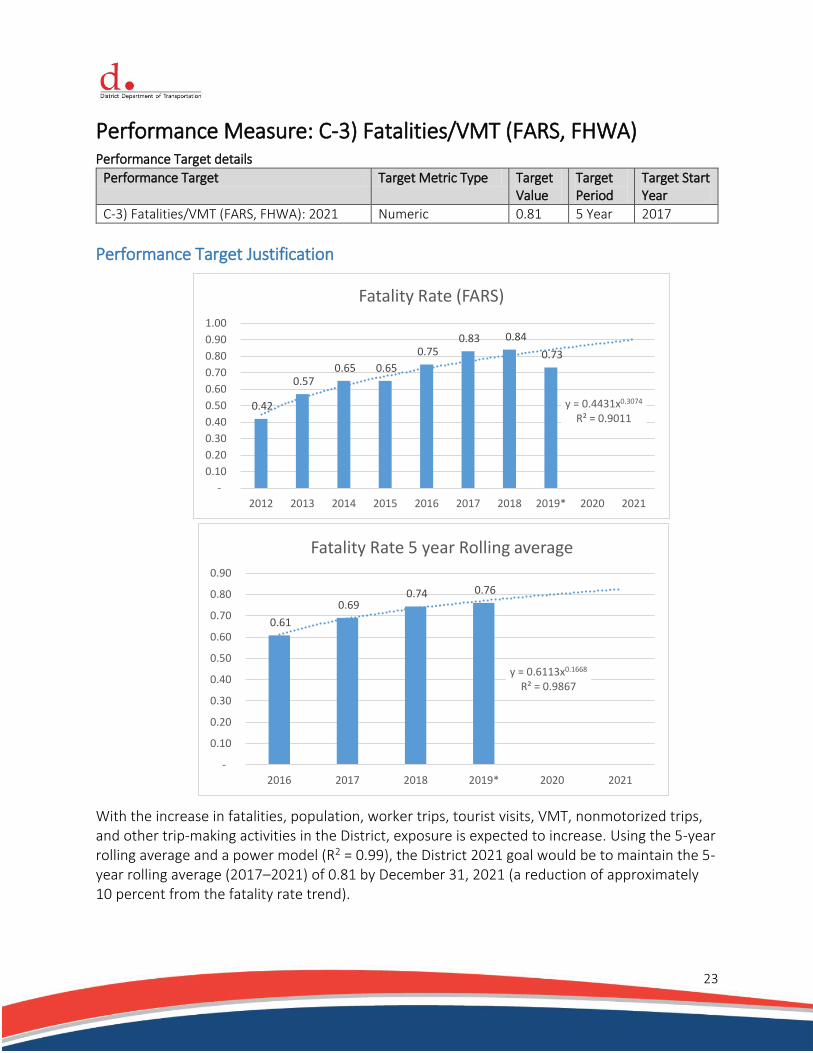
Performance Measure: C-3) Fatalities/VMT (FARS, FHWA) Performance Target details
Performance Target Target Metric Type Target Value
Target Period
Target Start Year
C-3) Fatalities/VMT (FARS, FHWA): 2021 Numeric 0.81 5 Year 2017
Performance Target Justification
With the increase in fatalities, population, worker trips, tourist visits, VMT, nonmotorized trips, and other trip-making activities in the District, exposure is expected to increase. Using the 5-year rolling average and a power model (R2 = 0.99), the District 2021 goal would be to maintain the 5-year rolling average (2017–2021) of 0.81 by December 31, 2021 (a reduction of approximately 10 percent from the fatality rate trend).
0.42
0.57 0.65 0.65
0.75 0.83 0.84
0.73
y = 0.4431x0.3074
R² = 0.9011
-
0.10
0.20
0.30
0.40
0.50
0.60
0.70
0.80
0.90
1.00
2012 2013 2014 2015 2016 2017 2018 2019* 2020 2021
Fatality Rate (FARS)
0.61
0.69 0.74 0.76
y = 0.6113x0.1668
R² = 0.9867
-
0.10
0.20
0.30
0.40
0.50
0.60
0.70
0.80
0.90
2016 2017 2018 2019* 2020 2021
Fatality Rate 5 year Rolling average

24
Performance Measure: C-4. Number of unrestrained passenger vehicle occupant fatalities, all seat positions (FARS) Performance Target details
Performance Target Target Metric Type
Target Value
Target Period
Target Start Year
C-4) Number of unrestrained passenger vehicle occupant fatalities, all seat positions (FARS): 2021
Numeric 3 5 Year 2017
Performance Target Justification
Unrestrained fatalities have fluctuated between 0 and 6 from 2012 to 2019 making it difficult for the models to accurately predict with these fluctuations. However, using the HSO best judgment the District goal is to maintain the number of unrestrained fatalities to no more than the 5-year average (2016–2019) of 3 by December 31, 2021.
y = -0.0179x2 + 0.1964x + 2.1964R² = 0.0041
0
1
2
3
4
5
6
7
2012 2013 2014 2015 2016 2017 2018 2019* 2020 2021
Unrestrained Fatalities
y = 0.05x2 - 0.23x + 2.95R² = 0.4
0
1
2
3
4
2016 2017 2018 2019* 2020 2021
Unrestrained Fatalities5-year Rolling Average

25
Performance Measure: C-5) Number of fatalities in crashes involving a driver or motorcycle operator with a BAC of .08 and above (FARS) Performance Target details
Performance Target Target Metric Type
Target Value
Target Period
Target Start Year
C-5) Number of fatalities in crashes involving a driver or motorcycle operator with a BAC of .08 and above (FARS): 2021
Numeric 12 5 Year 2017
Performance Target Justification
Impaired fatalities have been on an upward trend since 2012. However, in 2018, there was a significant reduction from a high of 15 (2017) to 9. Using the 5-year rolling average and a power model (R2 = 0.94), the District 2021 goal would be to maintain the 5-year rolling average (2017–2021) of 12 by December 31, 2021.
y = 3.437x0.5779
R² = 0.7046
0
2
4
6
8
10
12
14
16
2012 2013 2014 2015 2016 2017 2018 2019* 2020 2021
Impaired Fatalities
y = 6.6026x0.3156
R² = 0.9441
0
2
4
6
8
10
12
14
2016 2017 2018 2019* 2020 2021
Impaired Fatalities5-year Rolling Average

26
Performance Measure: C-6) Number of speeding-related fatalities (FARS) Performance Target details
Performance Target Target Metric Type
Target Value
Target Period
Target Start Year
C-6) Number of speeding-related fatalities (FARS): 2021 Numeric 16 5 Year 2017
Performance Target Justification
Speeding-related fatalities have been on an upward trend since 2012; there has been a slight decrease between 2017 and 2019 (preliminary data). During the first quarter of 2020 (January 1 to March 30) there were 4 speeding-related traffic fatalities compared to 1 during the same time period in 2019. Using the 5-year rolling average and a power model (R2 = 0.98), the District 2021 goal would be to maintain the 5-year rolling average (2017–2021) of 16 by December 31, 2021.
y = 6.1839x0.4524
R² = 0.6447
0
2
4
6
8
10
12
14
16
18
20
2012 2013 2014 2015 2016 2017 2018 2019* 2020 2021
Speeding-related Fatalities
y = 10.134x0.2393
R² = 0.9785
0
2
4
6
8
10
12
14
16
18
2016 2017 2018 2019* 2020 2021
Speeding-related Fatalities5-year Rolling Average

27
Performance Measure: C-7) Number of motorcyclist fatalities (FARS) Performance Target details
Performance Target Target Metric Type
Target Value
Target Period
Target Start Year
C-7) Number of motorcyclist fatalities (FARS): 2021 Numeric 6 5 Year 2017
Performance Target Justification
Motorcycle fatalities fluctuated from 3 and 8 between 2012 and 2019, making it difficult for the models to predict with these small numbers. Using the 5-year rolling average and a polynomial model (R2 = 0.8), the District 2021 goal would be to maintain the 5-year rolling average (2017–2021) of 6 by December 31, 2021.
Performance Measure: C-8) Number of unhelmeted motorcyclist fatalities (FARS) Performance Target details
Performance Target Target Metric Type
Target Value
Target Period
Target Start Year
C-8) Number of unhelmeted motorcyclist fatalities (FARS): 2021
Numeric 1.00 5 Year 2017
Performance Target Justification
Maintain the number of unhelmeted motorcyclist fatalities to no more than the 5-year average (2016–2019) of 1 by December 2021
y = 0.4x + 3.3R² = 0.8
0
1
2
3
4
5
6
2016 2017 2018 2019* 2020 2021
Motorcycle Fatalities5-year Rolling Average

28
Performance Measure: C-9) Number of drivers age 20 or younger involved in fatal crashes (FARS) Performance Target details
Performance Target Target Metric Type
Target Value
Target Period
Target Start Year
C-9) Number of drivers age 20 or younger involved in fatal crashes (FARS): 2021
Numeric 2 5 Year 2017
Performance Target Justification
Fatalities involving a younger driver have increased since 2015 to 3 in 2018; preliminary 2019 data shows
1 younger driver involved. The District goal is to maintain the number of younger-driver fatalities to no more than the 5-year average (2016–2019) of 2 by December 31, 2021.
y = 0.0519x2 - 0.5528x + 2.7857R² = 0.0898
0
0.5
1
1.5
2
2.5
3
3.5
2011 2012 2013 2014 2015 2016 2017 2018 2019* 2020 2021
Fatalities Involving a Younger Driver
y = 0.0143x2 - 0.0657x + 1.52R² = 0.033
0
1
1
2
2
2015 2016 2017 2018 2019* 2020 2021
Fatalities Involving a Younger Driver 5-year Rolling Average

29
Performance Measure: C-10) Number of pedestrian fatalities (FARS) Performance Target details
Performance Target Target Metric Type
Target Value
Target Period
Target Start Year
C-10) Number of pedestrian fatalities (FARS): 2021
Numeric 12 5 Year 2017
Performance Target Justification
Pedestrian fatalities fluctuated from 6 to 13 between 2012 and 2019 and are trending upward. For the first quarter of 2020 (January 1 to March 31, 2020), 5 out of the 9 fatalities reported were pedestrians compared to 3 during the same time period in 2019. Using the 5-year rolling average and a power model (R2 = 0.99), the District 2021 goal would be to maintain the 5-year rolling average (2017–2021) of 12 by December 31, 2021.
y = 7.341x0.2186
R² = 0.5228
0
2
4
6
8
10
12
14
2012 2013 2014 2015 2016 2017 2018 2019* 2020 2021
Pedestrian Fatalities
y = 9.1775x0.1241
R² = 0.9872
0
2
4
6
8
10
12
14
2016 2017 2018 2019* 2020 2021
Pedestrian Fatalities5-year Rolling Average

30
Performance Measure: C-11) Number of bicyclist fatalities (FARS) Performance Target details
Performance Target Target Metric Type
Target Value
Target Period
Target Start Year
C-11) Number of bicyclist fatalities (FARS): 2021 Numeric 2 5 Year 2017
Performance Target Justification
Bicycle fatalities fluctuated from 0 to 3 between 2012 and 2019, making it difficult for the models to predict with these small numbers. Using the 5-year rolling average and a polynomial model (R2 = 0.99), the District 2021 goal would be to maintain the 5-year rolling average (2017– 2021) of 2 by December 31, 2021.
y = -0.006x2 + 0.375x - 0.1607R² = 0.7396
0
0.5
1
1.5
2
2.5
3
3.5
2012 2013 2014 2015 2016 2017 2018 2019* 2020 2021
Bicyclist Fatalities
y = -0.05x2 + 0.59x + 0.25R² = 0.9966
0
1
1
2
2
3
2016 2017 2018 2019* 2020 2021
Bicyclist Fatalities5-year Rolling Average

31
Performance Measure: B-1) Observed seatbelt use for passenger vehicles, front seat outboard occupants (survey) Performance Target details
Performance Target Target Metric Type
Target Value
Target Period
Target Start Year
B-1) Observed seatbelt use for passenger vehicles, front seat outboard occupants (survey): 2020
Numeric 90.00 Annual 2021
Performance Target Justification
Maintain observation belt use to more than 90 percent. Because of the covid-19 pandemic, the survey normally conducted in June 2020 will be held in November 2020 (subject to change pending covid-19 restrictions).
32
Performance Measure: Number of injuries involving an impaired driver Performance Target details
Performance Target Target Metric Type
Target Value
Target Period
Target Start Year
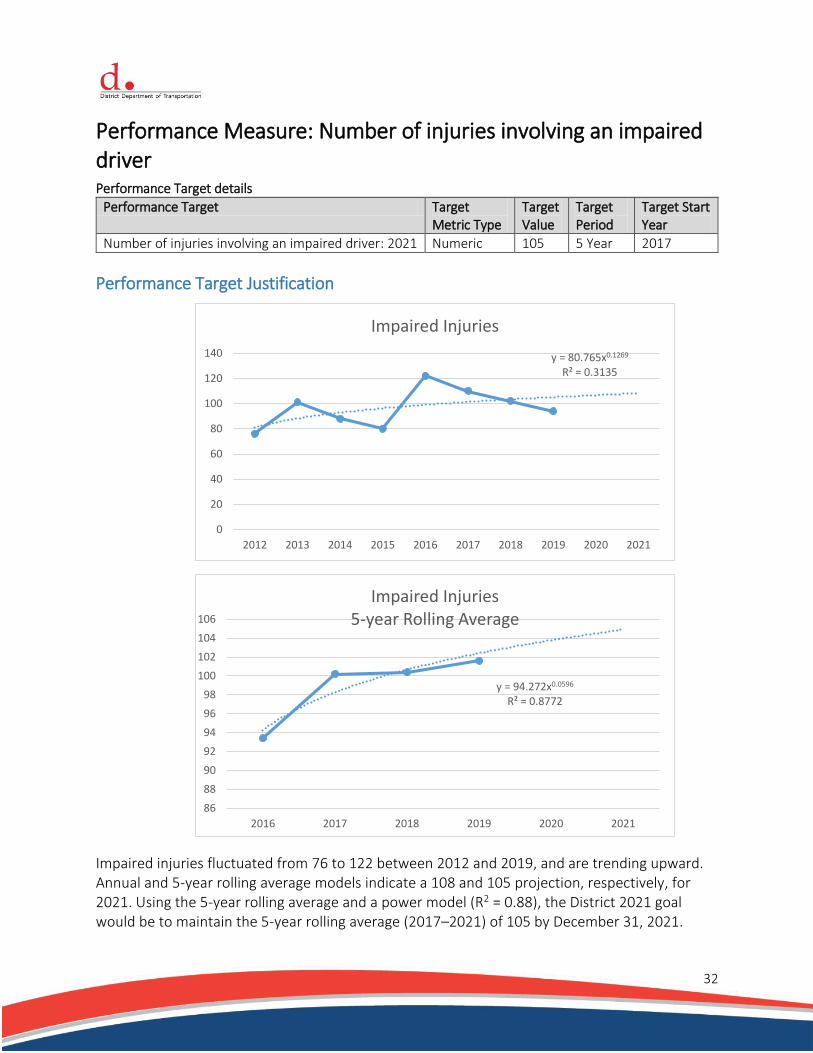
Number of injuries involving an impaired driver: 2021 Numeric 105 5 Year 2017
Performance Target Justification
Impaired injuries fluctuated from 76 to 122 between 2012 and 2019, and are trending upward. Annual and 5-year rolling average models indicate a 108 and 105 projection, respectively, for 2021. Using the 5-year rolling average and a power model (R2 = 0.88), the District 2021 goal would be to maintain the 5-year rolling average (2017–2021) of 105 by December 31, 2021.
y = 80.765x0.1269
R² = 0.3135
0
20
40
60
80
100
120
140
2012 2013 2014 2015 2016 2017 2018 2019 2020 2021
Impaired Injuries
y = 94.272x0.0596
R² = 0.8772
86
88
90
92
94
96
98
100
102
104
106
2016 2017 2018 2019 2020 2021
Impaired Injuries 5-year Rolling Average

33
Performance Measure: Number of injuries involving an aggressive driver Performance Target details
Performance Target Target Metric Type
Target Value
Target Period
Target Start Year
Number of injuries involving an aggressive driver–2021 Numeric 600 5 Year 2017
Performance Target Justification
Speeding-related injuries have trended upwards since 2012. In addition, since March 2020, there have been an increase in aggressive driving resulting from the low traffic volume on the roadways. For the first quarter of 2020 (January 1 to March 31, 2020), 97 out of the 502 injuries reported were speed-related; 19 percent. Using the 5-year rolling average and a power model (R2 = 0.99), the District 2021 goal would be to maintain the 5-year rolling average (2017–2021) of 600 by December 31, 2021.
y = 241.04x0.428
R² = 0.7851
0
100
200
300
400
500
600
700
2012 2013 2014 2015 2016 2017 2018 2019 2020 2021
Speeding-related Injuries
y = 394.05x0.2257
R² = 0.999
0
100
200
300
400
500
600
700
2016 2017 2018 2019 2020 2021
Speeding-related Injuries(5-year Rolling Average)
34
Performance Measure: Number of pedestrian-related injuries Performance Target details
Performance Target Target Metric Type
Target Value
Target Period
Target Start Year
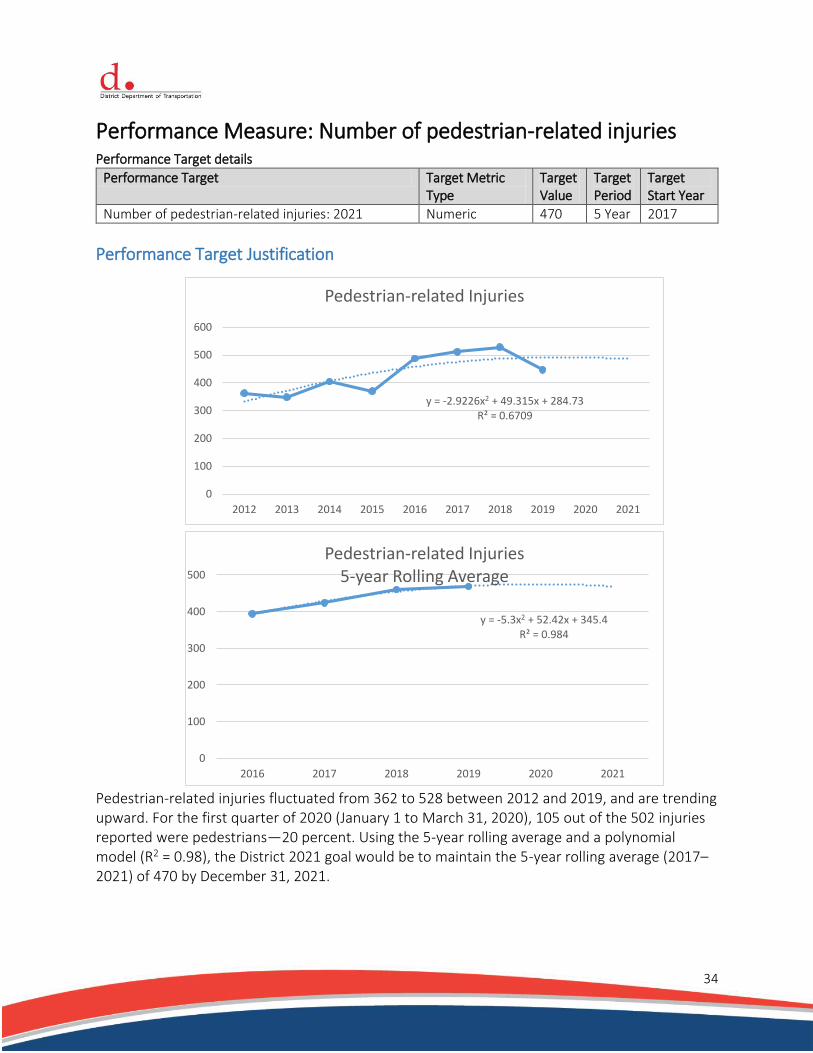
Number of pedestrian-related injuries: 2021 Numeric 470 5 Year 2017
Performance Target Justification
Pedestrian-related injuries fluctuated from 362 to 528 between 2012 and 2019, and are trending upward. For the first quarter of 2020 (January 1 to March 31, 2020), 105 out of the 502 injuries reported were pedestrians—20 percent. Using the 5-year rolling average and a polynomial model (R2 = 0.98), the District 2021 goal would be to maintain the 5-year rolling average (2017–2021) of 470 by December 31, 2021.
y = -2.9226x2 + 49.315x + 284.73R² = 0.6709
0
100
200
300
400
500
600
2012 2013 2014 2015 2016 2017 2018 2019 2020 2021
Pedestrian-related Injuries
y = -5.3x2 + 52.42x + 345.4R² = 0.984
0
100
200
300
400
500
2016 2017 2018 2019 2020 2021
Pedestrian-related Injuries5-year Rolling Average

35
Performance Measure: Number of bicyclist-related injuries Performance Target details
Performance Target Target Metric Type
Target Value
Target Period
Target Start Year
Number of bicyclist-related injuries: 2021 Numeric 380 5 Year 2017
Performance Target Justification
Bicycle injuries fluctuated between 260 to 414 from 2012 and 2017, and are trending sharply upward. The District is currently observing a major increase in bike trips (commuting and recreational), influx of younger non-car-owning residents, and expansion of bike facilities, which when taken together, will result in greater exposure. For the first quarter of 2020 (January 1 to March 31, 2020), 44 out of the 502 injuries reported were bicyclist related—8.8 percent. Using the 5-year rolling average and a power model (R2 = 0.88), the District 2021 goal would be to maintain the 5-year rolling average (2017–2021) of 380 by December 31, 2021.
y = 265.73x0.1667
R² = 0.5564
0
50
100
150
200
250
300
350
400
450
2012 2013 2014 2015 2016 2017 2018 2019 2020 2021
Bicyclist Injuries
y = 321.02x0.0902
R² = 0.8676
280
300
320
340
360
380
400
2016 2017 2018 2019 2020 2021
Bicyclist Injuries5-year Rolling Average

36
Performance Measure: Number of unrestrained-related injuries Performance Target details
Performance Target Target Metric Type
Target Value
Target Period
Target Start Year
Number of unrestrained-related injuries: 2021 Numeric 55 5 Year 2017
Performance Target Justification
Unrestrained injuries fluctuated from a high of 113 (2015) to a low of 41 (2019). A downward trend resulting from District efforts to achieve and maintain a high seatbelt compliance rate (>90 percent). Using the 5-year rolling average and an exponential model (R2 = 0.99), the District 2021 goal would be to maintain the 5-year rolling average (2017–2021) of 55 by December 31, 2021.
y = 163.98e-0.163x
R² = 0.7755
0
20
40
60
80
100
120
140
160
2012 2013 2014 2015 2016 2017 2018 2019 2020 2021
Unrestrianed Injuries
y = 125.93e-0.139x
R² = 0.9952
0
20
40
60
80
100
120
2016 2017 2018 2019 2020 2021
Unrestrained Injuries5-year Rolling Average

37
Certification: State HSP performance targets are identical to the State DOT targets for common performance measures (fatality, fatality rate, and serious injuries) reported in the HSIP Annual Report, as coordinated through the State SHSP. I certify: Yes A-1) Number of seatbelt citations issued during grant-funded enforcement activities. Seatbelt citations: 1,639 Fiscal Year A-1: 2019 A-2) Number of impaired driving arrests made during grant-funded enforcement activities. Impaired driving arrests: 189 Fiscal Year A-2: 2019 A-3) Number of speeding citations issued during grant-funded enforcement activities. Speeding citations: 1,146 Fiscal Year A-3: 2019

38
Program Areas
Program Area: Aggressive Driving
Description of Highway Safety Problems
Overview Aggressive driving usually involves speeding, as well as other factors, such as driving too fast for conditions; exceeding post speed limit; racing; following too closely; improper passing; operating motor vehicle in erratic, reckless, careless, negligent or aggressive manner; ran red light and ran STOP sign. NOTE: With the MPD reporting a new category, racing was included with the injury graphs. The following fines for speeding in DC are based on the number of miles per hour over the posted speed limit.
Violation Fine
Speeding 1–10 mph over limit $50
Speeding 11–15 mph over limit $100
Speeding 16–20 mph over limit $150
Speeding 21–25 mph over limit $200
Speeding 26+ mph over limit $300
DDOT has developed and implemented an automated photo enforcement program called DC StreetSafe; it is designed to reduce the number of violations and improve public safety. The cameras help enforce traffic laws and reduce violations by automatically photographing the rear license plates of vehicles whose drivers violate the regulations. The District has 129 cameras placed throughout the District. All locations are listed here: ddot.dc.gov/automatedenforcement.
39
Speeding-related Data Trends
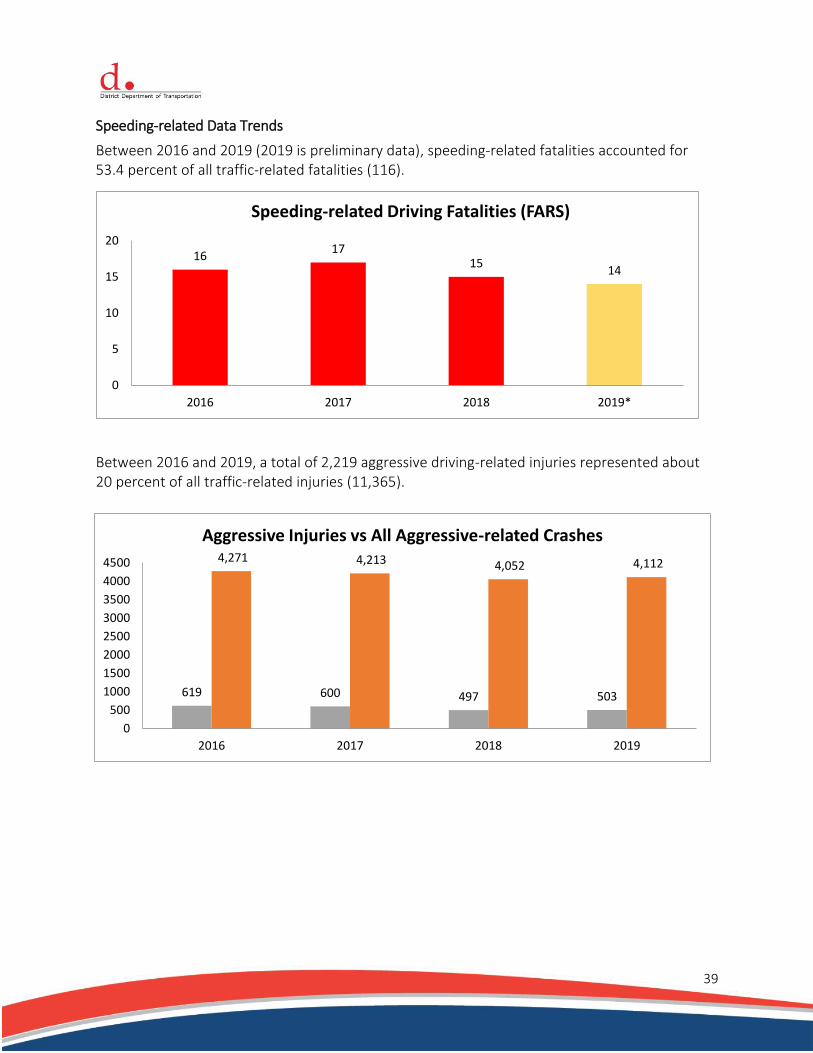
Between 2016 and 2019 (2019 is preliminary data), speeding-related fatalities accounted for 53.4 percent of all traffic-related fatalities (116).
Between 2016 and 2019, a total of 2,219 aggressive driving-related injuries represented about 20 percent of all traffic-related injuries (11,365).
1617
1514
0
5
10
15
20
2016 2017 2018 2019*
Speeding-related Driving Fatalities (FARS)
619 600 497 503
4,271 4,213 4,052 4,112
0
500
1000
1500
2000
2500
3000
3500
4000
4500
2016 2017 2018 2019
Aggressive Injuries vs All Aggressive-related Crashes

40
When aggressive driving injuries occur
The highest frequencies of aggressive driving-related injuries occur between the hours of 8:00 a.m. and noon (20.4 percent), noon to 3:59 p.m. (18.9 percent), 4:00 p.m.–7:59 p.m. (16.8 percent) and 4:00 a.m. to 7:59 a.m. (16.7 percent).
The days of the week with the highest frequencies of aggressive driving-related injuries are Thursdays (16.8 percent), Wednesdays (16.1 percent), Fridays (14.8 percent), and Saturdays (14.4 percent).
Sun Mon Tue Wed Thur Fri Sat
2016 78 61 83 99 102 106 90
2017 81 69 75 88 95 105 87
2018 73 59 63 90 84 57 71
2019 78 49 70 80 92 61 73
0
20
40
60
80
100
120
Aggressive Driving Injuries by Day of the Week
Midnight-3:59 a.m. 4:00 a.m.-7:59 a.m. 8:00 a.m.-11:59 a.m. Noon-3:59 p.m. 4:00 p.m.-7:59 p.m. 8:00 p.m.-11:59 p.m.
2016 82 113 110 120 102 92
2017 78 87 137 108 121 69
2018 75 86 110 95 75 56
2019 88 84 96 97 74 64
0
20
40
60
80
100
120
140
160
Aggressive Driving Injuires by Time of Day

41
The months of the year with the highest frequencies of aggressive driving-related injuries are May (10.7 percent); August (9.2 percent); and April, June, and September (8.9 percent). More crashes occurred on Labor Day, Independence Day and New Year’s holidays.
Where crashes occur
The following presents the distribution of crashes by Ward. The highest aggressive driving-related injuries occurred in Ward 7 (20.4 percent), followed by Ward 8 (16.2 percent), Ward 5 (16 percent), and Ward 2 (14.3 percent).
Jan Feb Mar Apr May June July Aug Sept Oct Nov Dec
2016 40 38 63 54 63 52 59 49 61 60 40 40
2017 54 49 37 48 65 57 52 50 49 47 51 41
2018 28 55 33 49 59 48 40 50 47 22 35 31
2019 35 28 59 46 50 41 42 56 40 42 31 33
0
10
20
30
40
50
60
70
Aggressive Driving Injuries by Month
Ward 1 Ward 2 Ward 3 Ward 4 Ward 5 Ward 6 Ward 7 Ward 8
2016 42 88 25 51 88 96 127 101
2017 36 75 40 43 100 77 109 118
2018 36 75 27 44 78 57 127 53
2019 33 79 16 40 88 67 89 87
0
20
40
60
80
100
120
140
Aggressive Driving Injuries by Ward

42
Who drives aggressively The following presents summaries of aggressive driving-related crashes by gender. From the summaries, male drivers were reported as the highest group involved in aggressive driving-related crashes with 62.5 percent (26.6 percent for female drivers and 11 percent unknown).
The age groups with the highest involvement in aggressive driving-related crashes are 26–30 years (12.8 percent); 21–25 years (10.9 percent), and 31–35 years (10.1 percent). 29 percent were coded as Unknown.
Male Female Unknown
2016 2721 1180 457
2017 2747 1128 427
2018 2581 1083 484
2019 2585 1133 500
0
500
1000
1500
2000
2500
3000
Gender of Aggressive Driver Involved in a Crash
16-20 21-25 26-30 31-35 36-40 41-45 46-50 51-55 56-60 61-65 >65 NULL
2016 153 490 564 447 332 265 234 236 190 114 142 1191
2017 134 495 554 448 333 254 240 238 164 120 136 1186
2018 117 443 538 395 347 247 222 215 143 113 132 1236
2019 112 432 530 430 308 235 221 180 202 113 122 1333
0
200
400
600
800
1000
1200
1400
Age of Aggressive Driver Involved in a Crash

43
The majority of drivers involved in aggressive driving-related crashes reside in the District (27.7 percent), followed by the Maryland (25.7 percent), and Virginia (9.8 percent). There were 7.5 percent from other States, and 29.3 percent accounted for unknowns.
Associated Performance Measures
Fiscal Year
Performance measure name Target End Year
Target Period
Target Value
2021 Number of injuries involving an aggressive driver 2021 5 Year 600
2021 C-6) Number of speeding-related fatalities (FARS) 2021 5 Year 16
Countermeasure Strategies in Program Area
Countermeasure Strategy
Communication Campaign—Aggressive Driving
Enforcement—Police Traffic Services (PTS)
Countermeasure Strategy: Communication Campaign—Aggressive Driving Program Area: Aggressive Driving
Project Safety Impacts
Crash data indicate that the highest number of aggressive-driving fatalities and injuries occur:
Wednesdays to Saturdays between 8 a.m. and 4 p.m.
Male drivers between ages 21 and 35 have the highest incidence of fatalities and injuries in Wards 7, 2, 5, and 8.
Maryland resident fatalities and injuries were about equal to the District.
DC MD VA Other State Unknown
2016 1242 1118 445 396 1157
2017 1231 1128 442 298 1203
2018 1110 1080 387 294 1277
2019 1130 1042 397 293 1355
0
200
400
600
800
1000
1200
1400
1600
Residence of Aggressive Driver Involved in a Crash

44
Highest injuries were noted in May, July, and August.
Paid media will target men ages 18 to 44, as well as high risk takers, and will run in conjunction with regionally coordinated law enforcement waves. The campaign may use a combination of radio, out-of-home advertising, and digital/social media.
Overall Marketing/Communications Goals
Influence audience attitudes in the District of Columbia and Metro area toward aggressive driving behaviors and their destructive consequences.
Continue to support the High-visibility Enforcement (HVE) approach through messaging and media.
Cause and sustain positive behaviors that will help to improve the safety and well-being of our community.
Linkage between Program Area
The District will continue to participate with other public safety officials and law enforcement through the Aggressive Driving Campaign. This program is a model for a coordinated, intra- and interstate program designed to combat aggressive driving problems and find short- and long-term solutions. The campaign provides education, information, and solutions to address the problem of aggressive driving.
The campaign works to influence audience attitudes toward aggressive-driving behaviors and their destructive consequences. Additionally, it promotes positive behaviors that will help improve the safety and well-being of the community.
Rationale
An aggressive enforcement program must be accompanied by an effective outreach campaign. Program evaluation has proved that implementing both elements can achieve the best results. Planned activities in countermeasure strategy
Unique Identifier Planned Activity Name
PM-2021-14-00 Media Campaign—Aggressive Driving
Planned Activity: Media Campaign—Aggressive Driving Planned activity number: PM-2021-14-00 Primary Countermeasure Strategy ID: Communication Campaign—Aggressive Driving
Planned Activity Description
Media Objective Emphasize automated enforcement to increase the perception that law enforcement is targeting speeding and aggressive driving behavior.
45
Media Strategy
Use a mix of traditional media vehicles as well as new media technologies targeted to reach the young male audience.
Use radio as a primary way to reach drivers behind the wheel.
Out-of-Home—MPD Billboard and Bus ads.
Support social media activities with additional content.
Use additional social media advertising tactics to increase ad impressions.
Intended Subrecipients
McAndrew Company is a privately owned, full-service advertising and marketing communications agency. McAndrew has a powerful track record of producing award-winning creative content while raising high levels of awareness and having a positive influence on audience behaviors. For the past 12 years, McAndrew has developed and implemented DDOT’s traffic safety campaigns, including Click It or Ticket, Checkpoint Strikeforce, Aggressive Driving, Distracted Driving and Pedestrian and Bicycle Safety, as well as managed the DC Road Rules website and social media pages.
Countermeasure strategies
Countermeasure Strategy
Communication Campaign—Aggressive Driving
Funding sources
Source Fiscal Year
Funding Source ID
Eligible Use of Funds Estimated Funding Amount
Match Amount
Local Benefit
2021 FAST Act NHTSA 402
Paid Advertising (FAST) $365,000.00 $365,000.00

46
Countermeasure Strategy: Enforcement—PTS Program Area: Aggressive Driving
Project Safety Impacts
The HSO remains committed to using enforcement and education to address unsafe speeding on the District’s roadways. Particular emphasis will continue to monitor driving speeds, enforce posted speed limits, and identify other unsafe driving behaviors in known problem locations areas with a higher incidence of crashes, as well as locations identified from the Data-Driven Approaches to Crime and Traffic Safety (DDACTS). In communities where speed is an issue and where officers cannot be constantly patrolling, a unstaffed speed display devices, also known as speed trailers, can show drivers that they are speeding and may encourage some drivers to slow down, but effects may last only as long as the devices are in place (Donnell & Cruzado, 2008). They may also suggest to drivers that speeds are being monitored or enforcement is nearby. Signs that provided either an implication that speeds were being monitored or a social norms message (average speed at the site; your speed) were effective at reducing speeds. MPD are requesting two (2) speed radar signs to assist with deterring speeding to be placed on these community streets to deter speeding. Electronic ticketing is faster and more efficient way to generate citations and reports for officers. Capturing driver’s license information and vehicle registrations electronically by scanning the driver’s license barcode and/or vehicle registrations or other forms, officers can complete citations and reports easily, quickly, and error-free. Electronic ticketing also allows all citations issued to be captured in one central database. Handwritten citations can take 15–20 minutes or longer to complete; by using an electronic citation process can reduce the average time of stop, data run, and ticket entry to between 4 to 5 minutes. By creating an error-free citation system, e-Citation speeds up the process and decreases the number of illegible tickets (those thrown out). Each traffic stop is unique in nature and depends on the circumstance surrounding the traffic stop. However, the Officer Android e-ticketing system has enabled MPD officers to issue Notice of Infractions (NOIs) in expedient and efficient manner. Phases 1 and 2 of this project are completed and there are currently (as of February 5, 2020) 997 MPD officers using the e-citation writers. MPD is also working on Phase 3—compliance and maintenance issues. The main benefit is to improve timeliness and accuracy over paper reports as was previously used. More than 1,662 MPD officers, including administration users, have been trained in how to use/operate Officer Android (e-Ticketing system).
Phase 4 is to be implemented in FY2021, and will continue to provide maintenance and updates to the e-Ticketing system, continue training, and increase the number of officers using this system.

47
Linkage between Program Area
Provide educational materials and increased enforcement on District roadways to deter aggressive-driving behavior, such as speeding, tailgating, and unsafe lane changes.
Manage MPD grants per NHTSA requirements and support the HSO by attending meetings related to the District’s Strategic Highway Safety Plan, TRCC, and NHTSA meetings.
Reduce the time it takes to issue a citation from fifteen (15) minutes to five (5) minutes; issue multiple violations, when justified, in a matter of minutes; while improving the availability of citations in a central database and reduce the number of citations issued with errors.
Rationale
Enforcement is a proven strategy for deterring aggressive driving. The District will enforce locations based on data (i.e., crash, citations and community feedback), as well as other locations deemed high risk.
Planned activities in countermeasure strategy
Unique Identifier Planned Activity Name
PT-2021-04-01 Police Traffic Services
Planned Activity: Police Traffic Services Planned activity number: PT-2021-04-01 Primary Countermeasure Strategy ID: Enforcement—PTS
Planned Activity Description
Conduct 3,500 overtime hours on speed enforcement at risk locations within the District as identified by the HSO and MPD sources.1
Conduct 700 overtime hours of high visibility enforcement during Aggressive Driving Campaign/holidays.2
Conduct 3,000 overtime hours to support traffic enforcement under MPD DDACTs Program for the Summer Crime Initiative.
Print and distribute 5,000 educational materials to educate the public relating to the dangers of aggressive driving and behaviors.3
Manage and support the HSO grant programs to meet NHTSA requirements.
Attend Traffic Crash Investigation training.
Add printers, hardware devices, batteries, battery chargers, and accessories.
1 Countermeasures that Work, Ninth Edition, 2017, Ch. 3, Section 2.3 2 Countermeasure that Work, Ninth Edition, 2017, Ch. 3, Section 2.2 3 Countermeasure that Work, Ninth Edition, 2017, Ch. 3, Section 4.1

48
Receive and distribute additional equipment.
Continue with training additional officers.
Upgrade server that houses central database and ensure timely submission of citations to the court.
Purchase two speed trailers—SMART 800 Fold Down Speed Limit Signs4.
Intended Subrecipients
Enter intended subrecipients.
The Metropolitan Police Departments (MPD) previous and current experience/qualifications are extensive and well known. It includes 150 years of policing the Nation’s Capital and providing protection and traffic safety to the residents of the District of Columbia, its neighbors, and visitors.
The majority of officers are seasoned veterans of the force and have more than 150 years of combined traffic safety law enforcement experience. Combine this with many other officers who work from MPD's seven police district stations, the Special Operations Division (SOD), and the Patrol Services and School Bureau (PSSB), and the MPD meets and or exceeds the necessary qualifications and experience to achieve its highway safety goals and objectives.
Countermeasure Strategies
Countermeasure strategies in this planned activity
Countermeasure Strategy
Enforcement—Police Traffic Services (PTS)
Funding sources
Source Fiscal Year
Funding Source ID Eligible Use of Funds
Estimated Funding Amount
Match Amount
Local Benefit
2021 FAST Act 405c Data Program
405c Data Program (FAST)
$246,148.54 $246,148.54
2021 FAST Act NHTSA 402
Police Traffic Services (FAST)
$785,245.00 $785,245.00
Major purchases and dispositions
Equipment with a useful life of more than 1 year and an acquisition cost of $5,000 or more.
Item Quantity Unit cost Total Cost NHTSA Share per unit
NHTSA Share Total Cost
Radar Speed Sign 2 $9,200.00 $18,400.00 $9,200.00 $18,400.00
4 Countermeasures That Work, Ninth Edition, 2017, Ch A3, Section 2.2

49
Program Area: Impaired Driving (Drug and Alcohol)
Description of Highway Safety Problems
Overview Consumption of alcohol and drugs continues to be prominent factor in serious injury crashes in the District. The number of drivers under the influence of drugs or/and a combination of both drugs and alcohol is increasing, exacerbating this very serious, complex problem.
Despite the mounting research evidence that driving under the influence of drugs (other than alcohol) is common, there is minimal public awareness of this fact, and drugged drivers are less frequently detected, prosecuted, or referred to treatment when compared to drunk drivers.
The legal drinking age in the District of Columbia is 21, and the MPD enforces the following three very distinct drinking and driving laws:
Driving while intoxicated (DWI). Applies to a person having a statutorily prohibited blood alcohol concentration (BAC) of .08 or higher. (In April 1999, the District of Columbia adopted the .08 percent BAC standard for driving while intoxicated.) The driver can be convicted in court based solely on the breath, blood, or urine results without any structured field sobriety test.
Driving under the influence (DUI). Applies to a person having a BAC of .07 percent or lower. Under D.C. code, a driver can be charged with a DUI offense if, in addition to a BAC reading, the officer has other signs of impairment from a structured field sobriety test and from observations of the suspect's driving behavior.
Underage Drinking. Persons under the age of 21 cannot purchase, consume, or possess alcoholic beverages of any kind. If these drivers are found to be operating a motor vehicle with any measurable amount of alcohol, they will be placed under arrest and charged with DWI—Driving While Intoxicated.
In accordance with the FAST Act, the District of Columbia is rated as a Low Range State and qualifies for 405 funding to continue to support the its efforts to reduce drinking and driving.

50
Impaired-related Data Trends
Between 2015 and 2019 (2019 is preliminary data) there were 50 alcohol impaired-related fatalities, representing 43 percent of all traffic-related fatalities (116).
Between 2016 and 2019, there were 428 impaired-related injuries (alcohol and drugs), representing about 3.7 percent of all traffic-related injuries (11,365).
7
10
15
9 9
0
2
4
6
8
10
12
14
16
2015 2016 2017 2018 2019*
Alcohol-impaired Fatalities
122 110 102 94
919858
911885
0
100
200
300
400
500
600
700
800
900
1000
2016 2017 2018 2019
Impaired-related Injuries vs All Impaired-related Crashes
Impaired-related Injuries Total Impaired-Related Crashes

51
When impaired-related injuries occur Based on the injury data between 2016 and 2019, the majority of these injuries occurred between midnight and 3:59 a.m., followed by the second highest time between 8:00 p.m. and 11:59 p.m.
The days of the week with the highest frequencies of impaired-related injuries are Saturdays and Sundays, with 25.5 percent and 20.1 percent, respectively. About 14.7 percent occur on Fridays and 12.1 percent occur on Thursdays.
Sun Mon Tue Wed Thur Fri Sat
2016 23 8 3 12 19 24 33
2017 22 12 8 12 15 13 28
2018 21 7 10 17 9 16 22
2019 20 8 14 7 9 10 26
0
5
10
15
20
25
30
35
Impaired Driving Injuries by Day of the Week
Midnight-3:59 a.m. 4:00 a.m.-7:59 a.m. 8:00 a.m.-11:59 a.m. Noon-3:59 p.m. 4:00 p.m.-7:59 p.m. 8:00 p.m.-11:59 p.m.
2016 54 6 6 14 15 27
2017 42 8 5 8 16 31
2018 48 4 6 6 14 24
2019 39 5 6 5 19 20
0
10
20
30
40
50
60
Impaired Driving Injuires by Time of Day
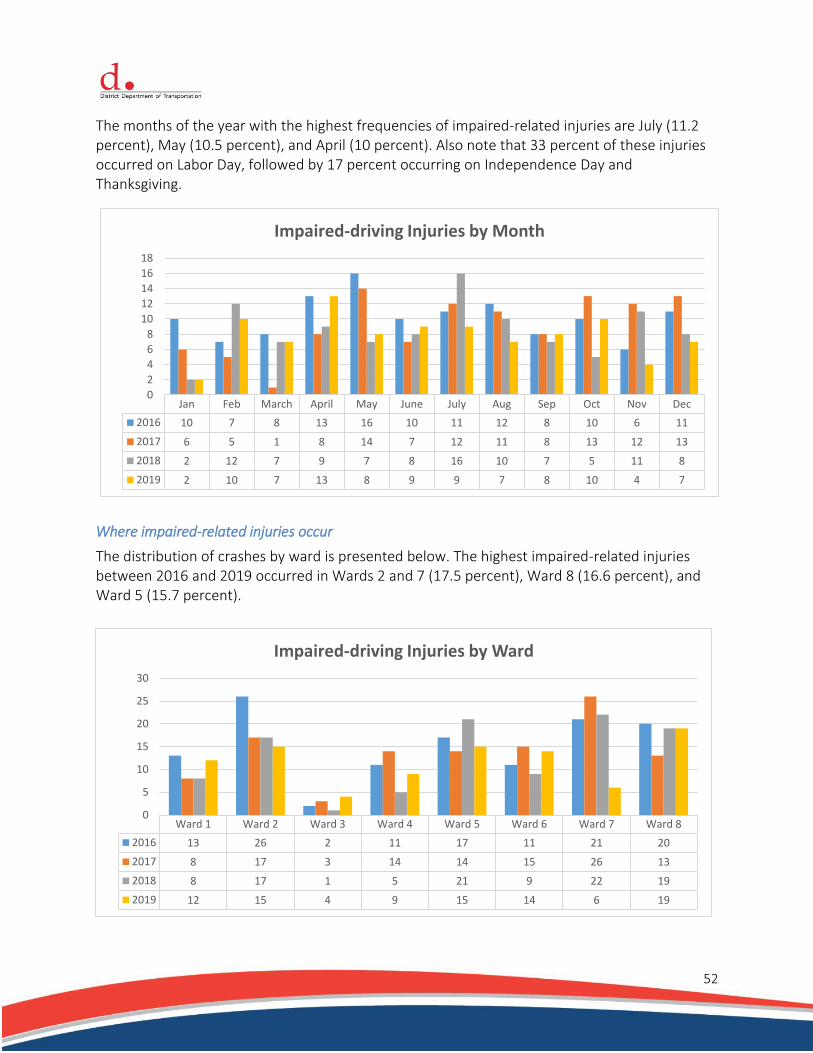
52
The months of the year with the highest frequencies of impaired-related injuries are July (11.2 percent), May (10.5 percent), and April (10 percent). Also note that 33 percent of these injuries occurred on Labor Day, followed by 17 percent occurring on Independence Day and Thanksgiving.
Where impaired-related injuries occur
The distribution of crashes by ward is presented below. The highest impaired-related injuries between 2016 and 2019 occurred in Wards 2 and 7 (17.5 percent), Ward 8 (16.6 percent), and Ward 5 (15.7 percent).
Jan Feb March April May June July Aug Sep Oct Nov Dec
2016 10 7 8 13 16 10 11 12 8 10 6 11
2017 6 5 1 8 14 7 12 11 8 13 12 13
2018 2 12 7 9 7 8 16 10 7 5 11 8
2019 2 10 7 13 8 9 9 7 8 10 4 7
0
2
4
6
8
10
12
14
16
18
Impaired-driving Injuries by Month
Ward 1 Ward 2 Ward 3 Ward 4 Ward 5 Ward 6 Ward 7 Ward 8
2016 13 26 2 11 17 11 21 20
2017 8 17 3 14 14 15 26 13
2018 8 17 1 5 21 9 22 19
2019 12 15 4 9 15 14 6 19
0
5
10
15
20
25
30
Impaired-driving Injuries by Ward

53
Who drives impaired The summaries of impaired driving crashes by gender is presented below. From the summaries, male drivers were reported as highest group involved in impaired-related crashes with an overwhelming majority of 72.6 percent (25.7 percent for female drivers and 1.7 percent unknown).
The age groups with the highest involvement in impaired-related crashes are 26–30 years (18.6 percent), 31–35 years (13.7 percent) and 21-25 years (12.5 percent). Overall, drivers within the 21–35 year age group accounted for 45 percent of all impaired-related crashes. 10.2 percent were coded as unknown.
Male Female Unknown
2016 735 266 19
2017 681 251 18
2018 722 232 23
2019 693 253 8
0
100
200
300
400
500
600
700
800
Gender of Impaired Driver Involved in a Crash
16-20 21-25 26-30 31-35 36-40 41-45 46-50 51-55 56-60 61-65 >65
2016 17 134 182 142 125 86 73 68 46 19 16
2017 11 128 173 126 121 74 57 68 36 29 22
2018 22 122 170 143 117 86 67 62 42 23 23
2019 22 122 170 143 117 86 67 62 42 23 23
020406080
100120140160180200
Age of Impaired Driver Involved in a Crash

54
The majority of drivers involved in impaired-related crashes live in the District (40.2 percent). Maryland drivers accounted for 24.8 percent; Virginia drivers were 8.3 percent. However, 5.5 percent were from other States; 21.2 percent were coded as unknown.
Associated Performance Measures
Fiscal Year
Performance measure name Target End Year
Target Period
Target Value
2021 Number of injuries involving an impaired driver 2021 5 Year 105
2021 C-5) Number of fatalities in crashes involving a driver or motorcycle operator with a BAC of .08 and above (FARS)
2021 5 Year 12
Countermeasure Strategies in Program Area
Countermeasure Strategy
Communication Campaign—Impaired
Court Monitoring
High-visibility Saturation Patrols
Laboratory Drug Testing
DC MD VA Other State Unknown
2016 444 282 91 71 132
2017 374 203 89 58 226
2018 378 244 64 45 246
2019 371 240 78 42 223
0
50
100
150
200
250
300
350
400
450
500
Residence of Impaired Driver involved in a Crash

55
Countermeasure Strategy: Communication Campaign—Impaired Program Area: Impaired Driving (Drug and Alcohol)
Project Safety Impacts
The goal of this outreach is to reduce the number of alcohol-related crashes by informing the public and, more specifically younger adults, on the negative effects of drinking and driving/walking/biking.
Linkage between Program Area
Data state that the highest number of impaired fatalities and injuries occur:
Fridays through Sundays between 8 p.m. and 4 a.m.;
Involve males 21–35;
Months with the highest fatalities and injuries are July, May, and April; and
Wards 7 and 2 has the highest level with a moderate balance through other Wards. Media Objective Increase belief of arrest for drinking and driving. Increase the perception that law enforcement is out with patrols and checkpoints. Education Objective
To increase knowledge and awareness of the dangers of alcohol by promoting healthy decisions through direct educational programs at local public and private high schools and community groups in the District.
Rationale
The District will also continue to participate in the National Enforcement Crackdown—where the primary message is Drive Sober or Get Pulled Over—in the summer months and holidays, as well as in the Checkpoint Strikeforce Campaign (http://www.checkpointstrikeforce.net/). This is a research-based, multi-State, zero-tolerance initiative conducted jointly with Maryland and Virginia. The media campaign by The McAndrew Company operates in conjunction with regional law enforcement waves aimed at getting impaired drivers off the roads and educating the public about the dangers and consequences of drunk drivers. Additional enforcement in deterring excessive drinking is the District’s Cops-in-Shops program, focusing on underage drinking, ABRA compliance checks, and beverage service policies for all ABC license holders.
The HSO will continue to partner with the Washington Regional Alcohol Program (WRAP) and provide communication and outreach strategies to the public on the dangers of driving while impaired. These efforts include education programs for high schools, community groups, and business. The SoberRide campaigns (http://www.wrap.org/soberride/) also provides a no-cost taxicab ride designed to prevent drunk driving.

56
All media/education outreach efforts will be coordinated with the MPD to support High-visibility Enforcement (HVE) waves. This plan will focus on areas with the greatest potential to enhance safety and improve existing traffic safety programs.
Planned activities in countermeasure strategy
Unique Identifier Planned Activity Name
AL-2021-03-00-00 WRAP Education and Outreach
FDLPEM-2021-00 MEDIA Media Campaign—Impaired
Planned Activity: Education and Outreach Planned activity number: AL-2021-03-00-00 WRAP Primary Countermeasure Strategy ID: Communication Campaign—Impaired
Planned Activity Description
Release the "2020 How Safe Are Our Roads?" report prepared through a contract with the Metropolitan Washington Council of Governments (MWCOG) or another similar agency. This detailed report represents an overall picture of the greater Washington area in the areas of impaired driving fatalities, crashes, injuries, and arrests.
Produce and distribute 1,500 copies of at least one FY2021 newsletter and FY2020 annual report. These publications will highlight and communicate WRAP’s program highlights and efforts in the continued need for traffic safety initiatives
Promote and conduct five SoberRide campaigns. Print materials, in English and Spanish, to be distributed for the seasonal media campaigns. Approximately 250,000 printed pieces will be distributed throughout the grant year. The campaigns will run during Halloween 2020, the 2020 Holiday season, St. Patrick's Day 2021, Cinco de Mayo 2021, and Independence Day 2021.
Maintain or increase the 4,681 rides given in FY2019 with the anticipated goals of reaching zero alcohol-impaired traffic fatalities during campaigns will run during Halloween 2020, the 2020 Holiday season, St. Patrick's Day 2021, Cinco de Mayo 2021, and Independence Day 2021.
WRAP's 2020 Law Enforcement Awards for Excellence for Impaired Driving Prevention to be held in December 2020 with expected attendance of 200. At least 14 awards will be given from awardees selected from local law enforcement agencies including MPD, US Park Police, and US Capitol Police.
Host WRAP's 38th Annual Meeting and WRAPPY Awards to be held in October 2020, with expected attendance of 100. At least 25 awards will be given to corporate, public and community, entities.
Update and maintain WRAP's websites (www.wrap.org and www.soberride.com) and social media sites with current news releases, upcoming events, and SoberRide information.
57
Continue to serve as a resource for referrals to a host of audiences, including DC’s newly formed Mayor’s Office of Nightlife and Culture, regarding the issues of impaired driving and underage drinking, as well as exploring opportunities to better compile and disseminate such information.
President or other WRAP staff attend 2021 Lifesavers Conference in Long Beach, California, and/or the annual 2021 GHSA conference in Denver, Colorado, and President attends NHTSA Region 3 meetings.
Contact all public and private District of Columbia high schools through email and direct to promote WRAP's Alcohol Awareness for Students presentation. The evaluation tool for this program is a pre- and post-presentation survey through Survey Monkey.
Expand WRAP's role to help serve as a coordinator and resource for local high school organizations promoting alcohol- and drug-free lifestyles to their peers.
Continue WRAP's leadership role in local, regional, and national coalitions concerning traffic safety and alcohol-related issues. Attend at least five meetings with local and regional coalitions and advisory groups to address alcohol-related issues concerning traffic safety.
Produce and disseminate WRAP's 2021 Youth and Corporate Guide online at wrap.org.
Reach residents, employees, and/or military personnel through presentations given at military facilities and participation at health fairs and other community events. This program is upon-demand and its users have been predominately District area military.
WRAP’s Director of Programs participate in Substance Abuse and Mental Health Service Administration (SAMHSA) 17th Annual Prevention Day or comparable event or activity.
Continue WRAP’s leadership role in District Office of the Attorney General’s regularly convened DUI Enforcement quarterly meetings; coordinate DUI enforcement activities in city and among prosecutorial agencies (AOAG, USDOJ), law enforcement (MPD, USPP, USSS, and USCP) and other (OFTS, MDSAA, NDAA) partners. Upon sought participation of these collective stakeholders, such a role will evolve to serve as a catalyst for the sought creation of a larger DC DUI task force.
Continue to promote and conduct prom and graduation activities at 24 District high schools from mid-April through May to call attention to the perils of drunk driving by advocating that high schools call for a Moment of Silence the week of May 14, 2021. Continue to serve as a resource for area high school students, faculty, and parents on underage drinking prevention data, programs, and efforts.
Intended Subrecipients
Enter intended subrecipients. WRAP is an award-winning nonprofit public-private partnership that has worked to prevent drunk driving and underage drinking in the Washington metropolitan area for 38 years. WRAP’s SoberRide program has successfully removed thousands of would-be drunk drivers from the
58
Greater Washington’s roadways and have reached numerous high school students on alcohol awareness.
Countermeasure strategies
Countermeasure strategies in this planned activity
Countermeasure Strategy
Communication Campaign—Impaired
Funding sources
Source Fiscal Year
Funding Source ID Eligible Use of Funds Estimated Funding Amount
Match Amount
Local Benefit
2021 FAST Act 405d Impaired Driving Low
405d Low Driver Education
$150,000.00
2021 FAST Act NHTSA 402 402 Impaired Driving $12,976.00
Planned Activity: Media Campaign—Impaired Planned activity number: FDLPEM-2021-00 MEDIA Primary Countermeasure Strategy ID: Communication Campaign—Impaired
Planned Activity Description
Campaign/Enforcement Dates September through December
Media Strategy
Use a mix of traditional media vehicles as well as new media technologies to target the young male audience.
Radio will the primary way to reach drivers behind the wheel, other media will include Out-of-Home Transit ads and the MPD Billboard.
Digital and social media.
Intended Subrecipients
McAndrew Company is a privately owned, full-service advertising and marketing communications agency. McAndrew has a powerful track record of producing award-winning creative media while raising high levels of awareness and having a positive effect on audience behaviors. For the past 12 years, McAndrew has developed and implemented the DDOT traffic safety campaigns, including Click It or Ticket, Checkpoint Strikeforce, Aggressive Driving, Distracted Driving and Pedestrian and Bicycle Safety, as well as managed the DC Road Rules website and social media pages.

59
Countermeasure strategies
Countermeasure strategies in this planned activity
Countermeasure Strategy
Communication Campaign—Impaired
Funding sources
Source Fiscal Year
Funding Source ID Eligible Use of Funds
Estimated Funding Amount
Match Amount
Local Benefit
2021 FAST Act 405d Impaired Driving Low
405d Low Paid/Earned Media
$200,000.00 $200,000.00
Countermeasure Strategy: Court Monitoring Program Area: Impaired Driving (Drug and Alcohol)
Project Safety Impacts
To reduce the number of impaired-related crashes by increasing the ability of prosecutors and law enforcement to effectively present and prosecute traffic safety violations, particularly focusing on impaired driving, by providing specialized training, legal research, practical resource materials, and real-time trial support throughout the District. The Office of the Attorney General (OAG) has the responsibility for prosecuting Driving Under the Influence of Alcohol and/or Drug offenses (DUI). The number of alcohol- and/or drug-impaired driving cases presented to the OAG for prosecution remains high. Because of the increased number of cases that exist and continue to rise, there is an urgent need for prosecutors to handle the increased caseload and focus solely on impaired-driving offenses. Some of these cases have unique issues, such as:
1. Multiple police agencies, maintaining distinct breath-testing programs with unique rules and regulations, policies and procedures;
2. Increased usage of police body worn cameras (BWC), street video, and station video cameras that require preserving, redacting, and disclosing footage during pretrial discovery (the District’s failure to preserve video could result in a sanction as severe as dismissal of the charges);
3. Drug impaired-driving cases (decriminalization of small quantities of marijuana, use of phencyclidine, synthetic cannabinoids, cathinones, and opioids);
4. High volume of crash cases that seek redress for crime victims; and 5) in crash cases where defendants are transported to the hospital (due to injury), difficulty in conducting assessment of impairment or inability to have defendant consent to a blood/urine draw.
DUI cases are considered the more challenging cases that the OAG’s Criminal Section handles. The complex issues related to DUI cases that arise requires activity hours devoted to learning and maintaining expertise to be able to assist law enforcement in conducting better
60
investigations, as well as being able to effectively present the evidence in court, and ultimately aim to deter the problem of impaired drivers and create a safer community. The activity hours devoted to DUI Prosecution focus on the more complex cases, including but not limited to children in the car with impaired drivers and repeat offenders. These cases include more intensive pre-trial discovery and novel and complex motions and oral arguments.
Linkage between Program Area
Alcohol- and drug-impaired driving and aggressive driving dominate these statistics. Accordingly, the District must remain vigilant in its efforts to reach zero traffic fatalities.
Some of the criminal traffic violations prosecuted by OAG include, but are not limited to, alcohol-/drug-impaired driving offenses (DUI), reckless driving, failing to yield to a pedestrian, leaving after collision offenses involving property damage and physical injuries (Hit and Run), speeding more than 30 mph over the posted speed limit, and operating nontraditional motor vehicles (ATVs).
Rationale
For enforcement efforts to be effective there must be proper prosecution and adjudication of DUI arrests. Therefore, the OAG is committed to continue funding for a dedicated traffic-safety resource prosecutor (TSRP) position, and a DUI Team comprised of DUI prosecutors and a paralegal with the OAG. OAG works with law enforcement, judicial communities, and policymakers to take a tough stance on impaired driving offences to protect the citizens of the District of Columbia. Comprehensive training arms law enforcement officers and prosecutors with the tools they need to better conduct their investigations and effectively present evidence in court to ultimately convict and deter impaired drivers. The DUI Team also meets and discusses drug impaired-driving cases, marijuana impairment, and discusses the revisions of legislation on marijuana levels and how to effectively prosecute marijuana-impaired cases.
This group meets on a monthly basis for DUI Enforcement meetings hosted by the TSRP. At these meetings, the TSRP keeps attendees abreast of legal issues, courtroom ruling trends, discovery matters, and training opportunities. Furthermore, attendees receive updates from police agency representatives on the occurrences and enforcement measures in their agency. These meetings also allow for creating new training programs, enforcement initiatives, and intra-agency coordination. Planned activities in countermeasure strategy
Unique Identifier Planned Activity Name
M6OT-2021-01-01 OAG/DUI DUI Prosecutor and Paralegal
M6OT-2021-01-01 OAG/TSRP Traffic Safety Resource Prosecutor

61
Planned Activity: DUI Prosecutor and Paralegal Planned activity number: M6OT-2021-01-01 OAG/DUI Primary Countermeasure Strategy ID: Court Monitoring
Planned Activity Description
Activities I: Litigation (Approximately 96 hours per week; 4992 hours per year) Carry caseloads of the most demanding and difficult impaired driving cases, such as repeat offenders, children in car cases, major crash cases and toxicology cases from inception to end. To include, but not limited to, arraignments, body worn camera footage review, review of police paperwork and witness statements, filing pleadings, plea negotiations, trials and motions hearings, and sentencing. Activities II: Intra-office Support (Approximately 4 hours per week; 208 hours per year) Respond to prosecutors’ written and verbal inquiries concerning criminal traffic matters and serve as a resource for prosecutors by offering expertise and assistance for prosecuting traffic safety offenses, and reviewing written case materials on a wide variety of legal issues. This includes, but is not limited to probable cause, Standardized Field Sobriety Tests (SFST), implied consent, breath/blood/urine testing, pretrial procedures, trial practice and strategy, advice with plea negotiations, and appellate practice. Activities III: Screening DUI cases (Approximately 40 hours per week; 2080 hours per year) Review and screen paperwork and body-worn camera footage from police agencies to verify there is sufficient evidence to charge DUI and ensure that the necessary documentation has been obtained from the police agencies. Activities IV: Drug Court (Approximately 12 hours per week; 624 hours per year) Represent the District of Columbia in bi-weekly Drug Court hearings where the prosecutors monitor defendants’ progress through the D.C. Superior Court Drug Intervention Program. This can also include extending Drug Court plea offers and reviewing pre-trial evaluations to determine if Drug Court is an appropriate resolution of the case. Activities V: Training and Technical Support (Approximately 8 hours per week; 416 hours per year) Attend conferences, trainings, and meetings that represent the District of Columbia to learn new information on impairment, prosecution of DUI cases, and traffic safety; and prepare quarterly progress reports.

62
Activities VI: Paralegal Support (Approximately 40 hours per week; 2080 hours per year) A. Build DUI jackets for arraignments, including entering information into Abacus and creating
discovery packets.
B. Redact sensitive information from discovery packets and personnel performance management system (PPMS) documents.
C. Request criminal records through WALES and NCIC.
D. Request local and nationwide driving histories (both preliminary and certified).
E. Order, pick up, and organize MPD station videos.
F. Request subpoenas of civilian witnesses and radio run/911/CAD reports.
G. Maintain statistical information on DUI cases not captured by the OAG case management system.
H. Maintain spreadsheet of all defendants who are referred to and enter into Drug Court.
Intended Subrecipients
The Office of the Attorney General has a long history of focusing on impaired driving. The Criminal Section of OAG has always prosecuted impaired drivers. As a result, the OAG has extensive experience training attorneys and law enforcement in this area, as well as successfully prosecuting impaired-driving cases. OAG is responsible for knowing every aspect of impaired driving and working with related agencies and successfully hold impaired drivers accountable. OAG continuously improves its policies and procedures to support the increased successful prosecutions of impaired drivers. OAG works with all law enforcement agencies in the District to prosecute impaired driving offenses.
Countermeasure strategies
Countermeasure strategies in this planned activity Countermeasure Strategy
Court Monitoring
Funding sources
Source Fiscal Year
Funding Source ID Eligible Use of Funds
Estimated Funding Amount
Match Amount
Local Benefit
2021 FAST Act 405d Impaired Driving Low
405d Low Court Support
$703,500.00

63
Planned Activity: Traffic Safety Resource Prosecutor Planned activity number: M6OT-2021-01-01 OAG/TRSP Primary Countermeasure Strategy ID: Court Monitoring
Planned Activity Description
Activities I: Training
Attend at least eight in-person or electronic media-based trainings to develop and maintain specialized knowledge of traffic safety and impaired-driving issues.
Host/Conduct a minimum of 25 training sessions for prosecutors, law enforcement officers, and other traffic safety professionals to emphasize the effective prosecution of impaired-driving cases. There should be a minimum of five attendees per training. These sessions include, but are not limited to, the following topics:
— Report writing and testimony tips (Cops in Court) to law enforcement;
— Operating breath-testing instruments used by the Metropolitan Police Department (MPD), United States Capitol Police, United States Park Police, and other police agencies;
— DUI Boot Camp for New Prosecutors;
— Qualifying and introducing expert witnesses;
— How to prepare for a DUI trial;
— Review appropriate DUI Plea Guidelines;
— Prosecutor and Toxicologist Guide to Effective Communication in Impaired Driving Cases (with moot court); and
— Legal updates that pertain to District code changes, case law, and other rules and procedures.
Meet quarterly with representatives from the National Traffic Law Center (NTLC); maintain online relationship with other TSRPs nationwide, and when needed, provide technical support to other jurisdictions.
Participate in Sobriety Check program to educate area high school and college students about the consequences of abusing alcohol and drugs.
Facilitate one Advanced Roadside Impaired Driving Enforcement (ARIDE) course with a minimum of 10 law enforcement officers in attendance. Work with MPD to develop a more comprehensive ARIDE and Drug Recognition Expert (DRE) program.
Attend some of the following conferences: Lifesavers Conference, the TSRP annual meeting, NHTSA regional meeting, DRE conference, and/or any additional conferences that promote

64
traffic safety. When possible, provide subject matter expertise on topics requested. Provide a summary of lessons learned to the DDOT Highway Safety Office.
Activities II: District-wide Resource
Meet with and support MPD and other law enforcement agencies, DDOT, the Office of the Chief Medical Examiner, and the Executive Office of the Mayor.
Facilitate preservation of blood/urine specimens collected from impaired drivers at Washington area hospitals.
Host/Conduct quarterly DUI enforcement meetings and annual DRE meetings to train and assist police officers and other traffic safety professionals. Representatives from at least three different police agencies should attend the monthly enforcement meetings. Facilitate quarterly meetings with the OCME to discuss toxicology and breath program issues pertinent to impaired driving.
Participate in Community Outreach Events, such as WRAP SoberRide Kick-Offs, NHTSA Drive Sober or Get Pulled Over, Checkpoint Strikeforce, Responsibility.org congressional meetings, and the District’s Vision Zero.
Regularly attend the District Traffic Records Coordinating Committee quarterly meetings, and the Strategic Highway Safety Program meeting(s). Prepare quarterly report that includes statistical information on DUI cases to be shared with the HSO office and TRCC committee.
Activities III: Intra-office Support
Communicate trends in impaired-driving enforcement and prosecution, updates in the law, and other issues to prosecutors at bi-weekly staff meetings, and/or bi-weekly e-mail communication.
Screen (paper) or assist with the screening of a minimum of 350 impaired-driving arrests, arrest warrant applications, search warrant applications, and judicial summons cases. Assist law enforcement with biological specimen-preservation requests. Screen DUI offenders for Drug Court placement.
Provides technical support to prosecutors dealing with impaired-driving cases. Technical support ranges from assisting with pretrial plea negotiations, litigation support, pre-trial preparation, witness conferences, case law, legal research, writing and editing legal arguments, reviewing body-worn camera footage, and aiding with sentencing. Can serve as second chair prosecutors in Court on difficult impaired-driving litigation.
Observe court proceedings on a biweekly basis to identify problem areas and any need for additional training.
Support pretrial discovery by securing toxicology reports from OCME, breath litigation materials, and save to a shared database for attorney access. Submit requests to Federal Agencies for street and station video, and upon receipt, deliver to attorneys. Secure FEMS reports.

65
Maintain and provide intra-office resources to prosecutors so they have easy access to pleadings, expert witness materials, trial preparation materials, and pertinent caselaw. Create DUI trial binders for new attorneys.
Keep Probation Show Cause (PSC) database and provide litigation support to track DUI offenders who violate terms of probation.
Retain a caseload of approximately 20–25 serious traffic (DUI) cases so as to remain current on litigation skills, including pretrial preparation, legal writing, plea negotiations, and trial.
Activities IV: Legislative Support
Advocate on behalf of the District and provide technical assistance of changes, if necessary, to the impaired driving, reckless driving, and other traffic safety laws. Review the effectiveness of the current impaired driving laws, and determine what, if any, modifications are to be made.
Serve on or support the Criminal Jury Instruction committee, particularly in DUI jury instructions.
Write quarterly submissions to the TSRP blog pertaining to trends in impaired driving.
Intended Subrecipients
The Office of the Attorney General has a long history of focusing on impaired driving. As such, OAG has extensive experience training attorneys and law enforcement in this area, as well as, successfully prosecuting impaired-driving cases. The OAG must know every aspect of these charges and has worked over the years with allied agencies to successfully hold motorists accountable. OAG has continuously made improvements in policies and procedures to assist with the increased successful prosecutions of impaired drivers. OAG works with all law enforcement agencies in the District in prosecuting impaired driving offenses.
Over the past decade OAG has used grants from the DDOT to hire and use a Traffic Safety Resource Prosecutor. This position has enabled OAG focus more attention to impaired-driving cases as the number of arrests has increased. As a result, this funded position has significantly increased work product and prosecution of these types of offenses.
Countermeasure strategies
Countermeasure Strategy
Court Monitoring
Funding sources
Source Fiscal Year
Funding Source ID Eligible Use of Funds
Estimated Funding Amount
Match Amount
Local Benefit
2021 FAST Act 405d Impaired Driving Low
405d Low Court Support
$187,000.00 $187,000.00

66
Countermeasure Strategy: High-visibility Saturation Patrols Program Area: Impaired Driving (Drug and Alcohol)
Project Safety Impaired driving can refer to operating a motor vehicle while under the influence of alcohol, drugs, or both. While alcohol-impaired driving is well researched and understood, little is known of drug-impaired driving, especially since NHTSA tracks more than 400 drugs, both legal and illegal, that can cause impairment—and each one has a different effect on every user. The alcohol-impaired driving laws are better understood and easier to enforce than those for drug-impaired driving.
If drivers believe that driving impaired is likely to be detected and result in an arrest, conviction, and punishment, many will not drive impaired. The Traffic Safety Specialized Enforcement Branch (TSSEB) will continue to coordinate high-visibility sobriety saturated patrols/checkpoints citywide on a weekly/monthly basis. Enforcement will be conducted in conjunction with the alcohol van, increasing enforcement visibility, and with MPD officers equipped with body cameras to strengthen their convictions.
Linkage between Program Area
MPD will enforce the District DUI laws, as well as continue to support the efforts of Check force Strikepoint campaign runs the months of January, February–Super Bowl, March–St Patrick’s Day, May–Cinco de Mayo, August, October–Halloween, November, and December Holidays, as well as NHTSA-designated crackdown periods.
Rationale The HSO has partnered with MPD to enforce the District’s DUI laws by regularly conducting saturated patrol, publicizing checkpoints, and using specially trained officers and equipment in high-risk locations. Both methodologies are found in the NHTSA publication Countermeasures That Work: A Highway Safety Countermeasure Guide for State Highway Safety Offices, 9th Edition, 2018. This effort would include uniformed law enforcement officers saturating a high DUI-related crash area and engaging the driving public by pulling over as many traffic violators as possible to serve as a deterrent to impaired driving. The HSO and other MPD sources identify these high-risk locations. As an additional deterrent, the HSO and MPD have also invested in building an Impaired Driving Mobilizing Processing Unit, which is a fully functional DUI processing center equipped with Intoxilyzer, breath-testing instruments, fingerprint equipment, holding cell, officers’ workstations, and all other necessary equipment and supplies. Using this van will also increase the efficiency of onsite DUI processing, checkpoints, and as a result, an increase in DUI arrests. This hybrid approach, along with the associated national crackdowns and mobilization, will provide continuous direct and general deterrence in impaired driving.
Planned activities in countermeasure strategy
Unique Identifier Planned Activity Name
M6OT-2021-01 Enforcement Impaired Driving

67
Planned Activity: Enforcement Impaired Driving Planned activity number: M6OT-2021-01 Primary Countermeasure Strategy ID: High-visibility Saturation Patrols
Planned Activity Description
Conduct 5,200 overtime hours for alcohol enforcement for saturated patrol/checkpoints during the day and times based on crash data at high-risk locations and using the impaired driving van and body cameras.5
Conduct 800 overtime hours for enforcement during Checkpoint Strikeforce, National Crackdowns and holidays where high-visibility enforcement is required and also using the impaired driving van and body cameras.6
Conduct 1,000 overtime hours of enforcement on underage drinking/purchasing alcohol and selling of alcohol to minors).
Conduct new SFST Training—32 hours of class; two classes in each of the seven Districts with a minimum of 10 new officers (140 officers).
Conduct SFST Refresher Course—8 hours of class; 3 classes per year with a minimum of 20 officers (60 officers).
Conduct Intoximeter training—40 hours of class; 4 classes per year with a maximum of 12 officers.
Intended Subrecipients
The MPD’s past and current experience/qualifications are extensive and well known. It includes 150 years of policing the Nation’s Capital and providing protection and traffic safety to the residents of the District of Columbia, its neighbors, and visitors. The majority of officers are seasoned veterans of the force and have over 100 years of combined traffic safety law enforcement experience. Combine this with many other officers who work from the MPD's seven police district stations, the Special Operations Division (SOD), and the Patrol Services and School Bureau (PSSB), and the MPD meets and or exceeds the necessary qualifications and experience to meet its highway safety objectives and goals.
Countermeasure strategies
Countermeasure Strategy
High-visibility Saturation Patrols
5 Countermeasures that Work, Ninth Edition, 2017, Ch. 1, Section 2.2 6 Countermeasures that Work, Ninth Edition, 2017, Ch. 1, Section 2.2

68
Funding sources
Source Fiscal Year
Funding Source ID Eligible Use of Funds
Estimated Funding Amount
Match Amount
Local Benefit
2021 FAST Act 405d Impaired Driving Low
405d Low Police Traffic Services
$534,000.00 $534,000.00
Countermeasure Strategy: Laboratory Drug Testing Program Area: Impaired Driving (Drug and Alcohol)
Project Safety Impacts
In the District of Columbia, approximately 94 percent of toxicology tests of individuals suspected of being impaired while driving was positive for alcohol or drugs in 2019 (calendar year). Of those drivers, 19 percent were positive for phencyclidine (PCP), 37 percent were positive for marijuana metabolite, 12 percent were positive for cocaine, and 8 percent were positive for fentanyl. In addition, 2018 fatality data from the OCME annual report demonstrates ethanol being present in 29 percent of traffic-related cases. Overall, this continued increase in positive casework creates workload challenges that negatively affect driving-under-the-influence casework turnaround time and backlog numbers.
The OCME Forensic Toxicology Laboratory conducts the blood and urine analyses for MPD. This service is extensive, and because it is interconnected with all toxicology testing, it involves multiple full-time equivalent (FTE) positions and consumes scientific and administrative resources. Scientifically, the laboratory provides screening and confirmation for alcohol and drugs of abuse. Administratively, the laboratory provides expert testimony services, litigation documentation, and specialized training for local prosecutors and law enforcement officials. With staff supported by grant funds, average turnaround time of DUI (Driving under the Influence) and DUID (Driving under the Influence of Drugs) casework was 30 days in 2019, an improvement from 2016 when 53.8 days was the average turnaround time for all DUI and DUID cases. In terms of turnaround time, the laboratory is striving to continue to increase the percentage of cases reported within 30 days. The years 2017, 2018, and 2019 had 30 percent, 62 percent, and 62 percent, respectively, cases reported within 30 days.
Linkage between Program Area
To address turnaround time, testimony services, method development, and monthly data gathering and distribution, the OCME is seeking continued staffing of two FTE positions (DUI toxicologists), training, and supplies, and services to supplement DUID enforcement.
The two toxicologists will continue to use and improve new in-house methodologies that support detection and reporting of drugs known to cause impairment, as well as provide direct, timely testing of DUI specimens, expert testimony, and rapid data-analysis services to stakeholders.

69
Training will help support both the toxicologists and the evidential breath program, helping the toxicologists maintain the in-house requirements of continuing education and supporting testing efforts by staying current with DUID trends and new methodology.
To address supplies, the OCME is seeking laboratory consumables in order to test DUI and DUID specimens, as well as NIST traceable ethanol gas tanks to support the breath program.
The laboratory is committed not only to offering an expansive testing panel, but focus is also given to monitoring acceptability trends. With the Federal Workplace Drug Testing Program now accepting oral fluids as a suitable specimen for testing, it is imperative that the laboratory explore oral fluids as an option to help support DUI and DUID efforts. As such, training specifically focused on oral fluid methodology (extraction and instrumentation), as well as expert testimony (to include interpretation) are paramount. Oral fluids allow for a less restrictive, less invasive, and less cumbersome collection process. At year end, the laboratory will report its findings regarding the toxicological assessment of being able to offer oral fluid testing for DUI and DUID cases.
Rationale
The District’s evidential breath program (initiated September 2012), as well as other enforcement efforts, influenced the number of MPD toxicology submissions between FY2012 and FY2019 (see Table below). However, even with the availability of the program, the number of specimens submitted has been increasing in recent years.
Fiscal Year FY2012 FY2013 FY2014 FY2015 FY2016 FY2017 FY2018 FY2019
MPD DUI Cases (n)
681 401 295 308 343 355 456 495
Estimated Cost of
Testing (K) 170.25 100.25 73.75 77 80 85 108 120
The OCME currently screens more than 450 urine cases a year. Average turnaround time for casework is approximately 30 days. The agency would like to reduce this time to fewer than 15 days and further expedite the court process. Equipment and resources applied in FY2019 are being used to achieve this long-term goal. In addition, technology applied will help analyze different types of drugs in DUID casework. Planned activities in countermeasure strategy
Unique Identifier Planned Activity Name
FDLBAC-2021-01-03-00 Chemical Testing of Impaired Drivers

70
Planned Activity: Chemical Testing of Impaired Drivers Planned activity number: FDLBAC-2021-01-03-00 Primary Countermeasure Strategy ID: Laboratory Drug Testing
Planned Activity Description
Continue to provide comprehensive DUI and DUID testing of District drivers suspected of impaired driving while reducing turnaround times and overall backlog of casework.
Continue to share data and provide information and analysis to assist stakeholders with decreasing the prevalence of DUI and DUID in the District of Columbia.
Improve specific services by increasing DUI and DUID chemical testing knowledge base by sending toxicologists and breath program employees to forensic toxicology scientific workshops and conferences.
Increase knowledge on alternative sample matrices, such as oral fluids, by attending scientific workshops and conferences.
Intended Subrecipients
Enter intended subrecipients. The Forensic Toxicology Laboratory for the OCME performs forensic testing on driving under the influence (DUI) and driving under the influence of drugs (DUID) casework occurring in the District of Columbia. Increasingly, the laboratory has used grant funds to decrease testing turnaround time and expand the scope of its analysis to meet stakeholders’ needs and meet the challenges caused by drugs and driving nationwide. The testing provided is complex and uses multiple full-time positions, equipment, and supplies to maintain quality. The testing allows prosecutors to complete cases faster and provides information so that DDOT can obtain more objective insight about the District’s impaired driving population.
Countermeasure strategies
Countermeasure strategies in this planned activity
Countermeasure Strategy
Laboratory Drug Testing Equipment
Funding sources
Source Fiscal Year
Funding Source ID Eligible Use of Funds
Estimated Funding Amount
Match Amount
Local Benefit
2021 FAST Act 405d Impaired Driving Low
405d Low Court Support
$336,262.03
71
Program Area: Nonmotorized (Pedestrians and Bicyclists)
Description of Highway Safety Problems
Overview
Pedestrians and bicyclists are among our most vulnerable roadway users and they suffer more serious injuries than vehicle occupants when involved in a crash with a motor vehicle. The District has placed pedestrian enforcement efforts in areas identified as particularly dangerous. These efforts emphasize education and safety tips to increase community member awareness.
The Council of the District of Columbia enacted the Pedestrian Safety Amendment of 2005 on March 16, 2005. The law has increased the civil infractions and fines for pedestrians who violate safety measures. Fines range from $10 to $50.
DC Code Title 50, Sections 2201 through 2221 and DCMR Title 18, detail how a driver should operate a motor vehicle on the streets of the District of Columbia:
Failure to STOP and give right-of-way to a pedestrian who has begun crossing on the WALK signal (signalized intersection).
$75 and 3 points
Failure to STOP and give right-of-way to a pedestrian crossing the roadway within any marked crosswalk or unmarked crosswalk at an intersection (unsignalized crosswalk).
$250 and 3 points
Overtaking a stopped vehicle from the rear at a marked crosswalk or at an unmarked crosswalk to permit a pedestrian to cross the roadway.
$250 and 3 points
Failure to give right-of-way to a pedestrian on a sidewalk (e.g., alleys and parking lots).
$250 and 3 points
Colliding with a pedestrian while committing any of the above-listed offenses.*
$500 and 6 points
* Criminal charges are possible. Penalty for colliding with a pedestrian leads to a double fine.
When traveling on city streets, cyclists should follow the same rules of the road as motorized vehicles. This means stopping at STOP signs, obeying traffic signals and lane markings, and using hand signals to let others know the cyclist’s intention to stop or turn. Furthermore, cyclists must to be aware of their surroundings.
In accordance with the FAST Act, the District of Columbia qualifies for a 405(h) incentive grant for Nonmotorized safety by having exceeded 15 percent of the total annual crash fatalities in 2015 (14 out of 23; 61 percent).

72
Pedestrian Data Trends
Between 2015 and 2019 (2019—preliminary data) there were 55 pedestrian fatalities, representing 47.4 percent of all traffic-related fatalities (116).
Between 2016 and 2019, there were 1,973 pedestrian-related injuries representing about 17.4 percent of all traffic-related injuries (11,365).
13
8
11 1112
0
2
4
6
8
10
12
14
2015 2016 2017 2018 2019*
Pedestrian Fatalities (FARS)
487 511 528447
1,022 1,104
1,201
1,071
0
200
400
600
800
1000
1200
1400
2016 2017 2018 2019
Pedestrian Injuries vs Pedestrian Crashes
Pedestrian Injuries Pedestrian Crashes

73
When injuries occur
The highest frequencies of pedestrian injuries occur between the hours of 4 p.m. to 7:59 p.m. (28.4 percent), noon to 3:59 p.m. (22.9 percent), and 8:00 a.m. to 11:59 a.m. (15.2 percent).
The days of the week with the highest frequencies of pedestrian injuries are Tuesdays, Fridays, and Wednesdays with 16.9 percent, 16.7 percent, and 16.4 percent, respectively.
Sun Mon Tue Wed Thur Fri Sat
2016 37 74 72 82 76 86 60
2017 50 67 97 90 76 83 48
2018 58 61 90 86 75 86 72
2019 46 61 74 66 75 74 51
0
20
40
60
80
100
120
Pedestrian Injuries by Day of the Week
Midnight-3:59 a.m. 4:00 a.m.-7:59 a.m. 8:00 a.m.-11:59 a.m. Noon-3:59 p.m. 4:00 p.m.-7:59 p.m. 8:00 p.m.-11:59 p.m.
2016 37 79 73 116 137 45
2017 43 64 77 117 155 55
2018 46 71 81 124 140 66
2019 28 72 69 95 128 55
0
20
40
60
80
100
120
140
160
180
Pedestrian Injuires by Time of Day

74
The months of the year with the highest frequencies of pedestrian injuries are May (9.9 percent, October (9.6 percent), August (9.5 percent), and September (9.1 percent).
Where they happen
The distribution of crashes by Ward is presented below. The highest pedestrian injuries occurred in Ward 2 (23.5 percent), followed by Ward 6 (14.2 percent), Ward 1 (11.7 percent), and Ward 5 (11.4 percent).
Jan Feb Mar April May June July Aug Sept Oct Nov Dec
2016 38 39 44 33 46 45 38 40 42 50 41 31
2017 39 34 36 37 47 45 42 42 49 55 45 40
2018 42 30 48 43 56 41 39 51 52 41 38 47
2019 32 24 46 35 47 41 27 54 36 43 31 31
0
10
20
30
40
50
60
Pedestrian Injury by Month
Ward 1 Ward 2 Ward 3 Ward 4 Ward 5 Ward 6 Ward 7 Ward 8
2016 59 123 40 50 50 60 47 57
2017 53 124 28 39 57 73 66 66
2018 72 122 38 48 59 78 50 61
2019 46 95 32 43 59 70 44 58
0
20
40
60
80
100
120
140
Pedestrian Injuries by Ward

75
Who is involved
The summaries of pedestrian crashes by gender is presented below. The data revealed that female pedestrians (50.1 percent) are slightly more involved in crashes than male pedestrians (49.8 percent).
The age groups with the highest involvement in pedestrian crashes are 26–30 years (13.7 percent), 21–25 years (12 percent), and 31–35 years (9.9 percent). Overall, pedestrian within the 21–35 year age group accounted for 35.5 percent of all pedestrian crashes.
Male Female Unknown
2016 566 528 2
2017 585 603 2
2018 641 641 1
2019 544 578 4
0
100
200
300
400
500
600
700
Gender of Pedestrian Involved in a Crash
01-05 06-10 11-15 16-20 21-25 26-30 31-35 36-40 41-45 46-50 51-55 56-60 61-65 >65 NULL
2016 22 41 56 59 112 151 110 77 54 66 68 78 63 83 56
2017 32 44 53 53 162 145 126 79 73 72 80 69 71 68 63
2018 32 35 63 83 155 179 125 102 71 71 86 73 55 103 50
2019 25 44 61 61 134 166 103 80 56 64 64 66 62 91 49
020406080
100120140160180200
Age of Pedestrian Involved in a Crash

76
The majority of pedestrians involved in crashes reside in the District (67.3 percent). Pedestrians residing in Maryland and Virginia make up 12.9 and 5.8 percent, respectively. However, 7.1 percent are from other States and 6.9 percent were coded as other or unknown.
Bicycle Crashes
There were 8 bicycle fatalities in the District between 2016 and 2019, representing 6.9 percent of all traffic-related fatalities (116).
2016 2017 2018 2019
DC 731 803 864 762
MD 138 156 162 148
VA 65 79 71 56
Other State 84 72 96 82
Unknown 78 80 90 78
0100200300400500600700800900
1000
Residence of Pedestrian involved in a Crash
1
2
3
2
0
0.5
1
1.5
2
2.5
3
3.5
2016 2017 2018 2019*
Bicyclist Fatalities (FARS)
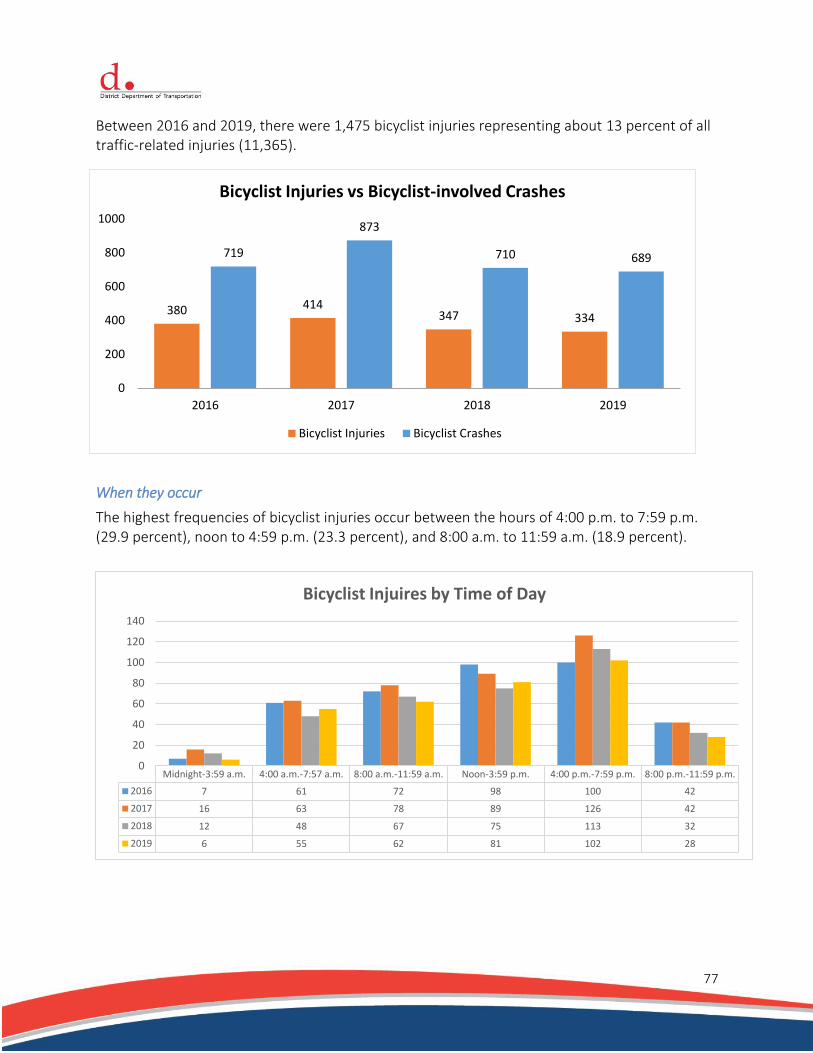
77
Between 2016 and 2019, there were 1,475 bicyclist injuries representing about 13 percent of all traffic-related injuries (11,365).
When they occur
The highest frequencies of bicyclist injuries occur between the hours of 4:00 p.m. to 7:59 p.m. (29.9 percent), noon to 4:59 p.m. (23.3 percent), and 8:00 a.m. to 11:59 a.m. (18.9 percent).
380 414347 334
719
873
710 689
0
200
400
600
800
1000
2016 2017 2018 2019
Bicyclist Injuries vs Bicyclist-involved Crashes
Bicyclist Injuries Bicyclist Crashes
Midnight-3:59 a.m. 4:00 a.m.-7:57 a.m. 8:00 a.m.-11:59 a.m. Noon-3:59 p.m. 4:00 p.m.-7:59 p.m. 8:00 p.m.-11:59 p.m.
2016 7 61 72 98 100 42
2017 16 63 78 89 126 42
2018 12 48 67 75 113 32
2019 6 55 62 81 102 28
0
20
40
60
80
100
120
140
Bicyclist Injuires by Time of Day
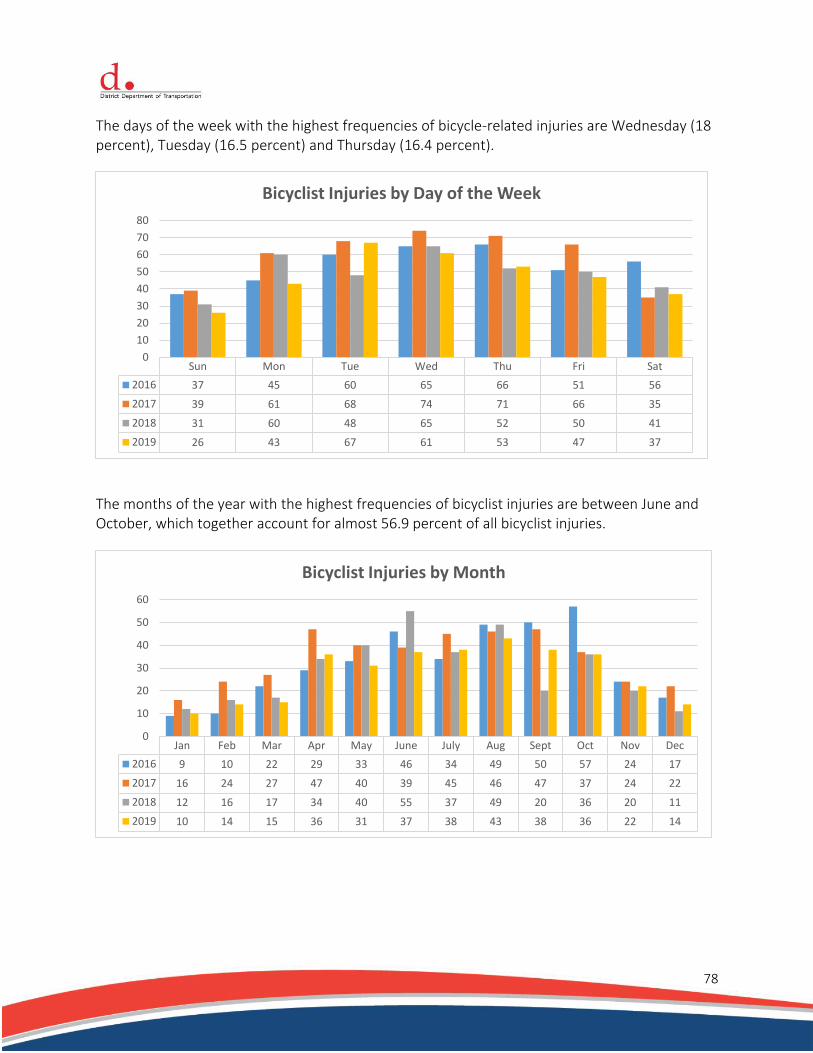
78
The days of the week with the highest frequencies of bicycle-related injuries are Wednesday (18 percent), Tuesday (16.5 percent) and Thursday (16.4 percent).
The months of the year with the highest frequencies of bicyclist injuries are between June and October, which together account for almost 56.9 percent of all bicyclist injuries.
Sun Mon Tue Wed Thu Fri Sat
2016 37 45 60 65 66 51 56
2017 39 61 68 74 71 66 35
2018 31 60 48 65 52 50 41
2019 26 43 67 61 53 47 37
0
10
20
30
40
50
60
70
80
Bicyclist Injuries by Day of the Week
Jan Feb Mar Apr May June July Aug Sept Oct Nov Dec
2016 9 10 22 29 33 46 34 49 50 57 24 17
2017 16 24 27 47 40 39 45 46 47 37 24 22
2018 12 16 17 34 40 55 37 49 20 36 20 11
2019 10 14 15 36 31 37 38 43 38 36 22 14
0
10
20
30
40
50
60
Bicyclist Injuries by Month
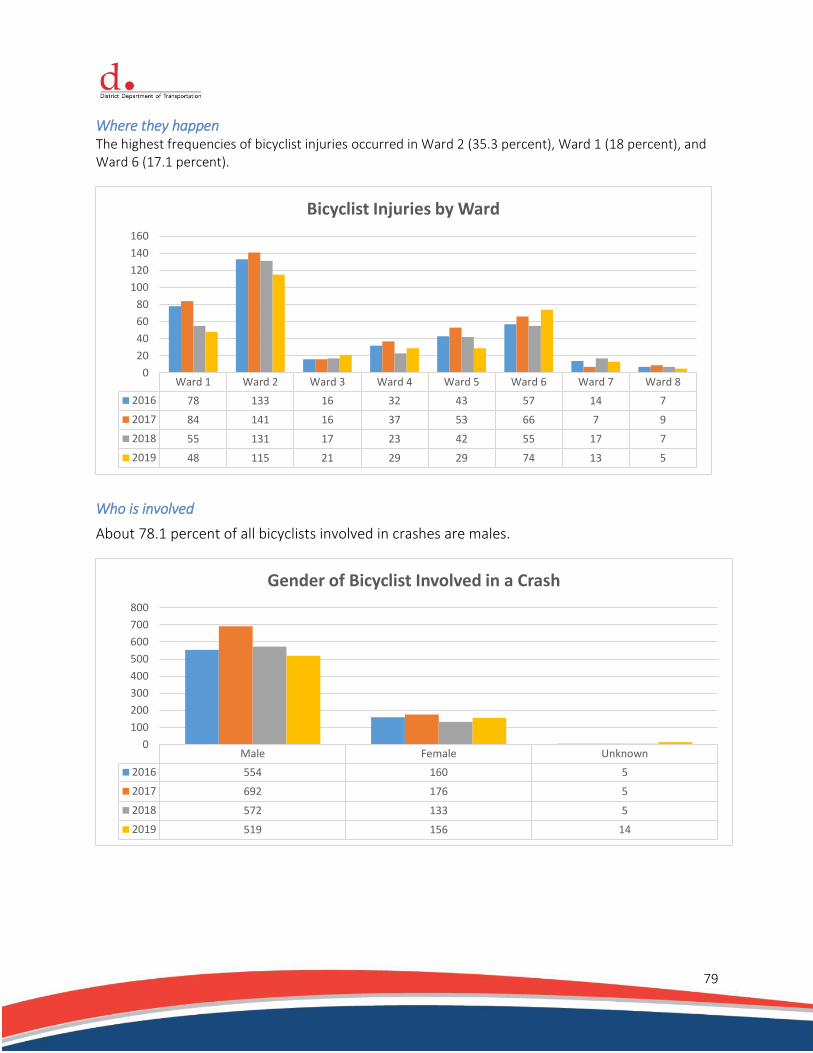
79
Where they happen The highest frequencies of bicyclist injuries occurred in Ward 2 (35.3 percent), Ward 1 (18 percent), and Ward 6 (17.1 percent).
Who is involved
About 78.1 percent of all bicyclists involved in crashes are males.
Ward 1 Ward 2 Ward 3 Ward 4 Ward 5 Ward 6 Ward 7 Ward 8
2016 78 133 16 32 43 57 14 7
2017 84 141 16 37 53 66 7 9
2018 55 131 17 23 42 55 17 7
2019 48 115 21 29 29 74 13 5
0
20
40
60
80
100
120
140
160
Bicyclist Injuries by Ward
Male Female Unknown
2016 554 160 5
2017 692 176 5
2018 572 133 5
2019 519 156 14
0
100
200
300
400
500
600
700
800
Gender of Bicyclist Involved in a Crash

80
The age groups with the highest involvement in bicyclist crashes are 26–30 years (19.3 percent), 31–35 years (16.4 percent), and 21–25 years (13.6 percent). 7.4 percent were unknown.
The majority of bicyclists involved in crashes reside in the District (71.6 percent). A smaller portion of bicyclists originate from Maryland (9.5 percent), Virginia (4.7 percent), Other States (6.1 percent), and Unknown (8.1 percent).
01-05 06-10 11-15 16-20 21-25 26-30 31-35 36-40 41-45 46-50 51-55 56-60 61-65 >65 NULL
2016 2 7 13 52 101 152 129 83 23 29 35 21 10 14 48
2017 3 12 21 60 112 162 144 66 58 51 40 35 27 13 69
2018 5 7 20 42 103 133 115 63 38 40 27 33 16 14 54
2019 2 7 25 26 90 131 102 87 45 40 28 31 15 10 50
0
20
40
60
80
100
120
140
160
180
Age of Bicyclist Involved in a Crash
DC MD VA Other State Unknown
2016 523 71 31 48 46
2017 626 70 44 62 71
2018 495 70 40 36 69
2019 499 73 27 35 55
0
100
200
300
400
500
600
700
Residence of Bicyclist Involved in a Crash
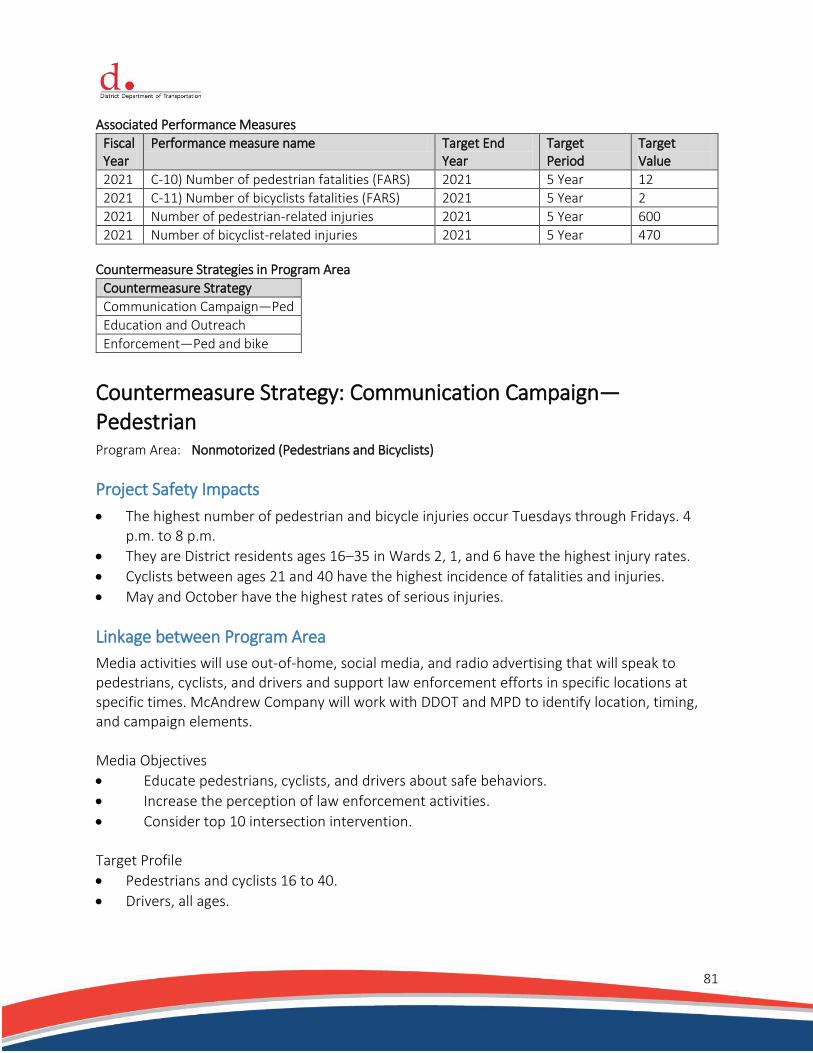
81
Associated Performance Measures
Fiscal Year
Performance measure name Target End Year
Target Period
Target Value
2021 C-10) Number of pedestrian fatalities (FARS) 2021 5 Year 12
2021 C-11) Number of bicyclists fatalities (FARS) 2021 5 Year 2
2021 Number of pedestrian-related injuries 2021 5 Year 600
2021 Number of bicyclist-related injuries 2021 5 Year 470
Countermeasure Strategies in Program Area
Countermeasure Strategy
Communication Campaign—Ped
Education and Outreach
Enforcement—Ped and bike
Countermeasure Strategy: Communication Campaign—Pedestrian Program Area: Nonmotorized (Pedestrians and Bicyclists)
Project Safety Impacts
The highest number of pedestrian and bicycle injuries occur Tuesdays through Fridays. 4 p.m. to 8 p.m.
They are District residents ages 16–35 in Wards 2, 1, and 6 have the highest injury rates.
Cyclists between ages 21 and 40 have the highest incidence of fatalities and injuries.
May and October have the highest rates of serious injuries.
Linkage between Program Area
Media activities will use out-of-home, social media, and radio advertising that will speak to pedestrians, cyclists, and drivers and support law enforcement efforts in specific locations at specific times. McAndrew Company will work with DDOT and MPD to identify location, timing, and campaign elements. Media Objectives
Educate pedestrians, cyclists, and drivers about safe behaviors.
Increase the perception of law enforcement activities.
Consider top 10 intersection intervention. Target Profile
Pedestrians and cyclists 16 to 40.
Drivers, all ages.

82
Rationale
An effective pedestrian and bicyclist safety program must be accompanied by a targeted outreach campaign and enforcement activities. Planned activities in countermeasure strategy
Unique Identifier Planned Activity Name
PS-2021-00 MEDIA Paid Media—Pedestrian Safety
Planned Activity: Paid Media–Pedestrian Safety
Planned activity number: PS-2021-00 MEDIA Primary Countermeasure Strategy ID: Communication Campaign–Ped
Planned Activity Description
Media Strategy
Out-of-home advertising will be a primary way to reach pedestrians and drivers in specific locations throughout the city.
Some radio will be added to reach drivers in their cars.
Digital and social media.
Intended Subrecipients
McAndrew Company is a privately owned, full-service advertising and marketing communications agency. McAndrew has a powerful track record of producing award-winning creative media while raising high levels of awareness and having a positive impact on audience behaviors. For the past 12 years, McAndrew has developed and implemented the DDOT’s traffic safety campaigns, including Click It or Ticket, Checkpoint Strikeforce, Aggressive Driving, Distracted Driving and Pedestrian and Bicycle Safety, as well as managed the DC Road Rules website and social media pages.
Countermeasure strategies
Countermeasure strategies in this planned activity
Countermeasure Strategy
Communication Campaign Ped
Funding sources
Source Fiscal Year
Funding Source ID
Eligible Use of Funds
Estimated Funding Amount
Match Amount
Local Benefit
2021 FAST Act NHTSA 402
Paid Advertising (FAST)
$150,000.00 $150,000.00

83
Countermeasure Strategy: Education and Outreach Program Area: Nonmotorized (Pedestrians and Bicyclists)
Project Safety Affects
The goal of this outreach is to reduce the number of pedestrian- and bicycle-related crashes by informing the public about pedestrian and bicycle safety and the District Laws.
Linkage between Program Area
The HSO will also continue to partner with Maryland and Northern Virginia through the Metropolitan Washington Council of Governments (MWCOG) Street Smart campaign. This is a public education, awareness, and behavioral campaign designed to promote pedestrian and bicycle safety. Since 2002, the campaign has used mass media (radio, newspaper, and transit advertising) to raise awareness and educate motorists, pedestrians, and bicyclists to build safer streets and sidewalks. High-visibility law enforcement also enforces laws and trains road users to be better drivers, cyclists, and pedestrians.
The Washington Area Bicyclist Association (WABA) is using a Ward-based community outreach effort to address the high rate of bicycle and pedestrian crashes—and their disproportionate effect on communities of color. WABA’s mission is to create a healthy, more livable region by promoting bicycling for fun, fitness, and affordable transportation; advocating for better bicycling conditions and transportation choices for a healthier environment; and educating children, adults, and motorists about safe bicycling.
Rationale
Multiple programs must be in place to reduce pedestrian/bike crashes. Education with the combination of enforcement is needed. Planned activities in countermeasure strategy
Unique Identifier Planned Activity Name
FHPE-2021-01 Street Smart Campaign
FHX 2021-01-01 WABA Bike Safety
Planned Activity: Street Smart Campaign Planned activity number: FHPE-2021-01 Primary Countermeasure Strategy ID: Education and Outreach
Planned Activity Description
Develop Media Strategy, including paid and free media, target audience, times, and locations. Transportation Planning Board (TPB) staff, project consultant, and the advisory group work together, using current safety data, to develop the strategy.

84
Revise/Adapt Ads as Needed. Consultant will work with TPB staff and advisory group to revise the existing materials, as needed.
Direct Outreach. Historically, this outreach involved two direct outreach events for the public, and using a mobile Virtual Reality (VR) training car, interactive headset, and large video screen to engage pedestrians at locations, such as shopping malls and street fairs, where large numbers of people gather and have time to do the training. The Spring 2020 VR event was cancelled because of COVID-19. This element will not take place, or will take some other form, if the COVID-19 epidemic is still in progress at the time of the FY2021 campaign.
Press Events, Media tours, and Enforcement Activation events. Hosted by a different jurisdiction each time, the purpose is to leverage media attention and highlight achievements and challenges in the host jurisdiction. Media outreach often highlights local enforcement efforts. “Enforcement activation” events enlist the press to cover live pedestrian enforcement. The Spring 2020 event has been rescheduled to September 2020 because of COVID-19, and it may not happen or take a significantly different form, as long as COVID-19 is still effect.
Request PSA placement. TPB staff approaches transit agencies and TPB member jurisdictions. Consultant approaches media outlets with whom paid media buys are placed and request PSA space. Messaging mix can be specific to the jurisdiction to the jurisdiction or agency. Print materials as needed.
Run Paid Media and PSA Campaign. The campaign typically includes transit ads, radio, TV, digital transit shelters in the District, and pump topper ads at gas stations. Peak times and corridors are targeted to the extent feasible for each media mode. Exact timing of the paid advertising may be adjusted by a week or two, based on advisory group input, ad availability, conflicting events, or other factors. Since the Spring 2020 paid media will run in September, the consultant will start a new run of paid media as soon as possible after October 1.
Evaluation Survey, 600 area residents.
Law enforcement by partner agencies. Issue Pedestrian safety-related citations and warnings. Participating law enforcement agencies are encouraged to conduct enforcement at high-incident locations, as identified by the State or local jurisdiction. This element could also be affected by COVID-19.
Print and Distribute materials. Print and distribute 5000 safety tips cards and other materials to partner agencies, including law enforcement.
Web outreach. Website, twitter feed, digital toolkit. Post campaign information on the website and maintain a social media presence and calendar. Distribute digital toolkits to partner agencies; toolkit includes web banners and other information to be posted on partner websites.
Best Practices in Pedestrian Enforcement Workshop. Bring law enforcement officers from

85
departments with successful pedestrian safety programs, together with civilian safety experts, to conduct a half day training for law enforcement officers on best practices in pedestrian safety enforcement.
Analyze survey results Analysis of the survey of 600 area residents will show which messages the target audiences are hearing and remembering, and on which media they hear those messages. This will help show the overall campaign effectiveness, and help rate the cost-effectiveness of specific media buys.
Annual Report. Prepare and print the Annual Report, which is a tool for engaging stakeholders. It shows all activities for the year, including law enforcement, paid media buys, and PSA placement. Value of PSA placement can be claimed as local match. It will also contain analysis of the survey results.
Intended Subrecipients
Enter intended subrecipients. The National Capital Region Transportation Planning Board (TPB) is the Federally designated Metropolitan Planning Organization for the Washington Region. MWCOG and TPB have close contacts at the highest levels with the counties, cities, States, and agencies that make up its membership. Through the Street Smart Advisory group and the Bicycle and Pedestrian Subcommittee, the MWCOG/TPB has managed the regional Street Smart program for 12 years.
The MWCOG allocates $63,344 from its membership dues to support this program. This puts local contributions on a more stable basis than the voluntary supplemental contributions that had been requested prior to FY2014.
Countermeasure strategies
Countermeasure strategies in this planned activity
Countermeasure Strategy
Education and Outreach
Funding sources
Source Fiscal Year
Funding Source ID Eligible Use of Funds
Estimated Funding Amount
Match Amount
Local Benefit
2021 FAST Act 405h Nonmotorized Safety
405h Public Education
$200,000.00 $200,000.00

86
Planned Activity: WABA Bike Safety Planned activity number: FHX 2021-01-01 Primary Countermeasure Strategy ID: Education and Outreach
Planned Activity Description
Objective 1: Design and Implement a Traffic Safety Educational Video(s) Project WABA will design and implement a video project to reach audiences with traffic safety educational information during the Covid-19 pandemic. WABA will utilize our current membership base and social media presence along with our strong, existing relationships with community partners to share the videos with the audiences identified below. Our goal is to share short, impactful traffic safety videos during the public health emergency when the public is social distancing and travelling less by car, yet bicycles riding and walking have increased. There has been a boom in bicycle sales in DC during the pandemic as explained in the ‘Bike boom continues as DC area moves toward reopening’ article by Kate Ryan, WTOP News. We plan to create one video by September 30, 2020 and one to two additional videos between September 30, 2020 and December 31, 2020. Please find a chart detailing possible topics, audiences, length, and format below.
Videos Topic Audience Length Format
Video 1 Driver Education (eg. safe passing)
Young adult drivers in the age range of 18-35 or any drivers
~5 minutes PSA, social media, animation
Video 2 Bicyclist / Pedestrian Safety Topic TBD
Youth (elementary, middle, junior high)
~5 minutes PSA, social media, animation
Activities include:
1. Design and implement one to two driver education and bicycle / pedestrian safety videos to reach bicyclists, pedestrians, and drivers during the Covid-19 pandemic.
2. Create educational content on the above topic(s). 3. WABA may contract video professional(s) to ensure high quality content is created with a
portion of the remaining HSO funds. 4. Utilize WABA’s existing membership, social media presence, and community partners to
share the videos with intended audiences. 5. Report back to the HSO.

87
Objective 2: Wrap Up the Fifth Annual Regional Traffic Safety Summit (“Washington Region Vision Zero Summit”)
WABA will wrap up the virtual Summit by writing and publishing an official blog recap, finalizing communications with participants including mailing thank you notes to speakers, and reporting back to the Highway Safety Office. The 2018 and 2019 Summits hosted speakers and panelists from over 40 public agencies and organizations, and included experts from other major American cities and around the world. The events were sold out with about 175 participants (there were over 250 participants in 2019). We conducted targeted outreach to communities and stakeholders who did not participate in previous years. Additionally, we will build on the success of the Vision Zero Community Listening Session(s), to formalize this opportunity for communities both West and East of the River. Activities include:
1. Write and publish an official blog recap. 2. Finalizing communications with participants including mailing thank you notes to
speakers 3. Email questionnaire to attendees for feedback. 4. Report back to the Highway Safety Office and others.
Intended Subrecipients
Enter intended subrecipients. Washington Area Bicyclist Association (WABA) has more than 46 years of experience and has earned the reputation of a trusted nonprofit through its thoughtful, agile, and results-driven service to the community.
Countermeasure strategies
Countermeasure strategies in this planned activity
Countermeasure Strategy
Education and Outreach
Funding sources
Source Fiscal Year
Funding Source ID Eligible Use of Funds
Estimated Funding Amount
Match Amount
Local Benefit
2021 FAST Act 405h Nonmotorized Safety
405h Public Education
$50,050.00

88
Countermeasure Strategy: Enforcement—Pedestrians and Bicyclists Program Area: Nonmotorized (Pedestrians and Bicyclists)
Project Safety Impacts
Pedestrian/Bicycle Safety is a high-priority problem area. In pedestrian-friendly metropolitan areas, such as the District, where walking is an important transportation mode of choice. With over 50 percent of the workers in the District either commuting by public transportation or walking to work (2006 American Community Survey), it is crucial to understand the causes and severity of crashes involving pedestrians and bicyclists in the District.
Linkage between Program Area
Pedestrian and bicyclist safety will always be a safety concern. MPD enforcement can increase all road-users awareness and encourage them to adhere to traffic laws to safely share the District roadway among its residents and visitors.
Rationale
Enforcement of driver and pedestrian behaviors is crucial to ensuring they follow the appropriate traffic rules and regulations of the road. Planned activities in countermeasure strategy
Unique Identifier Planned Activity Name
PS-2021-08-00 Pedestrian and Bicyclist Enforcement
Planned Activity: Pedestrian and Bicyclist Enforcement Planned activity number: PS-2021-08-00 Primary Countermeasure Strategy ID: Enforcement—Ped and Bike
Planned Activity Description
Conduct 3,200 hours of overtime enforcement for driver, pedestrian, and bicyclist violations at known risk locations/intersections and during the days and times of the month where the crash data indicate are the highest, as provided by the HSO and MPD sources.
Conduct 300 hours of overtime enforcement during the fall and spring/early summer Street
Smart Campaign in all districts, but with added emphasis in MPD Seventh, First, Second, and
Third Districts, which is where MPD/DDOT data show the majority of pedestrian and bicycle
fatalities occur.
Attend training related to Pedestrian Crash Investigation.

89
Intended Subrecipients
Enter intended subrecipients. The MPD is the primary law enforcement agency for the District of Columbia. More than 600 officers have been trained on the District’s Vehicle Pedestrian and Bicycle laws and regulations, but more training is needed. The MPD Academy, in conjunction with DDOT’s Pedestrian and Bicycle Safety Group, are developing an online Pedestrian/Bicycle Training module that law enforcement officers and other authorized agency enforcement personnel can take remotely from their offices or wireless laptops.
Countermeasure strategies
Countermeasure strategies in this planned activity
Countermeasure Strategy
Enforcement—Ped and Bike
Funding sources
Source Fiscal Year
Funding Source ID
Eligible Use of Funds Estimated Funding Amount
Match Amount
Local Benefit
2021 FAST Act NHTSA 402
Pedestrian/Bicycle Safety (FAST)
$268,310.00

90
Program Area: Occupant Protection (Adult and Child Passenger Safety)
Description of Highway Safety Problems
The FAST Act rates the District as a high-use State. The following sections conform to the FAST Act requirements for 405(b) application for the District.
Overview Proper and consistent use of seatbelts and child safety seats are the most effective protection to reduce the severity of a crash. The District has one of the most comprehensive seatbelt laws in the Nation, which went into effect on April 9, 1997. Unlike many States, District law allows police to stop a vehicle solely because its drivers and passengers are not properly buckled up. The law requires the following:
All motor vehicle passengers in the front seat and back seat are required to buckle up. Drivers are responsible for seatbelt compliance for all passengers. There is a $50 fine and 2 points for not having the seatbelt buckled at all times—for drivers and all passengers, front and back seats.
All children under the age of 8 must be properly seated in an installed infant, toddler or booster child-safety seat. Booster seats must be used with both a lap and shoulder belt. Children between 8 and 16 years old must be securely fastened with a seatbelt. Drivers who fail to properly secure their child will face even stiffer penalties—a $75 fine and 2 points for a first offense, and a $150 fine for fourth and subsequent offenses.
Since 2014, the average observed seatbelt use in the District has been over 90 percent, as shown below. This includes all front passengers (driver and front seat occupants) in all passenger vehicles, including small commercial vehicles (under 10,000 lbs).
95.5
94.1
93.6
95.195.4
92.5
93
93.5
94
94.5
95
95.5
96
2015 2016 2017 2018 2019
% Observed Seatbelt Use for Passenger Vehicles

91
Unrestrained-related Data Trends
The number of unrestrained fatalities in the District is on a downward trend. Unrestrained is defined as “not fastened” and/or “not installed.”
Between 2016 and 2019, there were 244 unrestrained-related injuries representing about 2.1 percent of all traffic-related crashes (11,365).
1
6
3
1
3
0
1
2
3
4
5
6
7
2015 2016 2017 2018 2019*
Unrestraint Fatalities (FARS)
10555 43 41
640
512 497
444
0
100
200
300
400
500
600
700
2016 2017 2018 2019
Unrestrained Injuries vs All Unrestrained Crashes

92
When they occur
Injuries resulting from unrestrained conditions seem to occur mostly during the day. The highest frequencies of unrestrained injuries occur between noon to 3:59 p.m. (25 percent), 8:00 a.m. to 11:59 a.m. (21.3 percent), and 4 p.m. to 7:59 p.m. (16.8 percent).
The days of the week with the highest frequencies of unrestrained injuries are Tuesdays and Saturdays with 17.2 percent, followed by Thursdays (16 percent).
Sun Mon Tue Wed Thur Fri Sat
2016 10 8 11 18 20 17 21
2017 12 7 8 7 9 3 9
2018 5 5 14 4 6 4 5
2019 6 3 9 5 4 7 7
0
5
10
15
20
25
Unrestrained Injuries by Day of the Week
Midnight-3:59 a.m. 4:00 a.m. - 7:59 a.m. 8:00 a.m.-11:59 a.m. Noon-3:59 p.m. 4:00 p.m.-7:59 p.m. 8:00 p.m.-11:59 p.m.
2016 15 14 17 34 14 11
2017 9 9 14 10 10 3
2018 3 6 12 6 12 4
2019 5 5 9 11 5 6
0
5
10
15
20
25
30
35
40
Unrestrained Injuires by Time of Day

93
The months with the highest frequencies of unrestraint injuries are May with 13.9 percent, August with 12.7 percent, and January with 11.5 percent of the total injuries. The District’s Click It or Ticket campaigns run in May and June, with a mini-campaign in March. Child Passenger Safety enforcement is conducted in September.
Where they occur The highest unrestraint-related injuries occurred in Ward 8, accounting for about 23 percent of all unrestraint-related injuries between 2016 and 2019. Ward 2 accounted for 18 percent; Ward 7 accounted for 16.4 percent unrestraint-related injuries.
Jan Feb Mar Apr May June July Aug Sept Oct Nov Dec
2016 25 5 11 10 9 6 8 12 6 4 4 5
2017 1 1 5 2 15 4 5 4 3 6 6 3
2018 1 3 2 4 3 4 5 7 5 4 3 2
2019 1 1 2 1 7 4 1 8 3 7 4 2
0
5
10
15
20
25
30
Unrestrained Injuries by Month
Ward 1 Ward 2 Ward 3 Ward 4 Ward 5 Ward 6 Ward 7 Ward 8
2016 4 20 4 2 9 17 17 32
2017 1 13 6 5 6 6 6 12
2018 8 6 0 1 9 5 9 5
2019 2 5 0 8 3 8 8 7
0
5
10
15
20
25
30
35
Unrestrained Injuries by Ward

94
Occupants who are unrestrained The driver age groups with the highest involvement in unrestraint crashes are 26–30 years (15 percent), 31–35 years (11.3 percent) and 21–25 years (9.2 percent). Overall, drivers within the 21–35 year age group accounted for 35.5 percent of all unrestraint-related crashes. 18.5 percent were Unknown.
The passenger age groups with the highest involvement in unrestraint crashes are 21–25 (10.3 percent), 26–30 (9.9 percent) and 16–20 (8.5 percent). Passengers between the ages of 0 and 10 years old accounted for 6.2 percent.
16-20 21-25 26-30 31-35 36-40 41-45 46-50 51-55 56-60 61-65 >65 NULL
2016 16 43 61 47 41 36 26 30 24 6 20 73
2017 7 37 56 43 29 28 25 28 15 21 17 73
2018 7 24 50 40 25 26 20 16 15 10 13 54
2019 10 21 37 23 22 19 21 14 16 7 15 51
0
10
20
30
40
50
60
70
80
Age of Unrestrained Driver involved in a Crash
01-05 06-10 11-15 16-20 21-25 26-30 31-35 36-40 41-45 46-50 51-55 56-60 61-65 >65 NULL
2016 11 12 15 29 34 34 25 17 21 16 31 12 7 12 65
2017 11 11 12 21 32 24 15 12 13 12 9 14 9 12 51
2018 7 9 11 32 36 24 20 7 11 11 10 6 8 16 48
2019 5 4 6 14 14 30 17 24 13 14 20 17 13 12 71
0
10
20
30
40
50
60
70
80
Age of Unrestrained Passenger involved in a Crash

95
The summaries of unrestraint driver crashes and passengers involved by gender is presented below. From the summaries, male drivers were reported as highest group involved in unrestraint crashes with 67.2 percent compared to 28 percent for female drivers. 4.9 percent were unknown.
For unrestrained passengers, the percentage of unrestrained female passengers involved in crashes is slightly higher than male passengers, at 45.6 and 50.2, respectively. 4.2 percent were unknown.
Male Female Unknown
2016 286 116 21
2017 260 98 21
2018 199 88 13
2019 168 78 11
0
50
100
150
200
250
300
350
Gender of Unrestrained Driver in a Crash
Male Female Unknown
2016 152 175 14
2017 119 134 5
2018 118 132 6
2019 126 126 22
020406080
100120140160180200
Gender of Unrestrained Passenger in a Crash

96
The majority of drivers involved in unrestrained crashes live in the District (43.1 percent). Drivers originated from Maryland accounted for 25.1 percent and Virginia, 9.5 percent. However, 12.8 percent were from other States and 9.5 were coded as Unknown.
Associated Performance Measures
Fiscal Year
Performance measure name Target End Year
Target Period
Target Value
2021 C-4) Number of unrestrained passenger vehicle occupant fatalities, all seat positions (FARS)
2021 5 Year 3
2021 B-1) Observed seatbelt use for passenger vehicles, front seat outboard occupants (survey)
2020 Annual 90.00
2021 Number of unrestrained-related injuries 2021 5 Year 55
Countermeasure Strategies in Program Area
Countermeasure Strategy
Child Restraint System Inspection Station(s)
Communication Campaign–OP
Occupant Protection Survey
Supporting Enforcement–OP
DC MD VA Other State Unknown
2016 164 108 36 62 36
2017 155 95 40 39 40
2018 135 73 27 35 27
2019 116 56 23 33 23
0
20
40
60
80
100
120
140
160
180
Residence of Unrestrained Driver involved in a Crash

97
Countermeasure Strategy: Child-Restraint System Inspection Station(s) Program Area: Occupant Protection (Adult and Child Passenger Safety)
Project Safety Impacts
Motor vehicle crashes are the leading cause of accidental death for all young people from 1 year through teens. Research on the effectiveness of correctly installed child safety seats has found them to reduce fatal injury by 71 percent for infants (younger than 1 year old) and by 54 percent for toddlers (1 to 4 years old) in passenger cars. Studies have also shown that the majority of car seats are installed incorrectly.
Safety experts and advocates currently recommend using booster seats for children from their fourth birthday until their eight birthday. However, parents too often do not use Booster seats because of cost, inconvenience, child discomfort, lack of understanding of how the seats work, and lack of understanding the law, as well as a low perceived risk of being ticketed for a booster seat law violation. Another problem in the District is the inability of new parents to afford an infant car seat prior to delivery or leaving the hospital. Occupant Protection for Children Program The occupant protection for children is part of the occupant restraint program administered by the District Certified Child Passenger (CPS) Coordinator, which uses DDOT grants to fund the CPS activities. This includes training for first-time technicians and recertification for trained technicians. These new technicians and seasoned technicians will staff inspection stations throughout the District. Each inspection station will have at least one nationally Certified Child Passenger Safety Technician during official posted hours. The technicians will ensure that parents, grandparents, and caregivers learn how to properly install their child passenger restraints and also provide other safety information and brochures.
In addition to this program, the CPS Coordinator also administers the District's Project Safe Child Program. Project Safe-Child (https://ddot.dc.gov/page/car-safety-seat-program) is a program that provides infant, toddler, and booster seats to District residents at a reduced rate and distributes information and educational materials on how to properly buckle children in their seats.
Parents and caregivers can get free hands-on help from a Certified Child Passenger Safety Technician and learn how to install their safety seats at any of the nine District inspection stations and outreach locations and at special events.
The CPS coordinator partners with MPD to promote and plan these events, as well as events supporting National Child Passenger Safety Week and that focus on both car seats and booster seats.

98
Certified Child Passenger Safety Technicians (CPS) The District currently has more than 52 National Child Passenger Safety Certified Technicians; at least one at every CPS fitting station. In FY2021, the District will host two 32-hour National Child Passenger Safety Certification Training sessions and provide one recertification training for police officers, Fire and EMS department personnel, and health care and childcare providers. Table below lists the number of CPS training courses for FY2021 that will be offered by the CPS Coordinator and two additional instructors.
Type of Classes Tentative Location Tentative Date Estimated number of Students (min)
CPS Training Certification Ward 8 April 2021 15
CPS Recertification Ward 2 August 2021 10
Of those technicians who did not recertify, job change has been the biggest factor.
CPS Inspection Stations The District has at least one inspection station in every Ward. Technicians at these locations conduct at least three demonstrations/inspections per month on how to install and use child safety seats and boosters. The District works with Department of Health—Healthy Start Program, Bright Beginnings, and DC Developing Families—to reach underserved District residents. Estimates are that approximately 35 percent of the District is underserved.
Linkage between Program Area
To reduce the number misused or improperly installed child passenger seats through workshops that educate residents on the proper use and benefits of using a car seat.
Rationale
The District has one of the most comprehensive seatbelt laws in the Nation and has maintained its 90 percent or higher rating since 2008. This has helped to significantly reduce crash severity. Each year over 1,000 car seats are provided at a low cost or free to the low-income families at nine locations throughout the District; Children’s Hospital, Adams Morgan Clinic, Georgetown Hospital, George Washington Hospital, Providence Hospital, Mary’s Center, Washington Hospital Center, Howard University, Centro Nia’, Developing Families, and MPD Traffic Division.
This program provides 2-hour Child Passenger Safety Workshops to parents and caregivers and also trains law enforcement officers, Fire and EMS Departments, and Health Care and Child Care providers to be National Child Passenger Safety (CPS) Technicians. These technicians will staff the 11 fitting stations and participate in over 60 events in the District.
Planned activities in countermeasure strategy
Unique Identifier Planned Activity Name
OP 2021-05-01-00 Child Passenger Safety
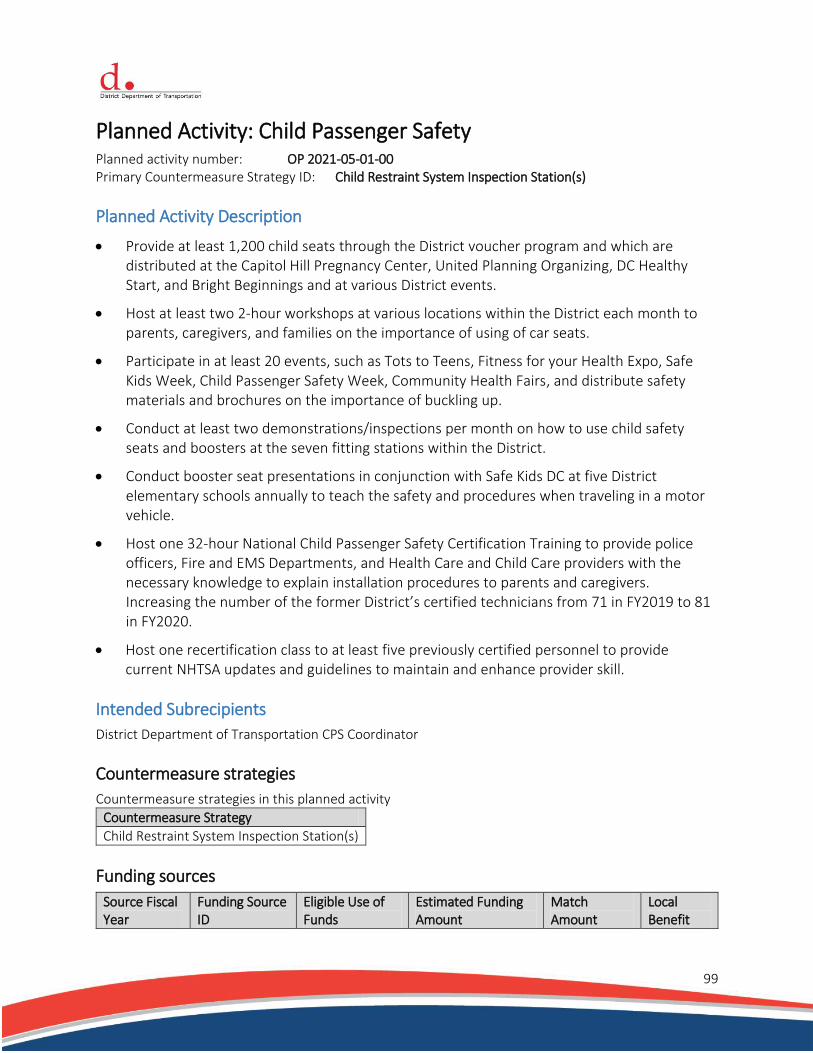
99
Planned Activity: Child Passenger Safety Planned activity number: OP 2021-05-01-00 Primary Countermeasure Strategy ID: Child Restraint System Inspection Station(s)
Planned Activity Description
Provide at least 1,200 child seats through the District voucher program and which are distributed at the Capitol Hill Pregnancy Center, United Planning Organizing, DC Healthy Start, and Bright Beginnings and at various District events.
Host at least two 2-hour workshops at various locations within the District each month to parents, caregivers, and families on the importance of using of car seats.
Participate in at least 20 events, such as Tots to Teens, Fitness for your Health Expo, Safe Kids Week, Child Passenger Safety Week, Community Health Fairs, and distribute safety materials and brochures on the importance of buckling up.
Conduct at least two demonstrations/inspections per month on how to use child safety seats and boosters at the seven fitting stations within the District.
Conduct booster seat presentations in conjunction with Safe Kids DC at five District elementary schools annually to teach the safety and procedures when traveling in a motor vehicle.
Host one 32-hour National Child Passenger Safety Certification Training to provide police officers, Fire and EMS Departments, and Health Care and Child Care providers with the necessary knowledge to explain installation procedures to parents and caregivers. Increasing the number of the former District’s certified technicians from 71 in FY2019 to 81 in FY2020.
Host one recertification class to at least five previously certified personnel to provide current NHTSA updates and guidelines to maintain and enhance provider skill.
Intended Subrecipients
District Department of Transportation CPS Coordinator
Countermeasure strategies
Countermeasure strategies in this planned activity
Countermeasure Strategy
Child Restraint System Inspection Station(s)
Funding sources
Source Fiscal Year
Funding Source ID
Eligible Use of Funds
Estimated Funding Amount
Match Amount
Local Benefit
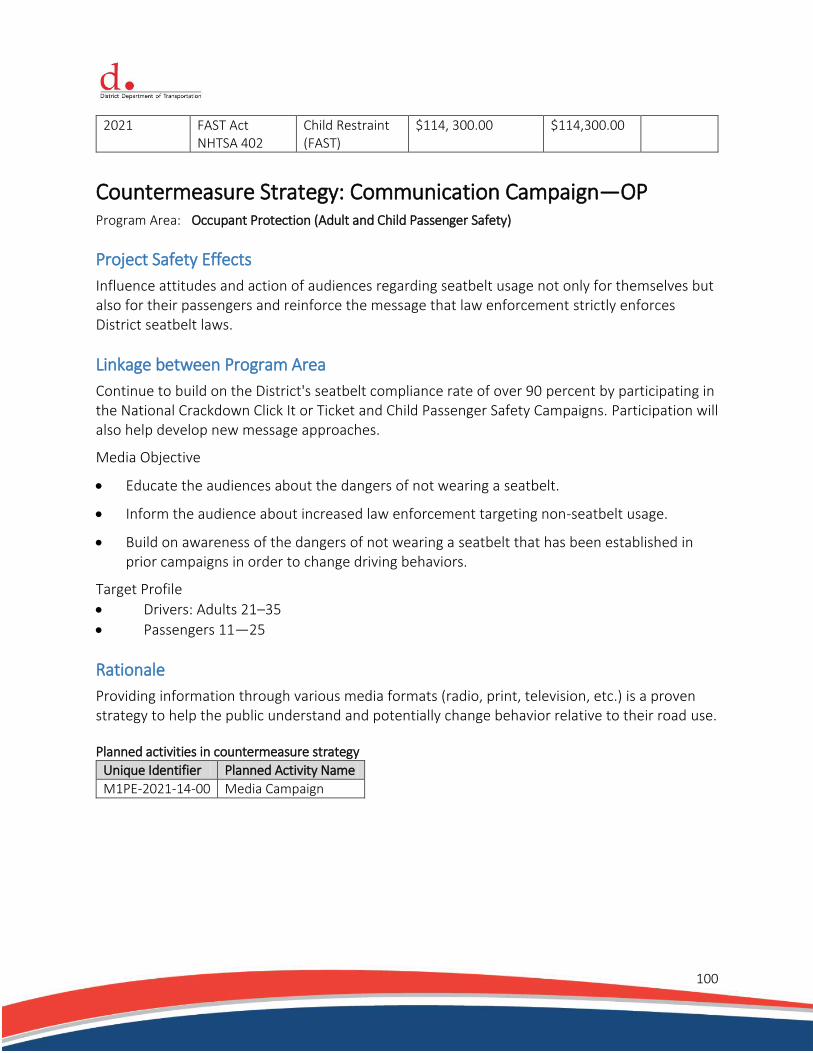
100
2021 FAST Act NHTSA 402
Child Restraint (FAST)
$114, 300.00 $114,300.00
Countermeasure Strategy: Communication Campaign—OP Program Area: Occupant Protection (Adult and Child Passenger Safety)
Project Safety Effects
Influence attitudes and action of audiences regarding seatbelt usage not only for themselves but also for their passengers and reinforce the message that law enforcement strictly enforces District seatbelt laws.
Linkage between Program Area
Continue to build on the District's seatbelt compliance rate of over 90 percent by participating in the National Crackdown Click It or Ticket and Child Passenger Safety Campaigns. Participation will also help develop new message approaches.
Media Objective
Educate the audiences about the dangers of not wearing a seatbelt.
Inform the audience about increased law enforcement targeting non-seatbelt usage.
Build on awareness of the dangers of not wearing a seatbelt that has been established in prior campaigns in order to change driving behaviors.
Target Profile
Drivers: Adults 21–35
Passengers 11—25
Rationale
Providing information through various media formats (radio, print, television, etc.) is a proven strategy to help the public understand and potentially change behavior relative to their road use. Planned activities in countermeasure strategy
Unique Identifier Planned Activity Name
M1PE-2021-14-00 Media Campaign

101
Planned Activity: Media Campaign Planned activity number: M1PE-2021-14-00 Primary Countermeasure Strategy ID: Communication Campaign—OP
Planned Activity Description
Click It or Ticket
Participation in the national Click It or Ticket campaign. This campaign aims to influence driver audience attitudes and actions regarding seatbelt usage not only for themselves, but also for their passengers and to reinforce the message that law enforcement strictly enforces District seatbelt laws. It is also recommended to continue mini-campaigns in January and March 2020. Paid media will target adults age 18–44 with an emphasis on males age 18–34. The campaign may also use a combination of radio, out‐of-home advertising, and digital/social media.
Child Passenger Safety
DDOT promotes Child Passenger safety throughout the year and participates in the national Child Passenger Safety week in September. DDOT supports efforts during Child Passenger Safety week with media promoting the car seat inspection and installation events held throughout the District.
Overall Marketing/Communications Goal
Continue to influence driver audience attitudes and actions regarding seatbelt usage not only for themselves, but also for their passengers. Reinforce the message that law enforcement is strictly enforcing District seatbelt laws, day and night, every trip, and every time.
Target Profile Drivers: Adults 21–35 Passengers 11–25
Media Strategy
Use a mix of traditional media vehicles as well as new media technologies designed to reach the target audience(s).
Radio will be the primary way to reach drivers behind the wheel.
Social media will be used to target males age 18–24 and to provide increased reach for the Click It or Ticket message.
Out-of-home campaign of bus ads and MPD Billboard.
Earned media.
Intended Subrecipients
McAndrew Company is a privately owned, full-service advertising and marketing communications agency. McAndrew has a powerful track record of producing award winning

102
creative while raising high levels of awareness and having a positive impact on audience behaviors. For the past 12 years, McAndrew has developed and implemented DDOT’s traffic safety campaigns, including Click It or Ticket, Checkpoint Strikeforce, Aggressive Driving, Distracted Driving and Pedestrian and Bicycle Safety, as well as managed the DC Road Rules website and social media pages.
Countermeasure strategies
Countermeasure strategies in this planned activity
Countermeasure Strategy
Communication Campaign–OP
Funding sources
Source Fiscal Year
Funding Source ID
Eligible Use of Funds Estimated Funding Amount
Match Amount
Local Benefit
2021 FAST Act 405b OP High
405b High Paid Advertising (FAST)
$280,000.00 $289,000.00
Countermeasure Strategy: Occupant Protection Survey Program Area: Occupant Protection (Adult and Child Passenger Safety)
Project Safety Impacts
Use NHTSA standards to conduct annual National Occupant Protection User Survey (NOPUS) and provide public information through a National and State report produced by Howard University.
Linkage between Program Area
The HSO will also fund Howard University to conduct the NOPUS of seatbelt use by all front passengers (driver and front seat occupants) in all passenger vehicles, including small commercial vehicles (under 10,000 lbs). The survey will comply with observation methodology adopted by NHTSA for the District’s 2018 seatbelt survey.
Rationale
Planned activities in countermeasure strategy
Unique Identifier Planned Activity Name
OP-2021-05-00 Occupant Protection Survey
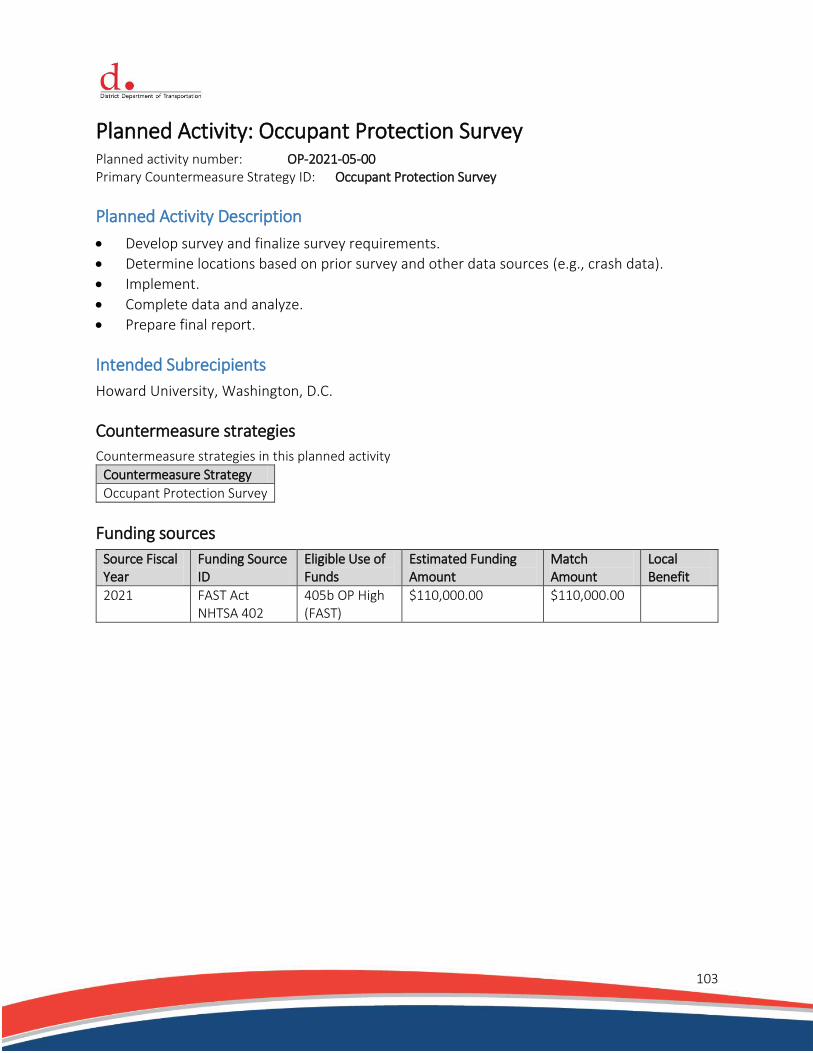
103
Planned Activity: Occupant Protection Survey Planned activity number: OP-2021-05-00 Primary Countermeasure Strategy ID: Occupant Protection Survey
Planned Activity Description
Develop survey and finalize survey requirements.
Determine locations based on prior survey and other data sources (e.g., crash data).
Implement.
Complete data and analyze.
Prepare final report.
Intended Subrecipients
Howard University, Washington, D.C.
Countermeasure strategies
Countermeasure strategies in this planned activity
Countermeasure Strategy
Occupant Protection Survey
Funding sources
Source Fiscal Year
Funding Source ID
Eligible Use of Funds
Estimated Funding Amount
Match Amount
Local Benefit
2021 FAST Act NHTSA 402
405b OP High (FAST)
$110,000.00 $110,000.00
104
Countermeasure Strategy: Supporting Enforcement—OP Program Area: Occupant Protection (Adult and Child Passenger Safety)
Project Safety Impacts
The District of Columbia has a primary seatbelt law, meaning that law enforcement officers can ticket a driver or passenger for not wearing a seatbelt, without any other traffic offense taking place.
Seatbelt usage is enforced in the District by regular enforcement throughout the year, as well as dedicated programs such as the Click It or Ticket (CIOT) Campaign and Child Passenger Safety Week. The annual CIOT campaigns typically run in May and June, with a mini-campaign in March. The Child Passenger Safety enforcement is conducted in September.
Linkage between Program Area
To increase seat belt usage both daytime and nighttime with all vehicle drivers and occupants within the District by strengthening law enforcement and working with key partners as part of the annual Click It or Ticket mobilization and Project Safe Child
Rationale
Enforcement has contributed to ensuring that more than 90 percent of all vehicle occupants wear their seatbelt. Planned activities in countermeasure strategy
Unique Identifier Planned Activity Name
M1X-2021-05-00 Occupant Protection Enforcement
Planned Activity: Occupant Protection Enforcement Planned activity number: M1X-2021-05-00 Primary Countermeasure Strategy ID: Supporting Enforcement—OP
Planned Activity Description
Conduct a total of 4,000 hours of overtime enforcement on day and or nighttime seatbelt enforcement at high-hazard locations identified by the HSO and MPD sources.7
Conduct 500 hours of overtime nighttime seatbelt enforcement during 2021 CIOT mobilizations and child passenger safety week.8
Conduct 600 hours of overtime at events and evenings for inspecting and performing CPS workshops to parents, teachers and caregivers on the proper installation of child safety
7 Countermeasures that Work, Ninth Edition, 2017, Ch. 2, Section 2.2 8 Countermeasures that Work, Ninth Edition, 2017, Ch. 2, Section 3.1
105
seats.
Assist CPS Coordinator in providing Child Passenger Safety Certification and recertification training courses to police officers, and Fire and EMS personnel.
Intended Subrecipients
The MPD is the primary law enforcement agency for the District of Columbia. Since the adoption of the national enforcement and media campaign Click It or Ticket, MPD has supported the program with its enforcement efforts and has worked with neighboring jurisdictions on performing border-to-border seatbelt mobilizations. MPD currently has 16 officers who are Child Passenger Safety Certified Technicians; these technicians participate in the District’s Child Passenger Safety—Project Safe-Child program where child seats are checked or installed and workshops about the proper use of child seats are given to parents and caregivers.
Countermeasure strategies
Countermeasure strategies in this planned activity
Countermeasure Strategy
Supporting Enforcement—OP
Funding sources
Source Fiscal Year
Funding Source ID
Eligible Use of Funds Estimated Funding Amount
Match Amount
Local Benefit
2021 FAST Act 405b OP High
405b High Police Traffic Services (FAST)
$389,400.00 $389,400.00

106
Program Area: Planning and Administration
Description of Highway Safety Problems
The District’s Highway Safety Office coordinate efforts within DDOT and subrecipients to effectively manage projects designed to address highway safety concerns throughout the District.
Planned Activities
Planned Activities in Program Area
Unique Identifier Planned Activity Name Primary Countermeasure Strategy ID
PA-2021-01-01-00 Program Administration—HSO Staff Planning and Administration
Planned Activity: Program Administration—HSO Staff Planned activity number: PA-2021-01-01-00 Primary Countermeasure Strategy ID: Planning and Administration
Planned Activity Description
The HSO will serve as the primary agency responsible for ensuring the District’s highway safety concerns are identified and addressed through the development and implementation the HSP. To fulfill this responsibility, the HSO conducts analysis of data to identify the District’s overall highway safety problems and set performance targets, selects and implements countermeasure strategies and programs, monitors progress and evaluates program results each year. Planning and Administration provides for the management of the HSO programs, including employment of a fulltime position of a Deputy HSO Coordinator (new position) to assist with the management of grant programs; and associated travel, conference fees, and operating expenses for the HSO office (Coordinator and Deputy Coordinator).
Intended Subrecipients
District Department of Transportation, Office of the Director.
Funding sources
Source Fiscal Year
Funding Source ID
Eligible Use of Funds Estimated Funding Amount
Match Amount
Local Benefit
2021 NHTSA 402 Planning and Administration
$187,759.08 $300,000.00
107
Program Area: Safe Communities
Description of Highway Safety Problems
The District’s Highway Safety Office (HSO) will analyze multiple data sources, including crash and citation data, to develop effective countermeasures to address District road-safety problems. The HSO is responsible for the preparation of the Highway Safety Plan, Annual Report, District’s Strategic Highway Safety Plan (SHSP), Traffic Records Plan, as well as coordinates the District’s Traffic Records Committee for USDOT/NHTSA requirements.
Planned Activities
Planned Activities in Program Area
Unique Identifier Planned Activity Name Primary Countermeasure Strategy ID
SA-2021-05-01-00 Safety Documents Safe Communities
Planned Activity: Safety Documents Planned activity number: SA-2021-01-01-00 Primary Countermeasure Strategy ID: Safe Communities
Planned Activity Description
Prepare required safety reports for the HSO. These activities will:
Identify the District’s most significant traffic safety problems.
Prioritize problems and develop methods to distribute safety funds.
Develop the annual Highway Safety Plan (HSP) and Annual Report.
Coordinate the HSP with the SHSP and other State plans.
Recommend individual grants for funding.
Develop planned grants.
Monitor grants.
Participate on various traffic-safety committees and task forces.
Provide sound fiscal management for traffic-safety programs.
Attend NHTSA meetings and other safety-related training.
Update the Procedure Manual, as needed.
Serve as the TRCC Coordinator.
Provide primary point of leadership and accountability for Traffic Safety Information Systems activity within the District.
Prepare a plan to implement traffic-safety data improvements.
Recommend forming interagency project teams to develop implementation plans for carrying out the plan objectives.
Provide executive guidance and coordination for programs, projects, and regulations as they become operational.

108
Receive periodic updates from the project teams.
Update Traffic Records Plan
Update/Implement the SHSP strategies, monitor progress, and prepare report.
Intended Subrecipients
KLS Engineering, LLC
Countermeasure strategies
Funding sources
Source Fiscal Year
Funding Source ID
Eligible Use of Funds
Estimated Funding Amount
Match Amount
Local Benefit
2021 FAST Act NHTSA 402
Safe Communities (FAST)
$545,636.00 $545,636.00

109
Program Area: Traffic Records
Description of Highway Safety Problems
The vision of the District’s Traffic Records Coordinating Committee (TRCC) is to enhance transportation safety and reduce crashes and crash-related injuries through a coordinated approach that will provide timely, accurate, complete, integrated, uniform, and accessible traffic records data. To achieve the vision, the TRCC developed the following goals:
Provide an ongoing District-wide forum for traffic records and support coordination of multiagency initiatives and projects.
Leverage technology and appropriate government and industry standards to improve the timely collection, dissemination, and analysis of traffic records data.
Improve the interoperability and exchange of local and regional traffic records data among systems and stakeholders for increased efficiency and enhanced integration.
Create a user-friendly data system incorporating public and private data sources that better inform traffic-related policy and program decision makers.
Associated Performance Measures
Fiscal Year
Performance measure name Target End Year
Target Period
Target Value
2021 C-1) Number of traffic fatalities (FARS) 2021 5 Year 30
2021 C-2) Number of serious injuries in traffic crashes (District crash data files)
2021 5 Year 365
Countermeasure Strategies in Program Area
Countermeasure Strategy
Improves completeness of a core highway safety database
Improves timeliness of a core highway safety database
Real-time information to First Responders
Countermeasure Strategy: Improve Completeness of a Core Highway Safety Database Program Area: Traffic Records
Project Safety Impacts
One of the biggest barriers to efficient safety data analysis is data integration. The most recent Model Inventory of Roadway Elements (MIRE) 2.0 report states “Data integration results in a new resource capable of supporting analyses that are not possible when the individual data sources stand alone”. Although crash data, roadway data and traffic data form the three primary

110
components in safety data analysis, the integration of these components is often a major challenge. Achieving this integration is deemed “vital” according to the MIRE report. DDOT has recently created a new system which extracts and synthesizes multiple datasets from DDOT’s crash database and linear referencing system (LRS) into a MIRE safety database. Safety data present some unique challenges and using this new database makes data many times easier to query and access. An interactive Web application (the Cross-Section Viewer) was created to showcase what was possible with the new MIRE safety database. The safety data query viewer (name TBD) allows users to peruse safety data items and filter a variety of attributes in a dynamic way. In addition to filtering and finding candidate segments, users can also dynamically generate a Streetmix cross-section – completely based upon the source LRS inventory. While the above project accomplished much, there is still a considerable amount of work yet to be done. We are proposing a follow-on project to enhance the prior work, focusing on improvements to both the Web application and database architecture. These improvements will focus on data-sharing and data integration capabilities of the system overall.
Linkage between Program Area
The improvements above will allow DDOT to close a huge gap in the data feedback loop, providing users an easy, natural way to communicate changes to data maintainers. Downstream, the benefits are greater access to and completely integrated safety data (accurate location of crashes, MIRE safety data elements), roadway and as well as traffic data. The need for ad-hoc ETL and data integration would be greatly reduced because the data are already fully integrated. DDOT personnel need to visualize the possible impacts of the chosen treatments prior to implementation. To facilitate this, fully integrated and accurate data are a must. The improvements above dramatically increase our ability to keep decision-making fully data-centric and should help to avoid negative/unsafe outcomes and other undue delays to safety mitigation.
Rationale
Improve road safety decision making. Planned activities in countermeasure strategy
Unique Identifier Planned Activity Name
RS-2021-13-01 MIRE Data Modeling

111
Planned Activity: MIRE Data Modeling Planned activity number: RS-2021-13-01 Primary Countermeasure Strategy ID: Improves completeness of a core highway-safety database
Planned Activity Description
The technical objective of this project is to enhance the Cross-Section Viewer application to communicate cross-section LRS updates via REST Web services. This is will ensure the overall integrity of crash and safety data analyses, which depend heavily upon cross-section data elements (notably the MIRE FDE) The overall benefit is to ensure that the above-mentioned analyses are producing more accurate predictions of where safety improvements should be made. Better data, which is timelier and more accurate, will allow DDOT to better integrate their analysis with the new safety database. Also, it will allow them to easily report corrections in a data-centric way.
Intended Subrecipients
The District Department of Transportation’s Office of Information Technology and Innovation (OITI) provides information technology oversight for DDOT. Manages, maintains and enhances DDOT related both owned and lease information technology infrastructures and solutions. OITI provides full service for technology operational support to all DDOT employees and vendors, specifically in the following areas: Applications and Development, Geospatial Data Systems, and Infrastructure and Customer Support. Committed to excellence, the OITI group has developed and/or implemented over 40 different applications/solutions to support the agency’s mission and vision of maintaining and improving the city’s infrastructure.
OITI, including its staff, has also won numerous awards and commendations for its tireless commitments and first-rate accomplishments.
Countermeasure strategies
Countermeasure strategies in this planned activity
Countermeasure Strategy
Improves completeness of a core highway safety database
Funding sources
Source Fiscal Year
Funding Source ID
Eligible Use of Funds
Estimated Funding Amount
Match Amount
Local Benefit
2016 402 Road Safety
Data Program (FAST)
$80,000.00 $80,000.00

112
Countermeasure Strategy: Improves Timeliness of a Core Highway Safety Database Program Area: Traffic Records
Project Safety Impacts
The timely posting of convictions to drivers' records is essential in identifying adverse drivers and maintaining public safety.
The Department of Motor Vehicles (DMV) is responsible for identifying habitual and frequent violators of traffic regulations and is authorized to suspend or revoke the driver’s license or driving privilege. DMV receives approximately 2,400 traffic convictions per month from other jurisdictions that are required to be posted to driver’s records in the DESTINY system. Currently, there is a backlog of 2,600 convictions and at a rate of 2,400 out-of-state convictions received every month the DMV is challenged with entering all these convictions in a timely manner (average yearly 24 – 36,000, timely defined as a backlog of less than one month worth of convictions). Delays in posting convictions to driver records impacts appropriate revocations and suspension actions against adverse drivers and thus the safety of the public.
Linkage between Program Area
Increasing the accuracy of driver records, by the timely and accurate data entry of paper traffic related convictions from other jurisdictions into DESTINY, resulting in the removal of the driving privileges of habitual and frequent violators of traffic regulations and ultimately reduce traffic fatalities, injuries and crashes.
Rationale
Approximately 10 percent (approximately 36,000) of all convictions within the D.C. database originate from out-of-State violations. Entering these into the conviction database (Destiny) is crucial in ensuring that traffic violations are appropriately dealt with and D.C. requirements assessed immediately. This strategy has the potential to reduce crashes, injuries, and fatalities. Planned activities in countermeasure strategy
Unique Identifier Planned Activity Name
M3DA-2021-07-05 Backlog of Out-of-State Convictions
Planned Activity: Backlog of Out-of-State Convictions Planned activity number: M3DA-2021-07-05 Primary Countermeasure Strategy ID: Improves timeliness of a core highway safety database
113
Planned Activity Description
DMV receives approximately 2,400 convictions per month from other jurisdictions. With the assistance of the grant, DMV have been able to enter the following via overtime:
FY2017 October 2016 to June 2017 14,996 convictions
FY2018 January 2018 to September 2018 13,624 convictions
FY2019 March 2019 to July 2019 10,032 convictions
DMV is currently entering convictions using funding from the FY2020 grant and will continue to reduce the backlog of convictions. Data entry in FY2021 will continue to allow the timely entry of convictions and should eliminate the existing backlog of out-of-state convictions. In FY2021, DMV is requesting additional hours for DMV’s staff to enter convictions into the DESTINY system via overtime. The convictions will be posted to appropriate DC driver’s records. DMV will assign Legal Instrument Examiners to enter the convictions. Convictions will be entered in the evenings and weekends. The timely entry of out-of-state convictions will contribute to the total number of traffic convictions posted to DC driver records. The entry of convictions and their associated “points” accumulation will result in an increase in suspensions and revocations, thereby removing the driver privilege of adverse drivers and improving public safety.
Intended Subrecipients
DMV is responsible for maintaining driver history and identifying habitual and frequent violators of traffic regulations. DMV has regulatory authorization to suspend or revoke the driver’s license or driving privilege of adverse drivers. The agency receives traffic violation and convictions from both local and national courts and enforcement agencies, including approximately 2,400 out-of-state traffic convictions per month that are required to be posted to DC driver’s records. Because of the disparate automation systems among the courts and law enforcement agencies across the Nation, most out-of-state convictions require data entry by DMV staff. Because of the large volume of out-of-state convictions received each month, DMV is challenged to enter all convictions in a timely manner. Delays in posting convictions to driver records affect appropriate revocations and suspension actions against adverse drivers and thus, the safety of the public. The District Highway Safety Office (HSO) provides funding to assist DMV is updating the driver files with out-of-state convictions.
Countermeasure strategies
Countermeasure strategies in this planned activity
Countermeasure Strategy
Improves timeliness of a core highway safety database

114
Funding sources
Source Fiscal Year
Funding Source ID Eligible Use of Funds
Estimated Funding Amount
Match Amount
Local Benefit
2021 FAST Act 405c Data Program
405c Data Program (FAST)
$70,000.00 $70,000.00
Evidence-based Traffic Safety Enforcement Program (TSEP) Planned activities that collectively constitute an evidence-based traffic safety enforcement program (TSEP):
Unique Identifier Planned Activity Name
AL-2021-03-00-00 WRAP Education and Outreach
M6OT-2021-01 Enforcement Impaired Driving
M1PE-2021-14-00 Media Campaign
PM-2021-14-00 Media Campaign—Aggressive Driving
FDLPEM-2021-00 MEDIA Media Campaign—Impaired
M1X-2021-05-00 Occupant Protection Enforcement
PS-2021-08-00 Pedestrian and Bicyclist Enforcement
PT-2021-04-01 Police Traffic Services
Analysis of crashes, crash fatalities, and injuries in areas of highest risk.
Crash Analysis
The problem-identification process uses the NHTSA FARS data for fatal crashes and MPD data for injuries. These databases are queried to determine who is involved in a crash (age, gender, seatbelt use, impairment, etc.); when crashes are occurring (time of day, day of the week, month, etc.); crash causation factors, (speed, alcohol, etc.); and where they occur. The Highway Safety Plan (HSP) summarizes the problems identified and the District’s program areas intended to address these problems. In addition to the data-analysis process used in developing the HSP, the traffic enforcement plan will also look at Police District locations where injuries and fatalities are occurring, and consider citizen complaints and community feedback.
Deployment of Resources
The MPD is the primary law enforcement agency in the District of Columbia. There are more than 3,800 sworn and 600 civilian members in the Department whose mission is to safeguard the District and protect its residents and visitors. They provide the highest quality of police service with integrity, compassion, and a commitment to innovation that integrates people, technology, and progressive business systems.
The HSO includes a law enforcement program manager who is coordinates District-wide law enforcement projects. The HSO is moving to a more evidence-based practice to help the MPD create and refine its approach and provide structure to its traffic safety enforcement efforts. This does not replace community-specific knowledge, and it does not remove MPD’s authority or responsibility for traffic-safety decisions.
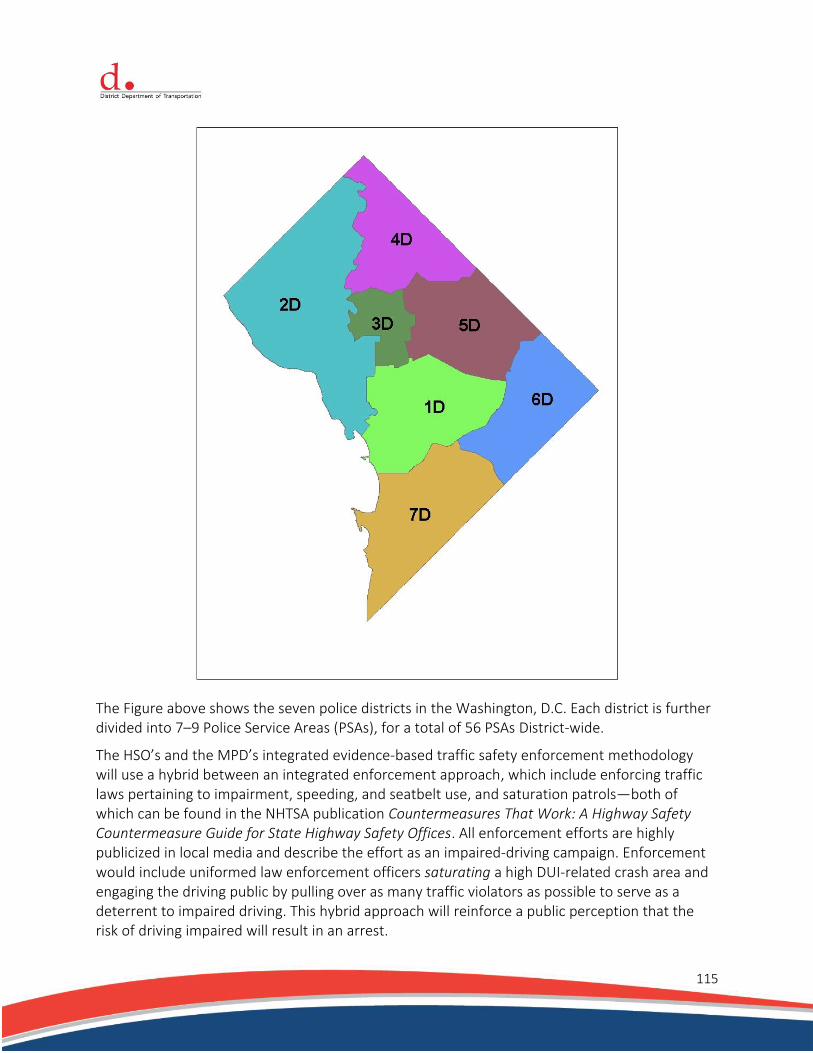
115
The Figure above shows the seven police districts in the Washington, D.C. Each district is further divided into 7–9 Police Service Areas (PSAs), for a total of 56 PSAs District-wide.
The HSO’s and the MPD’s integrated evidence-based traffic safety enforcement methodology will use a hybrid between an integrated enforcement approach, which include enforcing traffic laws pertaining to impairment, speeding, and seatbelt use, and saturation patrols—both of which can be found in the NHTSA publication Countermeasures That Work: A Highway Safety Countermeasure Guide for State Highway Safety Offices. All enforcement efforts are highly publicized in local media and describe the effort as an impaired-driving campaign. Enforcement would include uniformed law enforcement officers saturating a high DUI-related crash area and engaging the driving public by pulling over as many traffic violators as possible to serve as a deterrent to impaired driving. This hybrid approach will reinforce a public perception that the risk of driving impaired will result in an arrest.

116
This overall approach—along with associated National crackdowns and mobilizations, and the District’s safety calendar—will provide continuous, direct, and general deterrence in impaired driving, aggressive driving, seatbelt use, and improve pedestrian and bicycle safety.
The MPD enforces a Zero Tolerance strategy, so regardless of the enforcement area officers focus on, they will pull over drivers who exhibit unsafe driving behaviors. All MPD officers are encouraged to take part in and support a District-wide enforcement period, even if they do not receive grant funds.
MPD will assist the HSO by conducting overtime enforcement in the following areas:
Saturated Patrol (Impaired Driving). All seven MPD Districts address impaired driving in collaboration with the Traffic Safety Specialized Enforcement Branch (TSSEB) Impaired Driver Support Unit (IDSU). If drivers believe that driving impaired is likely to be detected and result in arrest, conviction, and punishment, many will not drive impaired. The TSSEB will continue to coordinate high-visibility sobriety checkpoints, as well as saturation patrols citywide on a weekly/monthly basis. In addition to the saturation patrols, the MPD also participates during the National impaired-driving crackdowns in August and December, as well as the Virginia, Maryland, and District Checkforce Strikepoint campaigns. MPD also conducts a Cops in Shops program, a proactive approach that places undercover officers in retail liquor establishments to stop the sale of alcohol to minors, as well as to those of legal age who attempt to purchase it for them.
Occupant Protection Enforcement. Since adopting the national enforcement and media Click It or Ticket campaign, the MPD has supported the program with its enforcement efforts and has worked with neighboring jurisdictions to perform border-to-border seatbelt mobilizations. MPD also has 16 officers who are Child Passenger Safety Certified Technicians and who participate in the District’s Child Passenger Safety—Project Safe-Child program, where child seats are checked or installed, and workshops are given to parents and caregivers on the proper use of child seats.
Aggressive Driving Enforcement. Police Traffic Services (PTS) focuses on speeding and aggressive driving and other moving violations. Drivers should know that MPD has a Zero Tolerance policy for not complying with the motor vehicle laws of the District. Speeding was the primary contributing factor in almost one-third of the fatalities over the past 5 years. The program consists of four enforcement waves that coincide with media blitzes to inform and educate the public and stigmatize aggressive driving. Participating law enforcement agencies are also consulted to determine the timing of the law enforcement activities and identify target demographics. Research and evaluations are conducted annually to evaluate the program and study the problem and solutions.
Pedestrian/Bicycle Enforcement (Pedestrian and Bicycle Safety). More than 600 officers have been trained on the District’s Vehicle Pedestrian and Bicycle laws and regulations, but more training is needed. The MPD Academy, in conjunction with DDOT’s Pedestrian and Bicycle Safety Group, are developing an online Pedestrian/Bicycle Training module that law enforcement officers and other authorized agency enforcement personnel can complete remotely from their office or wireless laptop. This should help increase enforcement capability as well as public awareness.
117
The HSO will continue to partner with Maryland and Northern Virginia with the Street Smart campaign, a public education, awareness, and behavioral campaign designed to improve pedestrian and bicycle safety. High-visibility law enforcement is used to enforce laws and train users to be better drivers, cyclists, and pedestrians. Since 2002, the campaign has used mass media, such as radio, newspaper, and transit advertising that emphasizes safe practices and educates motorists, pedestrians, and bicyclists on existing laws and regulations governing the safe use of all transportation facilities, including streets, bicycle lanes, and sidewalks.
Monitoring Effectiveness
To ensure these law enforcement projects remain relevant and retain the ability to adjust to any situation, various tracking mechanisms will be used that enable program managers and law enforcement managers quick insights into the progress of each project. Monthly meetings with the HSO and progress reports will be required from each area a grant was received to ensure an understanding of the goals and outcomes of each project. These reports must include data on the activities conducted, such as the area and times worked and the number of citations issued and arrests made. This monthly monitoring will allow for subtle or major adjustments within each MPD District in sufficient time to provide the greatest use of resources.
High-visibility Enforcement (HVE) Strategies Planned HVE strategies to support national mobilizations:
Countermeasure Strategy
Communication Campaign—Impaired
Communication Campaign—OP
Communication Campaign—Aggressive
Enforcement—PTS
High-visibility Saturation Patrols
Supporting Enforcement—OP
High-visibility Enforcement (HVE) planned activities that demonstrate the State's support and participation in the National HVE mobilizations to reduce alcohol-impaired or drug-impaired operation of motor vehicles and increase seatbelts use by of motor vehicle occupants
Unique Identifier Planned Activity Name
FDLPEM-2021-00 MEDIA Media Campaign—Impaired
M1PE-2021-14-00 Media Campaign
M1X-2021-05-00 Occupant Protection Enforcement
M6OT-2021-01 Enforcement Impaired Driving