fy2020 alaska seafood marketing institute
TRANSCRIPT

F Y2020
Alaska Seafood
Marketing Institute
ANNUAL REPORT

B OA R D O F
D I R E C TO R S
The governor appointed, seven member Alaska Seafood Marketing Institute Board of Directors is allocated to five processors (four large processors, one small processor) and two commercial harvesters. Through ASMI’s system of operational and species committees, the board and staff receive input primarily from industry experts in the harvesting and processing sectors.
B OA R D M E M B E R S
Jack Schultheis, Chair K W I K ’ PA K F I S H E R I E S
Allen Kimball, Vice-Chair T R I D E N T S E A FO O D S
Mark Palmer O B I S E A FO O D S
Tomi Marsh H A RV E S T E R
Tom Enlow U N I S E A
Michael Erickson A L A S K A G L AC I E R S E A FO O D S
Alf “Gus” Skaflestad H A RV E S T E R
E X- O F F I C I O M E M B E R S
Peter MiccicheA L A S K A S TAT E S E N AT E
Gary StevensA L A S K A S TAT E S E N AT E
Lyman HoffmanA L A S K A S TAT E S E N AT E
Louise StutesA L A S K A S TAT E H O U S E O F R E P R E S E N TAT I V E S
Dan OrtizA L A S K A S TAT E H O U S E O F R E P R E S E N TAT I V E S
Julie AndersonCO M M I S S I O N E R O F CO M M E R C E , CO M M U N I T Y
A N D ECO N O M I C D E V E LO P M E N T
John MollerO F F I C E O F T H E G OV E R N O R
2 | Alaska Seafood Marketing Institute

Message from the E X E C U T I V E D I R E C T O R
To say that 2020 presented unprecedented challenges is in itself an understatement.
It’s incredible to think how different our report would have been a year ago had we known what was just around the corner. When we last reported in 2019, Alaska Seafood as a whole was closing out one of the most valuable annual harvests on record. The inherent traits of Alaska seafood — delicious, nutritious, wild and sustainable — resonated with consumers worldwide and the seafood from the waters of Alaska were of high demand, receiving the premium value they deserve.
Of course, the global pandemic turned the world upside down. Many of you will recall there was a moment in the spring when a 2020 salmon season was in doubt. Alaska’s fishery participants and coastal communities were concerned about potential risks and the Alaska seafood industry pledged to do everything possible to keep Alaska’s fishing communities safe. Buoyed by that dedication, hundreds of stakeholders and state and community leaders came to the table to find solutions so that the industry could continue to safely and responsibly provide a sustainable, nutritious and essential protein to the world.
Without the tireless commitment across the industry and Alaska this past year, today’s conversation would be much different, and very possibly much worse. We know sectors of our industry are struggling, especially those who rely on hard-hit white tablecloth and other restaurant customers to bring their catch to market. However, we’ve also seen unprecedented growth in seafood consumption at home. Sales have surged for frozen seafood at retail and in direct to consumer online sales. Customers worldwide have also shown a renewed interest in healthy, delicious protein from trusted producers.
This year’s annual report gives us a snapshot of the industry at this historic moment in time. The world is battling a global pandemic, and celebrates the success brought by the fortitude that represents the can-do and community-focused attitude of the Alaska seafood industry that will help the Alaska Seafood sector rebound and rebuild itself beyond 2020.
Sincerely,
Jeremy Woodrow, Executive DirectorA L A S K A S E A FO O D M A R K E T I N G I N S T I T U T E
3 | 2020 Annual Report

T A B L E O F
C O N T E N T S
5 H OW A S M I WO R K S
6 A L A S K A S E A FO O D
I N D U S T RY S N A P S H OT
8 ACCO M P L I S H M E N T S & C H A L L E N G E S
11 G OA L S
22 F I N A N C I A L S
24 CO N TAC T A S M I
4 | Alaska Seafood Marketing Institute

H O W A S M I W O R K S
The Alaska Seafood Marketing Institute is a marketing organization with the mission to increase the economic value of the Alaska seafood resource through:
1. Increasing positive awareness of the Alaska Seafood brand.
2. Collaborative marketing programs that align ASMI and industry marketing efforts for maximum impact within the food industry.
3. Championing the sustainability of Alaska seafood harvests resulting from existing Alaska fisheries management imperatives (State of Alaska Constitution, Magnuson-Stevens Fishery Management and Conservation Act and The Halibut Act).
4. Proactive marketing planning to address short and long-term goals while remaining flexible and responsive to a changing environment and economy.
5. Quality assurance, technical industry analysis, education, advocacy and research.
6. Prudent, efficient fiscal management.
ASMI exists to serve the entire Alaska seafood industry, harvester and processor alike. It is supported by industry self-assessments and uses available public funds to achieve marketing successes for the common good. ASMI adheres to the following core principles:
• ASMI follows the highest ethical standards in its day-to-day operations and in its business relationships.
• ASMI values its employees and members and insists that all be treated with dignity and respect.
• ASMI conducts business in the open so its actions and decisions are visible.
• ASMI acts with integrity when it conducts promotions or makes claims in the marketplace.
• ASMI conducts marketing activities that provide the largest economic benefit for its industry members.
ASMI is a public-private partnership between the State of Alaska and the Alaska seafood industry established to foster economic development of a renewable natural resource. ASMI plays a key role in the positioning of Alaska’s seafood industry as a competitive, market-driven, food production industry.
ASMI increases the value of Alaska’s seafood resource by building equity for the Alaska Seafood brand in both U.S. and international markets through:
• consumer campaigns to strengthen demand for wild and natural Alaska seafood, stimulate sales and increase economic value of Alaska seafood;
• advertising and public relations campaigns to boost usage of all commercial species of Alaska seafood;
• outreach at expositions and trade shows;
• engaging broadline and specialty foodservice distributors to maximize Alaska Seafood brand penetration on menus domestically and abroad;
• promotions with retailers and foodservice operators to build on strong brand equity to differentiate Alaska Seafood from the competition;
• partnering with restaurant chains to increase the number of restaurants that feature Alaska seafood as a branded menu item;
• media tours and media outreach to secure positive publicity for Alaska seafood products and the Alaska seafood industry; and
• managing the Alaska Seafood brand.
M I S S I O N
S TAT E M E N T
CO R E
P R I N C I P L E S
A S M I ’ S RO L E
5 | 2020 Annual Report

A L A S K A S E A F O O D I N D U S T R Y S N A P S H O T
Halibut & Sablefish 50 M
Pacific Cod 488 M
Crab 44 M
Pollock 3.36 B
Salmon 731 M
Other 80 M
Flatfish, Rockfish, & Atka Mackerel 798 M
Flatfish, Rockfish, & Atka Mackerel $179 M
2018/19 Average Harvest Volume (pounds)TOTA L 5 . 55 B
Pacific Cod $202 M
Crab $213 M
Pollock $514 M
Salmon $705 M
Other $33 M
Halibut & Sablefish $174 M
2018/19 Average Ex-Vessel ValueTOTA L $2 .02 B
Source: McKinley Research for ASMI
Ex-vessel value refers to the value of payments made to fishermen by processors. First wholesale value is revenue received by processors when they sell processed seafood outside of their network.
6 | Alaska Seafood Marketing Institute
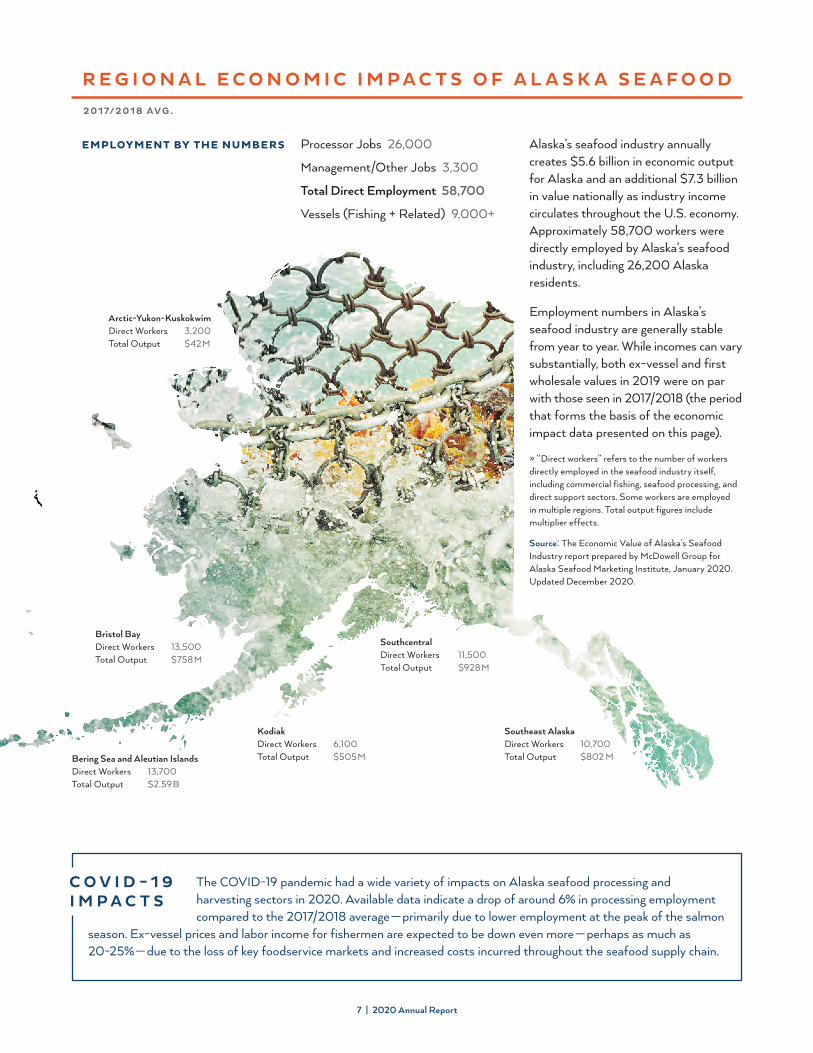
R E G I O N A L E C O N O M I C I M P A C T S O F A L A S K A S E A F O O D
2 0 17/2 0 1 8 AVG .
EMPLOYMENT BY THE NUMBERS Alaska’s seafood industry annually creates $5.6 billion in economic output for Alaska and an additional $7.3 billion in value nationally as industry income circulates throughout the U.S. economy. Approximately 58,700 workers were directly employed by Alaska’s seafood industry, including 26,200 Alaska residents.
Employment numbers in Alaska’s seafood industry are generally stable from year to year. While incomes can vary substantially, both ex-vessel and first wholesale values in 2019 were on par with those seen in 2017/2018 (the period that forms the basis of the economic impact data presented on this page).
» “Direct workers” refers to the number of workers directly employed in the seafood industry itself, including commercial fishing, seafood processing, and direct support sectors. Some workers are employed in multiple regions. Total output figures include multiplier effects.
Source: The Economic Value of Alaska’s Seafood Industry report prepared by McDowell Group for Alaska Seafood Marketing Institute, January 2020. Updated December 2020.
The COVID-19 pandemic had a wide variety of impacts on Alaska seafood processing and harvesting sectors in 2020. Available data indicate a drop of around 6% in processing employment compared to the 2017/2018 average — primarily due to lower employment at the peak of the salmon
season. Ex-vessel prices and labor income for fishermen are expected to be down even more — perhaps as much as 20-25% — due to the loss of key foodservice markets and increased costs incurred throughout the seafood supply chain.
C O V I D - 1 9 I M P A C T S
Southeast AlaskaDirect Workers 10,700Total Output $802 M
Bristol Bay Direct Workers 13,500Total Output $758 M
Arctic-Yukon-Kuskokwim Direct Workers 3,200Total Output $42 M
Kodiak Direct Workers 6,100Total Output $505 M
SouthcentralDirect Workers 11,500Total Output $928 M
Bering Sea and Aleutian Islands Direct Workers 13,700Total Output $2.59 B
Processor Jobs 26,000
Management/Other Jobs 3,300
Total Direct Employment 58,700
Vessels (Fishing + Related) 9,000+
7 | 2020 Annual Report

M A J O R A C C O M P L I S H M E N T S & C H A L L E N G E S
F Y2020 K E Y ACCO M P L I S H M E N T S
ASMI Global Food Aid Program (GFAP) achieved significant results in the 2020 calendar year. Through its efforts, USDA purchased over $62 million of wild Alaska salmon (canned Alaska pink salmon) and wild Alaska pollock (Alaska pollock block, whole grain breaded fish sticks, unbreaded, serpentine cut fillet portions and pollock nuggets) for their food, nutrition and safety net programs. With all of these products on the approved USDA program food list, ASMI is expanding the market with millions of new USDA food consumers, who will now look for wild Alaska pollock and salmon products in stores across America.
ASMI GFAP also worked closely with the development of the science-based Dietary Guidelines for Americans (DGA) 2020-2025 to ensure understanding of the importance of seafood in the American diet. The DGA 2020-2025 now recommends at least 2 weekly servings of seafood for Americans of all ages from 12 months old, including pregnant women. Seafood is considered a nutrient dense food and is the primary source of health promoting marine-source omega-3 fatty acids (breast milk is the only other effective source). The DGA 2020-2025 nutrition policy will be built into all USG food and nutrition programs, ideally causing more Americans to seek out more seafood in the marketplace.
In the U.S. domestic market, ASMI executed custom promotions including social media, point of sale materials, product demonstrations, and merchandising in over 35,500 retail stores and e-commerce platforms, in addition to partnering with over 18,000 foodservice establishments in FY2020.
During the same time period, U.S. consumer public relations earned media efforts resulted in 166 placements (6% YOY increase) and nearly 1.89 billion impressions (99% YOY increase) for the Alaska Seafood brand, products and messaging.
With additional funding from the USDA Agricultural Trade Promotion program, ASMI opened a Southeast Asia marketing office in May 2019 to promote Alaska seafood in Indonesia, Malaysia, the Philippines, Vietnam and Thailand. In their first full fiscal year, the Southeast Asia program conducted over 180 meetings with seafood trade partners, hosted a booth at the Vietfish trade show in Vietnam, conducted five Alaska seafood retail promotions, and hosted two successful seminars with strong attendance from across the regional seafood industry. Additionally, the Southeast Asia team built a robust online presence, creating websites and popular Facebook pages for Alaska Seafood in Vietnam and Thailand.
ASMI expanded the existing marketing program in Brazil to include additional countries in South America and organized an Alaska seafood suppliers’ trade mission to Lima and Piura, Peru in early 2020. The mission included market briefings, tours, buyer meetings and a trade reception. After ASMI’s trade reception, the Peruvian seafood industry president sent a letter to Peru’s president regarding market access for U.S. seafood, leading to authorization of a pilot project allowing the import of raw material into the country without regulatory barriers, effectively opening a new market for Alaska seafood.
The ASMI technical program collaborated with the Seafood Industry Research Fund to support a study by the University of Connecticut to gather key information regarding the impacts of dietary fish consumption patterns on breast cancer survivors’ symptoms of persistent pain and fatigue.
The technical program also collaborated with research staff from Oregon State University and University of Alaska Fairbanks and was awarded a grant to fulfill objectives from the research proposal, “Development of Value-added Market Opportunities for Pollock and Yellowfin Sole Co-products.” This project should be finished in the fall of 2021.
8 | Alaska Seafood Marketing Institute
The Alaska Responsible Fisheries Management program transitioned management from ASMI to the 501(c)(3) nonprofit foundation, Certified Seafood Collaborative following over 10 years of dedication by ASMI to developing the robust and independent third-party certification for the industry. ASMI will continue to provide marketing and administrative support for the program.
F Y2020 K E Y CO M P O N E N T C H A L L E N G E S
Challenge: COVID-19 global pandemic
Prior to the global pandemic, the majority of consumer dollars spent on seafood were spent in a restaurant or foodservice setting. The impacts of COVID-19 on the foodservice industry have been dire as many operators shuttered their restaurants, while others shifted to take-out and delivery which traditionally has not fared well for seafood options. Many Alaska species have historically been sold primarily through foodservice channels and pivoting to alternative distribution channels takes significant investment and time in an already competitive landscape. While retail-ready product forms have fared better, retail sales increases of seafood have not overcome the sales lost in the foodservice sector. These trends are not unique to the U.S. and are reflected in ASMI program areas around the world, resulting in unpredictable sales, cautious buyers and reduced ex-vessel prices for nearly every commercial species harvested in Alaska in 2020.
The Alaska seafood industry invested heavily in important precautionary measures to keep Alaska community members and seafood industry participants safe amid the pandemic. This extremely high overhead combined with reduced processing capacity due to COVID-19 and reduced market value for seafood presented challenges for many Alaska seafood companies. Low harvest returns of key species further compounded the challenges for the Alaska seafood industry.
While leading public health and food safety organizations continue to affirm that there is no evidence that the virus that causes COVID-19 is transmitted through food, food containers, or food packaging, Chinese officials continue to spread misinformation regarding the safety of imported seafood, causing delays and uncertainty, effectively creating a non-tariff barrier.
Challenge: Tariffs and trade
While the U.S. faces increasing tariffs and uncertainty in several major global markets, many competing countries are engaged in negotiating free trade agreements. For example, China currently has more free trade agreements in place than the U.S. This significantly reduces Alaska seafood’s competitiveness internationally.
In China, Alaska seafood’s largest export market, Alaska products continue to bear a heavy and expensive burden from the Section 301 tariffs initially implemented in 2018 and expanded in 2019. While we applaud the removal of some non-tariff trade barriers in the Phase One trade deal, currently most Alaska products face a 32-40% final tariff in the China market. The Chinese exclusions process, launched on March 2, 2020 as part of the Phase One agreement, relies on importers to complete extensive paperwork without any assurance that it will be accepted, leading many former customers to choose competing products from other nations that can be imported without these extra steps.
U.K. imports of Alaska seafood in 2019 reached 23.4 million pounds (10,602 metric tons) worth $62.7 million and not including the large amount of Alaska seafood that enters the U.K. indirectly, from China, Canada or the EU. Ongoing trade issues between the EU and the U.K. have the potential to threaten established markets for Alaska seafood in both markets. Alaska sees potential opportunity in bilateral negotiation between the U.S. and the U.K. however, as of February 2021, ASMI sees no indication that free trade for U.S. seafood will be a focus of the negotiations.
The Russian embargo on western food products in 2014 continues to impact the market opportunities for Alaska salmon and roe. In addition to being shut out of what was once a $60 million market for Alaska
9 | 2020 Annual Report
seafood and the second largest market for Alaska salmon roe, no corresponding limitation was placed on U.S. markets for Russian seafood producers. In fact, the value of Russian seafood imported by the U.S. has grown 69% since 2013, the year preceding the Russian embargo.
Several market conditions contributed to export declines of Alaska seafood to Japan. Loss of the China domestic market and continued embargo from Russia exacerbated the monopolistic market conditions for many Alaska products in Japan, bringing down prices. Additionally, large Russian wild salmon harvests coupled with high volumes of relatively inexpensive Chilean farmed coho, led to increased competition for Alaska salmon in Japan. In 2019 exports fell further as many Alaska companies turned to the U.S. market with their sockeye salmon.
Challenge: Alaska harvest volatility
Harvests of multiple Alaska fisheries including Pacific cod, crab and especially salmon have been increasingly volatile in recent years, putting more pressure on ASMI and the industry to expand sales of species with larger harvests and retain value for species with lower harvests.
Alaska halibut value has decreased amid the closure of restaurants and foodservice venues, all while Atlantic halibut stocks continue to rebound, thus providing fresh, year-round competition. Alaska sablefish and Pacific cod face similar market pressure from foodservice closures and competition from non-Alaska species.
Challenge: Consumption trends
Per capita seafood consumption has generally trended down in major markets like Europe and Japan over the past decade. Supply chain challenges in the meat industry due to the pandemic provided a potential short-term opportunity for Alaska seafood, however, economic uncertainty may result in consumers choosing lower-cost proteins in the U.S. and abroad.
Competition from the growing number of meat and seafood substitute products and the increase of vegan and plant-forward diets are encouraging U.S. and European consumers to eat less seafood and meat in general.
10 | Alaska Seafood Marketing Institute

Goal #1: Maintain first place ranking of Alaska Seafood among the most popular food brands on U.S. restaurant menus. R E S U LT S
In 2020, Alaska Seafood maintained the No. 1 ranking as the most commonly named protein brand called out on restaurant menus, surpassing Angus Beef, for the fifth consecutive year. In another study of United States consumers conducted by Datassential in August of 2019, 64% of consumers reported being more likely to order a fish/seafood dish if the Alaska Seafood logo is on the menu and 62% of consumers reported being more likely to order a fish/seafood dish when the word “Alaska” is on the menu.
L O O K I N G FO RWA R D: F Y202 1 C H A L L E N G E S A N D O P P O R T U N IT I E S
Challenges
Prior to the COVID-19 pandemic, nearly 70% of seafood was consumed in a foodservice setting. The shuttering of restaurants across the country in response to the global crisis hit many Alaska seafood species hard, especially those higher value species typically enjoyed at foodservice and with limited distribution at retail, like sablefish and halibut. While seafood saw significant sales increases at retail, especially in the frozen sector, the loss of foodservice customers continues to place additional pressure on the salmon category with increased volume from farmed and imported salmon.
Opportunities
With more consumers cooking and eating at home, the Alaska seafood industry adapted to this new opportunity in several ways. Many harvesters and marketers that previously sold their products directly to restaurants found new opportunities in direct-to-consumer and e-commerce sales.
A recent Datassential survey of U.S. consumers listed seafood as the second most missed restaurant menu item. Foodservice establishments found creative ways to safely offer meals to consumers outside of dine-in service and ASMI created resources and menu tools for foodservice partners to help takeout menus highlight more seafood offerings. Alaska seafood is well-poised to respond to a resurgence in this sector due to ASMI’s strong relationships with foodservice and distributor partners.
G O A L S
11 | 2020 Annual Report

Goal #2: Increase the first wholesale value of selected Alaska salmon products by 0.5%.
AL A SK A SALMON VALUE G ROW TH: E X-VE SSE L AND FIR S T WHOLE SALE , 2004-2019
(Millions of dollars)
$0
$500
$1,000
$1,500
$2,000
Ex-Vessel First Wholesale
2004 2016 201820142012201020082006
A N A LYS I S O F R E S U LT S
Ex-vessel value refers to the value of payments made to fishermen by processors. First wholesale value is revenue received by processors when they sell processed seafood outside of their network. ASMI strives to increase the value of Alaska seafood products and increase the first wholesale value and ex-vessel value of the resource for fishermen, processors, and communities.
Higher pink salmon catches in odd numbered years tend to produce larger harvest volumes and values than in even numbered years. ASMI’s long-term goal is to increase the value of Alaska’s salmon resource with the understanding that there will be fluctuations from year to year.
These results are from the 2019 season, which is the latest available data.
R E S U LT S
• The 2019 first wholesale salmon values increased from the prior year. Preliminary data indicate the first wholesale value of salmon totaled $1,733 million, an 11% increase from 2018. The increase was driven by both improved harvest volume and improved prices.
• Ex-vessel value from Alaska’s salmon fisheries totaled $715 million in 2019, a 2.9% increase from the prior year (updated Dec. 2020).
• Although the value of Alaska’s salmon production fluctuates, it has trended higher over the last decade. The 2018/2019 average first wholesale value of salmon production in Alaska was $1,649 million, a 40% increase from the 2009/2010 average. This produces a compound annual growth rate (CAGR) for the 10-year period of 3.6%. (Averaging two years balances fluctuations due to the two-year life cycle of pink salmon.)
Note: Ex-vessel value data was updated for some years starting in 2008.
Methodology: ADF&G, Commercial Operators Annual Report (Ex-Vessel Value) and Alaska Department of Revenue (First Wholesale Value), compiled by McKinley Research. Updated Jan. 2021
12 | Alaska Seafood Marketing Institute

• The 2018/2019 average ex-vessel value of salmon harvests was $704 million, a 43% increase from the 2009/2010 average of $494 million. This represents a CAGR of 3.6%.
• The CAGR of both first wholesale and ex-vessel value from salmon fisheries over the past 10 years is well above the 0.5% annual goal.
• The value of Alaska’s salmon production has trended higher due to a variety of factors including development of new markets, product innovation, increased quality, strong customer demand, and marketing efforts, among others.
L O O K I N G FO RWA R D: F Y202 1 C H A L L E N G E S A N D O P P O R T U N IT I E S
Challenges
In FY2021, the COVID-19 pandemic continues to be the most prominent factor impacting the value of Alaska salmon. Ex-vessel prices in 2020 declined from 2019 levels according to preliminary data, and significant uncertainty surrounds first wholesale values. Increased operating costs and lack of clarity around the direction of markets are two of the primary reasons for the ambiguity. Other factors impacting the value of Alaska salmon include trade disputes, currency rates, competition with other seafood and proteins, and fluctuations in harvest volume, among others.
This uncertainty in market value has resulted in caution among processors and preliminary ex-vessel prices which were down materially from 2019, particularly in Bristol Bay.
Volatile 2019 and 2020 Alaska salmon seasons again included returns of record highs and record lows across the state. For example, sockeye harvests continue to be favorable in Bristol Bay, whereas Southeast Alaska faced historically low returns of keta, pink and coho salmon. Similar harvest level disparities are expected to continue in 2021.
It is unclear how the value of Alaska salmon may be impacted in the coming year. The market may face continued weakness in salmon values, with limited recovery of foodservice demand and continued elevated operating costs and uncertainty. Other scenarios support stability or growth in salmon values, with examples including strong retail sales, limited salmon inventories heading into the 2021 season, or reduced operating costs due to abatement of the pandemic.
Opportunities
While spending at foodservice declined during the pandemic, retail seafood sales trended higher. Early data indicates the seafood category has experienced some of the highest growth rates in the grocery category. Stronger retail demand for seafood may help preserve the value of salmon, and offset declines occurring from weaker foodservice markets.
Anecdotal reports describe non-traditional seafood consumers purchasing seafood at retail as a factor in increased sales in this sector. Retaining new customers through ASMI initiatives such as widely shared recipe innovations, offers a possibility to expand the market for Alaska salmon, which will help maintain or increase its value.
13 | 2020 Annual Report
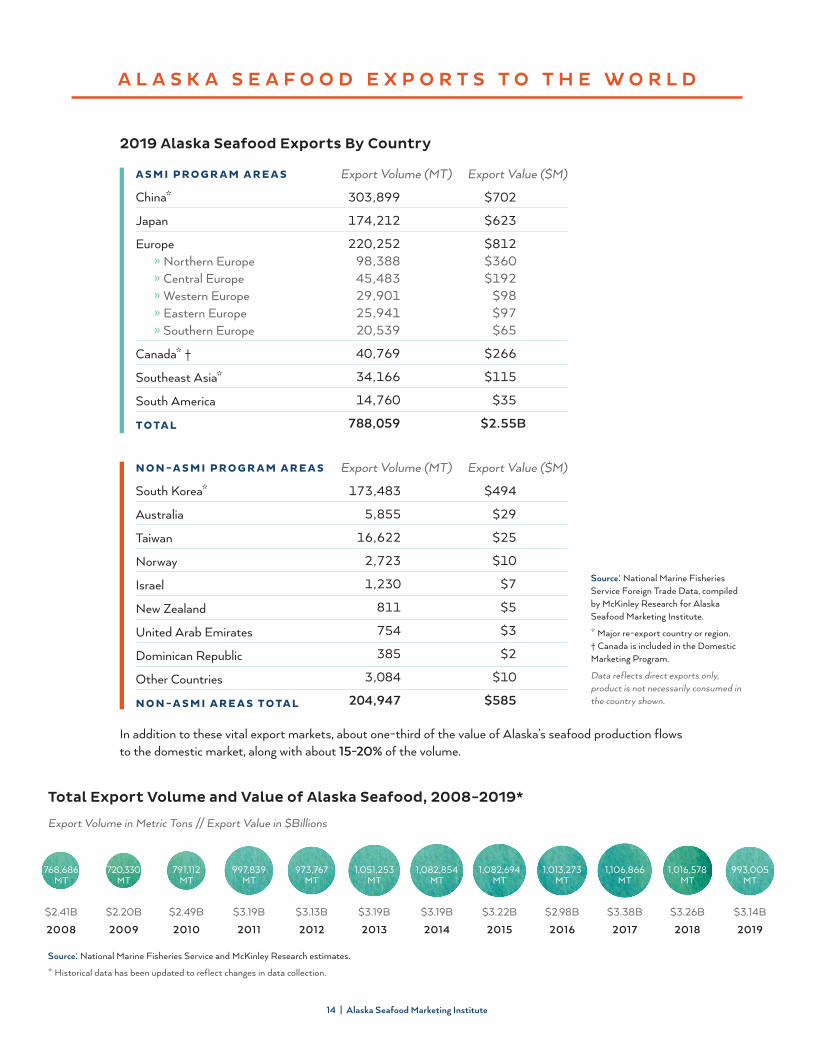
Source: National Marine Fisheries Service Foreign Trade Data, compiled by McKinley Research for Alaska Seafood Marketing Institute.
* Major re-export country or region. † Canada is included in the Domestic Marketing Program.
Data reflects direct exports only, product is not necessarily consumed in the country shown.
Source: National Marine Fisheries Service and McKinley Research estimates.
* Historical data has been updated to reflect changes in data collection.
A L A S K A S E A F O O D E X P O R T S T O T H E W O R L D
Total Export Volume and Value of Alaska Seafood, 2008-2019* Export Volume in Metric Tons // Export Value in $Billions
$3.14B
2019
993,005 MT
$2.41B
2008
768,686 MT
$2.20B
2009
720,330 MT
$2.49B
2010
791,112 MT
$3.19B
2011
997,839 MT
$3.13B
2012
973,767 MT
$3.19B
2013
1,051,253 MT
$3.19B
2014
1,082,854 MT
$3.22B
2015
1,082,694 MT
$2.98B
2016
1,013,273 MT
1,106,866 MT
$3.38B
2017
1,016,578 MT
$3.26B
2018
In addition to these vital export markets, about one-third of the value of Alaska’s seafood production flows to the domestic market, along with about 15-20% of the volume.
A S M I P RO G R A M A R E A S
China*
Japan
Europe» Northern Europe» Central Europe» Western Europe» Eastern Europe» Southern Europe
Canada* †
Southeast Asia*
South America
TOTA L
Export Volume (MT)
303,899
174,212
220,252 98,388 45,483 29,901 25,941
20,539
40,769
34,166
14,760
788,059
Export Value ($M)
$702
$623
$812 $360
$192 $98 $97 $65
$266
$115
$35
$2.55B
N O N -A S M I P RO G R A M A R E A S
South Korea*
Australia
Taiwan
Norway
Israel
New Zealand
United Arab Emirates
Dominican Republic
Other Countries
N O N -A S M I A R E A S TOTA L
Export Volume (MT)
173,483
5,855
16,622
2,723
1,230
811
754
385
3,084
204,947
Export Value ($M)
$494
$29
$25
$10
$7
$5
$3
$2
$10
$585
2019 Alaska Seafood Exports By Country
14 | Alaska Seafood Marketing Institute

Goal #3: Increase the aggregate value of Alaska seafood exports to Alaska Seafood Marketing Institute program destination countries by 0.5% annually.
Note: Data updated to reflect ASMI regions active at the time of exports. Also updated to include exports to Canada. Updated Jan. 2021.
Methodology: National Marine Fisheries Service, compiled by ASMI staff, McKinley Research.
AL A SK A SE AFOOD E XP ORT S TO A SMI PROG R AM DE S TINATION S
0
500
1,000
1,500
2,000
2,500
3,000
Value ($Millions) Volume (Metric Tons, Thousands)
2005 2015 20172013201120092007 2019
15 | 2020 Annual Report

R E S U LT S
Export markets are critical to Alaska’s seafood industry, accounting for 60-70% of first wholesale value each year. Growth in export volume and value helps maintain markets for Alaska seafood and supports higher values for the state’s annual production. (Note: Canadian exports are not reflected in these results as marketing activities in Canada are managed by ASMI’s domestic marketing program.)
• In 2019, the value and volume of exports to ASMI program countries declined 1.1% and 0.4%, respectively, from 2018 levels (updated Jan. 2021).
• Many factors contributed to the decline in export activity including trade disputes, currency rates, competition with seafood from other countries, and falling demand. While data is limited, a stronger domestic market appears to be reducing exports in some cases.
• Reduced export value to China (-10.5%) and Japan (-20.4%) was partially offset by expansion in Europe (+7.8%) program areas. The small but rapidly growing Southeast Asia (+18.0%) and South America (+87.3%) markets also helped moderate the net decline, due in part to new marketing investment by ASMI in 2019 to diversify export markets for Alaska seafood.
• The export value of Alaska seafood can be volatile, with 5+% changes year-to-year common. Over the last decade (2010-2019), the compound annual growth rate in export value is 2.3%, exceeding the 0.5% annual goal.
• Although the value of Alaska seafood exports to ASMI program areas declined in 2019, export values to non-ASMI program areas hit a record, up 3.7% from 2018. Most of this growth centered in South Korea, a major reprocessing center for Alaska seafood products. While it is difficult to quantify how much Alaska product is consumed within South Korea versus product that is re-exported, it is estimated that a significant volume of Alaska pollock roe, pollock surimi, salmon, and whitefish is re-exported, with the majority of that volume going to ASMI program area countries. These estimated re-exported volumes and values are not factored into the totals shown.
L O O K I N G FO RWA R D: F Y202 1 C H A L L E N G E S A N D O P P O R T U N IT I E S
Challenges
The total export value of Alaska seafood declined in 2020. This decline is due to reduced salmon harvest volumes, weaker prices for various species (including sablefish, rockfish, Pacific cod, and flatfish), and other factors. There is some evidence that a stronger U.S. domestic market for various Alaska seafood products is contributing to export value declines, though limited data is available to study this in detail.
In a typical year, about 80% of Alaska’s seafood production (by volume) is exported. China is the largest export market followed by Europe, Japan and South Korea. Anything disrupting these trade flows presents a challenge to the industry and the possibility of a reduction in value.
Since 2018, China has enacted tariffs as high as 42% on seafood products imported from the U.S., including most seafood originating in Alaska. China has excluded products intended to be reprocessed in the country and then re-exported, meaning the majority of Alaska seafood is not subject to the added expense. However, Alaska’s considerable exports destined for the Chinese domestic market
16 | Alaska Seafood Marketing Institute
continue to suffer from these tariffs at a time when China’s seafood consumption is on the rise. From 2017 to 2019, China’s seafood imports nearly doubled in value (+91%), while Alaska’s exports to the country declined 29% in value.
While product intended for reprocessing and re-export is not subject to tariffs in China, recent actions by China customs officials based on unproven claims related to the transmission of the virus that causes COVID-19, have effectively created a non-tariff barrier for trade by imposing strict testing stipulations on imported food and food packaging. These stipulations have resulted in delays in processing imported seafood from Alaska and caused uncertainty in trade relationships.
Ongoing trade issues with the EU related to the WTO’s decision regarding aircraft manufacturer subsidies also have the potential to threaten established markets for Alaska seafood. In November 2020, the EU enacted 25% tariffs on Pacific salmon fillets and smoked Pacific salmon. This effectively removed the more than $17 million market for Alaska salmon fillets in the EU, severely impacting individual small Alaska companies who rely on this market. Without resolution, Alaska salmon companies will have to make major shifts for the 2021 season. The U.K. chose not to impose these tariffs on Pacific salmon products soon after the EU announcement, however, they reserved the right to do so and negotiations remained unresolved as of January 2021.
Opportunities
Because of the importance of export markets, currency rates impact the value of Alaska seafood. A weaker U.S. dollar increases the purchasing power of foreign buyers and thereby increases the competitiveness of U.S. exports. For this reason, a weaker U.S. dollar is generally preferred.
The U.S. dollar has weakened about 3% versus the Chinese yuan since February 2020. The dollar has also weakened against the EU’s euro and Japan’s yen, down about 6% and 2%, respectively, since February 2020. The weakening of the U.S. dollar coincides with and appears to be related to impacts of the COVID-19 pandemic.
In the first year implementing USDA Agricultural Trade Promotion program funding, ASMI invested in strategic marketing activities designed to enhance and expand marketing and trade opportunities in both longstanding and emerging markets, including Southeast Asia, South America and Eastern Europe. Early results from these activities show increased sales, partner promotions and brand awareness in relevant markets.
ASMI continues to focus effort on traditional export markets such as Japan, as well as Northern, Western, and Central Europe, in addition to more recently established markets in Southern Europe and China. ASMI will also support emerging markets, which present opportunities to increase the overall value of the Alaska seafood resource by expanding and diversifying both reprocessing and end markets. The message of sustainable and healthy seafood from Alaska continues to resonate in both traditional and newer markets.
17 | 2020 Annual Report

Goal #4: Increase the ex-vessel value of key species in Alaska’s commercial harvest by 0.5% annually.
Methodology: 2019 is preliminary.
Data Sources: ADF&G (Commercial Operators Annual Report and CFEC), National Marine Fisheries Service, and McKinley Research estimates.
TOTAL HARVE S T VALUE OF KE Y COMME RCIAL SE AFOOD SPECIE S
(Millions of dollars)
$0
$500
$1,000
$1,500
$2,000
$2,500
2005 20152013201120092007 2017 2019
18 | Alaska Seafood Marketing Institute

R E S U LT S
• Preliminary 2019 ex-vessel value data of Alaska seafood totaled approximately $2,019 million, a 1.4% increase from 2018 (updated Dec. 2020).
• Net growth in 2019 was due to expanding value (ranked by total contribution) for Alaska pollock (+7.7%), crab (+12.2%), salmon (+2.9%), and halibut (+12.2%). This growth was moderated by falling values for Atka mackerel (-33.8%), sablefish (-22.5%), Pacific cod (-4.6%), and flatfish (-2.4%). The herring and rockfish category also experienced a net decline. (Updated Dec. 2020)
• A compound annual growth rate of 2.5% was observed between the averaged 2009/2010 and 2018/2019 seasons, exceeding the goal of 0.5%. It is appropriate to average even and odd-numbered years to smooth fluctuations in salmon harvest values.
L O O K I N G FO RWA R D: F Y202 1 C H A L L E N G E S A N D O P P O R T U N IT I E S
Challenges
The total ex-vessel value of Alaska seafood decreased nearly 25% in 2020 compared to the pre-2020 average levels due to the COVID-19 pandemic and other harvest and market pressures. The pandemic reduced profitability due to increased operating costs and resulted in lower value-added production, reduced demand due to foodservice closures, and general market uncertainty.
The industry was already struggling with several challenges entering the pandemic. Tariff disputes added complexity and costs to export activity, with flatfish particularly challenged. Halibut and sablefish markets were weak and falling harvest volumes of Pacific cod amplified the impact of weak markets for the species.
Opportunities
While short-term and medium-term factors appear to be predominantly negative, opportunities exist. The marketing value of Alaska’s name remains strong and has perhaps grown in visibility and relevance throughout the pandemic. Conversations with seafood retailers and marketing professionals support the view that consumers are increasingly interested in the health properties, sustainability, and provenance of their food. Alaska seafood remains especially well-positioned to benefit from these consumer trends.
Frozen seafood has experienced strong growth throughout the pandemic, offering the potential of a broader market for Alaska seafood. In addition to existing seafood consumers buying seafood more frequently, some reports indicate increased purchases by individuals who have never or very infrequently purchased seafood previously. Maintaining a positive experience for this new seafood buyer will convert them to long term consumers of Alaska seafood.
On the supply side, a weaker than expected salmon harvest in Russia in summer 2020 increased the market strength of Alaska salmon, helping preserve or increase its value.
19 | 2020 Annual Report

Goal #5: Continue to generate target consumer awareness via consumer public relations and advertising campaigns.
Methodology: ASMI; Edelman PR, Carol Merry Mktg, Lotus UK, MK2, RiverGlobal, SMH Int., Crisp Consulting, D. McClellan
NUMBE R OF CON SUME R S RE ACHE D BY A SMI MARKE TING C AMPAIG N S
(in Millions)
2009 201920172015201320110
500
1,000
1,500
2,000
3,000
2,500
3,500
4,000
4,500
20 | Alaska Seafood Marketing Institute

R E S U LT S
The number of consumers reached through ASMI consumer public relations efforts increased nearly 48% in FY2020* from the previous year. Beginning in FY2019, the chart for Goal #5 reflects consumers reached through consumer PR efforts in the U.S. as well as ASMI’s major international program areas, including China, Japan, South America and Europe
In FY2020, ASMI made additional investments in digital consumer public relations and marketing activities to connect with target audiences amid the pandemic. In the U.S., domestic public relations efforts resulted in nearly 1.89 billion impressions (+99%), and extensive social media posts reached 17.4 million impressions (+178%) for a total nearly 1.91 billion impressions. International public relations efforts from the above named markets resulted in nearly 2.12 billion impressions (+12%) for the Alaska seafood brand in FY2020.
* The ASMI Japan program in FY2020 reported over 3 trillion impressions following new investment in consumer marketing and PR made possible by a one-time short-term Agriculture Trade Promotion grant. Due to the statistical anomaly, these numbers are not reflected in the 2020 total.
L O O K I N G FO RWA R D: F Y202 1 C H A L L E N G E S A N D O P P O R T U N IT I E S
Traditional in-person consumer public relations and marketing activities were upended in 2020 due to the risks of COVID-19. ASMI quickly pivoted to connect with consumers and media virtually through expanded, targeted social media, and earned and paid media relations activities. Changing digital habits offer new ways to invest in digital resources and marketing promotions, allowing ASMI to educate target consumers on the quality, sustainability and health benefits of Alaska seafood, increasing the value of the Alaska seafood brand.
21 | 2020 Annual Report

A S M I E X P E N D I T U R E S A N D R E V E N U E S
FY2020 Total Expenditures $15,491,506
Full Time Employees: 20
Executive Office/Admin $1,901,264
Communications $699,091
Consumer PR $991,864
Sustainability/RFM $856,523
Technical $344,520
International $7,467,911
Food Aid $288,545
Retail $1,446,733
General Fund Match $0
Foodservice $1,495,055
FY2020 Total Revenues $15,491,506
Federal Receipts $5,625,007
Statutory Designated Program Receipts $9,866,499
22 | Alaska Seafood Marketing Institute 22 | Alaska Seafood Marketing Institute

F I N A N C I A L I N FO R M AT I O N
FY2020 reflects the second consecutive fiscal year in which Alaska Seafood Marketing Institute received zero State of Alaska General Funds. This requires that ASMI match federal grants using Statutory Designated Program Receipts (SDPR). The reduction in state matching funds may affect ASMI’s ability to secure competitive federal grants. ASMI’s budget is now wholly composed of SDPR and federal funds. In FY2020, ASMI was awarded $7.5 million in additional federal funding through the USDA Agricultural Trade Promotion program, intended to be spent through FY2024.
While the value of Alaska seafood trended up prior to the pandemic, market conditions in 2020 reduced ex-vessel prices and processing capacity. As a result, the voluntary industry assessment (SDPR) reduced year over year. Additionally, harvest of numerous key species have been volatile in recent years, which may impact overall value moving forward. Like the industry we represent, ASMI will continue to show resilience and fiscal responsibility amid both forecasted and unanticipated challenges to best fulfill the mission of increasing the value of Alaska’s seafood resource.
23 | 2020 Annual Report

C O N T A C T
A S M I O F F I C E
311 N. Franklin Street, Suite 200Juneau, Alaska 99801
Phone: 1(907) 465-5560 or 1(800) 478-2903
alaskaseafood.org
wildalaskaseafood.com
FAC E B O O K .CO M/alaskaseafood
FAC E B O O K .CO M/ASMInewsandupdates
T W I T T E R .CO M/alaska_seafood
I N S TAG R A M .CO M/alaskaseafood
P I N T E R E S T.CO M/alaskaseafood
YO U T U B E .CO M/alaskaseafood