fy2019 operating budget work session - wmata.com€¦ · washington metropolitan area transit...
TRANSCRIPT

Finance and Budget Committee
Information Item III-B
February 8, 2018
FY2019 Operating Budget Work Session
25 of 52
Washington Metropolitan Area Transit Authority
Board Action/Information Summary
TITLE:
FY2019 Operating Budget Work Session
PRESENTATION SUMMARY:
There will be two work sessions for the FY2019 proposed budget, one for the operating budget and a second for the capital budget. In this first session, staff will provide additional information on the proposed operating budget.
PURPOSE:
Staff will provide additional information in response to questions received from Boardmembers on the FY2019 proposed budget.
DESCRIPTION:
Key Highlights:
Following the General Manager/Chief Executive Officer's (GM/CEO) proposal of the FY2019 budget in November, the Finance and Budget Committee is convening two work sessions to review the budget in greater detail.
Background and History:
The GM/CEO’s proposed FY2019 budget totals $3.17 billion (including the $1.84 billion operating budget) and is grounded in Metro’s three priorities: Safety, Service Reliability, and Financial Responsibility.
The GM/CEO’s budget priorities include:
Fund safety, compliance and reliability improvements to drive ridershipDeliver capital program investment to renew and preserve the systemEncourage customers to ride through fare pass productsNo service reductions and no fare increasesFund legacy commitments, mandates and cost inflation while limiting operating subsidy growth to three percent ($29 million)Implement management actions to improve efficiency and reduce cost, including outsourcing where effective
Action Information MEAD Number:201945
Resolution:Yes No
26 of 52

Following the presentation of the proposed budget, Metro Board members submitted follow-up questions to staff covering a range of topics. These questions are serving as the basis for two public work sessions in January.
Discussion:
Responses to the Board member questions regarding the FY2019 proposed operating budget are included as an attachment. The presentation to the Finance and Budget Committee summarizes these questions into related topic areas.
FUNDING IMPACT:
Information item only - no funding impact.
TIMELINE:
RECOMMENDATION:
No action recommended - information item only.
Previous ActionsNovember 2017 - GM/CEO proposal of FY2019 budget
December 2017 - Request for budget work sessions and authorization of public hearing
Anticipated actions afterpresentation
January - February 2018 - Public participation activities and
budget public hearing
March 2018 - Planned adoption of FY2019 budget
27 of 52

1
Washington Metropolitan Area Transit Authority FY2019 Proposed Operating Budget Board Member Questions and Answers
1. Please provide additional details on the $25 million in planned base cost reductions. What areas will these reductions come from? What will be the impact on carrying out WMATA’s mission? (District of Columbia)
The GM/CEO has committed to $38 million of additional cost reductions and business revenue opportunities for FY2019, consisting of $25 million in management actions to reduce costs, $5 million in overtime reductions, and $8 million in additional revenue. Similar to efforts in FY2016 and FY2017, by June 2018 the GM/CEO will identify and implement actions to improve operational efficiency and to eliminate redundant functions and activities. The reductions will be implemented across WMATA’s departments and functions without negatively impacting safety, service reliability or compliance. In addition to the proposed overtime reduction, management will work to reduce additional administrative labor and overhead expenses across the organization. While WMATA will continue to aggressively pursue cost reductions and new revenue opportunities, the magnitude of administrative cost reductions seen over the past two years is not repeatable. Without transformational reforms, WMATA will be unable to balance the budget and maintain sustainable subsidy growth.
2. Has there been any analysis of the Federal Budget as it stands on Federal grants, etc. on the FY2019 Budget? (Virginia) WMATA’s budget is both directly and indirectly impacted by the federal budget and other actions by the Federal government including changes to the transit benefit program, federal workforce and contracting levels, potential sequestration measures, and tax credit reforms.
Transit Benefit The recent Tax Reform bill includes language that will change the tax treatment of commuter benefits provided by employers. While the bill maintains the current benefits of up to $255 per month as a non-taxable fringe benefit, it eliminates the deductibility of the cost by employers. This change could impact the willingness of some employers to maintain the benefit. It is difficult to predict the impact of this change, though it is expected to affect small employers more than larger ones. WMATA is considering various scenarios on the impact to Metro ridership and will continue outreach to private sector employers. Federal Budget and Workforce plan While the Administration has not issued its proposed FY2019 budget, it is focused on reducing the size of the federal workforce. There is speculation that a federal hiring freeze and/or a government-wide pay freeze for civilian (non-military) employees could lead to a surge of civilian employees retiring or leaving the federal workforce. Historically, reduction of the federal workforce has
28 of 52

2
impacted Metro’s ridership; but estimates of potential ridership impacts are not feasible until more information about federal workforce plans becomes available. The Alternative Fuels Tax Credit and the Alternative Fuels Property (Infrastructure) Credit expired on December 31, 2016 (FY2017). The tax reform bill enacted in December did not extend this credit. Recently introduced Senate legislation would extend both alternative fuels credits for 2017 retroactive (FY2018) and 2018 (FY2019). The FY2019 Proposed Operating budget includes the $3 million alternative fuel tax credit. If the legislation to extend the tax credits is not approved, this would unfavorably impact the budget.
3. Please provide the budgeted and actual amounts spent on marketing in FY16 and FY17 and the budgeted amounts for FY18 and FY19. When will the Board see a plan for encouraging off-peak and weekend ridership? (District of Columbia) WMATA’s marketing activities are designed to support Metro customer outreach, fair media, U-Pass, Youth Advisory Council Meetings, procurement fairs, and other events, as well as the print shop. The FY2019 proposed budget for the Office of Marketing is $6.9 million, 2.2 percent less than the FY2018 budget. The reduction is driven primarily by savings in printing equipment and contractual services.
Marketing Office Actual Actual Budget
Proposed
FY18 to FY19
FY18 to FY19
($ in Thousands) 2016 2017 2018 2019 Change Variance
Personal Cost $3,116 $2,216 $2,014 $2,048 $34 1.7%
Non-Personnel Cost $2,850 $4,033 $5,001 $4,815 ($186) -3.7%
TOTAL COST $5,966 $6,249 $7,015 $6,863 ($152) -2.2%
WMATA has initiated various efforts to encourage ridership, ranging from customer communications about service improvements, enhanced fare product options including Select Pass, 15-Minute grace period, U-pass, and holding the 7-Day Bus Pass price unchanged. Staff will come to the Board to discuss additional plans focused on increasing customer satisfaction and new pass products to promote more frequent ridership. Further, as part of Back-to-Good, WMATA will promote peak period ridership as a reliable and convenient way to travel in early 2018. Once the capital program schedule has been finalized, WMATA will develop additional communications around other service times.
4. What percentage of the $24 million in salary increases is contractually required by a CBA?
(District of Columbia) The total FY2019 proposed operating budget for salary and wage expenses is $801 million, $2 million less than FY2018 budget. The proposed budget includes $7 million for salary and wage adjustments that are contractually obligated by existing collective bargaining agreements (CBAs), including $2 million in salaries and $5 million in wages. These increases are more than offset by other projected salary and wage expense reductions.
29 of 52

3
The distribution of projected FY2019 labor expenses between the salary and wage account categories are preliminary and will be adjusted prior to the adoption of the budget this spring. The final budget distribution will be impacted by management actions to reduce expenses, organizational adjustments, and other factors.
Budget Proposed FY18 to FY19
$ in Thousands 2018 2019 Variance
Salaries $298,797 $322,861 $24,064
Wages $504,832 $478,578 ($26,254)
TOTAL $803,629 $801,439 ($2,190)
5. Please provide more explanation of the change in WMATA’s overhead expense allocation between Metrobus and Metrorail. (District of Columbia) As part of FY2019 budget development process, WMATA updated its modal allocation formula from the historical cost-based distribution model to an activity based model. The method provides a more accurate reflection of how transit modes are supported, aligning with current best practices and federal government guidance on overhead cost allocations. In an activity based model, overhead costs of support offices are distributed to transit modes of Bus, Rail and Access based on specific performance metrics. For example, the updated calculation factors the number of Metrorail procurement activities handled by the Office of Procurement as compared to Bus procurement activities. Other performance metrics include the number of litigation cases managed by Counsel, the number of transactions processed by Accounting, and the quantity of network support and application development provided by IT. As a result of the updated methodology, there was a shift in the percentage distribution of operating overhead expenses between the transit modes.
The following are the indirect cost allocation rates for overhead distributed to WMATA’s transit modes.
FY2018
DistributionFY2019
Distribution
Metrobus 38.8% 29.8%
Metrorail 59.3% 68.4%
MetroAccess 1.9% 1.8%
100.0% 100.0%
30 of 52

4
6. Please elaborate on the practical effects of moving to the activity-based model for allocating overhead expenses and how that impacts the cost recovery ratios reported for rail and bus in the most recent fiscal years. (Virginia) The modified distribution of the overhead costs enhances classification of the costs incurred by each transit mode. With the activity-based model implemented for FY2019, the allocation of overhead costs to bus decreases, improving Metrobus cost recovery slightly. The impact on cost recovery is negated by declines in projected bus passenger revenue. The overhead allocation slightly increased rail costs, decreasing Metrorail cost recovery. Additional information is provided in the response to Question 5 above.
7. Detail the projected changes in ridership and revenues, which could be anticipated by eliminating the Grosvenor turnback using 12 trains per hour to/from Shady Grove instead of 15, and what are the anticipated costs to do so? (Maryland)
Currently, WMATA turns back every other Red Line train at Grosvenor Station from 6:30 am to 9:30 am and from 3:30 pm to 7:00 pm on weekdays; with an 8-minute headway to Shady Grove Station and a 4-minute headway from Grosvenor to Silver Spring. During all other periods, all trains turnback at Shady Grove Station. This request would partially eliminate the Grosvenor turnback and extend rail service to Shady Grove. This additional service beyond the Grosvenor Turnback would increase peak service between Shady Grove and Grosvenor to 12 trains per hour with a headway of 4-4-8-4-4-8. To accomplish this, WMATA would need two additional 8-car trains and regional operating subsidy above the three percent growth, which are not included in the GM/CEO’s FY2019 proposed budget. While some trains operating between White Flint and Grosvenor during peak periods are more crowded, the trains are on average half-full with 60 to 70 Passengers per Car (PPC), well below the Board’s service standard of 100 to 120 PPC. To meet or exceed the average maximum 120 PPC per train, ridership at the four stations north of Grosvenor would need to double and this growth would need to occur between 8:00 am and 9:00 am. The increase from 8 to 12 trains per hour between Shady Grove and Grosvenor Stations would likely generate only a nominal ridership increase, as increased capacity does not generally result in ridership growth when capacity is already available. Accordingly, WMATA does not anticipate additional passenger revenue from the elimination of the Grosvenor Turnback. There is also some risk that additional service between Grosvenor and Shady Grove and additional trains at the Shady Grove terminal would impact service reliability for the entire Red Line. Additional service between Grosvenor and Shady Grove will require seven additional staff positions, including Train Operators to operate the additional trains and extra-board and yard operators to assist with train movement and congestion at Shady Grove terminal facility. Additional costs also include traction power for increased car miles. The total projected annual operating cost and regional subsidy increase would be $1.25 million to $1.75 million. Capital investment may be required to ensure Shady Grove terminal can reliably handle the new service pattern and would need to be evaluated if the Board approves the additional service and associated additional regional subsidy.
31 of 52

5
8. What savings are anticipated for the Cinder Bed Road Bus Operations and Maintenance Facility currently out for bid, and can that model be applied to facilities in other jurisdictions, or system-wide (e.g. Andrews Federal Center, Bladensburg, etc.)? (Maryland)
WMATA is exploring new business models to improve operating efficiency, while continuing to improve the quality and safety of service to our customers. Nearly one third of all transit agencies, nationally, contract out some of their bus service with some levels of cost savings associated with competitive contracting. The Cinder Bed Road Bus Operations and Maintenance Facility procurement is currently in progress and, thus, WMATA cannot comment on specific savings. Upon the award of the Cinder Bed Road contract, WMATA will analyze any cost savings and its application to other facilities. The GM/CEO will continue to explore outsourcing new functions, facilities and operations when feasible in an effort to gain efficiencies and cost savings.
32 of 52

6
9. Does WMATA have or can WMATA conduct a comparative analysis of MetroAccess's cost recovery ratio with like transit properties? Are the contracted cost increases for MetroAccess tied to performance measures (e.g. on-time performance, customer satisfaction)? Please detail any performance measures that are included in the contract and how any disputes over said measures are arbitrated. (Virginia)
The cost recovery of the top ten highest ridership paratransit service providers is detailed below. Cost recovery and subsidy requirements for MetroAccess and service providers nationwide are heavily influenced by the providers’ service areas as well as the availability of alternative and lower cost providers of paratransit or similar mobility services for people with disabilities. Additionally, fare policy, policy mandates, and the level and quality of service provided above and beyond the requirements of the Americans with Disabilities Act (ADA) continue to drive the overall cost and subsidy for transit agencies.
Agency Name City Ridership* Cost Recovery Ratio
2014 2015 2016
Miami-Dade Transit (MDT) Miami, FL 1,643,345 11.7% 11.5% 11.1%Southeastern Pennsylvania Transportation Authority(SEPTA) Philadelphia, PA 1,792,284 10.5% 10.8% 10.9%Metro Mobility St. Paul, MN 2,133,727 12.8% 13.7% 10.0%
Washington Metropolitan Area Transit Authority Washington, DC 2,281,044 7.2% 8.0% 7.9%
Pace, ADA Paratransit Services(PACE) Arlington Heights, IL 4,116,466 6.6% 6.9% 7.1%
Access Services(AS) El Monte, CA 4,293,380 6.2% 6.8% 6.9%
Massachusetts Bay Transportation Authority(MBTA) Boston, MA 2,187,785 5.9% 5.9% 5.9%
Metropolitan Transit Authority of Harris County, Texas(Metro) Houston, TX 1,928,762 2.9% 3.4% 4.0%
Maryland Transit Administration(MTA) Baltimore, MD 2,565,314 2.1% 2.2% 3.9%
MTA New York City Transit(NYCT) New York, NY 6,316,903 2.7% 2.9% 2.8%Data Source: National Transit Database (NTD) / *Unlinked Passenger Trips (UPT)
The compensation in all MetroAccess contracts always ties to performance metrics and associated liquidated damages defined in the contracts. Examples of the metrics include on-time performance, excessively late trips, missed trips, customer injury rate per 100k customers, valid customer complaints and response time to complaints, timely reporting of incidents and compliance for preventive maintenance inspections. Disputes over performance measures are addressed with the contractor by Access Services staff, and when escalated, through written correspondence between the contractor and the Contracting Officer in Procurement. Should the contractor wish to pursue the matter beyond the Contracting Officer, there is a formal dispute resolution process available. It involves filing a formal appeal of the Contracting Officer’s decision to the WMATA Board of Directors who in turn authorizes the Armed Services Board of Contract Appeals (ASBCA) to handle the case and render a final decision on the Board’s behalf. WMATA’s paratransit contractors have not invoked this procedure regarding liquidated damages in some time.
33 of 52
FY2017 Budget:Ridership and Revenue
Finance & Administration CommitteeOctober 8, 2015
Washington Metropolitan Area Transit Authority
FY2019 Budget Work Session:Operating Budget – Part Two
Finance and Budget CommitteeFebruary 8, 2018
34 of 52
2
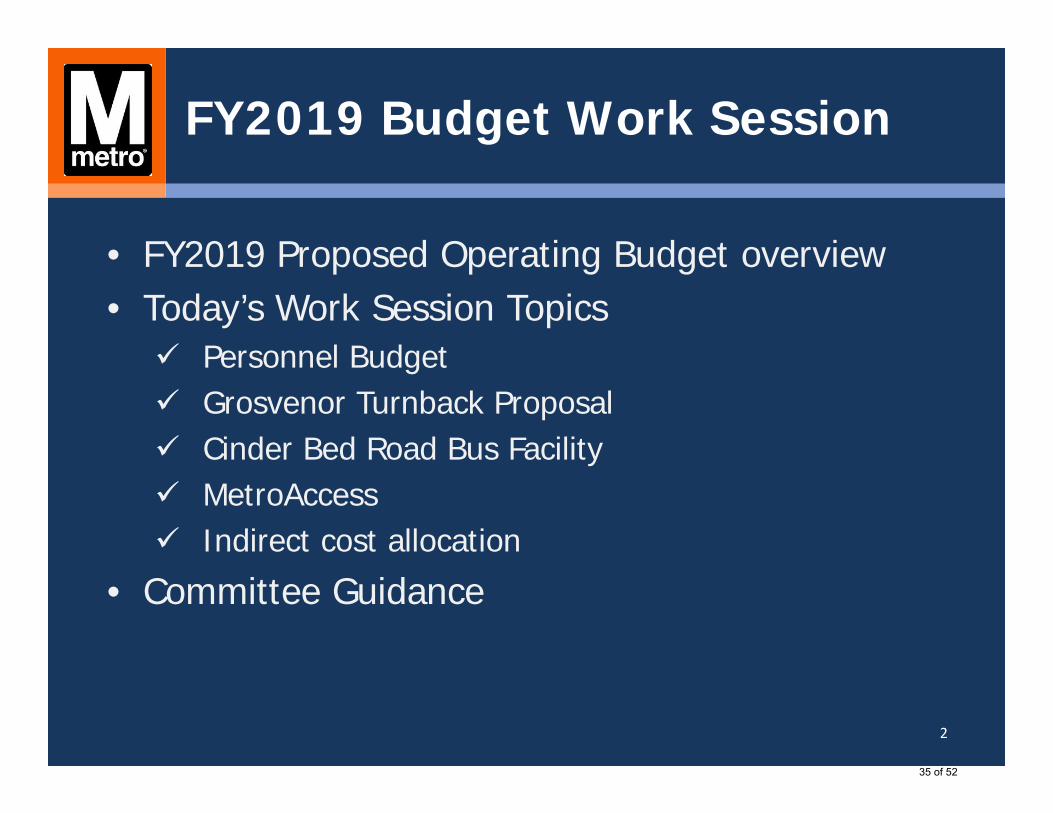
FY2019 Budget Work Session
• FY2019 Proposed Operating Budget overview• Today’s Work Session Topics Personnel Budget Grosvenor Turnback Proposal Cinder Bed Road Bus Facility MetroAccess Indirect cost allocation
• Committee Guidance
35 of 52

FY2019 Proposed Budget Priorities
• Fund safety, compliance and reliability improvements to drive ridership
• Deliver capital program investment to renew and preserve the system
• Encourage customers to ride through fare pass products• No service reductions and no fare increases• Fund legacy commitments, mandates and cost inflation
while limiting operating subsidy growth to 3 percent ($29 million)
• Implement management actions to improve efficiency and reduce cost, including outsourcing where effective
3
36 of 52

4
FY2019 Proposed Operating Budget
FY2018 FY2019 $ %REVENUE Passenger Revenue $756 $736 ($20) -2.6% Other Revenue $90 $92 $3 2.8% Total Revenue $845 $828 ($17) -2.0%
EXPENSES Labor and Benefits $1,308 $1,306 ($2) -0.2% Non-Labor $518 $532 $14 2.7% Total Expenses $1,825 $1,837 $12 0.7%
SUBSIDY $980 $1,009 $29 3.0%
Growth$ in millions
37 of 52

Rebuilding Ridership
• Improving reliability and on-time performance on Rail and Bus
• Encouraging customers to ride through fare pass products and customer confidence program
• Federal Governmento Decreases in federal and contractor workforce o Impact of tax law changes on employer-
provided commuter benefits• Telework and alternative work schedules• Growing transportation network companies• Low gas prices
538 of 52
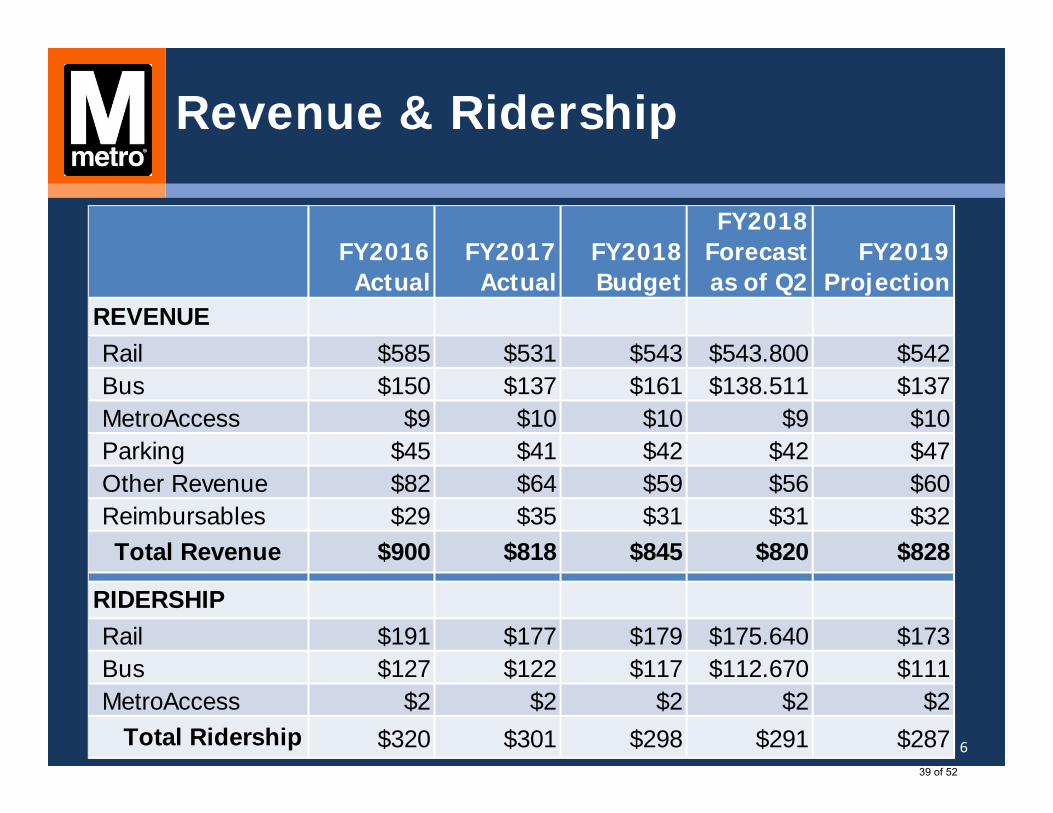
Revenue & Ridership
6
FY2016Actual
FY2017Actual
FY2018Budget
FY2018Forecastas of Q2
FY2019Projection
REVENUE
Rail $585 $531 $543 $543.800 $542 Bus $150 $137 $161 $138.511 $137 MetroAccess $9 $10 $10 $9 $10 Parking $45 $41 $42 $42 $47 Other Revenue $82 $64 $59 $56 $60 Reimbursables $29 $35 $31 $31 $32
Total Revenue $900 $818 $845 $820 $828
RIDERSHIP
Rail $191 $177 $179 $175.640 $173 Bus $127 $122 $117 $112.670 $111 MetroAccess $2 $2 $2 $2 $2
Total Ridership $320 $301 $298 $291 $287 39 of 52

FY2019 Subsidy Growth Constrained to 3 percent
($ in millions)Subsidy Impact
FY2018 Approved Subsidy $980
Ridership Decline Metrorail and Metrobus $25Subtotal $25
Legacy Commitments, Mandates and Inflation
Contractually obligated wage steps $7 Health Care and Pension $9 Paratransit $11 Energy Costs $7 Inflation: Materials, Supplies & Services $8
Subtotal $42
Management Actions to Reduce Cost and Generate More Revenue
Control Overtime Costs ($5)Baseline Reductions and Efficiencies ($25)Increase parking revenue ($6)Increase advertising revenue ($2)
Subtotal ($38)
FY2019 Jurisdictional SubsidyFY2019 Proposed Subsidy $1,009
Subsidy Increase (3%) $297
40 of 52

Management Actions and Initiatives to Reduce Cost and Generate Revenue
• Management actions already implemented: Reduced 800 positions and non-represented employee healthcare cost Implemented controls on absenteeism and workers’ compensation Launched Abilities-Ride Enhanced advertising Fair Fare Collection – Increase enforcement
• Additional management actions to reduce cost and generate revenue: Cost efficiencies and reductions – $25 million
• GM/CEO commitment to improve operating efficiency and eliminate redundancies without impacting safety, reliability or compliance
Control overtime expense – $5 million Increase parking revenue opportunities – $6 million Expand advertising – $2 million Advance structural reforms – TBD 8
41 of 52

FY2019 Operating Budget
$1,306 MPersonnel
$531 MNon-
Personnel
$99M
$109M
$127M
$196M
Non-Personnel Budget
$877M
$429M
Personnel Budget
Energy(7%)
Materials & Supply/ Other
(5%)
Services –Paratransit
(6%)
Services(11%)
Fringe(23%)
Salaries & Wages / OT
(48%)
942 of 52

FY2019 Personnel Budget
Salaries and Wages61%
Salaries and Wages61%
Salaries and Wages61%
Overtime7%
Overtime6%
Overtime6%
Fringe32%
Fringe32%
Fringe33%
$1,226 M
$1,308 M $1,306 M
$0
$200
$400
$600
$800
$1,000
$1,200
$1,400
Actual 2017 Budget 2018 Proposed 2019
FY2019 Proposed Budget does NOT include:
• Wage increases for FY2019 or prior years
• Personnel costs for Silver Line Phase 2
• Additional funding for contributions to OPEB Trust
10
43 of 52

Grosvenor Turnback Proposal
11
• Currently, every other Red Line train turns back at Grosvenor Station during weekday peak periods
• Request to add Red Line service and modify turnback at Grosvenor is not included in proposed budget; additional operating expense would require subsidy increase
• Potential capital investment needs must be evaluated• Minimal ridership impact due to existing capacity
44 of 52

Cinder Bed Road Bus Facility
• Cinder Bed Road Operations and Maintenance Facility RFP in progress• Cost savings to be analyzed upon award of contract• Metro will continue to examine opportunities for competitive
contracting where feasible and cost effective, including Silver Line Phase 2
12
45 of 52

MetroAccess
$118M $125M $121M $131M $50
$60
$70
$80
$90
$100
$110
$120
$130
$140
FY2016 Actual FY2017 Actual FY2018 Budget FY2019 Proposed
MetroAccess Operating Expense
Demand Response AgenciesCost Recovery Ratio
2014 2015 2016Southeastern Pennsylvania Transportation Authority (SEPTA) 10.5% 10.8% 10.9%
Washington Metropolitan Area Transit Authority (WMATA) 7.2% 8.0% 7.9%
Massachusetts Bay Transportation Authority (MBTA) 5.9% 5.9% 5.9%Maryland Transit Administration (MTA) 2.1% 2.2% 3.9%MTA New York City Transit (NYCT) 2.7% 2.9% 2.8%
11% Growth
• Demand for paratransit services increasing with growing eligible population
• Primary driver of FY2019 budget increase is anticipated contract rate increases
• Unsustainable cost and subsidy growth without more alternative service providers and structural changes
$ Millions
1346 of 52

Indirect Cost Allocation
• FY2019 indirect cost allocation is an activity-based model Provides more accurate distribution of overhead to transit modes Aligns with best practices and federal guidance on cost allocation
• Examples: Procurement activities and software applications
14
FY2018 FY2019
Metrobus 38.8% 29.8%
Metrorail 59.3% 68.4%
MetroAccess 1.9% 1.8%
100.0% 100.0%
47 of 52

Metrobus Routes Impacted Implementedin FY2018?
Estimated Subsidy Impact
($ in millions)
DC: G9 (Pilot), 52, 53, 54, U8, 59, 74 $2.3
DC: U5, U7, 74, X9, X2, 94, V5
MD: B30, G12, G14, J1, J2, J3, J12, K12, Y2, Y7, Y8
VA: 7A, 7F, 10E, 22B, 16G, 16H, 16B, 16J, 16X
$1.1
Metrobus Service Changes not included in FY2019 Proposed Budget
1548 of 52

Committee Guidance Required
16
Potential Budget Changes($ in millions)
FY2019 Budget ImpactExpense Revenue Subsidy
Additional Metrobus Service $0.0 - $4.6 $0.0 - $1.1 $0.0 - $3.5
Additional Peak Period Red Line Service between Shady Grove and Grosvenor Stations
$0.0 - $2.5 - $0.0 - $2.5
Additional Budget Increase for Office of Inspector General TBD TBD TBD
Other Post Employment Benefits Trust Contribution $0.0 - $5.0 - $0.0 - $5.0
Rainy Day Fund Contribution - - $0.0 - $18.4
Other Changes TBD TBD TBD
49 of 52
17
Next Steps
• March: Approval of the FY2019 Budget and Public Outreach Report
• July 1, 2018: Start of FY2019
50 of 52