fy2017 1 half financial results (ended september 20, 2017 ... · ac drive “cr700” for crane...
TRANSCRIPT
© 2017 YASKAWA Electric Corporation
(TSE6506)
FY2017 1st Half Financial Results(Ended September 20, 2017)
FY2017 2nd Half and Full-year Forecasts(Ending February 28, 2018)
Notes:- Yaskawa Electric changes its accounting period from March 20 to the last day of
Febguary starting FY2017. The figures of FY2017 forecasts〈Reference basis〉in this document are based on the assumption that the accounting period remains unchanged. (from March 21, 2017 to March 20, 2018) (Please refer to the appendix on page 18 for details.)
- The information within this document is made as of the date of writing. Any forward-looking statements are made according to the assumptions of management and are subject to change as a result of risks and uncertainties. YASKAWA Electric Corporation undertakes no obligation to update or revise these forward-looking statements, whether as a result of new information, future events, or otherwise.
- Figures in this document are rounded off, and may differ from those in other documents such as financial results.

© 2017 YASKAWA Electric Corporation 1
Contents
1. FY2017 1H Financial Results• FY2017 1H Financial Results
(Highlights, By Business Segment)
• Sales Breakdown by Business Segment(FY2016 1H FY2017 1H)
• Sales Breakdown by Destination(FY2016 1H FY2017 1H)
• Breakdown of Change in Operating Income(FY2016 1H FY2017 1H)
• Measures for FY2017 2Q
2. FY2017 2H Financial Forecasts
• FY2017 Full-year Financial Forecasts
(Highlights, By Business Segment)
• Breakdown of Change in Operating Income
(FY2016 FY2017)
• Measures for FY2017 2H
3. Reference• Change in Accounting Period and
its Effects
• Impact of Retroactive Application of
Revision in the Division of Business
Segments
• Capital Expenditure,
R&D Investment, Forex Rates
• Financial Indices
• Net Sales/Operating Income
• Quarterly Sales Trends
• Quarterly Order Trends
• Major Production Bases

© 2017 YASKAWA Electric Corporation 2
Motion Control System EngineeringRobotics
Other
Business Overview
[Core products]• IT-related services• Logistics, etc.
[Core products]• AC servo motors and controllers• Linear servo motors• AC drives
etc.
General purpose AC drive “Zero series”
AC servo motor “Σ-7” series
[Core products]• Industrial Robots
- Arc and spot welding robots, Painting robots
- FPD glass sheet transfer robots, Handling robots,
• Semiconductor wafer transfer robots• Biomedical robots• Collaborative robots etc.
Collaborative robot MOTOMAN-HC10
New miniature robot MOTOMAN-GP8
[Core products]• Electrical systems for steel plants• Electrical instrumentation systems for water supply plants and sewage treatment facilities
• Large-scale wind power generator and converter etc.
• PV inverters
PV inverter for photovoltaic power generation
Electrical instrumentationsystems for water and sewerage
Continuous-casting machineLarge-scale wind turbine and converter
Matrix converterU1000
Arc-welding robot MOTOMAN-AR1730

© 2017 YASKAWA Electric Corporation 3
1. FY2017 1H Financial Results(Ended September 20, 2017)

© 2017 YASKAWA Electric Corporation 4
FY2017 1H Financial Results Highlights
• Sales and profits significantly increased due to robust demand especially from the Chinese market.
(Sales and profits marked record high as 1H results)
Note: The figures of FY2017 1H previous forecasts were announced on July 20, 2017
FY2017 1H FY2016 1H FY2017 1H
Results Results Amounts % Forecasts
Net sales \ 229.1bn. \ 187.6bn. +\ 41.5bn. +22.1% \ 228.5bn.
\ 27.8bn. \ 13.8bn. +\ 14.0bn. +101.2% \ 28.2bn.
\ 27.5bn. \ 13.8bn. +\ 13.7bn. +99.6% \ 27.2bn.
\ 21.1bn. \ 8.6bn. +\ 12.5bn. +145.0% \ 18.3bn.
Changes
Profit attributable
to owners of parent
Ordinary income
Operating income

© 2017 YASKAWA Electric Corporation
FY2017 1H Financial Results by Business Segment (1)
5
•(M): Record highs achieved by strong AC servo sales in China
•(R): Profitability improved because of the steady sales growth
Note 1 : The figures of FY2017 1H previous forecasts were announced on July 20, 2017
Note 2 : Revisions were made to the division of businesses segments starting 1Q FY2017. The PV inverter business, which was
previously included in Motion Control, is included in System Engineering. The figures for 1H FY2016 reflect this change.
(Please refer to the appendix at the end of this material for details.)
ResultsIncome
ratioResults
Income
ratioAmounts % Forecasts
Income
ratio
229.1 187.6 +41.5 +22.1% 228.5
(M) Motion Control 110.4 83.2 +27.1 +32.6% 109.5
(R) Robotics 80.4 68.4 +12.1 +17.7% 80.0
(S) System Engineering 28.2 24.7 +3.5 +14.1% 29.0
Other 10.1 11.4 -1.2 -10.8% 10.0
27.8 12.1% 13.8 7.4% +14.0 +101.2% 28.2 12.3%
(M) Motion Control 21.8 19.7% 10.8 13.0% +11.0 +101.6% 21.6 19.7%
(R) Robotics 8.6 10.6% 5.6 8.2% +3.0 +53.3% 8.5 10.6%
(S) System Engineering -1.8 -6.3% -1.6 -6.5% -0.2 - -0.8 -2.8%
Other -0.1 -0.5% -0.4 -3.7% +0.4 - -0.2 -2.0%
Elimination or Corporate -0.7 - -0.6 - -0.2 - -0.9 -
27.5 12.0% 13.8 7.3% +13.7 +99.6% 27.2 11.9%
21.1 9.2% 8.6 4.6% +12.5 +145.0% 18.3 8.0%Profit attributable to owners of parent
Operating income
FY2017 1H
Ordinary income
Changes
Net sales
FY2016 1H FY2017 1H

© 2017 YASKAWA Electric Corporation
• AC servo sales and operating income grew significantly because of the production automation and strong smartphone-related demand.
• Sales and profitability grew on the back of recoveries in infrastructure investment in China and the U.S. oil- and gas-related demand.
• Automobile-related business was steady outside Japan.
• Sales for the general industries increased because of the strong demand for production automation of smartphones and home electronics in China.
Motion Control
Robotics
System Engineering
• Sales for steel plant and social system businesses were solid.
• Sales related to large-scale wind turbines grew.
• Sluggish PV inverter sales weighed on earnings.
FY2017 1H Financial Results by Business Segment (2)
6
© 2017 YASKAWA Electric Corporation 7
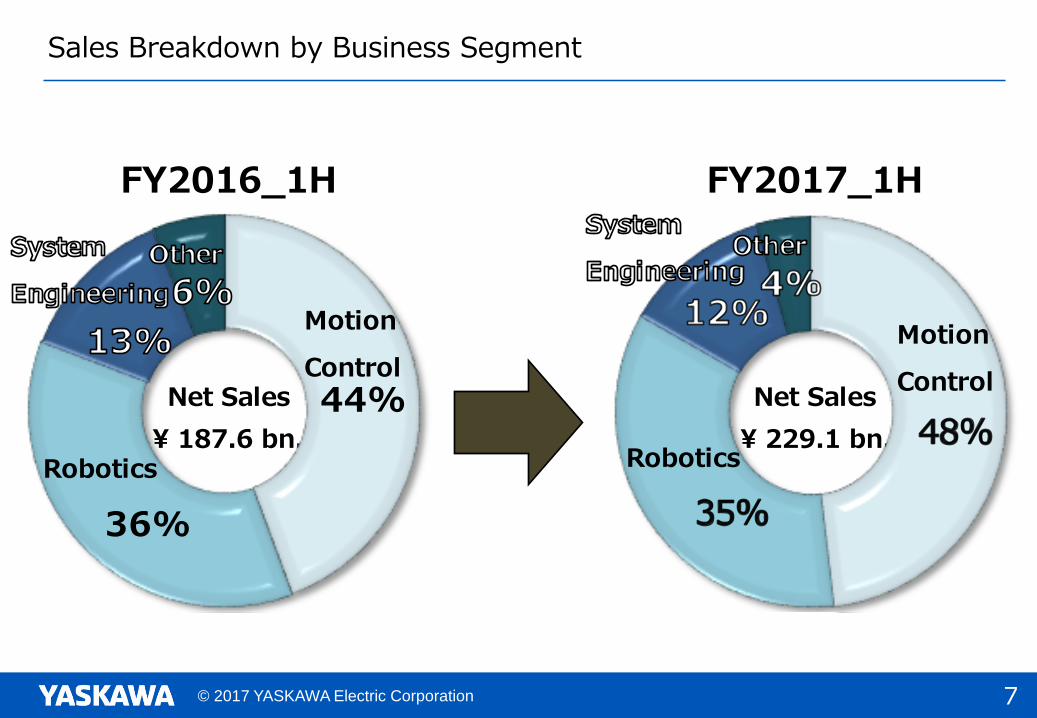
Sales Breakdown by Business Segment
FY2016_1H FY2017_1H
Net Sales Net Sales
\ 187.6 bn. \ 229.1 bn.
44%
36%
Motion
Control
Motion
Control
RoboticsRobotics
© 2017 YASKAWA Electric Corporation 8
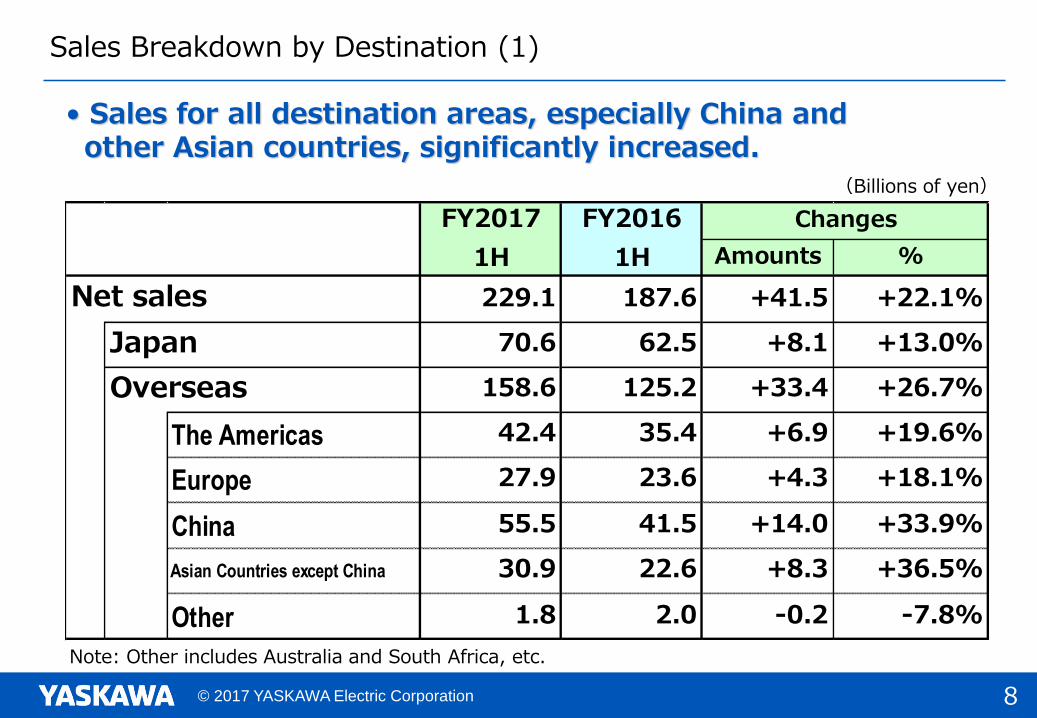
• Sales for all destination areas, especially China and other Asian countries, significantly increased.
Note: Other includes Australia and South Africa, etc.
Sales Breakdown by Destination (1)
(Billions of yen)
Amounts %
229.1 187.6 +41.5 +22.1%
Japan 70.6 62.5 +8.1 +13.0%
Overseas 158.6 125.2 +33.4 +26.7%
The Americas 42.4 35.4 +6.9 +19.6%
Europe 27.9 23.6 +4.3 +18.1%
China 55.5 41.5 +14.0 +33.9%
Asian Countries except China 30.9 22.6 +8.3 +36.5%
Other 1.8 2.0 -0.2 -7.8%
Changes
Net sales
FY2017
1H
FY2016
1H
© 2017 YASKAWA Electric Corporation 9
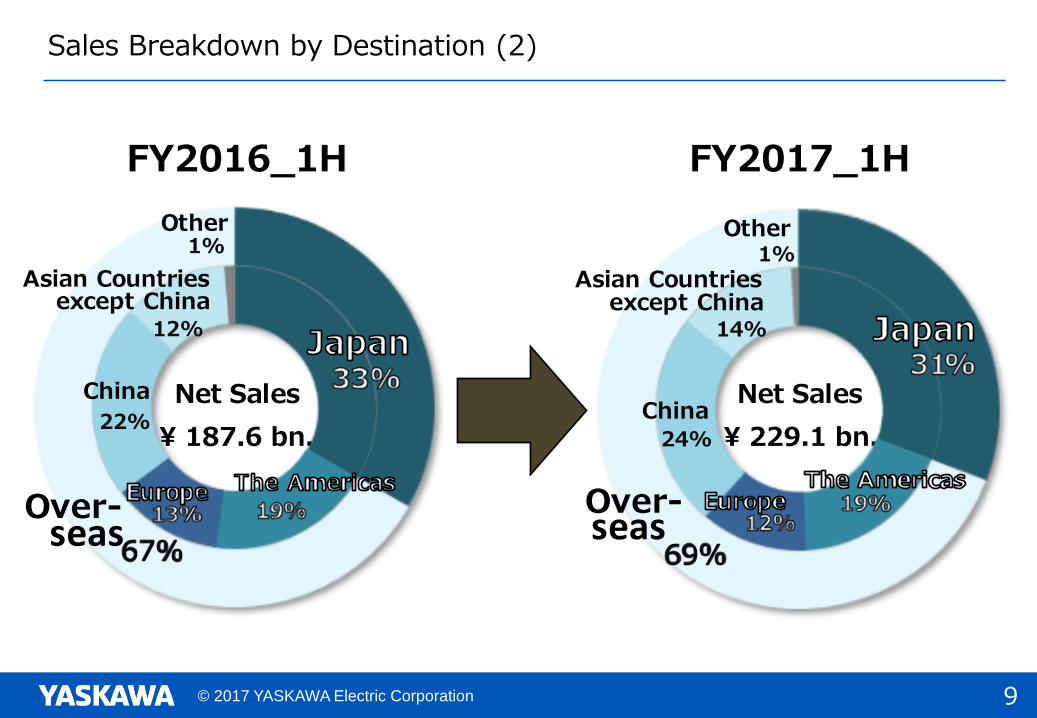
Sales Breakdown by Destination (2)
FY2016_1H FY2017_1H
Net Sales Net Sales
\ 187.6 bn. \ 229.1 bn.22%
12%
1%
24%
14%
1%
China
Other
China
Other
Over-seas
Over-seas
Asian Countriesexcept China
Asian Countriesexcept China
© 2017 YASKAWA Electric Corporation
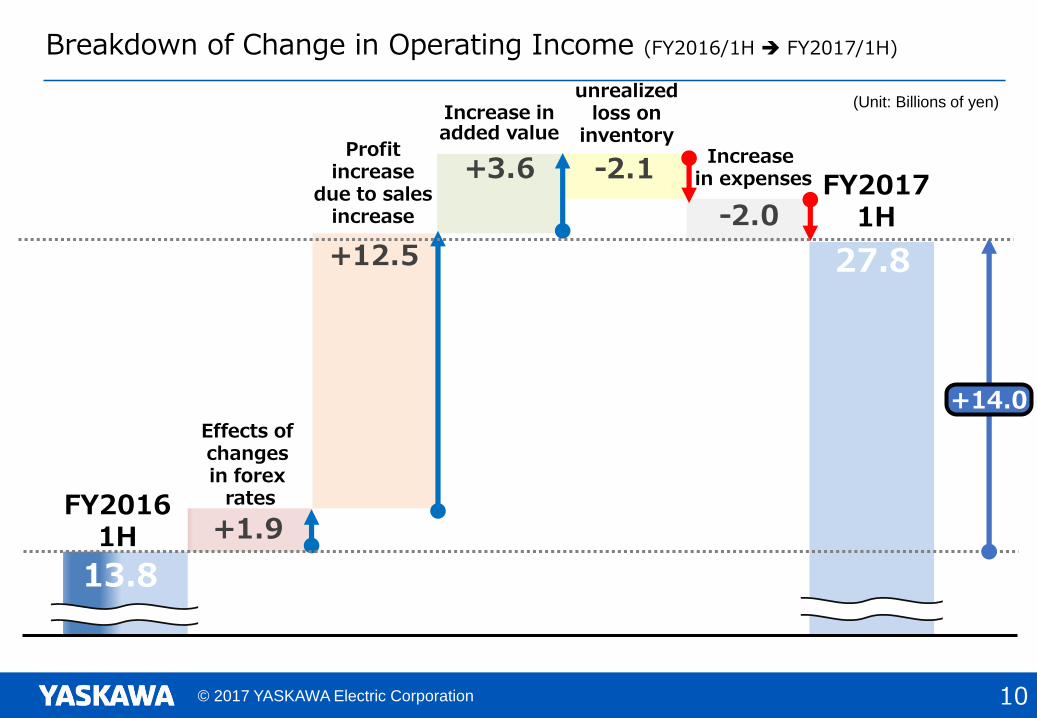
+1.9
+12.5
+3.6 -2.1
-2.0
13.8
27.8
+14.0
10
Breakdown of Change in Operating Income (FY2016/1H FY2017/1H)
(Unit: Billions of yen)
FY20171H
FY20161H
Profitincrease
due to sales increase
Effects of changes in forex
rates
Increase inadded value
Increase in expenses
unrealized loss on
inventory

© 2017 YASKAWA Electric Corporation
Profitability improvement in core businesses Promoted switch to AC servo Σ-7 series and enhanced its lineup
・Σ-7 switchover ratio in FY17 1H: 62% (China:96%)
・Launched hollow shaft servo motor “SGM7T model”
Expanded lineup of AC drive Zero series・Launched AC drive “CR700” for crane use
Improvement in production capacity Expansion of robot plant in China (Scheduled September, 2018)
・Capacity of robot production:1,500 units/month*
Promotion of new businesses Development of medical, nursing care,
and welfare services field・Launched upper limb rehabilitation
device “CoCoroe AR2”
Robot plant No.3 in China(Image)
AC drive “CR700” for crane application
11
Hollow shaft servo motor“SGM7T model”
CoCoroe AR2
Measures for FY2017 1H
* including the capacity of existing plants
(Sep.21, 2017)
(Aug.21, 2017)
(Sep.25, 2017)
Third plant (new)
Second plant
First plant
Area for expansion

© 2017 YASKAWA Electric Corporation 12
2. FY2017/2H and Full-year Financial Forecasts (Ending February 28, 2018)
© 2017 YASKAWA Electric Corporation 13
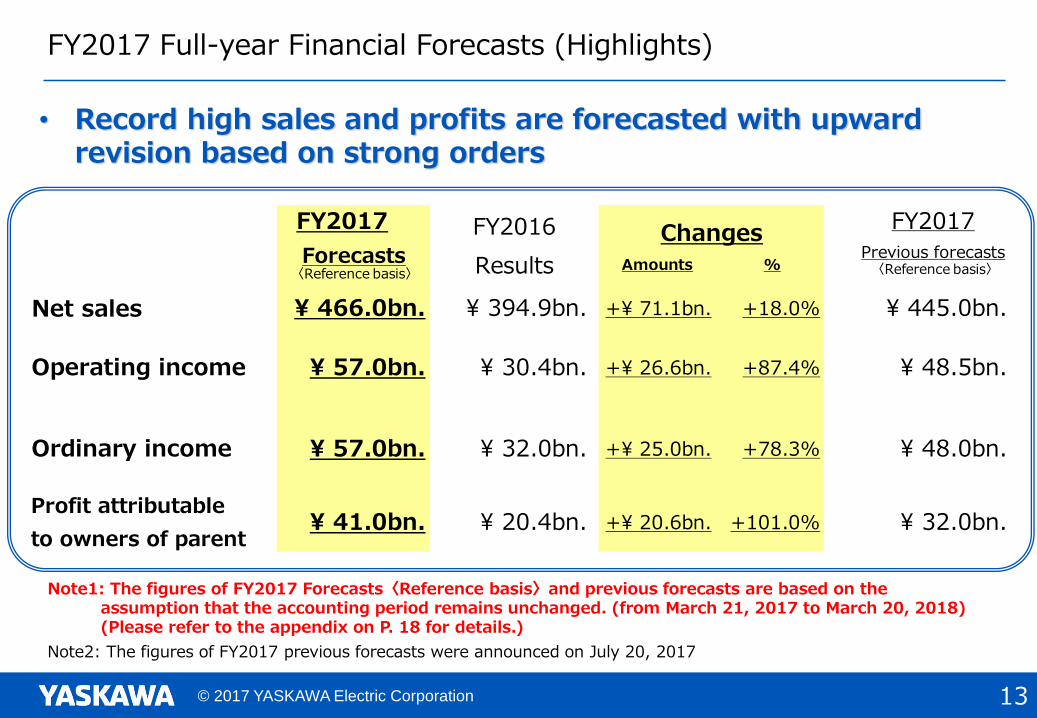
FY2017 Full-year Financial Forecasts (Highlights)
• Record high sales and profits are forecasted with upward revision based on strong orders
Note1: The figures of FY2017 Forecasts〈Reference basis〉and previous forecasts are based on the assumption that the accounting period remains unchanged. (from March 21, 2017 to March 20, 2018)(Please refer to the appendix on P. 18 for details.)
Note2: The figures of FY2017 previous forecasts were announced on July 20, 2017
FY2016
Results Amounts %
Net sales \ 466.0bn. \ 394.9bn. +\ 71.1bn. +18.0% \ 445.0bn.
\ 57.0bn. \ 30.4bn. +\ 26.6bn. +87.4% \ 48.5bn.
\ 57.0bn. \ 32.0bn. +\ 25.0bn. +78.3% \ 48.0bn.
\ 41.0bn. \ 20.4bn. +\ 20.6bn. +101.0% \ 32.0bn.
FY2017
Previous forecasts
FY2017
ForecastsChanges
Operating income
Ordinary income
Profit attributable
to owners of parent
〈Reference basis〉 〈Reference basis〉
© 2017 YASKAWA Electric Corporation 14
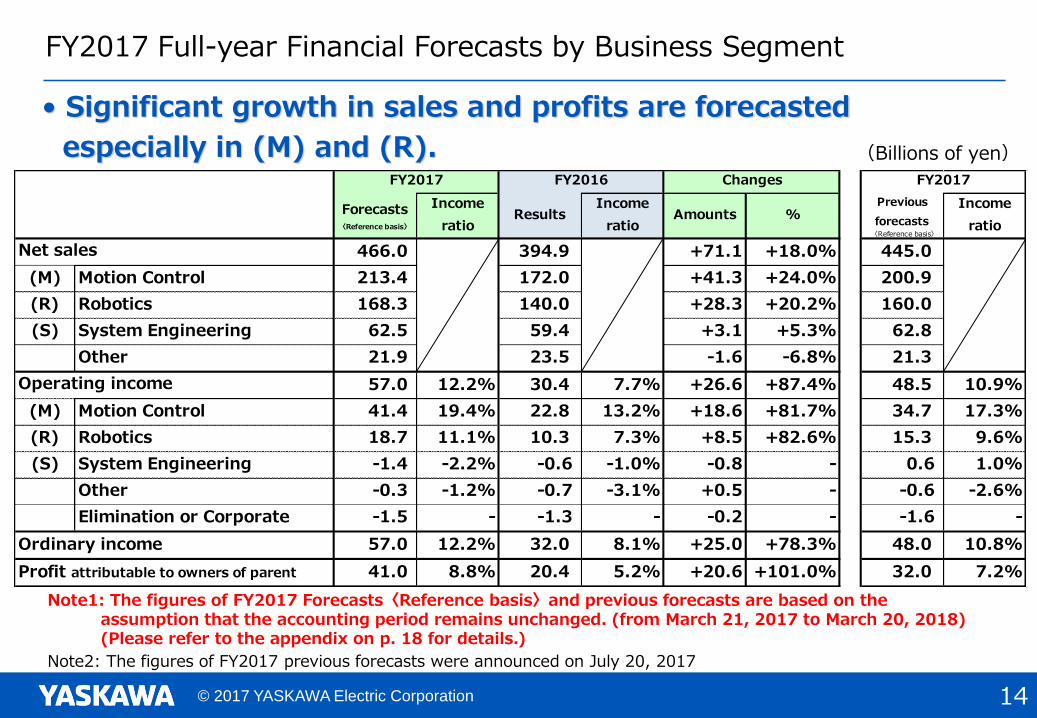
FY2017 Full-year Financial Forecasts by Business Segment
Note2: The figures of FY2017 previous forecasts were announced on July 20, 2017
• Significant growth in sales and profits are forecasted
especially in (M) and (R).
Forecasts〈Reference basis〉
Income
ratioResults
Income
ratioAmounts %
Previous
forecasts
Income
ratio
466.0 394.9 +71.1 +18.0% 445.0
(M) Motion Control 213.4 172.0 +41.3 +24.0% 200.9
(R) Robotics 168.3 140.0 +28.3 +20.2% 160.0
(S) System Engineering 62.5 59.4 +3.1 +5.3% 62.8
Other 21.9 23.5 -1.6 -6.8% 21.3
57.0 12.2% 30.4 7.7% +26.6 +87.4% 48.5 10.9%
(M) Motion Control 41.4 19.4% 22.8 13.2% +18.6 +81.7% 34.7 17.3%
(R) Robotics 18.7 11.1% 10.3 7.3% +8.5 +82.6% 15.3 9.6%
(S) System Engineering -1.4 -2.2% -0.6 -1.0% -0.8 - 0.6 1.0%
Other -0.3 -1.2% -0.7 -3.1% +0.5 - -0.6 -2.6%
Elimination or Corporate -1.5 - -1.3 - -0.2 - -1.6 -
57.0 12.2% 32.0 8.1% +25.0 +78.3% 48.0 10.8%
41.0 8.8% 20.4 5.2% +20.6 +101.0% 32.0 7.2%
FY2017FY2016FY2017
Operating income
Ordinary income
Profit attributable to owners of parent
Changes
Net sales〈Reference basis〉
(Billions of yen)
Note1: The figures of FY2017 Forecasts〈Reference basis〉and previous forecasts are based on the assumption that the accounting period remains unchanged. (from March 21, 2017 to March 20, 2018)(Please refer to the appendix on p. 18 for details.)

© 2017 YASKAWA Electric Corporation
+3.8
+19.5
+8.0+0.9 -5.6
57.0
30.4
+26.6
15
Breakdown of Change in Operating Income (FY2016 FY2017 Forecast)
(Unit: Billions of yen)
FY2017Forecast
FY2016
Profitincrease
due to sales increase
Effects of changes in forex
rates
Increase inadded value
Increase in expenses
unrealized profit on inventory

© 2017 YASKAWA Electric Corporation
Profitability improvement in core businesses Sales promotion of new robots (GP series and MotoMINI) Enhance proposal of robotics solutions
・Promote cross-divisional sales activity
Reinforce development, production and sales capabilities Establishment of Yaskawa Solution Factory
・Innovative production system for higher productivity Promotion of “i
3-Mechatronics”, a new solution concept
・Rebuild R&D and sales structures for creating new value・Enhance R&D of IoT and AI through alliances
Expansion of environment and energy business by optimizing resources Start production of EV powertrain at Chery Yaskawa Launch a strategic PV inverter product
Promotion of new businesses Full-scale entry into vegetable plant system and automation
of home-meal replacement production
Rendering of Yaskawa Solution Factory
Filling food trays with sandwich
MotoMINI, the smallest and lightest in industry, and can be embedded in equipment
16
Measures for FY2017 2H
(scheduled Jun. 2018)
(Jan. 2018)

© 2017 YASKAWA Electric Corporation 17
3. Reference

© 2017 YASKAWA Electric Corporation
1H 2H
Forecasts
Full-year
Forecasts
2H
Forecasts
Full-year
ForecastsChanges
229.1 236.9 466.0 220.9 450.0 -16.0
(M) Motion Control 110.4 103.0 213.4 99.8 210.2 -3.1
(R) Robotics 80.4 87.8 168.3 84.4 164.8 -3.5
(S) System Engineering 28.2 34.3 62.5 26.0 54.1 -8.4
Other 10.1 11.8 21.9 10.8 20.9 -1.0
27.8 29.2 57.0 26.2 54.0 -3.0
(M) Motion Control 21.8 19.6 41.4 19.1 40.8 -0.5
(R) Robotics 8.6 10.2 18.7 9.5 18.0 -0.7
(S) System Engineering -1.8 0.4 -1.4 -1.3 -3.1 -1.7
Other -0.1 -0.2 -0.3 -0.3 -0.3 -0.1
Elimination or Corporate -0.7 -0.7 -1.5 -0.8 -1.5 0.0
27.5 29.5 57.0 26.5 54.0 -3.0
21.1 19.9 41.0 17.9 39.0 -2.0
Before Change After Change
Net Sales
Operating Income
Ordinary Income
Profit attributable to owners of parent
18
Impact of change in accounting period
Impact of change in accounting period from March 20 to the last day of February
FY2017 Financial Forecasts (Unit: Billions of yen)

© 2017 YASKAWA Electric Corporation 19
Impact of retroactive application of revision in the division of business segments(FY2016)
・The PV inverter business, which was previously included in Motion Control, is included in System Engineering, starting fiscal 2017.
Full-Year
90.4 97.3 187.6 97.0 110.2 207.2 394.9 -
(M) Motion Control 40.8 42.4 83.2 42.5 46.3 88.8 172.0 -11.3
(R) Robotics 32.4 36.0 68.4 33.7 37.9 71.6 140.0 -
(S) System Engineering 11.7 13.0 24.7 15.5 19.2 34.7 59.4 11.2
Other 5.5 5.9 11.4 5.4 6.8 12.2 23.5 0.1
5.5 8.4 13.8 7.8 8.8 16.6 30.4 -
(M) Motion Control 4.6 6.2 10.8 6.1 5.9 12.0 22.8 2.0
(R) Robotics 2.2 3.4 5.6 2.3 2.3 4.7 10.3 -
(S) System Engineering -0.9 -0.7 -1.6 -0.1 1.1 1.0 -0.6 -1.5
Other -0.2 -0.2 -0.4 -0.1 -0.2 -0.3 -0.7 -0.5
Elimination or Corporate -0.3 -0.2 -0.6 -0.4 -0.4 -0.7 -1.3 -
Net sales
Operating income
(Unit: Billions of yen)
FY2016(After segment revision)Changes
1Q 2Q 1H 3Q 4Q 2H Full-Year
© 2017 YASKAWA Electric Corporation 20
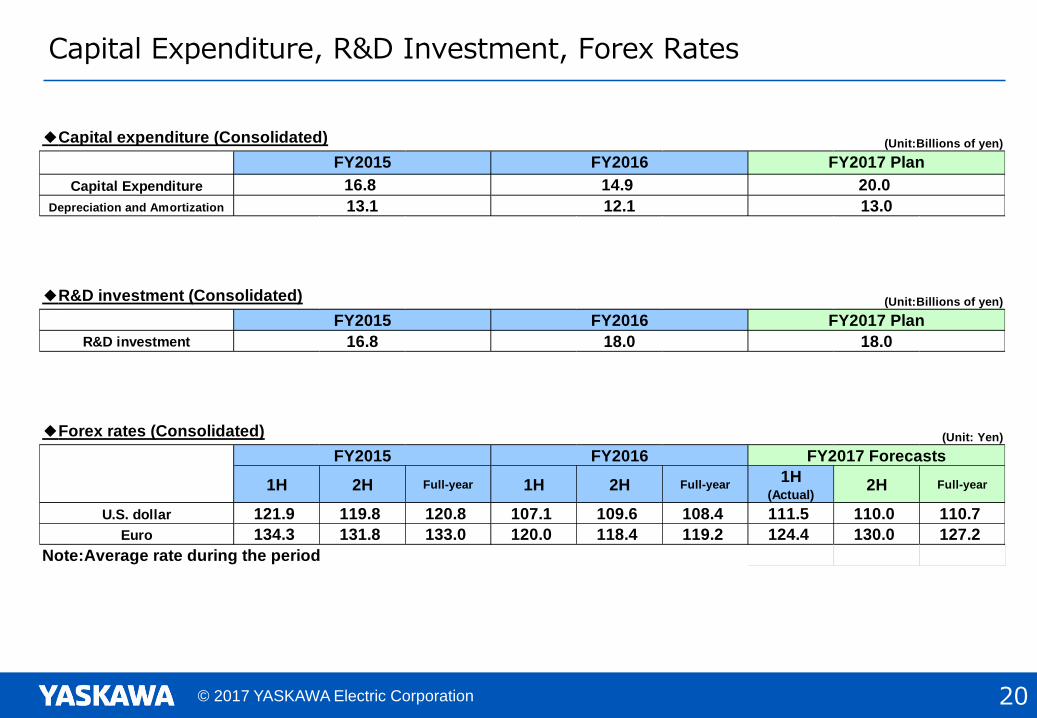
Capital Expenditure, R&D Investment, Forex Rates
◆Capital expenditure (Consolidated) (Unit:Billions of yen)
Capital Expenditure
Depreciation and Amortization
◆R&D investment (Consolidated) (Unit:Billions of yen)
R&D investment
◆Forex rates (Consolidated) (Unit: Yen)
1H 2H Full-year 1H 2H Full-year1H
(Actual)2H Full-year
U.S. dollar 121.9 119.8 120.8 107.1 109.6 108.4 111.5 110.0 110.7
Euro 134.3 131.8 133.0 120.0 118.4 119.2 124.4 130.0 127.2
Note:Average rate during the period
FY2015 FY2016
16.8 18.0
FY2015 FY2016
13.1 12.1
16.8 14.9
FY2016FY2015
18.0
FY2017 Forecasts
13.0
FY2017 Plan
FY2017 Plan
20.0

© 2017 YASKAWA Electric Corporation 21
Shareholders’ equity ratio 51.2% Shareholders’ equity 198.5 billion yen
Interest-bearing debt 36.8billion yen D/E ratio 0.19(Net D/E ratio) 0.04
Inventory 79.9 billion yenTurnover 2.4 months
ROE 10.7%
As of March 20, 2017
Shareholders’ equity ratio 52.2% Shareholders’ equity 220.4 billion yen
Interest-bearing debt 35.9 billion yen D/E ratio 0.16(Net D/E ratio) 0.00
Inventory 93.0 billion yenTurnover 2.4 months
As of September 20, 2017
Financial Indices
(Billions of yen)
Operating CF 15.0 17.7 12.5 4.0 2.5 6.4 24.6 24.0 29.0 32.0 33.8 19.6Investment CF -6.1 -9.9 -10.7 -6.5 -6.7 -11.9 -18.1 -16.9 -27.9 -22.4 -18.9 -8.8
Free CF 8.9 7.8 1.8 -2.4 -4.3 -5.5 6.6 7.0 1.1 9.5 14.8 10.8
Shareholders’
equity ratio
(right scale)
Shareholders’ equity
(left scale)
Interest-bearing debt(left scale)
*Interest-bearingdebt includes convertible bonds and lease obligations. *Inventoryat the end of the period is used for calculating turnover months.*ROE= Net income / Shareholders’ equity (average of beginning and
end of fiscal year)
(Billions of yen)
80.8 100.9 97.1 88.5 93.2 100.1 112.2 134.1
171.4 181.3 198.5
220.4
46.8 33.8 32.9 42.2 41.4
58.6 54.7 55.5 52.4 48.4 36.8 35.9
29.6%
34.9%
39.0%36.6% 35.2% 35.9% 37.1%
39.4%
44.1%
48.5%51.2% 51.2%
0%
10%
20%
30%
40%
50%
60%
0
50
100
150
200
250
300
FY2006 FY2007 FY2008 FY2009 FY2010 FY2011 FY2012 FY2013 FY2014 FY2015 FY2016 FY2017/2Q

© 2017 YASKAWA Electric Corporation 22
Net Sales/Operating Income (FY2006-2018 Plan)
Results
Dash 100Mid-term Business Plans
06
Challenge 100 Realize 100
07 08 1009 11 12 13 14 15 16 1817
Plan
Dash 25
369.0 382.3350.2
224.7
296.8 307.1 310.4
400.2 411.3394.9
466.0450.0
33.6 36.5
20.8
-7.0
12.9 14.8 13.1
25.731.5
36.730.4
57.0
45.0
-200
0
200
400
600
800
1,000
-1,000
0
1,000
2,000
3,000
4,000
5,000
• Projected to achieve targets of mid-term business plan, Dash 25, a year ahead
Operating margin (%)Operating income(Billions of yen)Net sales(Billions of yen)
Mid-term plan target
*
*Announced in April 2016

© 2017 YASKAWA Electric Corporation
DestinationBusiness segment
23
Quarterly Sales Trends (1)
Note2: The figures for FY2015 do not reflect the change in the division of business segments as of 1Q FY2017
0.0
20.0
40.0
60.0
80.0
100.0
120.0
140.0(M) (R) (S) Other
(Billions of yen)
(Billions of yen)
0.0
20.0
40.0
60.0
80.0
100.0
120.0
140.0Japan The Americas Europe
China Oher Asian Countries Other
Note1: (M)=Motion Control (R)=Robotics (S)=System Engineering
© 2017 YASKAWA Electric Corporation 24
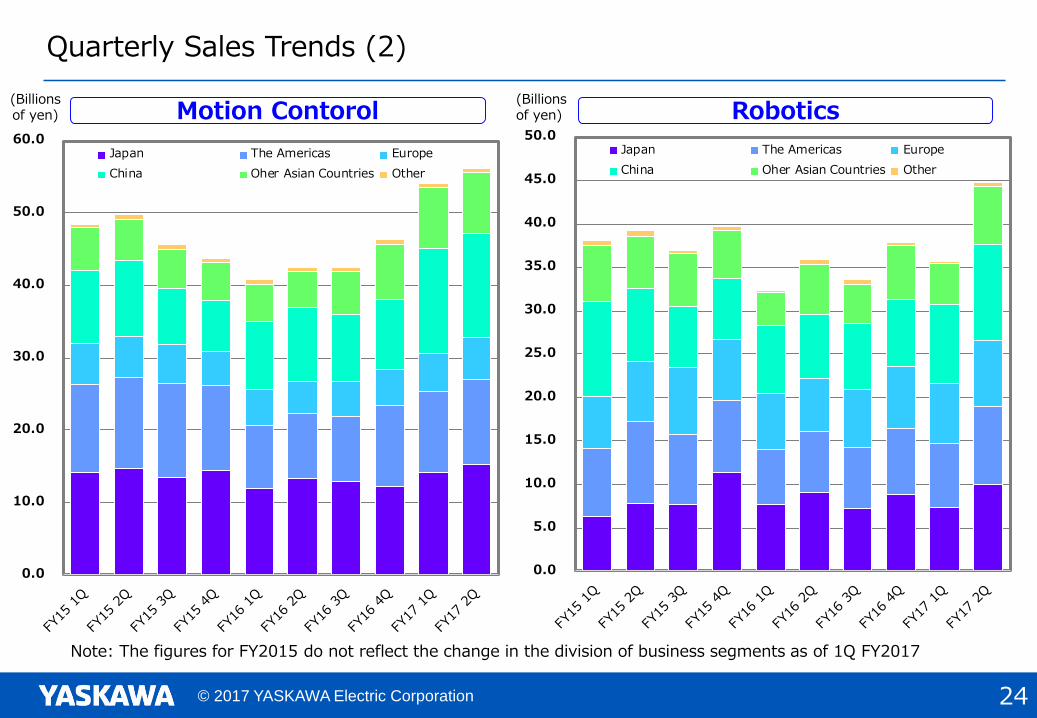
Note: The figures for FY2015 do not reflect the change in the division of business segments as of 1Q FY2017
Quarterly Sales Trends (2)
Motion Contorol Robotics
0.0
10.0
20.0
30.0
40.0
50.0
60.0Japan The Americas Europe
China Oher Asian Countries Other
(Billions of yen)
(Billions of yen)
0.0
5.0
10.0
15.0
20.0
25.0
30.0
35.0
40.0
45.0
50.0Japan The Americas Europe
China Oher Asian Countries Other
© 2017 YASKAWA Electric Corporation
0
20
40
60
80
100
120
140
Other
System Engineering
Robotics
Motion&Control
(Billions of Yen)
25
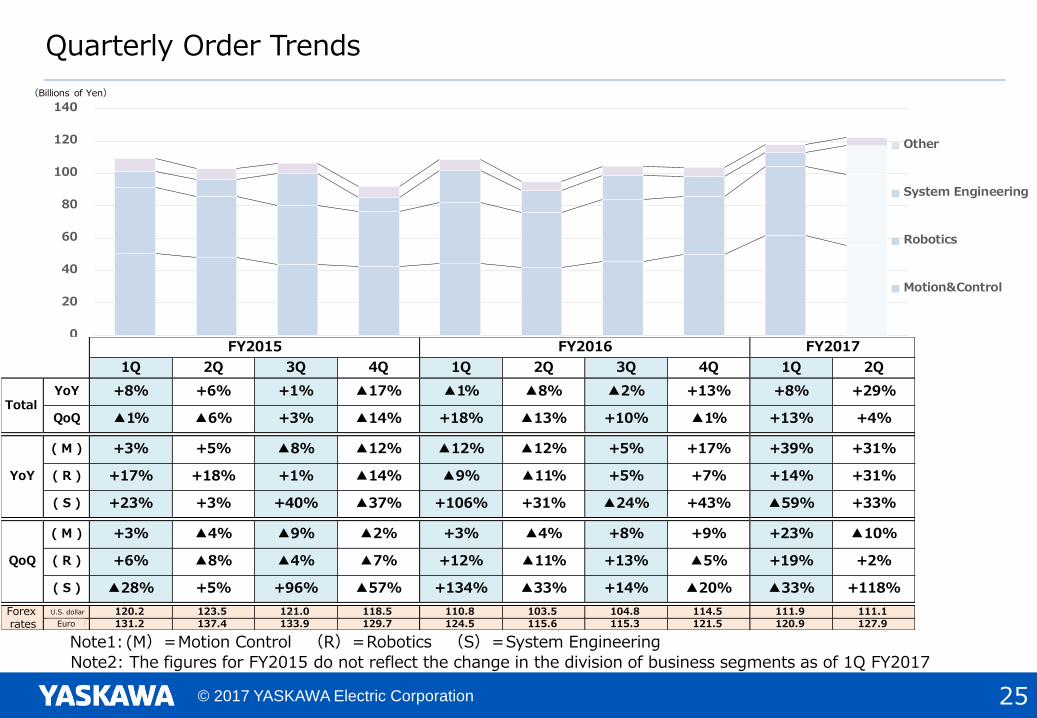
1Q 2Q 3Q 4Q 1Q 2Q 3Q 4Q 1Q 2Q
YoY +8% +6% +1% ▲17% ▲1% ▲8% ▲2% +13% +8% +29%
QoQ ▲1% ▲6% +3% ▲14% +18% ▲13% +10% ▲1% +13% +4%
( M ) +3% +5% ▲8% ▲12% ▲12% ▲12% +5% +17% +39% +31%
YoY ( R ) +17% +18% +1% ▲14% ▲9% ▲11% +5% +7% +14% +31%
( S ) +23% +3% +40% ▲37% +106% +31% ▲24% +43% ▲59% +33%
( M ) +3% ▲4% ▲9% ▲2% +3% ▲4% +8% +9% +23% ▲10%
QoQ ( R ) +6% ▲8% ▲4% ▲7% +12% ▲11% +13% ▲5% +19% +2%
( S ) ▲28% +5% +96% ▲57% +134% ▲33% +14% ▲20% ▲33% +118%
円/ドル 120.2 123.5 121.0 118.5 110.8 103.5 104.8 114.5 111.9 111.1円/ユーロ 131.2 137.4 133.9 129.7 124.5 115.6 115.3 121.5 120.9 127.9
FY2015
全社
FY2016
為替
レート
FY2017
Note1: (M)=Motion Control (R)=Robotics (S)=System Engineering
Note2: The figures for FY2015 do not reflect the change in the division of business segments as of 1Q FY2017
Quarterly Order Trends
Total
Forex rates
U.S. dollar
Euro
© 2017 YASKAWA Electric Corporation 26
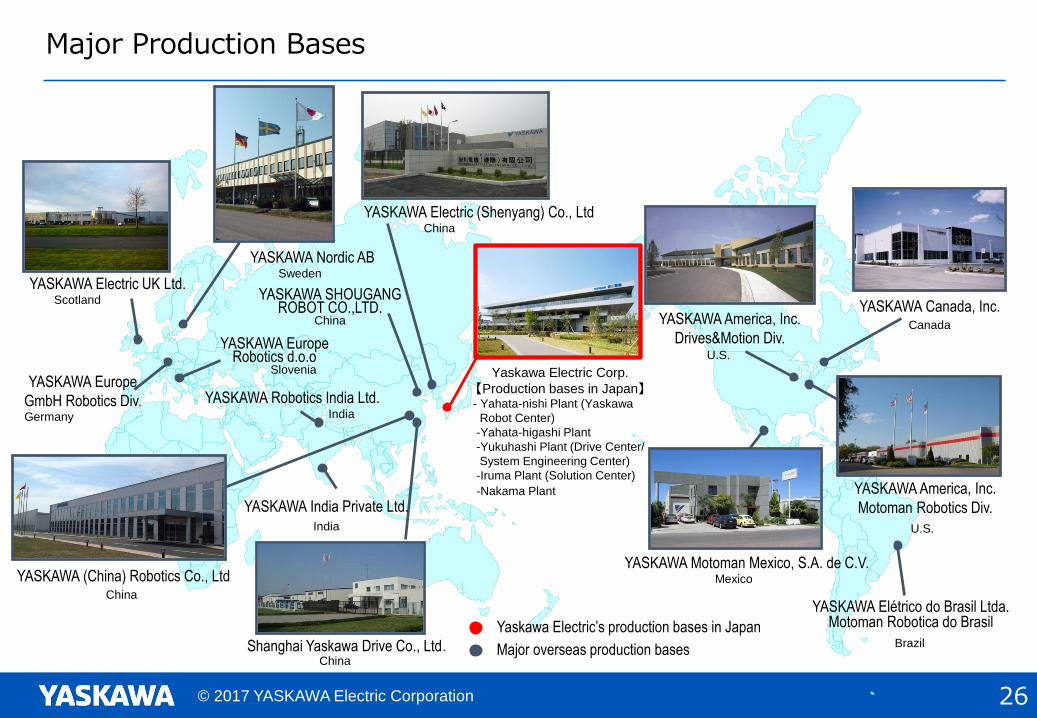
Major Production Bases
YASKAWA America, Inc.
Drives&Motion Div.
YASKAWA Electric UK Ltd.
YASKAWA Nordic AB
Shanghai Yaskawa Drive Co., Ltd.
Yaskawa Electric Corp.
【Production bases in Japan】- Yahata-nishi Plant (Yaskawa
Robot Center)
-Yahata-higashi Plant
-Yukuhashi Plant (Drive Center/
System Engineering Center)
-Iruma Plant (Solution Center)
-Nakama Plant
Major overseas production bases
Yaskawa Electric’s production bases in Japan
Scotland
Germany
Sweden
Canada
U.S.
YASKAWA America, Inc.
Motoman Robotics Div.
Mexico
YASKAWA Europe
GmbH Robotics Div.
Slovenia
China
YASKAWA Electric (Shenyang) Co., LtdChina
YASKAWA SHOUGANG ROBOT CO.,LTD.
China
U.S.
YASKAWA Canada, Inc.
YASKAWA Motoman Mexico, S.A. de C.V.
YASKAWA India Private Ltd.India
India
YASKAWA (China) Robotics Co., LtdChina
YASKAWA Elétrico do Brasil Ltda. Motoman Robotica do Brasil
YASKAWA Robotics India Ltd.
Brazil
YASKAWA EuropeRobotics d.o.o

© 2017 YASKAWA Electric Corporation 27