fy2016 first six months consolidated business results · © 2016 toshiba tec corporation fy2016...
TRANSCRIPT

© 2016 Toshiba Tec Corporation
FY2016 First Six Months Consolidated Business
Results
November 8, 2016

1 © 2016 Toshiba Tec Corporation
1.FY2016 First Six Months Consolidated Business Results
2.FY2016 Forecast

2 © 2016 Toshiba Tec Corporation
Operating Income, Ordinary Income and Net Income turned positive due to the significant improvement of the retail solutions business profitability.
Net Sales: 243.4 billion yen (YoY: △21.3 billion yen)
Decreased due to the impact of yen appreciation of △19.9 Billion yen against the
previous year.
Operating Income: 6.4 billion yen (YoY: +6.3 billion yen)
Increased due to the significant improvement in the retail solutions business.
Ordinary Income: 7.6 billion yen (YoY: +9.2 billion yen)
Improved as the non-operating income increased.
Net Income*: 4.3 billion yen (YoY: +77.9 billion yen) Improved significantly due to the reduced deficit in the overseas retail business as a result of the structural reform. The effective corporate tax rate was adjusted as well.
*Hereinafter “Net Income(△Loss)” refers to Profit (△Loss) attributable to owners of parent.
Key Points of FY2016 First Six Months Business Results

3 © 2016 Toshiba Tec Corporation
FY16/1H FY16/1H FY15/1H Difference
Actual Forecast Actual vs. FY16/1H FC vs. FY15/1H
Net Sales 243.4 253.0 264.8 △9.6 △21.3
Operating Income 6.4 4.0 0.1 +2.4 +6.3
(Rate of sales) (2.6%) (1.6%) (0.0%)
Ordinary Income (△Loss) 7.6 2.0 △1.7 +5.6 +9.2
(Rate of sales) (3.1%) (0.8%) (△0.6%)
Net Income (△Loss) 4.3 △2.0 △73.6 +6.3 +77.9
(Rate of sales) (1.8%) (△0.8%) (△27.8%)
Foreign currency exchange rate
US$ 107.29 110.00* 121.76 △2.71 △14.47
EUR 120.05 120.00* 134.55 +0.05 △14.50
(Billions of Yen)
FY2016 First Six Months Business Results
*Foreign currency exchange rates were revised to US$=110yen, EUR=120yen in the “FY2016 Toshiba Tec Management Policy(Mid-Term Business Plan)” announced on Aug. 30, 2016.

4 © 2016 Toshiba Tec Corporation
0.1
6.4
+ 0 . 5
△0 . 8
+ 6 . 7 △8 . 1
+ 1 . 3
DEP + 5 . 2
+ 1 . 5
(Billions of yen) Gross Profit (Decrease of profit by 7.4)
SG&A (Increase of profit by 13.7)
Operating Income Analysis of FY2016/1H
FY15/1H Operating Income
FY16/1H
Operating
Income Currency
Exchange
Decrease in Net Sales
Others
Currency Exchange
R&D
Personnel Expenses
Others

5 © 2016 Toshiba Tec Corporation
Net Sales 92.4 112.8 △20.4
Operating Income 2.1 6.6 △4.5
(Rate of Sales) (2.3%) (5.8%)
Net Sales 157.1 158.1 △1.0
Operating Income (△Loss) 4.4 △6.5 +10.8
(Rate of Sales) (2.8%) (△4.1%)
Retail Solutions Business
Group
Printing Solutions Business
Group
Net Sales 243.4 264.8 △21.3
Operating Income 6.4 0.1 +6.3
(Rate of Sales) (2.6%) (0.0%)
Consolidated Total
FY2016/1H FY2015/1H Difference
Actual Actual vs. FY2015/1H
(Billions of yen)
FY2016 First Six Months Business Results by Segment

6 © 2016 Toshiba Tec Corporation
Balance Sheet
242.0 204.2
16.9
14.6
22.7
32.8
16/3E 16/9E
Others
Intangible assets
Cash and cash equivalents
70.4 63.0
207.8 187.4
3.4
1.2
16/3E 16/9E
Loans payable
Net assets
Others
281.6
(Billions of yen)
281.6
Assets Liabilities and Net Assets
251.6 251.6
Net assets decreased by 7.4 Billion yen due to the drop in foreign currency translation adjustment. Net cash flow increased.
7 © 2016 Toshiba Tec Corporation
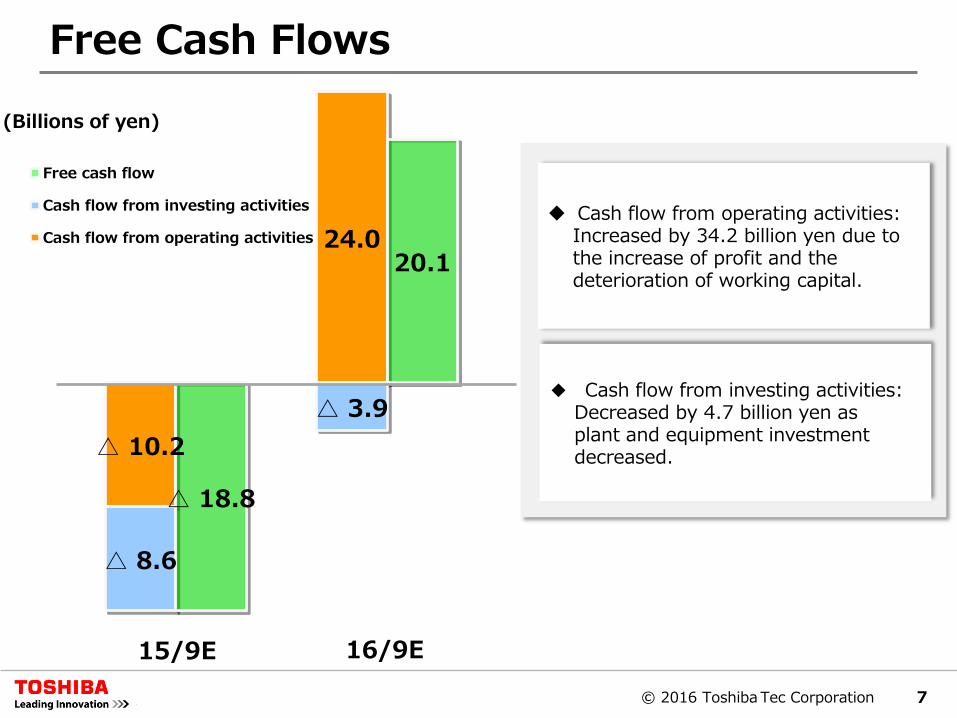
Free Cash Flows
15/9E 16/9E
Cash flow from operating activities: Increased by 34.2 billion yen due to the increase of profit and the deterioration of working capital.
◆ Cash flow from investing activities: Decreased by 4.7 billion yen as plant and equipment investment decreased.
(Billions of yen)
△ 10.2
24.0
△ 8.6
△ 3.9
△ 18.8
20.1
Free cash flow
Cash flow from investing activities
Cash flow from operating activities

8 © 2016 Toshiba Tec Corporation
1.FY2016 First Six Months Consolidated Business Results
2.FY2016 Forecast

9 © 2016 Toshiba Tec Corporation
*1:Foreign currency exchange rates of 16/2H forecasts are US$=100yen, EUR=110yen. *2:Foreign currency exchange rates were revised to US$=110yen, EUR=120yen in the “FY2016 Toshiba Tec Management Policy(Mid-Term Business Plan)” announced on Aug. 30, 2016.
FY2016 Forecast, Overall
FY16 FY16 FY15 Difference Forecast Forecast
(Aug. 5th) Actual vs. FY16
(Aug. 5th) vs. FY15
Net Sales 490.0 520.0 532.8 △30.0 △42.8
Operating Income 14.0 14.0 1.6 ー +12.4
(Rate of sales) (2.9%) (2.7%) (0.3%)
Ordinary Income (△Loss) 13.0 10.0 △2.3 +3.0 +15.3
(Rate of sales) (2.7%) (1.9%) (△0.4%)
Net Income (△Loss) 5.0 0.5 △103.4 +4.5 +108.4
(Rate of sales) (1.0%) (0.1%) (△19.4%)
Foreign currency exchange rate
US$ 104.00*1 110.00*2 120.77 △6.00 △16.77
EUR 115.00*1 120.00*2 132.74 △5.00 △17.74
(Billions of Yen)
10 © 2016 Toshiba Tec Corporation
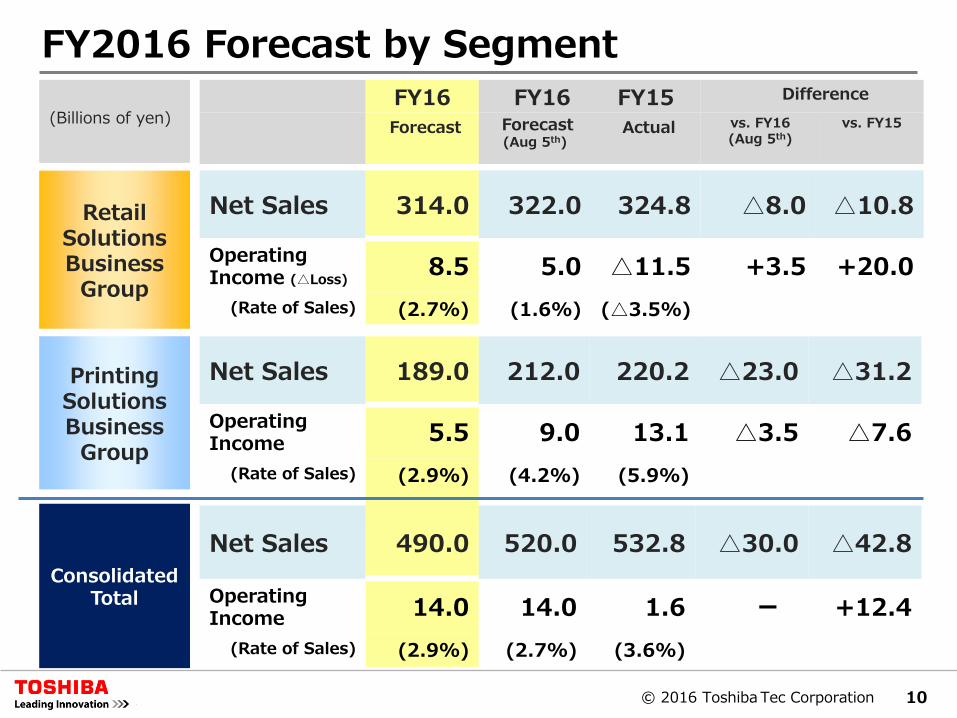
Net Sales 189.0 212.0 220.2 △23.0 △31.2
Operating Income 5.5 9.0 13.1 △3.5 △7.6
(Rate of Sales) (2.9%) (4.2%) (5.9%)
Net Sales 314.0 322.0 324.8 △8.0 △10.8
Operating Income (△Loss)
8.5 5.0 △11.5 +3.5 +20.0
(Rate of Sales) (2.7%) (1.6%) (△3.5%)
Retail Solutions Business
Group
Printing Solutions Business
Group
Net Sales 490.0 520.0 532.8 △30.0 △42.8
Operating Income 14.0 14.0 1.6 ー +12.4
(Rate of Sales) (2.9%) (2.7%) (3.6%)
Consolidated Total
FY16 FY16 FY15 Difference
Forecast
Forecast (Aug 5th)
Actual vs. FY16 (Aug 5th)
vs. FY15
(Billions of yen)
FY2016 Forecast by Segment

11 © 2016 Toshiba Tec Corporation
Forward-looking statements concerning TOSHIBA TEC's future
performance contained in this presentation represent certain
reasonable assumptions based on economic, financial and
competitive data and information currently available. However,
actual results will be affected by the business and competitive
environment and may differ materially from forecasts.

12 © 2016 Toshiba Tec Corporation