fy2015/3 financial review - nippon paper group · ... 2015) 1. business environment 2. financial...
TRANSCRIPT

FY2015/3 Financial Review
Nippon Paper Industries Co., Ltd.
May 26, 2015

FY2015/3 Review
(April 1, 2014 – March 31, 2015)
1. Business environment
2. Financial results
3. FY2016/3 earnings forecast
Contents
2

1. Business environment: Domestic shipment of Japanese paper industry
Domestic shipment of Japanese paper industry (YOY)
85%
90%
95%
100%
105%
110%
115%
Apr '11 Oct Apr '12 Oct Apr '13 Oct Apr '14 Oct
Paper
Paperboard
ref. consumption expenditures in real terms fortwo-or-more-person households
FY 2015/3
Domestic shipments decreased YOY in accordance
with weak personal consumption
3 Source: Japan Paper Association, Ministry of Internal Affairs and Communications

1. Business environment: Domestic shipment, exports and imports
Apr '14 - Mar '15
volume YOY volume YOY volume YOY
Newsprint 3,083 -4.1% 1 -59.7% 50 -9.0%
Printing & business communication paper 7,814 -5.1% 582 3.9% 1,202 -16.4%
Coated paper * 4,480 -5.8% 454 5.5% 556 -24.7%
Uncoated & specialty printing paper 2,014 -5.9% 92 2.4% 149 -11.9%
Business communication paper 1,320 -1.4% 36 -9.3% 498 -6.3%
3,209 -2.1% 229 18.0% 38 -5.3%
Paper total 14,105 -4.2% 812 7.4% 1,290 -15.8%
Container board 8,721 -1.6% 269 44.5% 82 -7.6%
Folding box board and others 2,217 -1.7% 21 -13.9% 261 -4.9%
Paperboard total 10,938 -1.6% 290 37.8% 343 -5.6%
Paper and paperboard total 25,044 -3.1% 1,102 14.0% 1,633 -13.9%
Exports
Other papers (packaging, sanitary
and other miscellaneous uses)
Domestic Shipments Imports
Apr '14 - Mar '15
Paper demand is stagnating.
Paperboard shipment slightly reduced.
4 ※ “Bitoko-shi”paper is included in coated paper. Source: Japan Paper Association
(’000 tonnes)
0.90
0.95
1.00
1.05
1.10
1.15
Apr. '11 Oct. Apr. '12 Oct. Apr. '13 Oct. Apr. '14 Oct. Apr. '15
Printing paper Linerboard Household tissue
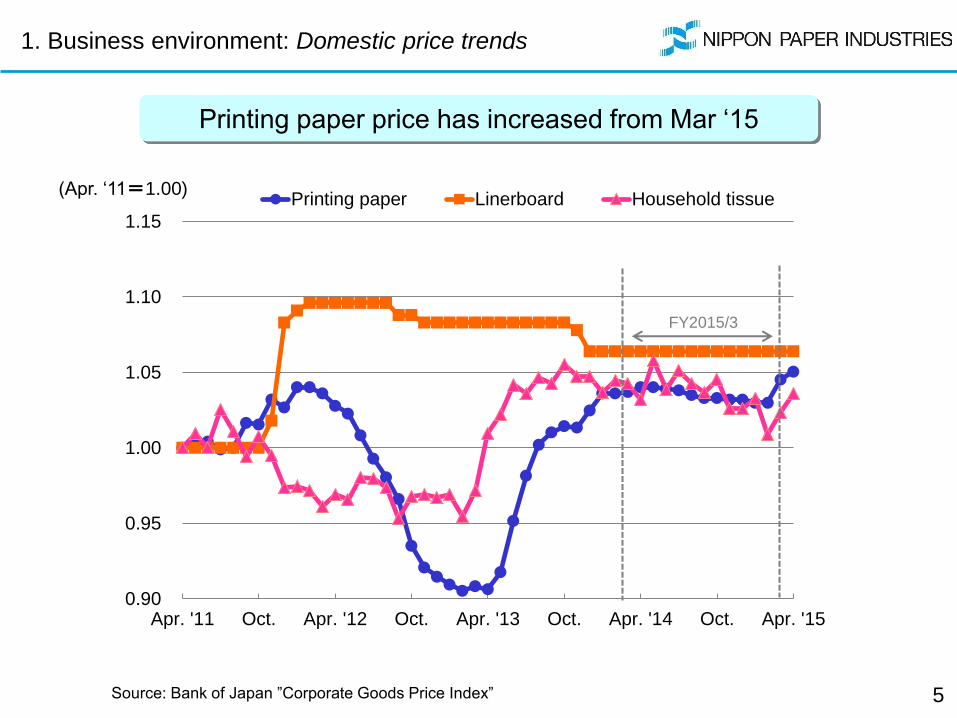
1. Business environment: Domestic price trends
Source: Bank of Japan ”Corporate Goods Price Index”
(Apr. ‘11=1.00)
FY2015/3
Printing paper price has increased from Mar ‘15
5

70
80
90
100
110
120
130
Apr '11 Apr '12 Apr '13 Apr '14 Apr '15
(¥/US$) US$
30.0
50.0
70.0
90.0
110.0
130.0
Apr '11 Apr '12 Apr '13 Apr '14 Apr '15
(US$/BL) (US$/t) Crude Oil Coal
120
140
160
180
200
200
400
600
800
1000
Apr '11 Apr '12 Apr '13 Apr '14 Apr '15
Woodchip (US$/t)
Pulp (US$/t) BHK BSK Woodchip
8
12
16
20
Apr '11 Apr '12 Apr '13 Apr '14 Apr '15
(¥/kg) ONP OCC
1. Business environment: Major input price trends
Wastepaper Pulp & Woodchip
Crude oil (Dubai) & Coal FOREX
In 2H, JPY depreciated against USD
and fuel prices dropped further
6
TBD
Source: Paper Recycling Promotion Center, Pulp&Paper Week, Crude oil= Platts, Coal=Global Coal Index

❏ Sales decreased due to a rush in demand before consumption tax
increase in previous year
❏ Operating income decreased though price increase and cost
reduction eased the raw material price surge impact due to FX
❏ Booked ¥19.4 billion gain on sales of non-current assets as
an extraordinary income
2. Financial results: Highlights
7
<Net sales>
<Operating income>
<Net income>
<Ordinary income>
Variance
(YOY) FY2015/3
Result FY2014/3
Result (¥billion)
23.2
1,052.5
23.7
-28.8
-4.8
0.4
23.2 -5.0
1,081.3
28.5
22.8
28.2

2. Financial results: Segment information
Sales decreased due to a rush in demand before
consumption tax increase in previous year
Pulp and paper 848.1 835.5 -12.6 17.4 15.0 -2.4
Paper related(packaging and chemical products)
93.0 91.0 -2.0 5.0 3.8 -1.3
Wood products and
construction related69.5 59.2 -10.3 2.4 2.1 . -0.3
Other(beverages, logistics, etc.)
70.6 66.7 -3.9 3.6 2.7 -0.9
Total 1,081.3 1,052.5 -28.8 28.5 23.7 -4.8
Operating Income
FY2015/3
Sales
FY2015/3FY2014/3 Variance
(YOY)
Variance
(YOY)
FY2014/3
8
(¥billion)

2. Financial results: Pulp & paper segment
Paper ・ Shipment: -4.6% (Domestic-6.3%, Exports +31.7% (YOY))
->Decreased due to impact of Consumption tax increase and
output reduction for maintaining price level ・ Price increase contributed to better operating income
Paperboard ・ Shipment:+2.5% (Domestic +1.8%, Exports +18.9% YOY))
->Increased in cup stock paper and containerboard for beverage
and foods ・ Price increase contributed to better operating income
Household Tissue ・ Sales volume reduced due to the impact of Consumption tax
increase ・ Price increase contributed to better operating income
Other ・ Electric power sales declined
->Basic (non-temporary) electric power business kept growing, while
temporary sale after the earthquake in 2011 sharply decreased
879.7 817.7 801.3 848.1 835.5
23.2 24.2 13.0 17.4 15.0
FY11/3 FY12/3 FY13/3 FY14/3 FY15/3
Net Sales
Operatingincome
Net sales and operating income
9
(¥ billion)

(’000 tonnes)
2. Financial results: Pulp & paper - sales volume by product
Higher export volume offset the impact of domestic sales decline
Newsprint 1,170 1,107 -5.4%Printing & business communication paper 2,588 2,395 -7.4%
Coated paper 1,420 1,295 -8.8%
Uncoated & specialty printing paper 597 544 -8.9%
Business communication paper 571 557 -2.5%
Packaging paper and others 315 312 -0.9%
Domestic sales (paper) 4,073 3,815 -6.3%
Export (paper) 196 258 31.7%
Paper total 4,268 4,072 -4.6%Container board 1,199 1,221 1.9%Folding boxboard and others 369 375 1.5%
Domestic sales (paperboard) 1,568 1,595 1.8%
Export (paperboard) 75 89 18.9%
Paperboard total 1,643 1,685 2.5%
Grand total (paper and paperboard) 5,911 5,757 -2.6%
FY2014/3 FY2015/3 YOY
10 “Total” means the sum of sales volume of Nippon Paper Industries Co., Ltd., Nippon Paper Papylia Co., Ltd. and Nippon Paper Crecia Co., Ltd.
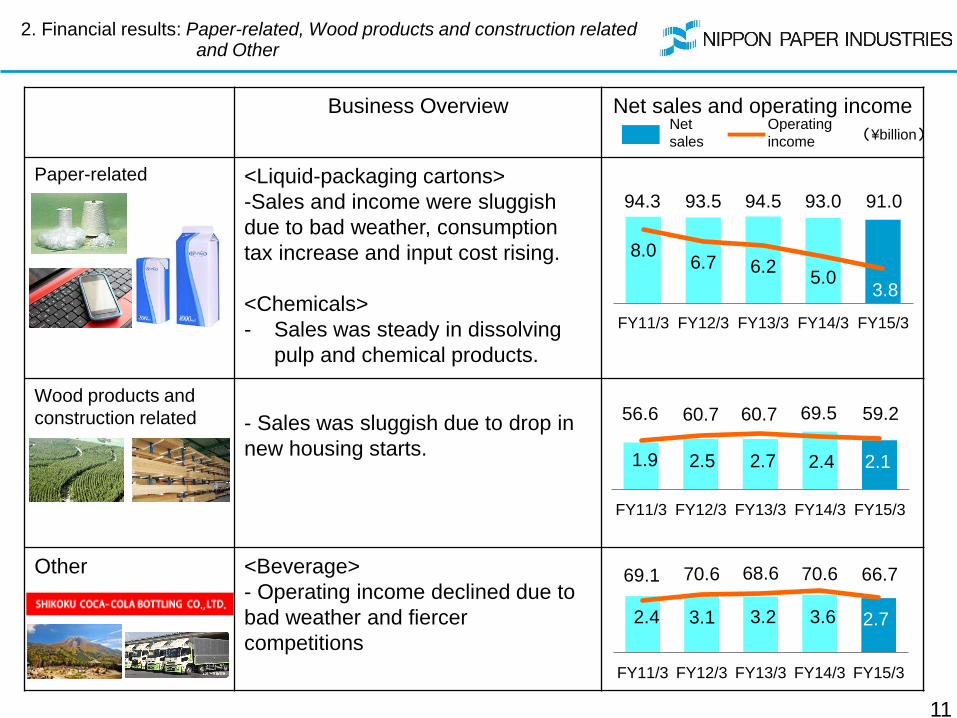
2. Financial results: Paper-related, Wood products and construction related and Other
Business Overview Net sales and operating income
Paper-related <Liquid-packaging cartons>
-Sales and income were sluggish
due to bad weather, consumption
tax increase and input cost rising.
<Chemicals>
- Sales was steady in dissolving
pulp and chemical products.
Wood products and
construction related
- Sales was sluggish due to drop in
new housing starts.
Other <Beverage>
- Operating income declined due to
bad weather and fiercer
competitions
94.3 93.5 94.5 93.0 91.0
8.0 6.7 6.2
5.0 3.8
FY11/3 FY12/3 FY13/3 FY14/3 FY15/3
56.6 60.7 60.7 69.5 59.2
1.9 2.5 2.7 2.4 2.1
FY11/3 FY12/3 FY13/3 FY14/3 FY15/3
69.1 70.6 68.6 70.6 66.7
2.4 3.1 3.2 3.6 2.7
FY11/3 FY12/3 FY13/3 FY14/3 FY15/3
11
Net
sales
Operating
income (¥billion)
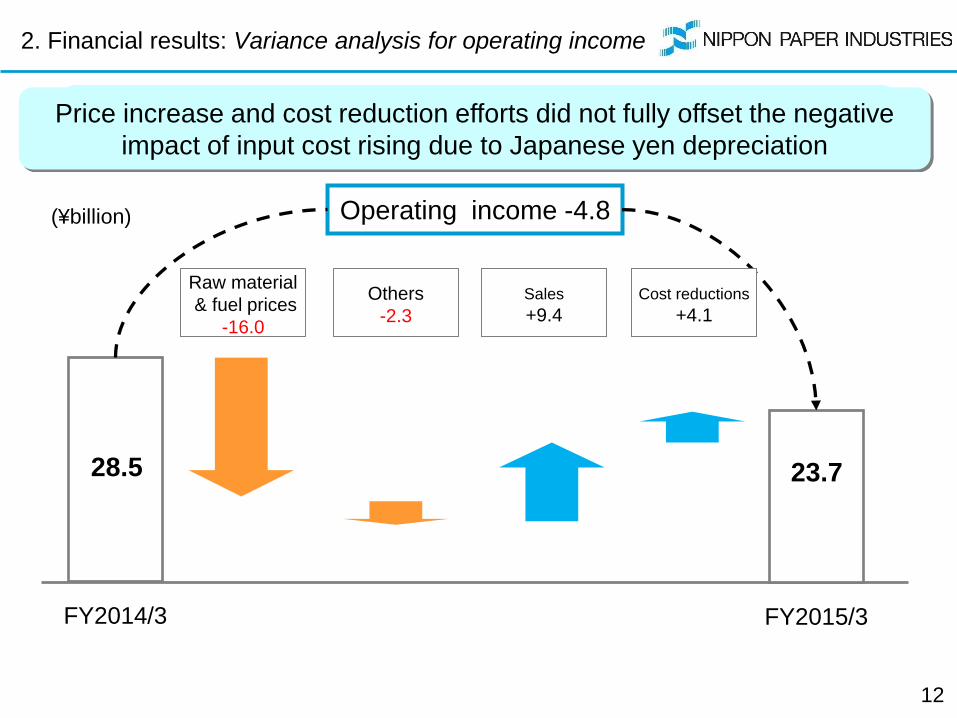
2. Financial results: Variance analysis for operating income
Operating income -4.8
円安原料高を価格修正・原価改善にて軽減
12
FY2014/3 FY2015/3
(¥billion)
Raw material
& fuel prices
-16.0
Others
-2.3
Sales
+9.4
Cost reductions
+4.1
28.5 23.7
Price increase and cost reduction efforts did not fully offset the negative
impact of input cost rising due to Japanese yen depreciation

Mar.31
2015
Compared to
Mar.31 2014
Total assets 1,495.6 14.7
Cash and time deposits 84.1 -13.1
Notes and accounts receivable 193.5 -8.2
Inventories 163.1 11.8
Other current assets 43.9 -11.3
Property, plant, equipment
and intangible f ixed assets734.4 -16.6
Investments and other assets 276.7 52.2
Total liabilities 1,005.9 -48.4 Interest-bearing liabilities
(incl. lease obligations)731.8 -43.8
Other liabilities 274.0 -4.7
Total net assets 489.7 63.2
Shareholder's equity 417.8 19.2
Net interest-bearing debt 647.7 -30.6
Net D/E ratio 1.55 -0.15
Achieved the target level of net interest-bearing debt
Operating activities 81.8
Income before income taxes 36.9
Depreciation 61.4
Change in net working capital -5.5
Other -11.0
Investing activities -42.5
Purchases of property, plant and equipment -48.7
Proceeds from sales of property, plant and equipment 19.3
Other -13.1
Free cash flows 39.3
Financing activities -52.7
Change in net borrowings -46.8
Cash dividends paid -5.8
Other -0.1
Effect of exchange rate changes on cash and cash equivalents 0.2
Cash and cash equivalents at the beginning of period 97.1
Cash and cash equivalents at the end of period 84.0
Item FY2015/3
2. Financial results: Balance sheet & cash flow statement
13
(¥billion)

3. FY2016/3 earnings forecast
14
<Net sales>
<Operating income>
<Net income>
<Ordinary income>
(¥billion)
FY2016/3
forecast
1,060.0
32.0
15.0
30.0
FY2015/3
1,052.5
23.7
23.2
23.2
Variance
(YOY)
7.5
8.3
-8.2
6.8
❏ Plan operating income increase due to price increases & cost reductions
❏ Estimate ¥6.5b sales gain & ¥3.5b FOREX profit due to Lee & Man shares
sale, and ¥-16.4b loss & ¥6.5b reversal of tax expense due to Shikoku Coca-Cola
shares sale
❏ Project annual dividend increase by ¥10 per share (¥50 -> ¥60)

Domestic Sales
- Volume (year-on-year)
Paper : -1.3%
Paperboard : +2.0%
- Price
Paper : Remain at current level
Paperboard : Remain at current level
Raw materials and fuel prices, FOREX
Crude oil : US$60/BL (Dubai)
Coal : US$68/t (Australian black coal)
Wastepaper : Remain at current level
FOREX : ¥120/US$
15
3. FY2016/3 earnings forecast : Assumptions

Newsprint 1,084 1,107 -2.1%
Printing & business communication paper 2,367 2,395 -1.2%
Coated paper 1,287 1,295 -0.6%
Uncoated & specialty printing paper 525 544 -3.4%
Business communication paper 555 557 -0.4%
Packaging paper and others 313 312 0.4%
Domestic sales (paper) 3,764 3,815 -1.3%
Export (paper) 303 258 17.4%
Paper total 4,067 4,072 -0.1%
Container board 1,247 1,221 2.1%
Folding boxboard and others 381 375 1.6%
Domestic sales (paperboard) 1,628 1,595 2.0%
Export (paperboard) 105 89 18.2%
Paperboard total 1,733 1,685 2.9%
Grand total (paper and paperboard) 5,800 5,757 0.7%
FY2015/3
results
FY2016/3
forecast
Change
YOY
Sales increase in paper exports & paperboard offset decline of
domestic paper sales
3. FY2016/3 earnings forecast : Sales volume by product
16
(’000 tonnes)
“Total” means the sum of sales volume of Nippon Paper Industries Co., Ltd., Nippon Paper Papylia Co., Ltd. and Nippon Paper Crecia Co., Ltd.

17
Operating income +8.3
FY/2015/3 FY2016/3
forecast
Price increases and cost reductions push up operating income
(¥billion)
Others
-4.1
Raw material
& fuel prices
-9.1
Sales
+15.8
Cost reductions
+5.7
23.7 32.0
3. FY2016/3 earnings forecast: Variance analysis for operating income

18
FY2011/3 FY2012/3 FY2013/3 FY2014/3 FY2015/3 FY2016/3
forecast
Operating margin on sales 3.2% 3.5% 2.5% 2.6% 2.2% 3.0%
Ordinary margin on sales 2.9% 0.6% 2.3% 2.6% 2.2% 2.8%
Capital expenditure
(¥billion) 46.6 57.2 53.3 47.2 48.5 48.4
Depreciation (¥billion) 78.6 74.4 64.9 63.2 61.4 58.0
Net interest-bearing debt
(¥billion) 727.5 718.9 719.3 678.4 647.7 650.0
Net D/E (times) 1.75 1.94 1.89 1.70 1.55 1.5-1.6
Number of employees 13,834 13,407 13,052 13,107 12,771 11,939
Earnings per share (¥) -208.73 -359.90 92.00 196.67 200.27 129.58
Dividends per share (¥) 60 30 40 40 50 60
4. FY2016/3 earnings forecast : Key figures and indices

Any statements in this presentation document, other
than those of historical fact, are forward-looking
statements about the future performance of Nippon
Paper Industries, Co., Ltd. and its group companies.
These statements are based on management’s
assumptions and beliefs in light of information
currently available, and involve risks and
uncertainties. Actual results may differ materially
from these forecasts.
Nippon Paper Industries Co., Ltd.
Disclaimer