fy2010 fy2011 fy2012 fy2013 - · pdf filefy2010 fy2011 fy2012 fy2013 ... 45% of the top 20...
TRANSCRIPT


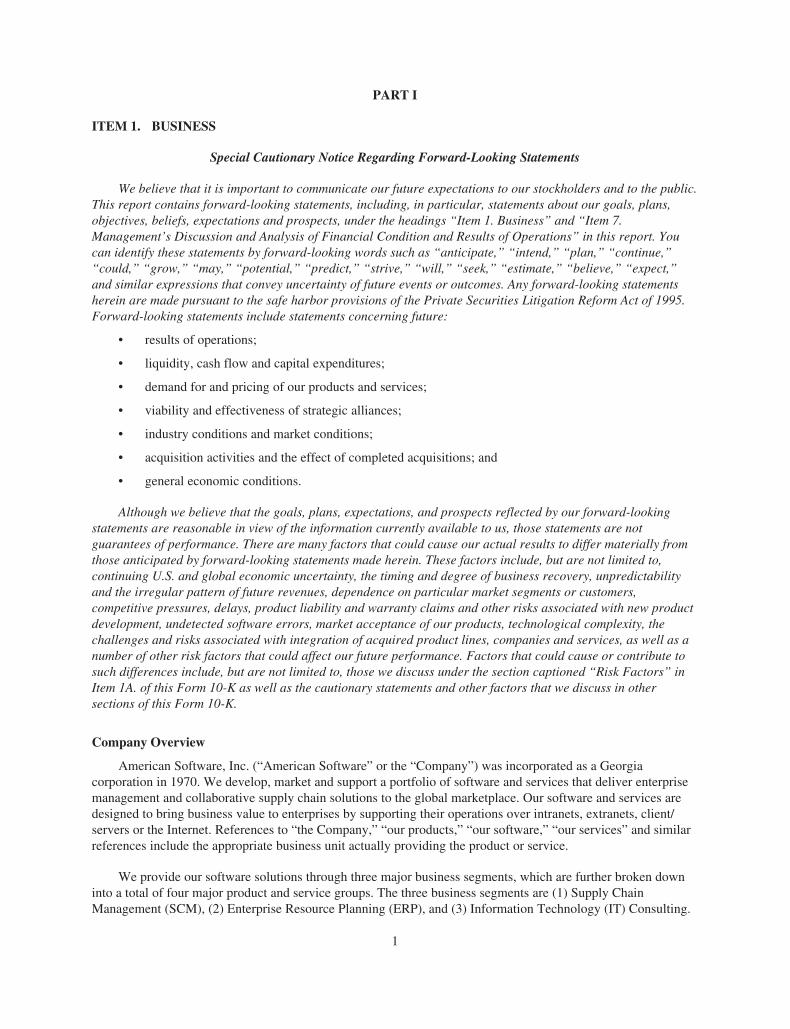
DILUTED EARNINGS PER COMMON SHARE
NET EARNINGS (in thousands)
OPERATING EARNINGS(in thousands)
FY2010 FY2011 FY2012 FY2013TOTAL REVENUES(in thousands)
$75,276$85,589
$102,636 $100,467
$7,299 $9,193
$16,168
$13,784
FY2010 FY2011 FY2012 FY2013
$5,704
$7,364
$11,343 $10,411
FY2010 FY2011 FY2012 FY2013
$0.22$0.28
$0.42$0.38
FY2010 FY2011 FY2012 FY2013
FINANCIAL HIGHLIGHTS

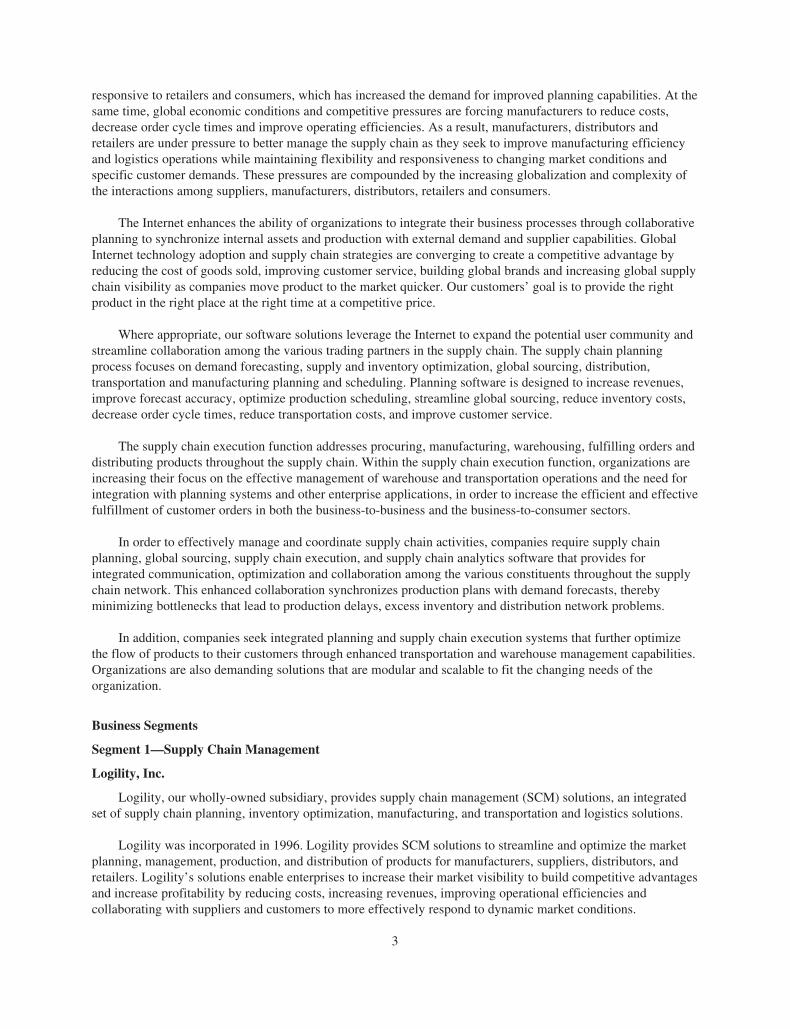
31% of the top 100 Global Consumer Goods Companies
35% of the top 20 Consumer Packaged Goods Companies
50% of the top 10 Housewares and Appliances Companies
45% of the top 20 Footwear and Apparel Companies
25% of the top 20 Beverage Companies
30% of the top 20 Food Companies
Logility supply chain solutions are used by:
J. Michael EdenfieldPresident and Chief Executive Officer
Dear Fellow Shareholders: Fiscal year 2013 marked American Software’s 12th consecutive year of profitability. We added 68 new customers, signed license agreements with customers in 25 countries and deployed our portfolio of supply chain management solutions farther than ever into more markets around the world. The Company completed the year with more than $66.4 million in cash and investments while carrying no debt and distributing approximately $15.5 million in shareholder dividends.
After two strong years of revenue growth, the trend flattened in Fiscal 2013 with a 2 percent dip in total revenue off a very strong Fiscal 2012. This served as a reminder that companies are still treading carefully as they navigate a sometimes complicated economic recovery. Yet, during Fiscal 2013 we continued to grow our recurring maintenance revenues by 5 percent, contributing approximately $35 million. Overall, we see a rising tide of supply chain improvement initiatives at companies of all sizes across a broad range of industries. American Software is well positioned to support these initiatives with a robust portfolio of innovative enterprise application solutions and deep supply chain management expertise.
On May 1, 2013, the Company successfully executed our CEO succession plan. James C. Edenfield became the executive chairman and I assumed the office of president and chief executive officer of American Software. Previously, I served as chief operating officer of American Software and as president and chief executive officer of Logility, Inc., our largest and most profitable operating unit. As CEO, my vision is to continue growing our business by constantly evolving our industry leading planning and optimization solutions, and helping our customers achieve the highest performance and efficiency throughout their global supply chains.
In fact, supply chain technology is at the heart of business growth and provides the foundation for a renewable competitive advantage for our customers. To help companies decrease costs, increase market share and boost customer service, our Logility’s Voyager Solutions™ and Demand Solutions® product suites have continued to add innovative functionality. For example, our unique Logility Voyager Proportional Profile Planning™ module disaggregates high-level forecasts into more accurate granular demand plans, increasing assortment precision and eliminating excess finished goods across multiple industries. Our flexible Cloud Services offerings include software as a service (SaaS), hosted, and managed services deployment alternatives to help customers accelerate and sustain the benefits of their supply chain initiatives. Incorporating social technology into our solutions
helps manufacturers and distributors boost collaboration and decrease cycle times for high-value activities like sales and operations planning (S&OP).
Logility is consistently recognized for delivering innovative software solutions that help companies improve the operation and efficiency of their global supply chains, and this year was no exception. The readers of Consumer Goods Technology voted Logility a top supply chain planning and supply chain execution solution provider for the 13th consecutive year. Logility also received accolades from industry analysts and publications including Aberdeen Group, Gartner, Supply & Demand Chain Executive and Manufacturing Executive.
We have expanded our presence around the world by adding ten new distributors. We now have offices and distributors in more than 56 countries helping supply chain teams extend their geographic reach and exploit new opportunities in emerging markets. With international markets generating 21 percent of Logility’s Fiscal 2013 revenues, expanding our global presence and driving innovation in our solutions has proven to be a winning strategy.
As we learn at every one of our well-attended user conferences, we are privileged to serve the best customers in the supply chain world. For them, we strive to be the partner they can most count on for high-value solutions that bring greater power and insight to their forecasting, sales and operations planning, inventory optimization, production scheduling, supply planning, and transportation management efforts—to name a few.
Our employees around the world continue to be the core strength of American Software. They are known among both customers and competitors for bringing powerful and easy-to-use products to market, seeking best-fit solutions for every company’s supply chain challenges, and offering the finest professional services and technical support in the industry. Our team looks forward to delivering continued strong performance to shareholders in Fiscal Year 2014.
Thank you for your commitment to supply chain excellence.
Sincerely,

UNITED STATESSECURITIES AND EXCHANGE COMMISSION
Washington, D.C. 20549
FORM 10-K(Mark One)È ANNUAL REPORT PURSUANT TO SECTION 13 OR 15(d) OF THE SECURITIES
EXCHANGE ACT OF 1934For the fiscal year ended April 30, 2013
OR
‘ TRANSITION REPORT PURSUANT TO SECTION 13 OR 15(d) OF THE SECURITIESEXCHANGE ACT OF 1934For the transition period from to
Commission File Number 0-12456
AMERICAN SOFTWARE, INC.(Exact name of registrant as specified in its charter)
Georgia 58-1098795(State or other jurisdiction ofincorporation or organization)
(IRS EmployerIdentification No.)
470 East Paces Ferry Road, N.E.Atlanta, Georgia 30305
(Address of principal executive offices) (Zip Code)
Registrant’s telephone number, including area code (404) 261-4381
Securities registered pursuant to Section 12(b) of the Act:
Title of each class Name of each exchange on which registered
None None
Securities registered pursuant to Section 12(g) of the Act:
Class A Common Shares, $.10 Par Value(Title of class)
Indicate by check mark if the registrant is a well-known seasoned issuer, as defined in Rule 405 of the Securities Act. Yes ‘ No ÈIndicate by check mark if the registrant is not required to file reports pursuant to Section 13 or Section 15(d) of the Act. Yes ‘ No ÈIndicate by check mark whether the registrant (1) has filed all reports required to be filed by Section 13 or 15(d) of the Securities
Exchange Act of 1934 during the preceding 12 months (or for such shorter period that the registrant was required to file such reports), and(2) has been subject to such filing requirements for the past 90 days. Yes È No ‘
Indicate by check mark whether the registrant has submitted electronically and posted on its corporate Web site, if any, everyInteractive Data File required to be submitted and posted pursuant to Rule 405 of Regulation S-T during the preceding 12 months (or forsuch shorter period that the registrant was required to submit and post such files). Yes È No ‘
Indicate by check mark if disclosure of delinquent filers pursuant to Item 405 of Regulation S-K is not contained herein, and will notbe contained, to the best of the registrant’s knowledge, in definitive proxy or information statements incorporated by reference in Part III ofthis Form 10-K or any amendment to this Form 10-K. ‘
Indicate by check mark whether the Registrant is a large accelerated filer, an accelerated filer, a non-accelerated filer or a smallerreporting company. See the definitions of “large accelerated filer,” “accelerated filer” and “smaller reporting company” in Rule 12b-2 ofthe Exchange Act.
Large accelerated filer ‘ Accelerated filer ÈNon-accelerated filer ‘ Smaller reporting company ‘Indicate by check mark whether the registrant is a shell company (as defined in Rule 12b-2 of the Exchange Act). Yes ‘ No ÈAt October 31, 2012, the last business day of the registrant’s most recently completed second fiscal quarter, 24,586,379 Class A
Common Shares and 2,587,086 Class B Common Shares of the registrant were outstanding. The aggregate market value (based upon theclosing price of Class A Common Shares as quoted on the NASDAQ National Market System at October 31, 2012) of the Class A sharesheld by non-affiliates on that date was approximately $196.2 million. At July 5, 2013, 24,779,349 Class A Common Shares and 2,587,086Class B Common Shares of the registrant were outstanding.
DOCUMENTS INCORPORATED BY REFERENCE; LOCATION IN FORM 10-K
Portions of the Company’s Proxy Statement for its 2013 Annual Meeting of Stockholders are incorporated by reference into Part III.


American Software Inc.ANNUAL REPORT ON FORM 10-K
For the Fiscal Year Ended April 30, 2013
TABLE OF CONTENTS
Item 1. Business . . . . . . . . . . . . . . . . . . . . . . . . . . . . . . . . . . . . . . . . . . . . . . . . . . . . . . . . . . . . . . . . . . . 1Item 1A. Risk Factors . . . . . . . . . . . . . . . . . . . . . . . . . . . . . . . . . . . . . . . . . . . . . . . . . . . . . . . . . . . . . . . . 26Item 1B. Unresolved Staff Comments . . . . . . . . . . . . . . . . . . . . . . . . . . . . . . . . . . . . . . . . . . . . . . . . . . . . 47Item 2. Properties . . . . . . . . . . . . . . . . . . . . . . . . . . . . . . . . . . . . . . . . . . . . . . . . . . . . . . . . . . . . . . . . . . 47Item 3. Legal Proceedings . . . . . . . . . . . . . . . . . . . . . . . . . . . . . . . . . . . . . . . . . . . . . . . . . . . . . . . . . . . . 47Item 4. Mine Safety Disclosures . . . . . . . . . . . . . . . . . . . . . . . . . . . . . . . . . . . . . . . . . . . . . . . . . . . . . . . 47Item 5. Market for Registrant’s Common Equity, Related Stockholder Matters, and Issuer Purchases
of Equity Securities . . . . . . . . . . . . . . . . . . . . . . . . . . . . . . . . . . . . . . . . . . . . . . . . . . . . . . . . . . . 48Item 6. Selected Consolidated Financial Data . . . . . . . . . . . . . . . . . . . . . . . . . . . . . . . . . . . . . . . . . . . . 51Item 7. Management’s Discussion and Analysis of Financial Condition and Results of Operations . . . 52Item 7A. Quantitative and Qualitative Disclosures about Market Risk . . . . . . . . . . . . . . . . . . . . . . . . . . . 67Item 8. Consolidated Financial Statements and Supplementary Data . . . . . . . . . . . . . . . . . . . . . . . . . . 68Item 9. Changes in and Disagreements with Accountants on Accounting and Financial Disclosure . . 100Item 9A. Controls and Procedures . . . . . . . . . . . . . . . . . . . . . . . . . . . . . . . . . . . . . . . . . . . . . . . . . . . . . . . 100Item 9B. Other Information . . . . . . . . . . . . . . . . . . . . . . . . . . . . . . . . . . . . . . . . . . . . . . . . . . . . . . . . . . . . 100Item 10. Directors, Executive Officers and Corporate Governance . . . . . . . . . . . . . . . . . . . . . . . . . . . . . 101Item 11. Executive Compensation . . . . . . . . . . . . . . . . . . . . . . . . . . . . . . . . . . . . . . . . . . . . . . . . . . . . . . 101Item 12. Security Ownership of Certain Beneficial Owners and Management and Related Stockholder
Matters . . . . . . . . . . . . . . . . . . . . . . . . . . . . . . . . . . . . . . . . . . . . . . . . . . . . . . . . . . . . . . . . . . . . 101Item 13. Certain Relationships and Related Transactions, and Director Independence . . . . . . . . . . . . . . 101Item 14. Principal Accounting Fees and Services . . . . . . . . . . . . . . . . . . . . . . . . . . . . . . . . . . . . . . . . . . . 101Item 15. Exhibits, Financial Statement Schedules . . . . . . . . . . . . . . . . . . . . . . . . . . . . . . . . . . . . . . . . . . 102

PART I
ITEM 1. BUSINESS
Special Cautionary Notice Regarding Forward-Looking Statements
We believe that it is important to communicate our future expectations to our stockholders and to the public.This report contains forward-looking statements, including, in particular, statements about our goals, plans,objectives, beliefs, expectations and prospects, under the headings “Item 1. Business” and “Item 7.Management’s Discussion and Analysis of Financial Condition and Results of Operations” in this report. Youcan identify these statements by forward-looking words such as “anticipate,” “intend,” “plan,” “continue,”“could,” “grow,” “may,” “potential,” “predict,” “strive,” “will,” “seek,” “estimate,” “believe,” “expect,”and similar expressions that convey uncertainty of future events or outcomes. Any forward-looking statementsherein are made pursuant to the safe harbor provisions of the Private Securities Litigation Reform Act of 1995.Forward-looking statements include statements concerning future:
• results of operations;
• liquidity, cash flow and capital expenditures;
• demand for and pricing of our products and services;
• viability and effectiveness of strategic alliances;
• industry conditions and market conditions;
• acquisition activities and the effect of completed acquisitions; and
• general economic conditions.
Although we believe that the goals, plans, expectations, and prospects reflected by our forward-lookingstatements are reasonable in view of the information currently available to us, those statements are notguarantees of performance. There are many factors that could cause our actual results to differ materially fromthose anticipated by forward-looking statements made herein. These factors include, but are not limited to,continuing U.S. and global economic uncertainty, the timing and degree of business recovery, unpredictabilityand the irregular pattern of future revenues, dependence on particular market segments or customers,competitive pressures, delays, product liability and warranty claims and other risks associated with new productdevelopment, undetected software errors, market acceptance of our products, technological complexity, thechallenges and risks associated with integration of acquired product lines, companies and services, as well as anumber of other risk factors that could affect our future performance. Factors that could cause or contribute tosuch differences include, but are not limited to, those we discuss under the section captioned “Risk Factors” inItem 1A. of this Form 10-K as well as the cautionary statements and other factors that we discuss in othersections of this Form 10-K.
Company Overview
American Software, Inc. (“American Software” or the “Company”) was incorporated as a Georgiacorporation in 1970. We develop, market and support a portfolio of software and services that deliver enterprisemanagement and collaborative supply chain solutions to the global marketplace. Our software and services aredesigned to bring business value to enterprises by supporting their operations over intranets, extranets, client/servers or the Internet. References to “the Company,” “our products,” “our software,” “our services” and similarreferences include the appropriate business unit actually providing the product or service.
We provide our software solutions through three major business segments, which are further broken downinto a total of four major product and service groups. The three business segments are (1) Supply ChainManagement (SCM), (2) Enterprise Resource Planning (ERP), and (3) Information Technology (IT) Consulting.
1

The SCM segment consists of Logility, Inc. (“Logility”), which provides collaborative supply chainsolutions to streamline and optimize the forecasting, production, distribution and management of productsbetween trading partners. The ERP segment consists of (1) American Software ERP, which provides purchasingand materials management, customer order processing, financial, e-commerce and traditional manufacturingsolutions, and (2) New Generation Computing (NGC), which provides industry-specific business software toboth retailers and manufacturers in the apparel, footwear, sewn products and furniture industries. The ITConsulting segment consists of The Proven Method, Inc., an IT staffing and consulting services firm. We alsoprovide support for our software products, such as software enhancements, documentation, updates, customereducation, consulting, systems integration services, and maintenance.
We derive revenues primarily from three sources: software licenses, services, and maintenance. Wegenerally determine software license fees based on the number of modules, servers, users and/or sites licensed.Services and other revenues consist primarily of fees from software implementation, training, and consultingservices. We bill primarily under time and materials arrangements and recognize revenues as we performservices. Maintenance agreements typically are for a one- to three-year term, usually commencing at the time ofthe initial product license. We generally bill maintenance fees annually in advance under agreements with termsof one to three years, and then recognize the resulting revenues ratably over the term of the maintenanceagreement. Deferred revenues represent advance payments or billings for software licenses, services andmaintenance billed in advance of the time we recognize the related revenues.
Our cost of revenues for licenses includes amortization of capitalized computer software development costs,salaries and benefits and value-added reseller (VAR) commissions. Costs for maintenance and services revenuesinclude the cost of personnel to conduct implementations, customer support and consulting, and other personnel-related expenses as well as agent commission expenses related to maintenance revenues generated by the indirectchannel.
Our selling expenses generally include the salaries and commissions we pay to our direct salesprofessionals, along with marketing, promotional, travel and associated costs. Our general and administrativeexpenses generally include the salaries and benefits we pay to executive, corporate and support personnel, as wellas office rent, utilities, communications expenses, and various professional fees.
Industry Background
Companies that effectively communicate, collaborate and integrate with their trading partners within theextended enterprise or supply chain can realize significant competitive advantages in the form of lower costs,improved customer service, and increased revenue. Supply chain management refers to the process of managingthe complex network of relationships that organizations maintain with external trading partners to forecastdemand, source, manufacture and deliver goods and services to the end consumer. Supply chain managementinvolves both the activities related to supplying products or services (source, make, move, buy, store, anddeliver) as well as the sales and marketing activities that influence the demand for goods and services, such asnew product introductions, promotions, pricing and forecasting.
In response to increasing global competition, companies are continually seeking new ways to enhance theproductivity of their operations. Computer software applications can be an effective tool for companies to re-engineer and streamline their core business processes. ERP applications help companies reduce employeeheadcount and increase employee utilization through recording, consolidating, and reporting the large quantitiesof transactional data that are generated through daily operations. Core ERP applications include automation offinancial reporting, human resources, and manufacturing functions. Included in the manufacturing function aresupply chain applications that assist companies in managing relationships with external trading partners such ascustomers, suppliers, manufacturers, distributors, and retailers.
Today, several market trends are driving organizations to expand collaboration with trading partners alongthe supply chain. A general shift in market power has forced manufacturers and distributors to become more
2
responsive to retailers and consumers, which has increased the demand for improved planning capabilities. At thesame time, global economic conditions and competitive pressures are forcing manufacturers to reduce costs,decrease order cycle times and improve operating efficiencies. As a result, manufacturers, distributors andretailers are under pressure to better manage the supply chain as they seek to improve manufacturing efficiencyand logistics operations while maintaining flexibility and responsiveness to changing market conditions andspecific customer demands. These pressures are compounded by the increasing globalization and complexity ofthe interactions among suppliers, manufacturers, distributors, retailers and consumers.
The Internet enhances the ability of organizations to integrate their business processes through collaborativeplanning to synchronize internal assets and production with external demand and supplier capabilities. GlobalInternet technology adoption and supply chain strategies are converging to create a competitive advantage byreducing the cost of goods sold, improving customer service, building global brands and increasing global supplychain visibility as companies move product to the market quicker. Our customers’ goal is to provide the rightproduct in the right place at the right time at a competitive price.
Where appropriate, our software solutions leverage the Internet to expand the potential user community andstreamline collaboration among the various trading partners in the supply chain. The supply chain planningprocess focuses on demand forecasting, supply and inventory optimization, global sourcing, distribution,transportation and manufacturing planning and scheduling. Planning software is designed to increase revenues,improve forecast accuracy, optimize production scheduling, streamline global sourcing, reduce inventory costs,decrease order cycle times, reduce transportation costs, and improve customer service.
The supply chain execution function addresses procuring, manufacturing, warehousing, fulfilling orders anddistributing products throughout the supply chain. Within the supply chain execution function, organizations areincreasing their focus on the effective management of warehouse and transportation operations and the need forintegration with planning systems and other enterprise applications, in order to increase the efficient and effectivefulfillment of customer orders in both the business-to-business and the business-to-consumer sectors.
In order to effectively manage and coordinate supply chain activities, companies require supply chainplanning, global sourcing, supply chain execution, and supply chain analytics software that provides forintegrated communication, optimization and collaboration among the various constituents throughout the supplychain network. This enhanced collaboration synchronizes production plans with demand forecasts, therebyminimizing bottlenecks that lead to production delays, excess inventory and distribution network problems.
In addition, companies seek integrated planning and supply chain execution systems that further optimizethe flow of products to their customers through enhanced transportation and warehouse management capabilities.Organizations are also demanding solutions that are modular and scalable to fit the changing needs of theorganization.
Business Segments
Segment 1—Supply Chain Management
Logility, Inc.
Logility, our wholly-owned subsidiary, provides supply chain management (SCM) solutions, an integratedset of supply chain planning, inventory optimization, manufacturing, and transportation and logistics solutions.
Logility was incorporated in 1996. Logility provides SCM solutions to streamline and optimize the marketplanning, management, production, and distribution of products for manufacturers, suppliers, distributors, andretailers. Logility’s solutions enable enterprises to increase their market visibility to build competitive advantagesand increase profitability by reducing costs, increasing revenues, improving operational efficiencies andcollaborating with suppliers and customers to more effectively respond to dynamic market conditions.
3

Additionally, Logility’s solutions streamline and automate the executive sales and operations planning (S&OP)process to create and assess business plans that profitably match supply with demand while synchronizing supplychain operations with strategic corporate goals.
Today, Logility’s customer base is approximately 1,250 companies located in more than 75 countries, whichgives Logility what we believe is the largest active installed base of supply chain planning customers among allapplication software vendors. Logility markets and sells the Demand Solutions® product line to the global smalland midsize enterprise (SME) market through the global VAR distribution network of Demand Management,Inc. (“DMI”). Logility also offers the Logility Voyager Solutions™ suite through both direct and indirect saleschannels to customers with distribution-intensive supply chains, ranging from upper-midsize to Fortune 1000companies.
Logility derives revenues primarily from three sources: software licenses, services, and maintenance.Logility generally determines software license fees based on the number of modules, deployments, users and/orsites licensed. Services and other revenues consist primarily of fees from software implementation, training, andconsulting services associated with the implementation of Logility products. Logility bills for these servicesprimarily under time and materials arrangements and recognizes revenues as it performs services. Maintenanceagreements typically are for a one- to three-year term, commencing at the time of the initial product license.Logility generally bills maintenance fees annually in advance under agreements with terms of one to three years,and then recognizes the resulting revenues ratably over the term of the maintenance agreement. Deferredrevenues represent advance payments or billings for software licenses, services and maintenance billed inadvance of the time Logility recognizes the related revenues.
Logility’s cost of revenues for licenses includes amortization of capitalized computer software developmentcosts, salaries and benefits along with VAR commissions. Costs for maintenance and services revenues includethe cost of personnel to conduct implementations, customer support and consulting, and other personnel-relatedexpenses as well as agent commission expenses related to maintenance revenues generated by the indirect saleschannel.
Logility’s selling expenses generally include the salaries and commissions it pays to its direct salesprofessionals, along with marketing, promotion, travel and associated costs. Logility’s general and administrativeexpenses generally include the salaries and benefits it pays to executive, corporate and support personnel, as wellas office rent, utilities, communications expenses, and various professional fees.
Supply Chain Industry Background
In response to increasing global competition, volatile market demand, shorter product life cycles andreduced lead times, companies are continually seeking new ways to enhance the productivity and profitability oftheir operations. Companies that effectively communicate, collaborate and integrate with their trading partnerswithin the extended enterprise network or supply chain can realize significant competitive advantages in the formof lower costs, greater customer responsiveness, reduced stock-outs, more efficient sourcing, reduced inventorylevels, synchronized supply and demand, improved transportation and logistics operations, and increasedrevenue. Supply chain management refers to the process of managing the complex global network ofrelationships that organizations maintain with external trading partners (customers, suppliers, manufacturers,distributors and retailers) to forecast, source, manufacture, store and deliver goods and services to the endcustomer. Supply chain management involves both the activities related to supplying products or services(source, make, move, buy, store, and deliver) as well as the sales and marketing activities that influence thedemand for goods and services, such as new product introductions, promotions, pricing and forecasting.
Today, several market trends are driving organizations to invest in collaborative supply chain initiatives.Global economic conditions and competitive pressures are forcing companies to reduce costs, decrease ordercycle times and improve operating efficiencies. As a result, manufacturers, distributors and retailers are under
4

pressure to better manage the supply chain as they seek to reduce costs, improve manufacturing efficiency andaccelerate logistics operations while maintaining flexibility and responsiveness to changing market conditionsand specific customer demands. These pressures are compounded by the increasing complexity and globalizationof the interactions among suppliers, manufacturers, distributors, retailers and consumers.
Companies are increasingly deploying supply chain application solutions to address their supply chainplanning, transportation and logistics requirements. Supply chain planning and optimization functions involve theuse of information and analysis to facilitate the on-time delivery of the right products to the correct location atthe right time and at the optimal total cost. The planning process focuses on forecasting and demandmanagement, inventory and supply optimization, distribution, transportation and manufacturing planning andscheduling. Planning software is designed to increase revenues, improve forecast accuracy, optimizemanufacturing scheduling, reduce inventory costs, decrease order cycle times, reduce transportation costs, andimprove customer service.
The supply chain functions also address procuring, warehousing, fulfilling orders, distributing products, anddelivery to customers throughout the global network. Within the supply chain execution function, organizationsare increasing their focus on the effective management of warehouse and transportation operations and the needfor integration with supply chain planning and other enterprise applications, in order to increase the efficient andeffective fulfillment of customer orders in both the business-to-business and the business-to-consumer sectors.
The March 2012 Gartner, Inc. report, Agenda for Supply Chain Functional Excellence, 2012, states, “Tocompete in global markets, organizations must improve the performance of their supply chains, as well as the keyfunctions, processes and technologies that make up an integrated supply chain.”
The December 2012 Gartner outlook for supply chain technologies remains cautiously optimistic.“According to recent Gartner supply chain, cloud and IT budget surveys, a majority of respondents haveexpectations for budget increases during the next 12 to 36 months. Building confidence feeds into Gartner’sforecast outlook for supply chain applications, which are estimated to have grown during 2012, and to secure a9% five-year compound annual growth rate (CAGR) through 2016. Given this year’s survey results, the current(3Q12) forecast assumes annual growth of 7.6%. 2012 SCM software growth was healthy, despite economicdiscontinuities and currency head winds within Europe. 2013 is expected to maintain growth at a slightly higherlevel (9.3%). During our 2012 survey, more respondents indicated higher budgets than 2011’s survey, where75% of respondents expected their budgets for supply chain to increase through 2014.”
“The business drivers perhaps are shifting some purchases for supply chain technologies, but they have alsohighlighted areas in which businesses need to improve. Highlights within the supply chain market include S&OP,transportation and global trade management (GTM), and procurement technologies. These are areas of focus formany businesses today. The trend is expected to continue through 2013, driving a five-year CAGR of 9% in thelarger, worldwide SCM market.”
In order to effectively manage and coordinate supply chain activities, companies require demand planning,supply planning, inventory optimization, global sourcing, transportation and logistics management, andperformance management software that provides for integrated communication, optimization and collaborationamong the various stakeholders throughout the supply chain network. This enhanced collaboration optimizesproduction and distribution plans with demand forecasts, thereby minimizing bottlenecks that lead to productiondelays, excess inventory and distribution network problems.
We believe that traditional ERP systems alone do not provide the visibility, depth, flexibility or optimizationrequired to effectively meet the demands of today’s intensely competitive global environment. Organizations aredemanding supply chain solutions that are both modular and scalable to extend ERP functionality, fit thedynamic needs of their businesses, deploy quickly and deliver rapid time-to-benefit.
5

Additionally, market drivers for more sophisticated supply chain software are finding their waydownstream. Issues that multi-billion dollar companies faced ten years ago are affecting even the low end of theSmall and Midsize Enterprises (SME) market today. Increasingly, Logility’s customers have to manage offshoremanufacturing requirements, which often extend time-to-market, as well as the unique challenges associated withselling to mass merchants. With new, increasingly complex data management needs to monitor global supplylines and deal with the retailers’ demand for accurate forecast and supply visibility, the SME market isoutgrowing spreadsheets for demand planning and turning to automated supply and demand, inventory andreplenishment management software extending the addressable market for Logility’s software offerings.
Logility Products and Services
Leveraging its SCM expertise, Logility has been an innovator in developing and deploying supply chainsolutions, with its first Internet-based collaborative planning software application implemented in 1996. Logilitycontinues to invest and expand its innovative solutions, which support the Collaborative Planning, Forecastingand Replenishment (CPFR®) standards defined by the Voluntary Interindustry Commerce Standards Association(VICS) as well as other collaborative supply chain standards such as vendor managed inventory and sales andoperations planning (S&OP).
Logility’s experience indicates that distribution-intensive industries face considerable competitive pressure,which is intensified by the high cost of inventory and distribution investments, dynamically changing consumerneeds, and variability in overall supply chain performance. These companies need solutions that are capable ofdelivering significant financial benefits by quickly solving problems that arise in sourcing, manufacturing anddistribution operations. Logility solutions are capable of helping these companies collaborate with their tradingpartners to improve customer service and optimize their sourcing, manufacturing, inventory and distributionnetworks.
With approximately 1,250 customers in more than 75 countries, Logility is a leading provider ofcollaborative supply chain solutions that help small, midsize, large and Fortune 1000 companies realizesubstantial bottom-line results. Logility provides two product suites, Logility Voyager Solutions and DemandSolutions, marketed, sold and distributed through both direct and indirect sales channels. The Logility VoyagerSolutions suite features performance monitoring capabilities and provides supply chain visibility; demand,inventory and replenishment planning; S&OP, supply and inventory optimization; manufacturing planning andscheduling; transportation planning and management; and warehouse management. The Demand Solutionsproduct suite provides forecasting, demand planning, replenishment and point-of-sale analysis for maximizingprofits for small to midsize manufacturing, distribution and retail operations.
Logility has licensed one or more modules of Logility Voyager Solutions or Demand Solutions to companiesworldwide, including A.O. Smith, , Augusta Sportswear, Avery Dennison Corporation, Berry PlasticsCorporation, Continental Mills, Electrolux, Everlast Worldwide, Fastenal Company, Ferguson Wholesale, FootLocker, Huhtamaki, Johnstone Supply, Kraft, L’Oreal, New Balance, New Belgium Brewing Company,Procter & Gamble, Remington Products Company, Rexnord, , Shiseido Americas, Sigma Aldrich, Trek Bicycle,Verizon Wireless, Warnaco, WD-40 Company, Westward Pharmaceutical Company and VF Corporation.Logility sells products and services through direct and indirect channels. Logility derived approximately 21% ofits revenues in the fiscal year ended April 30, 2013 from international sales.
Product Features: Logility Voyager Solutions
Logility Voyager Solutions is an integrated software suite that provides advanced SCM includingcollaborative planning, forecasting and replenishment, multi-echelon inventory optimization, optimized supplysourcing, production management, warehouse management, and collaborative logistics capabilities that aredesigned to increase revenues, reduce inventory costs, improve forecast accuracy, decrease order cycle times,manage global sourcing initiatives, optimize production scheduling, streamline logistics operations, reduce
6

transportation costs and improve customer service. Logility Voyager Solutions incorporates performancemanagement analytics to drive decision support for critical processes such as demand management, supply andinventory optimization, manufacturing planning and scheduling, transportation planning and management andS&OP.
The Logility Voyager Solutions software suite is modular and scalable to meet the requirements of globalorganizations involving tens of thousands of products with complex manufacturing or distribution networks. Inaddition, the Logility Voyager Solutions suite interfaces with a broad range of existing enterprise applicationsdeployed on a variety of technical platforms.
Logility’s customers can implement these modules individually, in combinations or as a comprehensivesolution suite. The following summarizes key features of the Logility Voyager Solutions product suite:
LOGILITY VOYAGER SOLUTIONS FOR COLLABORATIVE SUPPLY CHAIN MANAGEMENT
These applications allow companies to plan, manage, optimize and measure their supply chain operationsand strategic trading partner relationships for direct material procurement, production, logistics and customerorder fulfillment. Logility Voyager Solutions provides a performance-based architecture that allows companies tomanage supply chain processes on an exception basis. Companies can proactively monitor, alert, measure andresolve critical supply chain events both within their own companies and throughout the extended value chain.
SUPPLY CHAIN COLLABORATION
Logility Voyager Solutions accelerates S&OP, as well as strategic trading partner collaboration. LogilityVoyager Solutions allows companies to accelerate and synchronize demand plans, sales input, direct materialprocurement, sourcing, fulfillment and financial goals to increase profitability and improve service. LogilityVoyager Solutions enables companies to streamline and accelerate the entire S&OP process. Companies canmore easily track key performance indicators, measure and compare multiple plan performance, optimize salesplans and automate data gathering.
Voyager Collaborate™ enables companies to communicate efficiently across their organizations and sharereal-time supply chain information with external trading partners. With Voyager Collaborate, suppliers,manufacturers, distributors and retailers can use the power of collaborative business processes such as S&OP andbuilt-in standards such as CPFR® to advance enterprise-wide collaboration enabled via the Internet.
DEMAND CHAIN OPTIMIZATION
Logility Voyager Solutions provides the visibility to significantly improve forecasting accuracy by creatingcomprehensive overviews of market demand, new product introductions, product phase-outs, short life cycleproducts, promotions and inventory policies. As a result, enterprises can build plans that are more closely attunedto the market.
Voyager Demand Planning™ helps reconcile differences between high-level business planning and detailedproduct forecasting. Aligning inventory with customer demand, this solution makes it easier to boost servicelevels, shorten cycle times and reduce inventory obsolescence.
Voyager Life Cycle Planning™ provides control to model each phase in a product’s sunrise-to-sunsetlifecycle—including introduction, maturity, replacement, substitution and retirement. Using attribute-basedmodeling, Logility can improve the accuracy of new product introductions, short life cycle and phase-outs, whichresult in reduced stock-outs and lower obsolescence costs.
Voyager Event Planning integrates marketing strategies with forecasting, distribution and logistics planningto calculate the impact of promotional plans and demand shaping strategies such as price discounts, coupons,advertising, special packaging and product placement.
7

INVENTORY OPTIMIZATION
Logility Voyager Solutions enables enterprises to set optimal inventory targets at each node of a multi-echelon manufacturing or distribution network to match strategic inventory goals and service levels inaccordance with your business plan.
Voyager Inventory Optimization™ optimizes strategic and tactical inventory investments across multi-echelon manufacturing and distribution networks to meet business and service level objectives for complexsupply chains with multiple stages of inventory.
Logility Voyager Inventory Planning™ allows enterprises to effectively measure the tradeoff of finishedgoods inventory investments and desired customer service levels. This solution dynamically sets time-phasedinventory targets based on specific safety stock and order quantity rules.
SUPPLY CHAIN OPTIMIZATION
Logility Voyager Solutions optimizes material, inventory, production and distribution assets bysynchronizing supply and demand. Optimized supply plans are generated based on manufacturing, storage, andtransportation constraints as well as various sourcing, production and distribution options.
Voyager Supply Planning™ optimizes complex sourcing and production decisions to balance supply,manufacturing and distribution constraints based on corporate goals for maximizing profit or minimizing costs.
Voyager Replenishment Planning™ provides visibility of future customer demand, corresponding productand material requirements, and the actions needed to satisfy those demands.
Voyager Manufacturing Planning and Scheduling™ creates optimized constraint-based manufacturingschedules and compares multiple schedule scenarios to determine the optimal trade-off between manufacturingefficiencies, inventory investments and greenhouse gas emissions, providing lower costs and increased productavailability.
TRANSPORTATION AND LOGISTICS OPTIMIZATION
Logility Voyager Solutions provides industry-leading capabilities for optimizing both warehouse andtransportation operations. These solutions systematically balance logistics strategies, customer service policies,carrier effectiveness, and inventory management to boost perfect orders and spur improvements that favorablyimpact profitability.
Voyager WarehousePRO® provides shipping and inventory accuracy by optimizing the flow of materialsand information through distribution centers. WarehousePRO helps cut operating costs and improve productivity,increase order fill rates, optimize space utilization and improve customer service. This solution is highly flexibleand quickly adapts to changing business requirements.
Voyager Transportation Planning and Management™ provides a performance-driven, multi-modal solutionfor dramatic savings of time, effort and money. It enables automated shipment planning, shipment execution andfreight accounting. User workflows, driven by exceptions, increase visibility and accelerate more proactivecommunications among trading partners. The optimization engine evaluates logical alternatives for grouping andshipping orders considering business rules, consolidation parameters, carriers, rates, and date/time requirements.
Product Features: Demand Solutions
Demand Solutions’ proven, sophisticated supply chain software provides a smooth transition fromspreadsheet management to robust reporting and tracking. It is simple to install and easy to use.
8

Demand Solutions offers three separate product platforms: DS1, DS-SaaS and DSX. The DS1 suitecontinues to build on the company’s 27-year heritage supporting the global SME market. DSX was introduced inFebruary 2010 and combines this history of supply chain experience with the latest technology to create a highlyflexible supply chain planning solution. Built on a flexible architecture with configurability, performance andsecurity in mind, DSX is the culmination of more than two decades of customer-driven supply chainfunctionality. Both suites offer the same features which allow customers a growth path as their needs change.
While the DSX functionality is the same as DS1, the DSX platform was architected to exploit and applynew technologies to provide best-in-class supply chain efficiencies. Demand Solutions launched DS-SaaS inJanuary and supports both Software-as-a-Service and Infrastructure-as-a-Service. We are supporting both On-Demand Self Service and Broad Network Access. With our Web Services integration, our customers can utilizethe Demand Solutions cloud offering (DS-SaaS) in conjunction with their system of record regardless of whetherit is hosted, SaaS or On-Premise. All product platforms also incorporate social supply chain technology thatenables supply chain partners around the world to collaborate in real time using intuitive, “always-on” socialmedia tools.
The Demand Solutions application suite makes it easier to predict future demand and make informeddecisions to optimize inventory turns, customer service levels and profitability. Demand Solutions is a completetime-phased, multi-tiered planning and replenishment system and a proven platform for vendor managedinventory. Demand Solutions helps manufacturers, wholesalers and distributors exchange inventory informationin real time, proactively manage demand rather than operate in reactive mode, and increase profitability.
Demand Solutions Forecast Management provides a powerful yet easy-to-use demand planning solutionthat fits virtually any industry and deploys quickly. The system offers significant flexibility and allows the user toselect from 26 algorithms the forecasting formula that best addresses each item’s demand pattern to develop anaccurate forecast of future demand.
Demand Solutions Requirements Planning incorporates collaborative planning capabilities to streamlinesupply activities from the production line through delivery. With instant analysis of the projected demand forunlimited items against current inventory, Demand Solutions Requirements Planning recommends the idealinventory level for each shipping destination, providing valuable visibility up and down the supply chain.
Demand Solutions Collaboration offers a certified CPFR compliant collaborative planning solution thatstreamlines communications between a company and its customers and suppliers by letting them exchangeinformation in real time through social media tools. This solution minimizes the barriers to entry for smallertrading partners, who need only a web browser, and extends the value available through the entire DemandSolutions product line. Collaboration results in greater demand visibility and closer synchronization ofproduction and inventory investments.
Demand Solutions Sales & Operations Planning automates and continually analyzes the annual businessplanning process, while also giving all participants the social media tools to continue collaborating in betweenplanning meetings. There are two annual business plans available for each of the sections of data (bookings,sales, production, inventory, backlog and shipments): the Annual Plan and the Flexible Plan. Demand Solutionswas one of the first S&OP tools on the market and the company has more than 17 years of S&OP implementationexperience.
Demand Solutions Advanced Planning and Scheduling is a powerful and easy-to-use production schedulingsolution that supports the process and discrete enterprise environment, and quickly produces accurate schedules,taking into account machines, personnel, tooling and inventory constraints. The Demand Solutions AdvancedPlanning and Scheduling software enables manufacturers to balance material, capacity and shop floor schedulessimultaneously to meet customer demand “on-time” at the lowest costs.
9

Demand Solutions Retail Planning enables manufacturers, distributors and retailers to collaborativelyproduce, ship and replenish product based on point-of-sale (POS) data. Highly accurate and easy to use, DemandSolutions Retail Planning can track thousands of SKUs at the retail store level, resulting in optimized store-levelreplenishment, reduced out-of-stocks, greater inventory turns, elevated customer service levels and increasedprofits. Demand Solutions Retail Planning is designed around the philosophy of continuous replenishment,enabling actual demand to be consolidated from each POS location and routed to suppliers. Demand SolutionsRetail Planning leverages detailed analysis and strategic assortment planning for a store or group of stores. Theresult is a collaborative, highly responsive value chain from manufacturer or distributor to retail.
Segment 2—Enterprise Resource Planning
American Software ERP
Our enterprise solutions are comprehensive global solutions that link critical functions throughout anenterprise. All of our enterprise solutions support e-business functions.
The e-Intelliprise solution is a web-based ERP system that a customer can run over the Internet, intranet orextranet utilizing the IBM iSeries servers. This allows functions within the ERP system to be easily deployedover the Internet using a dynamic role-based web page capability. Users no longer require separateimplementations to achieve differing e-business views over the Internet. This solution supports e-businesses andtraditional businesses with full front-to-back office integration, which is critical to successful fulfillment andseamless processing and reporting throughout the enterprise. The e-Intelliprise solution is a global system,capable of operating in multiple languages and logistical organizations. We build this system around a flexibleenterprise architecture that enables centralized management of enterprise wide processes while allowingdelegation of other business process decisions to other levels of the organization.
Our e-applications are solutions for conducting business on the Internet that can web-enable specificbusiness functions through integration with existing ERP or legacy systems. Currently, e-applications areavailable for the following applications: e-procurement, e-store, e-expenses, e-forms, e-payables, e-receivables,Purchase Order Tracking and Vendor Collaboration, Requisition Tracking, Shipment Tracking, e-processmanagement and e-connect, a seamless, XML-enabled data exchange. We believe that these products represent acost-effective solution for customers with an e-business requirement.
We also market a tool to enable our customers to enter inventory and production transactions using barcodedata collection devices. This product is known as RF Direct Connect, and ensures accurate entry of suchinformation as shipping, transfer, inventory movement, receiving, and production data.
We have integrated a document management solution to enable the capture, storage and retrieval ofdocuments from multiple sources using preset business rules. This product is known as AsIrecall, and thesolution provides an integrated method of document capture and retrieval to aid in solving business issues,increasing operational efficiency, improving customer service and enabling the reduction of administrative costs.
Our product line consists of software and services that operate on three strategic computer platforms:(1) IBM System z Mainframe or compatible, (2) IBM System i (AS/400), and (3) Intel-based servers and clientsthat operate Windows 2000, 2003, XP and Vista. We have written our products in various standard programminglanguages used for business application software, including ANSI COBOL, Micro Focus COBOL, C, C++,Visual Basic, JAVA, JAVA2 and other programming languages. Many have both on-line and batch capabilities.
We have web-enabled our legacy System z and System i applications using Host Access TransformationServer (an IBM WebSphere application). This product enables our existing System z and System i customers toaccess their back office systems from any Windows-based computer with Internet access using only a webbrowser. The graphical user interface reduces the learning curve for new users and rejuvenates the look and feelof the systems. We market this product under the name Host-Access.
10

The following is a summary of our main ERP software solutions outside of our New Generation Computing,Inc. subsidiary:
Manufacturing Modules
Companies may use e-Intelliprise with traditional material requirements planning (MRP) II manufacturingand/or Flow Manufacturing modules. The modules listed below are the solution components within traditionalmanufacturing:
• Master Scheduling
• Material Requirements Planning
• Bill of Materials
• Capacity Planning
• Production Order Status
• Route and Work Center Maintenance
• Shop Floor Control
Logistics Modules
Our logistics solution consists of an integrated system of modules that provide information about the statusof purchasing activities, customer orders, inventory position and internal inventory requisition requirements.These modules perform primarily the following functions:
Inventory Asset Management
• Inventory Asset Control
• Lot Control
• Receipt and Shipment Management
• Serialized Inventory Processing
• Replenishment Processing
• Requisition Management
• Inspection
Procurement
• e-Procurement
• Traditional Purchasing
• Requisition Processing
• Blanket Purchasing
• Purchase Order and Purchase Requisition Approval Routing
Customer Order Management
• e-Store
• Order Management
• Pricing and Promotions Management
11
• Shipping Management
• Billing Management
• Credit Control Processing
• Customer Management
Financial Modules
Our comprehensive financial solutions provide functions such as financial reporting, budgeting, assetmanagement, cash management, credit management and receivables management. These systems assist inresolving customers’ specific financial control issues faster and more effectively. We designed the e-Intelliprisefinancial module for global companies in order to allow the use and reporting of multiple currencies, includingthe European Monetary Unit. The specific applications available are:
General Ledger
• Chart of Accounts Processing
• Budgeting
• Journal Entry Processing
Accounts Payable
• e-Payables
• Voucher Entry Processing
• Payment Processing
Treasury
• Bank Reconciliation
• Cash Management
• Netting and Write-Offs
Accounts Receivable
• e-Receivables
• Collections Management
• Credit Management
• Cash Receipts Management
• Financial Notices and Dunning Management
• Activity Manager
Key benefits of enterprise solutions include the following:
Single-Source Solution Provider for the Internet Age. Our comprehensive e-business solution suite supportsthe e-business requirements of most enterprises throughout their adoption of Internet technology. e-Intelliprise isa comprehensive solution to support the operations of enterprises and provide advanced decision support tools.
12

Front-to-Back Office Integration. e-Intelliprise provides complete integration of e-business transactions tothe entire ERP system, which is critical to the success of an enterprise. This supports comprehensive andconsistent flow of information throughout the enterprise and supply chain. Fulfillment issues that have beenexperienced by some “e-tailers” can be resolved through front-to-back office integration. e-Intelliprise is a singlesolution for support of traditional and e-business activities.
Rules-Based Architecture. e-Intelliprise is very flexible due to its rules-based architecture. This allows theERP data to be presented based upon the profile of the user.
Deployable over the Internet, Intranet and Extranet. Companies can deploy e-Intelliprise over multiplechannels without a separate implementation. e-Intelliprise allows users to create multiple secure role-based viewsof the system. We believe this system flexibility provides greater business value by extending the informationwithin the ERP securely across to employees, customers and trading partners, as needed.
Full Global Capabilities. e-Intelliprise provides full global support of the entire enterprise with multiplelanguages, currencies and books. This allows users to view information in their native language and currency.
Modular Solution. Companies may purchase one or more modules, which they can integrate with otherenterprise software. They may also purchase an integrated product suite to handle increased requirements forenterprise management, processing and transaction volume.
Extensive Functionality. Our enterprise solutions combine traditional and e-business functionality into acomprehensive yet flexible system. e-Intelliprise offers full operational and decision support functionality forglobal enterprises.
Rapid Deployment. Our products utilize a modular design and a flexible rules-based architecture, therebystreamlining implementation and reducing project time and expenses. We have announced a 120-dayimplementation program that is appropriate for many customers.
e-Applications
e-Applications streamline business processes and create competitive advantages that help businessesleverage the full value of their existing ERP and legacy systems. Our e-applications provide added value byextending the reach of the ERP to trading partners, establishing the groundwork for collaborative trading.
e-Procurement. This self-service online procurement solution reduces the time, cost and effort associatedwith “buy side” activities. This e-application can also help an enterprise become more efficient and productive bystreamlining the procurement process and eliminating purchasing bottlenecks. This solution not only eliminatespurchasing delays but it positions enterprises to respond faster to change and to capitalize on e-businessopportunities.
e-Store. This e-business storefront solution offers a cost-effective way to expand an enterprise’s market byproviding around-the-clock access to web-based ordering. e-Store acquires and retains customers’, employees’and distributors’ access to catalog information, pricing, product availability and order status. The solution cangive users authority to create or change customer orders, or may be restricted to inquiries.
e-Expenses. This paperless workflow solution enables employees to submit expense reports via the Internet,document receipts via fax and merge receipts and electronic documents. By giving employees access to expensestatus at all stages of the processing cycle (routing, approval and payment) and by supplying companymanagement with a system wide look into expense behavior, the e-Expenses solution offers a new level ofcontrol over and accountability for the cost of the function.
13

e-Forms. e-Forms provides the ability to route specific forms, such as purchase requisitions, purchaseorders, invoices, and acknowledgments via e-mail or fax. We believe that e-Forms offers an effective, easy-to-use communication channel to external trading partners. e-Forms provides a secure, self-service link betweennon-host users and purchasing, requisitioning, accounts payable, accounts receivable, customer order processingand manufacturing systems. Using e-mail, fax and XML/FTP gateways, this solution’s workflow engine routesdocuments from host applications. The review, approval and update loop uses HTML formatting and receivesinstructions interactively.
e-Payables. This module streamlines administrative processes regarding purchases online without usingpurchase orders, enabling users to cost-effectively transact business from any location at any time. Using theInternet or internal intranets, e-Payables provides a secure interface into an accounts payable system.
e-Receivables. This solution is designed to supply account information online to an enterprise’s customers.e-Receivables can help improve cash flow, reduce the cost of financing sales and, by automating routine taskssuch as customer queries, enable strategic focus on profit creation and reduce time demands on customer servicerepresentatives.
Purchase Order Tracking and Vendor Collaboration. Companies that source globally may experienceproblems communicating with distant suppliers. This module combines some of the features of e-Procurementand e-Forms with the ability to negotiate delivery schedules. The system allows buyers to electronically sendpurchase orders to suppliers, receive acknowledgments into a secure web site, and communicate and negotiatedelivery schedules via a secure web site. It uses e-mail alerts extensively to notify buyers and suppliers ofchanges to requirements and schedules.
Requisition Tracking. This solution is designed to reduce sourcing cycle time, improve control andcompliance with approvals and lower transaction costs with labor and hard copy savings. It streamlines therequisitioning process easily and cost effectively, providing better control and management of the process. Itprovides for full electronic approval of requisitions, consolidation of vendor orders to meet minimum orderrequirements and get volume discounts, tracking of in-process requisitions and full history of approval process.
Shipment Tracking. This solution is a critical element of the global sourcing process. It is designed toprovide shipment planning with full approval workflow, Advanced Ship Notice (ASN) management andshipment documentation. This solution works hand in hand with the Vendor Collaboration system to provide fullvisibility of inbound logistics and product availability.
e-Connect. We designed this solution to enable the exchange of XML-enabled data. e-Connect provides thelink to extend the ERP back-office software to the web and to enable users to interact with the ERP software viathe web. e-Connect also enables the interactive communication between web applications, marketplaces, tradingexchanges, suppliers, B2B transactions and back office ERP systems.
e-Process Management. This solution is designed as a web-based event-driven system that facilitates thesharing of information and the management of business processes across internal departments and amongbusiness partners. It automates business procedures (work flows) during which documents, information and tasksare passed from one participant to another in a way that is governed by rules or procedures.
RF Direct Connect
The RF Direct Connect solution offers an automated data collection system integrating hand-held datacollection devices and printing devices (RF terminals, scanners, barcode readers and printers) with the host ERPsystem’s inventory, customer order processing, and production control systems. Users can perform a number ofinventory and production reporting transactions using data collection devices including:
• Purchase Order Receiving
• Transfer Order Receiving/Shipping
14

• Production Order Receiving/Receipt Reversal
• Customer Order Pick Verification/Reversal
• Customer Order Shipment Verification/Reversal
AsIrecall
AsIrecall is an integrated document management solution for the capture, storage and retrieval ofdocuments. AsIrecall enables the automation of document-based business processes within the enterprise.AsIrecall enables not only the retrieval of scanned images such as packing slips, picking tickets, etc., but also theretrieval of spool files created within the ERP system. Documents can be stored in a variety of file types (TIFF,JPG, BMP, PDF, DOC, HTML), and EDI files can be converted to viewable documents.
New Generation Computing, Inc.
New Generation Computing (NGC) is our wholly-owned subsidiary that provides product solutions forretailers, importers and manufacturers primarily in the apparel, footwear, sewn products and furniture industries.NGC provides functionality that allows customers to improve efficiencies, lower operating costs, reduce supplychain time, meet complex customer requirements, improve supply chain visibility, improve inventorymanagement, and reduce production costs. NGC’s solutions include a 1) Product Lifecycle Management system(PLM), 2) Supply Chain Management (SCM) and Global Sourcing, 3) Enterprise Resource Planning (ERP) and4) Shop Floor Control. All products are completely integrated or can be implemented individually.
Product Lifecycle Management (PLM). From concept through adoption, NGC’s PLM software offersproductivity improvements during every step of development. NGC’s PLM can be configured to the specificneeds of any company and offers productivity improvements in every area of Development. It providescompanies with real-time visibility to product data and shares information with Planning, Merchandising,Design, Costing, Sourcing, Manufacturing and Logistics. NGC’s PLM is a flexible, collaborative platform thatcan be deployed as a stand-alone product development solution or an integrated application within an enterprise.
Using NGC’s PLM, companies can:
• Increase speed to market by managing their workflow in a global, collaborative environment.
• Enhance efficiency by using product development calendars to monitor on-time schedules andperformance.
• Raise gross margins by reducing the cost of goods sold through line item price negotiations, rawmaterial commitments and capacity planning.
• Improve product adoption rates by making “go/no-go” decisions earlier in the product developmentcycle.
• Reduce sampling costs by establishing product viability prior to issuing sample requests.
Features include:
• Line Planning
• Tech Packs
• Digital Asset Management
• Material Library
• Sampling
• Costing
15

• Sourcing
• Testing and Compliance
• Workflow Calendars
• Global Collaboration
• Exceptions Dashboard
• Custom Reporting
Supply Chain Management (SCM) and Global Sourcing. NGC’s Supply Chain Management and GlobalSourcing software enables real-time collaboration and visibility with vendors and suppliers, and is a powerfulweb-based application for companies that source and purchase products around the world. Production andlogistics information is shared among all members of the extended global supply chain including retailers,vendors, manufacturers, suppliers, contractors, agents, brokers, carriers and freight forwarders.
NGC’s SCM and Global Sourcing platform can be configured to meet customer requirements and integrateswith all enterprise applications, allowing companies to:
• Compress purchasing lead times by positioning raw materials for planned production cycles or series.
• Improve order fulfillment rates by balancing production capacity and product demand.
• Shrink markdowns and closeouts by applying “postponement” techniques to adjust WIP inventories.
• Cut unanticipated airfreight expenses by ensuring on-time deliveries from global production facilities.
• Reduce product defects by managing on-site quality audits and making corrections based upon theresults.
Features include:
• Purchase Order Management
• Quality Control
• Logistics Management
• Vendor Payment Automation
• Workflow Calendars
• Global Collaboration
• Exceptions Dashboard
• Custom Reporting
• Scan Pack Module (ezSHIP)
Enterprise Resource Planning (ERP). NGC’s ERP system manages the flow of essential informationthrough the enterprise and offers the flexibility to run all types of fashion companies, including manufacturersand importers. The system includes extensive EDI capabilities, materials purchasing and inventory, work ordermanagement, WMS, advanced allocation, integrated accounting, and extensive reporting.
Using NGC’s ERP, companies can:
• Improve operational productivity by integrating and streamlining all functional areas within theenterprise.
• Increase profit margins by identifying high cost business transactions.
• Enhance working capital by generating higher inventory turns.
16

• Reduce chargebacks by complying with customer requirements.
• Raise customer satisfaction levels by improving performance and providing timely, accurate information.
Features include:
• Executive Dashboard
• Integrated EDI
• Customer Order Processing
• Purchasing
• Material Requirements Planning
• Production Orders
• Screen Print and Embroidery
• Distribution and Warehouse Management
• Allocation and Reservation
• Integrated Financial Accounting
• Comprehensive Reporting
Shop Floor Control. NGC’s Shop Floor Control system is a labor and production management system that allowsvisibility throughout the production process. A configurable system for any business that manufactures products, ShopFloor Control provides real-time labor and production reporting throughout the entire factory network. The systemoptimizes on-time completions, evaluates plant workload, determines capacity needs, tracks employee performance,and calculates complex incentive payroll. Additional methods of data collection are available, including real timemodular monitoring and real time WIP data. The system is available in English, Spanish and Simplified Chinese.
NGC’s Shop Floor Control is proven system to help companies:
• Increase operational efficiency through daily workforce performance analysis.
• Improve payroll accuracy by scanning bar-coded payment coupons to determine employee wages.
• Reduce labor costs by reducing off-standard payroll.
• Increase production output by improved resource planning and eliminating bottlenecks.
• View detailed WIP visibility through multiple reports and inquiries.
Features include:
• Production Control and Incentive Payroll
• Raw Materials Management
• Modular Manufacturing
• Quality Control
• Real-Time Scanning of WIP, Quality and Payroll Data
• Factory Shipping
17
Segment 3—IT Consulting
The Proven Method, Inc.
The Proven Method, Inc., our wholly-owned subsidiary, is a technology services firm that specializes inassisting a diverse customer base to solve business issues with realistic and effective technology solutions. TheProven Method maintains a full-time staff of project management, business consultants and technical specialistspossessing a wide range of technical skills, and business applications and industry experience.
We believe a key differentiator of The Proven Method is its ability to offer flexible solutions to customersbased on current economic conditions. We provide solutions based on how our customers are running theirbusinesses, thereby meeting their specific needs. Customers today efficiently manage their technologyinvestments by implementing lower cost technologies to provide a direct and immediate revenue benefit. TheProven Method helps our customers drive revenue and targets customer satisfaction through their awareness ofthe best technologies available.
The solutions we provide can range from web and mobile applications on multiple platforms to complexBusiness Intelligence applications and solutions. Business Intelligence consists of the development andimplementation of a reporting process for dealing with very large volumes of data and multiple business entities/components. Our customers are Internet savvy and knowledgeable in wireless solutions, social networking andchanneling implementations, server and desktop virtualization, and deployment of interactive applications. Theyrely on The Proven Method to provide a fast return on investment, and our customers’ success in turn enhancesbrand awareness of The Proven Method among other customers and potential customers.
The cross-industry and multiple resource skills The Proven Method has acquired since 1995 enables us toprovide services to customers of virtually any type or size. The Proven Method customers benefit from ourservices in several different ways:
Professional Services / Project Management—Some rely on The Proven Method to serve in lieu of an in-house applications development group. The Proven Method provides these firms with the management,business and technical experience necessary to run an entire IT organization. Other companies will typicallyoutsource complete application development projects to The Proven Method, particularly when their internalproject management and technical personnel face a combination of critical timing and heavy backlog.
Staff Augmentation—Other customers call on The Proven Method to provide supplemental managementand technical resources for a skill or technical discipline they may not currently possess or if they simplyneed more of a particular set of skills. The Proven Method enables its customers to leverage their employeeswho have multiple skills to cover more job functions with fewer resources.
Infrastructure and Consulting Services—The Proven Method has helped chief information officers tomanage costs and align spending to match budget expectations and deliverables. The Networking andInfrastructure group offers a wide range of end-to-end communications services, delivering timely and costeffective solutions. They manage telecommunications data center build-outs, as well as integrate voice, data,IP, and networks seamlessly over coax cable, fiber cable, VOIP or space optics. The Proven Method offersadvanced technology communications services.
Social Media and Analytic Marketing—Customers now have the opportunity to understand the analyticalresults of the activities associated with the social media channels, including the development of marketingplans and recommendations for optimization based on industry needs and best practices. Services can beprovided to implement and manage social media programs as well as train prospective and present customers.
The Proven Method has worked with customers such as: Aon, Aarons Rents, IBM, UPS, Norfolk Southern,Xerox, SunTrust Bank, Coca-Cola, Dycom, Kubota Manufacturing of North America, The Home Depot,AT&T, State of Georgia, CompuCom, Zep Inc, Chick-fil-A, Global Payments, Verizon, Catlin Group Ltd,Federal Home Loan Bank of Atlanta, Forsythe Technology, Fulton Paper, AutoTrader.com, NalcoChemical, Georgia Tech Research Institute and numerous other customers throughout the United States.
See Note 8 to the Consolidated Financial Statements for further business segment information.
18

Customers
We primarily target businesses in the retail, apparel, consumer packaged goods, chemicals, pharmaceuticals,industrial products and other manufacturing industries. A sample of companies that have purchased one or more of ourproducts or services during the past two fiscal years is as follows:
ConsumerGoods
Chemicals, Oil & Gas,Pharmaceuticals
Retail & Apparel(cont.)
Manufacturingand Others
3M AustraliaAshley FurnitureAvery Dennison CorporationBASF CorporationBasic American FoodsBoise Paper Holdings, LLCCaribou Coffee CompanyCarrie FrancisClement Pappas & Co., Inc.Cliff Bar & CompanyCott Beverages LimitedDeschutes BreweryEURO-PRO Operating LLCFarley’s & Sathers Candy CompanyGlen Raven, Inc.Haddon House Food Products, Inc.Hamilton Beach Proctor-SilexHooker Furniture CorporationHuhtamakiKelly Moore Paint Company, IncKraft Foods CompanyL’OrealLance, Inc.LevolorMarquez Brothers InternationalMizuno USAMohawk IndustriesNestleNeatfreakOceana Brands LimitedParmalat South AfricaPeninsula Beverage CompanyPinnacle FoodsPolaris IndustriesProcter & GambleReckitt BenckisenRockline IndustriesSazerac CompanyJ. R. Simplot CompanyStarbucksSte. Michelle Wines Estates Ltd.The Stanley WorksTrek Bicycle CorporationXango, LLCZimmer K.K.
Telecommunications & Utilities
Brightstar CorporationBritsh TelecomKGP TelecommunicationsVerizon Wireless
Abbott LaboratoriesArch CorporationBerry Plastics CorporationBP Singapore Pte. LimitedBracco Imagining s.p.a.Chamberlain GroupCooperVisionDow Chemical CompanyEGO Pharmaceuticals, PTY LTDFisher Scientific InternationalGenzyme DiagnosticsHerbalife International of America,Inc.Nutra ManufacturingSandozShell Oil CompanySigma-Aldrich CorporationSunovion Pharmaceuticals, Inc.
Retail & Apparel
AeropostaleAGS Sports, Inc.Aktieselskabet AFAlberto MakaliAntartico Comercializadora SA de CVArmani Exchange, Inc.Art Van FurnitureBallet JewelsBernard Cap Co., Inc.BestsellerBillabong International UnlimitedBioworld MerchandisingBiscottiBobs Discount FurnitureBlair CorporationBRICABoots UK, Ltd.Broder BrothersBrooks SportsCacheCarharttCartersCasual Male Retail GroupColor Image Apparel, Inc.Delta ApparelDestination XLEverlast WorldwideEvy of CaliforniaFashion Avenue KnitsFGL GroupFoot Locker, Inc.Forzani Group
Foschini Retail Group PtyGodivaGoodwill IndustriesGTM SportswearHandcraft Manufacturing Corp.Hanesbrands, IncHMX GroupHugo BossISDA & Co.Janouras Custom Design, Ltd.Jaya Apparel, LLCJerry Leigh EntertainmentJerzeesJockeyJohn Paul RichardJos. A. Banks ClothiersLand ’n SeaLandau UniformLiz ClaiborneL’Koral, LLCLululemon AthleticaMaidenform BrandsManhattan Beachwear, LLCModell’s Sporting GoodsNew Balance Athletic Shoe, Inc.Nicole MillerParigi GroupPolo Ralph LaurenRawlings Sporting GoodsRed Wing Shoe CompanyRenfroRocky BrandsRussell CorporationSpanxSpartan SportswearSport ObermeyerStony ApparelSwatfameThe Home DepotTibiTiffany & Co.Topson DownsTristan & AmericaT-Shirt InternationalUnifirst CorpValley Apparel LLCVesi SportswearVF CorporationW Diamond GroupWarnacoWilliamson-Dickie ManufacturingWohali Outdoors
A.O. Smith Water ProductsCengage LearningCintas CorporationCorning Cable SystemsDal-Tile CorporationDassault Falcon JetIBM/SynertechIngram MicroIntertape Polymer GroupJohnson ControlsJohnsonDiversey, IncLouisiana-Pacific CorporationNewell RubbermaidParker Hannifin CorporationReliable Automatic SprinklerSeagate Technology LLCSeco Tools ABShaw IndustriesSiemens Medical SolutionsDiagnosticsSonoco ProductsTyco Safety ProductsUniversal Fiber SystemsWD40 Company
Wholesale Distribution
American Hotel RegisterCompanyAmerisource Bergen SpecialtyGroupChemPointCHF IndustriesDoosan GroupFastenal CompanyFerguson EnterprisesFintyre S.p.A.Groupe Seb HoldingsHDAJohnstone SupplyKomatsu Europe International NVRepublic National DistributingCo.SAICStandard Motor ProductsTirecoTrelleborg Wheel Systems SPA
19
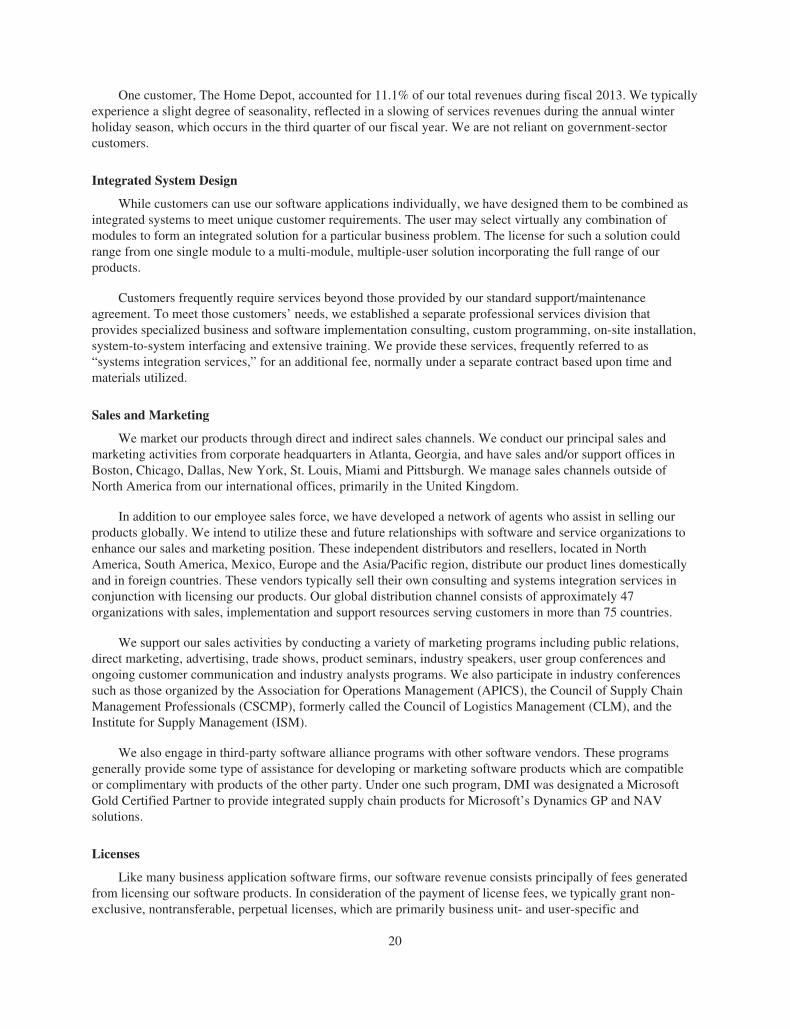
One customer, The Home Depot, accounted for 11.1% of our total revenues during fiscal 2013. We typicallyexperience a slight degree of seasonality, reflected in a slowing of services revenues during the annual winterholiday season, which occurs in the third quarter of our fiscal year. We are not reliant on government-sectorcustomers.
Integrated System Design
While customers can use our software applications individually, we have designed them to be combined asintegrated systems to meet unique customer requirements. The user may select virtually any combination ofmodules to form an integrated solution for a particular business problem. The license for such a solution couldrange from one single module to a multi-module, multiple-user solution incorporating the full range of ourproducts.
Customers frequently require services beyond those provided by our standard support/maintenanceagreement. To meet those customers’ needs, we established a separate professional services division thatprovides specialized business and software implementation consulting, custom programming, on-site installation,system-to-system interfacing and extensive training. We provide these services, frequently referred to as“systems integration services,” for an additional fee, normally under a separate contract based upon time andmaterials utilized.
Sales and Marketing
We market our products through direct and indirect sales channels. We conduct our principal sales andmarketing activities from corporate headquarters in Atlanta, Georgia, and have sales and/or support offices inBoston, Chicago, Dallas, New York, St. Louis, Miami and Pittsburgh. We manage sales channels outside ofNorth America from our international offices, primarily in the United Kingdom.
In addition to our employee sales force, we have developed a network of agents who assist in selling ourproducts globally. We intend to utilize these and future relationships with software and service organizations toenhance our sales and marketing position. These independent distributors and resellers, located in NorthAmerica, South America, Mexico, Europe and the Asia/Pacific region, distribute our product lines domesticallyand in foreign countries. These vendors typically sell their own consulting and systems integration services inconjunction with licensing our products. Our global distribution channel consists of approximately 47organizations with sales, implementation and support resources serving customers in more than 75 countries.
We support our sales activities by conducting a variety of marketing programs including public relations,direct marketing, advertising, trade shows, product seminars, industry speakers, user group conferences andongoing customer communication and industry analysts programs. We also participate in industry conferencessuch as those organized by the Association for Operations Management (APICS), the Council of Supply ChainManagement Professionals (CSCMP), formerly called the Council of Logistics Management (CLM), and theInstitute for Supply Management (ISM).
We also engage in third-party software alliance programs with other software vendors. These programsgenerally provide some type of assistance for developing or marketing software products which are compatibleor complimentary with products of the other party. Under one such program, DMI was designated a MicrosoftGold Certified Partner to provide integrated supply chain products for Microsoft’s Dynamics GP and NAVsolutions.
Licenses
Like many business application software firms, our software revenue consists principally of fees generatedfrom licensing our software products. In consideration of the payment of license fees, we typically grant non-exclusive, nontransferable, perpetual licenses, which are primarily business unit- and user-specific and
20

geographically restricted. Our standard license agreement contains provisions designed to prevent disclosure andunauthorized use of our software. In these agreements, we warrant that our products will function in accordancewith the specifications set forth in our product documentation.
The prices for our products are typically functions of the number of modules licensed and the number ofservers, users and sites for which the solution is designed and deployed.
Customer Service and Support
We provide the following services and support to our customers:
Implementation Support. We offer our customers a professional and proven implementation program thatfacilitates rapid implementation of our software products. Our consultants help customers define the nature oftheir project and subsequently proceed through the implementation process. We provide training for all users andmanagers involved. We first establish measurable financial and logistical performance indicators and thenevaluate them for conformance during and after implementation. Additional services beyond implementation caninclude post-implementation reviews and benchmarks to further enhance the benefits to customers.
Implementation: General Training Services. We offer our customers post-delivery professional servicesconsisting primarily of implementation and training services, for which we typically charge on a daily basis.Customers that purchase implementation services receive assistance in integrating our solution with existingsoftware applications and databases. Implementation of our products typically requires three to nine months,depending on factors such as the complexity of a customer’s existing systems, the number of modules purchased,and the number of end users.
Product Maintenance and Updates: Support Services. We provide our customers with ongoing productsupport services. Typically, we enter into support or maintenance contracts with customers for an initial one- tothree-year term, billed annually in advance, at the time of the product license with renewal for additional periodsthereafter. Under these contracts, we provide telephone consulting, product updates and releases of new versionsof products previously purchased by the customer, as well as error reporting and correction services. We provideongoing support and maintenance services on a seven-days-a-week, 24-hours-a-day basis through telephone,electronic mail and web-based support, using a call logging and tracking system for quality assurance.
Research and Development
Our future success depends in part upon our ability to continue to enhance existing products, respond tochanging customer requirements, develop and introduce new or enhanced products, and keep pace withtechnological developments and emerging industry standards. We focus our development efforts on severalareas, including, but not limited to, enhancing operability of our products across distributed and changingheterogeneous hardware platforms, operating systems and relational databases, and adding functionality toexisting products. These development efforts will continue to focus on deploying applications within a multi-tiered ERP and supply chain environment, including the Internet.
Logility’s current release of Logility Voyager Solutions is version 8.0, released in July 2010.Version 8.0uses an Internet-based architecture for maximum scalability and messaging functionality that supports theincreasingly distributed nature of supply chain planning, global sourcing, supply chain execution andcollaborative commerce. Logility Voyager Solutions interfaces with software of leading ERP vendors such asSAP and Oracle.
The current release of the traditional Demand Solutions products is version 11 and the first release of DSXwas introduced in February 2010. These products are designed to work with a wide variety of MRP, ERP andlegacy enterprise applications.
Our client/server and Internet-based solutions will be important for our long-term growth. As of April 30,2013, we employed 70 persons in product research, development and enhancement activities.
21
Competition
Our competitors are diverse and offer a variety of solutions directed at various aspects of the supply chain,as well as the enterprise application market as a whole. Our existing competitors include:
• Large ERP application software vendors such as SAP, Oracle and Infor, each of which offerssophisticated ERP solutions that currently, or may in the future, incorporate supply chain managementmodules, advanced planning and scheduling, warehouse management, transportation or collaborationsoftware;
• Vendors focusing on the supply chain application software market, including, but not limited to,vendors such as JDA Software;
• Other business application software vendors that may broaden their product offerings by internallydeveloping, or by acquiring or partnering with independent developers of, supply chain managementsoftware; and
• Internal development efforts by corporate information technology departments.
In addition, our Logility subsidiary may face competition from other application software vendors,including ERP vendors that from time to time jointly market Logility’s products as a complement to their ownsystems. To the extent such vendors develop or acquire systems with functionality comparable to Logility’sproducts, their significant installed customer base, long-standing customer relationships and ability to offer abroad solution could provide a competitive advantage over Logility’s products.
We also expect to face additional competition as other established and emerging companies enter the marketfor collaborative commerce and supply chain management software and introduce new products andtechnologies. In addition, current and potential competitors have made and may continue to make strategicacquisitions or establish cooperative relationships among themselves or with third parties, thereby increasing theability of their products to address the needs of our prospective customers. Accordingly, it is possible that newcompetitors or alliances among current and new competitors may emerge and rapidly gain significant marketshare. Increased competition could result in fewer customer orders, reduced gross margins and loss of marketshare.
The principal competitive factors in the target markets in which we compete include product functionalityand quality, domain expertise, integration technologies, product suite integration, breadth of products and relatedservices such as customer support, training and implementation services. Other factors important to customersand prospects include:
• customer service and satisfaction;
• ability to provide relevant customer references;
• compliance with industry-specific requirements and standards;
• flexibility to adapt to changing business requirements;
• ability to generate business benefits;
• rapid payback and measurable return on investment;
• vendor financial stability and company as well as product reputation; and
• initial license price, cost to implement and long term total cost of ownership.
Many of our competitors and potential competitors have a broader worldwide presence, longer operatinghistories, significantly greater financial, technical, marketing and other resources, greater name recognition, and alarger installed base of customers than we have. Some competitors have become more aggressive with theirprices, payment terms and issuance of contractual implementation terms or guarantees. In order to be successfulin the future, we must continue to develop innovative software solutions and respond promptly and effectively to
22
technological change and competitors’ innovations. We may also have to lower prices or offer other favorableterms. Our competitors may be able to respond more quickly to new or emerging technologies and changes incustomer requirements or devote greater resources to the development, promotion and sale of their products.
We believe that our principal competitive advantages are our comprehensive, integrated solutions, our list ofreferenceable customers, the ability of our solutions to generate business benefits for our customers, oursubstantial investment in product development, our deep domain expertise, the ease of use of our softwareproducts, our customer support and implementation services, our ability to deploy quickly, and our ability todeliver rapid return on investment for our customers.
Proprietary Rights and Licenses
Our success and ability to compete are dependent in part upon our proprietary technology. To protect ourproprietary technology, we rely on a combination of copyright and trade secret laws, confidentiality proceduresand contractual provisions, which may afford only limited protection. In addition, effective copyright and tradesecret protection may be unavailable or limited in certain foreign countries. Although we rely on the limitedprotection afforded by such confidential and contractual procedures and intellectual property laws, we alsobelieve that factors such as the knowledge, ability, and experience of our personnel, new product developments,frequent product enhancements, reliable maintenance and timeliness and quality of support services are essentialto establishing and maintaining a technology leadership position. We presently have no patents. The source codefor our proprietary software is protected as a trade secret and as a copyrighted work. Generally, copyrights on ourproducts expire 95 years after the year of first publication of each product. We enter into confidentiality orlicense agreements with our employees, consultants and customers, and control access to and distribution of oursoftware, documentation and other proprietary information. In addition, we have registered certain trademarksand have registration applications pending for other trademarks.
We provide our software products to customers under non-exclusive license agreements. As is customary inthe software industry, in order to protect our intellectual property rights, we do not sell or transfer title to ourproducts to our customers. Although the license agreements place restrictions on the customer’s use of ourproducts, unauthorized use of our products nevertheless may occur.
Despite measures we have taken to protect our proprietary rights, unauthorized parties may attempt toreverse engineer or copy aspects of our products or obtain and use information that we regard as proprietary.Policing unauthorized use of our products is difficult and expensive. In addition, litigation may be necessary inthe future to enforce our intellectual property rights, to protect our trade secrets, to determine the validity andscope of the proprietary rights of others, or to defend against claims of infringement or invalidity. Such litigationcould result in substantial costs and diversion of resources and could have a material adverse effect on ourbusiness, operating results and financial condition.
In the future, we may increasingly be subject to claims of intellectual property infringement as the number ofproducts and competitors in our industry segment grows and the functionality of products in different industrysegments overlaps. Although we are not aware that any of our products infringe upon the proprietary rights of thirdparties, there can be no assurance that third parties will not claim infringement by us with respect to current orfuture products. In addition, we may initiate claims or litigation against third parties for infringement of ourproprietary rights or to establish the validity of our proprietary rights. Any such claims against us, with or withoutmerit, as well as claims initiated by us against third parties, can be time consuming and expensive to defend,prosecute or resolve. Moreover, an adverse outcome in litigation or similar adversarial proceedings could subject usto significant liabilities to third parties, require the expenditure of significant resources to develop non-infringingtechnology, require a substantial amount of attention from management, require disputed rights to be licensed fromothers, require us to enter into royalty arrangements or require us to cease the marketing or use of certain products,any of which would have a material adverse effect on our business, operating results and financial condition. To theextent that we desire or are required to obtain licenses to patents or proprietary rights of others, there can be noassurance that any such licenses will be made available on terms acceptable to us, if at all.
23

We have re-licensed, and expect in the future to re-license, certain software from third parties for use inconnection with our products. There can be no assurance that these third-party software vendors will not changetheir product offerings or that these software licenses will continue to be available to us on commerciallyreasonable terms, if at all. The termination of any such licenses or product offerings, or the failure of the third-party licensors to adequately maintain or update their products, could result in delays in our ability to ship certainof our products while we seek to implement technology offered by alternative sources. Any required replacementlicenses could prove costly. Further, any such delay, if it becomes extended, could result in a material adverseeffect on our results of operations.
Company Strategy
Our objective is to become a leading provider of collaborative supply chain solutions and enterprise-wideERP to enable small, midsize, large and Fortune 1000 companies to optimize their operations associated with theplanning, sourcing, manufacture, storage, and distribution of products. Our strategy includes the following keyelements:
Leverage and Expand Installed Base of Customers. We currently target businesses in the consumer goods,chemicals and pharmaceuticals, food and beverage, apparel and sewn products, and oil and gas industries. Weintend to continue to leverage our installed base of more than 1,300 customers to introduce additionalfunctionality, product upgrades, and complementary modules. In addition, we intend to expand sales to newcustomers in our existing vertical markets and to target additional vertical markets over time.
Continue to Expand Sales and Marketing. We intend to continue to pursue an increased share of the marketfor ERP and SCM software solutions by expanding our sales and marketing activities. We believe ourcompetitive advantages include providing rapid implementation, easy-to-maintain configuration, and quick time-to-benefit across the full spectrum of customer operations. Logility intends to continue building a direct salesforce that is focused on selected vertical markets, such as consumer goods, retail and manufacturing supplychains, and NCG intends to continue to focus on the apparel, footwear, sewn products, and furniture industries,adding sales and marketing resources when appropriate.
Expand Indirect Channels to Increase Market Penetration. We believe that key relationships with VARswill increase sales and expand market penetration of our products and services. During fiscal 2013 we continuedto add VARs to the DMI channel in countries such as Italy, Chile, Peru, Czech Republic, and Croatia. Thisexperienced global distribution network significantly expands Logility’s reach and provides sales,implementation and support resources serving customers in more than 75 countries.
Maintain Technology Leadership. We believe we are a technology leader in the field of collaborative supplychain optimization solutions and we intend to continue to provide innovative, advanced solutions and services tothis market. We believe that Logility was one of the earliest providers of SCM software solutions on a client/server platform and on Windows, and the first to introduce a collaborative supply chain planning solution thatoperates over the Internet. We intend to continue developing and introducing new and enhanced products andkeeping pace with technological developments and emerging industry standards.
Invest Aggressively to Build Market Share. We intend to continue investing to expand our sales force,research and development efforts, and consulting infrastructure, balanced with our goal of increasingprofitability. We believe these investments are necessary to increase our market share and to capitalize on thegrowth opportunities in the market.
Acquire or Invest in Complementary Businesses, Products and Technologies. We believe that selectacquisitions or investments may provide opportunities to broaden our product offering to provide more advancedsolutions for our target markets. We will evaluate acquisitions or investments that will provide us withcomplementary products and technologies, expand our geographic presence and distribution channels, penetrateadditional vertical markets with challenges and requirements similar to those we currently meet, and furthersolidify our leadership position within the SCM market.
24

Focus on Integrated Collaborative Planning and Supply Chain Execution Solution. We believe Logility isone of the few providers of truly integrated SCM software solutions addressing demand and supply planning aswell as transportation and warehousing logistics requirements. Logility Voyager Solutions provides acomprehensive suite for supply chain planning, warehouse and transportation management with collaboration atits core, streamlining business processes between both internal and external trading partners. We intend tocontinue focusing Logility’s development initiatives on enhancing its end-to-end solution, expanding itsembedded performance management architecture and introducing additional capabilities that complement itsintegrated solution suite.
Increase Penetration of International Markets. In the fiscal year ended April 30, 2013, we generated 14% ofour total revenues from international sales, resulting from marketing relationships with a number of internationaldistributors. Logility, along with its subsidiary, DMI, has over 56 international VARs in its indirect channel. Thisexperienced global distribution network expands Logility’s reach and provides sales, implementation and supportresources, serving customers in more than 75 countries. We intend to further expand our international presenceby creating additional relationships with distributors in Africa, Asia, Australia, Europe, North America andSouth America.
Expand Strategic Relationships. We intend to develop strategic relationships with leading enterprisesoftware, systems integrators and service providers to integrate the Logility Voyager Solutions suite into theirservices and products and to create joint marketing opportunities. In addition, Logility has developed a networkof international agents who assist in the sale and support of its products. We intend to utilize these and futurerelationships with software and service organizations to enhance our sales and marketing position.
Continue to Focus on Providing High Quality Customer Service. Providing high quality customer service isa critical element of our strategy. We intend to continue investing in technology and personnel to accommodatethe needs of our growing customer base. We will continue to seek new ways to improve service to our customers.
Implement e-Business Strategy. We have launched an e-business initiative that will enable us to build oncurrent applications while moving toward total Internet-based value chain management. Our e-business strategyincludes products and services designed to enable the optimization of the customer’s supply chain and improvecollaboration.
Serve Small, Midsize and Large Business Markets. Our broad product portfolio allows us to address theunique business needs and complexity of a wide range of enterprises with small, midsize and large globaloperations.
There can be no assurance, however, that we will be successful in implementing the strategies outlinedabove.
Employees
As of April 30, 2013, we had 377 full-time employees, including 70 in product research, development andenhancement, 41 in customer support, 162 in professional services, 68 in marketing, sales and sales support, and36 in accounting, facilities and administration. We believe that our continued success will depend in part on ourability to continue to attract and retain highly skilled technical, marketing and management personnel, who maybe in great demand. We believe our employee relations are good. We have never had a work stoppage and noemployees are represented under collective bargaining arrangements.
Available Information
We make our annual reports on Form 10-K, quarterly reports on Form 10-Q, current reports on Form 8-K,and all amendments to these reports available free of charge on or through our website, located athttp://www.amsoftware.com, as soon as reasonably practicable after they are filed with or furnished to the SEC.Reference to our website does not constitute incorporation by reference of the information contained on the siteand should not be considered part of this document.
25

ITEM 1A. RISK FACTORS
A variety of factors may affect our future results and the market price of our stock.
We have included certain forward-looking statements in Management’s Discussion and Analysis ofFinancial Condition and Results of Operations and elsewhere in this Form 10-K. We may also make oral andwritten forward-looking statements from time to time, in reports filed with the Securities and ExchangeCommission and otherwise. We undertake no obligation to revise or publicly release the results of any revisionsto these forward-looking statements based on circumstances or events which occur in the future. Actual resultsmay differ materially from those projected in any such forward-looking statements due to a number of factors,including those set forth below and elsewhere in this Form 10-K.
We operate in a dynamic and rapidly changing environment that involves numerous risks and uncertainties.The following section lists some, but not all, of the risks and uncertainties that we believe may have a materialadverse effect on our business, financial condition, cash flow or results of operations. In that case, the trading priceof our securities could decline and you may lose all or part of your investment in our company. This section shouldbe read in conjunction with the audited Consolidated Financial Statements and Notes thereto, and Management’sDiscussion and Analysis of Financial Condition and Results of Operations included in this Form 10-K.
We cannot predict every event and circumstance that may affect our business, and therefore the risks anduncertainties discussed below may not be the only ones you should consider.
The risks and uncertainties discussed below are in addition to those that apply to most businesses generally.Furthermore, as we continue to operate our business, we may encounter risks of which we are not aware at thistime. These additional risks may cause serious damage to our business in the future, the impact of which wecannot estimate at this time.
RISK FACTORS RELATED TO THE ECONOMY
Disruptions in the financial and credit markets, a slow economic recovery, and other external influences inthe U.S. and global markets may reduce demand for our software and related services, which maynegatively affect our revenues and operating results.
Our revenues and profitability depend on the overall demand for our software, professional services andmaintenance. Regional and global changes in the economy and financial markets, such as the severe globaleconomic downturn in 2008 followed by a slow and relatively weak recovery, have resulted in companiesreducing their spending for technology projects generally and delaying or reconsidering potential purchases ofour products and related services. Adverse conditions in credit markets, lagging consumer confidence andspending, the fluctuating cost of fuel and commodities and their effects on the U.S. and global economies andmarkets are examples of negative factors that have delayed or canceled certain potential customer purchases.Furthermore, the uncertainty posed by the long-term effects of conflicts in the Middle East, terrorist activities,related uncertainties and risks, and other geopolitical issues may also adversely affect the purchasing decisions ofcurrent or potential customers. Weakness in European economies may adversely affect demand for our productsand services, both directly and by adversely affecting business conditions that our customers face, as many of ourU.S. customers rely heavily on European sales. There can be no assurance that government responses to thedisruptions in the financial markets or to weakened economies will sufficiently restore confidence, stabilizemarkets or increase liquidity and the availability of credit.
We are a technology company selling technology-based solutions with total pricing, including software andservices, in many cases exceeding $500,000. Reductions in the capital budgets of our customers and prospectivecustomers could have an adverse impact on our ability to sell our solutions. These economic and political conditionsmay reduce the willingness or ability of our customers and prospective customers to commit funds to purchase ourproducts and services or to renew existing post-contract support agreements, or their ability to pay for our productsand services after purchase. Future declines in demand for our products or services or a broadening or protractedextension of these conditions would have a significant negative impact on our revenues and operating results.
26

There may be an increase in customer bankruptcies due to weak economic conditions.
We have in the past and may in the future be affected by customer bankruptcies that occur in periodssubsequent to the software license sale. During weak economic conditions there is an increased risk that some ofour customers will file bankruptcy. When our customers file bankruptcy, we may be required to forego collectionof pre-petition amounts owed and to repay amounts remitted to us during the 90-day preference period precedingthe filing. Accounts receivable balances related to pre-petition amounts may in some of these instances be large,due to extended payment terms for software license fees and significant billings for consulting andimplementation services on large projects. The bankruptcy laws, as well as the specific circumstances of eachbankruptcy, may severely limit our ability to collect pre-petition amounts, and may force us to disgorge paymentsmade during the 90-day preference period. We also face risk from international customers that file forbankruptcy protection in foreign jurisdictions, as the application of foreign bankruptcy laws may be moredifficult to predict. Although we believe that we have sufficient reserves to cover anticipated customerbankruptcies, there can be no assurance that such reserves will be adequate, and if they are not adequate, ourbusiness, operating results and financial condition would be adversely affected.
Changes in the value of the U.S. Dollar, as compared to the currencies of foreign countries where wetransact business, could harm our operating results.
Our international revenues and the majority of our international expenses, including the wages of some ofour employees, have been denominated primarily in currencies other than the U.S. Dollar. Therefore, changes inthe value of the U.S. Dollar as compared to these other currencies may adversely affect our operating results. Wedo not hedge our exposure to currency fluctuations affecting future international revenues and expenses and othercommitments. For the foregoing reasons, currency exchange rate fluctuations have caused, and likely willcontinue to cause, variability in our foreign currency denominated revenue streams and our cost to settle foreigncurrency denominated liabilities.
RISK FACTORS RELATED TO COMPETITION
Our markets are very competitive, and we may not be able to compete effectively.
The markets for our solutions are very competitive. The intensity of competition in our markets hassignificantly increased, in part as a result of the deterioration in the business climate within the United States andother geographic regions in which we operate. We expect this intensity of competition to increase in the future.Our current and potential competitors have made and may continue to make acquisitions of other competitors andmay establish cooperative relationships among themselves or with third parties. Any significant consolidationamong ERP or supply chain software companies could adversely affect our competitive position. Increasedcompetition has resulted and in the future could result in price reductions, lower gross margins, longer salescycles and loss of market share. Each of these developments could have a material adverse effect on ouroperating performance and financial condition.
Many of our current and potential competitors have significantly greater resources than we do, andtherefore we may be at a disadvantage in competing with them.
We directly compete with other supply chain software vendors, including SAP, Oracle Corporation, JDASoftware Group, SAP AG, Infor, Inc., Manhattan Associates, Lawson Software Inc. and others. Some of ourcurrent and potential competitors have significantly greater financial, marketing, technical and other competitiveresources than we do, as well as greater name recognition and a larger installed base of clients. The ERP softwaremarket has experienced significant consolidation. This consolidation has included numerous mergers andacquisitions, including takeovers such as the Oracle acquisitions of PeopleSoft, Retek, ProfitLogic, Inc., 360Commerce, Siebel Systems, Inc. and Global Logistics Technologies, Inc.; SAP AG’s acquisitions of Triversity,Inc. and Khimetics. Inc.; JDA Software’s acquisition of Manugistics Group and i2 Technologies and RedPrairie’smerger with JDA Software, Inc. It is difficult to estimate what long-term effect these acquisitions will have onour competitive environment. We have encountered competitive situations where we suspect that large
27

competitors, in order to encourage customers to purchase licenses of non-retail specific applications and gainretail market share, have also offered to license at no charge certain retail software applications that compete withour solutions. If competitors such as Oracle and SAP AG and other large private companies are willing to licensetheir retail and/or other applications at no charge, this may result in a more difficult competitive environment forour products. In addition, we could face competition from large, multi-industry technology companies that havehistorically not offered an enterprise solution set to the retail supply chain market. We cannot guarantee that wewill be able to compete successfully for customers against our current or future competitors, or that competitionwill not have a material adverse effect on our business, operating results and financial condition. Also, someprospective buyers are reluctant to purchase applications that could have a short lifespan, as an acquisition couldresult in the application’s life being abruptly cut short. In addition, increased competition and consolidation inthese markets is likely to result in price reductions, reduced operating margins and changes in market share, anyone of which could adversely affect us. If customers or prospects want to reduce the number of their softwarevendors, they may elect to purchase competing products from a larger vendor than us since those larger vendorsoffer a wider range of products. Furthermore, some of these larger vendors, such as Oracle, may be capable ofbundling their software with their database applications, which underlie a significant portion of our installedapplications. When we compete with these larger vendors for new customers, we believe that these largerbusinesses often attempt to use their size as a competitive advantage against us.
Many of our competitors have well-established relationships with our current and potential clients and haveextensive knowledge of our industry. As a result, they may be able to adapt more quickly to new or emergingtechnologies and changes in client requirements or to devote greater resources to the development, promotionand sale of their products than we can. Some competitors have become more aggressive with their prices andpayment terms and issuance of contractual implementation terms or guarantees. We may be unable to continue tocompete successfully with new and existing competitors without lowering prices or offering other favorableterms. Furthermore, potential customers may consider outsourcing options, including application serviceproviders, data center outsourcing and service bureaus, as alternatives to licensing our software products. Any ofthese factors could materially impair our ability to compete and have a material adverse effect on our operatingperformance and financial condition.
We also face competition from the corporate information technology departments of current or potentialcustomers capable of internally developing solutions and we compete with a variety of more specialized softwareand services vendors, including:
• Internet (on demand) software vendors;
• single-industry software vendors;
• merging enterprise resource optimization software vendors;
• human resource management software vendors;
• financial management software vendors;
• merchandising software vendors;
• services automation software vendors; and
• outsourced services providers.
As a result, the market for enterprise software applications has been and continues to be intenselycompetitive. Some competitors are increasingly aggressive with their pricing, payment terms and/or issuance ofcontractual warranties, implementation terms or guarantees. Third-party service companies may offer competingmaintenance and implementation services to our customers and thereby reduce our opportunities to provide thoseservices. We may be unable to continue to compete successfully with new and existing competitors withoutlowering prices or offering other favorable terms to customers. We expect competition to persist and intensify,which could negatively affect our operating results and market share.
28
Due to competition, we may change our pricing practices, which could adversely affect operating marginsor customer ordering patterns.
The intensely competitive markets in which we compete can put pressure on us to reduce our prices. If ourcompetitors offer deep discounts on certain products or services in an effort to recapture or gain market share orto sell other products or services, we may need to lower prices or offer other favorable terms in order to competesuccessfully. For these and other reasons, in the future we may choose to make changes to our pricing practices.For example, we may (1) offer additional discounts to customers, (2) increase (or decrease) the use of pricing thatinvolves periodic fees based on the number of users of a product, or (3) change maintenance pricing. Suchchanges could reduce margins or inhibit our ability to sell our products.
RISK FACTORS RELATED TO OUR OPERATIONS
Our growth is dependent upon the successful further development of our direct and indirect saleschannels.
We believe that our future growth also will depend on developing and maintaining successful strategicrelationships with systems integrators and other technology companies. Our strategy is to continue to increase theproportion of customers served through these indirect channels. We are currently investing, and plan to continueto invest, significant resources to develop these indirect channels. This investment could adversely affect ouroperating results if these efforts do not generate license and service revenue necessary to offset this investment.Also, our inability to partner with other technology companies and qualified systems integrators could adverselyaffect our results of operations. Because lower unit prices are typically charged on sales made through indirectchannels, increased indirect sales could reduce our average selling prices and result in lower gross margins. Inaddition, sales of our products through indirect channels will reduce our consulting service revenues, as the third-party systems integrators generally provide these services. As indirect sales increase, our direct contact with ourcustomer base will decrease, and we may have more difficulty accurately forecasting sales, evaluating customersatisfaction and recognizing emerging customer requirements. In addition, these systems integrators and third-party software providers may develop, acquire or market products competitive with our products. Our strategy ofmarketing our products directly to customers and indirectly through systems integrators and other technologycompanies may result in distribution channel conflicts. Our direct sales efforts may compete with those of ourindirect channels and, to the extent that different systems integrators target the same customers, systemsintegrators may also come into conflict with each other. Any channel conflicts that develop may have a materialadverse effect on our relationships with systems integrators or harm our ability to attract new systems integrators.
We may be required to defer recognition of license revenue for a significant period of time after enteringinto an agreement, which could negatively affect our results of operations.
We may have to delay recognizing license revenue for a significant period of time based on a variety offactors, including:
• whether the license agreement relates to then-unavailable software products;
• whether transactions include both currently deliverable software products and software products thatare under development or other undeliverable elements;
• whether the customer demands services that include significant modifications, customizations orcomplex interfaces that could delay product delivery or acceptance;
• whether the transaction involves acceptance criteria that may preclude revenue recognition or if thereare identified product-related issues, such as known defects; and
• whether the transaction involves payment terms or fees that depend upon contingencies.
These factors and other specific accounting requirements under U.S. Generally Accepted AccountingPrinciples (GAAP) for software revenue recognition requires that we have very precise terms in our license
29

agreements to allow us to recognize revenue when we initially deliver software or perform services. Although wehave a standard form of license agreement that we believe meets the criteria under GAAP for current revenuerecognition on delivered elements, we negotiate and revise these terms and conditions in many transactions.Therefore, it is possible that from time to time we may license our software or provide services with terms andconditions that do not permit revenue recognition at the time of delivery or even as work on the project iscompleted.
We are dependent upon the retail industry for a significant portion of our revenues.
Historically, we have derived a significant percentage of our revenues from the license of software productsand the sale of collaborative applications that address vertical market opportunities with manufacturers andwholesalers that supply retail customers. The success of our customers is directly linked to economic conditionsin the retail industry, which in turn are subject to intense competitive pressures and are affected by overalleconomic conditions. In addition, we believe that the licensing of certain of our software products involves alarge capital expenditure, which is often accompanied by large-scale hardware purchases or other capitalcommitments. As a result, demand for our products and services could decline in the event of instability orpotential downturns in our customers’ industries.
We believe the retail industry remains cautious in its level of investment in information technology duringthe current difficult economic cycle. We remain concerned about weak and uncertain economic conditions,consolidations and the disappointing results of retailers in certain markets, especially if such weak economicconditions or fear of additional terrorist attacks and wars persist for an extended period of time. Weak anduncertain economic conditions have in the past, and may in the future, negatively affect our revenues, includingpotential deterioration of our maintenance revenue base as customers look to reduce their costs, elongation of ourselling cycles, and reduction in the demand for our products. As a result, it is difficult in the current economicenvironment to predict exactly when specific software licenses will close. In addition, weak and uncertaineconomic conditions could impair our customers’ ability to pay for our products or services. Any of these factorscould adversely affect our business, our quarterly or annual operating results and our financial condition.
We have observed that the retail industry may be consolidating, and that the industry is currentlyexperiencing increased competition in certain geographic regions that could negatively affect the industry andour customers’ ability to pay for our products and services. Such consolidation has in the past, and may in thefuture, negatively impact our revenues and reduce the demand for our products, and may adversely affect ourbusiness, operating results and financial condition.
We may derive a significant portion of our revenues in any quarter from a limited number of large, non-recurring license sales.
We expect to continue to experience from time to time large, individual license sales, which may causesignificant variations in quarterly license fees. We also believe that purchasing our products is relativelydiscretionary and generally involves a significant commitment of a customer’s capital resources. Therefore, adownturn in any customer’s business could result in order cancellations that could have a significant adverseimpact on our revenues and quarterly results. Moreover, continued uncertainty about general economicconditions could precipitate significant reductions in corporate spending for information technology, which couldresult in delays or cancellations of orders for our products.
Our lengthy sales cycle makes it difficult to predict quarterly revenue levels and operating results.
Because license and implementation fees for our software products are substantial and the decision topurchase our products typically involves members of our customers’ senior management, the sales process forour solutions is lengthy. Accordingly, the timing of our license revenues is difficult to predict, and the delay of anorder could cause our quarterly revenues to fall substantially below our expectations and those of public marketanalysts and investors. Moreover, to the extent that we succeed in shifting customer purchases away from
30

individual software products and toward more costly integrated suites of software and services, our sales cyclemay lengthen, which could increase the likelihood of delays and cause the effect of a delay to become morepronounced. Delays in sales could cause significant shortfalls in our revenues and operating results for anyparticular period. Also, it is difficult for us to forecast the timing and recognition of revenues from sales of ourproducts because our existing and prospective customers often take significant time evaluating our productsbefore licensing them. The period between initial customer contact and a purchase by a customer may vary fromnine months to more than one year. During the evaluation period, prospective customers may decide not topurchase or may scale down proposed orders of our products for various reasons, including:
• reduced demand for enterprise software solutions;
• introduction of products by our competitors;
• lower prices offered by our competitors;
• changes in budgets and purchasing priorities; and
• reduced need to upgrade existing systems.
Our existing and prospective customers routinely require education regarding the use and benefits of ourproducts. This may also lead to delays in receiving customers’ orders.
We derive a significant portion of our services revenues from a small number of customers. If thesecustomers were to discontinue the usage of our services or delay their implementation our total revenueswould be adversely affected.
We derive a significant portion of our services revenues, and total revenues, from a small number ofcustomers using our services for product enhancement and other optional services. If these customers were todiscontinue or delay the usage of these services, or obtain these services from a competitor, our services revenuesand total revenues would be adversely affected. Customers may delay or terminate implementation of ourservices due to budgetary constraints related to economic uncertainty, dissatisfaction with product quality, thedifficulty of prioritizing numerous information technology projects, changes in business strategy, personnel orpriorities, or for other reasons. Such customers may be less likely to invest in additional software in the futureand to continue to pay for software maintenance. Since our business relies to a large extent upon sales to existingcustomers and since maintenance and services revenues are key elements of our revenue base, any reduction inthese sales or these maintenance and services payments could have a material adverse effect on our business,results of operations, cash flows and financial condition.
Services revenues carry lower gross margins than license revenues and an overall increase in servicesrevenues as a percentage of total revenues could have an adverse impact on our business.
Because our service revenues have lower gross margins than do our license revenues, an increase in thepercentage of total revenues represented by service revenues or a change in the mix between services that areprovided by our employees versus services provided by third-party consultants could have a detrimental impacton our overall gross margins and could adversely affect operating results.
If our customers elect not to renew maintenance contracts after the initial maintenance period and the lossof those customers is not offset by new maintenance customers, our maintenance revenues and totalrevenues would be adversely affected.
Upon the purchase of a software license, our customers typically enter into a maintenance contract with aterm from approximately one to three years. If, after this initial maintenance period, customers elect not to renewtheir maintenance contracts and we do not offset the loss of those customers with new maintenance customers asa result of new license fees, our maintenance revenues and total revenues would be adversely affected.
31

If accounting interpretations relating to revenue recognition change or companies we acquire have appliedsuch standards differently than we do or have not applied them at all, our reported revenues could declineor we could be forced to make changes in our business practices or we may incur the expense and risksassociated with an audit or restatement of the acquired company’s financial statements.
There are several accounting standards and interpretations covering revenue recognition for the softwareindustry. These standards address software revenue recognition matters primarily from a conceptual level and donot include specific implementation guidance. We believe that we currently comply with these standards.
The accounting profession and regulatory agencies continue to discuss various provisions of thesepronouncements with the objective of providing additional guidance on their application and with respect topotential interpretations. These discussions and the issuance of new interpretations could lead to unanticipatedchanges in our current revenue accounting practices, which could change the timing of recognized revenue. Theycould also drive significant adjustments to our business practices which could result in increased administrativecosts, lengthened sales cycles and other changes which could adversely affect our reported revenues and resultsof operations. In addition, companies we acquire may have historically interpreted software revenue recognitionrules differently than we do or may not have been subject to U.S. GAAP as a result of reporting under localGAAP in a foreign country. If we discover that companies we have acquired have interpreted and appliedsoftware revenue recognition rules differently than prescribed by U.S. GAAP, we could be required to devotesignificant management resources, and incur the expense associated with an audit, restatement or otherexamination of the acquired companies’ financial statements.
Our future growth depends upon our ability to develop and sustain relationships with complementaryvendors to market and implement our software products, and failure to develop and sustain theserelationships could have a material adverse effect on our operating performance and financial condition.
We are developing, maintaining and enhancing significant working relationships with complementaryvendors, such as software companies, consulting firms, resellers and others that we believe can play importantroles in marketing our products and solutions. We are currently investing, and intend to continue to invest,significant resources to develop and enhance these relationships, which could adversely affect our operatingmargins. We may be unable to develop relationships with organizations that will be able to market our productseffectively. Our arrangements with these organizations are not exclusive and, in many cases, may be terminatedby either party without cause. Many of the organizations with which we are developing or maintaining marketingrelationships have commercial relationships with our competitors. There can be no assurance that anyorganization will continue its involvement with us and our products. The loss of relationships with importantorganizations could materially and adversely affect our operating performance and financial condition.
Failure to maintain our margins and service rates for implementation services could have a materialadverse effect on our operating performance and financial condition.
A significant portion of our revenues is derived from implementation services. If we fail to scope ourimplementation projects correctly, our services margins may suffer. We bill for implementation servicespredominately on an hourly or daily basis (time and materials) and sometimes under fixed price contracts, and wegenerally recognize revenue from those services as we perform the work. If we are not able to maintain thecurrent service rates for our time and materials implementation services, without corresponding cost reductions,or if the percentage of fixed price contracts increases and we underestimate the costs of our fixed price contracts,our operating performance may suffer. The rates we charge for our implementation services depend on a numberof factors, including the following:
• perceptions of our ability to add value through our implementation services;
• complexity of services performed;
• competition;
32

• pricing policies of our competitors and of systems integrators;
• the use of globally sourced, lower-cost service delivery capabilities within our industry; and
• economic, political and market conditions.
Our past and future acquisitions may not be successful and we may have difficulty integratingacquisitions.
We continually evaluate potential acquisitions of complementary businesses, products and technologies. Wehave in the past acquired and invested, and may continue to acquire or invest, in complementary companies,products and technologies, and enter into joint ventures and strategic alliances with other companies.Acquisitions, joint ventures, strategic alliances, and investments present many risks, and we may not realize thefinancial and strategic goals that were contemplated at the time of any transaction. Risks commonly encounteredin such transactions include:
• the risk that the acquired company or assets may not further our business strategy or that we paid morethan the company or assets were worth;
• the difficulty of assimilating the operations and retaining and motivating personnel of the combinedcompanies;
• the risk that we may not be able to integrate the acquired technologies or products with our currentproducts and technologies;
• the potential disruption of our ongoing business and the diversion of our management’s attention fromother business concerns;
• the inability of management to maximize our financial and strategic position through the successfulintegration of acquired businesses;
• adverse impact on our annual effective tax rate;
• dilution of existing equity holders caused by capital stock issuance to the shareholders of acquiredcompanies or stock option grants to retain employees of the acquired companies;
• difficulty in maintaining controls, procedures and policies;
• potential adverse impact on our relationships with partner companies or third-party providers oftechnology or products;
• the impairment of relationships with employees and customers;
• potential assumption of liabilities of our acquisition targets;
• significant exit or impairment charges if products acquired in business combinations are unsuccessful;and
• issues with product quality, product architecture, legal contingencies, product development issues, orother significant issues that may not be detected through our due diligence process.
Accounting rules require the use of the purchase method of accounting in all new business acquisitions.Many acquisition candidates have significant intangible assets, and an acquisition of these businesses wouldlikely result in significant amounts of goodwill and other intangible assets. The purchase method of accountingfor business combinations may require large write-offs of any in-process research and development costs relatedto companies being acquired, as well as ongoing amortization costs for other intangible assets valued incombinations of companies. Goodwill and certain other intangible assets are not amortized to income, but aresubject to at least annual impairment reviews. If the acquisitions do not perform as planned, future write-offs andcharges to income arising from such impairment reviews could be significant. In addition, these acquisitions
33

could involve acquisition-related charges, such as one-time acquired research and development charges. Suchwrite-offs and ongoing amortization charges may have a significant negative impact on operating margins andnet earnings in the quarter of the combination and for several subsequent years. We may not be successful inovercoming these risks or any other problems encountered in connection with such transactions.
Our business may require additional capital.
We may require additional capital to finance our growth or to fund acquisitions or investments incomplementary businesses, technologies or product lines. Our capital requirements may be influenced by manyfactors, including:
• the demand for our products;
• the timing and extent of our investment in new technology;
• the timing and extent of our acquisition of other companies;
• the level and timing of revenue;
• the expenses of sales and marketing and new product development;
• the success and related expense of increasing our brand awareness;
• the cost of facilities to accommodate a growing workforce;
• the extent to which competitors are successful in developing new products and increasing their marketshares; and
• the costs involved in maintaining and enforcing intellectual property rights.
To the extent that our resources are insufficient to fund our future activities, we may need to raise additionalfunds through public or private financing. However, additional funding, if needed, may not be available on termsattractive to us, or at all. Our inability to raise capital when needed could have a material adverse effect on ourbusiness, operating results and financial condition. If additional funds are raised through the issuance of equitysecurities, the percentage ownership of our company by our current shareholders would be diluted.
Business disruptions could affect our operating results.
A significant portion of our research and development activities and certain other critical businessoperations are concentrated in a few geographic areas. We are a highly automated business and a disruption orfailure of our systems could cause delays in completing sales and providing services. A major earthquake, fire orother catastrophic event that results in the destruction or disruption of any of our critical business or informationtechnology systems could severely affect our ability to conduct normal business operations and, as a result, ourfuture operating results could be materially and adversely affected.
Our international operations and sales subject us to risks associated with unexpected activities outside ofthe United States.
The global reach of our business could cause us to be subject to unexpected, uncontrollable and rapidlychanging events and circumstances in addition to those experienced in locations within the United States. As wegrow our international operations, we may need to recruit and hire new consulting, product development, salesand marketing and support personnel in the countries in which we have or will establish offices. Entry into newinternational markets typically requires the establishment of new marketing and distribution channels, as well asthe development and subsequent support of localized versions of our software. International introductions of ourproducts often require a significant investment in advance of anticipated future revenues. In addition, the openingof a new office typically results in initial recruiting and training expenses and reduced labor efficienciesassociated with the introduction of products to a new market. If we are less successful in a new market than we
34

expect, we may not be able to realize an adequate return on our initial investment and our operating results couldsuffer. We cannot guarantee that the countries in which we operate will have a sufficient pool of qualifiedpersonnel from which to hire, that we will be successful at hiring, training or retaining such personnel or that wecan expand or contract our international operations in a timely, cost-effective manner. If we have to downsizecertain international operations, particularly in Europe, the costs to do so are typically much higher thandownsizing costs in the United States. The following factors, among others, could have an adverse impact on ourbusiness and earnings:
• failure to properly comply with foreign laws and regulations applicable to our foreign activitiesincluding, without limitation, software localization requirements;
• failure to properly comply with U.S. laws and regulations relating to the export of our products andservices;
• compliance with multiple and potentially conflicting regulations in Europe, Asia and North America,including export requirements, tariffs, import duties and other trade barriers, as well as health andsafety requirements;
• difficulties in managing foreign operations and appropriate levels of staffing;
• longer collection cycles;
• tariffs and other trade barriers;
• seasonal reductions in business activities, particularly throughout Europe;
• reduced protection for intellectual property rights in some countries;
• proper compliance with local tax laws which can be complex and may result in unintended adverse taxconsequences;
• anti-American sentiment due to conflicts in the Middle East and other American policies that may beunpopular in certain countries;
• increasing political instability, adverse economic conditions and the potential for war or otherhostilities in many of these countries;
• difficulties in enforcing agreements through foreign legal systems;
• fluctuations in exchange rates that may affect product demand and may adversely affect theprofitability in U.S. Dollars of products and services provided by us in foreign markets where paymentfor our products and services is made in the local currency;
• changes in general economic and political conditions in countries where we operate;
• potential labor strikes, lockouts, work slowdowns and work stoppages at U.S. and international ports;and
• restrictions on downsizing operations in Europe and expenses and delays associated with any suchactivities.
It may become increasingly expensive to obtain and maintain liability insurance.
Our products are often critical to the operations of our customers’ businesses and provide benefits that maybe difficult to quantify. If our products fail to function as required, we may be subject to claims for substantialdamages. Courts may not enforce provisions in our contracts that would limit our liability or otherwise protect usfrom liability for damages. Although we maintain general liability insurance coverage, including coverage forerrors or omissions, this coverage may not continue to be available on reasonable terms or in sufficient amountsto cover claims against us. In addition, our insurer may disclaim coverage as to any future claim. If claimsexceeding the available insurance coverage are successfully asserted against us, or our insurer imposes premiumincreases, large deductibles or co-insurance requirements on us, our business and results of operations could beadversely affected.
35

We contract for insurance to cover a variety of potential risks and liabilities, including those relating to theunexpected failure of our products. In the current market, insurance coverage for all types of risk is becomingmore restrictive, and when insurance coverage is offered, the deductible for which we are responsible is larger. Inlight of these circumstances, it may become more difficult to maintain insurance coverage at historical levels or,if such coverage is available, the cost to obtain or maintain it may increase substantially. This may result in ourbeing forced to bear the burden of an increased portion of risks for which we have traditionally been covered byinsurance, which could negatively impact our results of operations.
Adverse litigation results could affect our business.
We may be subject to various legal proceedings and claims involving customer, shareholder, consumer,competition and other issues on a global basis. Litigation can be lengthy, expensive and disruptive to ouroperations, and results cannot be predicted with certainty. An adverse decision could result in monetary damagesor injunctive relief that could affect our business, operating results or financial condition.
Growth in our operations could increase demands on our managerial and operational resources.
If the scope of our operating and financial systems and the geographic distribution of our operations andcustomers increase dramatically, this may increase demands on our management and operations. Our officers andother key employees will need to implement and improve our operational, customer support and financial controlsystems and effectively expand, train and manage our employee base.
Further, we may be required to manage an increasing number of relationships with various customers andother third parties. We may not be able to manage future expansion successfully, and our inability to do so couldharm our business, operating results and financial condition.
RISK FACTORS RELATED TO OUR PRODUCTS
We may not be successful in convincing customers to migrate to current or future releases of our products,which may lead to reduced services and maintenance revenues and less future business from existingcustomers.
Our customers may not be willing to incur the costs or invest the resources necessary to complete upgradesto current or future releases of our products. This may lead to our loss of services and maintenance revenues andfuture business from customers that continue to operate prior versions of our products or choose to no longer useour products.
We depend on third-party technology which, if it should become unavailable or if it contains defects, couldresult in increased costs or delays in the production and improvement of our products.
We license critical third-party software products that we incorporate into our own software products. We arelikely to incorporate and include additional third-party software into and with our products and solutions as weexpand our product offerings. The operation of our products would be impaired if errors occur in the third-partysoftware that we utilize. It may be more difficult for us to correct any defects in third-party software because thesoftware is not within our control. Accordingly, our business could be adversely affected in the event of anyerrors in this software. There can be no assurance that these third parties will continue to make their softwareavailable to us on acceptable terms, invest the appropriate levels of resources in their products and services tomaintain and enhance the capabilities of their software, or even remain in business. Further, due to the limitednumber of vendors of certain types of third-party software, it may be difficult for us to replace such third-partysoftware if a vendor terminates our license of the software or our ability to license the software to customers. Ifour relations with any of these third-party software providers are impaired, and if we are unable to obtain ordevelop a replacement for the software, our business could be harmed. In addition, if the cost of licensing any ofthese third-party software products significantly increases, our gross margin levels could significantly decrease.
36

The use of open source software in our products may expose us to additional risks and harm ourintellectual property.
Some of our products use or incorporate software that is subject to one or more open source licenses. Opensource software is typically freely accessible, usable and modifiable. Certain open source software licensesrequire a user who intends to distribute the open source software as a component of the user’s software todisclose publicly part or all of the source code to the user’s software. In addition, certain open source softwarelicenses require the user of such software to make any derivative works of the open source code available toothers on unfavorable terms or at no cost. This can subject previously proprietary software to open source licenseterms.
While we monitor the use of all open source software in our products, processes and technology and try toensure that no open source software is used in such a way as to require us to disclose the source code to therelated product or solution, such use could inadvertently occur. Additionally, if a third-party software providerhas incorporated certain types of open source software into software we license from such third party for ourproducts and solutions, we could, under certain circumstances, be required to disclose the source code to ourproducts and solutions. This could harm our intellectual property position and have a material adverse effect onour business, results of operations, cash flow and financial condition.
We may be unable to retain or attract customers if we do not develop new products and enhance ourcurrent products in response to technological changes and competing products.
As a software company, we have been required to migrate our products and services from mainframe tocustomer server to web-based environments. In addition, we have been required to adapt our products toemerging standards for operating systems, databases and other technologies. We will be unable to competeeffectively if we are unable to:
• maintain and enhance our technological capabilities to correspond to these emerging environments andstandards;
• develop and market products and services that meet changing customer needs; or
• anticipate or respond to technological changes on a cost-effective and timely basis.
A substantial portion of our research and development resources is devoted to product upgrades that addressregulatory and support requirements. Only the remainder of our limited research and development resources isavailable for new products. New products require significant development investment. That investment is furtherconstrained because of the added costs of developing new products that work with multiple operating systems ordatabases. We face uncertainty when we develop or acquire new products because there is no assurance that asufficient market will develop for those products. If we do not attract sufficient customer interest in thoseproducts, we will not realize a return on our investment and our operating results will be adversely affected.
Our core products face competition from new or modified technologies that may render our existingtechnology less competitive or obsolete, reducing the demand for our products. As a result, we must continuallyredesign our products to incorporate these new technologies and to adapt our software products to operate on,and comply with evolving industry standards for, hardware and software platforms. Maintaining and upgradingour products to operate on multiple hardware and database platforms reduces our resources for developing newproducts. Because of the increased costs of developing and supporting software products across multipleplatforms, we may need to reduce the number of those platforms. In addition, conflicting new technologiespresent us with difficult choices of which new technologies to adopt. If we fail to anticipate the most popularplatforms, fail to respond adequately to technological developments, or experience significant delays in productdevelopment or introduction, our business and operating results will be negatively impacted.
In addition, to the extent we determine that new technologies and equipment are required to remaincompetitive, the development, acquisition and implementation of such technologies may require us to make
37

significant capital investments. We may not be able to obtain capital for these purposes and investments in newtechnologies may not result in commercially viable products. The loss of revenue and increased costs to us fromsuch changing technologies would adversely affect our business and operating results.
If our products are not able to deliver quick, demonstrable value to our customers, our business could beseriously harmed.
Enterprises are requiring their application software vendors to provide faster returns on their technologyinvestments. We must continue to improve our speed of implementation and the pace at which our productsdeliver value or our competitors may gain important strategic advantages over us. If we cannot successfullyrespond to these market demands, or if our competitors respond more successfully than we do, our business,results of operations and financial condition could be materially and adversely affected.
If we do not maintain software performance across accepted platforms and operating environments, ourlicense and services revenue could be adversely affected.
The markets for our software products are characterized by rapid technological change, evolving industrystandards, changes in customer requirements and frequent new product introductions and enhancements. Wecontinuously evaluate new technologies and implement advanced technology into our products. However, if inour product development efforts we fail to accurately address, in a timely manner, evolving industry standards,new technology advancements or important third-party interfaces or product architectures, sales of our productsand services will suffer.
Market acceptance of new platforms and operating environments may require us to undergo the expense ofdeveloping and maintaining compatible product lines. We can license our software products for use with avariety of popular industry standard relational database management system platforms using differentprogramming languages and underlying databases and architectures. There may be future or existing relationaldatabase platforms that achieve popularity in the marketplace and that may or may not be architecturallycompatible with our software product design. In addition, the effort and expense of developing, testing, andmaintaining software product lines will increase as more hardware platforms and operating systems achievemarket acceptance within our target markets. Moreover, future or existing user interfaces that achieve popularitywithin the business application marketplace may or may not be architecturally compatible with our currentsoftware product design. If we do not achieve market acceptance of new user interfaces that we support, or adaptto popular new user interfaces that we do not support, our sales and revenue may be adversely affected.Developing and maintaining consistent software product performance characteristics across all of thesecombinations could place a significant strain on our resources and software product release schedules, whichcould adversely affect revenues and results of operations.
Our software products and product development are complex, which makes it increasingly difficult toinnovate, extend our product offerings, and avoid costs related to correction of program errors.
The market for our software products is characterized by rapid technological change, evolving industrystandards, changes in customer requirements and frequent new product introductions and enhancements. Forinstance, existing products can become obsolete and unmarketable when vendors introduce products utilizingnew technologies or new industry standards emerge. As a result, it is difficult for us to estimate the life cycles ofour software products. There can be no assurance that we will successfully identify new product opportunities ordevelop and bring new products to the market in a timely and cost-effective manner, or that products, capabilitiesor technologies developed by our competitors will not render our products obsolete. Our future success willdepend in part upon our ability to:
• continue to enhance and expand our core applications;
• continue to sell our products;
• continue to successfully integrate third-party products;
38

• enter new markets and achieve market acceptance; and
• develop and introduce new products that keep pace with technological developments, includingdevelopments related to the Internet, satisfy increasingly sophisticated customer requirements andachieve market acceptance.
Despite testing by us, our software programs, like all software programs generally, may contain a number ofundetected errors or “bugs” when we first introduce them or as new versions are released. We do not discoversome errors until we have installed the product and our customers have used it. Errors may result in the delay orloss of revenues, diversion of software engineering resources, material non-monetary concessions, negativemedia attention, or increased service or warranty costs as a result of performance or warranty claims that couldlead to customer dissatisfaction, resulting in litigation, damage to our reputation, and impaired demand for ourproducts. Correcting bugs may result in increased costs and reduced acceptance of our software products in themarketplace. Further, such errors could subject us to claims from our customers for significant damages, and wecannot assure you that courts would enforce the provisions in our customer agreements that limit our liability fordamages. The effort and expense of developing, testing and maintaining software product lines will increase withthe increasing number of possible combinations of:
• vendor hardware platforms;
• operating systems and updated versions;
• application software products and updated versions; and
• database management system platforms and updated versions.
Developing consistent software product performance characteristics across all of these combinations couldplace a significant strain on our development resources and software product release schedules.
If the open source community expands into enterprise application and supply chain software, our licensefee revenues may decline.
The open source community is comprised of many different formal and informal groups of softwaredevelopers and individuals who have created a wide variety of software and have made that software availablefor use, distribution and modification, often free of charge. Open source software, such as the Linux operatingsystem, has been gaining in popularity among business users. If developers contribute enterprise and supplychain application software to the open source community, and that software has competitive features and scale tosupport business users in our markets, we will need to change our product pricing and distribution strategy tocompete successfully.
Implementation of our products can be complex, time-consuming and expensive, customers may be unableto implement our products successfully, and we may become subject to warranty or product liabilityclaims, which could be costly to resolve and result in negative publicity.
Our products must integrate with the many existing computer systems and software programs of ourcustomers. This can be complex, time-consuming and expensive, and may cause delays in the deployment of ourproducts. Our customers may be unable to implement our products successfully or otherwise achieve the benefitsattributable to our products. Although we test each of our new products and product enhancement releases andevaluate and test the products we obtain through acquisitions before introducing them to the market, there maystill be significant errors in existing or future releases of our software products, with the possible result that wemay be required to expend significant resources in order to correct such errors or otherwise satisfy customerdemands. In addition, defects in our products or difficulty integrating our products with our customers’ systemscould result in delayed or lost revenues, warranty or other claims against us by customers or third parties, adversecustomer reactions and negative publicity about us or our products and services or reduced acceptance of ourproducts and services in the marketplace, any of which could have a material adverse effect on our reputation,business, results of operations and financial condition.
39

An increase in sales of software products that require customization would result in revenue beingrecognized over the term of the contract for those products and could have a material adverse effect onour operating performance and financial condition.
Historically, we generally have been able to recognize software license revenue upon delivery of oursolutions and contract execution. Customers and prospects could ask for unique capabilities in addition to ourcore capabilities to give them a competitive edge in the market place. These instances could cause us torecognize more of our software license revenue on a contract accounting basis over the course of the delivery ofthe solution rather than upon delivery and contract execution. The period between the initial contract and thecompletion of the implementation of our products can be lengthy and is subject to a number of factors (overmany of which we have little or no control) that may cause significant delays. These factors include the size andcomplexity of the overall project. As a result, a shift toward a higher proportion of software license contractsrequiring contract accounting would have a material adverse effect on our operating performance and financialcondition and cause our operating results to vary significantly from quarter to quarter.
We sometimes experience delays in product releases, which can adversely affect our business.
Historically, we have issued significant new releases of our software products periodically, with minorinterim releases issued more frequently. As a result of the complexities inherent in our software, major newproduct enhancements and new products often require long development and testing periods before they arereleased. On occasion, we have experienced delays in the scheduled release dates of new or enhanced products,and we cannot provide any assurance that we will achieve future scheduled release dates. The delay of productreleases or enhancements, or the failure of such products or enhancements to achieve market acceptance, couldmaterially affect our business and reputation.
We may not receive significant revenues from our current research and development efforts forseveral years.
Developing and localizing software is expensive, and the investment in product development may involve along payback cycle. Our future plans include significant investments in software research and development andrelated product opportunities. We believe that we must continue to dedicate a significant amount of resources toour research and development efforts to maintain our competitive position. However, we do not expect to receivesignificant revenues from these investments for several years, if at all.
We have limited protection of our intellectual property and proprietary rights and may potentiallyinfringe third-party intellectual property rights.
We consider certain aspects of our internal operations, software and documentation to be proprietary, andrely on a combination of copyright, trademark and trade secret laws; confidentiality agreements with employeesand third parties; and protective contractual provisions (such as those contained in our license agreements withconsultants, vendors, partners and customers) and other measures to protect this information. Existing copyrightlaws afford only limited protection. We believe that the rapid pace of technological change in the computersoftware industry has made trade secret and copyright protection less significant than factors such as:
• knowledge, ability and experience of our employees;
• frequent software product enhancements;
• customer education; and
• timeliness and quality of support services.
Our competitors may independently develop technologies that are substantially equivalent or superior to ourtechnology. The laws of some countries in which our software products are or may be licensed do not protect oursoftware products and intellectual property rights to the same extent as the laws of the United States.
40

We generally enter into confidentiality or license agreements with our employees, customers, consultants,and vendors. These agreements control access to and distribution of our software, documentation, and otherproprietary information. Despite our efforts to protect our proprietary rights, unauthorized parties may copyaspects of our products, obtain and use information that we regard as proprietary, or develop similar technologythrough reverse engineering or other means. Preventing or detecting unauthorized use of our products is difficult.There can be no assurance that the steps we take will prevent misappropriation of our technology or that ourlicense agreements will be enforceable. In addition, we may resort to litigation to enforce our intellectualproperty rights, protect our trade secrets, determine the validity and scope of others’ proprietary rights, or defendagainst claims of infringement or invalidity in the future. Such litigation could result in significant costs or thediversion of resources. This could materially and adversely affect our business, operating results and financialcondition.
Third parties may assert infringement claims against us. Although we do not believe that our productsinfringe on the proprietary rights of third parties, we cannot guarantee that third parties will not assert orprosecute infringement or invalidity claims against us. These assertions could distract management, require us toenter into royalty arrangements, and result in costly and time-consuming litigation, including damage awards.Such assertions or the defense of such claims may materially and adversely affect our business, operating results,or financial condition. In addition, such assertions could result in injunctions against us. Injunctions that preventus from distributing our products would have a material adverse effect on our business, operating results, andfinancial condition. If third parties assert such claims against us, we may seek to obtain a license to use suchintellectual property rights. There can be no assurance that such a license would be available on commerciallyreasonable terms. If a patent claim against us were successful and we could not obtain a license on acceptableterms or license a substitute technology or redesign to avoid infringement, we may be prevented fromdistributing our software or required to incur significant expense and delay in developing non-infringingsoftware.
We may experience liability claims arising out of the licensing of our software and provision of services.
Our agreements normally contain provisions designed to limit our exposure to potential liability claims andgenerally exclude consequential and other forms of extraordinary damages. However, these provisions could berendered ineffective, invalid or unenforceable by unfavorable judicial decisions or by federal, state, local orforeign laws or ordinances. For example, we may not be able to avoid or limit liability for disputes relating toproduct performance or the provision of services. If a claim against us were to be successful, we may be requiredto incur significant expense and pay substantial damages, including consequential or punitive damages, whichcould have a material adverse effect on our business, operating results and financial condition. Even if we prevailin contesting such a claim, the accompanying publicity could adversely affect the demand for our products andservices.
We also rely on certain technology that we license from third parties, including software that is integratedwith our internally developed software. Although these third parties generally indemnify us against claims thattheir technology infringes on the proprietary rights of others, such indemnification is not always available for alltypes of intellectual property. Often such third-party indemnifiers are not well capitalized and may not be able toindemnify us in the event that their technology infringes on the proprietary rights of others. As a result, we mayface substantial exposure if technology we license from a third party infringes on another party’s proprietaryrights. Defending such infringement claims, regardless of their validity, could result in significant cost anddiversion of resources.
Concerns that our products do not adequately protect the privacy of consumers could inhibit sales of ourproducts.
One of the features of our software applications is the ability to develop and maintain profiles of customersfor use by businesses. Typically, these products capture profile information when customers and employees visitan Internet web site and volunteer information in response to survey questions concerning their backgrounds,
41

interests and preferences. Our products augment these profiles over time by collecting usage data. Although wehave designed our products to operate with applications that protect user privacy, privacy concerns maynevertheless cause visitors to resist providing the personal data necessary to support this profiling capability. Ifwe cannot adequately address customers’ privacy concerns, these concerns could seriously harm our business,financial condition and operating results.
We face risks associated with the security of our products.
Maintaining the security of computers and computer networks is an issue of critical importance for ourcustomers. Attempts by experienced computer programmers, or hackers, to penetrate client network security orthe security of web sites to misappropriate confidential information have become an industry-wide phenomenonthat affects computers and networks across all platforms. We have included security features in certain of ourInternet browser-enabled products that are intended to protect the privacy and integrity of customer data. Inaddition, some of our software applications use encryption technology to provide the security necessary to affectthe secure exchange of valuable and confidential information. Despite these security features, our products maybe vulnerable to break-ins and similar problems caused by Internet users, which could jeopardize the security ofinformation stored in and transmitted through the computer systems of our customers. Actual or perceivedsecurity vulnerabilities in our products (or the Internet in general) could lead some customers to seek to reduce ordelay future purchases or to purchase competitors’ products which are not Internet-based applications. Customersmay also increase their spending to protect their computer networks from attack, which could delay adoption ofnew technologies. Any of these actions by customers and the cost of addressing such security problems may havea material adverse effect on our business.
Although our license agreements with our customers contain provisions designed to limit our exposure as aresult of the situations listed above, such provisions may not be effective. Existing or future federal, state, orlocal laws or ordinances or unfavorable judicial decisions could affect their enforceability. To date, we have notexperienced any such product liability claims, but there can be no assurance that this will not occur in the future.Because our products are used in essential business applications, a successful product liability claim could have amaterial adverse effect on our business, operating results, and financial condition. Additionally, defending such asuit, regardless of its merits, could entail substantial expense and require the time and attention of keymanagement.
RISK FACTORS RELATED TO OUR PERSONNEL
We are dependent upon key personnel, and need to attract and retain highly qualified personnel in allareas.
Our future operating results depend significantly upon the continued service of a relatively small number ofkey senior management and technical personnel, including our Chief Executive Officer, J. Michael Edenfield.None of our key personnel are bound by long-term employment agreements. We do not have in place “keyperson” life insurance policies on any of our employees. The loss of Mr. Edenfield or one or more other keyexecutives could have an adverse effect on us.
Our future success also depends on our continuing ability to attract, train, retain and motivate other highlyqualified managerial and technical personnel. Competition for these personnel is intense, and we have at timesexperienced difficulty in recruiting and retaining qualified personnel, including sales and marketingrepresentatives, qualified software engineers involved in ongoing product development, and personnel who assistin the implementation of our products and provide other services. The market for such individuals is competitive.For example, it has been particularly difficult to attract and retain product development personnel experienced inobject oriented development technologies. Given the critical roles of our sales, product development andconsulting staffs, our inability to recruit successfully or any significant loss of key personnel would adverselyaffect us. A high level of employee mobility and aggressive recruiting of skilled personnel characterizes thesoftware industry. It may be particularly difficult to retain or compete for skilled personnel against larger, better-
42

known software companies. We cannot guarantee that we will be able to retain our current personnel, attract andretain other highly qualified technical and managerial personnel in the future, or assimilate the employees fromany acquired businesses. We will continue to adjust the size and composition of our workforce to match thedifferent product and geographic demand cycles. If we are unable to attract and retain the necessary technical andmanagerial personnel, or assimilate the employees from any acquired businesses, our business, operating resultsand financial condition would be adversely affected.
The failure to attract, train, retain and effectively manage employees could negatively impact ourdevelopment and sales efforts and cause a degradation of our customer service. In particular, the loss of salespersonnel could lead to lost sales opportunities because it can take several months to hire and train replacementsales personnel. If our competitors increase their use of non-compete agreements, the pool of available sales andtechnical personnel may further narrow in certain areas, even if the non-compete agreements ultimately prove tobe unenforceable. We may grant large numbers of stock options to attract and retain personnel, which could behighly dilutive to our shareholders. The volatility or lack of positive performance of our stock price mayadversely affect our ability to retain or attract employees. The loss of key management and technical personnel orthe inability to attract and retain additional qualified personnel could have an adverse effect on us.
We periodically have restructured our sales force, which can be disruptive.
We continue to rely heavily on our direct sales force. Periodically, we have restructured or made otheradjustments to our sales force in response to factors such as product changes, geographical coverage and otherinternal considerations. Change in the structures of the sales force and sales force management can result intemporary lack of focus and reduced productivity that may affect revenues in one or more quarters. Futurerestructuring of our sales force could occur, and if so we may again experience the adverse transition issuesassociated with such restructuring.
RISK FACTORS RELATED TO OUR CORPORATE STRUCTURE AND GOVERNANCE
Our business is subject to changing regulation of corporate governance and public disclosure that hasincreased both our costs and the risk of noncompliance.
Because our common stock is publicly traded, we are subject to certain rules and regulations of federal, stateand financial market exchange entities charged with the protection of investors and the oversight of companieswhose securities are publicly traded. These entities, including the Public Company Accounting Oversight Board,the Securities and Exchange Commission and NASDAQ, have issued new requirements and regulations andcontinue to develop additional regulations and requirements in response to laws enacted recently by Congress,most notably the Sarbanes-Oxley Act of 2002. Our efforts to comply with these new regulations have resulted in,and are likely to continue to result in, increased general and administrative expenses and a diversion ofmanagement time and attention from revenue-generating activities to compliance activities.
In particular, our efforts to comply with Section 404 of the Sarbanes-Oxley Act of 2002 and the relatedregulations regarding our required assessment of our internal control over financial reporting and ourindependent public accounting firm’s audit of that assessment have required, and continue to require, thecommitment of significant financial and managerial resources. Moreover, because these laws, regulations andstandards are subject to varying interpretations, their application in practice may evolve over time as newguidance becomes available. This evolution may result in continuing uncertainty regarding compliance mattersand additional costs necessitated by ongoing revisions to our disclosure and governance practices. Over time, wehave made significant changes in, and may consider making additional changes to, our internal controls, ourdisclosure controls and procedures, and our corporate governance policies and procedures. Any system ofcontrols, however well designed and operated, is based in part on certain assumptions and can provide onlyreasonable, and not absolute, assurances that the objectives of the system are met. Any failure of our controls,policies and procedures could have a material adverse effect on our business, results of operations, cash flow andfinancial condition.
43
If in the future we are unable to assert that our internal control over financial reporting is effective as of the endof the then current fiscal year (or if our independent registered public accounting firm is unable to express anopinion on the effectiveness of our internal controls over financial reporting), we could lose investor confidencein the accuracy and completeness of our financial reports, which would have a negative market reaction.
Our principal shareholders may control our management decisions.
James C. Edenfield, Executive Chairman, Treasurer and a Director of the Company, and ThomasL. Newberry, Chairman of the Board of Directors, own 100% of our outstanding Class B common sharesbetween them, giving them the right to elect a majority of the Board of Directors. Moreover, Class B commonshares have additional voting rights that currently give Mr. Edenfield and Dr. Newberry sufficient voting powerto assure the approval of other shareholder voting issues if both of them vote in favor of those issues.Mr. Edenfield and Dr. Newberry have reported in filings with the Securities and Exchange Commission that theyconstitute a group, for voting purposes. Current directors and executive officers as a group beneficially ownedapproximately 7.6% of our Class A common shares as of June 30, 2013. Mr. Edenfield, Dr. Newberry andmembers of their immediate families currently constitute four of the seven members of the Board, and thus havesignificant influence in directing the actions of the Board of Directors and all other matters requiring approval oracquiescence by shareholders, including the composition of our Board of Directors, the approval of mergers andother business combinations, amendments to our certificate of incorporation, a substantial sale of assets, a mergeror similar corporate transaction or a non-negotiated takeover attempt. Such concentration of ownership maydiscourage a potential acquirer from making a purchase offer that other shareholders might find favorable, whichin turn could adversely affect the market price of our common stock.
Our articles of incorporation and bylaws and Georgia law may inhibit a takeover of our company.
Our basic corporate documents and Georgia law contain provisions that might enable our management toresist a takeover. These provisions might discourage, delay or prevent a change in the control or a change in ourmanagement. These provisions could also discourage proxy contests and make it more difficult for you and othershareholders to elect directors and take other corporate actions. The existence of these provisions could also limitthe price that investors might be willing to pay in the future for shares of our common stock.
We are a “controlled company” within the meaning of NASDAQ rules and, as a result, qualify for, andrely on, exemptions from certain corporate governance requirements.
Because our Class B shareholders own a controlling interest and act as a group, we are a “controlledcompany” within the meaning of the rules governing companies with stock quoted on the NASDAQ GlobalSelect Market. Under these rules, a company of which more than 50% of the voting power is held by anindividual, a group or another company is a “controlled company” and is exempt from certain corporategovernance requirements, including requirements that (1) a majority of the board of directors consist ofindependent directors, (2) compensation of officers be determined or recommended to the board of directors by amajority of its independent directors or by a compensation committee that is composed entirely of independentdirectors and (3) director nominees be selected or recommended for selection by a majority of the independentdirectors or by a nominating committee composed solely of independent directors. Our Board of Directors doesnot have a majority of independent directors, and our compensation committee is not required to consist entirelyof independent directors. We are not required to have, and have not chosen to establish, a nominating committee.Accordingly, our procedures for approving significant corporate decisions are not subject to the same corporategovernance requirements as non-controlled companies with stock quoted on the NASDAQ Global Select Market.
44
RISK FACTORS RELATED TO OUR STOCK PRICE
We could experience fluctuations in quarterly operating results that could adversely affect our stock price.
We have difficulty predicting our actual quarterly operating results, which have varied widely in the pastand which we expect to continue to vary in the future. We expect they will continue to vary significantly fromquarter to quarter due to a number of factors, many of which are outside our control. We base our expense levels,operating costs and hiring plans on projections of future revenues, and it is difficult for us to rapidly adjust whenactual results do not match our projections. If our quarterly revenue or operating results fall below theexpectations of investors or public market analysts, the price of our common stock could fall substantially.License revenues in any quarter depend substantially on the combined contracting activity of the AmericanSoftware group of companies and our ability to recognize revenues in that quarter in accordance with our revenuerecognition policies. Our contracting activity is difficult to forecast for a variety of reasons, including thefollowing:
• we complete a significant portion of our license agreements within the last few weeks of each quarter;
• our sales cycle for products and services, including multiple levels of authorization required by somecustomers, is relatively long and variable because of the complex and mission-critical nature of ourproducts;
• the demand for our products and services can vary significantly;
• the size of our license transactions can vary significantly;
• the possibility of adverse global political conditions and economic downturns, both domestic andinternational, characterized by decreased product demand, price erosion, technological shifts, workslowdowns and layoffs, may substantially reduce customer demand and contracting activity;
• customers may unexpectedly postpone or cancel anticipated system replacement or new systemevaluation and implementation due to changes in their strategic priorities, project objectives, budgetaryconstraints, internal purchasing processes or company management;
• customer evaluations and purchasing processes vary from company to company, and a customer’sinternal approval and expenditure authorization process can be difficult and time-consuming, even afterselection of a vendor; and
• the number, timing and significance of software product enhancements and new software productannouncements by us and by our competitors may affect purchase decisions.
Variances or slowdowns in our licensing activity in prior quarters may affect current and future consulting,training and maintenance revenues, since these revenues typically follow license fee revenues. Our ability tomaintain or increase services revenues primarily depends on our ability to increase the number and size of ourlicensing agreements. In addition, we base our budgeted operating costs and hiring plans primarily on ourprojections of future revenues. Because most of our expense levels are relatively fixed, including employeecompensation and rent in the near term, if our actual revenues fall below projections in any particular quarter, ourbusiness, operating results, and financial condition could be materially and adversely affected. In addition, ourexpense levels are based, in part, on our expectations regarding future revenue increases. As a result, anyshortfall in revenue in relation to our expectations could cause significant changes in our operating results fromquarter to quarter and could result in quarterly losses. As a result of these factors, we believe that period-to-period comparisons of our revenue levels and operating results are not necessarily meaningful. As a result,predictions of our future performance should not be based solely on our historical quarterly revenue andoperating results.
45
Our stock price is volatile and there is a risk of litigation.
The trading price of our common stock has been in the past and may in the future be subject to widefluctuations in response to factors such as the following:
• general market conditions;
• revenue or results of operations in any quarter failing to meet the expectations, published or otherwise,of the investment community;
• customer order deferrals resulting from the anticipation of new products, economic uncertainty,disappointing operating results by the customer, management changes, corporate reorganizations orotherwise;
• reduced investor confidence in equity markets, due in part to corporate collapses in recent years;
• speculation in the press or analyst community;
• wide fluctuations in stock prices, particularly with respect to the stock prices for other technologycompanies;
• announcements of technological innovations by us or our competitors;
• new products or the acquisition or loss of significant customers by us or our competitors;
• developments with respect to our copyrights or other proprietary rights or those of our competitors;
• changes in interest rates;
• changes in investors’ beliefs as to the appropriate price-earnings ratios for us and our competitors;
• changes in recommendations or financial estimates by securities analysts who track our common stockor the stock of other software companies;
• changes in management;
• sales of common stock by our controlling shareholders, directors and executive officers;
• rumors or dissemination of false or misleading information, particularly through Internet chat rooms,instant messaging, and other rapid-dissemination methods;
• conditions and trends in the software industry generally;
• the announcement of acquisitions or other significant transactions by us or our competitors;
• adoption of new accounting standards affecting the software industry;
• domestic or international terrorism and other factors; and
• the other factors described in these “Risk Factors.”
Fluctuations in the price of our common stock may expose us to the risk of securities class action lawsuits.Although no such lawsuits are currently pending against us and we are not aware that any such lawsuit isthreatened to be filed in the future, there is no assurance that we will not be sued based on fluctuations in theprice of our common stock. Defending against such lawsuits could result in substantial cost and divertmanagement’s attention and resources. In addition, any settlement or adverse determination of these lawsuitscould subject us to significant liabilities.
Our dividend policy is subject to change.
From the second quarter of fiscal 2008 through the second quarter of fiscal 2013, our Board of Directorsdeclared quarterly dividends of $0.09 per share. For the third quarter of fiscal 2013, our Board of Directorsdeclared a quarterly dividend of $0.10 per share and also declared a special accelerated dividend of $0.20 per
46
share of our Class A and Class B common stock. The accelerated dividend was intended to be in lieu of theregular quarterly dividends that have historically been declared in February and May of each year. We currentlyexpect to declare and pay cash dividends at this level on a quarterly basis in the future following the periods paidby the special accelerated dividend. However, our dividend policy may be affected by, among other things, ourviews on business conditions, our financial position, earnings, earnings outlook, capital spending plans and otherfactors that our Board of Directors considers relevant at that time. Our dividend policy may change from time totime, and we cannot provide assurance that we will continue to declare dividends at all or in any particularamounts. A change in our dividend policy could have a negative effect on the market price of our common stock.
The price of our common stock may decline due to shares eligible for future sale or actual future sales ofsubstantial amounts of our common stock.
Sales of substantial amounts of our common stock in the public market, or the perception that such salesmay occur, could cause the market price of our common stock to decline. Current directors and executive officersof the Company as a group beneficially owned approximately 7.6% of our Class A common shares as of June 30,2013. Sales of substantial amounts of our common stock in the public market by these persons, or the perceptionthat such sales may occur, could cause the market price of our common stock to decline and could impair ourability to raise capital through the sale of additional equity securities.
ITEM 1B. UNRESOLVED STAFF COMMENTS
None.
ITEM 2. PROPERTIES
Our corporate headquarters are located in an approximately 100,000 square foot office building that we ownat 470 East Paces Ferry Road, N.E., Atlanta, Georgia. We also own a four-story 42,000 square foot building at3110 Maple Drive, a one-story 1,400 square foot building at 3116 Maple Drive and a one-story 14,000 squarefoot building at 3120 Maple Drive, each in Atlanta, Georgia.
We have entered into leases for sales offices located in various cities in the United States and overseas. Webelieve our existing facilities are adequate for our current needs and that suitable additional or substitute spacewill be available as needed on commercially reasonable terms.
Each of our three segments makes use of the property at 470 East Paces Ferry Road and our SCM segmentoccupies office space that we lease in the United Kingdom.
ITEM 3. LEGAL PROCEEDINGS
(a) Many of our installations involve products that are critical to the operations of our customers’businesses. Any failure in our products could result in a claim for substantial damages against us,regardless of our responsibility for such failure. Although we attempt to limit contractually our liabilityfor damages arising from product failures or negligent acts or omissions, there can be no assurance thatthe limitations of liability contained in our contracts will be enforceable in all instances. We are notcurrently a party to any material legal proceedings that would require disclosure under this Item.
(b) None.
ITEM 4. MINE SAFETY DISCLOSURES
Not applicable.
47

PART II
ITEM 5. MARKET FOR REGISTRANT’S COMMON EQUITY, RELATED STOCKHOLDERMATTERS, AND ISSUER PURCHASES OF EQUITY SECURITIES
Trading Market
Our Class A Common Shares are listed on the NASDAQ Global Select Market under the symbol AMSWA.As of July 5, 2013, there were 8,411 holders of Class A Common Shares who held their stock either individuallyor in nominee or “street” names through various brokerage firms, and two holders of Class B Common Shares.
Market Price Information
The table below presents the quarterly high and low sales prices for American Software, Inc. Class Acommon stock as reported by NASDAQ, for the Company’s last two fiscal years, as well as the amount of cashdividends declared in each quarter:
High Low
CashDividendsDeclared
Fiscal Year 2013First Quarter . . . . . . . . . . . . . . . . . . . . . . . . . . . . . . . . . . . . . . . . . . . . . . . . . . . . . . . . . . . $8.64 $7.82 $0.09Second Quarter . . . . . . . . . . . . . . . . . . . . . . . . . . . . . . . . . . . . . . . . . . . . . . . . . . . . . . . . 9.00 7.95 0.09Third Quarter . . . . . . . . . . . . . . . . . . . . . . . . . . . . . . . . . . . . . . . . . . . . . . . . . . . . . . . . . . 8.70 7.29 0.30Fourth Quarter . . . . . . . . . . . . . . . . . . . . . . . . . . . . . . . . . . . . . . . . . . . . . . . . . . . . . . . . . 8.82 7.88 —
Fiscal Year 2012First Quarter . . . . . . . . . . . . . . . . . . . . . . . . . . . . . . . . . . . . . . . . . . . . . . . . . . . . . . . . . . . $8.90 $7.01 $0.09Second Quarter . . . . . . . . . . . . . . . . . . . . . . . . . . . . . . . . . . . . . . . . . . . . . . . . . . . . . . . . 8.52 6.13 0.09Third Quarter . . . . . . . . . . . . . . . . . . . . . . . . . . . . . . . . . . . . . . . . . . . . . . . . . . . . . . . . . . 9.80 7.42 0.09Fourth Quarter . . . . . . . . . . . . . . . . . . . . . . . . . . . . . . . . . . . . . . . . . . . . . . . . . . . . . . . . . 9.55 8.05 0.09
Equity Compensation Plans
The following table discloses information regarding the Company’s equity compensation plans as ofApril 30, 2013:
Plan Category
Number of Securities to beissued upon exercise ofoutstanding options,warrants and rights
Weighted-Averageexercise price of
outstanding options,warrants and rights
Number of securitiesremaining available forfuture issuance under
equity compensation plans(excluding securities
reflected in the first column)
Equity Compensation Plans approved bysecurity holders . . . . . . . . . . . . . . . . . . 3,751,180 $7.12 433,143
Dividend Policy
Since the third quarter of fiscal 2013, our Board of Directors has declared quarterly dividends of $0.10 pershare. We currently expect to declare and pay cash dividends at this level on a quarterly basis in the future. Thecontinuation of this policy, and payment of future cash dividends, will be at the sole discretion of the Board ofDirectors. In exercising this discretion, the Board of Directors will consider our profitability, financial condition,cash requirements, future prospects and other relevant factors.
48
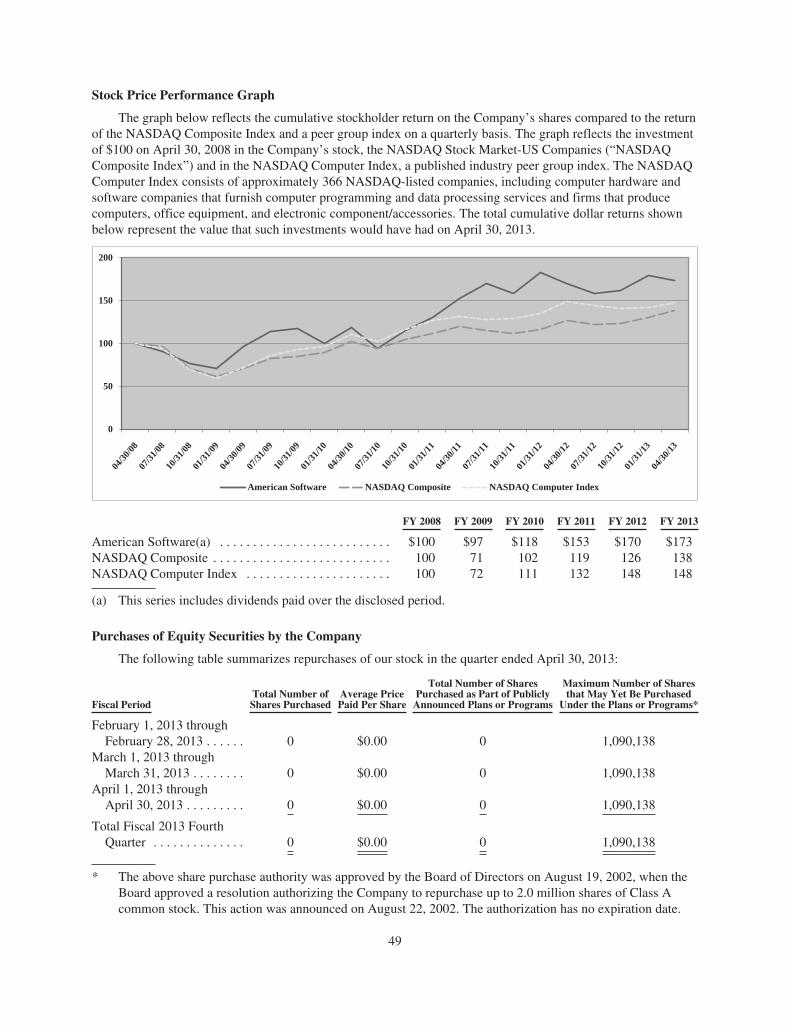
Stock Price Performance Graph
The graph below reflects the cumulative stockholder return on the Company’s shares compared to the returnof the NASDAQ Composite Index and a peer group index on a quarterly basis. The graph reflects the investmentof $100 on April 30, 2008 in the Company’s stock, the NASDAQ Stock Market-US Companies (“NASDAQComposite Index”) and in the NASDAQ Computer Index, a published industry peer group index. The NASDAQComputer Index consists of approximately 366 NASDAQ-listed companies, including computer hardware andsoftware companies that furnish computer programming and data processing services and firms that producecomputers, office equipment, and electronic component/accessories. The total cumulative dollar returns shownbelow represent the value that such investments would have had on April 30, 2013.
04/30
/0807
/31/08
10/31
/0801
/31/09
04/30
/0907
/31/09
10/31
/0901
/31/10
04/30
/1007
/31/10
10/31
/1001
/31/11
04/30
/1107
/31/11
10/31
/1101
/31/12
04/30
/1207
/31/12
10/31
/1201
/31/13
04/30
/13
0
50
100
150
200
American Software NASDAQ Composite NASDAQ Computer Index
FY 2008 FY 2009 FY 2010 FY 2011 FY 2012 FY 2013
American Software(a) . . . . . . . . . . . . . . . . . . . . . . . . . . $100 $97 $118 $153 $170 $173NASDAQ Composite . . . . . . . . . . . . . . . . . . . . . . . . . . . 100 71 102 119 126 138NASDAQ Computer Index . . . . . . . . . . . . . . . . . . . . . . 100 72 111 132 148 148
(a) This series includes dividends paid over the disclosed period.
Purchases of Equity Securities by the Company
The following table summarizes repurchases of our stock in the quarter ended April 30, 2013:
Fiscal PeriodTotal Number ofShares Purchased
Average PricePaid Per Share
Total Number of SharesPurchased as Part of PubliclyAnnounced Plans or Programs
Maximum Number of Sharesthat May Yet Be Purchased
Under the Plans or Programs*
February 1, 2013 throughFebruary 28, 2013 . . . . . . 0 $0.00 0 1,090,138
March 1, 2013 throughMarch 31, 2013 . . . . . . . . 0 $0.00 0 1,090,138
April 1, 2013 throughApril 30, 2013 . . . . . . . . . 0 $0.00 0 1,090,138
Total Fiscal 2013 FourthQuarter . . . . . . . . . . . . . . 0 $0.00 0 1,090,138
* The above share purchase authority was approved by the Board of Directors on August 19, 2002, when theBoard approved a resolution authorizing the Company to repurchase up to 2.0 million shares of Class Acommon stock. This action was announced on August 22, 2002. The authorization has no expiration date.
49

Transfer Agent
American Stock Transfer & Trust Company LLC6201 15th Ave.Brooklyn, NY 11219Toll free: (800) 937-5449Local & international: (718) 921-8124http://www.amstock.com
Inquiries regarding stock transfers, lost certificates or address changes should be directed to the aboveaddress.
Market Makers
The following firms make a market in the Class A common shares of American Software, Inc:
Archipelago Stock Exchange Maxim Group LLCAutomated Trading Desk Merrill Lynch, Pierce, FennerBarclays Capital Inc./Le Morgan Stanley & CO. LLCBats Trading, Inc. NASDAQ Execution Services LLCCanaccord Genuity Inc. National Stock ExchangeCantor, Fitzgerald & Co. Needham & Company, LLCChicago Board Options Exchange Pershing Advisor Solution LLCCitadel Derivatives Group LLC RBC Capital Markets, LLCCitadel Securities LLC Riley & Co.Citigroup Global Markets Inc. Stifel Nicolaus & Co.Credit Suisse Securities USA SunTrust Capital Markets IncDirect Edge ECN LLC Susquehanna Capital GroupG1 Execution Services LLC Susquehanna Financial Group,Goldman, Sachs & Co. Timber Hill Inc.Jefferies & Company, Inc. Two Sigma Securities, LLCKnight Capital Americas, L.P. UBS Securities LLCLatour Trading LLC
50

ITEM 6. SELECTED CONSOLIDATED FINANCIAL DATA
The selected consolidated financial data presented below as of and for the years ended April 30, 2013, 2012,2011, 2010, and 2009 is derived from our audited consolidated financial statements.
Consolidated Statements of Operations Data:
Years Ended April 30,
2013 2012 2011 2010 2009
(In thousands, except per share data)Revenues:
License fees . . . . . . . . . . . . . . . . . . . . . . . . . . . . . . . . . . . . . . . $ 21,184 $ 27,826 $ 19,240 $15,503 $ 16,073Services and other . . . . . . . . . . . . . . . . . . . . . . . . . . . . . . . . . . 45,323 42,380 36,960 32,298 33,920Maintenance . . . . . . . . . . . . . . . . . . . . . . . . . . . . . . . . . . . . . . . 33,960 32,430 29,389 27,475 28,031
Total revenues . . . . . . . . . . . . . . . . . . . . . . . . . . . . . . . . . 100,467 102,636 85,589 75,276 78,024
Cost of revenues:License fees . . . . . . . . . . . . . . . . . . . . . . . . . . . . . . . . . . . . . . . 6,026 7,142 5,828 3,374 4,908Services and other . . . . . . . . . . . . . . . . . . . . . . . . . . . . . . . . . . 31,870 31,101 27,205 22,797 22,963Maintenance . . . . . . . . . . . . . . . . . . . . . . . . . . . . . . . . . . . . . . . 7,664 7,597 7,152 6,803 7,253
Total cost of revenues . . . . . . . . . . . . . . . . . . . . . . . . . . . . 45,560 45,840 40,185 32,974 35,124
Gross margin . . . . . . . . . . . . . . . . . . . . . . . . . . . . . . . . . . . . . . . . . . 54,907 56,796 45,404 42,302 42,900Operating expenses:
Research and development costs . . . . . . . . . . . . . . . . . . . . . . . 8,882 8,226 7,388 6,722 7,150Sales and marketing expense . . . . . . . . . . . . . . . . . . . . . . . . . . 19,829 18,797 15,720 15,045 14,979General and administrative expenses . . . . . . . . . . . . . . . . . . . . 11,911 13,070 12,200 12,841 13,231Amortization of acquisition-related intangibles . . . . . . . . . . . . 501 535 684 395 350Severance expenses . . . . . . . . . . . . . . . . . . . . . . . . . . . . . . . . . — — 219 — —
Total operating expenses . . . . . . . . . . . . . . . . . . . . . . . . . 41,123 40,628 36,211 35,003 35,710
Operating income . . . . . . . . . . . . . . . . . . . . . . . . . . . . . . . . . . . . . . . 13,784 16,168 9,193 7,299 7,190Other income/(loss), net . . . . . . . . . . . . . . . . . . . . . . . . . . . . . . . . . . 1,741 1,103 1,941 1,929 (1,054)
Earnings before income taxes . . . . . . . . . . . . . . . . . . . . . . . . . . . . . . 15,525 17,271 11,134 9,228 6,136Income tax expense . . . . . . . . . . . . . . . . . . . . . . . . . . . . . . . . . . . . . (5,114) (5,928) (3,770) (3,434) (2,400)
Net earnings . . . . . . . . . . . . . . . . . . . . . . . . . . . . . . . . . . . . . . . $ 10,411 $ 11,343 $ 7,364 $ 5,794 $ 3,736
Less net earnings attributable to noncontrolling interests . . . . . . . . — — — (90) (720)
Net earnings attributable to American Software, Inc. . . . . . . . $ 10,411 $ 11,343 $ 7,364 $ 5,704 $ 3,016
Earnings per common share:(a)Basic . . . . . . . . . . . . . . . . . . . . . . . . . . . . . . . . . . . . . . . . . . . . . $ 0.38 $ 0.43 $ 0.29 $ 0.23 $ 0.12
Diluted . . . . . . . . . . . . . . . . . . . . . . . . . . . . . . . . . . . . . . . . . . . $ 0.38 $ 0.42 $ 0.28 $ 0.22 $ 0.12
Weighted average common shares—Basic . . . . . . . . . . . . . . . . . . . 27,173 26,455 25,751 25,318 25,327Diluted . . . . . . . . . . . . . . . . . . . . . . . . . . . . . . . . . . . . . . . . . . . 27,629 27,098 26,183 25,881 25,756
Cash dividends declared . . . . . . . . . . . . . . . . . . . . . . . . . . . . . . . . . . $ 0.48 $ 0.36 $ 0.36 $ 0.36 $ 0.36
Consolidated Balance Sheet Data:Cash and cash equivalents . . . . . . . . . . . . . . . . . . . . . . . . . . . . $ 41,164 $ 39,111 $ 23,928 $21,730 $ 37,629Investments—short and long term . . . . . . . . . . . . . . . . . . . . . . $ 25,260 $ 27,759 $ 31,483 $32,149 $ 33,465Working capital . . . . . . . . . . . . . . . . . . . . . . . . . . . . . . . . . . . . $ 51,088 $ 50,109 $ 36,721 $29,128 $ 45,432Total assets . . . . . . . . . . . . . . . . . . . . . . . . . . . . . . . . . . . . . . . . $113,070 $116,553 $104,832 $97,175 $112,319American Software, Inc. shareholders’ equity . . . . . . . . . . . . . $ 83,244 $ 83,030 $ 74,056 $72,280 $ 79,839
(a) Basic per share amounts are the same for Class A and Class B shares. Diluted per share amounts for Class A shares areshown above. Diluted per share for Class B shares under the two-class method are $0.38, $0.43, $0.29, $0.23, and $0.12for the years ended April 30, 2013, 2012, 2011, 2010, and 2009, respectively. See Note 1(r) to the Consolidated FinancialStatements.
51

ITEM 7. MANAGEMENT’S DISCUSSION AND ANALYSIS OF FINANCIAL CONDITION ANDRESULTS OF OPERATIONS
The following discussion and analysis should be read in conjunction with “Item 6. Selected Financial Data”and “Item 8. Financial Statements and Supplementary Data”. This discussion contains forward-lookingstatements relating to our future financial performance, business strategy, financing plans and other futureevents that involve uncertainties and risks. You can identify these statements by forward-looking words such as“anticipate,” “intend,” “plan,” “continue,” “could,” “grow,” “may,” “potential,” “predict,” “strive,”“estimate,” “believe,” “expect” and similar expressions that convey uncertainty of future events or outcomes.Any forward-looking statements herein are made pursuant to the safe harbor provision of the Private SecuritiesLitigation Reform Act of 1995. Our actual results could differ materially from the results anticipated by theseforward-looking statements as a result of many known and unknown factors that are beyond our ability to controlor predict, including but not limited to those discussed above in “Risk Factors” and elsewhere in this report. Seealso “Special Cautionary Notice Regarding Forward-Looking Statements” at the beginning of “Item 1.Business.”
CRITICAL ACCOUNTING POLICIES AND ESTIMATES
We have based the following discussion and analysis of financial condition and results of operations on ourconsolidated financial statements, which we have prepared in accordance with U.S. generally acceptedaccounting principles. The preparation of these financial statements requires management to make estimates andassumptions that affect the reported amounts of assets and liabilities, and disclosures of contingent assets andliabilities at the date of the financial statements and the reported amounts of revenues and expenses during thereporting period. Note 1 to the Consolidated Financial Statements for the fiscal year ended April 30, 2013,describes the significant accounting policies that we have used in preparing our financial statements. On anongoing basis, we evaluate our estimates, including, but not limited to, those related to revenue/vendor-specificobjective evidence (VSOE), bad debts, capitalized software costs, goodwill, intangible asset impairment, stock-based compensation, income taxes and contingencies. We base our estimates on historical experience and onvarious other assumptions that we believe to be reasonable under the circumstances, the results of which form thebasis for making judgments about the carrying values of assets and liabilities that are not readily apparent fromother sources. Our actual results could differ materially from these estimates under different assumptions orconditions.
We believe the critical accounting policies listed below affect significant judgments and estimates used inthe preparation of the financial statements.
Revenue Recognition. We recognize revenue in accordance with the Software Revenue Recognition Topicof the Financial Accounting Standards Board’s (FASB) Accounting Standards Codification.We recognizelicense revenues in connection with license agreements for standard proprietary software upon delivery of thesoftware, provided we deem collection to be probable, the fee is fixed or determinable, there is evidence of anarrangement, and VSOE exists with respect to any undelivered elements of the arrangement. We generally billmaintenance fees annually in advance and recognize the resulting revenues ratably over the term of themaintenance agreement. We derive revenues from services which primarily include consulting, implementation,and training. We bill for these services primarily under time and materials arrangements and recognize fees as weperform the services. Deferred revenues represent advance payments or billings for software licenses, services,and maintenance billed in advance of the time we recognize revenues. We record revenues from sales of third-party products in accordance with Principal Agent Considerations within the Revenue Recognition Topic of theFASB Accounting Standards Codification. Furthermore, we evaluate sales through our indirect channel on acase-by-case basis to determine whether the transaction should be recorded gross or net, including but not limitedto assessing whether or not we (1) act as principal in the transaction, (2) take title to the products, (3) have risksand rewards of ownership, such as the risk of loss for collection, delivery, or returns, and (4) act as an agent orbroker with compensation on a commission or fee basis. Accordingly, our sales through the DMI channel aretypically recorded on a gross basis.
52
Generally, our software products do not require significant modification or customization. Installation of theproducts is routine and is not essential to their functionality. Our sales frequently include maintenance contractsand professional services with the sale of our software licenses. We have established VSOE for our maintenancecontracts and professional services. We determine fair value based upon the prices we charge to customers whenwe sell these elements separately. We defer maintenance revenues, including those sold with the initial licensefee, based on VSOE, and recognize the revenue ratably over the maintenance contract period. We recognizeconsulting and training service revenues, including those sold with license fees, as we perform the services basedon their established VSOE. We determine the amount of revenue we allocate to the licenses sold with services ormaintenance using the “residual method” of accounting. Under the residual method, we allocate the total value ofthe arrangement first to the undelivered elements based on their VSOE and allocate the remainder to license fees.
Allowance for Doubtful Accounts. We maintain allowances for doubtful accounts for estimated lossesresulting from the inability of customers to make required payments. If the financial condition of these customerswere to deteriorate, resulting in an impairment of their ability to make payments, we may require additionalallowances or we may defer revenue until we determine that collectability is probable. We specifically analyzeaccounts receivable and historical bad debts, customer creditworthiness, current economic trends and changes incustomer payment terms when we evaluate the adequacy of the allowance for doubtful accounts.
Valuation of Long-Lived and Intangible Assets. We review goodwill for impairment annually and wheneverevents or changes in circumstances indicate its carrying value may not be recoverable in accordance with theIntangibles-Goodwill and Other Topic of the FASB Accounting Standards Codification. Effective fiscal 2012, weopted to perform a qualitative assessment to test a reporting unit’s goodwill for impairment. Based on ourqualitative assessment, if we determine that the fair value of a reporting unit is more likely than not (i.e., alikelihood of more than 50 percent) to be less than its carrying amount, the two step impairment test will beperformed. In the first step, we compare the fair value of each reporting unit to its carrying value. If the fair valueof the reporting unit exceeds the carrying value of the net assets assigned to that unit, goodwill is not consideredimpaired and we are not required to perform further testing. If the carrying value of the net assets assigned to thereporting unit exceeds the fair value of the reporting unit, then we must perform the second step of theimpairment test in order to determine the impairment. Our reporting units are consistent with our operatingsegments identified in Note 8 of Notes to Consolidated Financial Statements included elsewhere in this AnnualReport.
In accordance with the Property, Plant, and Equipment Topic of the FASB Accounting StandardsCodification, long-lived assets, such as property and equipment and intangible assets, are reviewed forimpairment whenever events or changes in circumstances indicate that the carrying amount of an asset may notbe recoverable. Recoverability would be measured by a comparison of the carrying amount of an asset to theestimated undiscounted future cash flows expected to be generated by the asset. If the carrying amount of anasset exceeds its estimated future cash flows, we recognize an impairment charge in the amount by which thecarrying amount of the asset exceeds the fair value of the asset. The determination of estimated future cash flows,however, requires management to make estimates. Future events and changes in circumstances may require us torecord a significant impairment charge in the period in which such events or changes occur. Impairment testingrequires considerable analysis and judgment in determining results. If other assumptions and estimates were usedin our evaluations, the results could differ significantly.
Annual tests or other future events could cause us to conclude that impairment indicators exist and that ourgoodwill is impaired. For example, if we had reason to believe that our recorded goodwill and intangible assetshad become impaired due to decreases in the fair market value of the underlying business, we would have to takea charge to income for that portion of goodwill or intangible assets that we believed was impaired. Any resultingimpairment loss could have a material adverse impact on our financial position and results of operations. AtApril 30, 2013, our goodwill balance was $12.6 million and our intangible assets with definite lives balance was$687,000, net of accumulated amortization.
53

Valuation of Capitalized Software Assets. We capitalize certain computer software development costs inaccordance with the Costs of Software to be Sold, Leased, or Marketed Topic of the FASB Accounting StandardsCodification. Costs incurred internally to create a computer software product or to develop an enhancement to anexisting product are charged to expense when incurred as research and development expense until technologicalfeasibility for the respective product is established. Thereafter, we capitalize all software development costs andreport those costs at the lower of unamortized cost or net realizable value. Capitalization ceases when the productor enhancement is available for general release to customers. We make ongoing evaluations of the recoverabilityof our capitalized software projects by comparing the amount capitalized for each product to the estimated netrealizable value of the product. If such evaluations indicate that the unamortized software development costsexceed the net realizable value, we write off the amount by which the unamortized software development costsexceed net realizable value. Any resulting impairment loss could have a material adverse impact on our financialposition and results of operations. There was no impairment charge related to capitalized computer softwareduring the years ended April 30, 2013, 2012 and 2011. At April 30, 2013, our capitalized software balance was$8.7 million, net of accumulated amortization. We amortize capitalized computer software development costsratably based on the projected revenues associated with the related software or on a straight-line basis over threeyears, whichever method results in a higher level of amortization. Amortization of capitalized computer softwaredevelopment costs is included in the cost of license revenues in the consolidated statements of operations.
Stock-Based Compensation. We estimate the value of options granted on the date of grant using the Black-Scholes option pricing model. Management judgments and assumptions related to volatility, the expected termand the forfeiture rate are made in connection with the calculation of stock compensation expense. Weperiodically review all assumptions used in our stock option pricing model. Changes in these assumptions couldhave a significant impact on the amount of stock compensation expense.
Income Taxes. We provide for the effect of income taxes on our financial position and results of operationsin accordance with the Income Tax Topic of the FASB Accounting Standards Codification. Under thisaccounting guidance, income tax expense is recognized for the amount of income taxes payable or refundable forthe current year and for the change in net deferred tax assets or liabilities resulting from events that are recordedfor financial reporting purposes in a different reporting period than recorded in the tax return. Management mustmake significant assumptions, judgments and estimates to determine our current provision for income taxes andalso our deferred tax assets and liabilities and any valuation allowance to be recorded against our net deferred taxasset. Our judgments, assumptions and estimates relative to the current provision for income tax take intoaccount current tax laws, our interpretation of current tax laws, allowable deductions, tax planning strategies,projected tax credits and possible outcomes of current and future audits conducted by foreign and domestic taxauthorities. Changes in tax laws or our interpretation of tax laws and the resolution of current and future taxaudits could significantly impact the amounts provided for income taxes in our financial position and results ofoperations. Our assumptions, judgments and estimates relative to the value of our deferred tax asset take intoaccount our expectations of the amount and category of future taxable income. Actual operating results and theunderlying amount and category of income in future years, which could significantly increase tax expense, couldrender inaccurate our current assumptions, judgments and estimates of recoverable net deferred taxes.
54

RESULTS OF OPERATIONS
The following table sets forth certain revenue and expense items as a percentage of total revenues for thethree years ended April 30, 2013, 2012, and 2011 and the percentage increases and decreases in those items forthe years ended April 30, 2013 and 2012:
Percentage of Total RevenuesPct. Change in
DollarsPct. Change in
Dollars
2013 2012 2011 2013 vs. 2012 2012 vs. 2011
Revenues:License . . . . . . . . . . . . . . . . . . . . . . . . . . . . . . . . . . 21% 27% 23% (24)% 45%Services and other . . . . . . . . . . . . . . . . . . . . . . . . . . 45 41 43 7 15Maintenance . . . . . . . . . . . . . . . . . . . . . . . . . . . . . . 34 32 34 5 10
Total revenues . . . . . . . . . . . . . . . . . . . . . . . . . 100 100 100 (2) 20
Cost of revenues:License . . . . . . . . . . . . . . . . . . . . . . . . . . . . . . . . . . 6 7 7 (16) 23Services and other . . . . . . . . . . . . . . . . . . . . . . . . . . 31 30 32 2 14Maintenance . . . . . . . . . . . . . . . . . . . . . . . . . . . . . . 8 7 8 1 6
Total cost of revenues . . . . . . . . . . . . . . . . . . . 45 44 47 (1) 14
Gross margin . . . . . . . . . . . . . . . . . . . . . . . . . . 55 56 53 (3) 25
Research and development . . . . . . . . . . . . . . . . . . . . . . . 9 8 9 8 11Sales and marketing . . . . . . . . . . . . . . . . . . . . . . . . . . . . 20 18 18 5 20General and administrative . . . . . . . . . . . . . . . . . . . . . . . 12 13 15 (9) 6Severance expenses . . . . . . . . . . . . . . . . . . . . . . . . . . . . . — — — nm nm
Total operating expenses . . . . . . . . . . . . . . . . 41 40 42 1 12
Operating income . . . . . . . . . . . . . . . . . . . . . . 14 16 11 (15) 76Other income/(loss):
Interest income . . . . . . . . . . . . . . . . . . . . . . . . . . . . 1 1 2 (11) (9)Other, net . . . . . . . . . . . . . . . . . . . . . . . . . . . . . . . . — — 1 nm nm
Earnings before income taxes . . . . . . . . . . . . . 15 17 14 (10) 55Income tax expense . . . . . . . . . . . . . . . . . . . . . . . . . . . . . (5) (6) (4) (14) 57
Net earnings. . . . . . . . . . . . . . . . . . . . . . . . . . . 10% 11% 10% (8)% 54%
nm—not meaningful
Economic Overview and Significant Trends in Our Business
Corporate capital spending trends and commitments are the primary determinants of the size of the marketfor business software. Corporate capital spending is, in turn, a function of general economic conditions in theU.S. and abroad and in particular may be affected by conditions in U.S. global credit markets. In recent years, theweakness in the overall world economy and the U.S. economy in particular has resulted in reduced expendituresin the business software market.
In April 2013, the International Monetary Fund (“IMF”) provided an update to the World EconomicOutlook (“WEO”) for the 2013 world economic growth forecast. The update noted that, “Overall, the annualgrowth forecast for advanced economies in 2013—a modest 11⁄4 percent—is no better than the outcome for2012.That said, assuming that policymakers avoid setbacks and deliver on their commitments, the projections in thisWorld Economic Outlook (WEO) build on continued easing of the brakes on real activity. Consequently, in 2013,after a weak first half, real GDP growth in the advanced economies is projected to rise above 2 percent for therest of the year and to average 21⁄4 percent in 2014, spurred by U.S. growth of about 3 percent.”
55

For fiscal 2014, we expect the world economy to remain relatively weak with some moderate improvementtowards the end of the fiscal year, which could result in a continuation of the difficult selling environment.Overall information technology spending continues to be relatively weak as a result of the current globaleconomic environment. However, we believe that information technology spending will incrementally improveover the long term as increased global competition forces companies to improve productivity by upgrading theirtechnology systems. Although this improvement could slow or regress at any time, due in part to concerns inglobal capital markets and general economic conditions, we believe that our organizational and financialstructure will enable us to take advantage of any sustained economic rebound. Customers continue to take longperiods to evaluate discretionary software purchases.
We believe weak economic conditions may be driving some businesses to focus on achieving more processand efficiency enhancements in their operations and to invest in solutions that improve operating margins, ratherthan make large infrastructure-type technology purchases. If this trend continues, we believe it may tend to favorsolutions such as our Logility supply chain solutions, which are designed to provide a more rapid return oninvestment and are targeted at some of the largest profit drivers in a customer’s business. While the currenteconomic crisis has had a particularly adverse impact on the weaker companies in our target markets, we believea large percentage of our customers are seeking to make investments to strengthen their operations, and some aretaking advantage of current economic conditions to gain market share.
Business opportunities and risks
We currently view the following factors as the primary opportunities and risks associated with our business:
• Dependence on Capital Spending Patterns. There is risk associated with our dependence on the capitalspending patterns of U.S. and international businesses, which in turn are functions of economic trendsand conditions over which we have no control.
• Acquisition Opportunities. There are opportunities for selective acquisitions or investments to provideopportunities to expand our sales distribution channels and/or broaden our product offering byproviding additional solutions for our target markets.
• Acquisition Risks. There are risks associated with acquisitions of complementary companies, productsand technologies, including the risks that we will not achieve the financial and strategic goals that wecontemplate at the time of the transaction. More specifically, in any acquisition we will face risks andchallenges associated with the uncertain value of the acquired business or assets, the difficulty ofassimilating operations and personnel, integrating acquired technologies and products and maintainingthe loyalty of the customers of the acquired business.
• Competitive Technologies. There is a risk that our competitors may develop technologies that aresubstantially equivalent or superior to our technology.
• Competition in General. There are risks inherent in the market for business application software andrelated services, which has been and continues to be intensely competitive; for example, some of ourcompetitors may become more aggressive with their prices and/or payment terms, which mayadversely affect our profit margins.
For more information, please see “Risk Factors” in Item 1A. above.
Adoption of New Accounting Pronouncements
In September 2011, the FASB issued an accounting standards update amending the guidance on the annualtesting of goodwill for impairment. The update allows entities to first assess qualitative factors to determinewhether it is more-likely-than-not that the fair value of a reporting unit is less than its carrying value. If a greaterthan 50 percent likelihood exists that the fair value is less than the carrying amount then it is necessary toperform the currently prescribed two-step goodwill impairment test. Otherwise, the two-step goodwill
56
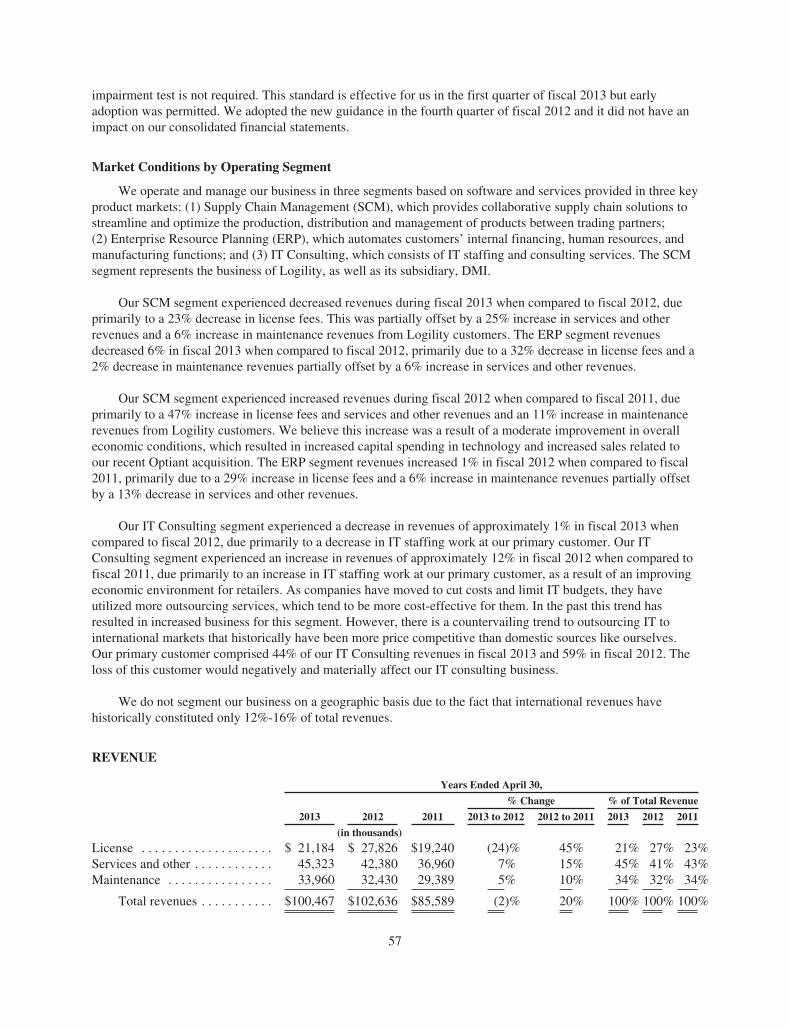
impairment test is not required. This standard is effective for us in the first quarter of fiscal 2013 but earlyadoption was permitted. We adopted the new guidance in the fourth quarter of fiscal 2012 and it did not have animpact on our consolidated financial statements.
Market Conditions by Operating Segment
We operate and manage our business in three segments based on software and services provided in three keyproduct markets: (1) Supply Chain Management (SCM), which provides collaborative supply chain solutions tostreamline and optimize the production, distribution and management of products between trading partners;(2) Enterprise Resource Planning (ERP), which automates customers’ internal financing, human resources, andmanufacturing functions; and (3) IT Consulting, which consists of IT staffing and consulting services. The SCMsegment represents the business of Logility, as well as its subsidiary, DMI.
Our SCM segment experienced decreased revenues during fiscal 2013 when compared to fiscal 2012, dueprimarily to a 23% decrease in license fees. This was partially offset by a 25% increase in services and otherrevenues and a 6% increase in maintenance revenues from Logility customers. The ERP segment revenuesdecreased 6% in fiscal 2013 when compared to fiscal 2012, primarily due to a 32% decrease in license fees and a2% decrease in maintenance revenues partially offset by a 6% increase in services and other revenues.
Our SCM segment experienced increased revenues during fiscal 2012 when compared to fiscal 2011, dueprimarily to a 47% increase in license fees and services and other revenues and an 11% increase in maintenancerevenues from Logility customers. We believe this increase was a result of a moderate improvement in overalleconomic conditions, which resulted in increased capital spending in technology and increased sales related toour recent Optiant acquisition. The ERP segment revenues increased 1% in fiscal 2012 when compared to fiscal2011, primarily due to a 29% increase in license fees and a 6% increase in maintenance revenues partially offsetby a 13% decrease in services and other revenues.
Our IT Consulting segment experienced a decrease in revenues of approximately 1% in fiscal 2013 whencompared to fiscal 2012, due primarily to a decrease in IT staffing work at our primary customer. Our ITConsulting segment experienced an increase in revenues of approximately 12% in fiscal 2012 when compared tofiscal 2011, due primarily to an increase in IT staffing work at our primary customer, as a result of an improvingeconomic environment for retailers. As companies have moved to cut costs and limit IT budgets, they haveutilized more outsourcing services, which tend to be more cost-effective for them. In the past this trend hasresulted in increased business for this segment. However, there is a countervailing trend to outsourcing IT tointernational markets that historically have been more price competitive than domestic sources like ourselves.Our primary customer comprised 44% of our IT Consulting revenues in fiscal 2013 and 59% in fiscal 2012. Theloss of this customer would negatively and materially affect our IT consulting business.
We do not segment our business on a geographic basis due to the fact that international revenues havehistorically constituted only 12%-16% of total revenues.
REVENUE
Years Ended April 30,
2013 2012 2011
% Change % of Total Revenue
2013 to 2012 2012 to 2011 2013 2012 2011
(in thousands)
License . . . . . . . . . . . . . . . . . . . . $ 21,184 $ 27,826 $19,240 (24)% 45% 21% 27% 23%Services and other . . . . . . . . . . . . 45,323 42,380 36,960 7% 15% 45% 41% 43%Maintenance . . . . . . . . . . . . . . . . 33,960 32,430 29,389 5% 10% 34% 32% 34%
Total revenues . . . . . . . . . . . $100,467 $102,636 $85,589 (2)% 20% 100% 100% 100%
57

For the fiscal year ended April 30, 2013, the 2% decrease in total revenues was attributable primarily to a24% decrease in license fee revenues. This was partially offset by a 7% increase in services and other revenuesand a 5% increase in maintenance revenues.
For the fiscal year ended April 30, 2012, the increase in total revenues was broadly attributable to increasesin license fee, services and maintenance revenues, primarily due to an improvement in the overall capitalspending environment and to a lesser extent increased license fee sales from our recent Optiant acquisition.
Due to intensely competitive markets we discount license fees from our published list price due to pricingpressure in our industry. Numerous factors contribute to the amount of the discounts provided, such as previouscustomer purchases, the number of customer sites utilizing the software, the number of modules purchased andthe number of users, as well as the overall size of the contract. While all these factors affect the discount amountof one contract, the overall percentage discount has not materially changed in the recent reported fiscal periods.
The change in our revenues from period to period is primarily due to the volume of products and relatedservices sold in any period and the amounts of products or modules purchased with each sale.
International revenues represented approximately 14% of total revenues for the year ended April 30, 2013,16% of total revenues for the year ended April 30, 2012, and 14% for the year ended April 30, 2011. Ourinternational revenues may fluctuate substantially from period to period primarily because we derive theserevenues from a relatively small number of customers in a given period.
License revenue
Years Ended April 30,
2013 2012
% Change
2012 to 20112011 2013 to 2012
(in thousands)
Enterprise Resource Planning . . . . . . . . . . . . . . . . . . . . $ 2,272 $ 3,350 $ 2,595 (32)% 29%Supply Chain Management . . . . . . . . . . . . . . . . . . . . . . 18,912 24,476 16,645 (23)% 47%
Total license revenues . . . . . . . . . . . . . . . . . . . . . . $21,184 $27,826 $19,240 (24)% 45%
For the year ended April 30, 2013, license fee revenues decreased by 24% when compared to the previousyear due to a difficult selling environment as our SCM and ERP units have experienced a decline in license feeclose rates in the current fiscal year due to cancellations and/or delays in business investment as a result of anuncertainty in the direction of the global economy. Logility, including its DMI subsidiary, constituted 89%, 88%and 87% of our total license fee revenues for the years ended April 30, 2013, 2012 and 2011, respectively.License fees from our ERP segment, which includes NGC, also decreased in fiscal 2013, primarily due to adecrease in license fee sales to the apparel and retail industries also as a result of uncertainty in the direction ofthe global economy.
For the year ended April 30, 2012, license fee revenues increased by 45%, due to an improvement in thecapital spending environment particularly in our SCM business unit and to a lesser extent an increase in salesrelated to our recent Optiant acquisition. License fees from our ERP segment, which includes NGC, increased infiscal 2012 due primarily to our NGC unit, which experienced an improvement in sales to the apparel industry.
The direct sales channel provided approximately 70% of license fee revenues for the year ended April 30,2013, compared to approximately 70% in fiscal 2012 and 63% in fiscal 2011. The decrease in indirect licensefees from fiscal 2011 to fiscal 2012 was largely the result of lower license fee sales through our indirect channel,which primarily sells software products through its DMI subsidiary to small and midsize companies. As a resultof the current economic conditions, we believe the ability of small and midsize companies to access the credit
58

markets to finance capital purchases is difficult when compared to the same period last year and also theuncertainly of the direction of the global economy is delaying capital purchasing decisions at all company sizesbut particularly the small and midsize companies.
For the year ended April 30, 2013, our margins after commissions on direct sales were approximately 83%,and our margins after commissions on indirect sales were approximately 49%. For the year ended April 30, 2012,our margins after commissions on direct sales were approximately 81%, and our margins after commissions onindirect sales were approximately 48%. For the year ended April 30, 2011, our margins after commissions ondirect sales were approximately 83%, and our margins after commissions on indirect sales were approximately50%. The margins after commissions were relatively consistent in a range between 81% and 84% for direct and48% and 50% for indirect sales. DMI is the source of the bulk of our indirect sales. License fee gross marginpercentage tends to be directly related to the level of license fee revenues due to the relatively fixed cost ofcomputer software amortization expense, amortization of acquired software and the sales mix between our directand indirect channel.
Services and other revenue
Years Ended April 30,
2013 2012 2011
% Change
2013 to 2012 2012 to 2011
(in thousands)
Enterprise Resource Planning . . . . . . . . . . . . . . . . . . . . $ 6,162 $ 5,827 $ 6,733 6% (13)%Supply Chain Management . . . . . . . . . . . . . . . . . . . . . . 13,929 11,178 7,607 25% 47%IT Consulting . . . . . . . . . . . . . . . . . . . . . . . . . . . . . . . . . 25,232 25,375 22,620 (1)% 12%
Total services and other revenues . . . . . . . . . . . . . $45,323 $42,380 $36,960 7% 15%
The 7% increase in services and other revenues for the year ended April 30, 2013 when compared to fiscal2012 was due primarily to an increase in revenue from our SCM business unit, as higher SCM license fees salesin prior periods resulted in more project implementation services, and to a lesser extent was attributable to ourERP business unit as higher license fees sales in prior periods resulted in more project implementation services.This was partially offset by a 1% decrease in services and other revenues in IT Consulting business unit due to itscustomers’—particularly its primary customer—decreased utilization of outside contractors.
The 15% increase in services and other revenues for the year ended April 30, 2012 when compared to fiscal2011 was due primarily to an increase in revenue from our SCM business unit, as higher SCM license fees salesin prior periods resulted in more project implementation services, and to a lesser extent was attributable to our ITConsulting business unit, The Proven Method, as its customers—particularly its primary customer—increasedutilization of outside contractors as a result of improved economic conditions. This was partially offset by a 13%decrease in services and other revenues in our ERP business unit.
As noted in our Form 10-Q for the first quarter of fiscal 2011, commencing September 2010, a large ERPcustomer did not renew a services agreement that has been in place for more than ten years. During fiscal 2010this agreement represented approximately $1.1 million in ERP services revenue per quarter. The loss of thisrevenue resulted in a substantial reduction in services revenues in our ERP segment commencing in the secondquarter of fiscal 2011. This services agreement was unique to this customer, and therefore we do not believe thatthe non-renewal of the agreement reflects a trend that will affect other services agreements or customerrelationships. We have taken appropriate cost reduction actions to mitigate the earnings impact of this lostrevenue.
In our software business units, we have observed that there is a tendency for services and other revenues tolag changes in license revenues by one to three quarters, as new licenses in one quarter often involve
59

implementation and consulting services in subsequent quarters, for which we recognize revenues only as weperform those services. Thus, it is not necessary for the proportion of customers purchasing implementationservices to increase if the amount of license fees increased in recent quarters.
Maintenance revenue
Years Ended April 30,
2013 2012 2011
% Change
2013 to 2012 2012 to 2011
(in thousands)
Enterprise Resource Planning . . . . . . . . . . . . . . . . . . . . $ 4,391 $ 4,474 $ 4,220 (2)% 6%Supply Chain Management . . . . . . . . . . . . . . . . . . . . . . 29,569 27,956 25,169 6% 11%
Total maintenance revenues . . . . . . . . . . . . . . . . . . $33,960 $32,430 $29,389 5% 10%
The 5% increase in total maintenance revenues for the year ended April 30, 2013 was primarily due to a 6%increase in maintenance revenues from our SCM business unit as a result of increased license fees and improvedmaintenance renewal rates. This was partially offset by a 2% decrease from our ERP business unit from lowermaintenance renewal rates.
The 10% increase in total maintenance revenues for the year ended April 30, 2012 was primarily due to an11% increase in maintenance revenues from our SCM business unit as a result of increased license fees andimproved maintenance renewal rates. Also, to a lesser extent, the increase was due to a 6% increase from ourERP business unit from increased license sales and improved maintenance renewal rates at NGC.
Logility’s maintenance revenues constituted 87% of total maintenance revenues for the year ended April 30,2013 compared to 86% for the years ended April 30, 2012 and 2011. Typically, our maintenance revenues havehad a direct relationship to current and historic license fee revenues, since new licenses are the potential sourceof new maintenance customers.
GROSS MARGIN:
The following table provides both dollar amounts and percentage measures of gross margin:
Years Ended April 30,
2013 2012 2011
(in thousands)
Gross margin on license fees . . . . . . . . . . . . . . . . . . . . . . . . . . . . $15,158 72% $20,684 74% $13,412 70%Gross margin on services and other . . . . . . . . . . . . . . . . . . . . . . . 13,453 30% 11,279 27% 9,755 26%Gross margin on maintenance . . . . . . . . . . . . . . . . . . . . . . . . . . . 26,296 77% 24,833 77% 22,237 76%
Total gross margins . . . . . . . . . . . . . . . . . . . . . . . . . . . . . . . $54,907 55% $56,796 55% $45,404 53%
The total gross margin percentage for the year ended April 30, 2013 was primarily the same percentage asthe same period last year.
The increase in total gross margin percentage for the year ended April 30, 2012 was primarily due to theincrease in gross margin percentage on license fees and to a lesser extent the services and other and maintenancegross margins improved when compared to the same period last year as result of increased services andmaintenance revenue during the current year.
60

Gross Margin on License Fees
The decrease in license fee gross margin percentage for the fiscal year ended April 30, 2013 when comparedto fiscal 2012 were due primarily to the decrease in license fee sales. The increase in license fee gross marginpercentage for the fiscal year ended April 30, 2012 when compared to fiscal 2011 was due primarily to theincrease in license fee sales and a reduction in the proportion of license fee sales through our indirect channel atDMI, for which agent commissions are expensed to cost of license fees. License fee gross margin percentagetends to be directly related to the level of license fee revenues due to the relatively fixed cost of computersoftware amortization expense, amortization of acquired software and the sales mix between our direct andindirect channel.
Gross Margin on Services and Other
For the year ended April 30, 2013, our gross margin percentage on services and other revenues increasedfrom 27% in fiscal 2012 to 30% in fiscal 2013, primarily due to higher gross margins at our IT Consultingsegment, The Proven Method, Inc. (“TPM”), as its services gross margin increased to 20% in fiscal 2013compared to 18% in fiscal 2012, as a result of improved contracted utilization and hourly billing rates. Also, to alesser extent, the increase was due to higher gross margins at our ERP segment, as services gross marginincreased from 33% in fiscal 2012 compared to 36% in fiscal 2013 as a result of higher services revenue. In ourSCM segment, Logility’s gross margin increased slightly to 44% in fiscal 2013 compared to 43% in fiscal 2012due to higher services revenue.
For the year ended April 30, 2012, our gross margin percentage on services and other revenues increased1%, primarily due to higher gross margins at TPM, as its services gross margin increased to 18% in fiscal 2012compared to 16% in fiscal 2011, as a result of improved contracted utilization and hourly billing rates. Our ERPsegment’s services gross margin decreased to 33% in fiscal 2012 compared to 40% in fiscal 2011 as a result oflower services revenue from the loss of a large ERP customer noted above in the services revenue area. In ourSCM segment, Logility’s gross margin decreased slightly to 43% in fiscal 2012 compared to 44% in fiscal 2011due to additional headcount.
As discussed above, our IT Consulting business unit typically has lower margins when compared to theother business units that have higher margin implementation service revenue, so a decrease in the percentage ofservices revenues from our IT Consulting segment tends to cause our overall services gross margin percentage toincrease. The IT Consulting segment was 56%, 60% and 61% of the Company’s services revenues in fiscal 2013,2012 and 2011, respectively. Our SCM segment was 31%, 26% and 21% of the Company’s services revenues infiscal 2013, 2012 and 2011, respectively. Our ERP segment was 13%, 14% and 18% of the Company’s servicesrevenues in fiscal 2013, 2012 and 2011, respectively.
Gross Margin on Maintenance
Maintenance gross margin percentage remained relatively consistent for the years ended April 30, 2013,2012 and 2011. The slight improvement in maintenance gross margin percentage in fiscal 2013 compared tofiscal 2012 was due to an increase in maintenance revenue and cost containment efforts.
61

EXPENSES
Years Ended April 30,
2013 2012 2011
% of Revenues
2013 2012 2011
(in thousands)
Research and development . . . . . . . . . . . . . . . . . . . . . . . . . . . . $ 8,882 $ 8,226 $ 7,388 9% 8% 9%Sales and marketing . . . . . . . . . . . . . . . . . . . . . . . . . . . . . . . . . 19,829 18,797 15,720 20% 18% 18%General and administrative . . . . . . . . . . . . . . . . . . . . . . . . . . . . 11,911 13,070 12,200 12% 13% 14%Amortization of acquisition-related intangible assets . . . . . . . . 501 535 684 0% 1% 1%Severance expenses . . . . . . . . . . . . . . . . . . . . . . . . . . . . . . . . . . — — 219 0% 0% 0%Other income/(loss), net . . . . . . . . . . . . . . . . . . . . . . . . . . . . . . 1,741 1,103 1,941 2% 1% 3%Income tax expense . . . . . . . . . . . . . . . . . . . . . . . . . . . . . . . . . . (5,114) (5,928) (3,770) (5)% (6)% (4)%
Research and Development
Gross product research and development costs include all non-capitalized and capitalized softwaredevelopment costs. A breakdown of the research and development costs is as follows:
Years Ended
April 30,2013
PercentChange
April 30,2012
PercentChange
April 30,2011
(in thousands)
Total capitalized computer software development costs . . . . . . $ 3,418 25% $ 2,731 6% $2,565Percentage of gross product research and developmentcosts . . . . . . . . . . . . . . . . . . . . . . . . . . . . . . . . . . . . . . . . 28% 25% 26%
Total research and development expense . . . . . . . . . . . . . . . . . . 8,882 8% 8,226 11% 7,388
Percentage of total revenues . . . . . . . . . . . . . . . . . . . . 9% 8% 9%Total research and development expense and capitalizedcomputer software development costs . . . . . . . . . . . . . . . . . . $12,300 12% $10,957 10% $9,953
Percentage of total revenues . . . . . . . . . . . . . . . . . . . . . . . . 12% 11% 12%Total amortization of capitalized computer softwaredevelopment costs* . . . . . . . . . . . . . . . . . . . . . . . . . . . . . . . . . $ 2,501 0% $ 2,502 32% $1,892
* Included in cost of license fees
For the year ended April 30, 2013, gross product research and development costs and capitalized softwaredevelopment costs increased compared to fiscal 2012 primarily due to an increase in research and developmentspending by Logility for the enhancement of several software products. Capitalized software development costsincreased in fiscal 2013 compared to fiscal 2012 due to timing of project work. Amortization of capitalizedsoftware development in fiscal 2013 and fiscal 2012 were essentially the same for both periods.
For the year ended April 30, 2012, gross product research and development costs and capitalized softwaredevelopment costs increased compared to fiscal 2011 primarily due to an increase in research and developmentspending by our Logility and ERP subsidiaries and enhancement of several software products. Capitalizedsoftware development costs increased in fiscal 2012 compared to fiscal 2011 due to timing of project work.Amortization of capitalized software development increased in fiscal 2012 when compared to fiscal 2011, due tothe completion of our Voyager 8.0 software project at our SCM business unit released on July 27, 2010.
Sales and Marketing
In the year ended April 30, 2013, the increase in sales and marketing expenses compared to fiscal 2012 wasdue primarily to expenditures related to increased headcount and higher marketing related costs.
62

In the year ended April 30, 2012, the increase in sales and marketing expenses compared to fiscal 2011 wasdue primarily to higher commissions from higher license fee sales and expenditures related to increasedheadcount.
General and Administrative
For the year ended April 30, 2013, the decrease in general and administrative expenses compared to fiscal2012 was primarily due to lower variable compensation expense. The total number of employees wasapproximately 377 on April 30, 2013, 332 on April 30, 2012 and 297 on April 30, 2011.
For the year ended April 30, 2012, the increase in general and administrative expenses compared to fiscal2011 was primarily due to expenses related to higher variable compensation expense. The total number ofemployees was approximately 332 on April 30, 2012, 297 on April 30, 2011 and 291 on April 30, 2010.
Amortization of Acquisition-related Intangible Assets
For the year ended April 30, 2013, we recorded $501,000 in intangible amortization expense related to theOptiant acquisition that occurred on March 19, 2010. This amount is included in operating expenses.Additionally, we recorded approximately $75,000 related to the Logility treasury stock buy-back (see Note 1(l) tothe Consolidated Financial Statements). This amount is included in general and administrative expenses.
For the year ended April 30, 2012, we recorded $535,000 in intangible amortization expense related to theOptiant acquisition that occurred on March 19, 2010. This amount is included in operating expenses.Additionally, we recorded approximately $82,000 related to the Logility treasury stock buy-back (see Note 1(l) tothe Consolidated Financial Statements). This amount is included in general and administrative expenses.
For the year ended April 30, 2011, we recorded $684,000 in intangible amortization expense related to theOptiant acquisition that occurred on March 19, 2010 and the DMI acquisition that occurred on September 30,2004. This amount is included in operating expenses. Additionally, we recorded $112,000 related to the Logilitytreasury stock buy-back (see Note 1(l) to the Consolidated Financial Statements). This amount is included ingeneral and administrative expenses.
Severance Expenses
As noted in our Form 10-Q for the first quarter of fiscal 2011, a large ERP customer informed us that afterAugust 2010 it would not renew a services agreement that has been in place for more than ten years. As a result,during the second quarter of fiscal 2011 we took appropriate cost reduction efforts, including reducing headcountand paying associated benefits to terminated employees, to mitigate the earnings impact of the lost revenue. Thisservices agreement was unique to this customer, and therefore we do not believe that the non-renewal of theagreement reflects a trend that will affect other services agreements or customer relationships.
Operating Income/(Loss)
Years Ended April 30,
% Change
2013 2012 2011 2013 to 2012 2012 to 2011
(in thousands)
Enterprise Resource Planning . . . . . . . . . . . . . . . . . . . . $ (4,741) $ (4,947) $ (4,166) 4% (19)%Supply Chain Management . . . . . . . . . . . . . . . . . . . . . . 16,881 19,335 12,348 (13)% 57%IT Consulting . . . . . . . . . . . . . . . . . . . . . . . . . . . . . . . . . 1,644 1,780 1,011 (8)% 76%
Total Operating Income . . . . . . . . . . . . . . . . . . . . . $13,784 $16,168 $ 9,193 (15)% 76%
63
The lower ERP segment operating loss in fiscal 2013 when compared to fiscal 2012 was due primarily tocost containment efforts. Also, during the current fiscal year, the Company continued to invest approximately18% of total ERP revenues, or approximately $2.3 million, in research and development for new softwareproducts to compete more effectively in the sewn products, apparel and retail industries.
The larger ERP segment operating loss in fiscal 2012 when compared to fiscal 2011 was due primarily tothe decline in revenues, specifically the decline in services revenue from the loss of a large ERP customer afterAugust 2010. During fiscal 2010 this agreement represented approximately $1.1 million in ERP services revenueper quarter. The loss of this revenue resulted in a substantial reduction in services revenues in our ERP segmentcommencing in the second quarter of fiscal 2011. Also, to a lesser extent, the increase in operating loss in fiscal2012 is due to the Company investing approximately 16% of total ERP revenues, or approximately $2.2 million,in research and development for new software products to compete more effectively in the sewn products,apparel and retail industries.
Our SCM segment decreased operating income by 13% in fiscal 2013 compared to fiscal 2012 primarily dueto a 2% decrease in revenues and increased investment in sales and R&D efforts. Our SCM segment increasedoperating income by 57% in fiscal 2012 compared to fiscal 2011 primarily due to a 29% increase in revenues.
Our IT consulting segment operating income decreased 8% in fiscal 2013 compared to fiscal 2012 primarilydue to a 1% decrease in revenues. Our IT consulting segment operating income increased 76% in fiscal 2012compared to fiscal 2011 primarily due to a 12% increase in revenues.
Other Income
Other income is comprised of net interest and dividend income, rental income net of related depreciationexpenses, exchange rate gains and losses, and realized and unrealized gains and losses from investments. Otherincome was approximately $1.7 million in the year ended April 30, 2013 compared to $1.1 million in fiscal 2012.The increase was primarily due to increase in unrealized and realized gains on investments and to a lesser extenthigher rental income from leases on our Atlanta property in fiscal 2013 and lower exchange rates losses. Weincurred an exchange rate loss of approximately $258,000 in the year ended April 30, 2013 compared to a loss ofapproximately $289,000 in fiscal 2012. This was partially offset by lower interest income.
Other income was approximately $1.1 million in the year ended April 30, 2012 compared to $1.9 million infiscal 2011. The decrease was primarily due to a change in exchange rates gains/(losses). We incurred anexchange rate loss of approximately $289,000 in the year ended April 30, 2012 compared to a gain ofapproximately $172,000 in fiscal 2011. To a lesser extent the decrease was due to an increase in unrealized andrealized losses on investments and lower interest income. This was partially offset by an increase in rentalincome from leases on our Atlanta property in fiscal 2012.
Income Taxes
During fiscal 2013, the Company recorded income tax expense of $5.1 million compared to $5.9 million infiscal 2012 and $3.8 million in fiscal 2011. Our effective income tax rate takes into account the source of taxableincome, by state, and available income tax credits. Our tax effective rate was 32.9%, 34.3%, and 33.9% in fiscalyears 2013, 2012 and 2011, respectively. The effective tax rate for the current fiscal year is lower than last yearprimarily due to the approval of the research and development tax credit during the third quarter of the currentyear which resulted in a “catch-up” credit adjustment for the period January 1, 2012 to January 31, 2013 whichincluded four months (January 2012 to April 2012) of the fiscal 2012 tax credit in fiscal 2013. We expect our taxeffective rate to be in the range of 33% to 36% in fiscal 2014.
64

Operating Pattern
We experience an irregular pattern of quarterly operating results, caused primarily by fluctuations in boththe number and size of software license contracts received and delivered from quarter to quarter and our ability torecognize revenues in that quarter in accordance with our revenue recognition policies. We expect this pattern tocontinue.
Liquidity and Capital Resources
Sources and Uses of Cash
We have historically funded, and continue to fund, our operations and capital expenditures primarily withcash generated from operating activities. The changes in net cash that our operating activities provide generallyreflect the changes in net earnings and non-cash operating items plus the effect of changes in operating assets andliabilities, such as investment trading securities, trade accounts receivable, trade accounts payable, accruedexpenses and deferred revenue. We have no debt obligations or off-balance sheet financing arrangements, andtherefore we used no cash for debt service purposes.
The following tables show information about our cash flows and liquidity positions as of and for the fiscalyears ended April 30, 2013 and 2012. You should read these tables and the discussion that follows in conjunctionwith our consolidated statements of cash flows contained in Item 8 of this report.
Years endedApril 30,
2013 2012
(in thousands)
Net cash provided by operating activities . . . . . . . . . . . . . . . . . . . . . . . . . . . . . . $ 19,128 $16,281Net cash (used in) provided by investing activities . . . . . . . . . . . . . . . . . . . . . . . (2,966) 2,734Net cash used in financing activities . . . . . . . . . . . . . . . . . . . . . . . . . . . . . . . . . . (14,109) (3,832)
Net change in cash and cash equivalents . . . . . . . . . . . . . . . . . . . . . . . . . . . $ 2,053 $15,183
The increase in cash provided by operating activities in fiscal 2013 compared to fiscal 2012 was dueprimarily to: (1) a decrease in accounts receivable in fiscal 2013 compared to an increase in fiscal 2012 due totiming of sales and billing, (2) a decrease in the purchases of trading securities due to timing, (3) an increase inthe net proceeds from sales and maturities of trading securities because all debt securities acquired during fiscal2013 were classified as “trading” and are included in operating activities, (4) a decrease in excess tax benefitsfrom stock-based compensation due to a decrease in stock option exercises in fiscal 2013 compared to fiscal2012, (5) an increase in deferred income taxes, (6) a decrease in prepaid expenses and other assets in fiscal 2013compared to an increase in fiscal 2012 due to timing of purchases, (7) an increase in stock-based compensationexpense due to the increase value of option grants, and (8) an increase in retirement of property and equipment.
These factors were partially offset by (1) a decrease in accounts payable and other liabilities when comparedto fiscal 2012 due primarily to timing and amount of sales commissions, bonuses and tax liabilities, (2) adecrease in net earnings, (3) a decrease in tax benefits of options exercised due to less stock option exercises inthe current year, (4) an increase in the gain on unrealized investments compared to a loss in the prior year due toinvestment markets, (5) a lower increase in deferred revenues when compared to fiscal 2012 due to lower licensefee sales in the current year, (6) lower depreciation and amortization expense due to timing and (7) lower bondamortization.
The increase in cash used in investing activities in fiscal 2013 compared to cash provided by investingactivities in fiscal 2012 was due primarily to: (1) a decrease in proceeds from maturities of investments becauseall debt securities acquired during fiscal 2013 and 2012 were classified as “trading” and are included in operatingactivities, (2) an increase in capitalized software development costs due to increased R&D efforts, and (3) anincrease in purchases of equipment.
65
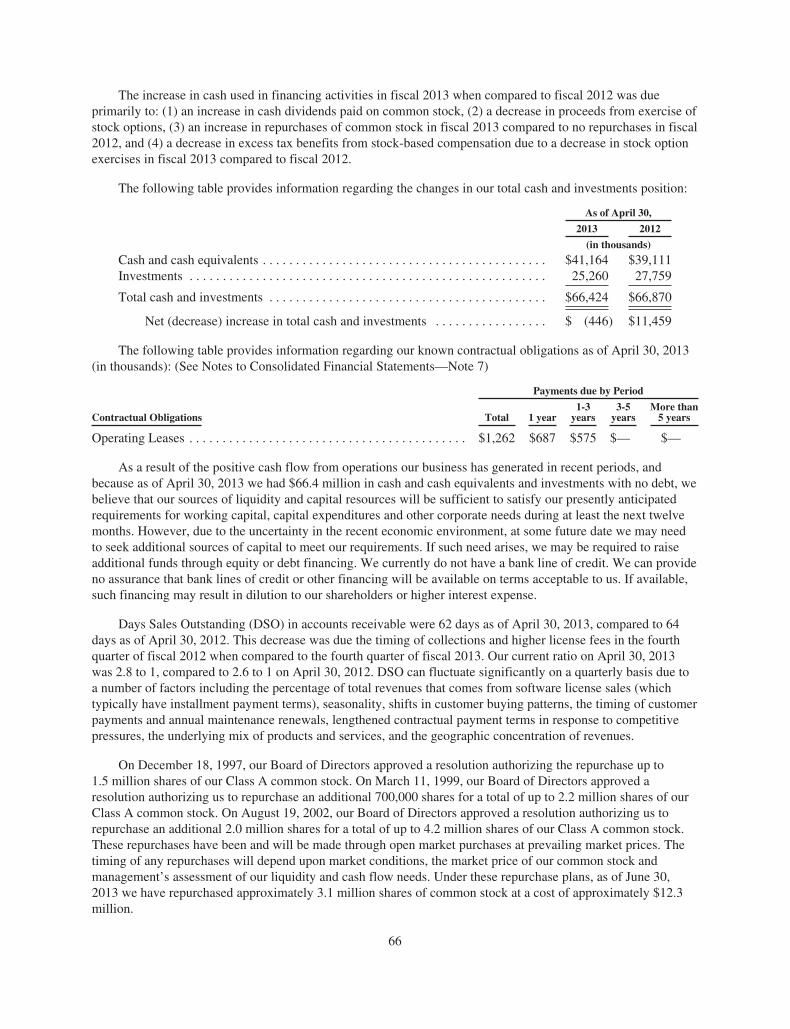
The increase in cash used in financing activities in fiscal 2013 when compared to fiscal 2012 was dueprimarily to: (1) an increase in cash dividends paid on common stock, (2) a decrease in proceeds from exercise ofstock options, (3) an increase in repurchases of common stock in fiscal 2013 compared to no repurchases in fiscal2012, and (4) a decrease in excess tax benefits from stock-based compensation due to a decrease in stock optionexercises in fiscal 2013 compared to fiscal 2012.
The following table provides information regarding the changes in our total cash and investments position:
As of April 30,
2013 2012
(in thousands)
Cash and cash equivalents . . . . . . . . . . . . . . . . . . . . . . . . . . . . . . . . . . . . . . . . . . . $41,164 $39,111Investments . . . . . . . . . . . . . . . . . . . . . . . . . . . . . . . . . . . . . . . . . . . . . . . . . . . . . . 25,260 27,759
Total cash and investments . . . . . . . . . . . . . . . . . . . . . . . . . . . . . . . . . . . . . . . . . . $66,424 $66,870
Net (decrease) increase in total cash and investments . . . . . . . . . . . . . . . . . $ (446) $11,459
The following table provides information regarding our known contractual obligations as of April 30, 2013(in thousands): (See Notes to Consolidated Financial Statements—Note 7)
Payments due by Period
Contractual Obligations Total 1 year1-3years
3-5years
More than5 years
Operating Leases . . . . . . . . . . . . . . . . . . . . . . . . . . . . . . . . . . . . . . . . . . $1,262 $687 $575 $— $—
As a result of the positive cash flow from operations our business has generated in recent periods, andbecause as of April 30, 2013 we had $66.4 million in cash and cash equivalents and investments with no debt, webelieve that our sources of liquidity and capital resources will be sufficient to satisfy our presently anticipatedrequirements for working capital, capital expenditures and other corporate needs during at least the next twelvemonths. However, due to the uncertainty in the recent economic environment, at some future date we may needto seek additional sources of capital to meet our requirements. If such need arises, we may be required to raiseadditional funds through equity or debt financing. We currently do not have a bank line of credit. We can provideno assurance that bank lines of credit or other financing will be available on terms acceptable to us. If available,such financing may result in dilution to our shareholders or higher interest expense.
Days Sales Outstanding (DSO) in accounts receivable were 62 days as of April 30, 2013, compared to 64days as of April 30, 2012. This decrease was due the timing of collections and higher license fees in the fourthquarter of fiscal 2012 when compared to the fourth quarter of fiscal 2013. Our current ratio on April 30, 2013was 2.8 to 1, compared to 2.6 to 1 on April 30, 2012. DSO can fluctuate significantly on a quarterly basis due toa number of factors including the percentage of total revenues that comes from software license sales (whichtypically have installment payment terms), seasonality, shifts in customer buying patterns, the timing of customerpayments and annual maintenance renewals, lengthened contractual payment terms in response to competitivepressures, the underlying mix of products and services, and the geographic concentration of revenues.
On December 18, 1997, our Board of Directors approved a resolution authorizing the repurchase up to1.5 million shares of our Class A common stock. On March 11, 1999, our Board of Directors approved aresolution authorizing us to repurchase an additional 700,000 shares for a total of up to 2.2 million shares of ourClass A common stock. On August 19, 2002, our Board of Directors approved a resolution authorizing us torepurchase an additional 2.0 million shares for a total of up to 4.2 million shares of our Class A common stock.These repurchases have been and will be made through open market purchases at prevailing market prices. Thetiming of any repurchases will depend upon market conditions, the market price of our common stock andmanagement’s assessment of our liquidity and cash flow needs. Under these repurchase plans, as of June 30,2013 we have repurchased approximately 3.1 million shares of common stock at a cost of approximately $12.3million.
66

See Item 5 of this report, under the caption “Market for Registrant’s Common Equity, Related StockholderMatters, and Issuer Purchases of Equity Securities.”
ITEM 7A. QUANTITATIVE AND QUALITATIVE DISCLOSURES ABOUTMARKET RISK
Foreign Currency. For the fiscal years ended April 30, 2013 and 2012, we generated 14% and 16% of ourrevenues outside of the United States, respectively. We typically denominate our international sales in U.S.Dollars, Euros or British Pounds Sterling. We denominate our expenses associated with our internationaloperations in local currencies. Where transactions may be denominated in foreign currencies, we are subject tomarket risk with respect to fluctuations in the relative value of currencies. We recorded exchange rate losses ofapproximately $258,000 and $289,000 in fiscal years 2013 and 2012, respectively. We estimate that a 10%movement in foreign currency rates would have the effect of creating an exchange gain or loss of approximately$209,000.
Interest Rates and Other Market Risks. We manage our interest rate risk by maintaining an investmentportfolio of trading and held-to-maturity investments with high credit quality and relatively short averagematurities. These instruments include, but are not limited to, money-market instruments, bank time deposits, andtaxable and tax-advantaged variable rate and fixed rate obligations of corporations, municipalities, and national,state, and local government agencies, in accordance with an investment policy approved by our Board ofDirectors. These instruments are denominated in U.S. Dollars. The fair market value of our cash equivalents andinvestments as of April 30, 2013 was approximately $63.0 million.
We also hold cash balances in accounts with commercial banks in the United States and foreign countries.These cash balances represent operating balances only and are invested in short-term time deposits of the localbank. Such operating cash balances held at banks outside the United States are denominated in the local currencyand are minor.
Many of our investments carry a degree of interest rate risk. When interest rates fall, our income frominvestments in variable-rate securities declines. When interest rates rise, the fair market value of our investmentsin fixed-rate securities declines. In addition, our investments in equity securities are subject to stock marketvolatility. Due in part to these factors, our future investment income may fall short of expectations or we maysuffer losses in principal if forced to sell securities, which have seen a decline in market value due to changes ininterest rates. We attempt to mitigate risk by holding fixed-rate securities to maturity, but, if our liquidity needsforce us to sell fixed-rate securities prior to maturity, we may experience a loss of principal. We believe that a10% fluctuation in interest rates would not have a material effect on our financial condition or results ofoperations.
Inflation. Although we cannot accurately determine the amounts attributable thereto, we have been affectedby inflation through increased costs of employee compensation and other operational expenses. To the extentpermitted by the marketplace for our products and services, we attempt to recover increases in costs byperiodically increasing prices.
67
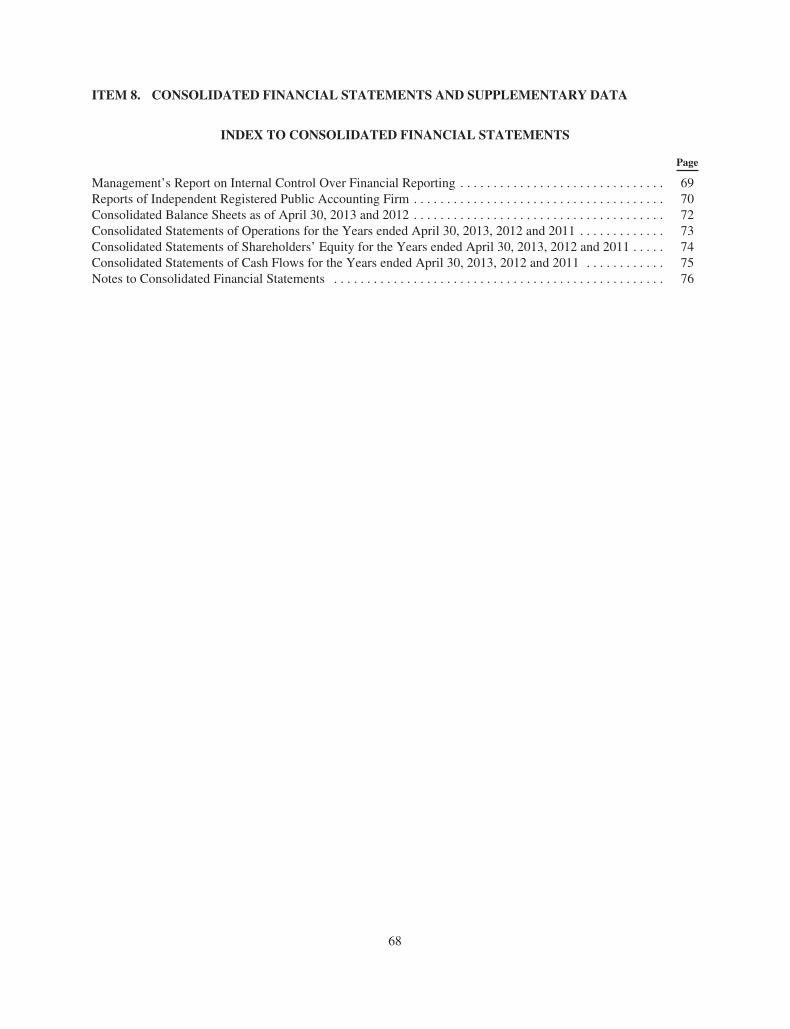
ITEM 8. CONSOLIDATED FINANCIAL STATEMENTS AND SUPPLEMENTARY DATA
INDEX TO CONSOLIDATED FINANCIAL STATEMENTS
Page
Management’s Report on Internal Control Over Financial Reporting . . . . . . . . . . . . . . . . . . . . . . . . . . . . . . . 69Reports of Independent Registered Public Accounting Firm . . . . . . . . . . . . . . . . . . . . . . . . . . . . . . . . . . . . . . 70Consolidated Balance Sheets as of April 30, 2013 and 2012 . . . . . . . . . . . . . . . . . . . . . . . . . . . . . . . . . . . . . . 72Consolidated Statements of Operations for the Years ended April 30, 2013, 2012 and 2011 . . . . . . . . . . . . . 73Consolidated Statements of Shareholders’ Equity for the Years ended April 30, 2013, 2012 and 2011 . . . . . 74Consolidated Statements of Cash Flows for the Years ended April 30, 2013, 2012 and 2011 . . . . . . . . . . . . 75Notes to Consolidated Financial Statements . . . . . . . . . . . . . . . . . . . . . . . . . . . . . . . . . . . . . . . . . . . . . . . . . . 76
68

(a) Management’s Report on Internal Control Over Financial Reporting
Our management is responsible for establishing and maintaining adequate internal control over financialreporting for us. Internal control over financial reporting is a process designed by or under the supervision of ourCEO and CFO, and effectively by our Board of Directors, management and other personnel to providereasonable assurance regarding the reliability of financial reporting and the preparation of financial statementsfor external purposes in accordance with U.S. generally accepted accounting principles and includes thosepolicies and procedures that:
• Pertain to the maintenance of records that, in reasonable detail, accurately and fairly reflect ourtransactions and dispositions of our assets;
• Provide reasonable assurance that transactions are recorded as necessary to permit preparation offinancial statements in accordance with U.S. generally accepted accounting principles, and that receiptsand expenditures are being made only in accordance with authorizations from our management anddirectors; and
• Provide reasonable assurance regarding prevention or timely detection of unauthorized acquisition, useor disposition of our assets that could have a material effect on the financial statements.
Because of its inherent limitations, there is a risk that material misstatements may not be prevented ordetected on a timely basis by internal control over financial reporting. Also, projections of any evaluation ofeffectiveness to future periods are subject to the risk that controls may become inadequate because of changes inconditions, or that the degree of compliance with the policies or procedures may deteriorate.
Our management, including our CEO and CFO, assessed the effectiveness of our internal control overfinancial reporting as of April 30, 2013. In making this assessment, our management used the criteria set forth inInternal Control—Integrated Framework published by the Committee of Sponsoring Organizations of theTreadway Commission (COSO). Based on this assessment, our management, including our CEO and CFO, hasconcluded that our internal control over financial reporting was effective as of April 30, 2013.
KPMG LLP, our independent registered public accounting firm, has issued an attestation report on theeffectiveness of our internal control over financial reporting as of April 30, 2013, and this attestation reportfollows immediately below.
69

(b) Report of Independent Registered Public Accounting Firm
The Board of Directors and ShareholdersAmerican Software, Inc.:
We have audited American Software, Inc.’s internal control over financial reporting as of April 30, 2013,based on criteria established in Internal Control—Integrated Framework issued by the Committee of SponsoringOrganizations of the Treadway Commission (COSO). American Software, Inc.’s management is responsible formaintaining effective internal control over financial reporting and for its assessment of the effectiveness ofinternal control over financial reporting, included in the accompanying Management’s Report on Internal ControlOver Financial Reporting (Item 8(a)). Our responsibility is to express an opinion on American Software, Inc.’sinternal control over financial reporting based on our audit.
We conducted our audit in accordance with the standards of the Public Company Accounting OversightBoard (United States). Those standards require that we plan and perform the audit to obtain reasonable assuranceabout whether effective internal control over financial reporting was maintained in all material respects. Ouraudit included obtaining an understanding of internal control over financial reporting, assessing the risk that amaterial weakness exists, and testing and evaluating the design and operating effectiveness of internal controlbased on the assessed risk. Our audit also included performing such other procedures as we considered necessaryin the circumstances. We believe that our audit provides a reasonable basis for our opinion.
A company’s internal control over financial reporting is a process designed to provide reasonable assuranceregarding the reliability of financial reporting and the preparation of financial statements for external purposes inaccordance with generally accepted accounting principles. A company’s internal control over financial reportingincludes those policies and procedures that (1) pertain to the maintenance of records that, in reasonable detail,accurately and fairly reflect the transactions and dispositions of the assets of the company; (2) provide reasonableassurance that transactions are recorded as necessary to permit preparation of financial statements in accordancewith generally accepted accounting principles, and that receipts and expenditures of the company are being madeonly in accordance with authorizations of management and directors of the company; and (3) provide reasonableassurance regarding prevention or timely detection of unauthorized acquisition, use, or disposition of thecompany’s assets that could have a material effect on the financial statements.
Because of its inherent limitations, internal control over financial reporting may not prevent or detectmisstatements. Also, projections of any evaluation of effectiveness to future periods are subject to the risk thatcontrols may become inadequate because of changes in conditions, or that the degree of compliance with thepolicies or procedures may deteriorate.
In our opinion, American Software, Inc. maintained, in all material respects, effective internal control overfinancial reporting as of April 30, 2013, based on criteria established in Internal Control—Integrated Frameworkissued by COSO.
We also have audited, in accordance with the standards of the Public Company Accounting Oversight Board(United States), the consolidated balance sheets of American Software, Inc. and subsidiaries as of April 30, 2013and 2012, and the related consolidated statements of operations, shareholders’ equity, and cash flows for each ofthe years in the three-year period ended April 30, 2013, and our report dated July 12, 2013 expressed anunqualified opinion on those consolidated financial statements.
/s/ KPMG LLP
Atlanta, GeorgiaJuly 12, 2013
70

(c) Report of Independent Registered Public Accounting Firm
The Board of Directors and ShareholdersAmerican Software, Inc.:
We have audited the accompanying consolidated balance sheets of American Software, Inc. and subsidiaries(the “Company”) as of April 30, 2013 and 2012, and the related consolidated statements of operations,shareholders’ equity, and cash flows for each of the years in the three-year period ended April 30, 2013. Inconnection with our audits of the consolidated financial statements, we also have audited the financial statementschedule. These consolidated financial statements and the financial statement schedule are the responsibility ofthe Company’s management. Our responsibility is to express an opinion on these consolidated financialstatements and financial statement schedule based on our audits.
We conducted our audits in accordance with the standards of the Public Company Accounting OversightBoard (United States). Those standards require that we plan and perform the audit to obtain reasonable assuranceabout whether the financial statements are free of material misstatement. An audit includes examining, on a testbasis, evidence supporting the amounts and disclosures in the financial statements. An audit also includesassessing the accounting principles used and significant estimates made by management, as well as evaluatingthe overall financial statement presentation. We believe that our audits provide a reasonable basis for ouropinion.
In our opinion, the consolidated financial statements referred to above present fairly, in all material respects,the financial position of American Software, Inc. and subsidiaries as of April 30, 2013 and 2012, and the resultsof their operations and their cash flows for each of the years in the three-year period ended April 30, 2013, inconformity with U.S. generally accepted accounting principles. Also, in our opinion, the related financialstatement schedule, when considered in relation to the basic consolidated financial statements taken as a whole,presents fairly, in all material respects, the information set forth therein.
We also have audited, in accordance with the standards of the Public Company Accounting Oversight Board(United States), American Software, Inc.’s internal control over financial reporting as of April 30, 2013, based oncriteria established in Internal Control—Integrated Framework issued by the Committee of SponsoringOrganizations of the Treadway Commission (COSO), and our report dated July 12, 2013 expressed anunqualified opinion on the effectiveness of the Company’s internal control over financial reporting.
/s/ KPMG LLP
Atlanta, GeorgiaJuly 12, 2013
71

American Software, Inc. and Subsidiaries
Consolidated Balance Sheets
April 30, 2013 and 2012(in thousands, except share data)
2013 2012
ASSETSCurrent assets:
Cash and cash equivalents . . . . . . . . . . . . . . . . . . . . . . . . . . . . . . . . . . . . . . . . . . . . . . . $ 41,164 $ 39,111Investments . . . . . . . . . . . . . . . . . . . . . . . . . . . . . . . . . . . . . . . . . . . . . . . . . . . . . . . . . . 18,602 20,251Trade accounts receivable, less allowance for doubtful accounts of $337 at April 30,2013 and $171 at April 30, 2012:Billed . . . . . . . . . . . . . . . . . . . . . . . . . . . . . . . . . . . . . . . . . . . . . . . . . . . . . . . . . . . 13,179 15,205Unbilled . . . . . . . . . . . . . . . . . . . . . . . . . . . . . . . . . . . . . . . . . . . . . . . . . . . . . . . . . 3,741 4,607
Deferred income taxes . . . . . . . . . . . . . . . . . . . . . . . . . . . . . . . . . . . . . . . . . . . . . . . . . . — 34Prepaid expenses and other current assets . . . . . . . . . . . . . . . . . . . . . . . . . . . . . . . . . . 3,162 3,184
Total current assets . . . . . . . . . . . . . . . . . . . . . . . . . . . . . . . . . . . . . . . . . . . . 79,848 82,392Investments—noncurrent . . . . . . . . . . . . . . . . . . . . . . . . . . . . . . . . . . . . . . . . . . . . . . . . . . . 6,658 7,508Property and equipment, net . . . . . . . . . . . . . . . . . . . . . . . . . . . . . . . . . . . . . . . . . . . . . . . . . 4,482 4,912Capitalized software, net . . . . . . . . . . . . . . . . . . . . . . . . . . . . . . . . . . . . . . . . . . . . . . . . . . . . 8,708 7,791Goodwill . . . . . . . . . . . . . . . . . . . . . . . . . . . . . . . . . . . . . . . . . . . . . . . . . . . . . . . . . . . . . . . . 12,601 12,601Other intangibles, net . . . . . . . . . . . . . . . . . . . . . . . . . . . . . . . . . . . . . . . . . . . . . . . . . . . . . . 687 1,263Other assets . . . . . . . . . . . . . . . . . . . . . . . . . . . . . . . . . . . . . . . . . . . . . . . . . . . . . . . . . . . . . . 86 86
Total assets . . . . . . . . . . . . . . . . . . . . . . . . . . . . . . . . . . . . . . . . . . . . . . . . . . $113,070 $116,553
LIABILITIES AND SHAREHOLDERS’ EQUITYCurrent liabilities:
Accounts payable . . . . . . . . . . . . . . . . . . . . . . . . . . . . . . . . . . . . . . . . . . . . . . . . . . . . . $ 1,207 $ 1,042Accrued compensation and related costs . . . . . . . . . . . . . . . . . . . . . . . . . . . . . . . . . . . 2,961 5,169Dividends payable . . . . . . . . . . . . . . . . . . . . . . . . . . . . . . . . . . . . . . . . . . . . . . . . . . . . . — 2,433Other current liabilities . . . . . . . . . . . . . . . . . . . . . . . . . . . . . . . . . . . . . . . . . . . . . . . . . 2,969 4,198Deferred income taxes . . . . . . . . . . . . . . . . . . . . . . . . . . . . . . . . . . . . . . . . . . . . . . . . . . 332 —Deferred revenue . . . . . . . . . . . . . . . . . . . . . . . . . . . . . . . . . . . . . . . . . . . . . . . . . . . . . . 21,291 19,441
Total current liabilities . . . . . . . . . . . . . . . . . . . . . . . . . . . . . . . . . . . . . . . . . . . . . 28,760 32,283Deferred income taxes . . . . . . . . . . . . . . . . . . . . . . . . . . . . . . . . . . . . . . . . . . . . . . . . . . . . . . 1,066 1,240
Total liabilities . . . . . . . . . . . . . . . . . . . . . . . . . . . . . . . . . . . . . . . . . . . . . . . . . . . 29,826 33,523Shareholders’ equity:
Common stock:Class A, $.10 par value. Authorized 50,000,000 shares: Issued 29,184,846shares at April 30, 2013 and 28,798,490 shares at April 30, 2012 . . . . . . . . . . 2,918 2,880
Class B, $.10 par value. Authorized 10,000,000 shares: Issued and outstanding2,587,086 shares at April 30, 2013 and April 30, 2012; convertible intoClass A shares on a one-for-one basis . . . . . . . . . . . . . . . . . . . . . . . . . . . . . . . . 259 259
Additional paid-in capital . . . . . . . . . . . . . . . . . . . . . . . . . . . . . . . . . . . . . . . . . . . . . . . 98,947 95,386Retained earnings . . . . . . . . . . . . . . . . . . . . . . . . . . . . . . . . . . . . . . . . . . . . . . . . . . . . . 5,398 8,024Class A treasury stock, 4,444,815 shares at April 30, 2013 and 4,348,663 shares atApril 30, 2012, at cost . . . . . . . . . . . . . . . . . . . . . . . . . . . . . . . . . . . . . . . . . . . . . . . . (24,278) (23,519)
Total shareholders’ equity . . . . . . . . . . . . . . . . . . . . . . . . . . . . . . . . . . . . . . . 83,244 83,030
Commitments and contingenciesTotal liabilities and shareholders’ equity . . . . . . . . . . . . . . . . . . . . . . . . . . . $113,070 $116,553
See accompanying notes to consolidated financial statements.
72

American Software, Inc. and Subsidiaries
Consolidated Statements of Operations
Years ended April 30, 2013, 2012, and 2011(In thousands, except per share data)
2013 2012 2011
Revenues:License . . . . . . . . . . . . . . . . . . . . . . . . . . . . . . . . . . . . . . . . . . . . . . . . . . . . . $ 21,184 $ 27,826 $19,240Services and other . . . . . . . . . . . . . . . . . . . . . . . . . . . . . . . . . . . . . . . . . . . . 45,323 42,380 36,960Maintenance . . . . . . . . . . . . . . . . . . . . . . . . . . . . . . . . . . . . . . . . . . . . . . . . . 33,960 32,430 29,389
Total revenues . . . . . . . . . . . . . . . . . . . . . . . . . . . . . . . . . . . . . . . . . . . 100,467 102,636 85,589
Cost of revenues:License . . . . . . . . . . . . . . . . . . . . . . . . . . . . . . . . . . . . . . . . . . . . . . . . . . . . . 6,026 7,142 5,828Services and other . . . . . . . . . . . . . . . . . . . . . . . . . . . . . . . . . . . . . . . . . . . . 31,870 31,101 27,205Maintenance . . . . . . . . . . . . . . . . . . . . . . . . . . . . . . . . . . . . . . . . . . . . . . . . . 7,664 7,597 7,152
Total cost of revenues . . . . . . . . . . . . . . . . . . . . . . . . . . . . . . . . . . . . . 45,560 45,840 40,185
Gross margin . . . . . . . . . . . . . . . . . . . . . . . . . . . . . . . . . . . . . . . . . . . . 54,907 56,796 45,404
Research and development . . . . . . . . . . . . . . . . . . . . . . . . . . . . . . . . . . . . . . . . . . 8,882 8,226 7,388Sales and marketing . . . . . . . . . . . . . . . . . . . . . . . . . . . . . . . . . . . . . . . . . . . . . . . 19,829 18,797 15,720General and administrative . . . . . . . . . . . . . . . . . . . . . . . . . . . . . . . . . . . . . . . . . 11,911 13,070 12,200Amortization of acquisition-related intangibles . . . . . . . . . . . . . . . . . . . . . . . . . . 501 535 684Severance expenses . . . . . . . . . . . . . . . . . . . . . . . . . . . . . . . . . . . . . . . . . . . . . . . — — 219
Total operating expenses . . . . . . . . . . . . . . . . . . . . . . . . . . . . . . . . . . . 41,123 40,628 36,211
Operating income . . . . . . . . . . . . . . . . . . . . . . . . . . . . . . . . . . . . . . . . . 13,784 16,168 9,193Other income:
Interest income . . . . . . . . . . . . . . . . . . . . . . . . . . . . . . . . . . . . . . . . . . . . . . . 1,140 1,288 1,421Other, net, primarily investment income/(loss) . . . . . . . . . . . . . . . . . . . . . . 601 (185) 520
Earnings before income taxes . . . . . . . . . . . . . . . . . . . . . . . . . . . . . . . 15,525 17,271 11,134Income tax expense . . . . . . . . . . . . . . . . . . . . . . . . . . . . . . . . . . . . . . . . . . . . . . . (5,114) (5,928) (3,770)
Net earnings. . . . . . . . . . . . . . . . . . . . . . . . . . . . . . . . . . . . . . . . . . . . . . $ 10,411 $ 11,343 $ 7,364
Earnings per common share:(a)Basic . . . . . . . . . . . . . . . . . . . . . . . . . . . . . . . . . . . . . . . . . . . . . . . . . . . . . . . $ 0.38 $ 0.43 $ 0.29
Diluted . . . . . . . . . . . . . . . . . . . . . . . . . . . . . . . . . . . . . . . . . . . . . . . . . . . . . $ 0.38 $ 0.42 $ 0.28
Shares used in the calculation of earnings per common share:Basic . . . . . . . . . . . . . . . . . . . . . . . . . . . . . . . . . . . . . . . . . . . . . . . . . . . . . . . 27,173 26,455 25,751Diluted . . . . . . . . . . . . . . . . . . . . . . . . . . . . . . . . . . . . . . . . . . . . . . . . . . . . . 27,629 27,098 26,183
(a) Basic per share amounts are the same for Class A and Class B shares. Diluted per share amounts for Class Ashares are shown above. Diluted per share for Class B shares under the two-class method are $0.38, $0.43and $0.29 for the years ended April 30, 2013, 2012 and 2011, respectively. See Note 1 to the ConsolidatedFinancial Statements.
See accompanying notes to consolidated financial statements.
73
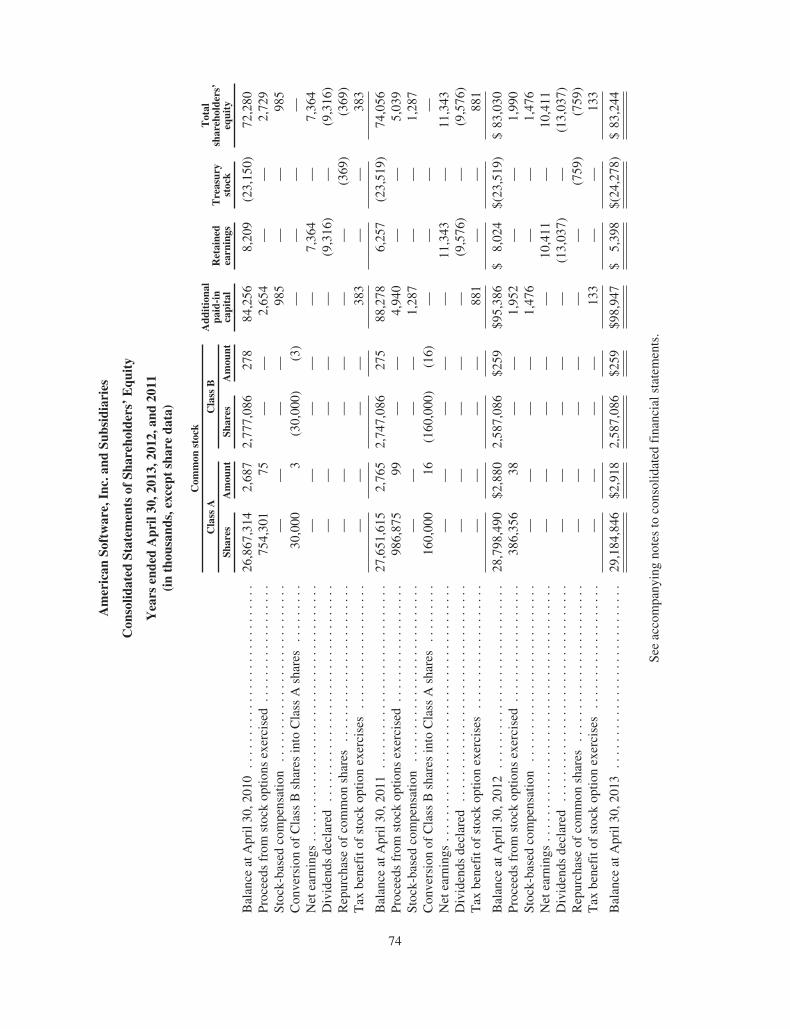
American
Software,Inc.an
dSu
bsidiaries
Con
solid
ated
Statem
entsof
Shareholders’Equ
ity
Years
endedApril30,2013,2012,and
2011
(inthou
sand
s,except
shareda
ta)
Com
mon
stock
Add
itiona
lpa
id-in
capital
Retained
earnings
Treasury
stock
Total
shareholders’
equity
Class
AClass
B
Shares
Amou
ntSh
ares
Amou
nt
Balance
atApril30,2010
............................
26,867,314
2,687
2,777,086
278
84,256
8,209
(23,150)
72,280
Proceeds
from
stockoptio
nsexercised..................
754,301
75—
—2,654
——
2,729
Stock-basedcompensation
...........................
——
——
985
——
985
Conversionof
Class
Bshares
into
Class
Ashares
.........
30,000
3(30,000)
(3)
——
——
Netearnings
.......................................
——
——
—7,364
—7,364
Dividends
declared
..................
...............
——
——
—(9,316)
—(9,316)
Repurchaseof
common
shares
..........
..............
——
——
——
(369)
(369)
Tax
benefito
fstockoptio
nexercises
...................
——
——
383
——
383
Balance
atApril30,2011
............................
27,651,615
2,765
2,747,086
275
88,278
6,257
(23,519)
74,056
Proceeds
from
stockoptio
nsexercised..................
986,875
99—
—4,940
——
5,039
Stock-basedcompensation
...........................
——
——
1,287
——
1,287
Conversionof
Class
Bshares
into
Class
Ashares
.........
160,000
16(160,000)
(16)
——
——
Netearnings
.......................................
——
——
—11,343
—11,343
Dividends
declared
..................
...............
——
——
—(9,576)
—(9,576)
Tax
benefito
fstockoptio
nexercises
....
...............
——
——
881
——
881
Balance
atApril30,2012
............................
28,798,490
$2,880
2,587,086
$259
$95,386
$8,024
$(23,519)
$83,030
Proceeds
from
stockoptio
nsexercised..................
386,356
38—
—1,952
——
1,990
Stock-basedcompensation
...........................
——
——
1,476
——
1,476
Netearnings
.......................................
——
——
—10,411
—10,411
Dividends
declared
..................
...............
——
——
—(13,037)
—(13,037)
Repurchaseof
common
shares
..........
..............
——
——
——
(759)
(759)
Tax
benefito
fstockoptio
nexercises
...................
——
——
133
——
133
Balance
atApril30,2013
............................
29,184,846
$2,918
2,587,086
$259
$98,947
$5,398
$(24,278)
$83,244
Seeaccompanyingnotesto
consolidated
financialstatements.
74
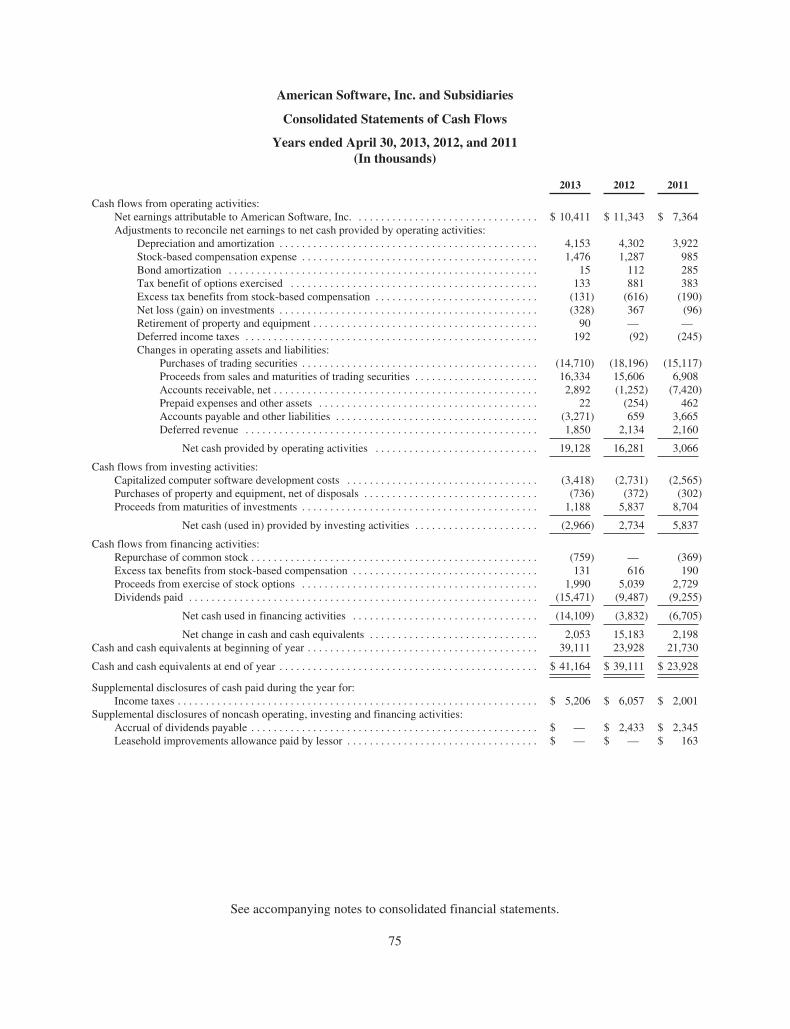
American Software, Inc. and Subsidiaries
Consolidated Statements of Cash Flows
Years ended April 30, 2013, 2012, and 2011(In thousands)
2013 2012 2011
Cash flows from operating activities:Net earnings attributable to American Software, Inc. . . . . . . . . . . . . . . . . . . . . . . . . . . . . . . . . $ 10,411 $ 11,343 $ 7,364Adjustments to reconcile net earnings to net cash provided by operating activities:
Depreciation and amortization . . . . . . . . . . . . . . . . . . . . . . . . . . . . . . . . . . . . . . . . . . . . . . 4,153 4,302 3,922Stock-based compensation expense . . . . . . . . . . . . . . . . . . . . . . . . . . . . . . . . . . . . . . . . . . 1,476 1,287 985Bond amortization . . . . . . . . . . . . . . . . . . . . . . . . . . . . . . . . . . . . . . . . . . . . . . . . . . . . . . . 15 112 285Tax benefit of options exercised . . . . . . . . . . . . . . . . . . . . . . . . . . . . . . . . . . . . . . . . . . . . 133 881 383Excess tax benefits from stock-based compensation . . . . . . . . . . . . . . . . . . . . . . . . . . . . . (131) (616) (190)Net loss (gain) on investments . . . . . . . . . . . . . . . . . . . . . . . . . . . . . . . . . . . . . . . . . . . . . . (328) 367 (96)Retirement of property and equipment . . . . . . . . . . . . . . . . . . . . . . . . . . . . . . . . . . . . . . . . 90 — —Deferred income taxes . . . . . . . . . . . . . . . . . . . . . . . . . . . . . . . . . . . . . . . . . . . . . . . . . . . . 192 (92) (245)Changes in operating assets and liabilities:
Purchases of trading securities . . . . . . . . . . . . . . . . . . . . . . . . . . . . . . . . . . . . . . . . . . (14,710) (18,196) (15,117)Proceeds from sales and maturities of trading securities . . . . . . . . . . . . . . . . . . . . . . 16,334 15,606 6,908Accounts receivable, net . . . . . . . . . . . . . . . . . . . . . . . . . . . . . . . . . . . . . . . . . . . . . . . 2,892 (1,252) (7,420)Prepaid expenses and other assets . . . . . . . . . . . . . . . . . . . . . . . . . . . . . . . . . . . . . . . 22 (254) 462Accounts payable and other liabilities . . . . . . . . . . . . . . . . . . . . . . . . . . . . . . . . . . . . (3,271) 659 3,665Deferred revenue . . . . . . . . . . . . . . . . . . . . . . . . . . . . . . . . . . . . . . . . . . . . . . . . . . . . 1,850 2,134 2,160
Net cash provided by operating activities . . . . . . . . . . . . . . . . . . . . . . . . . . . . . 19,128 16,281 3,066
Cash flows from investing activities:Capitalized computer software development costs . . . . . . . . . . . . . . . . . . . . . . . . . . . . . . . . . . (3,418) (2,731) (2,565)Purchases of property and equipment, net of disposals . . . . . . . . . . . . . . . . . . . . . . . . . . . . . . . (736) (372) (302)Proceeds from maturities of investments . . . . . . . . . . . . . . . . . . . . . . . . . . . . . . . . . . . . . . . . . . 1,188 5,837 8,704
Net cash (used in) provided by investing activities . . . . . . . . . . . . . . . . . . . . . . (2,966) 2,734 5,837
Cash flows from financing activities:Repurchase of common stock . . . . . . . . . . . . . . . . . . . . . . . . . . . . . . . . . . . . . . . . . . . . . . . . . . . (759) — (369)Excess tax benefits from stock-based compensation . . . . . . . . . . . . . . . . . . . . . . . . . . . . . . . . . 131 616 190Proceeds from exercise of stock options . . . . . . . . . . . . . . . . . . . . . . . . . . . . . . . . . . . . . . . . . . 1,990 5,039 2,729Dividends paid . . . . . . . . . . . . . . . . . . . . . . . . . . . . . . . . . . . . . . . . . . . . . . . . . . . . . . . . . . . . . . (15,471) (9,487) (9,255)
Net cash used in financing activities . . . . . . . . . . . . . . . . . . . . . . . . . . . . . . . . . (14,109) (3,832) (6,705)
Net change in cash and cash equivalents . . . . . . . . . . . . . . . . . . . . . . . . . . . . . . 2,053 15,183 2,198Cash and cash equivalents at beginning of year . . . . . . . . . . . . . . . . . . . . . . . . . . . . . . . . . . . . . . . . . 39,111 23,928 21,730
Cash and cash equivalents at end of year . . . . . . . . . . . . . . . . . . . . . . . . . . . . . . . . . . . . . . . . . . . . . . $ 41,164 $ 39,111 $ 23,928
Supplemental disclosures of cash paid during the year for:Income taxes . . . . . . . . . . . . . . . . . . . . . . . . . . . . . . . . . . . . . . . . . . . . . . . . . . . . . . . . . . . . . . . . $ 5,206 $ 6,057 $ 2,001
Supplemental disclosures of noncash operating, investing and financing activities:Accrual of dividends payable . . . . . . . . . . . . . . . . . . . . . . . . . . . . . . . . . . . . . . . . . . . . . . . . . . . $ — $ 2,433 $ 2,345Leasehold improvements allowance paid by lessor . . . . . . . . . . . . . . . . . . . . . . . . . . . . . . . . . . $ — $ — $ 163
See accompanying notes to consolidated financial statements.
75

American Software, Inc. and Subsidiaries
Notes to Consolidated Financial Statements
April 30, 2013, 2012, and 2011
(1) Presentation and Summary of Significant Accounting Policies
(a) Basis of Presentation
Founded in 1970 and headquartered in Atlanta, Georgia, American Software, Inc. and its subsidiaries(collectively, the “Company”) are engaged in the development, marketing, and support activities of a broad rangeof computer business application software products. The Company’s operations are principally in the computersoftware industry, and its products and services are used by customers within the United States and certaininternational markets. We provide our software solutions through three major business segments, which arefurther broken down into a total of four major product and service groups. The three business segments are(1) Supply Chain Management (SCM), (2) Enterprise Resource Planning (ERP), and (3) Information Technology(IT) Consulting.
• The SCM segment consists of our subsidiary, Logility, Inc. (see Note 8), which provides collaborativesupply chain solutions to streamline and optimize the production, distribution and management ofproducts between trading partners and Demand Management, Inc. (“DMI”), a wholly-owned subsidiaryof Logility.
• The ERP segment consists of (1) American Software USA, Inc., which provides purchasing andmaterials management, customer order processing, financial, e-commerce, Flow Manufacturing andtraditional manufacturing solutions, and (2) New Generation Computing (NGC), which providesindustry specific business software to both retailers and manufacturers primarily in the apparel, sewnproducts and furniture industries.
• The IT Consulting segment consists of The Proven Method, Inc., an IT staffing and consulting servicesfirm.
(b) Principles of Consolidation
The consolidated financial statements include the accounts of American Software, Inc. and its wholly-owned subsidiaries. All significant intercompany balances and transactions have been eliminated inconsolidation.
(c) Revenue Recognition and Deferred Revenue
The Company recognizes revenue in accordance with the Software Revenue Recognition Topic of theFinancial Accounting Standards Board’s (FASB) Accounting Standards Codification.
License. License revenue in connection with license agreements for standard proprietary software isrecognized upon delivery of the software, provided collection is considered probable, the fee is fixed ordeterminable, there is evidence of an arrangement, and vendor-specific objective evidence (VSOE) exists withrespect to any undelivered elements of the arrangement. For multiple-element arrangements, the Companyrecognizes revenue under the residual method, whereby (1) the total fair value of the undelivered elements, asindicated by VSOE, is deferred and subsequently recognized and (2) the difference between the totalarrangement fee and the amount deferred for the undelivered elements is recognized as revenue related to thedelivered elements. We record revenues from sales of third-party products in accordance with Principal AgentConsiderations within the Revenue Recognition Topic of the FASB Accounting Standards Codification.Furthermore, we evaluate sales through our indirect channel on a case-by-case basis to determine whether thetransaction should be recorded gross or net, including but not limited to assessing whether or not the Company(1) acts as principal in the transaction, (2) takes title to the products, (3) has risks and rewards of ownership, such
76

American Software, Inc. and Subsidiaries
Notes to Consolidated Financial Statements—(Continued)
April 30, 2013, 2012, and 2011
as the risk of loss for collection, delivery, or returns, and (4) acts as an agent or broker with compensation on acommission or fee basis. Accordingly, in most cases we record our sales through the DMI channel on a grossbasis.
Subscription and other recurring revenues include fees for access rights to software solutions that areoffered under a subscription-based delivery model where the users do not take possession of the software. Underthis model, the software applications are hosted by the Company or by a third party and the customer accessesand uses the software on an as-needed basis over the Internet or via a dedicated line. The underlyingarrangements typically (i) include a single fee for the service that is billed monthly, quarterly or annually,(ii) cover a period from 36 to 60 months and (iii) do not provide the customer with an option to take delivery ofthe software at any time during or after the subscription term. In addition, subscription and other recurringrevenues include subscription-based software license revenues where the customer has taken physical possessionof the software for a defined period of time. Subscription revenues are recognized ratably over the subscriptionterm beginning on the commencement dates of each contract. As of April 30, 2013, revenue recorded under thisaccounting treatment has been minimal.
Maintenance. Revenue derived from maintenance contracts primarily includes telephone consulting,product updates, and releases of new versions of products previously purchased by the customer, as well as errorreporting and correction services. Maintenance contracts are typically sold for a separate fee with initialcontractual periods ranging from one to three years with renewal for additional periods thereafter. Maintenancefees are generally billed annually in advance. Maintenance revenue is recognized ratably over the term of themaintenance agreement. In situations where all or a portion of the maintenance fee is bundled with the licensefee, revenue/VSOE for maintenance is determined based on prices when sold separately.
Services. Revenue derived from services primarily includes consulting, implementation, and training. Feesare primarily billed under time and materials arrangements and are recognized as services are performed. Inaccordance with the other presentation matters within the Revenue Recognition Topic of the FASB AccountingStandards Codification, the Company recognizes amounts received for reimbursement of travel and other out-of-pocket expenses incurred as revenue in the consolidated statements of operations under services and other.Reimbursements received from customers for out-of-pocket expenses were recorded in revenues and totaledapproximately $2,239,000, $1,903,000, and $1,338,000 for 2013, 2012 and 2011, respectively.
Indirect Channel Revenue. We recognize revenues for sales made through indirect channels principallywhen the distributor makes the sale to an end-user, when the license fee is fixed or determinable, the license feeis nonrefundable, and the sale meets all other conditions for revenue recognition.
Deferred Revenue. Deferred revenue represents advance payments or billings for software licenses,services, and maintenance billed in advance of the time revenue is recognized.
Sales Taxes. We account for sales taxes collected from customers on a net basis.
Unbilled Accounts Receivable. The unbilled receivable balance consists of amounts generated from licensefee and services revenues. At April 30, 2013 and 2012, unbilled license fees were approximately $1.1 million and$1.0 million, respectively, and unbilled services revenues were approximately $2.7 million and $3.6 million,respectively. Unbilled license fee accounts receivable represents revenue that has been recognized but under theterms of the license agreement, which include specified payment terms that are considered normal andcustomary, certain payments have not yet been invoiced to the customers. Unbilled services revenues primarilyoccur due to the timing of the respective billings, which occur subsequent to the end of each reporting period.
77
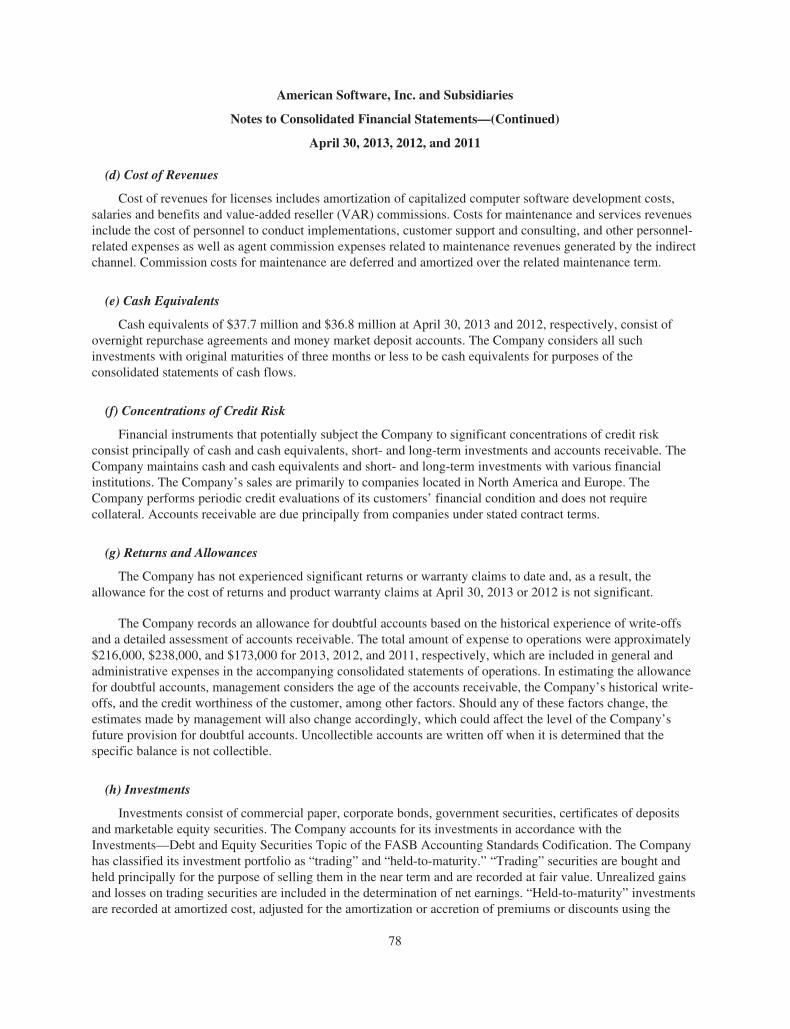
American Software, Inc. and Subsidiaries
Notes to Consolidated Financial Statements—(Continued)
April 30, 2013, 2012, and 2011
(d) Cost of Revenues
Cost of revenues for licenses includes amortization of capitalized computer software development costs,salaries and benefits and value-added reseller (VAR) commissions. Costs for maintenance and services revenuesinclude the cost of personnel to conduct implementations, customer support and consulting, and other personnel-related expenses as well as agent commission expenses related to maintenance revenues generated by the indirectchannel. Commission costs for maintenance are deferred and amortized over the related maintenance term.
(e) Cash Equivalents
Cash equivalents of $37.7 million and $36.8 million at April 30, 2013 and 2012, respectively, consist ofovernight repurchase agreements and money market deposit accounts. The Company considers all suchinvestments with original maturities of three months or less to be cash equivalents for purposes of theconsolidated statements of cash flows.
(f) Concentrations of Credit Risk
Financial instruments that potentially subject the Company to significant concentrations of credit riskconsist principally of cash and cash equivalents, short- and long-term investments and accounts receivable. TheCompany maintains cash and cash equivalents and short- and long-term investments with various financialinstitutions. The Company’s sales are primarily to companies located in North America and Europe. TheCompany performs periodic credit evaluations of its customers’ financial condition and does not requirecollateral. Accounts receivable are due principally from companies under stated contract terms.
(g) Returns and Allowances
The Company has not experienced significant returns or warranty claims to date and, as a result, theallowance for the cost of returns and product warranty claims at April 30, 2013 or 2012 is not significant.
The Company records an allowance for doubtful accounts based on the historical experience of write-offsand a detailed assessment of accounts receivable. The total amount of expense to operations were approximately$216,000, $238,000, and $173,000 for 2013, 2012, and 2011, respectively, which are included in general andadministrative expenses in the accompanying consolidated statements of operations. In estimating the allowancefor doubtful accounts, management considers the age of the accounts receivable, the Company’s historical write-offs, and the credit worthiness of the customer, among other factors. Should any of these factors change, theestimates made by management will also change accordingly, which could affect the level of the Company’sfuture provision for doubtful accounts. Uncollectible accounts are written off when it is determined that thespecific balance is not collectible.
(h) Investments
Investments consist of commercial paper, corporate bonds, government securities, certificates of depositsand marketable equity securities. The Company accounts for its investments in accordance with theInvestments—Debt and Equity Securities Topic of the FASB Accounting Standards Codification. The Companyhas classified its investment portfolio as “trading” and “held-to-maturity.” “Trading” securities are bought andheld principally for the purpose of selling them in the near term and are recorded at fair value. Unrealized gainsand losses on trading securities are included in the determination of net earnings. “Held-to-maturity” investmentsare recorded at amortized cost, adjusted for the amortization or accretion of premiums or discounts using the
78

American Software, Inc. and Subsidiaries
Notes to Consolidated Financial Statements—(Continued)
April 30, 2013, 2012, and 2011
effective interest method. For the purposes of computing realized gains and losses, cost is identified on a specificidentification basis. Investments with maturities less than one year as of the balance sheet date are classified asshort-term investments and those that mature greater than one year are classified as long-term investments.
(i) Furniture, Equipment, and Purchased Computer Software
Furniture, equipment and purchased computer software are recorded at cost, less accumulated depreciationand amortization. Depreciation of buildings, computer equipment, purchased computer software, officefurniture and equipment is calculated using the straight-line method based upon the estimated useful lives of theassets (three years for computer equipment and software, seven years for office furniture and equipment andthirty years for buildings). Leasehold improvements are amortized using the straight-line method over theestimated useful lives of the assets or the related lease term, whichever is shorter. Depreciation and amortizationexpense on buildings, furniture, equipment and purchased computer software was $1,076,000, $1,183,000, and$1,232,000 in 2013, 2012 and 2011, respectively.
(j) Capitalized Computer Software Development Costs
The Company capitalizes certain computer software development costs in accordance with the FASBAccounting Standards Codification Costs of Software to be Sold, Leased or Marketed Topic. Costs incurredinternally to create a computer software product or to develop an enhancement to an existing product are chargedto expense when incurred as research and development expense until technological feasibility for the respectiveproduct is established. Thereafter, all software development costs are capitalized and reported at the lower ofunamortized cost or net realizable value. Capitalization ceases when the product or enhancement is available forgeneral release to customers. The Company makes ongoing evaluations of the recoverability of its capitalizedsoftware projects by comparing the net amount capitalized for each product to the estimated net realizable valueof the product. If such evaluations indicate that the unamortized software development costs exceed the netrealizable value, the Company writes off the amount by which the unamortized software development costsexceed net realizable value. Capitalized computer software development costs are being amortized ratably basedon the projected revenues associated with the related software or on a straight-line basis over three years,whichever method results in a higher level of amortization. Amortization of capitalized computer softwaredevelopment costs is included in the cost of license revenues in the consolidated statements of operations.
Total Expenditures and Amortization. Total expenditures for capitalized computer software developmentcosts, total research and development expense, and total amortization of capitalized computer softwaredevelopment costs are as follows:
Years ended April 30,
2013 2012 2011
(in thousands)
Total capitalized computer software development costs . . . . . . . . . . . . . . . . . . . . . . $ 3,418 $ 2,731 $2,565Total research and development expense . . . . . . . . . . . . . . . . . . . . . . . . . . . . . . . . . . 8,882 8,226 7,388
Total research and development expense and capitalized computer softwaredevelopment costs . . . . . . . . . . . . . . . . . . . . . . . . . . . . . . . . . . . . . . . . . . . . . . . . . $12,300 $10,957 $9,953
Total amortization of capitalized computer software development costs . . . . . . . . . $ 2,501 $ 2,502 $1,892
79

American Software, Inc. and Subsidiaries
Notes to Consolidated Financial Statements—(Continued)
April 30, 2013, 2012, and 2011
Capitalized computer software development costs consist of the following at April 30, 2013 and 2012 (inthousands):
2013 2012
Capitalized computer software development costs . . . . . . . . . . . . . . . . . . . . . . . . $16,372 $12,954Accumulated amortization . . . . . . . . . . . . . . . . . . . . . . . . . . . . . . . . . . . . . . . . . . (7,664) (5,163)
$ 8,708 $ 7,791
Of the Company’s capitalized software projects that are currently completed and being amortized, thecompany expects amortization expense for the next five years to be as follows (in thousands):
2014 . . . . . . . . . . . . . . . . . . . . . . . . . . . . . . . . . . . . . . . . . . . . . . . . . . . . . . . . . . . . . . . . $6252015 . . . . . . . . . . . . . . . . . . . . . . . . . . . . . . . . . . . . . . . . . . . . . . . . . . . . . . . . . . . . . . . . —2016 . . . . . . . . . . . . . . . . . . . . . . . . . . . . . . . . . . . . . . . . . . . . . . . . . . . . . . . . . . . . . . . . —2017 . . . . . . . . . . . . . . . . . . . . . . . . . . . . . . . . . . . . . . . . . . . . . . . . . . . . . . . . . . . . . . . . —2018 . . . . . . . . . . . . . . . . . . . . . . . . . . . . . . . . . . . . . . . . . . . . . . . . . . . . . . . . . . . . . . . . —
$625
(k) Acquisition-Related Intangible Assets (exclusive of Logility’s treasury stock repurchases)
Acquisition-related intangible assets are stated at historical cost and include acquired software and certainother intangible assets with definitive lives. The intangible assets are being amortized over a period ranging fromtwo to six years. Total amortization expense related to acquisition-related intangible assets was approximately$501,000, $535,000 and $684,000 for 2013, 2012 and 2011, respectively, and is included in operating expense inthe accompanying consolidated statements of operations.
Acquisition-Related Intangible Assets consist of the following (in thousands):
2013 2012
Current Technology . . . . . . . . . . . . . . . . . . . . . . . . . . . . . . . . . . . . . . . . . . . . . . . . $ 1,370 $ 1,370Customer Relationships . . . . . . . . . . . . . . . . . . . . . . . . . . . . . . . . . . . . . . . . . . . . . 790 790Trademarks . . . . . . . . . . . . . . . . . . . . . . . . . . . . . . . . . . . . . . . . . . . . . . . . . . . . . . . 76 76
2,236 2,236Less accumulated amortization . . . . . . . . . . . . . . . . . . . . . . . . . . . . . . . . . . . . . . . (1,619) (1,118)
$ 617 $ 1,118
The Company expects amortization expense for the next five years to be as follows based on intangibleassets as of April 30, 2013 (in thousands):
2014 . . . . . . . . . . . . . . . . . . . . . . . . . . . . . . . . . . . . . . . . . . . . . . . . . . . . . . . . . . . . . . . . $4722015 . . . . . . . . . . . . . . . . . . . . . . . . . . . . . . . . . . . . . . . . . . . . . . . . . . . . . . . . . . . . . . . . 1452016 . . . . . . . . . . . . . . . . . . . . . . . . . . . . . . . . . . . . . . . . . . . . . . . . . . . . . . . . . . . . . . . . —2017 . . . . . . . . . . . . . . . . . . . . . . . . . . . . . . . . . . . . . . . . . . . . . . . . . . . . . . . . . . . . . . . . —2018 . . . . . . . . . . . . . . . . . . . . . . . . . . . . . . . . . . . . . . . . . . . . . . . . . . . . . . . . . . . . . . . . —
$617
80

American Software, Inc. and Subsidiaries
Notes to Consolidated Financial Statements—(Continued)
April 30, 2013, 2012, and 2011
(l) Goodwill and Other Intangibles
Goodwill represents the excess of costs over fair value of assets of businesses acquired. Goodwill andintangible assets acquired in a purchase business combination and determined to have an indefinite useful life arenot amortized, but instead are tested for impairment at least annually in accordance with the Intangibles-Goodwill and Other Topic of the FASB Accounting Standards Codification. The Company evaluates the carryingvalue of goodwill annually and between annual evaluations if events occur or circumstances change that wouldmore likely than not reduce the fair value of the reporting unit below its carrying amount. Such circumstancescould include, but are not limited to, (1) a significant adverse change in legal factors or in business climate,(2) unanticipated competition, or (3) an adverse action or assessment by a regulator.
In September 2011, the FASB issued an accounting standards update amending the guidance on the annualtesting of goodwill for impairment. The update allows entities to first assess qualitative factors to determinewhether it is more-likely-than-not that the fair value of a reporting unit is less than its carrying value. If a greaterthan 50 percent likelihood exists that the fair value is less than the carrying amount then it is necessary toperform the currently prescribed two-step goodwill impairment test. Otherwise, the two-step goodwillimpairment test is not required.
The Company adopted the new guidance during the fourth quarter of fiscal 2012 and after considering suchqualitative factors as macroeconomic conditions, industry and market conditions, overall financial performanceand other Company-specific factors such as potential changes in strategy, the Company determined that it wasnot more likely than not that any impairment to goodwill occurred during the year ended April 30, 2013.Consequently, the Company was not required to perform the remaining two-step quantitative goodwillimpairment test.
For the year ended April 30, 2011, the Company applied the required quantitative two-step goodwillimpairment test. When evaluating whether the goodwill is impaired, the Company compares the fair value of thereporting unit to which the goodwill is assigned to its carrying amount, including goodwill. The Companyidentifies the reporting unit on a basis that is similar to its method for identifying operating segments as definedby the Segment Reporting Topic of the FASB Accounting Standards Codification. If the carrying amount of areporting unit exceeds its fair value, then the amount of the impairment loss must be measured. This evaluation isapplied annually on each impairment testing date (April 30) unless there is a triggering event present during aninterim period. The Company used the Income and Market approaches to test for goodwill impairment as of theValuation Date. The methodology utilized to implement the Income approach was the discounted cash flowmethodology. The methodologies utilized to implement the Market approach were the comparable companymethodology and the comparable transaction methodology.
The Company considers the following valuation factors in connection with performing annual impairmenttesting:
• The nature of the business or entity, the risks to which it is subject, and its historical patterns of growth;
• The general economic outlook, the position of the industry in the existing economy, and the position ofthe business or entity within its industry;
• The book value and general financial condition of the business or entity;
• The earnings history and earnings capacity of the business or entity;
• The dividend-paying capacity of the business or entity;
81

American Software, Inc. and Subsidiaries
Notes to Consolidated Financial Statements—(Continued)
April 30, 2013, 2012, and 2011
• The market prices of stocks of businesses engaged in related activities, where such stocks are traded onan exchange or over-the-counter;
• Any recent sales of the common stock of the business and the size of the block of stock to be valued;
• The existence of undervalued tangible and intangible assets; and
• Other special factors and circumstances of the business or entity that can be judged as important to theoverall value.
In the event of impairment, the loss would be calculated by comparing the implied fair value of reportingunit goodwill to its carrying amount. In calculating the implied fair value of goodwill, the fair value of thereporting unit is allocated to all of the other assets and liabilities of that unit based on their fair values. The excessof the fair value of a reporting unit over the amount assigned to its other assets and liabilities is the implied fairvalue of goodwill. The Company performed its periodic review of its goodwill for impairment as of April 30,2011 and did not identify any goodwill impairment as a result of the review.
Intangible assets with estimable useful lives are required to be amortized over their respective estimateduseful lives to their estimated residual values, and reviewed for impairment in accordance with the Property,Plant, and Equipment Topic of the FASB Accounting Standards Codification.
Goodwill consisted of the following by segment (in thousands):
Enterprise ResourcePlanning*
Supply ChainManagement**
ITConsulting Total
Balance at April 30, 2011, 2012 and 2013 . . . . . . . . . . . $1,812 $10,789 $— $12,601
* Goodwill related to New Generation Computing, Inc.** Goodwill related to Logility, Inc., Demand Management, Inc. and Optiant, Inc.
Intangible Assets (including Acquisition-Related Intangible Assets) consisted of the following by segment(in thousands):
Enterprise ResourcePlanning
Supply ChainManagement
ITConsulting Total
Balance at April 30, 2011 . . . . . . . . . . . . . . . . . . . . . . . . . . $— $1,880 $— $1,880Amortization expense . . . . . . . . . . . . . . . . . . . . . . . . . . . . . — (617) — (617)
Balance at April 30, 2012 . . . . . . . . . . . . . . . . . . . . . . . . . . $— $1,263 $— $1,263Amortization expense . . . . . . . . . . . . . . . . . . . . . . . . . . . . . — (576) — (576)
Balance at April 30, 2013 . . . . . . . . . . . . . . . . . . . . . . . . . . $— $ 687 $— $ 687
Goodwill and intangible assets include the effects of applying purchase accounting resulting from Logility’sstock repurchases. Total amortization expense related to Logility Stock Buy-back Step Acquisition andpurchased software was approximately $75,000, $82,000 and $112,000 for 2013, 2012 and 2011, respectively.For purposes of the disclosure above, amounts related to the buyback of Logility stock are presented as acomponent of the SCM segment.
82
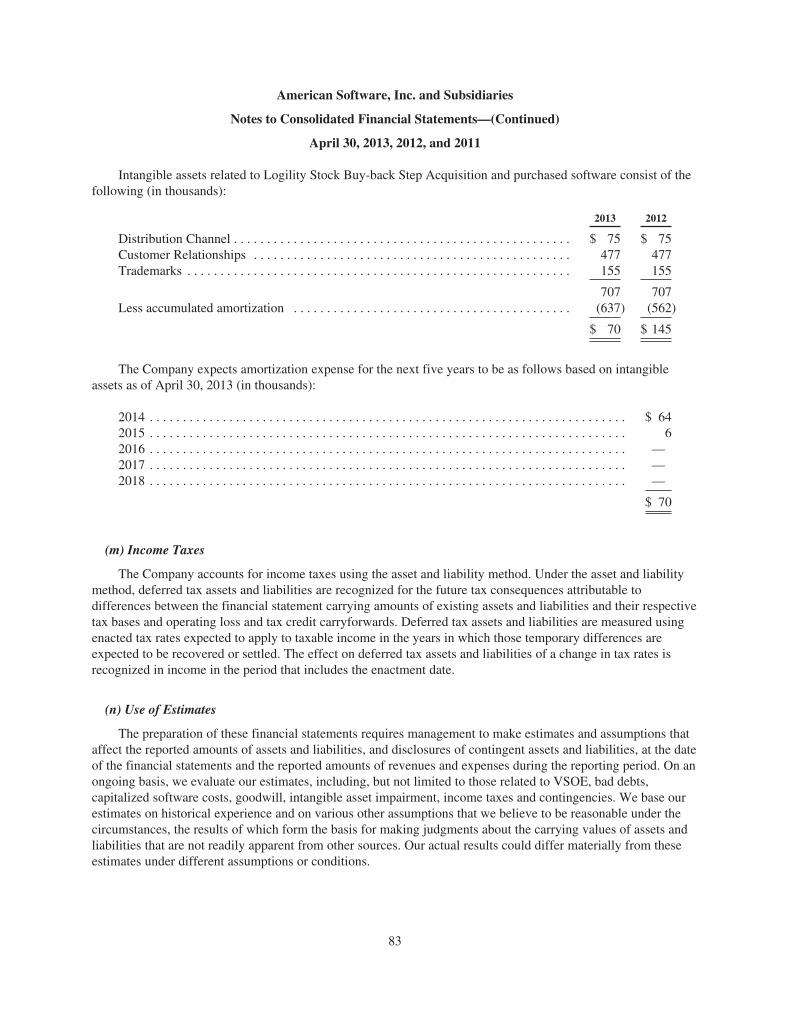
American Software, Inc. and Subsidiaries
Notes to Consolidated Financial Statements—(Continued)
April 30, 2013, 2012, and 2011
Intangible assets related to Logility Stock Buy-back Step Acquisition and purchased software consist of thefollowing (in thousands):
2013 2012
Distribution Channel . . . . . . . . . . . . . . . . . . . . . . . . . . . . . . . . . . . . . . . . . . . . . . . . . . . $ 75 $ 75Customer Relationships . . . . . . . . . . . . . . . . . . . . . . . . . . . . . . . . . . . . . . . . . . . . . . . . 477 477Trademarks . . . . . . . . . . . . . . . . . . . . . . . . . . . . . . . . . . . . . . . . . . . . . . . . . . . . . . . . . . 155 155
707 707Less accumulated amortization . . . . . . . . . . . . . . . . . . . . . . . . . . . . . . . . . . . . . . . . . . (637) (562)
$ 70 $ 145
The Company expects amortization expense for the next five years to be as follows based on intangibleassets as of April 30, 2013 (in thousands):
2014 . . . . . . . . . . . . . . . . . . . . . . . . . . . . . . . . . . . . . . . . . . . . . . . . . . . . . . . . . . . . . . . . . . . . . . . . $ 642015 . . . . . . . . . . . . . . . . . . . . . . . . . . . . . . . . . . . . . . . . . . . . . . . . . . . . . . . . . . . . . . . . . . . . . . . . 62016 . . . . . . . . . . . . . . . . . . . . . . . . . . . . . . . . . . . . . . . . . . . . . . . . . . . . . . . . . . . . . . . . . . . . . . . . —2017 . . . . . . . . . . . . . . . . . . . . . . . . . . . . . . . . . . . . . . . . . . . . . . . . . . . . . . . . . . . . . . . . . . . . . . . . —2018 . . . . . . . . . . . . . . . . . . . . . . . . . . . . . . . . . . . . . . . . . . . . . . . . . . . . . . . . . . . . . . . . . . . . . . . . —
$ 70
(m) Income Taxes
The Company accounts for income taxes using the asset and liability method. Under the asset and liabilitymethod, deferred tax assets and liabilities are recognized for the future tax consequences attributable todifferences between the financial statement carrying amounts of existing assets and liabilities and their respectivetax bases and operating loss and tax credit carryforwards. Deferred tax assets and liabilities are measured usingenacted tax rates expected to apply to taxable income in the years in which those temporary differences areexpected to be recovered or settled. The effect on deferred tax assets and liabilities of a change in tax rates isrecognized in income in the period that includes the enactment date.
(n) Use of Estimates
The preparation of these financial statements requires management to make estimates and assumptions thataffect the reported amounts of assets and liabilities, and disclosures of contingent assets and liabilities, at the dateof the financial statements and the reported amounts of revenues and expenses during the reporting period. On anongoing basis, we evaluate our estimates, including, but not limited to those related to VSOE, bad debts,capitalized software costs, goodwill, intangible asset impairment, income taxes and contingencies. We base ourestimates on historical experience and on various other assumptions that we believe to be reasonable under thecircumstances, the results of which form the basis for making judgments about the carrying values of assets andliabilities that are not readily apparent from other sources. Our actual results could differ materially from theseestimates under different assumptions or conditions.
83

American Software, Inc. and Subsidiaries
Notes to Consolidated Financial Statements—(Continued)
April 30, 2013, 2012, and 2011
(o) Stock Compensation Plans
The Company has four stock-based employee compensation plans under which options to purchase commonstock of the Company were outstanding as of April 30, 2013. Those plans are described more fully in Note 6. Inaddition to two American Software plans, effective July 9, 2009, the Company adopted the Logility, Inc. 1997Stock Plan and Logility, Inc. 2007 Stock Plan as equity plans of the Company in conjunction with theCompany’s acquisition of the shares of Logility common stock it did not previously own.
The Company recorded stock option compensation cost of approximately $1,476,000, $1,287,000 and$985,000 and related income tax benefits of approximately $436,000, $339,000 and $238,000 for the fiscal yearsended April 30, 2013, 2012 and 2011, respectively. Stock-based compensation expense on current year grants isrecorded on a straight-line basis over the vesting period for the entire award directly to additional paid-in capital.
Cash flows resulting from the tax benefits generated by tax deductions in excess of the compensation costrecognized for those options (excess tax benefits) are classified as financing cash flows. During the years endedApril 30, 2013, 2012 and 2011, the Company realized tax benefits from stock options generated in previous andcurrent periods resulting in approximately $131,000, $616,000 and $190,000 of excess tax benefits which areincluded as a component of cash flows from financing activities in the accompanying 2013, 2012 and 2011consolidated statements of cash flows, respectively.
(p) Impairment of Long-Lived Assets
The Company reviews long-lived assets, such as property, plant, and equipment, and purchased intangiblessubject to amortization, for impairment whenever events or changes in circumstances indicate that the carryingamount of an asset may not be recoverable. Recoverability of assets to be held and used is measured by acomparison of the carrying amount of an asset to estimated undiscounted future cash flows expected to begenerated by the asset. If the carrying amount of an asset exceeds its estimated future cash flows, an impairmentcharge is recognized by the amount by which the carrying amount of the asset exceeds the fair value of the asset.Assets to be disposed of by sale would be separately presented in the balance sheet and reported at the lower ofthe carrying amount or fair value less costs to sell, and are no longer depreciated. The assets and liabilities of agroup classified as held for sale would be presented separately in the appropriate asset and liability sections ofthe balance sheet.
(q) Comprehensive Income
The Comprehensive Income Topic of the FASB Accounting Standards Codification establishes standardsfor reporting and presentation of comprehensive income and its components in a full set of financial statements.
The Company did not have any other comprehensive income items for 2013, 2012, or 2011.
(r) Earnings per Common Share
The Company has two classes of common stock of which Class B common shares are convertible intoClass A common shares at any time, on a one-for-one basis. Under the Company’s Articles of Incorporation, ifdividends are declared, holders of Class A common shares shall receive a $.05 dividend per share prior to theClass B common shares receiving any dividend and holders of Class A common shares shall receive a dividendat least equal to Class B common shares dividends on a per share basis. As a result, the Company has computed
84

American Software, Inc. and Subsidiaries
Notes to Consolidated Financial Statements—(Continued)
April 30, 2013, 2012, and 2011
the earnings per share in compliance with the Earnings Per Share Topic of the FASB Accounting StandardsCodification, which requires companies that have multiple classes of equity securities to use the “two-class”method in computing earnings per share.
For the Company’s basic earnings per share calculation, the Company uses the “two-class” method. Basicearnings per share are calculated by dividing net earnings attributable to each class of common stock by theweighted average number of shares outstanding. All undistributed earnings are allocated evenly between Class Aand B common shares in the earnings per share calculation to the extent that earnings equal or exceed $.05 pershare. This allocation is based on management’s judgment after considering the dividend rights of the two-classes of common stock, the control of the Class B shareholders and the convertibility rights of the Class Bshares to Class A shares. Due to Class B shares converting to Class A shares during the period, the distributed netearnings for Class B shares is calculated using the weighted average common shares outstanding during theperiod.
Diluted earnings per share is calculated similarly to basic earnings per share, except that the calculationincludes the dilutive effect of the assumed exercise of options issuable under the Company’s stock incentiveplans. For the Company’s diluted earnings per share calculation for Class A shares, the Company uses the “if-converted” method. This calculation assumes that all Class B common shares are converted into Class Acommon shares and, as a result, assumes there are no holders of Class B common shares to participate inundistributed earnings.
For the Company’s diluted earnings per share calculation for Class B shares, the Company uses the “two-class” method. This calculation does not assume that all Class B common shares are converted into Class Acommon shares. In addition, this method assumes the dilutive effect of Class A stock options were converted toClass A shares and the undistributed earnings are allocated evenly to both Class A and B shares includingClass A shares issued pursuant to those converted stock options. This allocation is based on management’sjudgment after considering the dividend rights of the two-classes of common stock, the control of the Class Bshareholders and the convertibility rights of the Class B shares into Class A shares.
The following tables set forth the computation of basic earnings per common share and diluted earnings percommon share (in thousands except for per share amounts), See Note 6 for total stock options outstanding andpotentially dilutive:
Basic earnings per common share:
Year EndedApril 30, 2013
Year EndedApril 30, 2012
Year EndedApril 30, 2011
Class A Class B Class A Class B Class A Class B
Distributed earnings . . . . . . . . . . . . . . . . . . . . . . . . . . $ 0.48 $ 0.48 $ 0.36 $ 0.36 $ 0.36 $ 0.36Undistributed earnings/(loss) . . . . . . . . . . . . . . . . . . . (0.10) (0.10) 0.07 0.07 (0.07) (0.07)
Total . . . . . . . . . . . . . . . . . . . . . . . . . . . . . . . . . . $ 0.38 $ 0.38 $ 0.43 $ 0.43 $ 0.29 $ 0.29
Distributed earnings . . . . . . . . . . . . . . . . . . . . . . . . . . $11,796 $1,242 $ 8,642 $ 931 $ 8,311 $ 989Undistributed earnings/(loss) . . . . . . . . . . . . . . . . . . . (2,377) (250) 1,595 175 (1,730) (206)
Total . . . . . . . . . . . . . . . . . . . . . . . . . . . . . . . . . . $ 9,419 $ 992 $10,237 $1,106 $ 6,581 $ 783
Basic weighted average common shares . . . . . . . . . . . 24,586 2,587 23,840 2,615 23,004 2,747
85
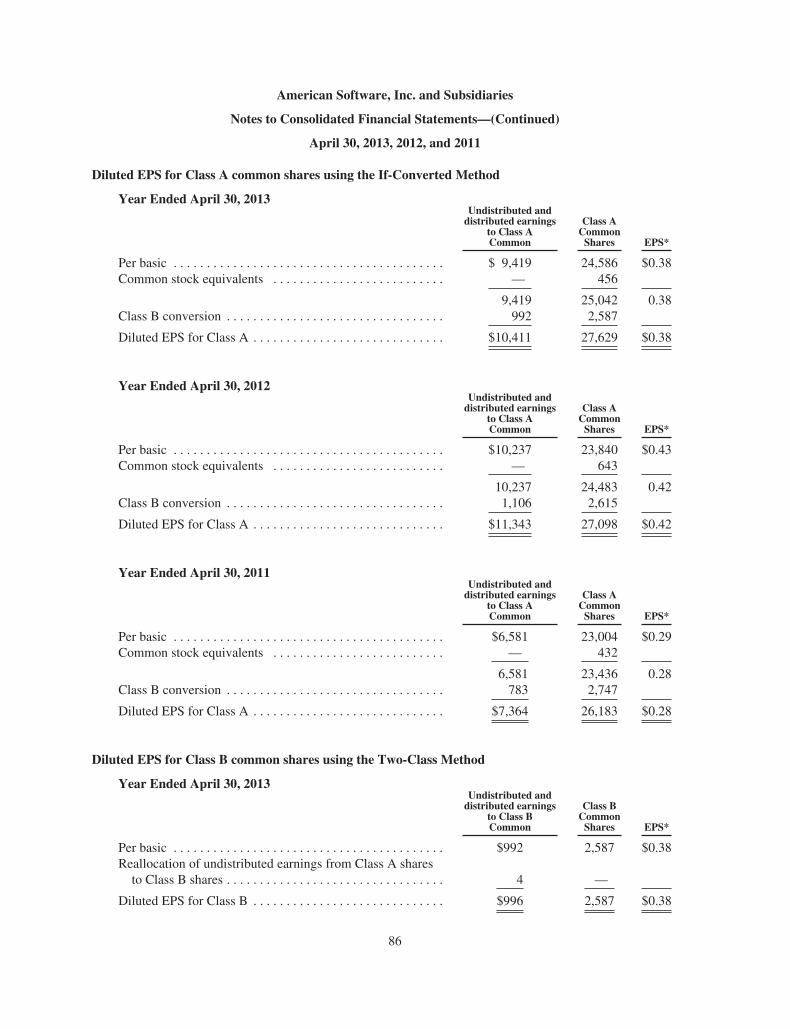
American Software, Inc. and Subsidiaries
Notes to Consolidated Financial Statements—(Continued)
April 30, 2013, 2012, and 2011
Diluted EPS for Class A common shares using the If-Converted Method
Year Ended April 30, 2013Undistributed anddistributed earnings
to Class ACommon
Class ACommonShares EPS*
Per basic . . . . . . . . . . . . . . . . . . . . . . . . . . . . . . . . . . . . . . . . . $ 9,419 24,586 $0.38Common stock equivalents . . . . . . . . . . . . . . . . . . . . . . . . . . — 456
9,419 25,042 0.38Class B conversion . . . . . . . . . . . . . . . . . . . . . . . . . . . . . . . . . 992 2,587
Diluted EPS for Class A . . . . . . . . . . . . . . . . . . . . . . . . . . . . . $10,411 27,629 $0.38
Year Ended April 30, 2012Undistributed anddistributed earnings
to Class ACommon
Class ACommonShares EPS*
Per basic . . . . . . . . . . . . . . . . . . . . . . . . . . . . . . . . . . . . . . . . . $10,237 23,840 $0.43Common stock equivalents . . . . . . . . . . . . . . . . . . . . . . . . . . — 643
10,237 24,483 0.42Class B conversion . . . . . . . . . . . . . . . . . . . . . . . . . . . . . . . . . 1,106 2,615
Diluted EPS for Class A . . . . . . . . . . . . . . . . . . . . . . . . . . . . . $11,343 27,098 $0.42
Year Ended April 30, 2011Undistributed anddistributed earnings
to Class ACommon
Class ACommonShares EPS*
Per basic . . . . . . . . . . . . . . . . . . . . . . . . . . . . . . . . . . . . . . . . . $6,581 23,004 $0.29Common stock equivalents . . . . . . . . . . . . . . . . . . . . . . . . . . — 432
6,581 23,436 0.28Class B conversion . . . . . . . . . . . . . . . . . . . . . . . . . . . . . . . . . 783 2,747
Diluted EPS for Class A . . . . . . . . . . . . . . . . . . . . . . . . . . . . . $7,364 26,183 $0.28
Diluted EPS for Class B common shares using the Two-Class Method
Year Ended April 30, 2013Undistributed anddistributed earnings
to Class BCommon
Class BCommonShares EPS*
Per basic . . . . . . . . . . . . . . . . . . . . . . . . . . . . . . . . . . . . . . . . . $992 2,587 $0.38Reallocation of undistributed earnings from Class A sharesto Class B shares . . . . . . . . . . . . . . . . . . . . . . . . . . . . . . . . . 4 —
Diluted EPS for Class B . . . . . . . . . . . . . . . . . . . . . . . . . . . . . $996 2,587 $0.38
86

American Software, Inc. and Subsidiaries
Notes to Consolidated Financial Statements—(Continued)
April 30, 2013, 2012, and 2011
Year Ended April 30, 2012Undistributed anddistributed earnings
to Class BCommon
Class BCommonShares EPS*
Per basic . . . . . . . . . . . . . . . . . . . . . . . . . . . . . . . . . . . . . . . . . $1,106 2,615 $0.43Reallocation of undistributed earnings from Class A sharesto Class B shares . . . . . . . . . . . . . . . . . . . . . . . . . . . . . . . . . (4) —
Diluted EPS for Class B . . . . . . . . . . . . . . . . . . . . . . . . . . . . . $1,102 2,615 $0.43
Year Ended April 30, 2011Undistributed anddistributed earnings
to Class BCommon
Class BCommonShares EPS*
Per basic . . . . . . . . . . . . . . . . . . . . . . . . . . . . . . . . . . . . . . . . . $783 2,747 $0.29Reallocation of undistributed earnings from Class A sharesto Class B shares . . . . . . . . . . . . . . . . . . . . . . . . . . . . . . . . . 3 —
Diluted EPS for Class B . . . . . . . . . . . . . . . . . . . . . . . . . . . . . $786 2,747 $0.29
* Amounts adjusted for rounding
(s) Advertising
All advertising costs are expensed as incurred. Advertising expenses, which are included within sales andmarketing expenses, were $2.0 million, $1.8 million and $1.7 million in fiscal 2013, 2012 and 2011, respectively.
(t) Guarantees and Indemnifications
The Company accounts for guarantees in accordance with the Guarantee Topic of the FASB AccountingStandards Codification. The Company’s sales agreements with customers generally contain infringementindemnity provisions. Under these agreements, the Company agrees to indemnify, defend and hold harmless thecustomer in connection with patent, copyright or trade secret infringement claims made by third parties withrespect to the customer’s authorized use of the Company’s products and services. The indemnity provisionsgenerally provide for the Company’s control of defense and settlement and cover costs and damages finallyawarded against the customer, as well as the Company’s modification of the product so it is no longer infringingor, if it cannot be corrected, return of the product for a refund. The sales agreements with customers sometimesalso contain indemnity provisions for death, personal injury or property damage caused by the Company’spersonnel or contractors in the course of performing services to customers. Under these agreements, theCompany agrees to indemnify, defend and hold harmless the customer in connection with death, personal injuryand property damage claims made by third parties with respect to actions of the Company’s personnel orcontractors. The indemnity provisions generally provide for the Company’s control of defense and settlement andcover costs and damages finally awarded against the customer. The indemnity obligations contained in salesagreements generally have a limited life and monetary award. The Company has not previously incurred costs tosettle claims or pay awards under these indemnification obligations. The Company accounts for these indemnityobligations in accordance with the Contingencies Topic of the FASB Accounting Standards Codification, andrecords a liability for these obligations when a loss is probable and reasonably estimable. The Company has notrecorded any liabilities for these agreements as of April 30, 2013 or 2012.
87
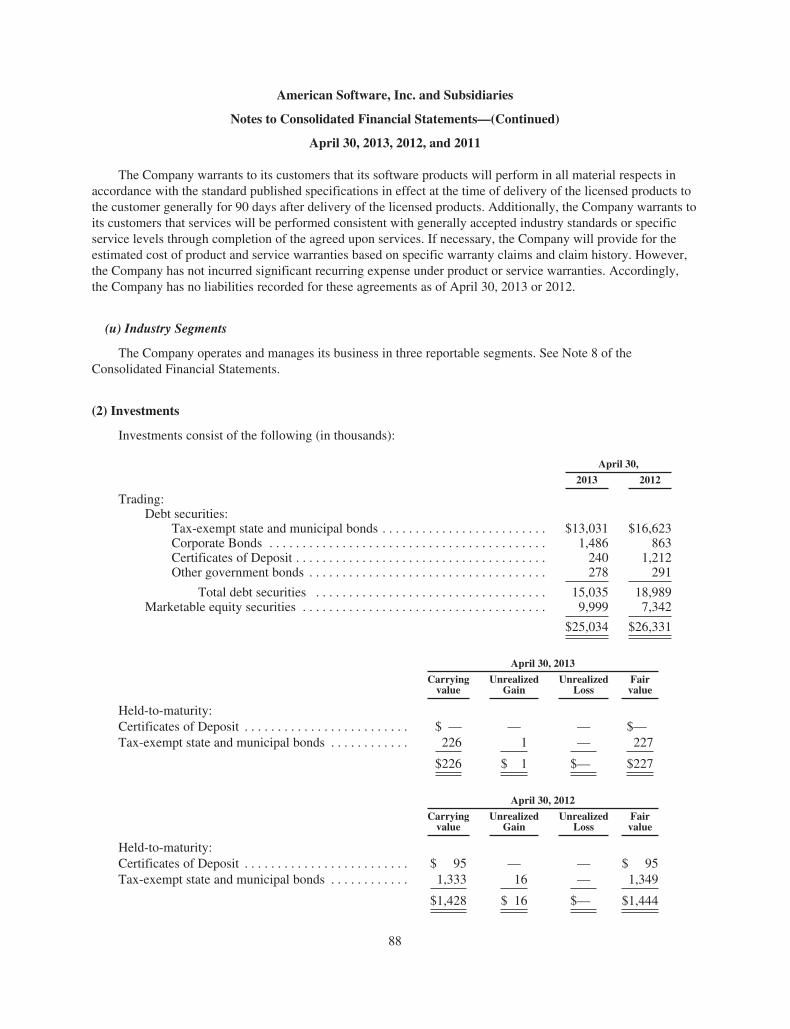
American Software, Inc. and Subsidiaries
Notes to Consolidated Financial Statements—(Continued)
April 30, 2013, 2012, and 2011
The Company warrants to its customers that its software products will perform in all material respects inaccordance with the standard published specifications in effect at the time of delivery of the licensed products tothe customer generally for 90 days after delivery of the licensed products. Additionally, the Company warrants toits customers that services will be performed consistent with generally accepted industry standards or specificservice levels through completion of the agreed upon services. If necessary, the Company will provide for theestimated cost of product and service warranties based on specific warranty claims and claim history. However,the Company has not incurred significant recurring expense under product or service warranties. Accordingly,the Company has no liabilities recorded for these agreements as of April 30, 2013 or 2012.
(u) Industry Segments
The Company operates and manages its business in three reportable segments. See Note 8 of theConsolidated Financial Statements.
(2) Investments
Investments consist of the following (in thousands):
April 30,
2013 2012
Trading:Debt securities:
Tax-exempt state and municipal bonds . . . . . . . . . . . . . . . . . . . . . . . . . $13,031 $16,623Corporate Bonds . . . . . . . . . . . . . . . . . . . . . . . . . . . . . . . . . . . . . . . . . . 1,486 863Certificates of Deposit . . . . . . . . . . . . . . . . . . . . . . . . . . . . . . . . . . . . . . 240 1,212Other government bonds . . . . . . . . . . . . . . . . . . . . . . . . . . . . . . . . . . . . 278 291
Total debt securities . . . . . . . . . . . . . . . . . . . . . . . . . . . . . . . . . . . 15,035 18,989Marketable equity securities . . . . . . . . . . . . . . . . . . . . . . . . . . . . . . . . . . . . . 9,999 7,342
$25,034 $26,331
April 30, 2013
Carryingvalue
UnrealizedGain
UnrealizedLoss
Fairvalue
Held-to-maturity:Certificates of Deposit . . . . . . . . . . . . . . . . . . . . . . . . . $ — — — $—Tax-exempt state and municipal bonds . . . . . . . . . . . . 226 1 — 227
$226 $ 1 $— $227
April 30, 2012
Carryingvalue
UnrealizedGain
UnrealizedLoss
Fairvalue
Held-to-maturity:Certificates of Deposit . . . . . . . . . . . . . . . . . . . . . . . . . $ 95 — — $ 95Tax-exempt state and municipal bonds . . . . . . . . . . . . 1,333 16 — 1,349
$1,428 $ 16 $— $1,444
88

American Software, Inc. and Subsidiaries
Notes to Consolidated Financial Statements—(Continued)
April 30, 2013, 2012, and 2011
The total carrying value of all investments on a consolidated basis was approximately $25,260,000 and$27,759,000 at April 30, 2013 and 2012, respectively. At April 30, 2013, there were approximately $6,658,000 intrading investments included in investments-noncurrent in the accompanying consolidated balance sheets. AtApril 30, 2012, there were approximately $7,278,000 in trading investments and $230,000 in held-to-maturityinvestments included in investments-noncurrent in the accompanying consolidated balance sheets. As ofApril 30, 2013, the Company does not believe any investments to be other-than-temporarily impaired.
The contractual maturities of debt securities classified as trading at April 30, 2013 and 2012 were as follows(in thousands):
2013 2012
Due within one year . . . . . . . . . . . . . . . . . . . . . . . . . . . . . . . . . . . . . . . $ 8,648 $11,986Due within two years . . . . . . . . . . . . . . . . . . . . . . . . . . . . . . . . . . . . . . . 4,776 5,628Due within three years . . . . . . . . . . . . . . . . . . . . . . . . . . . . . . . . . . . . . . 751 540Due after three years . . . . . . . . . . . . . . . . . . . . . . . . . . . . . . . . . . . . . . . 860 835
$15,035 $18,989
The contractual maturities of debt securities classified as held-to-maturity at April 30, 2013 and 2012 wereas follows (in thousands):
2013 2012
Due within one year . . . . . . . . . . . . . . . . . . . . . . . . . . . . . . . . . . . . . . . $226 $1,198Due within two years . . . . . . . . . . . . . . . . . . . . . . . . . . . . . . . . . . . . . . . — 230Due within three years . . . . . . . . . . . . . . . . . . . . . . . . . . . . . . . . . . . . . . — —Due after three years . . . . . . . . . . . . . . . . . . . . . . . . . . . . . . . . . . . . . . . — —
$226 $1,428
In 2013, 2012 and 2011, the Company’s investment portfolio of trading securities experienced netunrealized holding gains of approximately $815,000, $45,000 and $107,000, respectively, which have beenincluded in other income/(loss), net in the accompanying consolidated statements of operations.
(3) Fair Value of Financial Instruments
The Company measures its investments based on a fair value hierarchy disclosure framework that prioritizesand ranks the level of market price observability used in measuring assets and liabilities at fair value. A numberof factors affect market price observability including the type of asset or liability and its characteristics. Thishierarchy prioritizes the inputs into three broad levels as follows:
• Level 1—Quoted prices in active markets for identical instruments.
• Level 2—Quoted prices for similar instruments in active markets; quoted prices for identical or similarinstruments in markets that are not active; and model-derived valuations in which all significant inputsand significant value drivers are observable in active markets.
• Level 3—Valuations derived from valuation techniques in which one or more significant inputs orsignificant value drivers are unobservable.
89

American Software, Inc. and Subsidiaries
Notes to Consolidated Financial Statements—(Continued)
April 30, 2013, 2012, and 2011
The following is a general description of the valuation methodologies used for financial assets and liabilitiesmeasured at fair value, including the general classification of such assets and liabilities pursuant to the valuationhierarchy.
Cash Equivalents—Cash equivalents include investments in government obligation based money-marketfunds, other money market instruments and interest-bearing deposits with initial or remaining terms of threemonths or less. The fair value of cash equivalents approximates its carrying value due to the short-termnature of these instruments.
Marketable Securities —Marketable securities utilizing Level 1 inputs include active exchange-tradedequity securities and equity index funds, and most U.S. Government debt securities, as these securities allhave quoted prices in active markets. Marketable securities utilizing Level 2 inputs include municipalbonds. We value these securities using market-corroborated pricing or other models that use observableinputs such as yield curves.
The following table presents our assets that we measured at fair value on a recurring basis and indicates thefair value hierarchy of the valuation techniques we utilized to determine such fair value (in thousands):
April 30, 2013 April 30, 2012
Quoted Pricesin Active
Markets forIdentical Assets
(Level 1)
SignificantOther
ObservableInputs(Level 2)
SignificantUnobservable
Inputs(Level 3) Total
Quoted Pricesin Active
Markets forIdentical Assets
(Level 1)
SignificantOther
ObservableInputs(Level 2)
SignificantUnobservable
Inputs(Level 3) Total
Cash equivalents . . . $37,716 — — $37,716 $36,831 — — $36,831Marketablesecurities . . . . . . . 11,215 13,548 — $24,763 7,930 18,126 — $26,056
Total . . . . . . . . . $48,931 $13,548 $— $62,479 $44,761 $18,126 $— $62,887
In addition to cash equivalents and marketable securities classified as trading securities, we also have anequity method investment valued at approximately $271,000 and approximately $226,000 in held-to-maturityinvestments which are not recorded at fair value and thus are not recorded in the table above. The held-to-maturity investments consist of tax-exempt state and municipal bonds and are recorded at amortized cost. Fairvalues for these securities are obtained from third party broker statements. The fair value amounts are primarilyderived from quoted prices for similar instruments in active markets; quoted prices for identical or similarinstruments in markets that are not active; and model-derived valuations in which all significant inputs andsignificant value drivers are observable in active markets. See Note 2 for the fair value of the Company’sinvestments classified as “held-to-maturity.”
The carrying amounts of cash, trade accounts receivable and unbilled accounts receivable, accounts payable,accrued compensation and related costs, and other current liabilities approximate fair value because of theirshort-term maturities.
90

American Software, Inc. and Subsidiaries
Notes to Consolidated Financial Statements—(Continued)
April 30, 2013, 2012, and 2011
(4) Furniture, Equipment and Purchased Software
Furniture, equipment and purchased software consisted of the following at April 30, 2013 and 2012 (inthousands):
2013 2012
Buildings and leasehold improvements . . . . . . . . . . . . . . . . . . . . . . . . $19,993 $19,967Computer equipment and purchased software . . . . . . . . . . . . . . . . . . . 9,611 9,358Office furniture and equipment . . . . . . . . . . . . . . . . . . . . . . . . . . . . . . . 4,367 4,200
33,971 33,525Less accumulated depreciation and amortization . . . . . . . . . . . . . . . . . 29,489 28,613
$ 4,482 $ 4,912
(5) Income Taxes
Income tax expense consisted of the following:
Years ended April 30,
2013 2012 2011
(In thousands)
Current:Federal . . . . . . . . . . . . . . . . . . . . . . . . . . . . . . . . . . . . . . . . . . . . . . . $4,103 $5,335 $3,464State . . . . . . . . . . . . . . . . . . . . . . . . . . . . . . . . . . . . . . . . . . . . . . . . . 847 685 551
4,950 6,020 4,015
Deferred:Federal . . . . . . . . . . . . . . . . . . . . . . . . . . . . . . . . . . . . . . . . . . . . . . . 131 (85) (225)State . . . . . . . . . . . . . . . . . . . . . . . . . . . . . . . . . . . . . . . . . . . . . . . . . 33 (7) (20)
164 (92) (245)
$5,114 $5,928 $3,770
The Company’s actual income tax expense differs from the “expected” income tax expense calculated byapplying the Federal statutory rate of 35% for fiscal years 2013 and 2012 and 34% for fiscal year 2011, toearnings before income taxes and noncontrolling interest as follows:
Years ended April 30,
2013 2012 2011
(In thousands)
Computed “expected” income tax expense . . . . . . . . . . . . . . . . . . . . . . . $5,434 $6,045 $3,786Increase (decrease) in income taxes resulting from:
State income taxes, net of Federal income tax effect . . . . . . . . . . . . 568 405 377Research and development credits . . . . . . . . . . . . . . . . . . . . . . . . . . (584) (259) (447)Change in valuation allowance for deferred tax assets . . . . . . . . . . (187) 34 (43)Tax contingencies . . . . . . . . . . . . . . . . . . . . . . . . . . . . . . . . . . . . . . . 27 (59) 151Other, net, including permanent items . . . . . . . . . . . . . . . . . . . . . . . (144) (238) (54)
$5,114 $5,928 $3,770
91

American Software, Inc. and Subsidiaries
Notes to Consolidated Financial Statements—(Continued)
April 30, 2013, 2012, and 2011
Our effective income tax rates were 32.9%, 34.3% and 33.9% in 2013, 2012 and 2011, respectively. Oureffective income tax rate takes into account the source of taxable income, by state, and available income taxcredits. The provision for income taxes in 2013, 2012 and 2011 excludes approximately $160,000, $881,000 and$383,000, respectively, of tax benefits realized from the recognition of stock option deductions, which have beenrecorded in additional paid-in capital.
The significant components of deferred income tax (benefit) expense attributable to income from continuingoperations before income taxes for the years ended April 30, 2013, 2012, and 2011 are as follows:
Years ended April 30,
2013 2012 2011
(In thousands)
Deferred tax expense (benefit) . . . . . . . . . . . . . . . . . . . . . . . . . . . . . . . . . . . $ 351 $(126) $(202)(Decrease) increase in the valuation allowance for deferred tax assets . . . . (187) 34 (43)
$ 164 $ (92) $(245)
The tax effects of temporary differences that give rise to significant portions of the deferred tax assets anddeferred tax liabilities at April 30, 2013 and 2012 are presented as follows:
2013 2012
(In thousands)
Deferred tax assets:Accruals and expenses not deducted for tax purposes . . . . . . . . . . . . . . . . . . $ 1,018 $ 815State net operating loss carryforwards . . . . . . . . . . . . . . . . . . . . . . . . . . . . . . 358 357Intangible assets and fixed asset basis differences . . . . . . . . . . . . . . . . . . . . . 1,191 1,039Nonqualified stock options . . . . . . . . . . . . . . . . . . . . . . . . . . . . . . . . . . . . . . . 1,287 927
Total gross deferred tax assets . . . . . . . . . . . . . . . . . . . . . . . . . . . . . . . . 3,854 3,138Less valuation allowance . . . . . . . . . . . . . . . . . . . . . . . . . . . . . . . . . . . . . . . . 421 608
Net deferred tax assets . . . . . . . . . . . . . . . . . . . . . . . . . . . . . . . . . . . . . . 3,433 2,530
Deferred tax liabilities:Capitalized computer software development costs . . . . . . . . . . . . . . . . . . . . (3,334) (2,909)Net gains/losses on trading securities . . . . . . . . . . . . . . . . . . . . . . . . . . . . . . . (458) (143)Goodwill . . . . . . . . . . . . . . . . . . . . . . . . . . . . . . . . . . . . . . . . . . . . . . . . . . . . . (511) (425)Other . . . . . . . . . . . . . . . . . . . . . . . . . . . . . . . . . . . . . . . . . . . . . . . . . . . . . . . . (528) (259)
Total gross deferred tax liabilities . . . . . . . . . . . . . . . . . . . . . . . . . . . . . (4,831) (3,736)
Net deferred tax liabilities . . . . . . . . . . . . . . . . . . . . . . . . . . . . . . . . . . . $(1,398) $(1,206)
At April 30, 2013, the Company has approximately $10.9 million of various state net operating losscarryforwards which are available to offset future state taxable income, if any, through 2033.
In assessing the realizability of deferred tax assets, management considers whether it is more likely than notthat some portion or all of the deferred tax assets will not be realized. The ultimate realization of deferred taxassets is dependent upon the generation of future taxable income during the periods in which those temporarydifferences become deductible. Management considers the scheduled reversal of deferred tax liabilities, projected
92

American Software, Inc. and Subsidiaries
Notes to Consolidated Financial Statements—(Continued)
April 30, 2013, 2012, and 2011
future taxable income, and tax planning strategies in making this assessment. Based upon reversal of deferred taxliabilities and expected future profitability, management believes it is more likely than not the Company willrealize the benefits of these deductible differences, net of the existing valuation allowances, at April 30, 2013.
On May 1, 2007, the Company adopted accounting provisions which require us to prescribe a recognitionthreshold and measurement attribution for the financial statement recognition and measurement of a tax positiontaken or expected to be taken within an income tax return.
As of April 30, 2013, 2012 and 2011, we have recorded approximately $1.2 million, $1.1 million, and $1.2million, respectively, of unrecognized tax benefits, inclusive of interest and penalties, all of which would impactour effective tax rate if recognized. The liability for unrecognized tax benefits is recorded net of any federal taxbenefit that would result from payment.
We recognize potential accrued interest and penalties related to unrecognized tax benefits within income taxexpense. To the extent interest and penalties are not assessed with respect to uncertain tax positions, amountsaccrued will be reduced and reflected as a reduction of the overall income tax provision. As of April 30, 2013and 2012, we had recorded a liability for potential penalties and interest of approximately $191,000 and$161,000, respectively, related to uncertain tax positions.
A reconciliation of the beginning and ending amount of unrecognized tax benefits is as follows, excludinginterest and penalties (in thousands):
2013 2012
Balance at beginning of the period . . . . . . . . . . . . . . . . . . . . . . . . . . . . . . . . . . . . . . . . $984 $1,081Decreases as a result of positions taken during prior periods . . . . . . . . . . . . . . . . . . . (25) (104)Increases as a result of positions taken during the current period . . . . . . . . . . . . . . . . 22 7
Balance at April 30, . . . . . . . . . . . . . . . . . . . . . . . . . . . . . . . . . . . . . . . . . . . . . . . . . . . $981 $ 984
We conduct business globally and, as a result, file income tax returns in the United States Federaljurisdiction and in many state and foreign jurisdictions. We are no longer subject to state and local, or non-U.S.income tax examinations for years prior to 2000. We are no longer subject to U.S. Federal income taxexamination for years prior to 2010. The Company’s 2009 and 2008 U.S. Federal returns were audited by theInternal Revenue Service, and the examinations were concluded in November 2011 and 2009, respectively, withno changes to the returns as originally filed.
We do not anticipate that total unrecognized tax benefits will significantly change in the next twelvemonths.
(6) Shareholders’ Equity
Except for the election or removal of Directors and class votes as required by law or the Articles ofIncorporation, holders of both classes of common stock vote as a single class on all matters with each Class Acommon share entitled to cast one-tenth vote per share and each Class B common share entitled to cast one voteper share. Neither class has cumulative voting rights. Holders of Class A common shares, as a class, are entitledto elect 25% of the board of directors (rounded up to the nearest whole number of Directors) if the number ofoutstanding Class A common shares is at least 10% of the number of outstanding shares of both classes ofcommon stock. No cash or property dividend may be paid to holders of Class B common shares during any fiscal
93
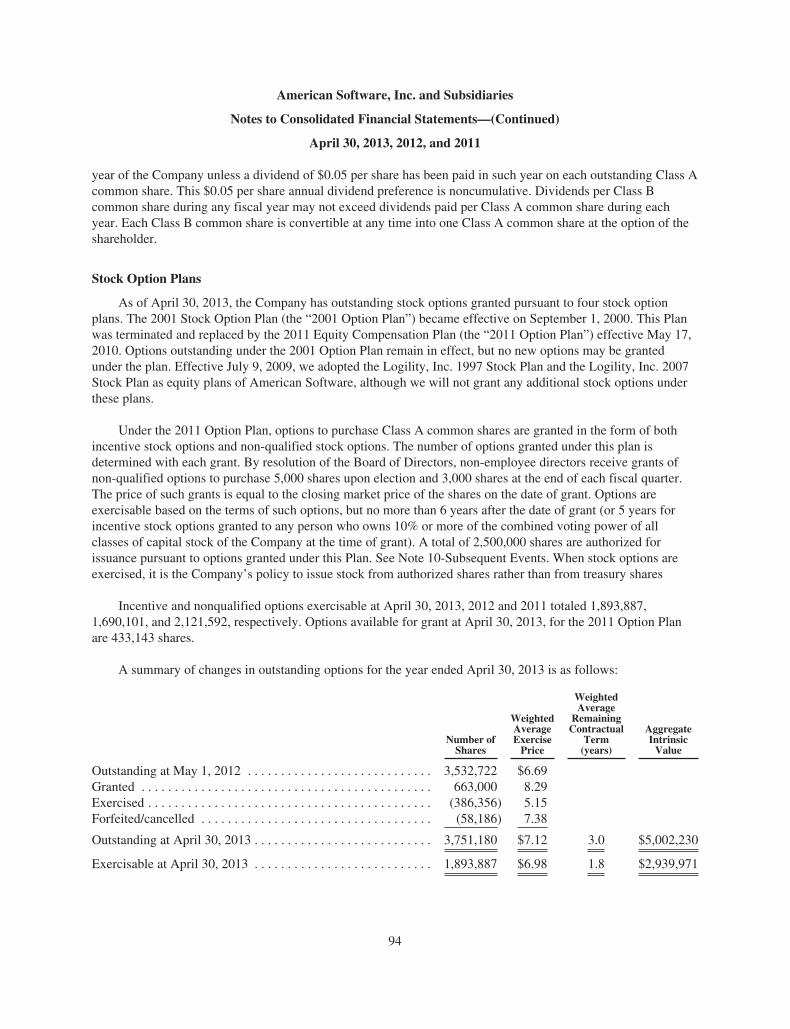
American Software, Inc. and Subsidiaries
Notes to Consolidated Financial Statements—(Continued)
April 30, 2013, 2012, and 2011
year of the Company unless a dividend of $0.05 per share has been paid in such year on each outstanding Class Acommon share. This $0.05 per share annual dividend preference is noncumulative. Dividends per Class Bcommon share during any fiscal year may not exceed dividends paid per Class A common share during eachyear. Each Class B common share is convertible at any time into one Class A common share at the option of theshareholder.
Stock Option Plans
As of April 30, 2013, the Company has outstanding stock options granted pursuant to four stock optionplans. The 2001 Stock Option Plan (the “2001 Option Plan”) became effective on September 1, 2000. This Planwas terminated and replaced by the 2011 Equity Compensation Plan (the “2011 Option Plan”) effective May 17,2010. Options outstanding under the 2001 Option Plan remain in effect, but no new options may be grantedunder the plan. Effective July 9, 2009, we adopted the Logility, Inc. 1997 Stock Plan and the Logility, Inc. 2007Stock Plan as equity plans of American Software, although we will not grant any additional stock options underthese plans.
Under the 2011 Option Plan, options to purchase Class A common shares are granted in the form of bothincentive stock options and non-qualified stock options. The number of options granted under this plan isdetermined with each grant. By resolution of the Board of Directors, non-employee directors receive grants ofnon-qualified options to purchase 5,000 shares upon election and 3,000 shares at the end of each fiscal quarter.The price of such grants is equal to the closing market price of the shares on the date of grant. Options areexercisable based on the terms of such options, but no more than 6 years after the date of grant (or 5 years forincentive stock options granted to any person who owns 10% or more of the combined voting power of allclasses of capital stock of the Company at the time of grant). A total of 2,500,000 shares are authorized forissuance pursuant to options granted under this Plan. See Note 10-Subsequent Events. When stock options areexercised, it is the Company’s policy to issue stock from authorized shares rather than from treasury shares
Incentive and nonqualified options exercisable at April 30, 2013, 2012 and 2011 totaled 1,893,887,1,690,101, and 2,121,592, respectively. Options available for grant at April 30, 2013, for the 2011 Option Planare 433,143 shares.
A summary of changes in outstanding options for the year ended April 30, 2013 is as follows:
Number ofShares
WeightedAverageExercisePrice
WeightedAverage
RemainingContractual
Term(years)
AggregateIntrinsicValue
Outstanding at May 1, 2012 . . . . . . . . . . . . . . . . . . . . . . . . . . . . 3,532,722 $6.69Granted . . . . . . . . . . . . . . . . . . . . . . . . . . . . . . . . . . . . . . . . . . . . 663,000 8.29Exercised . . . . . . . . . . . . . . . . . . . . . . . . . . . . . . . . . . . . . . . . . . . (386,356) 5.15Forfeited/cancelled . . . . . . . . . . . . . . . . . . . . . . . . . . . . . . . . . . . (58,186) 7.38
Outstanding at April 30, 2013 . . . . . . . . . . . . . . . . . . . . . . . . . . . 3,751,180 $7.12 3.0 $5,002,230
Exercisable at April 30, 2013 . . . . . . . . . . . . . . . . . . . . . . . . . . . 1,893,887 $6.98 1.8 $2,939,971
94
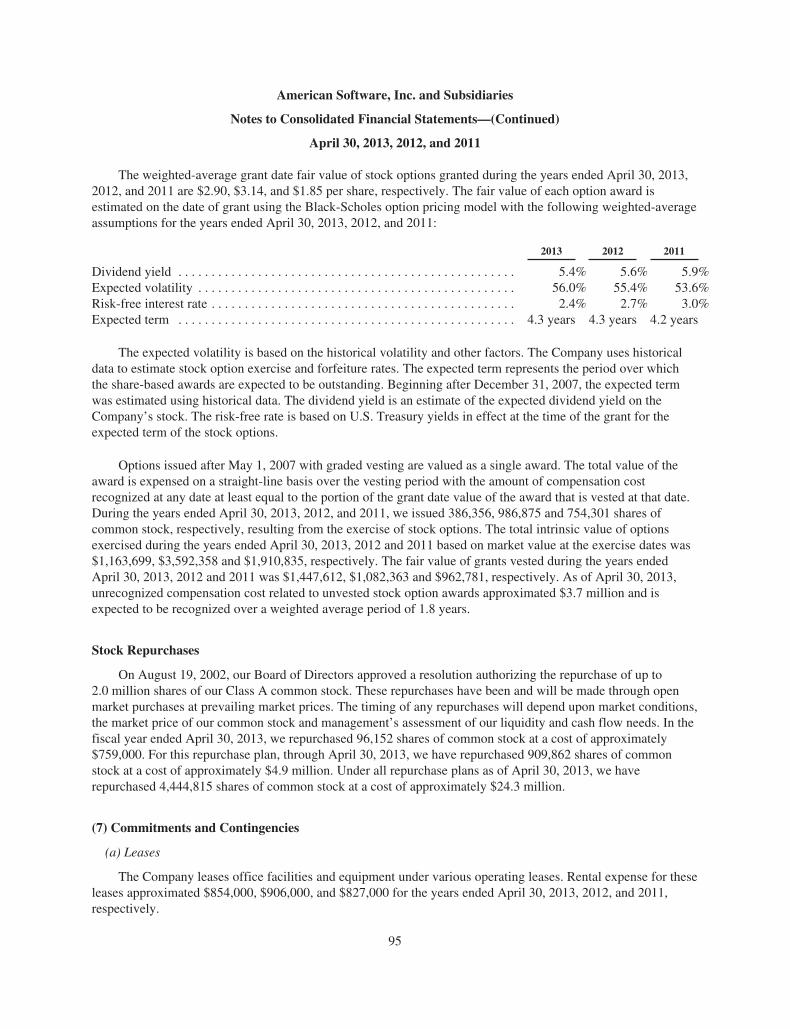
American Software, Inc. and Subsidiaries
Notes to Consolidated Financial Statements—(Continued)
April 30, 2013, 2012, and 2011
The weighted-average grant date fair value of stock options granted during the years ended April 30, 2013,2012, and 2011 are $2.90, $3.14, and $1.85 per share, respectively. The fair value of each option award isestimated on the date of grant using the Black-Scholes option pricing model with the following weighted-averageassumptions for the years ended April 30, 2013, 2012, and 2011:
2013 2012 2011
Dividend yield . . . . . . . . . . . . . . . . . . . . . . . . . . . . . . . . . . . . . . . . . . . . . . . . . . . 5.4% 5.6% 5.9%Expected volatility . . . . . . . . . . . . . . . . . . . . . . . . . . . . . . . . . . . . . . . . . . . . . . . . 56.0% 55.4% 53.6%Risk-free interest rate . . . . . . . . . . . . . . . . . . . . . . . . . . . . . . . . . . . . . . . . . . . . . . 2.4% 2.7% 3.0%Expected term . . . . . . . . . . . . . . . . . . . . . . . . . . . . . . . . . . . . . . . . . . . . . . . . . . . 4.3 years 4.3 years 4.2 years
The expected volatility is based on the historical volatility and other factors. The Company uses historicaldata to estimate stock option exercise and forfeiture rates. The expected term represents the period over whichthe share-based awards are expected to be outstanding. Beginning after December 31, 2007, the expected termwas estimated using historical data. The dividend yield is an estimate of the expected dividend yield on theCompany’s stock. The risk-free rate is based on U.S. Treasury yields in effect at the time of the grant for theexpected term of the stock options.
Options issued after May 1, 2007 with graded vesting are valued as a single award. The total value of theaward is expensed on a straight-line basis over the vesting period with the amount of compensation costrecognized at any date at least equal to the portion of the grant date value of the award that is vested at that date.During the years ended April 30, 2013, 2012, and 2011, we issued 386,356, 986,875 and 754,301 shares ofcommon stock, respectively, resulting from the exercise of stock options. The total intrinsic value of optionsexercised during the years ended April 30, 2013, 2012 and 2011 based on market value at the exercise dates was$1,163,699, $3,592,358 and $1,910,835, respectively. The fair value of grants vested during the years endedApril 30, 2013, 2012 and 2011 was $1,447,612, $1,082,363 and $962,781, respectively. As of April 30, 2013,unrecognized compensation cost related to unvested stock option awards approximated $3.7 million and isexpected to be recognized over a weighted average period of 1.8 years.
Stock Repurchases
On August 19, 2002, our Board of Directors approved a resolution authorizing the repurchase of up to2.0 million shares of our Class A common stock. These repurchases have been and will be made through openmarket purchases at prevailing market prices. The timing of any repurchases will depend upon market conditions,the market price of our common stock and management’s assessment of our liquidity and cash flow needs. In thefiscal year ended April 30, 2013, we repurchased 96,152 shares of common stock at a cost of approximately$759,000. For this repurchase plan, through April 30, 2013, we have repurchased 909,862 shares of commonstock at a cost of approximately $4.9 million. Under all repurchase plans as of April 30, 2013, we haverepurchased 4,444,815 shares of common stock at a cost of approximately $24.3 million.
(7) Commitments and Contingencies
(a) Leases
The Company leases office facilities and equipment under various operating leases. Rental expense for theseleases approximated $854,000, $906,000, and $827,000 for the years ended April 30, 2013, 2012, and 2011,respectively.
95

American Software, Inc. and Subsidiaries
Notes to Consolidated Financial Statements—(Continued)
April 30, 2013, 2012, and 2011
The Company leased several floors of its headquarters in Atlanta, GA under various operating leases. Rentalincome for these leases approximated $418,000, $349,000 and $344,000 for the years ended April 30, 2013, 2012and 2011, respectively. In addition, the Company owns other properties leased under various operating leases.Rental income for these leases approximated $225,000, $204,000 and $178,000 for the years ended April 30,2013, 2012, and 2011, respectively. The rental income is included as a component of Other Income, Net in theaccompanying consolidated statements of operations.
Future minimum lease payments under noncancelable operating leases (with initial or remaining lease termsin excess of one year) as of April 30, 2013 are as follows (existence of renewal or escalation clauses) (inthousands):
Years ended April 30:2014 . . . . . . . . . . . . . . . . . . . . . . . . . . . . . . . . . . . . . . . . . . . . . . . . . . . . . . . . . . $ 6872015 . . . . . . . . . . . . . . . . . . . . . . . . . . . . . . . . . . . . . . . . . . . . . . . . . . . . . . . . . . 3952016 . . . . . . . . . . . . . . . . . . . . . . . . . . . . . . . . . . . . . . . . . . . . . . . . . . . . . . . . . . 1802017 . . . . . . . . . . . . . . . . . . . . . . . . . . . . . . . . . . . . . . . . . . . . . . . . . . . . . . . . . . —2018 . . . . . . . . . . . . . . . . . . . . . . . . . . . . . . . . . . . . . . . . . . . . . . . . . . . . . . . . . . —
$1,262
Future minimum lease rentals receivable under noncancelable operating leases (with initial or remaininglease terms in excess of one year) as of April 30, 2013 are as follows (already included or prorated at theCompany’s occupied building) (in thousands):
Years ended April 30:2014 . . . . . . . . . . . . . . . . . . . . . . . . . . . . . . . . . . . . . . . . . . . . . . . . . . . . . . . . . . $ 5652015 . . . . . . . . . . . . . . . . . . . . . . . . . . . . . . . . . . . . . . . . . . . . . . . . . . . . . . . . . . 2422016 . . . . . . . . . . . . . . . . . . . . . . . . . . . . . . . . . . . . . . . . . . . . . . . . . . . . . . . . . . 1082017 . . . . . . . . . . . . . . . . . . . . . . . . . . . . . . . . . . . . . . . . . . . . . . . . . . . . . . . . . . 762018 . . . . . . . . . . . . . . . . . . . . . . . . . . . . . . . . . . . . . . . . . . . . . . . . . . . . . . . . . . 76Thereafter . . . . . . . . . . . . . . . . . . . . . . . . . . . . . . . . . . . . . . . . . . . . . . . . . . . . . . 70
$1,137
(b) 401(k) Profit Sharing Plan
Employees are offered the opportunity to participate in the Company’s 401(k) Profit Sharing Plan (the401(k) Plan), which is intended to be a tax-qualified defined contribution plan under Section 401(k) of theInternal Revenue Code. Under the 401(k) Plan, employees are eligible to participate on the first day of the monthfollowing the date of hire. Eligible employees may contribute up to 60% of pretax income to the 401(k) Plan.Subject to certain limitations, the Company may make a discretionary profit sharing contribution at an amountdetermined by the board of directors of the Company. The Company did not make profit sharing contributionsfor 2013, 2012, or 2011.
(c) Contingencies
The Company more often than not indemnifies its customers against damages and costs resulting fromclaims of patent, copyright, or trademark infringement associated with use of the Company’s products. The
96

American Software, Inc. and Subsidiaries
Notes to Consolidated Financial Statements—(Continued)
April 30, 2013, 2012, and 2011
Company has historically not been required to make any payments under such indemnifications. However, theCompany continues to monitor the conditions that are subject to the indemnifications to identify whether it isprobable that a loss has occurred, and would recognize any such losses under the indemnifications when thoselosses are estimable.
In addition, the Company warrants to customers that the Company’s products operate substantially inaccordance with the software product’s specifications. Historically, no costs have been incurred related tosoftware product warranties and none are expected in the future, and as such no accruals for software productwarranty costs have been made. Additionally, the Company is involved in various claims arising in the ordinarycourse of business. In the opinion of management, the ultimate disposition of these matters will not have amaterial adverse effect on the financial position or results of operations of the Company.
(8) Segment information
The Company provides our software solutions through three major business segments, which are furtherbroken down into a total of four major product and service groups. The three business segments are (1) SupplyChain Management (SCM), (2) Enterprise Resource Planning (ERP), and (3) Information Technology (IT)Consulting.
The SCM segment consists of Logility, Inc., a wholly-owned subsidiary, as well as its subsidiary, DMI,which provides collaborative supply chain solutions to streamline and optimize the forecasting, production,distribution and management of products between trading partners. The ERP segment consists of (1) AmericanSoftware ERP, which provides purchasing and materials management, customer order processing, financial, e-commerce and traditional manufacturing solutions, and (2) New Generation Computing (NGC), which providesindustry-specific business software to both retailers and manufacturers in the apparel, sewn products andfurniture industries. The IT Consulting segment consists of The Proven Method, Inc., an IT staffing andconsulting services firm. We also provide support for our software products, such as software enhancements,documentation, updates, customer education, consulting, systems integration services, and maintenance.
Our chief operating decision maker is the President and Chief Executive Officer. While the CEO is apprisedof a variety of financial metrics and information, we manage our business primarily on a segment basis, with theCEO evaluating performance based upon segment operating profit or loss that includes an allocation of commonexpenses, but excludes certain unallocated expenses.
97
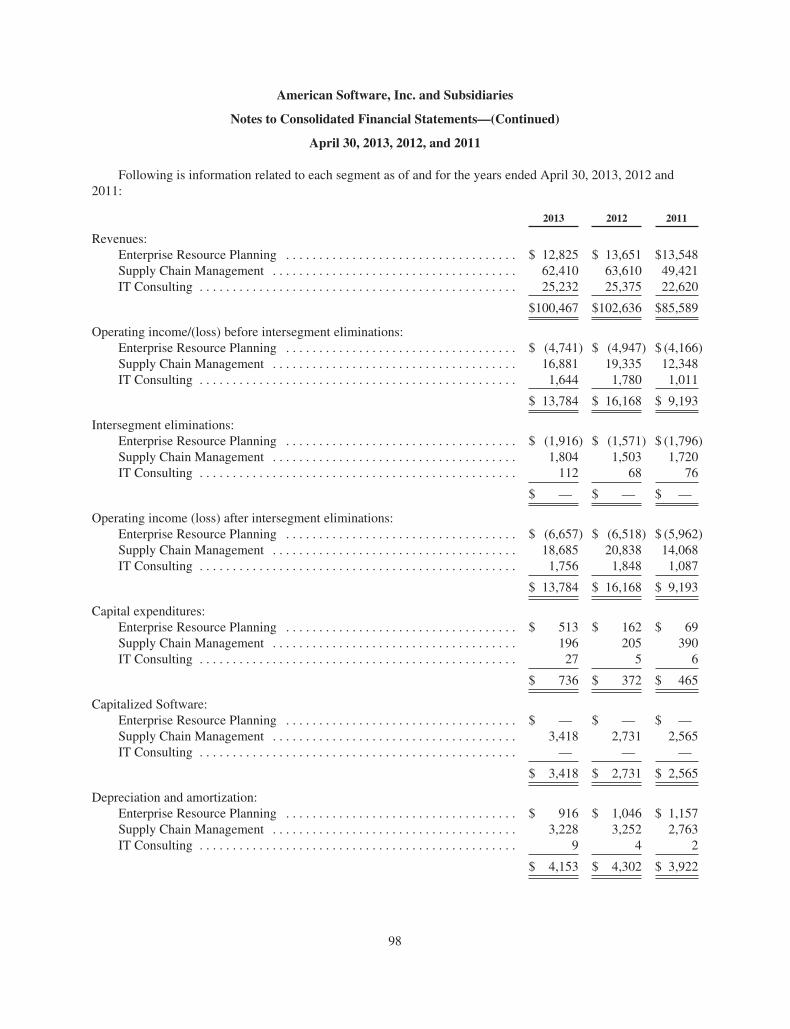
American Software, Inc. and Subsidiaries
Notes to Consolidated Financial Statements—(Continued)
April 30, 2013, 2012, and 2011
Following is information related to each segment as of and for the years ended April 30, 2013, 2012 and2011:
2013 2012 2011
Revenues:Enterprise Resource Planning . . . . . . . . . . . . . . . . . . . . . . . . . . . . . . . . . . . $ 12,825 $ 13,651 $13,548Supply Chain Management . . . . . . . . . . . . . . . . . . . . . . . . . . . . . . . . . . . . . 62,410 63,610 49,421IT Consulting . . . . . . . . . . . . . . . . . . . . . . . . . . . . . . . . . . . . . . . . . . . . . . . . 25,232 25,375 22,620
$100,467 $102,636 $85,589
Operating income/(loss) before intersegment eliminations:Enterprise Resource Planning . . . . . . . . . . . . . . . . . . . . . . . . . . . . . . . . . . . $ (4,741) $ (4,947) $ (4,166)Supply Chain Management . . . . . . . . . . . . . . . . . . . . . . . . . . . . . . . . . . . . . 16,881 19,335 12,348IT Consulting . . . . . . . . . . . . . . . . . . . . . . . . . . . . . . . . . . . . . . . . . . . . . . . . 1,644 1,780 1,011
$ 13,784 $ 16,168 $ 9,193
Intersegment eliminations:Enterprise Resource Planning . . . . . . . . . . . . . . . . . . . . . . . . . . . . . . . . . . . $ (1,916) $ (1,571) $ (1,796)Supply Chain Management . . . . . . . . . . . . . . . . . . . . . . . . . . . . . . . . . . . . . 1,804 1,503 1,720IT Consulting . . . . . . . . . . . . . . . . . . . . . . . . . . . . . . . . . . . . . . . . . . . . . . . . 112 68 76
$ — $ — $ —
Operating income (loss) after intersegment eliminations:Enterprise Resource Planning . . . . . . . . . . . . . . . . . . . . . . . . . . . . . . . . . . . $ (6,657) $ (6,518) $ (5,962)Supply Chain Management . . . . . . . . . . . . . . . . . . . . . . . . . . . . . . . . . . . . . 18,685 20,838 14,068IT Consulting . . . . . . . . . . . . . . . . . . . . . . . . . . . . . . . . . . . . . . . . . . . . . . . . 1,756 1,848 1,087
$ 13,784 $ 16,168 $ 9,193
Capital expenditures:Enterprise Resource Planning . . . . . . . . . . . . . . . . . . . . . . . . . . . . . . . . . . . $ 513 $ 162 $ 69Supply Chain Management . . . . . . . . . . . . . . . . . . . . . . . . . . . . . . . . . . . . . 196 205 390IT Consulting . . . . . . . . . . . . . . . . . . . . . . . . . . . . . . . . . . . . . . . . . . . . . . . . 27 5 6
$ 736 $ 372 $ 465
Capitalized Software:Enterprise Resource Planning . . . . . . . . . . . . . . . . . . . . . . . . . . . . . . . . . . . $ — $ — $ —Supply Chain Management . . . . . . . . . . . . . . . . . . . . . . . . . . . . . . . . . . . . . 3,418 2,731 2,565IT Consulting . . . . . . . . . . . . . . . . . . . . . . . . . . . . . . . . . . . . . . . . . . . . . . . . — — —
$ 3,418 $ 2,731 $ 2,565
Depreciation and amortization:Enterprise Resource Planning . . . . . . . . . . . . . . . . . . . . . . . . . . . . . . . . . . . $ 916 $ 1,046 $ 1,157Supply Chain Management . . . . . . . . . . . . . . . . . . . . . . . . . . . . . . . . . . . . . 3,228 3,252 2,763IT Consulting . . . . . . . . . . . . . . . . . . . . . . . . . . . . . . . . . . . . . . . . . . . . . . . . 9 4 2
$ 4,153 $ 4,302 $ 3,922
98

American Software, Inc. and Subsidiaries
Notes to Consolidated Financial Statements—(Continued)
April 30, 2013, 2012, and 2011
April 30,2013
April 30,2012
April 30,2011
Identifiable assets:Enterprise Resource Planning . . . . . . . . . . . . . . . . . . . . . . . . . . . . . . . . . . $ 36,985 $ 33,594 $ 30,515Supply Chain Management . . . . . . . . . . . . . . . . . . . . . . . . . . . . . . . . . . . . 70,982 77,288 68,463IT Consulting . . . . . . . . . . . . . . . . . . . . . . . . . . . . . . . . . . . . . . . . . . . . . . . 5,103 5,671 5,854
$113,070 $116,553 $104,832
International Revenue and Significant Customer
International revenues approximated $14.0 million or 14%, $16.2 million or 16%, and $12.1 million or 14%,of consolidated revenues for the years ended April 30, 2013, 2012, and 2011, respectively, and were derivedprimarily from customers in Canada and Europe.
One customer accounted for approximately 11%, 15% and 15% of consolidated revenue for the years endedApril 30, 2013, 2012 and 2011, respectively, principally from our IT consulting segment. Accounts receivablefrom this customer were approximately $1.6 million at April 30, 2013 and 2012, respectively.
(9) Financial Statements and Supplementary Data (Unaudited)
The following schedule presents results for each quarter in the years ended April 30, 2013 and 2012 (inthousands, except per share amounts):
Totalrevenues
Grossmargins
Operatingincome
Netearnings
Dilutedearningsper share*
Quarter ended:July 31, 2012 . . . . . . . . . . . . . . . . . . . . . . . . . . . . . . . $ 25,914 $14,010 $ 3,721 $ 2,422 $0.09October 31, 2012 . . . . . . . . . . . . . . . . . . . . . . . . . . . . 26,263 14,680 4,236 2,771 0.10January 31, 2013 . . . . . . . . . . . . . . . . . . . . . . . . . . . . 23,076 12,032 2,291 2,140 0.08April 30, 2013 . . . . . . . . . . . . . . . . . . . . . . . . . . . . . . 25,214 14,185 3,536 3,078 0.11
Year ended April 30, 2013 . . . . . . . . . . . . . . . $100,467 $54,907 $13,784 $10,411 $0.38
Quarter ended:July 31, 2011 . . . . . . . . . . . . . . . . . . . . . . . . . . . . . . . $ 23,709 $13,192 $ 3,594 $ 2,288 $0.09October 31, 2011 . . . . . . . . . . . . . . . . . . . . . . . . . . . . 25,598 14,634 4,716 2,981 0.11January 31, 2012 . . . . . . . . . . . . . . . . . . . . . . . . . . . . 25,397 13,502 3,293 2,592 0.10April 30, 2012 . . . . . . . . . . . . . . . . . . . . . . . . . . . . . . 27,932 15,468 4,565 3,482 0.13
Year ended April 30, 2012 . . . . . . . . . . . . . . . $102,636 $56,796 $16,168 $11,343 $0.42
* Quarterly amounts may not sum to full year total due to rounding.
(10) Subsequent Events
On May 15, 2013, our Board of Directors adopted, subject to shareholder approval, an amendment to the2011 Option Plan to increase the number of Class A Common shares that may be subject to options under the2011 Option Plan from 2,500,000 shares to 3,700,000 shares (the “Plan Amendment”). The Plan Amendment issubject to shareholder approval at the Company’s upcoming 2013 annual meeting of stockholders.
99

ITEM 9. CHANGES IN AND DISAGREEMENTSWITH ACCOUNTANTS ON ACCOUNTING ANDFINANCIAL DISCLOSURE
None.
ITEM 9A. CONTROLS AND PROCEDURES
Evaluation of Disclosure Controls and Procedures
Our disclosure controls and procedures (as defined in Rule 13a-15(e) of the Securities ExchangeAct of 1934 (“Exchange Act”)) are designed to provide reasonable assurance that information required to bedisclosed in our reports filed or submitted under the Exchange Act, such as this annual report on Form 10-K, isrecorded, processed, summarized and reported within the time periods specified in the SEC rules and forms. Ourdisclosure controls and procedures are also designed to ensure that such information is accumulated andcommunicated to our management, including our chief executive officer and chief financial officer, to allowtimely decisions regarding required disclosure.
Our chief executive officer and chief financial officer, with the assistance of our Disclosure Committee,have conducted an evaluation of the effectiveness of our disclosure controls and procedures as of April 30, 2013.We perform this evaluation on a quarterly basis so that the conclusions concerning the effectiveness of ourdisclosure controls and procedures can be reported in our annual report on Form 10-K and quarterly reports onForm 10-Q. Based on this evaluation, our chief executive officer and chief financial officer have concluded thatour disclosure controls and procedures were effective to provide such reasonable assurance as of April 30, 2013.
We believe our consolidated financial statements fairly present in all material respects our financialposition, results of operations and cash flows in our annual report on Form 10-K. The unqualified opinion of ourindependent registered public accounting firm on our consolidated financial statements for the years endedApril 30, 2013 and 2012 and each of the years in the three-year period ended April 30, 2013 is included in thisForm 10-K.
Changes in Internal Control over Financial Reporting
There have not been any changes in the Company’s internal control over financial reporting (as such term isdefined in Rules 13a-15(f) and 15d-15(f) under the Exchange Act) during the last fiscal quarter of fiscal 2013 towhich this report relates that have materially affected, or are reasonably likely to materially affect, theCompany’s internal control over financial reporting.
Reports on Internal Control Over Financial Reporting
Management’s report on internal control over financial reporting and the report of the independentregistered public accounting firm on internal control over financial reporting are included under Item 8,“Financial Statements and Supplementary Data,” of this report.
ITEM 9B. OTHER INFORMATION
None.
100

PART III
ITEM 10. DIRECTORS, EXECUTIVE OFFICERS AND CORPORATE GOVERNANCE
The information required by this item is incorporated by reference from the information contained in ourProxy Statement for the Annual Meeting of Shareholders expected to be filed with the SEC on or prior to July 27,2013 under the captions “Election of Directors,” “Executive Compensation,” “Section 16(a) BeneficialOwnership Reporting Compliance,” “Code of Business Conduct and Ethics,” and “Committees of the Board ofDirectors.”
ITEM 11. EXECUTIVE COMPENSATION
This information is set forth under the caption “Executive Compensation” in the Proxy Statement, whichinformation is incorporated herein by reference.
ITEM 12. SECURITY OWNERSHIP OF CERTAIN BENEFICIAL OWNERS ANDMANAGEMENTAND RELATED STOCKHOLDERMATTERS
Information regarding security ownership of management and others is set forth under the caption “SecurityOwnership of Management and Certain Beneficial Owners” in the Proxy Statement, which information isincorporated herein by reference.
ITEM 13. CERTAIN RELATIONSHIPS AND RELATED TRANSACTIONS, AND DIRECTORINDEPENDENCE
Policy Regarding Transactions with Related Persons
On December 8, 2003 our Board of Directors adopted a resolution directing the Audit Committee of theBoard of Directors to establish and implement procedures for identifying and conducting an appropriate reviewof any proposed transaction that meets the definition of “related party transaction” within the meaning ofItem 404 of SEC Regulation S-K. In January 2004 the Audit Committee adopted written procedures inaccordance with such direction. Under those procedures, the Audit Committee reviews and evaluates anyproposed related party transaction and determines whether the terms of such transaction, judged at the time of thedetermination, are fair to the Company. Our officers are instructed that when a related party transaction isproposed they are to bring it to the attention of the Audit Committee, which then reviews the transaction andmakes a determination of whether it meets the above standard. The Audit Committee is required to prepare areport of its deliberations, conclusions and recommendations, and furnish that report to the full Board ofDirectors.
Information regarding director independence is set forth under the captions “Director Independence” and“Committees of the Board of Directors” in the Proxy Statement, which information is incorporated herein byreference.
ITEM 14. PRINCIPAL ACCOUNTING FEES AND SERVICES
This information is set forth under the caption “Ratification of Appointment of Independent RegisteredPublic Accounting Firm” in the Proxy Statement, which information is incorporated herein by reference.
101

PART IV
ITEM 15. EXHIBITS, FINANCIAL STATEMENT SCHEDULES
(a) Documents filed as part of this report.
1. Financial statements; All financial statements of the Company as described in Item 8 of this report onForm 10-K.
2. Financial statement schedule included in Part IV of this Form:Page
Schedule II—Consolidated Valuation Accounts—for the three years endedApril 30, 2013 . . . . . . . . . . . . . . . . . . . . . . . . . . . . . . . . . . . . . . . . . . . . . . . . . . . . . . 103
All other financial statements and schedules not listed above are omitted as the required information is notapplicable or the information is presented in the financial statements or related notes.
3. Exhibits
The following exhibits are filed herewith or incorporated herein by reference:
3.1 The Company’s Amended and Restated Articles of Incorporation, and amendments thereto.(1)3.2 The Company’s Amended and Restated By-Laws dated May 18, 2009.(2)10.1 American Software, Inc. 401(k)/Profit Sharing Plan and Trust Agreement.(3)10.2 Amendment to American Software, Inc. 401(k)/Profit Sharing Plan and Trust Agreement.(4)10.3 The Logility, Inc. 1997 Stock Plan as Amended and Restated Effective July 9, 2009.(5)10.4 The Logility, Inc. 2007 Stock Plan as Amended and Restated Effective July 9, 2009.(5)10.5 The Company’s 2001 Stock Option Plan, as Amended and Restated Effective August 17, 2009.(6)10.6 The Company’s 2011 Equity Compensation Plan.(7)21.1 List of Subsidiaries.23.1 Consent of Independent Registered Public Accounting Firm.31.1 Certification Pursuant to Rule 13a-14(a)/15d-14(a).31.2 Certification Pursuant to Rule 13a-14(a)/15d-14(a).32.1 Certifications Pursuant to Section 906 of Sarbanes-Oxley Act of 2002.101.INS XBRL Instance Document.101.SCH XBRL Taxonomy Extension Schema Document.101.CAL XBRL Taxonomy Extension Calculation Linkbase Document.101.DEF XBRL Taxonomy Extension Definition Linkbase Document.101.LAB XBRL Taxonomy Extension Label Linkbase Document.101.PRE XBRL Taxonomy Extension Presentation Linkbase Document.
(1) Incorporated by reference herein. Filed by the Company as an exhibit to its quarterly report filed onForm 10-Q for the quarter ended October 31, 1990.
(2) Incorporated by reference herein. Filed by the Company as an exhibit to its quarterly report filed onForm 10-Q for the quarter ended January 31, 2010.
(3) Incorporated by reference herein. Filed by the Company as an exhibit to its Registration StatementNo. 33-55214 filed on Form S-8 on December 1, 1992.
(4) Incorporated by reference herein. Filed by the Company as an exhibit to its annual report filed onForm 10-K for the fiscal year ended April 30, 2002.
(5) Incorporated by reference herein. Filed by the Company as an exhibit to its Registration StatementNo. 333-160559 filed on Form S-8 on July 13, 2009.
(6) Incorporated by reference herein. Filed by the Company as an exhibit to its Registration StatementNo. 333-161471 filed on Form S-8 on August 21, 2009.
(7) Incorporated by reference herein. Filed by the Company as an exhibit to its Registration StatementNo. 333-168943 filed on Form S-8 on August 19, 2010.
102

SHEDULE II
AMERICAN SOFTWARE, INC.
CONSOLIDATED VALUATION ACCOUNTS
Years ended April 30, 2013, 2012, 2011(In thousands)
Allowance for Doubtful Accounts
Year ended:
Balance atbeginningof year
Amountscharged toexpense
OtherAdditions(1)
Deductions(2)
Balance atend of year
April 30, 2013 . . . . . . . . . . . . . . . . $171 216 0 50 337April 30, 2012 . . . . . . . . . . . . . . . . $243 238 0 310 171April 30, 2011 . . . . . . . . . . . . . . . . $187 173 0 117 243
(1) Recovery of previously written-off amounts.(2) Write-off of uncollectible accounts.
Deferred Income Tax Valuation Allowance
The deferred tax valuation allowance roll-forward is included in Item 8 of this Report in the Notes toConsolidated Financial Statements—Note 5.
See accompanying report of independent registered public accounting firm.
103

SIGNATURES
Pursuant to the requirements of Section 13 or 15(d) of the Securities Exchange Act of 1934, theregistrant has duly caused this report to be signed on its behalf by the undersigned, thereunto dulyauthorized.
AMERICAN SOFTWARE, INC.
By: /s/ J. Michael Edenfield
J. Michael EdenfieldPresident, Chief Executive Officer,
Director and Chief Operating Officer
Date: July 12, 2013
Pursuant to the requirements of the Securities Exchange Act of 1934, this report has been signedbelow by the following persons on behalf of the registrant and in the capacities and on the dates indicated.
Signatures Title Date
/s/ James C. EdenfieldJames C. Edenfield
Executive Chairman, Treasurer andDirector
July 12, 2013
/s/ Thomas L. NewberryThomas L. Newberry
Chairman of the Board of Directors July 12, 2013
/s/ J. Michael EdenfieldJ. Michael Edenfield
President, Chief Executive Officer,Director and Chief Operating Officer
July 12, 2013
/s/ W. Dennis HogueW. Dennis Hogue
Director July 12, 2013
/s/ John J. JarvisJohn J. Jarvis
Director July 12, 2013
/s/ Thomas L. Newberry, V.Thomas L. Newberry, V.
Director July 12, 2013
/s/ James B. Miller, Jr.James B. Miller, Jr.
Director July 12, 2013
/s/ Vincent C. KlingesVincent C. Klinges
Chief Financial Officer July 12, 2013
/s/ Herman L. MoncriefHerman L. Moncrief
Controller and Principal AccountingOfficer
July 12, 2013
104

Exhibit 21.1
American Software, Inc. Subsidiaries
Name of Subsidiary Jurisdiction of Incorporation
American Software Research and Development Corporation . . . . . . . . . . . . . . . . . . . . GeorgiaAmerican Software U.K., Ltd. . . . . . . . . . . . . . . . . . . . . . . . . . . . . . . . . . . . . . . . . . . . . . United KingdomAmerican Software USA, Inc. . . . . . . . . . . . . . . . . . . . . . . . . . . . . . . . . . . . . . . . . . . . . . GeorgiaASI Properties, Inc. . . . . . . . . . . . . . . . . . . . . . . . . . . . . . . . . . . . . . . . . . . . . . . . . . . . . . GeorgiaLogility, Inc. . . . . . . . . . . . . . . . . . . . . . . . . . . . . . . . . . . . . . . . . . . . . . . . . . . . . . . . . . . GeorgiaNew Generation Computing, Inc. . . . . . . . . . . . . . . . . . . . . . . . . . . . . . . . . . . . . . . . . . . FloridaThe Proven Method, Inc. . . . . . . . . . . . . . . . . . . . . . . . . . . . . . . . . . . . . . . . . . . . . . . . . . GeorgiaDemand Management, Inc. . . . . . . . . . . . . . . . . . . . . . . . . . . . . . . . . . . . . . . . . . . . . . . . GeorgiaOptiant, Inc. . . . . . . . . . . . . . . . . . . . . . . . . . . . . . . . . . . . . . . . . . . . . . . . . . . . . . . . . . . . Georgia

Exhibit 23.1
Consent of Independent Registered Public Accounting Firm
The Board of DirectorsAmerican Software, Inc.:
We consent to the incorporation by reference in the registration statements (No. 333-168943 on Form S-8and No. 333-160559 on Form S-8) of American Software, Inc. of our reports dated July 12, 2013, with respect tothe consolidated balance sheets of American Software, Inc. and subsidiaries as of April 30, 2013 and 2012, andthe related consolidated statements of operations, shareholders’ equity and cash flows for each of the years in thethree-year period ended April 30, 2013, and related financial statement schedule, and the effectiveness of internalcontrol over financial reporting as of April 30, 2013, which reports appear in the April 30, 2013, annual report onForm 10-K of American Software, Inc.
/s/ KPMG LLP
Atlanta, GeorgiaJuly 12, 2013

Exhibit 31.1
Certification Pursuant to Rule 13a-14(a)/15d-14(a)
I, J. Michael Edenfield, certify that:
1. I have reviewed this Annual Report on Form 10-K of American Software, Inc.;
2. Based on my knowledge, this report does not contain any untrue statement of a material fact or omit to statea material fact necessary to make the statements made, in light of the circumstances under which suchstatements were made, not misleading with respect to the period covered by this report;
3. Based on my knowledge, the financial statements, and other financial information included in this report,fairly present in all material respects the financial condition, results of operations and cash flows of theregistrant as of, and for, the periods presented in this report;
4. The registrant’s other certifying officer(s) and I are responsible for establishing and maintaining disclosurecontrols and procedures (as defined in Exchange Act Rules 13a-15(e) and 15d-15(e)) and internal controlover financial reporting (as defined in Exchange Act Rules 13a-15(f) and 15d-15(f)) for the registrant andhave:
(a) Designed such disclosure controls and procedures, or caused such disclosure controls and procedures tobe designed under our supervision, to ensure that material information relating to the registrant,including its consolidated subsidiaries, is made known to us by others within those entities, particularlyduring the period in which this report is being prepared;
(b) Designed such internal control over financial reporting, or caused such internal control over financialreporting to be designed under our supervision, to provide reasonable assurance regarding thereliability of financial reporting and the preparation of financial statements for external purposes inaccordance with generally accepted accounting principles;
(c) Evaluated the effectiveness of the registrant’s disclosure controls and procedures and presented in thisreport our conclusions about the effectiveness of the disclosure controls and procedures, as of the endof the period covered by this report based on such evaluation; and
(d) Disclosed in this report any change in the registrant’s internal control over financial reporting thatoccurred during the registrant’s most recent fiscal quarter (the registrant’s fourth fiscal quarter in thecase of an annual report) that has materially affected, or is reasonably likely to materially affect, theregistrant’s internal control over financial reporting; and
5. The registrant’s other certifying officer(s) and I have disclosed, based on our most recent evaluation ofinternal control over financial reporting, to the registrant’s auditors and the audit committee of theregistrant’s board of directors (or persons performing the equivalent functions):
(a) All significant deficiencies and material weaknesses in the design or operation of internal control overfinancial reporting which are reasonably likely to adversely affect the registrant’s ability to record,process, summarize and report financial information; and
(b) Any fraud, whether or not material, that involves management or other employees who have asignificant role in the registrant’s internal control over financial reporting.
Date: July 12, 2013 By: /s/ J. Michael EdenfieldJ. Michael Edenfield
Chief Executive Officer

Exhibit 31.2
Certification Pursuant to Rule 13a-14(a)/15d-14(a)
I, Vincent C. Klinges, certify that:
1. I have reviewed this Annual Report on Form 10-K of American Software, Inc.;
2. Based on my knowledge, this report does not contain any untrue statement of a material fact or omit to statea material fact necessary to make the statements made, in light of the circumstances under which suchstatements were made, not misleading with respect to the period covered by this report;
3. Based on my knowledge, the financial statements, and other financial information included in this report,fairly present in all material respects the financial condition, results of operations and cash flows of theregistrant as of, and for, the periods presented in this report;
4. The registrant’s other certifying officer(s) and I are responsible for establishing and maintaining disclosurecontrols and procedures (as defined in Exchange Act Rules 13a-15(e) and 15d-15(e)) and internal controlover financial reporting (as defined in Exchange Act Rules 13a-15(f) and 15d-15(f)) for the registrant andhave:
(a) Designed such disclosure controls and procedures, or caused such disclosure controls and procedures tobe designed under our supervision, to ensure that material information relating to the registrant,including its consolidated subsidiaries, is made known to us by others within those entities, particularlyduring the period in which this report is being prepared;
(b) Designed such internal control over financial reporting, or caused such internal control over financialreporting to be designed under our supervision, to provide reasonable assurance regarding thereliability of financial reporting and the preparation of financial statements for external purposes inaccordance with generally accepted accounting principles;
(c) Evaluated the effectiveness of the registrant’s disclosure controls and procedures and presented in thisreport our conclusions about the effectiveness of the disclosure controls and procedures, as of the endof the period covered by this report based on such evaluation; and
(d) Disclosed in this report any change in the registrant’s internal control over financial reporting thatoccurred during the registrant’s most recent fiscal quarter (the registrant’s fourth fiscal quarter in thecase of an annual report) that has materially affected, or is reasonably likely to materially affect, theregistrant’s internal control over financial reporting; and
5. The registrant’s other certifying officer(s) and I have disclosed, based on our most recent evaluation ofinternal control over financial reporting, to the registrant’s auditors and the audit committee of theregistrant’s board of directors (or persons performing the equivalent functions):
(a) All significant deficiencies and material weaknesses in the design or operation of internal control overfinancial reporting which are reasonably likely to adversely affect the registrant’s ability to record,process, summarize and report financial information; and
(b) Any fraud, whether or not material, that involves management or other employees who have asignificant role in the registrant’s internal control over financial reporting.
Date: July 12, 2013 By: /s/ Vincent C. KlingesVincent C. Klinges
Chief Financial Officer
Exhibit 32.1
Certifications Pursuant to Section 906 ofThe Sarbanes-Oxley Act of 2002 (18 U.S.C Section 1350)
The undersigned, as the Chief Executive Officer of American Software, Inc., certifies that, to the best of hisknowledge and belief, the Annual Report on Form 10-K for the fiscal year ended April 30, 2013 (the “Report”),which accompanies this certification, fully complies with the requirements of Section 13(a) of the SecuritiesExchange Act of 1934 and the information contained in the Report fairly presents, in all material respects, thefinancial condition and results of operations of American Software, Inc. at the dates and for the periods indicated.The foregoing certification is made pursuant to Section 906 of the Sarbanes-Oxley Act of 2002 (18 U.S.C.Section 1350) and shall not be relied upon for any other purpose.
This 12th day of July, 2013 /s/ J. Michael Edenfield
J. Michael EdenfieldChief Executive Officer
The undersigned, as the Chief Financial Officer of American Software, Inc., certifies that, to the best of hisknowledge and belief, the Annual Report on Form 10-K for the fiscal year ended April 30, 2013 (the “Report”),which accompanies this certification, fully complies with the requirements of Section 13(a) of the SecuritiesExchange Act of 1934 and the information contained in the Report fairly presents, in all material respects, thefinancial condition and results of operations of American Software, Inc. at the dates and for the periods indicated.The foregoing certification is made pursuant to Section 906 of the Sarbanes-Oxley Act of 2002 (18 U.S.C.Section 1350) and shall not be relied upon for any other purpose.
This 12th day of July, 2013 /s/ Vincent C. Klinges
Vincent C. KlingesChief Financial Officer
A signed original of this written statement required by Section 906, or other document authenticating,acknowledging, or otherwise adopting the signature that appears in typed form within the electronic version ofthis written statement required by Section 906, has been provided to American Software, Inc. and will be retainedby American Software, Inc. and furnished to the Securities and Exchange Commission or its staff upon request.
The information in this Exhibit 32.1 shall not be deemed “filed” for purposes of Section 18 of the SecuritiesExchange Act of 1934, as amended, nor shall it be deemed incorporated by reference in any filing under theSecurities Act of 1933, except as shall be expressly set forth by specific reference in such filing.

[THIS PAGE INTENTIONALLY LEFT BLANK]

[THIS PAGE INTENTIONALLY LEFT BLANK]

[THIS PAGE INTENTIONALLY LEFT BLANK]

James C. EdenfieldExecutive Chairman
J. Michael EdenfieldPresident and Chief Executive Officer
Vincent C. KlingesChief Financial Officer
James R. McGuoneGeneral Counsel, Vice President and Secretary
Thomas L. Newberry, Ph.D.Chairman of the Board of Directors
James C. EdenfieldExecutive Chairman
J. Michael EdenfieldPresident and Chief Executive Officer
W. Dennis HoguePresident, Hogue Enterprises
John J. Jarvis, Ph.D.Former Executive Director, The Logistics Institute - Asia Pacific, Georgia Institute of Technology
James B. Miller, Jr.Chairman, President, and Chief Executive Officer, Fidelity Southern Corporation
Thomas L. Newberry, VChief Executive Officer, 1% Club, Inc.
Goldman, Sachs & Co.Jefferies & Company Inc.Knight Capital Americas LLCLatour Trading LLCMaxim Group LLCMerrill Lynch, Pierce, FennerMorgan Stanley & Co. LLCNASDAQ Execution Services LLCNational Stock ExchangeNeedham & Company LLCPershing Advisor Solution LLCRBC Capital Markets LLCRiley & Co.Stifel Nicolaus & Co.SunTrust Capital Markets Inc.Susquehanna Capital GroupSusquehanna Financial GroupTimber Hill Inc.Two Sigma Securities LLCUBS Securities LLC
Contact Information
American Software, Inc.470 East Paces Ferry Road, NEAtlanta, GA 30305Phone 404-261-4381Fax 404-264-5514www.amsoftware.com
Investor Contact
Pat McManusPhone 404-364-7615Fax [email protected]
Annual Meeting
The annual meeting of shareholderswill be held at 3:00 PM EST on Monday,August 19, 2013, at American SoftwareHeadquarters, 470 East Paces Ferry Road,NE, Atlanta, GA. All American Softwareshareholders are encouraged to attend.
Exchange: NASDAQ Global MarketSymbol: AMSWA
Inquiries regarding stock transfers, lost certificates or address changes should be directed to the following address:
Transfer Agent
American Stock Transfer & TrustCompany LLC
16633 N. Dallas Parkway, Suite 600Addison, TX 75001Phone 972-588-1852Cell 704-956-3386Fax [email protected]
Independent Auditors
KPMG LLP
303 Peachtree Street, NESuite 2000Atlanta, GA 30308-2355Phone 404-222-3000
Forward-looking StatementsThis annual report contains forward-looking statements that are subject to substantial risks and uncertainties. There are a number of factors that could cause actual results to differ materially from those anticipated by statements made herein. These factors include, but are not limited to, changes in general economic conditions, technology and the market for the Company’s products and services, including economic conditions within the software application markets; the timely availability and market acceptance of these products and services; the challenges and risks associated with integration of acquired product lines and companies; the effect of competitive products and pricing; the Company’s ability to satisfy in a timely manner the requirements of Section 404 of the Sarbanes-Oxley Act of 2002 and the rules and regulations adopted under that Section; the uncertainty of the viability and effectiveness of strategic alliances; and the irregular pattern of the Company’s revenues. For further information about risks the Company could experience as well as other information, please refer to the Company’s Form 10-K for the year ended April 30, 2013 furnished within and other reports and documents subsequently filed with the Securitiesand Exchange Commission.
Offices
Worldwide Locations
Corporate Headquarters
470 East Paces Ferry Road, NEAtlanta, GA 30305Phone 404-261-4381Fax 404-264-5514 www.amsoftware.com
Subsidiaries
American Software USA, Inc.
470 East Paces Ferry Road, NEAtlanta, GA 30305Phone 404-261-4381Fax 404-264-5514
ASI Properties, Inc.
470 East Paces Ferry Road, NEAtlanta, GA 30305Phone 404-261-4381Fax 404-238-5514
Logility, Inc.
470 East Paces Ferry Road, NEAtlanta, GA 30305Phone 404-261-9777Fax 404-264-5813www.logility.com
Birmingham UKFort Dunlop, Fort ParkwayBirmingham, B24 9FE United KingdomPhone +44 (0) 121 629 7866Fax +44 (0) 121 629 7701
Boston34 Washington Street, Suite 210Wellesley Hills, MA 02481Phone 781-237-3383Fax 781-237-0156
Burlington8 New England Executive ParkSuite 130 Burlington, MA 01803Phone 781-238-8855Fax 781-238-8887
Chicago 1011 East Touhy Avenue, Suite 315Des Plaines, IL 60018Phone 847-699-6620Fax 847-699-6671
Dallas545 E. John Carpenter FreewaySuite 300Irving, TX 75062Phone 972-719-9177Fax 972-719-9178
Demand Management, Inc.
1 Cityplace Drive Suite 540St. Louis, MO 63141Phone: 314-991-7100www.demandsolutions.com
New Generation Computing, Inc.
14900 Northwest 79th CourtSuite 100Miami Lakes, FL 33016Phone 305-556-9122Fax 305-828-6358www.ngcsoftware.com
The Proven Method, Inc.
470 East Paces Ferry Road, NEAtlanta, GA 30305Phone 404-238-8480Fax 404-238-8499www.provenmethod.com
Market Makers
The following firms make a market in the common shares of American Software:
Archipelago Stock ExchangeAutomated Trading DeskBarclays Capital Inc./LeBats Trading Inc.Canaccord Genuity Inc.Cantor, Fitzgerald & Co.Chicago Board Options ExchangeCitadel Derivatives Group LLCCitadel Securities LLCCitigroup Global Markets Inc.Credit Suisse Securities USADirect Edge ECN LLCG1 Execution Services LLC
EXECUTIVE OFFICERS BOARD OF DIRECTORS
©2013 American Software, Inc.

American Software470 East Paces Ferry Road, NE, Atlanta, Georgia 30305
404-261-4381 Fax 404-264-5514
www.amsoftware.com