fy2010 consolidated financial results (prepared in
TRANSCRIPT

Advantest Corporation (FY2010)
1
FY2010 Consolidated Financial Results (Prepared in accordance with U.S. GAAP)
(Year ended March 31, 2011) (Unaudited)
April 27, 2011 Company name : Advantest Corporation (URL http://www.advantest.co.jp/investors/en-index.shtml) Stock exchanges on which shares are listed : First section of the Tokyo Stock Exchange Stock code number : 6857 Company representative : Haruo Matsuno, Representative Director, President and
CEO Contact person : Hiroshi Nakamura, Managing Executive Officer and
Senior Vice President, Corporate Administration Group (03) 3214-7500 Date of General Shareholders’ Meeting (as planned) : June 24, 2011 Dividend Payable Date (as planned) : June 2, 2011 Annual Report Filing Date (as planned) : June 27, 2011 Financial Results Supplemental Materials : Yes Financial Results Presentation Meeting : Yes
(Rounded to the nearest million yen) 1. Consolidated Results of FY2010 (April 1, 2010 through March 31, 2011) (1) Consolidated Financial Results
(% changes as compared with the previous fiscal year) Net sales Operating income
(loss) Income (loss) before income taxes and equity in earnings (loss) of affiliated company
Net income (loss)
Million yen % increase(decrease) Million yen % increase
(decrease) Million yen % increase(decrease) Million yen % increase
(decrease)
FY2010 99,634 (87.2) 6,111 - 5,551 - 3,163 -
FY2009 53,225 (30.6) (11,639) - (9,926) - (11,454) -(Note) Comprehensive income (loss): FY2010 (Y) (248) million (‐%); FY2009 (Y) (11,726) million (‐%)
Net income (loss) per share - basic
Net income (loss) per share - diluted
Net income (loss) to equity ratio
Ratio of income (loss) before taxes to
total assets
Ratio of operating income (loss) to net sales
Yen Yen % % % FY2010 18.03 18.03 2.2 3.0 6.1 FY2009 (64.09) (64.09) (7.3) (5.1) (21.9) (Reference) Equity in earnings (loss) of affiliated company: FY2010 (Y) (36) million; FY2009 (Y) (71) million
(2) Consolidated Financial Position Total assets Net assets Equity-to-assets ratio Net assets
per share Million yen Million yen % Yen FY2010 180,312 138,132 76.6 797.20 FY2009 188,663 150,242 79.6 840.65 (3) Consolidated Cash Flows
Cash flows from operating activities
Cash flows from investing activities
Cash flows from financing activities
Cash and cash equivalentsat end of year
Million yen Million yen Million yen Million yen FY2010 (693) (5,828) (12,028) 75,323 FY2009 (17,746) 10,824 (1,803) 96,439

Advantest Corporation (FY2010)
2
2. Dividends Dividend per share
(Record Date) First quarter end
Second quarter end
Third quarter end Year end Annual total
Total dividend
paid (annual)
Payout ratio (consolidated)
Ratio of total amount of
dividends to net assets
(consolidated) yen yen yen yen yen Million yen % % FY2009 - 5.00 - 5.00 10.00 1,787 - 1.1 FY2010 - 5.00 - 5.00 10.00 1,733 55.5 1.2 FY2011 (forecast) - - - - - N/A - N/A
The dividend forecast for the fiscal year ending March 31, 2012 has not been decided. Advantest takes
earnings forecast into consideration and intends to promptly disclose the relevant dividend forecast when such forecast becomes available. 3. Projected Results for FY2011 (April 1, 2011 through March 31, 2012)
Advantest focuses primarily on the business of test systems for semiconductors and Advantest’s business relies heavily on the capital expenditures of semiconductor manufacturers, test houses and foundries. The capital expenditures of these companies are determined primarily by factors such as current or future trends in the demand for semiconductors. At this time, Advantest is unable to provide the earnings forecast for the fiscal year ending March 31, 2012 due to difficulty in forecasting trends in the demand for semiconductors and investment plans for semiconductor related capital expenditures. Advantest intends to promptly disclose the relevant earnings forecast when such disclosure becomes possible. 4. Others (1) Material changes in subsidiaries during this fiscal year (changes in scope of consolidation resulting from
changes in subsidiaries): Yes Newly included None; Excluded 1 (Company name: Advantest Manufacturing, Inc.) (Note) Please see “Scope of Consolidation and Application of the Equity Method” on page 18 for details.
(2) Changes in accounting principles, procedures and the presentation of the consolidated financial
statements 1) Changes based on revisions of accounting standard : None 2) Changes other than 1) above : None
(3) Number of issued and outstanding shares (common stock)
1) Number of issued and outstanding stock at the end of each fiscal year (including treasury stock): FY2010 199,566,770 shares; FY2009 199,566,770 shares.
2) Number of treasury stock at the end of each fiscal year: FY2010 26,294,819 shares; FY2009 20,845,178 shares.
3) Average number of outstanding stock for each fiscal year: FY2010 175,481,854 shares; FY2009 178,722,505 shares.

Advantest Corporation (FY2010)
3
(Reference) Selected Non-Consolidated Financial Data (Prepared in accordance with JAPAN GAAP)
1. Non-consolidated Results of FY2010 (April 1, 2010 through March 31, 2011) (1) Non-Consolidated Financial Results
(% changes as compared with the previous fiscal year)
Net sales Operating income (loss) Income (loss) before income taxes Net income (loss)
Million yen % increase(decrease) Million yen % increase
(decrease) Million yen % increase(decrease) Million yen % increase
(decrease) FY2010 84,792 102.3 (1,848) - 3,743 - 9,105 - FY2009 41,907 (21.1) (17,307) - (2,384) - (2,402) -
Net income (loss) per share - basic
Net income (loss) per share - diluted
Yen Yen FY2010 51.89 51.88 FY2009 (13.44) - (2) Non-consolidated Financial Position
Total assets Net assets Equity-to-assets ratio Net assets per share
Million yen Million yen % Yen FY2010 151,514 123,755 80.8 706.92 FY2009 157,639 128,647 79.6 702.18 (Reference) Total equity : FY2010 (Y) 122,489 million; FY2009 (Y) 125,494 million.
Implementation status of audit procedures This consolidated financial results report is not subject to audit procedures by independent auditors under Japan’s Financial
Instruments and Exchange Law. At the time of release of this report, audit procedures under the Financial Instruments and Exchange Law have not been completed.
Explanation on the Appropriate Use of Future Earnings Projections and Other Special Instructions
This document contains “forward-looking statements” that are based on Advantest’s current expectations, estimates and projections. These forward-looking statements are subject to known and unknown risks, uncertainties and other factors that may cause Advantest’s actual results, levels of activities, performance or achievements to be materially different from those expressed or implied by such forward-looking statements. These factors include: (i) changes in demand for the products and services produced and offered by Advantest’s customers, including semiconductors, communications services and electronic goods; (ii) circumstances relating to Advantest’s investment in technology, including its ability to timely develop products that meet the changing needs of semiconductor manufacturers, communications network equipment and components makers and service providers; (iii) significant changes in the competitive environment in the major markets where Advantest purchases materials, components and supplies for the production of its products or where its products are produced, distributed or sold; and (iv) changes in economic conditions, currency exchange rates or political stability in the major markets where Advantest procures materials, components and supplies for the production of its principal products or where its products are produced, distributed or sold. A discussion of these and other factors which may affect Advantest's actual results, levels of activity, performance or achievements is contained in the "Operating and Financial Review", "Key Information - Risk Factors" and "Information on the Company" sections and elsewhere in Advantest's annual report on Form 20-F, which is on file with the United States Securities and Exchange Commission.
Advantest Corporation (FY2010)
4
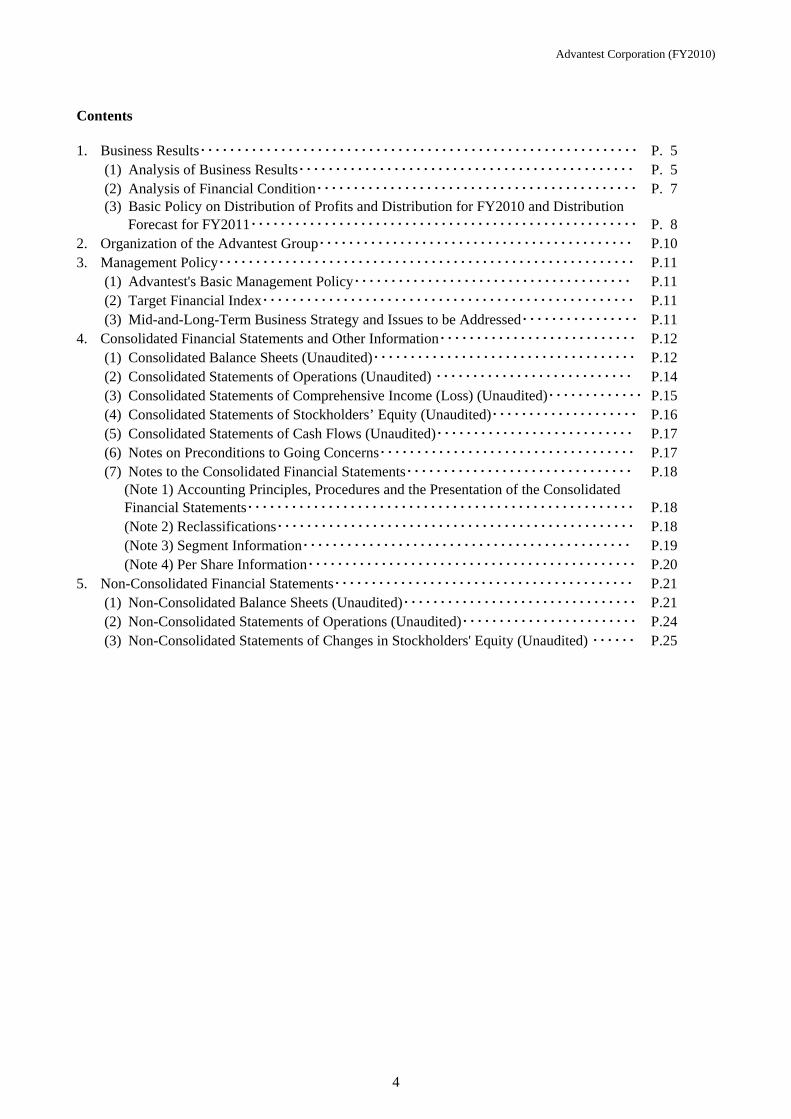
Contents 1. Business Results・・・・・・・・・・・・・・・・・・・・・・・・・・・・・・・・・・・・・・・・・・・・・・・・・・・・・・・・・・・・ P. 5
(1) Analysis of Business Results・・・・・・・・・・・・・・・・・・・・・・・・・・・・・・・・・・・・・・・・・・・・・・ P. 5 (2) Analysis of Financial Condition・・・・・・・・・・・・・・・・・・・・・・・・・・・・・・・・・・・・・・・・・・・・ P. 7 (3) Basic Policy on Distribution of Profits and Distribution for FY2010 and Distribution
Forecast for FY2011・・・・・・・・・・・・・・・・・・・・・・・・・・・・・・・・・・・・・・・・・・・・・・・・・・・・・ P. 8 2. Organization of the Advantest Group・・・・・・・・・・・・・・・・・・・・・・・・・・・・・・・・・・・・・・・・・・・ P.10 3. Management Policy・・・・・・・・・・・・・・・・・・・・・・・・・・・・・・・・・・・・・・・・・・・・・・・・・・・・・・・・・ P.11
(1) Advantest's Basic Management Policy・・・・・・・・・・・・・・・・・・・・・・・・・・・・・・・・・・・・・・ P.11 (2) Target Financial Index・・・・・・・・・・・・・・・・・・・・・・・・・・・・・・・・・・・・・・・・・・・・・・・・・・・ P.11 (3) Mid-and-Long-Term Business Strategy and Issues to be Addressed・・・・・・・・・・・・・・・・ P.11
4. Consolidated Financial Statements and Other Information・・・・・・・・・・・・・・・・・・・・・・・・・・・ P.12 (1) Consolidated Balance Sheets (Unaudited)・・・・・・・・・・・・・・・・・・・・・・・・・・・・・・・・・・・・ P.12 (2) Consolidated Statements of Operations (Unaudited) ・・・・・・・・・・・・・・・・・・・・・・・・・・・ P.14 (3) Consolidated Statements of Comprehensive Income (Loss) (Unaudited)・・・・・・・・・・・・・ P.15 (4) Consolidated Statements of Stockholders’ Equity (Unaudited)・・・・・・・・・・・・・・・・・・・・ P.16 (5) Consolidated Statements of Cash Flows (Unaudited)・・・・・・・・・・・・・・・・・・・・・・・・・・・ P.17 (6) Notes on Preconditions to Going Concerns・・・・・・・・・・・・・・・・・・・・・・・・・・・・・・・・・・・ P.17 (7) Notes to the Consolidated Financial Statements・・・・・・・・・・・・・・・・・・・・・・・・・・・・・・・ P.18
(Note 1) Accounting Principles, Procedures and the Presentation of the Consolidated Financial Statements・・・・・・・・・・・・・・・・・・・・・・・・・・・・・・・・・・・・・・・・・・・・・・・・・・・・・ P.18 (Note 2) Reclassifications・・・・・・・・・・・・・・・・・・・・・・・・・・・・・・・・・・・・・・・・・・・・・・・・・ P.18 (Note 3) Segment Information・・・・・・・・・・・・・・・・・・・・・・・・・・・・・・・・・・・・・・・・・・・・・ P.19 (Note 4) Per Share Information・・・・・・・・・・・・・・・・・・・・・・・・・・・・・・・・・・・・・・・・・・・・・ P.20
5. Non-Consolidated Financial Statements・・・・・・・・・・・・・・・・・・・・・・・・・・・・・・・・・・・・・・・・・ P.21 (1) Non-Consolidated Balance Sheets (Unaudited)・・・・・・・・・・・・・・・・・・・・・・・・・・・・・・・・ P.21 (2) Non-Consolidated Statements of Operations (Unaudited)・・・・・・・・・・・・・・・・・・・・・・・・ P.24 (3) Non-Consolidated Statements of Changes in Stockholders' Equity (Unaudited) ・・・・・・ P.25

Advantest Corporation (FY2010)
5
1. Business Results (1) Analysis of Business Results 1) Consolidated Financial Results of FY2010 (April 1, 2010 through March 31, 2011)
(in billion yen)
FY2009 FY2010
As compared to the previous fiscal year
Increase (decrease)
Orders input received 67.7 109.0 60.9% Net sales 53.2 99.6 87.2% Operating income (loss) (11.6) 6.1 -
Income (loss) before income taxes and equity in earnings (loss) of affiliated company (9.9) 5.6 - Net income (loss) (11.5) 3.2 -
In the fiscal year ended March 31, 2011, the global economy showed overall growth, driven by expansion in the developing world and national policies to stimulate consumption, despite complicating factors such as inflation in China and other emerging economies, sluggish employment growth in the United States, and the European sovereign debt crisis.
The semiconductor market also registered significant overall growth, despite demand divergence among various device types, notably a weakening in DRAM in the latter half fiscal 2010, in contrast to strong growth in the DRAM market at the beginning of the period.
Factors including strong yen appreciation and price competition contributed to a difficult business environment for Advantest in this fiscal year, but the company successfully leveraged the positive growth in the semiconductor market into expanded orders and revenues. Advantest also strove to better its results through proactive management policies aimed at improving customer satisfaction through global service provision and shorter lead times, and through consolidation of its subsidiaries.
These efforts delivered revenue and order growth, and helped Advantest to achieve full-year profitability for the first time in three fiscal years. Moreover, the company’s order backlog as of March 31 was significantly greater than the previous fiscal year’s.
As a result of the above, orders input received was (Y) 109.0 billion (a 60.9% increase in comparison to FY2009), net sales were (Y) 99.6 billion (a 87.2% increase in comparison to FY2009), operating income was (Y) 6.1 billion ((Y) 17.7 billion improvement in comparison to FY2009), income before income taxes and equity in loss of affiliated company was (Y) 5.6 billion ((Y) 15.5 billion improvement in comparison to FY2009), net income was (Y) 3.2 billion ((Y) 14.7 billion improvement in comparison to FY2009). The percentage of net sales to overseas customers was 77.5%, compared to 77.5% in FY2009.
Advantest Corporation (FY2010)
6
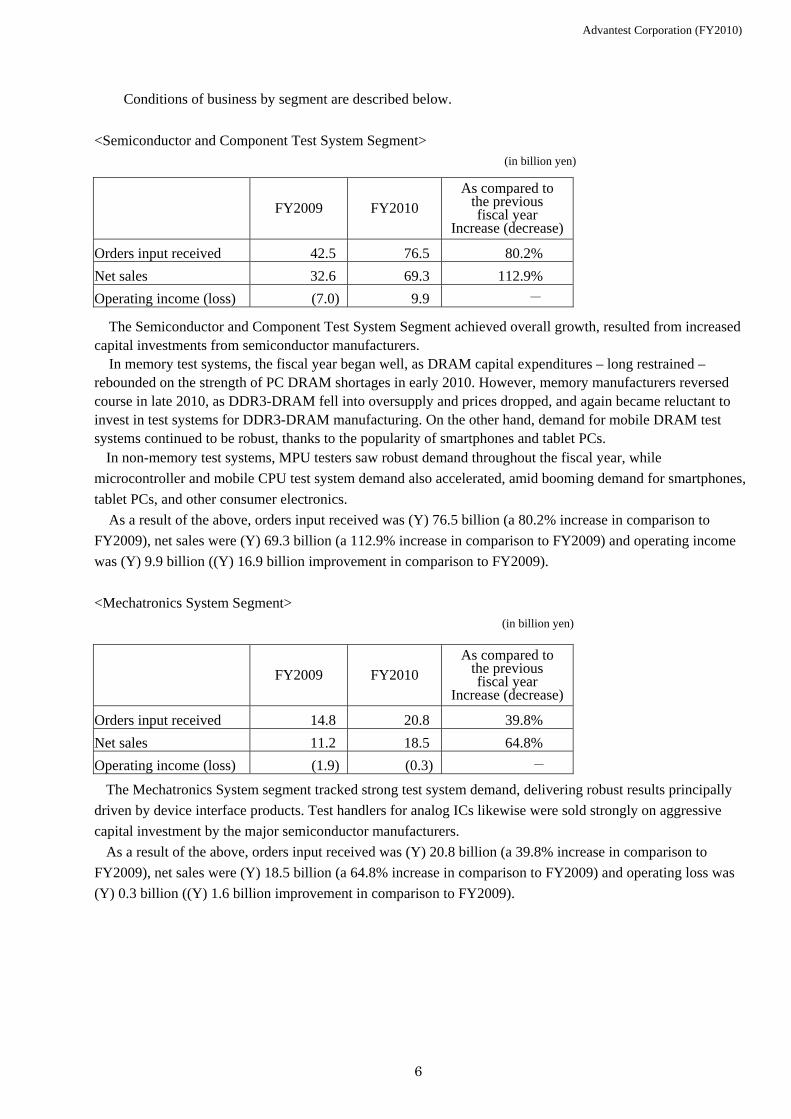
Conditions of business by segment are described below.
<Semiconductor and Component Test System Segment> (in billion yen)
FY2009 FY2010
As compared to the previous fiscal year
Increase (decrease)
Orders input received 42.5 76.5 80.2% Net sales 32.6 69.3 112.9% Operating income (loss) (7.0) 9.9 -
The Semiconductor and Component Test System Segment achieved overall growth, resulted from increased
capital investments from semiconductor manufacturers. In memory test systems, the fiscal year began well, as DRAM capital expenditures – long restrained –
rebounded on the strength of PC DRAM shortages in early 2010. However, memory manufacturers reversed course in late 2010, as DDR3-DRAM fell into oversupply and prices dropped, and again became reluctant to invest in test systems for DDR3-DRAM manufacturing. On the other hand, demand for mobile DRAM test systems continued to be robust, thanks to the popularity of smartphones and tablet PCs.
In non-memory test systems, MPU testers saw robust demand throughout the fiscal year, while microcontroller and mobile CPU test system demand also accelerated, amid booming demand for smartphones, tablet PCs, and other consumer electronics.
As a result of the above, orders input received was (Y) 76.5 billion (a 80.2% increase in comparison to FY2009), net sales were (Y) 69.3 billion (a 112.9% increase in comparison to FY2009) and operating income was (Y) 9.9 billion ((Y) 16.9 billion improvement in comparison to FY2009). <Mechatronics System Segment>
(in billion yen)
FY2009 FY2010
As compared to the previous fiscal year
Increase (decrease)
Orders input received 14.8 20.8 39.8% Net sales 11.2 18.5 64.8% Operating income (loss) (1.9) (0.3) -
The Mechatronics System segment tracked strong test system demand, delivering robust results principally
driven by device interface products. Test handlers for analog ICs likewise were sold strongly on aggressive capital investment by the major semiconductor manufacturers.
As a result of the above, orders input received was (Y) 20.8 billion (a 39.8% increase in comparison to FY2009), net sales were (Y) 18.5 billion (a 64.8% increase in comparison to FY2009) and operating loss was (Y) 0.3 billion ((Y) 1.6 billion improvement in comparison to FY2009).

Advantest Corporation (FY2010)
7
<Services, Support and Others Segment>
(in billion yen)
FY2009 FY2010
As compared to the previous fiscal year
Increase (decrease)
Orders input received 13.0 14.0 8.2% Net sales 11.8 14.2 19.7% Operating income 2.2 2.1 (2.0%)
The Services, Support and Others Segment delivered stable results, as Advantest’s customers placed larger orders for new testers, and customer utilization rates improved.
As a result, orders input received was (Y) 14.0 billion (a 8.2% increase in comparison to FY2009), net sales were (Y) 14.2 billion (a 19.7% increase in comparison to FY2009) and operating income was (Y) 2.1 billion (a 2.0% decrease in comparison to FY2009). 2) Prospects for the Upcoming Fiscal Year
The Great East Japan Earthquake and tsunami that struck Japan on March 11 inflicted damage on suppliers of semiconductors, semiconductor materials, and components, with the extent of the impact on the global supply chain still unclear at this time. This uncertainty in the consumer electronics, computer, automotive, and other markets deeply intertwined with the semiconductor industry, as well as chip markets themselves, is expected to continue for the time being.
Advantest escaped the natural disaster with only minor damage to facilities in the affected area, and has already returned to normal operations. However, some of the company’s components and materials suppliers suffered damage to their manufacturing facilities. Advantest has established an emergency procurement structure to ensure the stability of its own manufacturing operations.
Meanwhile, the semiconductor market continues its growth trajectory, with social trends towards greater information-oriented society expected to stimulate increasing demand for chips. Semiconductor manufacturers are demonstrating readiness to invest aggressively in production capacity expansion, and reconstruction in the wake of the recent earthquake in Japan should help to drive an increasingly positive market outlook. Advantest consequently expects increasingly positive trends in its own business environment.
The company’s corporate initiative “1000 Days,” which was launched in July 2009 and will conclude at the end of fiscal 2011, aims to deliver cumulative profitability over the three-year span of the initiative.
Advantest has undertaken several measures to achieve that goal, centrally its policy of seeking sales growth through market share expansion in the non-memory test systems segment, which accounts for the majority of worldwide tester revenues, and is expected to grow at a stable rate. The company is also striving to enhance profitability through internal kaizen improvements such as shorter R&D and manufacturing lead times, material cost reductions, and greater administrative efficiencies. In parallel, Advantest is broadening its business platform for long-term growth by targeting new markets outside the semiconductor industry, a push spearheaded by the company’s new TAS7000 terahertz 3D imaging system.
On March 28, Advantest and Verigy Ltd. entered into a definitive agreement providing for a business combination of the two companies. Regulatory approval of the deal is pending. Other closing conditions, and conditions pertaining to the acquisition and future merger of the two companies, have not yet been satisfied, and no expected closing date has currently been announced. Further announcements will follow any developments in these matters warranting disclosure. (2) Analysis of Financial Condition
Total assets at the end of FY2010 was (Y) 180.3 billion, a decrease of (Y) 8.4 billion compared to the previous fiscal year, primarily due to a decrease of (Y) 21.1 billion in cash and cash equivalents, and an

Advantest Corporation (FY2010)
8
increase of (Y) 6.9 billion and (Y) 6.8 billion in inventories and trade receivables, respectively. The amount of total liabilities was (Y) 42.2 billion, an increase of (Y) 3.8 billion compared to March 31, 2010. Stockholders' equity was (Y) 138.1 billion. Equity to assets ratio was 76.6%, a decrease of 3.0 percentage point compared to the previous fiscal year.
(Cash Flow Condition)
Cash and cash equivalents held at the end of FY2010 were (Y) 75.3 billion, a decrease of (Y) 21.1 billion from the previous fiscal year.
Significant cash flows during this fiscal year and their causes are described below. Net cash used in operating activities was (Y) 0.7 billion (Net cash outflow (Y) 17.7 billion in FY2009).
This amount was primarily attributable to an increase of (Y) 7.6 billion in trade receivables, an increase of (Y) 7.3 billion in inventories, an increase of (Y) 2.5 billion in accrued expenses and an adjustment of noncash items such as depreciation and amortization, despite the net income being (Y) 3.2 billion.
Net cash used in investing activities was (Y) 5.8 billion (Net cash inflow (Y) 10.8 billion in FY2009). This amount was primarily attributable to purchases of property, plant and equipment in the amount of (Y) 3.1 billion and an increase in short-term investments in the amount of (Y) 2.4 billion.
Net cash used in financing activities was (Y) 12.0 billion (Net cash outflow (Y) 1.8 billion in FY2009). This amount was primarily attributable to purchases of treasury stock in the amount of (Y) 10.3 billion and dividends paid in the amount of (Y) 1.8 billion.
The following table illustrates the historical movements of certain cash flow indexes:
FY2006 FY2007 FY2008 FY2009 FY2010 Stockholders' equity ratio (%) 80.5 85.1 81.0 79.6 76.6
Stockholders' equity ratio based on market prices (%)
267.9 154.7 129.2 221.5 144.0
Debt to annual cash flow ratio (%) 0.1 0.0 0.2 - -Interest coverage ratio (times) 3,094.7 1,839.4 195.9 - -Stockholders' equity ratio: stockholders' equity / total assets Stockholders' equity ratio based on market prices: market capitalization / total assets Debt to annual cash flow ratio: interest-bearing liabilities / operating cash flows Interest coverage ratio: operating cash flows / interest payments (Notes) 1. These indexes are calculated using U.S. GAAP figures.
2. Market capitalization is calculated based on issued and outstanding shares excluding treasury stock.
3. Operating cash flows are the cash flows provided by operating activities on the consolidated statements of cash flows.
4. Interest-bearing liabilities include all liabilities on the consolidated balance sheets that incur interest.
(3) Basic Policy on Distribution of Profits and Distribution for FY2010 and Distribution Forecast for FY2011
Based on the premise that long-term and continued growth in corporate value is fundamental to the creation of shareholder value, Advantest deems the consistent distribution of profits to be the most important management priority. Accordingly, Advantest engages in active distribution of profits based on consolidated business performance.
With respect to the distribution of retained earnings, Advantest makes payout decisions after taking into consideration consolidated business performance, financial conditions, as well as the need for strategic investment for mid-to-long-term business development. While aiming to make consistent distributions, because of the fluctuation of the market in which it operates, Advantest makes dividend payouts following a target payout ratio of 20% or more.

Advantest Corporation (FY2010)
9
Retained earnings are devoted to research and development, streamlining efforts, overseas expansion, investments in new businesses and resources for M&A activities, with an aim to strengthen Advantest’s business position and enhance its corporate value.
In order to maintain capital strategies responsive to changes in the operating environment, Advantest will repurchase its own shares from time to time through taking into account factors such as trends in stock price, capital efficiency and cash flow.
In this fiscal year, Advantest decided to distribute a year end dividend of (Y) 5 consistent with the revised forecast announced on January 27, 2011, with a payment date of June 2, 2011. Since Advantest paid an interim dividend of (Y) 5 on December 1, 2010, the total dividend per share for the fiscal year will be (Y) 10.
Advantest has elected not to publish a dividend forecast for fiscal 2011 at this time, primarily due to the semiconductor market is unclear by the Great East Japan Earthquake and tsunami, despite the robust movement of the Company’s business environment, as explained in the prospects section above. Payout decisions will take future results into consideration and will be announced when they are available.

Advantest Corporation (FY2010)
10
2. Organization of the Advantest Group The following diagram shows the business relationships among the major affiliated companies of the Advantest Group.
Customers and Distrib uto rs
Advantest Component, Inc.
Advansoft Development Corporation Advantest America R&D Center, Inc.
Development Companies
Manufacturing Company Advantest Laboratories Co., Ltd.
Advantest Finance Inc. Advanfaci lities Co., Ltd. Advantest Staff Resource
Corporat ion Advantest Media Service Corporat ion
Service Companies
Advantest Engineering (M)Sdn. Bhd.
Japan Engineering Co., Ltd Advantes t Kyus hu Systems Co., Ltd
Advantest America, Inc. Advantest Europe GmbH Advantest (Singapore) Pte. Ltd.
Advantest Taiwan Inc. Advantest Korea Co., Ltd. Advantest (Suzhou) Co., Ltd.
Ad vantest Corporation
Semiconductor and Component Test System Mechatronics S ystem Services, Support and Others
Development, manufacturing and sales Companies Manufacturing Company
Research and Development Company
Sales and Support Companies
There are 10 other consolidated subsidiaries and 1 equity method affiliate in addition to those mentioned in the above diagram. Consolidated subsidiaries (11 domestic; 16 overseas; 27 total) Equity method affiliate (1 domestic)
:Main flow of products and services

Advantest Corporation (FY2010)
11
3. Management Policy (1) Advantest's Basic Management Policy
Advantest has established a corporate vision of “Technology Support on the Leading Edge”, and its corporate mission of “Quest for the Essence”. Guided by these principles, Advantest respects each of its stakeholders, strives to maintain harmony with society, and aims for the sustained development of the Company and the improvement of corporate value while contributing to the goal of a sustainable society.
(2) Target Financial Index
Advantest applies the "AVA" (Advantest Value Added), a financial index incorporating the concept of EVA®(Economic Value Added) *, as a significant management indicator, along with profit margin, ROE and cash flows. Specifically, Advantest will set the minimum return-on-investment ratio ("hurdle rate") for evaluating AVA at 8% and a mid-term target at 12% or more with an aim to further enhance corporate value and shareholder value.
*"EVA®" is a registered trademark of Stern Stewart & Co. (3) Mid-and-Long-Term Business Strategy and Issues to be Addressed
While maintaining "Measurements" as our core competence in mid-and-long term, Advantest intends to improve its corporate value by establishing a management and financial structure that responds timely to changes in the global market, and by aiming to increase market share by introducing fine products that will inspire the market demands of the next generation. To achieve these objectives, Advantest promotes to further strengthen its product development operations and improve production efficiency while strengthening its overseas operations and support system in the U.S., Europe and Asia.
Advantest is establishing an emergency procurement structure to ensure the stability of its own manufacturing operations for some of the company’s components which have become difficult to procure due to the Great East Japan Earthquake and tsunami.
Also the company’s corporate initiative “1000 Days,” which was launched in July 2009 and will conclude at the end of fiscal 2011, aims to deliver cumulative profitability over the three-year span of the initiative. Advantest plans to act for more improvement of profitability by activities such as actions to expand market share by timely offering of new solution in line with market needs and to improve the appointed date of delivery, development of the new business except the semiconductor and activities such as actions to generally reduce costs.

Advantest Corporation (FY2010)
4. Consolidated Financial Statements and Other Information
(1)Consolidated Balance Sheets (Unaudited)
Assets March 31, 2010 March 31, 2011
Current assets:Cash and cash equivalents ¥ 96,439 75,323Short-term investments 10,498 12,651Trade receivables, net 15,930 22,707Inventories 16,590 23,493Other current assets 4,292 2,995
Total current assets 143,749 137,169
Investment securities 8,077 7,432Property, plant and equipment, net 32,881 31,878Intangible assets, net 1,445 1,519Other assets 2,511 2,314
Total assets ¥ 188,663 180,312
Yen (Millions)
12

Advantest Corporation (FY2010)
Yen (Millions)Liabilities and Stockholders’ Equity March 31, 2010 March 31, 2011
Current liabilities:Trade accounts payable ¥ 11,430 11,729Accrued expenses 4,894 7,329Accrued warranty expenses 2,802 1,754Customer prepayments 544 1,740Other current liabilities 2,249 1,955
Total current liabilities 21,919 24,507
Accrued pension and severance costs 13,765 14,069Other liabilities 2,737 3,604
Total liabilities 38,421 42,180
Commitments and contingent liabilities
Stockholders’ equity:Common stock 32,363 32,363Capital surplus 40,463 40,628Retained earnings 181,606 183,009Accumulated other comprehensive income (loss) (14,859) (18,270)Treasury stock (89,331) (99,598)
Total stockholders’ equity 150,242 138,132
Total liabilities and stockholders’ equity ¥ 188,663 180,312
13

Advantest Corporation (FY2010)
(2)Consolidated Statements of Operations (Unaudited)
Year ended Year ended March 31, 2010 March 31, 2011
Net sales ¥ 53,225 99,634Cost of sales 27,297 51,164
Gross profit 25,928 48,470
Research and development expenses 17,896 21,197Selling, general and administrative expenses 19,671 21,162
Operating income (loss) (11,639) 6,111
Other income (expense):Interest and dividend income 579 326Interest expense (4) (3)Impairment losses on investment securities (316) (512)Other, net 1,454 (371)
Total other income (expense) 1,713 (560)
Income (loss) before income taxes and equityin earnings (loss) of affiliated company (9,926) 5,551
Income taxes 1,457 2,352Equity in earnings (loss) of affiliated company (71) (36)
Net income (loss) ¥ (11,454) 3,163
Year ended Year ended March 31, 2010 March 31, 2011
Net income (loss) per share:Basic ¥ (64.09) 18.03Diluted (64.09) 18.03
Yen (Millions)
Yen
14

Advantest Corporation (FY2010)
(3)Consolidated Statements of Comprehensive Income (Loss) (Unaudited)
Year ended Year ended March 31, 2010 March 31, 2011
Comprehensive income (loss)Net income (loss) ¥ (11,454) 3,163Other comprehensive income (loss), net of tax
Foreign currency translation adjustments (2,614) (3,231)Net unrealized gains (losses) on investment securities 776 (59)Pension related adjustment 1,566 (121)
Total other comprehensive income (loss) (272) (3,411)
Total comprehensive income (loss) ¥ (11,726) (248)
Yen (Millions)
15

Advantest Corporation (FY2010)
(4) Consolidated Statements of Stockholders’ Equity (Unaudited)
Year ended Year ended March 31, 2010 March 31, 2011
Common stockBalance at beginning of year ¥ 32,363 32,363Changes in the year
Total changes in the year — — Balance at end of year 32,363 32,363
Capital surplusBalance at beginning of year 40,320 40,463Changes in the year
143 165Total changes in the year 143 165
Balance at end of year 40,463 40,628Retained earnings
Balance at beginning of year 194,848 181,606Changes in the year
Net income (loss) (11,454) 3,163Cash dividends (1,787) (1,760)Sale of treasury stock (1) (0)Total changes in the year (13,242) 1,403
Balance at end of year 181,606 183,009Accumulated other comprehensive income (loss)
Balance at beginning of year (14,587) (14,859)Changes in the year
Other comprehensive income (loss), net of tax (272) (3,411)Total changes in the year (272) (3,411)
Balance at end of year (14,859) (18,270)Treasury stock
Balance at beginning of year (89,328) (89,331)Changes in the year
(4) (10,267)Sale of treasury stock 1 0Total changes in the year (3) (10,267)
Balance at end of year (89,331) (99,598)Total stockholders' equity
Balance at beginning of year 163,616 150,242Changes in the year
Net income (loss) (11,454) 3,163Other comprehensive income (loss), net of tax (272) (3,411)Cash dividends (1,787) (1,760)
143 165(4) (10,267)
Sale of treasury stock 0 0Total changes in the year (13,374) (12,110)
Balance at end of year ¥ 150,242 138,132
Stock option compensation expensePurchases of treasury stock
Yen (Millions)
Stock option compensation expense
Purchases of treasury stock
16

Advantest Corporation (FY2010)
(5)Consolidated Statement of Cash Flows (Unaudited)
Year ended Year ended March 31, 2010 March 31, 2011
Cash flows from operating activities:Net income (loss) ¥ (11,454) 3,163Adjustments to reconcile net income (loss) to net cashprovided by (used in) operating activities:
Depreciation and amortization 4,314 4,209Deferred income taxes (148) 425Stock option compensation expense 143 165Impairment losses on investment securities 316 512Changes in assets and liabilities:
Trade receivables (5,457) (7,645)Inventories (6,942) (7,285)Trade accounts payable 6,525 1,146Other accounts payable (5,534) (393)Accrued expenses (1,126) 2,540Accrued warranty expenses (8) (1,040)Customer prepayments 24 1,276Accrued pension and severance costs 1,386 225
Other 215 2,009Net cash used in operating activities (17,746) (693)
Cash flows from investing activities:(Increase) decrease in short-term investments 13,881 (2,446)Purchase of available-for-sale securities (389) - Proceeds from sale of property, plant and equipment 287 12Purchases of property, plant and equipment (2,798) (3,138)Purchases of intangible assets (215) (323)Other 58 67
Net cash provided by (used in) investing activities 10,824 (5,828)
Cash flows from financing activities:Purchases of treasury stock (4) (10,268)Dividends paid (1,796) (1,760)Other (3) 0
Net cash used in financing activities (1,803) (12,028)Net effect of exchange rate changes on cash and cash equivalents (291) (2,567)Net change in cash and cash equivalents (9,016) (21,116)Cash and cash equivalents at beginning of year 105,455 96,439Cash and cash equivalents at end of year ¥ 96,439 75,323
(6) Notes on Preconditions to Going Concerns: None
Yen (Millions)
17

Advantest Corporation (FY2010)
(7) Notes to the Consolidated Financial Statements (Note 1) Accounting Principles, Procedures and the Presentation of the Consolidated Financial Statements (a) Terminology, Form and Method of Preparation of the Consolidated Financial Statements
Advantest Corporation (or the “Company”) and its consolidated subsidiaries (collectively “Advantest”) prepare the consolidated financial statements in accordance with generally accepted accounting principle in the United States of America (“U.S. GAAP”). U.S. GAAP is codified in the Financial Accounting Standards Board (“FASB”) Accounting Standards Codification (“ASC”), which is the source of authoritative accounting principles recognized by the FASB to be applied by nongovernmental entities. Advantest Corporation and its consolidated subsidiaries prepare their unconsolidated financial statements in accordance with accounting principles generally accepted in the country of their domicile. Certain adjustments and reclassifications have been incorporated in the accompanying non-consolidated financial statements to present them in conformity with U.S.GAAP. (b) Preparation of Consolidated Financial Statements and Registration with the U.S. Securities and Exchange Commission
Advantest Corporation became listed on the New York Stock Exchange on September 17, 2001 (local time) by means of an issuance of American Depository Shares, and has been filing a Form 20-F (equivalent to the Annual Securities Report in Japan) with the U.S. Securities and Exchange Commission since FY2001. Advantest prepares the consolidated financial statements in its Form 20-F in accordance with U.S. GAAP. (c) Scope of Consolidation and Application of the Equity Method
Advantest’s consolidated financial statements include financial statements of Advantest Corporation and its subsidiaries, all of which are wholly-owned. Advantest is not involved with any significant variable interest entities where Advantest is the primary beneficiary, and which require consolidation in accordance with U.S. GAAP. All significant intercompany balances and transactions have been eliminated in consolidation.
The following table sets forth the number of consolidated subsidiaries and equity method affiliates
of Advantest:
FY 2009 FY 2010
(As of March 31, 2010) (As of March 31, 2011) Increase
(decrease) Domestic 14 11 (3) Overseas 16 16 -
Consolidated subsidiaries 30 27 (3)Equity method affiliates 1 1 -
Total 31 28 (3) Changes in the scope of consolidation: Excluded 3 Material changes in subsidiaries: Excluded 1 (Company name: Advantest Manufacturing, Inc. *)
* Advantest Manufacturing, Inc. was merged with Advantest Corporation on July 1, 2010. (Note 2) Reclassifications
Certain reclassifications have been made to the prior years’ consolidated financial statements to conform with the presentation used for the year ended March 31, 2011.
18

Advantest Corporation (FY2010) (Note 3) Segment Information 1. Business Segment Information
Yen (Millions)
Year ended March 31, 2010
Semiconductorand
Component Test System
Business
MechatronicsSystem
Business
Services, Support and
Others
Elimination and
Corporate Total
Net sales to unaffiliated customers ¥ 30,168 11,219 11,838 - 53,225 Inter-segment sales 2,404 18 - (2,422) -
Net sales 32,572 11,237 11,838 (2,422) 53,225Depreciation and amortization 1,364 470 1,977 503 4,314Operating income (loss) before stock option compensation expense
(7,042) (1,897) 2,175 (4,732) (11,496)
Adjustment:
Stock option compensation expense 143Operating income (loss) ¥ (11,639)Expenditures for additions to long-lived assets
942 396 1,856 231 3,425
Total assets 38,782 10,478 11,474 127,929 188,663
Yen (Millions)
Year ended March 31, 2011
Semiconductorand
Component Test System
Business
MechatronicsSystem
Business
Services, Support and
Others
Elimination and
Corporate Total
Net sales to unaffiliated customers ¥ 67,070 18,398 14,166 - 99,634 Inter-segment sales 2,263 117 - (2,380) -
Net sales 69,333 18,515 14,166 (2,380) 99,634Depreciation and amortization 1,417 533 1,755 504 4,209Operating income (loss) before stock option compensation expense
9,857 (251) 2,133 (5,463) 6,276
Adjustment:
Stock option compensation expense 165Operating income (loss) ¥ 6,111Expenditures for additions to long-lived assets
1,350 374 1,733 336 3,793
Total assets 53,570 11,780 9,226 105,736 180,312 (Notes) 1. Adjustments to operating income (loss) in Corporate principally represent corporate general and administrative
expenses and research and development expenses related to fundamental research activities that are not allocated to operating segments.
2. Advantest uses the operating income (loss) before stock option compensation expense for management's analysis of business segment results.
3. Additions to long-lived assets included in Corporate consist of purchases of software and fixed assets for general corporate use.
4. Total assets included in Corporate consist of cash and cash equivalents, assets for general corporate use and assets used for fundamental research activities, which are not allocated to reportable segments.
19
Advantest Corporation (FY2010)
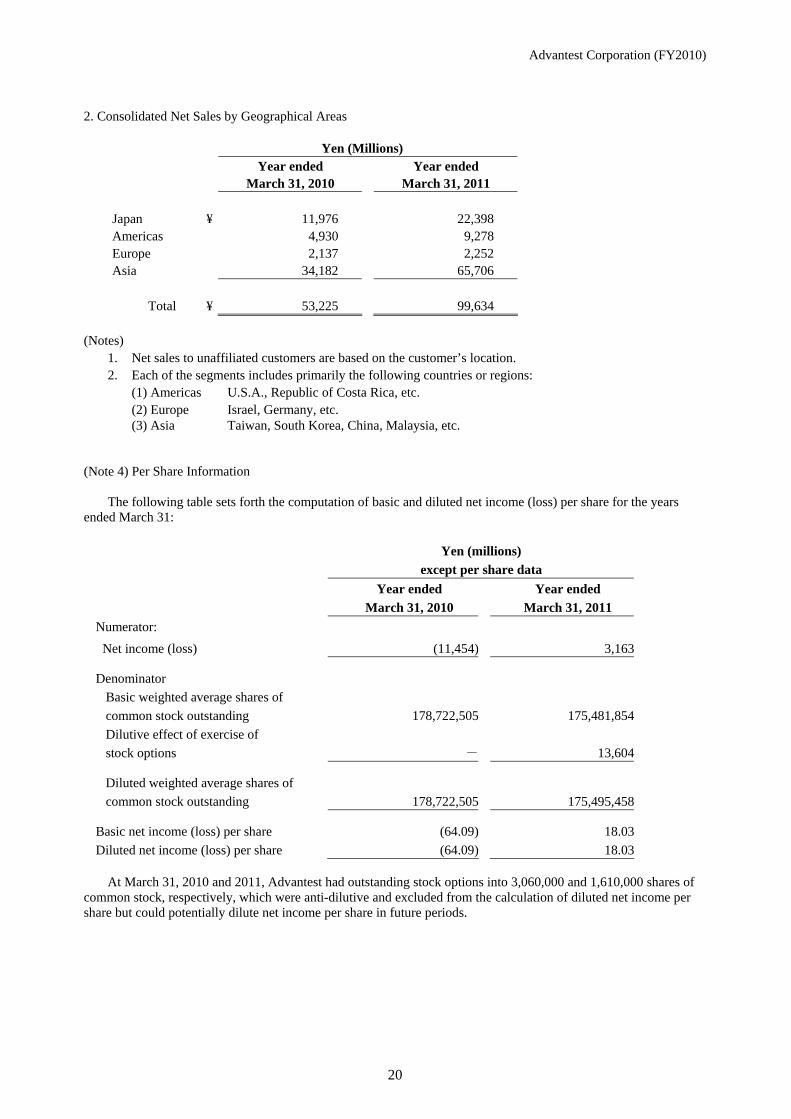
2. Consolidated Net Sales by Geographical Areas
Yen (Millions) Year ended
March 31, 2010 Year ended
March 31, 2011
Japan ¥ 11,976 22,398 Americas 4,930 9,278 Europe 2,137 2,252 Asia 34,182 65,706 Total ¥ 53,225 99,634
(Notes)
1. Net sales to unaffiliated customers are based on the customer’s location. 2. Each of the segments includes primarily the following countries or regions:
(1) Americas U.S.A., Republic of Costa Rica, etc. (2) Europe Israel, Germany, etc. (3) Asia Taiwan, South Korea, China, Malaysia, etc.
(Note 4) Per Share Information
The following table sets forth the computation of basic and diluted net income (loss) per share for the years ended March 31:
Yen (millions)
except per share data
Year ended
March 31, 2010 Year ended
March 31, 2011 Numerator: Net income (loss) (11,454) 3,163
Denominator Basic weighted average shares of common stock outstanding 178,722,505 175,481,854 Dilutive effect of exercise of stock options - 13,604
Diluted weighted average shares of common stock outstanding 178,722,505 175,495,458
Basic net income (loss) per share (64.09) 18.03Diluted net income (loss) per share (64.09) 18.03
At March 31, 2010 and 2011, Advantest had outstanding stock options into 3,060,000 and 1,610,000 shares of
common stock, respectively, which were anti-dilutive and excluded from the calculation of diluted net income per share but could potentially dilute net income per share in future periods.
20

(All non-consolidated financial information has been prepared in accordancewith accounting principles generally accepted in Japan.)
Advantest Corporation (FY2010)
5. Non-Consolidated Financial Statements
(1) Non-Consolidated Balance Sheets (Unaudited)
March 31, 2010 March 31, 2011Assets
Current assetsCash and deposits ¥ 52,542 43,553Trade notes receivables 414 452Accounts receivable 15,901 21,051Short-term investments 16,900 12,000Merchandises and finished goods 3,993 3,094Work in process 6,910 11,891Raw materials and supplies 2,104 4,872Short-term loans receivable 2,192 1,999Other receivable 939 472Refundable income taxes 66 104Other 613 312Allowance for doubtful accounts (50) (50)Total current assets 102,524 99,750
Noncurrent assetsProperty, plant and equipment
Buildings 43,609 43,792Accumulated depreciation (32,946) (34,056)Buildings, net 10,663 9,736
Structures 3,894 3,923Accumulated depreciation (3,376) (3,454)Structures, net 518 469
Machinery and equipment 18,319 18,834Accumulated depreciation (17,382) (17,788)Machinery and equipment, net 937 1,046
Vehicles and delivery equipment 45 75Accumulated depreciation (28) (58)Vehicles and delivery equipment, net 17 17
Tools and furniture 11,021 11,959Accumulated depreciation (10,461) (11,078)Tools and furniture, net 560 881
Land 15,852 15,852Construction in progress 6 16Total property, plant and equipment ¥ 28,553 28,017
Yen (Millions)
21

(All non-consolidated financial information has been prepared in accordancewith accounting principles generally accepted in Japan.)
Advantest Corporation (FY2010)
March 31, 2010 March 31, 2011Intangible fixed assets
Patent rights ¥ 25 — Leasehold rights 173 173Telephone rights 40 46Utility rights 8 7Software 344 449Other 5 36Total intangible fixed assets 595 711
Investments and other assetsInvestment securities 7,656 7,039Investment in affiliated companies 16,980 14,807Long-term loans receivable 11 6Long-term loans to affiliated companies 250 250Long-term prepaid expenses 215 126Other 855 808Total investments and other assets 25,967 23,036
Total noncurrent assets 55,115 51,764Total assets 157,639 151,514
LiabilitiesCurrent liabilities
Trade accounts payable 11,067 11,389Other accounts payable 572 401Accrued expenses 3,616 5,677Income tax payable 1 7Customer prepayments 34 14Deposits received 4,004 582Accrued warranty expenses 2,727 1,738Bonus accrual for directors — 117Other 79 76Total current liabilities 22,100 20,001
Noncurrent liabilitiesAllowance for retirement benefits 5,520 6,521Deferred tax liabilities 587 528Asset retirement obligations — 60Other 785 649Total noncurrent liabilities 6,892 7,758
Total liabilities ¥ 28,992 27,759
Yen (Millions)
22

(All non-consolidated financial information has been prepared in accordancewith accounting principles generally accepted in Japan.)
Advantest Corporation (FY2010)
March 31, 2010 March 31, 2011Net assets
Stockholders' equityCommon stock ¥ 32,363 32,363Capital surplus
Capital reserve 32,973 32,973Total capital surplus 32,973 32,973
Retained earningsLegal reserve 3,083 3,083Other retained earnings
Reserve for losses in foreign investments 27,062 27,062General reserve 146,880 146,880Retained earnings (accumulated loss) (28,398) (21,053)
Total retained earnings 148,627 155,972Treasury stock (89,331) (99,598)Total stockholders' equity 124,632 121,710
Difference of appreciation and conversionNet unrealized gains on securities 862 779Total difference of appreciation and conversion 862 779
Stock acquisition rights 3,153 1,266Total net assets 128,647 123,755
Total liabilities and net assets ¥ 157,639 151,514
Yen (Millions)
23

(All non-consolidated financial information has been prepared in accordancewith accounting principles generally accepted in Japan.)
Advantest Corporation (FY2010)
(2) Non-Consolidated Statements of Operations (Unaudited)
Year ended Year ended March 31, 2010 March 31, 2011
Net sales ¥Net product sales 41,907 84,792
Cost of salesFinished goods at beginning of year 2,763 3,993Cost of manufactured goods 26,443 47,692Total 29,206 51,685Transfers to other accounts 252 890Finished goods at end of year 3,993 3,094Balance of cost of sales 24,961 47,701
Gross profit 16,946 37,091Selling, general and administrative expenses 34,253 38,939Operating income (loss) (17,307) (1,848)Non-operating income
Interest income 290 153Dividends income 13,583 6,951Lease income 1,788 1,413Miscellaneous income 1,431 420Total non-operating income 17,092 8,937
Non-operating expensesInterest expenses 11 5Expenses for leased equipment 1,440 765Foreign exchange losses — 1,019Impairment losses on investment securities 259 473Miscellaneous expenses 459 1,084Total non-operating expenses 2,169 3,346
Ordinary income (loss) (2,384) 3,743Extraordinary income
Gain on extinguishment of tie-in shares — 3,834Gain on reversal of subscription rights to shares — 2,053Total extraordinary income — 5,887
Income (loss) before income taxes (2,384) 9,630Income taxes - current 18 30Income taxes - deferred — 495Total income taxes 18 525Net income (loss) ¥ (2,402) 9,105
Yen (Millions)
24

(All non-consolidated financial information has been prepared in accordancewith accounting principles generally accepted in Japan.)
Advantest Corporation (FY2010)
(3) Non-Consolidated Statements of Changes in Stockholders' Equity (Unaudited)
Year ended Year ended March 31, 2010 March 31, 2011
Stockholders' EquityCommon stock
Balance at beginning of year ¥ 32,363 32,363Changes in the year
Total changes in the year — — Balance at end of year 32,363 32,363
Capital surplusCapital reserve
Balance at beginning of year 32,973 32,973Changes in the year
Total changes in the year — — Balance at end of year 32,973 32,973
Retained earningsLegal reserve
Balance at beginning of year 3,083 3,083Changes in the year
Total changes in the year — — Balance at end of year 3,083 3,083
Other retained earningsReserve for losses in foreign investments
Balance at beginning of year 27,062 27,062Changes in the year
Total changes in the year — — Balance at end of year 27,062 27,062
General reserveBalance at beginning of year 146,880 146,880Changes in the year
Total changes in the year — — Balance at end of year 146,880 146,880
Retained earnings (accumulated loss)Balance at beginning of year (24,208) (28,398)Changes in the year
Dividends from retained earnings (1,787) (1,760)(2,402) 9,105
Sale of treasury stock (1) (0)Total changes in the year (4,190) 7,345
Balance at end of year ¥ (28,398) (21,053)
Net income (loss)
Yen (Millions)
25

(All non-consolidated financial information has been prepared in accordancewith accounting principles generally accepted in Japan.)
Advantest Corporation (FY2010)
Year ended Year ended March 31, 2010 March 31, 2011
Treasury stockBalance at beginning of year ¥ (89,328) (89,331)Changes in the year
(4) (10,267)Sale of treasury stock 1 0Total changes in the year (3) (10,267)
Balance at end of year (89,331) (99,598)Total stockholders' equity
Balance at beginning of year 128,825 124,632Changes in the year
Dividends from retained earnings (1,787) (1,760)(2,402) 9,105
(4) (10,267)Sale of treasury stock 0 0Total changes in the year (4,193) (2,922)
Balance at end of year 124,632 121,710Difference of appreciation and conversion
Net unrealized gains on securitiesBalance at beginning of year 120 862Changes in the year
742 (83)Total changes in the year 742 (83)
Balance at end of year 862 779Stock acquisition rights
Balance at beginning of year 3,077 3,153Changes in the year
76 (1,887)Total changes in the year 76 (1,887)
Balance at end of year 3,153 1,266Total net assets
Balance at beginning of year 132,022 128,647Changes in the year
Dividends from retained earnings (1,787) (1,760)(2,402) 9,105
(4) (10,267)Sale of treasury stock 0 0
818 (1,970)Total changes in the year (3,375) (4,892)
Balance at end of year ¥ 128,647 123,755
Net income (loss)
Changes of items other than stockholders' equity, net
Yen (Millions)
Net income (loss)
Changes of items other than stockholders' equity, net
Changes of items other than stockholders' equity, net
Purchases of treasury stock
Purchases of treasury stock
Purchases of treasury stock
26

Changes in Directors, Corporate Auditors and Executive Officers (To be effective on June 24, 2011)
1. Nominees for Directors Director Toshio Maruyama Director Haruo Matsuno Director Naoyuki Akikusa Director Yasusige Hagio Director Yuichi Kurita Director Shinichiro Kuroe Director Sae Bum Myung (to be newly elected)
Executive Officer of Advantest Corporation
Mr. Maruyama is to be elected as Chairman of the Board and Representative Director and Mr. Matsuno is to be elected as Representative Director at the special meeting of the board of directors to be held on June 24, 2011 after the 69th ordinary general meeting of shareholders of Advantest Corporation.
2. Nominees for Corporate Auditors Standing Corporate Auditor Akira Hatakeyama (to be newly elected)
Advisor of Advantest Corporation Corporate Auditor Masamichi Ogura (to be newly elected)
Standing Corporate Auditor of Fujitsu Limited 3. Nominees for Executive Officers President and CEO Haruo Matsuno Senior Executive Officer Yuichi Kurita Managing Executive Officer Shinichiro Kuroe Managing Executive Officer Sae Bum Myung (to be promoted)
Executive Officer of Advantest Corporation Managing Executive Officer Hiroshi Nakamura Managing Executive Officer Yoshiaki Yoshida Managing Executive Officer Masao Shimizu Managing Executive Officer Hideaki Imada (to be promoted)
Executive Officer of Advantest Corporation Executive Officer Yasuhiro Kawata Executive Officer Takashi Sugiura Executive Officer Takashi Sekino Executive Officer Soichi Tsukakoshi
Executive Officer Josef Schraetzenstaller Executive Officer R. Keith Lee Executive Officer Makoto Nakahara (to be newly elected)
Executive Officer Toshiyuki Okayasu (to be newly elected) 4. Resignation from Directors, Corporate Auditors and Executive Officers Hiroshi Tsukahara, Director and Managing Executive Officer --- To be elected as Advisor Hiroyasu Sawai, Director and Managing Executive Officer --- To be elected as Advisor Hitoshi Owada, Standing Corporate Auditor --- To be elected as Advisor Jiro Haneda, Corporate Auditor

Nominees for New Directors (Biography)
Sae Bum Myung (Date of Birth: September 16, 1954) Mar. 1989 Master’s Degree from Graduate school of engineering, Meiji University Apr. 1989 Joined Advantest Corporation Apr. 2004 Manager, International Sales Department 3, Sales and Marketing Group Jun. 2006 Representative Director and President, Advantest Korea Co., Ltd. (present position) Jun. 2008 Executive Officer (present position)
Nominee for New Corporate Auditors (Biography)
Akira Hatakeyama (Date of Birth: June 28, 1950) Mar. 1973 Graduated from School of engineering, Nagoya University Apr. 1973 Joined Advantest Corporation Apr. 2001 Representative Director and President, Japan Engineering Co,. Ltd. Jun. 2005 Executive Officer Jun. 2008 Advisor (present position)
Masamichi Ogura (Date of Birth: June 30, 1946)
Mar. 1969 Graduated from School of commerce I, Waseda University Apr. 1969 Joined Fujitsu Limited Jun. 2000 Director, Fujitsu Limited Jun. 2002 Corporate Senior Vice President, Fujitsu Limited Apr. 2003 Corporate Executive Vice President, Fujitsu Limited Jun. 2003 Director, Corporate Executive Vice President, Fujitsu Limited Jun. 2006 Representative Director, Corporate Senior Executive Vice President, Fujitsu Limited Jun. 2008 Standing Corporate Auditor, Fujitsu Limited (present position)
Nominees for New Executive Officers (Biography)
Makoto Nakahara (Date of Birth: July 23, 1959) Mar. 1983 Graduated from Faculty of economics, Kanagawa University Apr. 1983 Joined Advantest Corporation Jan. 2010 General Manager, Global Marketing Division, Sales and Marketing Group (present position)
Toshiyuki Okayasu (Date of Birth: June 2, 1962)
Mar. 1987 Master’s Degree from Graduate school of engineering, Saitama University Apr. 1987 Joined Advantest Corporation Jun. 2009 Vice President, Technology Development Group (present position)