fy17 & 4q17 results -...
TRANSCRIPT

FY17 & 4Q17 results
Opportunity Day28th February 2018

2

3
DISCLAIMER
The information contained in this presentation is intended solely for your reference.
This presentation contains “forward-looking” statements that relate to future events, which are, by their nature, subject to significant risks and uncertainties. All statements, other than statements of historical fact contained in this presentation including, without limitation, those regarding Banpu’s future financial position and results of operations, strategy, plans, objectives, goals and targets, future developments in the markets where Banpuparticipates or is seeking to participate and any statements preceded by, followed by or that include the words “believe”, “expect”, “aim”, “intend”, “will”, “may”, “project”, “estimate”, “anticipate”, “predict”, “seek”, “should” or similar words or expressions, are forward-looking statements.
The future events referred to in these forward-looking statements involve known and unknown risks, uncertainties and other factors, some of which are beyond our control, which may cause the actual results, performance or achievements, or industry results to be materially different from any future results, performance or achievements expressed or implied by the forward-looking statements.
These forward-looking statements are based on numerous assumptions regarding our present and future business strategies and the environment in which Banpu will operate in the future and are not a guarantee of future performance. Such forward-looking statements speak only as of the date on which they are made. Banpu does not undertake any obligation to update or revise any of them, whether as a result of new information, future events or otherwise. The information set out herein is subject to change without notice, its accuracy is not guaranteed, has not been independently verified and it may not contain all material information concerning the Company.
Banpu makes no representation, warranty or prediction that the results anticipated by such forward-looking statements will be achieved, and such forward-looking statements represent, in each case, only one if many possible scenarios and should not be viewed as the most likely or standard scenario. No assurance given that future events will occur or our assumptions are correct. Actual results may materially differ from those provided in the forward-looking statements and indications of past performance are not indications of future performance. In no event shall Banpu be responsible or liable for the correctness of any such material or for any damage or lost opportunities resulting from use of this material. Banpu makes no representation whatsoever about the opinion or statements of any analyst or other third party. Banpu does not monitor or control the content of third party opinions or statements and does not endorse or accept any responsibility for the content or use of any such opinion or statement.
Banpu’s securities have not been and will not be registered under the U.S. Securities Act of 1933, as amended, or the securities laws of any state of the United States, and may not be offered or sold within the United States, except pursuant to an exemption from, or in a transaction not subject to, the registration requirements of such act or such laws.
This presentation does not constitute an offer to sell or a solicitation of an offer to buy or sell Banpu’s securities in any jurisdiction.

4
3.2 Australia operations
Coal business
The Banpu difference
3
1
3.3 Indonesia operations
3.4 China, Mongolia operations
Gas business5
Financial summary6
Power business
3.1 Coal market
4
2018 and beyond7
Highlights 20172
2.2 Coal business
2.3 Power business
2.4 Gas & Infinergy business
2.1 Summary

5
GLOBAL
REACH
BALANCED
SUSTAINABILITY
VALUE-CREATING
INNOVATION
1 2 3
Banpu is unique amongst major SET-listed energy companies in offering investors a combination of:
The Banpu difference
Positioned to take advantage of the best growth projects and deals across Asia and beyond
Three decades of value-creating international experience
Over 80% Ebitda from international operations
Reliable, affordable and eco-friendly energy supply
Combination of core cashflowstability, upside potential and LT growth
Synergistic hybrid strategy bridging conventional and unconventional
Demonstrated trackrecord in learning new skills and technologies fast
Focus on building on innovation and new technologies to create value
Banpu people: aptitude, adaptability and versatility

6
Thailand
3%
Other
SEA
8%
China
22%
India
28%
Other
Asia-Pac
& ME
18%
Americas
9%
ROW
12%
Global reach: world energy growth analysis
3,824 17,584
2016 2040
13,760
Growth
2040 breakdownGrowth 2016-2040
Note: * based on the New Policies scenario which incorporates broad commitments and plans announced by countries to limit global temperature increase to 4°CSource: World Energy Outlook 2017 , IEA, Thailand Power Development Plan 2015-2036 (PDP2015)
Thailand
1% Other SEA
5%
China
22%
India
11%Other
Asia-Pac
& ME
15%
Americas
22%
ROW
24%
Unit: Mtoe
Note: ME = Middle East, ROW = Rest of the world
WORLD PRIMARY ENERGY DEMAND BY REGION*

7Source: AWR Lloyd
Note: *Market cap above THB 10 bn, ** In 2016 89% and in 2017, 96%
0 – 20% 21 – 40% 41 – 60% 61 – 80% > 80%
% 2016 EBITDA FROM INTERNATIONAL OPERATIONS OF MAJOR SET-LISTED ENERGY COMPANIES*
Over 80% of Banpuconsolidated Ebitdacomes from operations outside Thailand**
PO
WER
-ON
LY
CO
MPA
NIE
SEN
ER
GY
CO
MPA
NIE
S
Indonesia
48%
Australia
24%
China
10%
Laos
11%
USA
3%
Thailand
4%
Global reach: Banpu vs other SET energy
BANPU

8
INDONESIA
Indocoal 2001
IPO of ITM 2007
Global reach: 3 decades of international experience
1990s 2000s 2010s
Coal interests in Indonesia and Australia developed from early 1990s
Industrial minerals business established in Vietnam from 1995
THAILAND
First coal mine 19851
VIETNAM
Industrial minerals 19953
AUSTRALIA
Stake in Oakbridge 19912
INDONESIA
Jorong concession
development 1996
4
Big step in Indonesia from 2001 with acquisition and development of Indocoal assets which became ITM
First step in China coal business from 2003
Laos project from 2006
Exited Australia, Vietnam
Big step into Australia with Centennial acquisition in 2010
First step into US with gas investments from 2016
First steps also into Japan Solar (2015), Singapore and Mongolia
CHINA
AACI acquisition 2003, 2008
Hebi ZT JV 2005
CHP power business acquisition 2006
5
LAOS
Hongsa agreement 20066
MONGOLIA
Hunnu 20117
JAPAN
Solar investment 20158
SINGAPORE
Trading office 20169
AUSTRALIA (II)
Centennial 20102
USA
Gas investment 201610

9
‘West’ ‘East’
6%
48%
16%
27%
3%
Western know-how and technology
Western standards of best practice governance and IR
Pro-active culture of accountability and initiative
Unique diversity: strength and unity
Banpu people are ‘Global’ and ‘Local’
With extensive international network of friendships, new market entry is easier for Banpu
Asian roots
Focus on long term: patience, hard work
Emphasis: integrity, trust, duty, loyalty
5,785 EMPLOYEES BY NATIONALITY (%)
Global reach: West - East fusion culture
Thailand
Indonesia
Australia
China
Others

10
Balanced sustainability: world energy growth
27%
14%
5%
32%22%
27%
24%
22%19%
6%
13.8 Btoe 17.6 Btoe
Coal demand will grow in absolute terms and remain a core baseload energy
Gas and renewables represent the two largest growth segments
Banpu well positioned for stability and growth
Renewables1.9 Btoe
Nuclear0.7 Btoe
Oil4.4 Btoe Gas
3.0 Btoe
Coal3.8 Btoe
2016 2040
WORLD PRIMARY ENERGY DEMAND BY FUEL*
Note: * based on the New Policies scenario which incorporates broad commitments and plans announced by countries to limit global temperature increase to 4°CSource: World Energy Outlook 2017 , IEA, Thailand Power Development Plan 2015-2036 (PDP2015)
Renewables3.5 Btoe
Nuclear1.0 Btoe
Oil4.8 Btoe
Gas4.4 Btoe
Coal3.9 Btoe

11
Balanced sustainability: reliable, affordable,
eco-friendly strategy
Development of lower-emissions gas portfolio:
200MMcfd
Rapidly growing renewable energybusiness: +385 MW committed solar capacity in Japan and China
Smart energy business: 97 MW committed solar rooftop capacity in SEA and India
SUSTAINABLE
Experienced Coal M&L team with
extensive marketing network throughout
Asia-PacificDiverse equity coal specs, blending capabilities and 3rd party traded coal to meet all customer needs
Developing new synergistic supply chainbusinesses in fuels, gas and bio-energy
Focus on cost rationalization and control at all mines and power operations
Coal mining and HELE coal-fired power still have cost advantage vs RE and LNG
Coal and CFP remain core engine
of energy supply and cashflow at Banpu

12
Balanced sustainability: stability vs growth
Stability Upside potential
LT
GR
OW
TH
CASH FLOW
Mediu
m
Export
coal
Domestic
coal
Conventional
power Gas
Renewables
Infinergy ESCM
Hig
h
Banpu is bridging the old and new in the energy sector
Banpu is leading transition to greater energy sustainability in a responsible way*
With a hybrid mix of conventional and unconventional energy, Banpu is developing both horizontal and vertical energy supply chain synergies
Balanced portfolio offers both cash flow stability and upside potential
* “If there was a button I could press to stop all hydrocarbon usage today, I would not press it. It would be irresponsible to press that button.”
Elon MuskFounder of Tesla, SolarCity and SpaceX

13
Value-creating innovation: proven track record
Banpu has a proven 35 year track record in learning new skills and technologies fast
Banpu is focused on investing in new technologies that lead to meaningful value-creation
Banpu people have demonstrated their versatility, adaptability* and aptitude
1990s
Power project developmentSince 2010
Underground mining
Since 2015
Solar PV development
Examples
* “It is not the strongest of the species that survives, nor the most intelligent that survives. It is the one that is the most adaptable to change”
Charles Darwin
Since 2016
Gathering and Compression

14
3.2 Australia operations
Coal business
The Banpu difference
3
1
3.3 Indonesia operations
3.4 China, Mongolia operations
Gas business5
Financial summary6
Power business
3.1 Coal market
4
2018 and beyond7
Highlights 20172
2.2 Coal business
2.3 Power business
2.4 Gas & Infinergy business
2.1 Summary

15
* Equity basis2017 highlights
COAL
GAS
SMART ENERGY
ESCM
POWER
+180 MMcfd gas production
Banpu now amongst top 20 gas producers in Pennsylvania
First operator position
1,074 Bcf 1P reserves up 7x
Coal price NEX +18% YoY 41.3 Mt coal sales Coal Ebitda $790M +109% YoY Group coal reserves +71 Mt, to 751 Mt
Hongsa EAF >80% BLCP reached 10th
year of operation +46 MWe*
Zouping expansion
New fuel procurement and marketing business in Indonesia
Established “Banpu Infinergy” 26% stake in leading rooftop player in Singapore 97 MW* solar rooftop in Southeast Asia and India
+6 MW* Awaji in operation
+82 MW* China Solar in operation
+130 MW* Japan Solar new projects secured
Note: *Based on equity basis
16
2a1a
2bNORTH ASIA
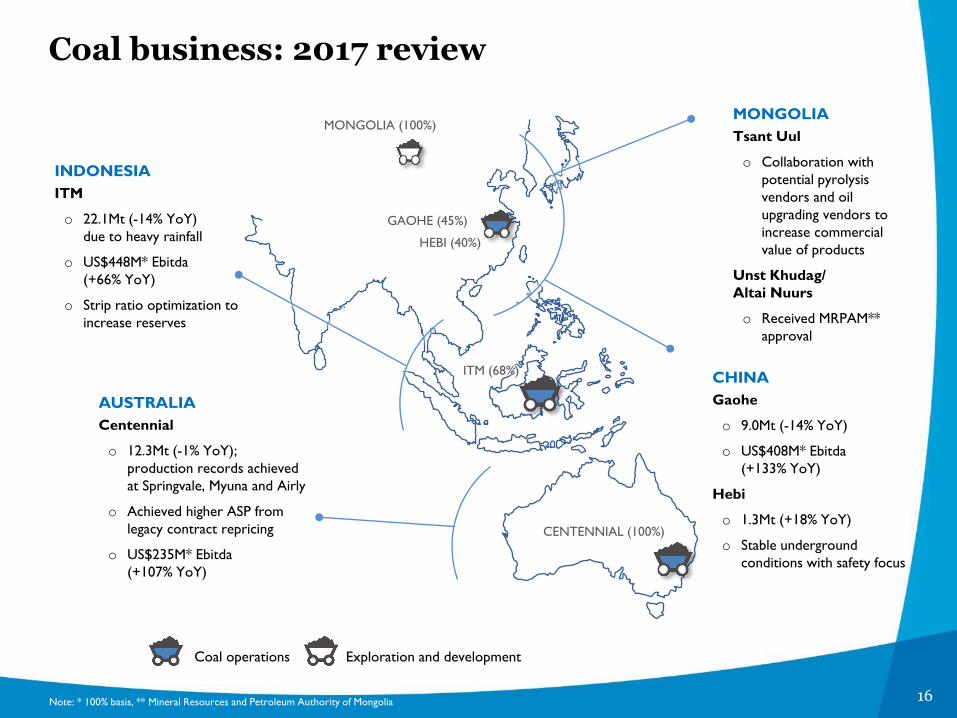
Coal business: 2017 review
ITM (68%)
CENTENNIAL (100%)
Note: * 100% basis, ** Mineral Resources and Petroleum Authority of Mongolia
Coal operations Exploration and development
MONGOLIA (100%)
GAOHE (45%)
HEBI (40%)
INDONESIA
ITM
o 22.1Mt (-14% YoY)
due to heavy rainfall
o US$448M* Ebitda
(+66% YoY)
o Strip ratio optimization to
increase reserves
AUSTRALIA
Centennial
o 12.3Mt (-1% YoY);
production records achieved
at Springvale, Myuna and Airly
o Achieved higher ASP from
legacy contract repricing
o US$235M* Ebitda
(+107% YoY)
MONGOLIA
Tsant Uul
o Collaboration with
potential pyrolysis
vendors and oil
upgrading vendors to
increase commercial
value of products
Unst Khudag/
Altai Nuurs
o Received MRPAM**
approval
CHINA
Gaohe
o 9.0Mt (-14% YoY)
o US$408M* Ebitda
(+133% YoY)
Hebi
o 1.3Mt (+18% YoY)
o Stable underground
conditions with safety focus

17
Power business: 2017 review
Note: *Equity basis
JAPAN
Japan Solar
o Awaji 6 MWAC*
commenced operation
o Secured 130 MWAC*
additional projects
o Total committed capacity of
233.3 MWAC* of which
12.6 MWAC* in operation
CHINA
CHP
o Capacity expansion to
435 MWe*, +46 MWe*
from 2016
o Total revenue increased to
RMB 1,144 M, +12% YoY
from additional Solar
business and higher demand
Shanxi Lu Guang
o Expected COD 2019-2020
China Solar
o Capacity +81.6 MWDC*
to total 152.1 MWDC*,
all in operation
o RMB 97M EBITDA,
+593% YoY from projects
in operation
THAILAND
BLCP
o EAF for 2017 reported
at 88%, with 98%
dispatch factor
o Completed
10 weeks major
maintenance
in 4Q17
o THB 6.6 bn EBITDA,
-17% YoY
LAOS
Hongsa
o Significant operational
improvement
o THB 13.1 bn EBITDA,+43% YoY
Capacity based on 100% basis
2a1a
2b
NORTH ASIA
THAILAND1,434 MW (50%)
LAOS1,878 MW (40%)
JAPAN
233 MWAC
(40-100%) operating and
committed capacityCHINA
CHP: 435 MWe (70 -100% equity)
SLG: 1,320 MW (30%)
Solar: 152 MW (100%)
operating and committed capacity
Coal fired development
Coal-fired operational Solar operational
Solar development

18
Gas and Infinergy businesses: 2017 review
Note: * based on equity basis via Sunseap shareholding
Capacity based on equtiy basis
2a1a
2bNORTH ASIA
THAILAND12MW
OTHER SEA78MW
USA
Marcellus
o +180 MMcfd gas
production to 201
MMcfd through 5 gas
acquisitions within
one year
o Acquired at lower
acquisition prices
compared to average
leading US peers
o US$25 M Ebitda, +255% YoY
Thailand Solar rooftop
o Installed 12MW solar
rooftop for both residential
and commercial customers
o Partnership with Rugby
School Thailand to promote
'Smart Campus’
Other SEA and India Solar
rooftop
o Secured total of 85MW*
solar rooftop through
25.7% ownership in Sunseap
o 78MW* in Southeast Asia
includes Singapore,
Vietnam, Philippines,
Malaysia, Cambodia, and
7MW* in India
INDIA7MW
Gas operational Solar rooftop operational
MARCELLUS 1,074 Bcf
SOUTHEAST ASIA & INDIA
19
3.2 Australia operations
Coal business
The Banpu difference
3
1
3.3 Indonesia operations
3.4 China, Mongolia operations
Gas business5
Financial summary6
Power business
3.1 Coal market
4
2018 and beyond7
Highlights 20172
2.2 Coal business
2.3 Power business
2.4 Gas & Infinergy business
2.1 Summary

20
GEOGRAPHY CHANGE
2017-16 (Mt.)COMMENTS
OTHERS
CHINA
EUROPE
OTHER
N.ASIA
INDIA
Note: Includes lignite but excludes anthracite
Global demand trends: 2017 vs 2016
GLOBAL
Cold weather and low hydro supported coal burn
Delays in restarting nuclear reactors and full review of French nuclear
regulator increased coal generation
Turkey commenced 2x660 MW coal-fired power plants in 4Q2017
Malaysia, Philippines, Vietnam and Pakistan are the main drivers which expected
to add 9 Mt of demand growth
Mexico drives growth in Americas
Strong imported coal demand due to cold weather, nuclear outages, growing
economy and continued Chinese domestic supply tightness. High oil prices and
US dollar weakness also impacts spot prices. Strong demand is expected to
continue into 1Q2018 as cold weather remains.
Strong winter demand in North Asia
10 nuclear reactors in South Korea are shutdown during winter for safety checks
Most of nuclear reactors in Japan remain shutdown
+1
0
+8
+22
-8
+1
7
+4
9
Strong winter demand and gas shortages boosted coal consumptions
Tighter supply drives coal prices rally
Temporary lifted coal import ban support imports
Decline in hydro and nuclear power generation supported coal demand
Domestic supply problems persist leading non-power consumers to use
imported coal
Pet coke ban increased import demand

21
Substantial growth despite heavy rainfall almost the whole year
Slower domestic demand growth supported export
S.AFRICA
INDONESIA
RUSSIA
COLOMBIA
Strikes continued tighten supply in 4Q2017
Bad weather and rail maintenance is expected to hamper coal
shipments in 1Q2018
AUSTRALIA
High exports in 4Q2017 despite bad weather disrupted loading activity
Shareholders pushed RBCT to increase exports in in the fourth quarter
to avoid take-or-pay rail charges in 2017
Suppliers lifted exports to capture more favourable prices in
international market
Weaker US dollar helped to support the price of coal export
GLOBAL
+21
0
-5
+16
+7
+21
-3
+57
USA
OTHERS
Torrential rain curbed production and exports
Freezing conditions cause transport delays and impact port loadings.
Strong margins continued support coal exports
Bad weather continued to curtail supply in Asia and opened opportunity
for supply from US and Colombia. Chinese production recovered slowly
while heavy snow continued delay coal transport. Supply tightness
expected to continue into 1Q2018
GEOGRAPHY CHANGE
2017-16 (Mt.)COMMENTS
Global supply trends: 2017 vs 2016
Exports from Philippines and Poland are declined

22Note: * includes lignite but excludes anthracite imports/exports
Source: www.sxcoal.com/cn 6 February 2018
CHINA THERMAL COAL IMPORTS/EXPORTS*
Unit: Mt Stable economic growth, cold temperature
and gas shortages pushed up thermal coal demand
Domestic supply recovered slowly due to ongoing safety inspection
Railway bottlenecks due to snow delayed coal transport in the north
Domestic thermal coal prices rose significantly pass RMB700/t at end of 2017
Government intervened in markets aiming to stabilize coal prices
– Asked coal producers and end users to sign long-term contracts for 2018 with higher contract volume aiming to reduce the size of spot market to curtail the impact of high spot prices on industries
– Lifted coal import ban late December 2017 to 15 February 2018 for electricity generation to increase supply to match stronger demand.
– Relaxed production controls and urged producers to release new supply
Supply tightness is likely to continue into 1Q2018
China: demand up, supply constrained, drives prices
QUARTERLY (ANNUALIZED) ANNUAL
IMPO
RT
EX
PO
RT
132 139 122 123153
194 210172 189 196 189
2
4Q15
3 5
1Q16 2Q16
6
3Q16
0 2
133
3Q14
51
3Q152Q151Q15
1
4Q14
131170 187
2016e
4
2014
1
2015
4
2015 2016 20171Q15 2Q15 3Q15 4Q15 1Q16 2Q16 3Q16 4Q16 1Q17 2Q17 3Q17 4Q17
23
Sources: Banpu MS&L
200
300
400
500
600
700
800
2014 2015 2016 2017
> 5,800 kcal/kg
> 5,500 kcal/kg
> 5,000 kcal/kg
790
764688
CHINA DOMESTIC COAL PRICES
Unit: RMB/t
3

23Note: * includes lignite grade imports
Sources:: Commodity Insights, Banpu MS&L
INDIA THERMAL COAL IMPORTS*
Unit: Mt
India: domestic supply issues driving coal imports
QUARTERLY (ANNUALIZED) ANNUAL
171 180
142
161 149
171
128 131 122
151
123
149
2Q161Q16 2Q173Q16 4Q16 4Q171Q174Q153Q151Q15 2Q15
164
145 137
2017201620153Q17
Coal shortages restricted operations of 12 GW coal-fired capacity in 4Q2017
A steep decline in power plant stocks forced utilities to reduce generation, leading to unscheduled power cuts affecting different parts of the country
Coal India Ltd (CIL) prioritized supply to grid-connected power plants, less volume was available for sales in spot market
– Captive power plants and other consumers experienced tighter supply, led to higher reliance on imported coal
With stricter environmental regulation on petroleum coke use and higher import tariffs, US thermal coal imports were increased over the past few months
Government allows mines to expand up to 40% of its capacity without conducting a public hearing in order to ramp up supply
CIL announces ~10 % price increase for all grades of domestic thermal coal to offset the impact of a higher wage bill

24Note: * excluding Mongolia coal
Banpu group coal sales 2017
THAILAND
HK
CHINA
TAIWAN
ITALY4.7
0.1
INDIA
2.6 Mt
2.9 Mt
9.0 Mt
0.4 Mt2.7 Mt
0.3 Mt
7.1 Mt
1.7 Mt
JAPAN
5.3
INDONESIA
2.5 MtPHILIPPINES
AUSTRALIA
8.2 Mt
OTHERS0.70.6
1.3 Mt
Indonesia coal
Australia coal
China coal
Japan
17%
Korea
6%
Taiwan
7%
China
22%
Australia
20%
Other
SE Asia
11%
Thailand
7%
India
6%
Others
3%
Notes:* Sales from Indonesia are included on 100% basis, sales from Australia and
China are included on equity basis
** Illustrative target
*** Include coal sales from domestic production in China
S KOREA
41.3
Mt**
***
COAL SALES* SOURCE – DESTINATION ANALYSIS 2017
1.80.9
2.7 Mt
1.8
4.2
GLOBAL COAL SALES* 2017 BY REGION
0.91.8

25
Banpu coal sales pricing status
Fixed100%
Fixed
23.2* Mt
Fixed
43%
42%
11%4%
Fixed
26.0* Mt
2017
2018e
Indexed
Unpriced
Unsold
INDONESIA COAL
* 44% sales
contracts as Index Linked
29%
30%
39%Fixed Export
Domestic: long-term export parity
13.4* Mt
Domestic: legacy
42%
20%
14%
14%
7%3%
Unsold
Fixed Export
Domestic: long-term export parity14.1*
Mt
Domestic: legacy
2017
2018e
Unpriced
Indexed
AUSTRALIA COAL
* 6% sales
contracts as Index Linked
Note: * target sales

26
30
50
70
90
110
130
Jan-1
6Feb-1
6M
ar-1
6A
pr-
16
May
-16
Jun-1
6Ju
l-16
Aug-
16
Sep-1
6O
ct-1
6N
ov-
16
Dec-
16
Jan-1
7Feb-1
7M
ar-1
7A
pr-
17
May
-17
Jun-1
7Ju
l-17
Aug-
17
Sep-1
7O
ct-1
7N
ov-
17
Dec-
17
Jan-1
8
Note: * Included post shipment price adjustments as well as traded coal
** The Newcastle Export Index (previously known as the Barlow Jonker Index – BJI)
4Q17 ASP firmed according to supply
tightness
– ITM ASP: US$81.8/t* (+7% QoQ)
– CEY ASP: A$93.5/t* (+4% QoQ)
– NEX (Feb 15, 2018)**: US$103.5/t
Market continued strong in 4Q17 with
significant increased QoQ
Supply tightness expected to continue
into 1Q18 due to bad weather, together
with strong winter demand
Unit: US$/t; A$/t for CEY
Banpu ASPs vs thermal coal benchmark prices
BANPU ASP VS BENCHMARK PRICES COMMENTS
Monthly NEX
Quarterly
ITM ASP
Quarterly
Centennial ASP
US$81.8/t
US$108.5/t
A$93.5/t
0
50
100
150
200
2007
2008
2009
2010
2011
2012
2013
2014
2015
2016
2017
Monthly NEX

27
3.2 Australia operations
Coal business
The Banpu difference
3
1
3.3 Indonesia operations
3.4 China, Mongolia operations
Gas business5
Financial summary6
Power business
3.1 Coal market
4
2018 and beyond7
Highlights 20172
2.2 Coal business
2.3 Power business
2.4 Gas & Infinergy business
2.1 Summary

28
2017 YoY 4Q17 QoQ
Sales revenue A$1,112 M ▲28% A$331 M ▲14%
EBITDA A$287 M ▲98% A$92 M ▲11%
PBT A$117 M ▲571% A$49 M ▲24%
NPAT A$85 M ▲393% A$36 M ▲27%
Gearing(Net debt to net debt +
book value of equity)
34% (FY2016: 39%)
2017 output: 12.3 Mt Production
Equity ROM: 3.0 Mt (down 8% QoQ but up 8% YoY)
Longwall changeover at Springvale during the quarter
Mandalong back in full production mid October 2017
Production records achieved at Clarence and Airly
ASP
4Q17: ~A$92/t vs 3Q17: ~A$85/t, ASP benefitting from improved domestic and export spot prices, partly offset by higher A$/US$ exchange rate on export sales
Sales volume up 6% QoQand up 15% YoY – as result of timing of sales
Quarterly domestic: export split 62%:38% (3Q17: 61:39%) (2017: 61%:39%)
Note: NCIG = Newcastle Coal Infrastructure Group; PWCS = Port Waratah Coal
Services; PKCT = Port Kembla Coal Terminal.
2017 OUTPUT (ROM EQUITY BASIS) KEY UPDATES
FINANCIAL SUMMARY
Australia: operational and financial summary
Wollongong
PKCT
Airly
Clarence
Springvale
Mandalong Myuna
Sydney
PWCS
Newcastle
Underground mine
Port
Power station
RoadRail
WESTERN OPERATIONS:
2017: 5.1 Mt
NORTHERN OPERATIONS:
2017: 7.2 Mt
NCIG

29
MANDALONG
COAL OUTPUT (Mt)1
CV: 6,700 kcal/kg2
Mandalong: Production up 66% QoQ and 57% YoY, with an extended LW changeover completed in mid-October, following gas management issues. LW now back in full production
Myuna: Production down 18% QoQ, but up 19% YoY
– Impacted by poor geological conditions and equipment availability with respect to a hired miner, temporarily installed while awaiting the delayed delivery and introduction of a third super panel
– Third Super Panel to be introduced in 1Q18
Myuna received a prestigious mining award for the development of an innovative mining method, the ‘Myuna Herringbone System’
Note: 1 ROM output on an equity basis
2 CV figures are air-dried basis
3 Longwall
LW 3 MOVE SCHEDULE
4Q16 3Q17 4Q17 1Q18 2Q18e
Mth 1
Mth 2
Mth 3
1.0 1.0
1.6
1.0
MYUNA COMMENTS
4Q16 3Q17 4Q17 1Q18e
4Q16 3Q17 4Q17 1Q18e
3
wks
0.4 0.5 0.5 0.5
Australia: northern operations quarterly output
2
wks
3
wks
3
wks
COAL OUTPUT (Mt)1
CV: 6,700 kcal/kg2

30
SPRINGVALE
COAL OUTPUT (Mt)1
CV: 6,700 kcal/kg2
Note: 1 ROM output on an equity basis
2 CV figures are air-dried basis
3 Longwall
LW3 MOVE SCHEDULE
4Q16 3Q17 4Q17 1Q18 2Q18e
Mth 1
Mth 2
Mth 3
COAL OUTPUT (Mt)1
CV: 6,700 kcal/kg2
OTHER OPERATIONS COMMENTS
4Q16 3Q17 4Q17 1Q18e
Springvale: Output down 69% QoQ, and 64% YoY
- Delayed LW changeover , after encountering a lithology zone. Full production recommenced mid-Dec 2017
- Mine in full production during the comparison periods
Clarence: Output down 28% QoQ, but up 5% YoY
- Despite encountering an unusual fault during the quarter, a new half-yearly record was achieved
Airly: Output down 20% QoQ and 10% YoY
- New all-time half-yearly and annual production records achieved during quarter
- 2018 focus is on development in preparation for the narrow panel extraction mining, planned to commence in 2019
Australia: western operations quarterly output
4Q16 3Q17 4Q17 1Q18e
0.7 0.8
0.40.6
0.6 0.7 0.60.4
0.20.2
0.2
0.2AIRLY
CLARENCECLARENCE
6
wks
3
wks

31
Australia: operating costs
Focus remains firmly on cost control and improving productivity through automationand the Step Change Productivity initiative
Several mines experienced poor geology during 4Q17, while Myuna also experienced some equipment issues
Mandalong now operating in a higher gas regime
Springvale experienced a delayed longwall start-up, as it navigated a lithology zone.
Looking forward:
- Continue to develop automation, technology, digital and engineering opportunities
- Manage gas levels at Mandalong; progress use of gas for electricity generation to meet internal needs
- Reduce distribution costs , increasing distribution efficiency, and undertaking logistics review
- Organic production growth options
Note: 1 These figures do not include selling, distribution and royalty costs; based on ‘sold’ production2 Open-cut production ceased in FY2015
Unit: A$/t
2016 2017
3Q
AVERAGE PRODUCTION COST 1 COMMENTS
FY14 FY15 2QFY164Q3Q2Q1Q FY171Q 4Q
494950
52
5051
44
55
Stores and supplies
Coal handling
& preparation
Repair and
maintenance
General expense
Cash overhead
Depreciation
Open-cut 2
Labor
53
0
5
10
15
20
25
30
35
40
45
50
55
52 5553

32
3.2 Australia operations
Coal business
The Banpu difference
3
1
3.3 Indonesia operations
3.4 China, Mongolia operations
Gas business5
Financial summary6
Power business
3.1 Coal market
4
2018 and beyond7
Highlights 20172
2.2 Coal business
2.3 Power business
2.4 Gas & Infinergy business
2.1 Summary

33
East Kalimantan
Balikpapan
Palangkaraya
Banjarmasin
Central Kalimantan
South Kalimantan
Kitadin -Embalut0.9 Mt
Indominco13.0 Mt
Trubaindo4.9 Mt
Bharinto2.4 Mt
Jorong0.9 Mt
Jorong Port
Bontang Coal Terminal
Captive coal-
fired power
Indominco : 4Q17 output was 3.3Mt, close to target despite weather condition at Indominco
Trubaindo: 4Q17 production output was 1.5Mt, slightly lower than target due to heavy rainfall
Bharinto : 4Q17 output was 0.6Mt, close to target despite weather condition
Embalut: Achieved production output target of 0.3Mt
Jorong: Achieved production output target of 0.3MtSamarinda
Bunyut Port
PRODUCTION OUTPUT* 2017 KEY UPDATES - 4Q17 PRODUCTION AND PROGRESS
FINANCIAL SUMMARY
Note: * saleable tonnes basis
Indonesia: operational and financial summary
2017 output: 22.1 Mt
2018 target: 22.5 Mt
2017 YoY 4Q17 QoQ
Sales revenue US$1,690M ▲ 24% US$526M ▲ 27%
EBITDA US$448M ▲ 66% US$137M ▲ 12%
PBT US$362M ▲ 89% US$112M ▲ 23%
NPAT US$253M ▲ 93% US$80M ▲ 20%

34
1.0 1.3 1.51.0
0.50.6
0.6
0.6
0.2 0.2 0.3 0.3
CV: 5300 kcal/kg**
STRIP RATIOS (bcm/t)
Note: *Output figures are 100% basis
**CV figures are air-dried basis
JORO
NGE
BLO
CK
W B
LOCK
IND
OM
INCO
TRU
BAIN
DO
BH
ARIN
TO
TRU
BAIN
DO
BH
ARIN
TO
EM
BALU
TJO
RO
NG
EM
BALU
T
EAST
WEST
COAL OUTPUT (Mt)*
CV: 5950 - 6250 kcal/kg**COAL OUTPUT (Mt)*
CV: 6550 - 6700 kcal/kg**
COAL OUTPUT (Mt)*
CV: 5800 kcal/kg**
2Q17 3Q17 4Q17 1Q18e
STRIP RATIOS (bcm/t) STRIP RATIOS (bcm/t)
1.51.9
28.5
12.0
15.3
9.1
7.4
11.3
0.2 0.3 0.3 0.2
2.8 2.9 2.92.2
0.4 0.5 0.4
0.3
3.23.4 3.3
2.5
INDOMINCO - BONTANG TRUBAINDO - BHARINTO EMBALUT - JORONG
2Q17 3Q17 4Q17 1Q18e
2Q17 3Q17 4Q17 1Q18e
2Q17 3Q17 4Q17 1Q18e
2Q17 3Q17 4Q17 1Q18e
2Q17 3Q17 4Q17 1Q18e
2Q17 3Q17 4Q17 1Q18e
26.0
11.1
2.1
13.3
9.3
6.5
12.5
Indonesia: quarterly output
20.2
9.4
9.7
6.5
6.9
16.5
26.7
11.2
1.6
9.4
12.4
5.4
10.4

35
0
5
10
15
20
25
30
35
40
45
50
55
Note: * Repair and maintenance, salaries and allowances, inventory adjustment, etc.
1Q 2Q
59
FY14 FY15 1Q4Q
Mining cost
SG&A expenses
474242
FY163Q 2Q 3Q
Other production
cost*
44
Royalty
FY17
50
Depr & Amortization
44
Unit: US$/t
2016 2017
INDICATIVE AVERAGE TOTAL COSTS COMMENTS
4Q
52 56
Indonesia: total costs
51
383636
37
42
37
4346
0
5
10
15
Average total costs
8 966 77 6
9 10
47
56
9 10
55
45
4Q17 average total cost higher than 3Q17 mainly due to:
− Higher royalty cost due to higher ASP in 4Q17
− Higher oil price by 16%
2017 average total cost higher than 2016 mainly due to:
− Optimized stripping ratios in 2017 as result of coal price and coal quality improvement
− Higher royalty cost as a result of higher ASP in 2017
− Higher oil price by 26%
51
62
11

36
Change in Indonesia coal reserves 2017 (100% basis)
253
198
+48
END 2016 MINE PLAN/
ECONOMICS
END 2017EXPLORATION/
PERMITS
+29
2017 SALES
DEPLETION
(22)
Unit: Mt
Coal reserves increased by 77 Mt from 2016

37
3.2 Australia operations
Coal business
The Banpu difference
3
1
3.3 Indonesia operations
3.4 China, Mongolia operations
Gas business5
Financial summary6
Power business
3.1 Coal market
4
2018 and beyond7
Highlights 20172
2.2 Coal business
2.3 Power business
2.4 Gas & Infinergy business
2.1 Summary

38
Operation
Hebi
Note: 1 Solid material that remains after light gases and tar have been released from a carbonaceous material during carbonization process2 Detail Environmental Impact Assessment, 3 Ministry of Environmental Green Development and Tourism
2.5 2.3 2.3 2.0
4Q16 3Q17 4Q17 1Q18e
Gaohe
summary1Q17 2Q17 3Q17 4Q17
Sales
(Mt)1.6 2.5 2.7 2.5
ASP
(US$/t)81 78 81 84
Revenue
(US$M) 129 195 216 208
COGS
(US$/t)42 41 44 55
EBITDA
(US$M)80 111 117 100
Gaohe
Higher production QoQ due to stable mining conditions
Continue to manage gas drainage and work on improving development rate
Safety work remains a priority in order to ensure continuous production. HZTM has applied for Class I Safety Coal Mine status
Unit: Mt ROM
Note: * Output figures are ROM output (100% basis)
0.3 0.3 0.4 0.3
4Q16 3Q17 4Q17 1Q18e
Stable production with continued focus on safety. Enforcement of stricter environmental policies, impacted on coal truck transportation and sales
Demand in winter has picked up for the seasonal heating supply. Overall coal market remains stable with increased demand and transportation constraints along supply chain
HEBI OPERATIONAL UPDATESGAOHE OPERATIONAL UPDATESCHINA COAL 2017 PRODUCTION
4Q16-4Q17 CHINA COAL OUTPUT*
HEBI
1.3 Mt
GAOHE
9.0 Mt
BEIJING
MONGOLIA
Project
MONGOLIA PROJECTS UPDATES
CHINA
Tsant Uul
Collaborate with potential pyrolysis vendors and oil upgrading vendors to add more value to tar oil and char1
Unst Khudag and Altai Nuurs
Preliminary feasibility study for UK coal conversion
Received DEIA2 report for mining from MEGD3
China and Mongolia summary

39
3.2 Australia operations
Coal business
The Banpu difference
3
1
3.3 Indonesia operations
3.4 China, Mongolia operations
Gas business5
Financial summary6
Power business
3.1 Coal market
4
2018 and beyond7
Highlights 20172
2.2 Coal business
2.3 Power business
2.4 Gas & Infinergy business
2.1 Summary

40
4Q17 Banpu Power overview
Solar
Performance slightly impacted by winter season
Revenue in total of RMB 31 M, -14% QoQ
Total equity portfolio of 152.1 MWDC all in operation
BLCP
Performance mainly impacted by Unit 1 major overhaul
EAF* of 66% decreased from 88% in 3Q17 due to Extended Major Overhaul (EMJ) for 10 weeks
EBITDA of THB 0.7 Bn, -59% QoQ
Profit contribution of THB -0.2 Bn
Hongsa
Stable reliability YoY. Unit 3 on inspection
EAF* of 83% despite plant inspection
EBITDA of THB 2.8 Bn, -15% QoQ
Profit contribution of THB 0.4 Bn, -30% QoQ
CHP
Better performance due to winter season
EBITDA increased to RMB 126 M, +334% QoQ
SLG
Expected COD in 2019-2020
Note: * Equivalent Availability Factor (EAF) is a percentage and measures of the potential amount of energy that could be produced by the unit after all planned and unplanned losses are removed
THAILAND LAOS CHINA JAPAN
Solar
Performance slightly impacted by winter season
Capacity factor decreased to 10%, -5% QoQ
Total portfolio of 233.3 MWAC, in which 12.6 MWAC
in operation, 44.5 MWAC to COD in 2018 and 176.2 MWAC under development

41
Nari Aizu (75%) 20.5 MWAC (15)
Mukawa (56%) 17 MWAC (9.5)
Yamagata (100%) 20 MWAC
Hiroshima (100%) 8 MWAC
Kessenuma (100%) 20 MWAC
Yabuki (75%) 7 MWAC (5.3)
Onami (75%)
16 MWAC (12)
Note: *Equity basis; MWe = MW equivalent including steam
2018 2020 2023
TOTAL OPERATING EQUITY CAPACITY AT YEAR-END (GWe)
Power projects: 721MWe* pipeline to 2023
2.16 2.48 2.69 2.79
JAPAN
2019
Shirakawa (100%) 10 MWAC
Kurokawa (100%) 18.9 MWAC
CHINA
44.5MWAC
SLG Unit 1&2 (30%)
1,320 MW (396 MW)
Luannan
expansion phase 2
(100%)
62.2MWAC
Luannan
expansion phase 3
(100%)
25 MW and 150 tph
(52 MWe*)
25 MW and 150 tph
(52 MWe*)
CONVENTIONAL
RENEWABLES
2017
Yamagata Iide (51%)
200 MWAC (102)
2.07
GROWTH MILESTONES

42
3.2 Australia operations
Coal business
The Banpu difference
3
1
3.3 Indonesia operations
3.4 China, Mongolia operations
Gas business5
Financial summary6
Power business
3.1 Coal market
4
2018 and beyond7
Highlights 20172
2.2 Coal business
2.3 Power business
2.4 Gas & Infinergy business
2.1 Summary

43
New gas investment (Dec 17): NEPA Corners-V
Banpu’s sixth
investment, 88% stake
in 35 wells
in Marcellus
$105M Operator
Second operator
position
292 Bcf*Proved (1P) reserves
Low acquisition
price based on
EV/reserves
$0.36/Mcf
52 MMcfd*Net production
Note: * Net to Banpu basis
Bcf = Billion cubic feet of natural gas
Mcf = Thousand cubic feet of natural gas
MMcfd = Million cubic feet of natural gas produced per day

44
NEPA Corners-V vs US gas comparables
EV/1P Reserve ($/Mcf)
EV/ Daily production ($/Mcf/day)
EV/EBITDA 2018e(x)
Average leading US gas producersNEPA Corners-V
Note:
* Comparable EV metrics compiled by Macquarie Capital based on SEC
filings and company presentations (11 companies: EQT, Chesapeake Energy,
Cabot Oil and Gas, Antero, Rice Energy, Range Resources, Southwestern
Energy, CONSOL, Gulfport, Carrizo Oil and Gas and Eclipse)
ACQUISITION PRICE*
.2 1.490.36
2,019
7.87.0
5,155
Source: IHS Markit
COMMENTS
NEPA Corners-V has been acquired at low acquisition price compared to average leading US gas producers with focus on Marcellus
Warren Resources (existing major operator) will operate NEPA Corners-V for about 6 months before Banpu group via affiliates gradually takes operational control

45
Banpu gas portfolio: 201 MMcfd gas production
17
52
21
201
100
4 7
Unit: MMcfd
GAS PRODUCTION
CHAFFEE
CORNERS
112
NEPA
CORNERS-I
63
NEPA
CORNERS-II
16
NEPA
CORNERS-III
16
NEPA
CORNERS-IV
210
TOTAL
as of 2017
522
0.5 0.5 0.4 0.5 0.5
2017
MAR JAN MAR MAY SEP
2016
DEC
0.7
INVESTMENT
(US$ M)
EV PRICE/1P
RESERVES
(US$/Mcf)
NEPA
CORNERS-V
105
0.4

46
U.S. gas market update
Source: EIA
AVERAGE HENRY HUB PRICE AS OF 19 FEB-18 U.S. TOTAL NATURAL GAS PRODUCTION
Unit: Bcf/d
NATURAL GAS IN UNDERGROUND STORAGE
Unit: Bcf/d
Unit: US$/MMbtu
Unit: Bcf
83.49 Bcf/d (As of Jan 2018)
$2.64
19-Feb-18
1,884 Bcf(As of 9 Feb. 2018)
Average gas price in last 12M has stayed at US$3.0 per MMbtu level
Though there was big pull on US storage during winter, the February temperatures likely to be more than 5% above 10-year normal benchmark pushed natural-gas futures down to $2.64 per MMBtu, just over two weeks after prices topped $3.50 for the highest finish in more than a year
EIA comments: strong domestic natural gas production growth in 2018 should limit Henry Hub spot prices to an average US$2.88/MMBtu, below previous forecasts and expected to average US$2.92/MMBtu in 2019
1.00
1.50
2.00
2.50
3.00
3.50
4.00
Jan-17 Apr-17 Jul-17 Oct-17 Jan-18
Y2017
average
$3.02(YTD$3.0)
0
10
20
30
40
50
60
70
80
90
Jan-16 Jul-16 Jan-17 Jul-17 Jan-18
Marcellus Other Shale Gas Production Other Natural Gas Production
-8%
-6%
-4%
-2%
0%
2%
4%
6%
8%
0
1,000
2,000
3,000
4,000
5,000
Oct-15 Oct-16 Oct-17
% Increase compared to 5-years average
5-years (2012-2016) maximum billion cubic feet
Working Gas in Storage billion cubic feet
5-years (2012-2016) minimum billion cubic feet

47
2.56
2.03 0.06 0.32
0.92
0.85
Effective
Selling Price
Upstream Midstream Operating
Expense
Selling and
admin
EBITDA
4.5
8.0
5.5
20.9
3Q17 4Q17 2016
(28 Mar -
31 Dec)
2017
Gas business 4Q17 and FY2017 performance
Unit: Bcf 1 Unit: US$M
Unit: US$M
Unit: US$/1000 Cubic Feet (Mcf)
SALES VOLUMES
Additional sales volume and return from acquisition of NEPA Corners-IV. Lower return from midstream as reversal of prior year accrual for partial G&C* settlements we had anticipated to receive during 2017. Significant increase in selling and admin expenses related to due diligence expenditure allocated to the statement during 4Q17
EBITDA
TOTAL REVENUE4Q17 EBITDA BREAKDOWN PER UNIT
2 3 4
Midstream
Upstream
Total
5.813.5 13.7
33.4
2.2
0.5 0.9
4.1
8.0
14.0 14.6
37.5
3Q17 4Q17 2016
(28 Mar -
31 Dec)
2017
5.6 6.8 7.9
24.8
3Q17 4Q17 2016
(28 Mar -
31 Dec)
20175
Note:
1 Billion cubic feet
2 Revenue after royalties and fees
3 Pipeline recovery income
4 Lease operating expense and work over expenses
5 Taxes, marketing and transportation expenses, and administrative expense
2017
20172017
Note: *Gathering and Compression cost

48
3.2 Australia operations
Coal business
The Banpu difference
3
1
3.3 Indonesia operations
3.4 China, Mongolia operations
Gas business5
Financial summary6
Power business
3.1 Coal market
4
2018 and beyond7
Highlights 20172
2.2 Coal business
2.3 Power business
2.4 Gas & Infinergy business
2.1 Summary

49
Others*
Gas
Power
Coal Australia
Coal Indonesia
Banpu consolidated sales revenues
USD million
416 418 542
177 241
259 46
40
57
4Q16 3Q17 4Q17
Note: *Revenue from others includes coal trading, fuel business and other businesses
652
720
586
1,402
1,722
660
883 155
189
15
37
27
46
2016 2017
2,259
2,877
892
+24% QoQ
+37% YoY
+27% YoY
Coal Australia
+34% YoY
Coal Indonesia
+23% YoY
Power+22% YoY
Gas+153% YoY
Coal Australia+7% QoQ
+46% YoY
Coal Indonesia+30% QoQ+30% YoY
Power
+44% QoQ+25% YoY
Gas
+69% QoQ
+139% YoY
6
14
88 13
19
Others*
+53% QoQ
+154% YoY
Others*+73% YoY

50
Banpu consolidated coal gross margin 2017: 40%
Coal sales Gross margin
4Q16 3Q17 4Q17
177
259
USD million
Australia coal
gross margin: 36%
241
40%20%36%
COAL GROSS MARGIN 2017 : 40%COAL GROSS MARGIN 4Q17 : 41%
2016 2017
883
660
34%
23%
2016 2017
1,722
1,402
43%
37%
4Q16 3Q17 4Q17
416
542
418
45%47%43%
Indonesia coal
gross margin: 43%
USD million
Australia coal
gross margin: 34%
Indonesia coal
gross margin: 43%

51
Banpu consolidated EBITDA
216
263
540
968
274
Gas
Power
Coal Australia
Coal China
Coal Indonesia
+4% QoQ
+27% YoY
+79% YoY
246
460 19
95
113
235
155
153
7
25
2016 2017
Gas+255% YoY
Power
-1% YoY
Coal Australia
+107% YoY
Coal - China
Coal - Indonesia
+36% YoY+29% QoQ
Coal - Australia -2% QoQ+179% YoY
Power -33% QoQ
-48% YoY
Gas - USA+20% QoQ
+184% YoY
-38% QoQ
-37% YoY
111 118 152
31 31
20 26
73 72
45
35 24
2
6 7
4Q16 3Q17 4Q17
USD million
Coal China
+404% YoY
Coal Indonesia
+87% YoY

52
118
31
(58)
(35)(31)
(27)
(51)
73
356
Banpu consolidated NPAT
Note : * interest rate swap ** cross currency swap
4Q17 NET PROFIT AFTER TAX
460
95
235
153
25
Coal
Indonesia
EBITDA
968
(206)
FINANCE
CHARGES
TAX&
DEFERRED
TAX
(134)
NPATNON-
RECURRING
ITEMS
2016 NET PROFIT AFTER TAX
2017 NET PROFIT AFTER TAX
USD million
234
Non-recurring items:
• Other non recurring ($48M)
• FX loss USD:THB ($76M)
• Derivative loss ($21M)- Coal swap ($13M)- Oil hedging $4.9M- Gas hedging $3.2M- FX ($12M)- IRS* ($5.8M)- CCS** $1.7M
Power
(140)
(110)
(145)
D&A MINORITY
USD million
Gas
China coal
246
19113
155
7
Coal
Indonesia
EBITDA
540
(182)
FINANCE
CHARGES
TAX&
DEFERRED
TAX
(69)
NPATNON-
RECURRING
ITEMS
USD million
47
Non-recurring items:
• Other non recurring ($18M)
• FX loss USD:THB ($12M)
• Derivative loss ($32.2M)- Oil hedging ($3.2M)- Coal swap ($3.9M)- FX ($16.9M)- IRS* ($8.6M)- CCS** $0.4M
Power
(130)
(50)(62)
D&A MINORITY
China coal
Coal -
Australia
Coal - Australia
3Q17 NET PROFIT AFTER TAX
EBITDA
263
FINANCE
CHARGES
TAX&
DEFERRED
TAX
NPATNON-
RECURRING
ITEMS
USD million
61
Non-recurring items:
• Other non recurring ($18.3M)
• FX loss USD:THB ($17.3M)
• Derivative loss ($15.2M)- Oil hedging $4.1M- Gas hedging $0.6M- Coal swap ($15.8M)- FX ($2.8M)- IRS* ($1.3M)
D&A MINORITY
Gas
Coal - China
Power
Coal - Australia
Coal
Indonesia
152
20
(51)
(38)
(45)
(30)
(44)
72
247
EBITDA
274
FINANCE
CHARGES
TAX&
DEFERRED
TAX
NPATNON-
RECURRING
ITEMS
66
Non-recurring items:
• Other non recurring ($20.5M)
• FX loss USD:THB ($21.4M)
• Derivative loss ($1.6M)- Coal swap ($1.2M)- Gas hedging $0.7M- FX ($0.9M) - IRS* ($1.3M)- CCS** $1.1M
D&A MINORITY
Gas
Coal - China
Power
Coal - Australia
Coal
Indonesia
Gas

53
Note: net profits and FX impact
Adjust for
FX loss (gain) of
BLCP, HPC
Adj. net profits
(excl. FX)
Adjust for
FX loss (gain)
after Ebitda
Net profits -
as reported
4Q16 4Q17
USD million
3Q17 20172016
43
21
(8)
(14)
17
61
89
11
66
21
96
8
47
57
12
(3)
234
76
39
349

54
Banpu consolidated balance sheet
2017 CONSOLIDATED BALANCE SHEET DEBT FX STRUCTURE
Total gross debt: US$3.8 billion
As of 31 Dec 2017
1.18x0.99x 0.99x
Net debt / Equity 1 (x)
78%58%
50%
Net market gearing 2 (%)
Net debt / EBITDA (x)
7.00x6.16x
3.27x
2015 2016 2017
GEARING RATIOS
Note:
1 Net debt to book value of shareholders' equity
2 Net debt to enterprise value (enterprise value
= net debt + market capitalization as at 31 December 2017)
USD million
7,534
3,211
690
1,154
3,859
TOTAL ASSETS TOTAL LIABILITIES
AND
SHAREHOLDERS'
EQUITY
ASSETS
TOTAL
SHAREHOLDERS’ EQUITY
TOTAL BORROWINGS
OTHER LIABILITIES
CASH EQUIVALENT
USD
Fixed
42%
AUD
Fixed
2%
THB
Fixed
19%
USD
Float
31%
AUD
Float
6%
2015 2016 2017

55
3.2 Australia operations
Coal business
The Banpu difference
3
1
3.3 Indonesia operations
3.4 China, Mongolia operations
Gas business5
Financial summary6
Power business
3.1 Coal market
4
2018 and beyond7
Highlights 20172
2.2 Coal business
2.3 Power business
2.4 Gas & Infinergy business
2.1 Summary

56
Coal: strategic plan 2018 and beyond
RESERVES
OPTIMIZATION
Increase reserves through both organic and inorganic growth
MARKETING
OPTIMIZATION
Product mix optimization;customer base diversification;Continue to explore blending
opportunities
OPERATIONAL
IMPROVEMENTS
Step Change Productivity initiative and automation at Centennial;
cycle time improvement
THIRD PARTY COAL
TRADING EXPANSION
Third party coal sourcing and trading business expansion
LOGISTICS
ENHANCEMENT
Hauling road upgradeRail optimization
Barge cycle time improvement at ITM
MARGINS ACROSS
VALUE CHAIN
More usage of internal contractors;synergy with surrounding mines;
fuel cost management

57
Banpu Power: strategic plan 2018 and beyond
4,300 MWE COMMITTED
CAPACITY BY 2025
Targets ≥ 20% renewables as % of equity MW portfolio by 2025
EXPANSION
OPPORTUNITIES
Actively evaluate new investment and acquisition opportunities in
conventional power and renewables throughout Asia-Pacific
OPERATIONAL IMPROVEMENT AND
PROJECT DEVELOPMENT
Hongsa EAF > 80%BLCP unit 2 EMJ in 4Q18
China and Japan Solar operational stabilityOn-time projects development
SUSTAINABLE DEVELOPMENT
AND CORPORATE GOVERNANCE
Continued successful CEO transitionBest practice IR and CG
Sustainability report initiation

58
Gas and Infinergy: strategic plan 2018 and beyond
STRENGTHEN
MARKET POSITION
Build a critical mass portfolio of Marcellus Super Core assets to
strengthen market position
300MW SOLAR ROOFTOP
STRATEGIC GOAL
Expand capacity from current foothold domestically
and internationally within the next 3-5 years
OPERATIONAL
IMPROVEMENTS
Develop synergies among assets within the portfolio;
utilize big data analytics; leveraged established infrastructure
PARTNERSHIP WITH ENERGY
TECHNOLOGY LEADERS
Leverage skills and expand knowledge
CAPABILITY
ENHANCEMENT
Build in-house upstream gas skills and expertise; strengthen
relationship with related parties
NEW ENERGY TECHNOLOGY
OPPORTUNITIES
Expand into both stationary and mobile sectors including energy
management systems and electric vehicle related business
GA
SIN
FIN
ER
GY

59
Capital expenditure 2018
UPSTREAM BUSINESS POWER BUSINESS NEW ENERGY BUSINESS
12
20
2018
32
25
55
2018
80
2018
ILLUSTRATIVE & INDICATIVE ONLY
USD million USD millionUSD million
70
Note: capex figures exclude maintenance capex
DISCLAIMER The views, information and indications expressed here including forward looking targets and indications are illustrative only, are subject to change, may be based on incorrect
assumptions, and have not been independently verified. No representation or warranty is made as to the accuracy, completeness or reliability of the views, information as indications expressed
here. This slide should not be relied upon as a recommendation or forecast by Banpu Public Company Limited. Nothing in this slide should be construed as either an offer to sell or a solicitation of an offer to buy or sell shares in any jurisdiction.
Japan
Solar
Coal
ETS
China CHP/
China Solar
Gas

60
Appendix

61
Change in Banpu coal reserves 2017 (100% basis)
173 1631730
END 2016 RESERVES
ADJUSTMENT
END 20172017 SALES
DEPLETION
(11)
GROSS
RESERVES 2017
253275198 +77 (22)
335349355(15)(6)
Unit: Mt
AUSTRALIA
INDONESIA
CHINA
TOTAL
BANPU
GROUP726 75171 797 (47)

62
CURRENT PORTFOLIO (2018)
Reserves (Bcf) 1,074
Production (mmcfd) 200 - 230
Gas business: 2018 indicative guidance
UNIT GUIDANCE (US$/ MCF) COMMENTS
REVENUE
Average differential to Henry Hub
$0.7-$0.9 Difference selling points and (NYMEX basis) and Henry Hub
Pipeline revenuek
$0.05-$0.15 Applicable to Chaffee Corners volume only
COSTS
G&C costs $0.3-0.4 Gathering and compression costs(to intrastate pipelines)
Lease operating costs $0.2-$0.3 Main component of operating costs
G&A $0.25-$0.35 General and administrative costs
DD&A $0.75-0.85 Depreciation, depletion and amortization
Taxes 21% Currently benefit from tax shield due to accelerated DD&A
ILLUSTRATIVE AND INDICATIVE ONLY

63
Key external and corporate eventsE
XT
ER
NA
L E
VE
NT
SC
OR
PO
RA
TE
E
VE
NT
SD
IREC
TIN
DIR
EC
T
3Q17
Moody's expects
Thailand's GDP
growth to
recover to 3.4%
in 2017
BoT
maintained
policy rate at
1.5%
SET reached
1,659 points,
the highest in
24 years
Thai Baht
continue to
rally, +7%
YTD
Glencore acquired
49% stake in
Hunter Valley
from Yancoal and
Mitsubishi
2Q17
results presentation
Dividend XD date
Banpu Infinergy
announced 25%
acquisition of Sunseap
5th Kalnin
Ventures
shale gas
investment
in Marcellus (US$16M)
Dividend
payment THB0.3/sh
Indonesia to change
domestic coal pricing
to cost-plus
mechanism
4Q17
6th Kalnin
Ventures
shale gas
investment
in Marcellus (US$105M)
China NDRC loosened
coal import restrictions
and approved 32
Mtpa new coal mines
SET reached
1,800 points,
the new
record high
Thai Baht hit its
3-year high, at
THB 32.2 to
USD, +12% YoY
China ban use of
diesel trucks for coal
transport, starting
1st October
3Q17
results presentation
BoT maintains policy
rate at 1.5% and
raised GDP growth
in 2018 to 3.9%
ITM announced
4.7 Mt coal acquisition

64
Regional thermal coal market: 2017 vs 2016
EUROPEUSA
+21
-5
+8
+7
SOUTH
AFRICA
-8
+21
0
INDIA
COLOMBIA
CHINA
INDONESIA
AUSTRALIA
OTHER N. ASIA
+34+41
+23
ATLANTIC
+8
SUPPLY
DEMAND
Unit: Mt
OTHERS
+16
RUSSIA
-3
+22
* Demand in other countries driven by
Philippines, Malaysia, , Vietnam,
Pakistan and some countries in Americas
+10
OTHERS *
+17
PACIFIC

65
Banpu group Q-Q revenue analysis: coal
Note: ITM and Centennial revenues are consolidated in Banpu income statement.
Australia Coal – Third party coal sales included.
*NEX = Newcastle Export Index (formerly Barlow Jonker Index or BJI)
It is relevant but not linked to China Coal’s ASP
Note: Hebi and Gaohe revenues are not consolidated
in Banpu income statement.
SALES (Mt)
AVERAGE SELLING PRICE (US$/t) excl. VAT
REVENUE (US$M)
103 69 96 107 106
4Q16 1Q17 2Q17 3Q17 4Q17
1.2 0.9 1.2 1.3 1.3
4Q16 1Q17 2Q17 3Q17 4Q17
AS
P 85 80 78 81 84
4Q16 1Q17 2Q17 3Q17 4Q17
NE
X*
9583 81
96 99
Equity basis
Equity basis
Domestic
Export
CHINA COAL
1.8 1.9 1.9 2.1 2.2
3.1 3.2 3.1 3.4 3.6
4Q16 1Q17 2Q17 3Q17 4Q17
SALES (Mt)
AVERAGE SELLING PRICE (A$/t)
REVENUE (A$M)
236 242 248 291 331
4Q16 1Q17 2Q17 3Q17 4Q17
75 76 79 85 92
4Q16 1Q17 2Q17 3Q17 4Q17
9583 81
96 99
Equity basis
Equity basis
Domestic
Export
AUSTRALIA COAL (CENTENNIAL)
5.8 4.6 4.9 5.1 6.0
6.75.4 5.5 5.6
6.6
4Q16 1Q17 2Q17 3Q17 4Q17
SALES (Mt) 100% basisDomestic
Export
AVERAGE SELLING PRICE (US$/t)
REVENUE (US$M)
409 366 381 415526
4Q16 1Q17 2Q17 3Q17 4Q17
NEX
*A
SP
9583 81
96 99
100% basis
60 68 6974 81
4Q16 1Q17 2Q17 3Q17 4Q17
INDONESIA COAL (ITM)

66
Indonesia coal gross margin 4Q17 : 43%
4Q16 3Q17 4Q17
43%
45%47%
542
Indonesia Coal
4Q16 3Q17 4Q17
Indominco
44%53%
39%
250
217
205
4Q16 3Q17 4Q17
47%43%
51%
171
Trubaindo
119108
3Q16 3Q17 4Q17
Jorong
33% 35% 47%
11 9 14
52%
4Q16 3Q17 4Q17
23
37%45% 50%
Kitadin
820
416418
4Q16 3Q17 4Q17
Bharinto
6448
59% 48%
59
56%
USD million

67
FX impact analysis guidance on P&L
CURRENCY EXPOSURE
NPAT IMPACT /4Q17 (US$M)
APPROXIMATE FX EXPOSURE (US$M)
NPAT 5% SENSITIVITY 1Q18 (US$M)
-21.4
0.1
-0.6
-
20.9
NET
AUD
ID R
THB & O THER
Banpu: THB
bond and others
8
40
34
0.4
-1.9
35
NET
AUD
ID R
THB & O THER
NET LIABILITY NET ASSET
•2017 growth 5.07% YoY
•BI forecast 2018 growth
5.1-5.5% YoY
•Moderate
growth
•2017 growth 3.9% YoY
•BOT forecast
2018 growth to 3.9% YoY
Assuming 5% depreciation of local
currencies against USD
ITMG: IDR asset
and liabilities
CEY: USD asset
Net
-720

68
Banpu group EBITDA breakdown
Note: all ownership 100% unless otherwise shown
*BIC = Banpu Investment China
80 111 117 100
-1 -2 -2 -0
0 1 1 2
2 3 8 9
13 13 20 19
27 18 30 49
60 51 55 55
Jorong
8 4 7 8
102 86 114 137
40%
45%
Gaohe
Hebi
& holding companies
68%
Indominco
Trubaindo
Kitadin
AACI OVERHEAD
100%
51 60 83 92
Consolidated NOT
consolidated
-1 -1 -1 -1
AUD mil
All figures are 100% basis except for Centennial which is equity basis
216 215 263 274
Bharinto
1Q17 2Q17 3Q17 4Q17
USD million
1Q17 2Q17 3Q17 4Q17
1Q17 2Q17 3Q17 4Q17
1Q17 2Q17 3Q17 4Q17
1Q17 2Q17 3Q17 4Q17
1Q17 2Q17 3Q17 4Q17
1Q17 2Q17 3Q17 4Q17
1Q17 2Q17 3Q17 4Q17
1Q17 2Q17 3Q17 4Q17
50%
40%
70%
Zouping
3 3 3 6
Zhengding
10 1 0 9
Luannan
5 1 1 5
39 50 30 21
BLCP
HONGSA
BIC*
39 59 35 24
79%
79 120 100 85
18 5 4 19
6 7 6 7
U.S. SHALE GAS
1Q17 2Q17 3Q17 4Q17 1Q17 2Q17 3Q17 4Q171Q17 2Q17 3Q17 4Q17 1Q17 2Q17 3Q17 4Q17 1Q17 2Q17 3Q17 4Q17
1Q17 2Q17 3Q17 4Q17
1Q17 2Q17 3Q17 4Q17
1Q17 2Q17 3Q17 4Q17
1Q17 2Q17 3Q17 4Q17 1Q17 2Q17 3Q17 4Q17 1Q17 2Q17 3Q17 4Q17

69
Banpu group net debt breakdown
Note: all ownership 100% unless otherwise shown.
& holding
companies
2,780 2,920 2,955 3,169
AUSTRALIA COAL INDONESIA COAL
CHINA COAL MONGOLIA COAL THAILAND POWER LAOS POWER CHINA POWER
100% 68%
45% 40% 100% 50% 40% 100%
728 763 665 630-404 -370 -402 -380
AUD mil
Consolidated
NOT consolidated
Net debt
Net cash
1Q17 2Q17 3Q17 4Q17
USD million
1Q17 2Q17 3Q17 4Q17 1Q17 2Q17 3Q17 4Q17
196 234 210 182
Gaohe Hebi
-83 -89 -91 -123 -1 -1 -2 -1
1Q17 2Q17 3Q17 4Q17 1Q17 2Q17 3Q17 4Q17 1Q17 2Q17 3Q17 4Q17
2,240 2,207 2,120 2,222
HONGSABLCP BIC*
190 190 150 1503
-19
27 24
1Q17 2Q17 3Q17 4Q17 1Q17 2Q17 3Q17 4Q17 1Q17 2Q17 3Q17 4Q17
POWER79%
1Q17 2Q17 3Q17 4Q17
54 93 111 125

70
Banpu consolidated : operating profit
Sales revenues – Power
Cost of sales
Gross profit*
GPM
Sales revenues – Coal
Total sales revenues*
Gross profit – Coal
Gross profit – Power
GPM – Power
GPM – Coal
Note: * including other businesses
USD million
Sales revenues – Gas
Gross profit – Gas
GPM – Gas
155
(1,511)
748
33%
2,259
2,063
674
54
35%
33%
15
6
44%
189
(1,767)
1,110
39%
2,877
2,629
1,047
45
24%
40%
37
13
36%
YoY%2017 2016
48%
27%
27%
55%
22%
-16%
153%
106%

71
Banpu consolidated : operating profit
Gross profit
GPM
SG&A
Royalty
Other income and Dividend
EBIT
EBITDA
EBIT - Coal
EBIT - Power
Income from associates
EBITDA - Coal
EBITDA - Power
Mining property
EBITDA - Gas
USD million
EBIT - Gas
YoY%
188%
-3%
48%
113%
79%
109%
-1%
255%
710%
748
33%
(296)
(219)
33
358
540
214
143
118
378
(26)
155
7
1
20162017
1,110
39%
(292)
(268)
46
762
968
615
140
205
790
(39)
153
25
7

72
Banpu consolidated : net profit
Note: * income from non-core assets and other non-operating expenses
EBIT
Interest expenses
Financial expenses
Minorities
Non-recurring items*
Income tax (non - core business)
Net profit before FX
Income tax (core business)
Net profit before extra items
FX translations
Net Profit
EPS (US$/share)
Deferred tax income (expenses)
Gain (Loss) on Derivatives Transactions
USD million
113%
421%
392%
291%
762
(135)
(5)
(110)
(48)
(21)
310
(117)
396
(76)
234
0.046
4
(21)
358
(127)
(3)
(50)
(18)
(20)
59
(77)
101
(12)
47
0.013
28
(32)
YoY%2017 2016

73
Banpu consolidated : operating profit
Sales revenues – Power
Cost of sales
Gross profit*
GPM
Sales revenues – Coal
Total sales revenues*
Gross profit – Coal
Gross profit – Power
GPM – Power
GPM – Coal
YoY%
Note: * including other businesses
QoQ%
USD million
4Q164Q17
Sales revenues – Gas
Gross profit – Gas
41%
37%
37%
41%
25%
36%
139%
52%
18%
24%
22%
15%
44%
121%
69%
31%
GPM – Gas
3Q17
31%
57
(541)
351
39%
892
812
329
16
27%
41%
14
4
46
(403)
249
38%
652
593
233
11
25%
39%
6
3
48%39%
40
(422)
298
41%
720
669
285
7
18%
43%
8
3

74
Banpu consolidated : operating profit
Gross profit
GPM
SG&A
Royalty
Other income and Dividend
EBIT
EBITDA
EBIT - Coal
EBIT - Power
Income from associates
EBITDA - Coal
EBITDA - Power
Mining property
EBITDA - Gas
QoQ% YoY%
USD million
4Q16
EBIT - Gas
18%
8%
4%
18%
-36%
10%
-33%
20%
nm.
4Q17
70%
-52%
41%
38%
27%
45%
-48%
184%
nm.
3Q17
243
351
39%
(87)
(82)
23
222
274
202
20
25
(7)
24
7
(0)
249
38%
(84)
(67)
10
161
216
120
41
64
169
(10)
45
2
0
222
298
41%
(75)
(68)
5
205
263
172
31
60
(15)
35
6
2

75
Banpu consolidated : net profit
Note: * income from non-core assets and other non-operating expenses
EBIT
Interest expenses
Financial expenses
Minorities
Non-recurring items*
Income tax (non - core business)
Net profit before FX
Income tax (core business)
Net profit before extra items
FX translations
Net Profit
EPS (US$/share)
YoY%
38%
152%
55%
71%
Deferred tax income (expenses)
QoQ%
8%
12%
9%
5%
Gain (Loss) on Derivatives Transactions
USD million
4Q164Q17
222
(36)
(2)
(30)
(20)
(7)
88
(34)
121
(21)
66
0.013
(4)
(2)
3Q17
161
(31)
(1)
(25)
(11)
(13)
35
(34)
70
8
43
0.009
(5)
(7)
205
(35)
(1)
(27)
(18)
(4)
78
(28)
115
(17)
61
0.012
0
(15)

76
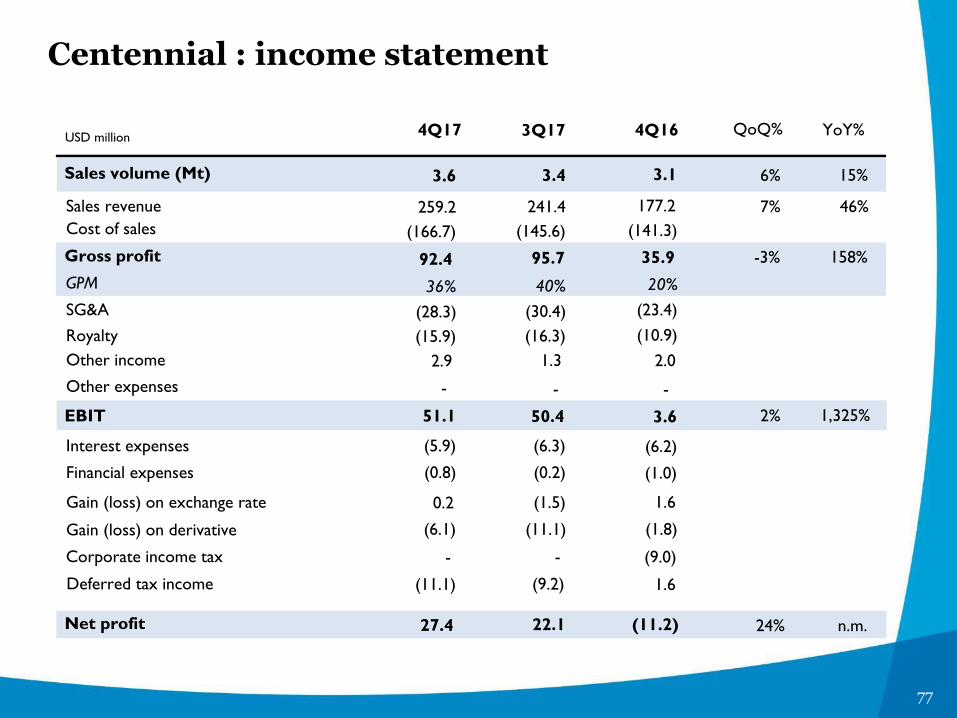
Centennial : income statement
USD million
Cost of sales
Gross profit
GPM
Royalty
SG&A
EBIT
Sales revenue
Sales volume (Mt)
Other income
Interest expenses
Financial expenses
Gain (loss) on exchange rate
Net profit
Gain (loss) on derivative
Other expenses
Corporate income tax
Deferred tax income
YoY%
97%
449%
1%
34%
n.m.
2017
65.1
(581.9)
300.6
34%
(55.6)
(105.8)
148.6
13.4
882.5
9.4
(24.5)
(2.0)
(3.4)
(29.0)
-
(24.8)
2016
(21.8)
(507.6)
152.8
23%
(41.6)
(92.8)
27.1
13.2
660.4
8.7
(25.6)
(3.4)
(0.1)
(16.9)
(9.0)
6.1
- -
77
Centennial : income statement
USD million
Cost of sales
Gross profit
GPM
Royalty
SG&A
EBIT
Sales revenue
Sales volume (Mt)
Other income
Interest expenses
Financial expenses
Gain (loss) on exchange rate
Net profit
Gain (loss) on derivative
Other expenses
YoY%
158%
1,325%
15%
46%
n.m.
QoQ%
-3%
2%
6%
7%
24%
Corporate income tax
- -
4Q164Q17
Deferred tax income
3Q17
27.4
(166.7)
92.4
36%
(15.9)
(28.3)
51.1
3.6
259.2
2.9
(5.9)
(0.8)
0.2
(6.1)
-
(11.1)
(11.2)
(141.3)
35.9
20%
(10.9)
(23.4)
3.6
3.1
177.2
2.0
(6.2)
(1.0)
1.6
(1.8)
1.6
(9.0)
-
22.1
(145.6)
95.7
40%
(16.3)
(30.4)
50.4
3.4
241.4
1.3
(6.3)
(0.2)
(1.5)
(11.1)
-
(9.2)

78
1.2 1.21.8
0.9 1.2 1.11.6 1.3
1.8 1.8
1.5
2.1 1.62.5 1.6 2.3
3.0 3.03.3
3.02.8
3.63.2
3.6
0.0
0.5
1.0
1.5
2.0
2.5
3.0
3.5
4.0
4.5
5.0
1Q17 2Q17 3Q17 4Q17 1Q18e 2Q18e 3Q18e 4Q18e
Total equity ROM (Mt)
WESTERN
NO
RTH
ERN
Australia coal: quarterly equity ROM output
Note: 1 Bar width is indicative of the equity production contributions to Centennial
2 Production generally responds to the timing of longwall changeovers (i.e. lower production results during a longwall changeover period)
3 Angus Place was put on care and maintenance from February 2015.
Normal production Bolt-up/commissioning LW relocation
2016 2017e
LW move Jan Feb Mar Apr May Jun Jul Aug Sep Oct Nov Dec Jan Feb Mar Apr May Jun Jul Aug Sep Oct Nov Dec
Mandalong
(100%)
Springvale
(50%)
2
wks
3
wks
2
wks
3
wks 3
wks
3
wks
5
wks
6
wks
2017 2018e
ACTUAL PLANNED
(INDICATIVE ONLY)
