fy16 budget message - pinellas county, florida › budget › 16budget › proposedbudgetfy16 ›...
TRANSCRIPT

TABLE OF CONTENTS FY16 BUDGET MESSAGE
OVERVIEW OF THE FY16 BUDGET .............................................................. A-3
FUND FORECASTS UPDATE ...................................................................... A-23
CHANGES TO KEY FORECAST ASSUMPTIONS .............................. A-23
GENERAL FUND ................................................................................ A-27
TOURIST DEVELOPMENT COUNCIL FUND ...................................... A-31
TRANSPORTATION TRUST FUND ..................................................... A-35
CAPITAL PROJECTS FUND ............................................................... A-39
EMERGENCY MEDICAL SERVICE FUND .......................................... A-43
AIRPORT FUND ................................................................................... A-47
WATER FUNDS ................................................................................... A-51
SEWER FUNDS ................................................................................... A-55
SOLID WASTE FUNDS ........................................................................ A-59
SURPACE WATER FUND ................................................................... A-63
Pinellas County, Florida A-1 FY16 Proposed Budget

Pinellas County, Florida A-2 FY16 Proposed Budget

OVERVIEW OF THE FY16 BUDGET
This portion of the Fiscal Year FY16 Proposed Budget Message provides an overview of the budget, including:
• Development Philosophy • Citizen Engagement • Process • Strategy • Additional Needs Addressed within the Proposed Budget • Departments and Agencies Overview • Legislative Impacts • Fund Reserves • Unincorporated Area (MSTU) Budget
The objective of any government budget is to effectively and judiciously appropriate available funds to provide services and community investments that best meet the needs of the Public and customers. These decisions are made by elected officials on behalf of their constituents. The Board of County Commissioners has worked diligently to develop an inclusive FY16 budget that reflects the County’s strategic plan and aligns with the mission, vision, values statement. FY16 Budget Development philosophy First step: Strategy Underpinning the development of the budget is the County’s strategic plan. The plan, along with the mission, vision, values statement, is evaluated on an annual basis to define and refine the principles that guide the Board in making budget and other decisions. During work sessions held in the spring, the Board reviewed, refined and adopted the current strategic plan which supports the County’s Vision: To Be the Standard for Public Service in America. With the mission, vision, values statement as a guidepost, the strategic plan was created as an overarching, living document that addresses supporting strategies, and specific Doing Things that the County does to best serve the Public and our customers.
Pinellas County, Florida A-3 FY16 Proposed Budget

OVERVIEW OF THE FY16 BUDGET
This Doing Things for You philosophy connects the mission, vision, values statement to the five strategic goals of the plan:
1. Deliver first class services to the public and our customers. 2. Ensure public health, safety, and welfare. 3. Practice superior environmental stewardship. 4. Foster continual economic growth and vitality. 5. Create a quality workforce in a positive, supportive organization.
Creating focus Doing Things The County’s strategic plan creates focus for how and why funds are allocated and disbursed. Examples of the strategic plan in action are evidenced in recent accomplishments. These accomplishments demonstrate the vitality and strength of active partnerships among employees, with our municipalities, and other stakeholders within the community.
Pinellas County, Florida A-4 FY16 Proposed Budget

OVERVIEW OF THE FY16 BUDGET
Delivering first-class services to the public and customers. Communications and Business Technology Services worked together to develop the “Doing Things for You!” mobile app that allows citizens to easily report problems and issues. The app won the 2015 Public Technology Institute Solutions Award.
St. Pete-Clearwater International Airport realized a 23 percent increase in passenger volume from 2013, the second highest in its history, with a total of 1.25 million passengers in 2014.
Pinellas County Animal Services (PCAS) strengthened its Adoption Partner Network, including its primary partners, the Humane Society of Pinellas, the Society for the Prevention of Cruelty to Animals Tampa Bay (SPCA), PetPal and the Suncoast Animal League; 70 approved rescue organizations and 11 local pet stores. PCAS, Humane Society and SPCA also partnered to secure a $75,000 grant from Florida Animal Friend, Inc. to provide low cost spay and neuter services to the community. We’re ensuring public health, safety and welfare.
The County established new five-year agreement for paramedic first responder services with all municipalities and fire districts, maintaining previous levels of service in a financially sustainable fashion.
The new Public Safety Complex consolidated multiple agencies and saves tax payers approximately $300,000 while providing Category 5 hurricane-hardened facilities for centralized 9-1-1 communications, Fire and Emergency Medical Services dispatch, Sheriff’s administration and fleet management, Emergency Management and the Emergency Operations Center. The Regional 9-1-1 Center answers close to 900,000 calls each year with more than 500,000 of them being 9-1-1 calls. Current statistics show more than 90 percent of 9-1-1 calls are answered within 10 seconds.
Pinellas County, Florida A-5 FY16 Proposed Budget

OVERVIEW OF THE FY16 BUDGET
Emergency Management developed the Storm Surge Protector web application to allow citizens to easily visualize the deadly effects of storm surge. The app won the Governor’s Hurricane Conference 2015 Innovation Award.
The County was awarded $778,138 in federal funding and $30,390 in state low income pool funds for the Mobile Medical Unit program, a medical office on wheels providing free basic health care for homeless residents.
Practicing superior environmental stewardship.
Due to ongoing education programs, recycling rates at Pinellas County drop-off locations increased by almost 15 percent.
Funding for the $1.5 million Fort De Soto recirculation project—restoring estuary habitat and improving bay water quality—has been approved.
In partnership with the Greater Ridgecrest Area in Largo, the Community Revitalization Division coordinated a large scale clean-up resulting in the collection of 157 pounds of chemicals and 2,362 pounds of electronics.
Pinellas County, Florida A-6 FY16 Proposed Budget

OVERVIEW OF THE FY16 BUDGET
The Downtown District Cooling Plant uses an impressive system of generating and delivering chilled water through an underground distribution piping network to provide air conditioning to several County buildings throughout downtown Clearwater. The result is a state-of-the-art energy efficient chilled water system that provides low energy cost air conditioning and a reduced carbon footprint. Fostering continual economic growth and vitality. Economic Development partnered with Tampa-Hillsborough Economic Development Corporation to create a strong regional approach for local businesses seeking to export their products and services. The recently implemented South St. Petersburg Redevelopment Plan will allow future property tax revenue to be set aside to tackle poverty and blight conditions, creating new economic vitality in this historically underserved area. Creating a quality workforce in a positive, supportive organization.
The County is dedicated to developing its workforce through recruitment and retention of a diverse and talented pool of employees and by expanding opportunities for workforce growth and development.
In support of the community’s economic vitality, the County offers a fair and competitive compensation to all employees, adopting a minimum wage of $12.50 per hour, effective FY16.
These are a just a few of the strategic plan-driven accomplishments the County achieved in 2014 and, to date, in 2015. For a more detailed list, refer to the Doing Things for You! 2014 Accomplishments Report at: www.pinellascounty.org/PDF/County_Accomplishment_Report.pdf
Pinellas County, Florida A-7 FY16 Proposed Budget

OVERVIEW OF THE FY16 BUDGET
Setting the Standard for Public Service in America Citizen Engagement Citizens are at the heart of the County’s mission, vision, values and strategic plan. Multiple methodologies are employed year-round to engage citizens in substantive feedback, gauging citizens’ priorities and satisfaction levels with government programs and services. Interactive Engagement Survey of Citizen Values This is the fifth consecutive year that the County has conducted a statistically valid citizen survey (+/- 3.5 percent at a 95 percent confidence level). The goals of this year’s survey were to measure citizen expectations and perceptions regarding key drivers that impact their overall quality of life, and to determine strengths and opportunities for improvement. An independent expert conducted 800 telephone interviews in each of the County’s regions: north, mid, south and beaches. The survey was designed to ensure representation from various age groups, genders, unincorporated residents, and other demographic groups. The detailed survey results can be found at: www.pinellascounty.org/budget/pdf/2015_Telephonic_Citizen.pdf. Another methodology employed to engage citizen participation is an online survey. The online survey followed the telephonic survey. Citizens were able to participate via an online link, which was posted on the County’s website. The survey results can be found at: www.pinellascounty.org/budget/pdf/2015_Citizen_Report_Online.pdf. Community Conversation On May 20, 2015, the Board and the County Administrator engaged citizens in a Community Conversation, partnering with the Seminole campus of St. Petersburg College, the St. Petersburg College Institute for Strategic Policy Solutions and Bay News 9. This was the fourth consecutive year the live event took place in the Digitorium of the C.W. “Bill” Young University Partnership Center.
This year’s event broadened the scope of the conversation, opening the program to any topic citizens wished to discuss. Citizens asked questions and provided comments in person, via the Community Conversation website and
Pinellas County, Florida A-8 FY16 Proposed Budget
OVERVIEW OF THE FY16 BUDGET
through telephone outreach. Viewers of Pinellas County Connection Television, along with a simulcast on St. Petersburg College’s cable channel, called in or joined in online to participate. In total, more than 9,400 citizens engaged in the 2015 Community Conversation,
with 9,250 by telephone, 199 online and approximately 70 audience members. More than 20 topics and/or questions were fielded by the Board and County Administrator during the hour-long event. Due to time constraints, questions that were not presented were answered in a text format and posted to the Community Conversation website shortly after the event. A replay of the Community Conversation and responses to all of the questions submitted by Citizens can be found at: www.pinellascounty.org/communityconversation.
Budget Information Sessions Citizens also have an opportunity to participate in multiple budget information work sessions throughout the budget cycle, with two (2) public hearings in September 2015. An ongoing schedule of key dates in the annual budget process can be found at: www.pinellascounty.org/budget/16budget/date_schedule.htm. Citizen Suggestions Citizens are encouraged to provide input throughout the budget process by submitting ideas through the County’s “Citizens’ Guide to the Budget” website at www.pinellascounty.org/budget. This website includes helpful information on the budget including presentations and handouts for all budget development meetings, as well as the budget timeline, the budget document, opportunities for citizen input, how the budget process works and other budget-related topics. Employee Input For almost four decades, the Employee Suggestion Award Program has been rewarding employees for their innovative ideas. The program has led to many initiatives that generate savings, optimize business processes leading to better efficiencies and identify new or enhanced revenue streams.
Pinellas County, Florida A-9 FY16 Proposed Budget

OVERVIEW OF THE FY16 BUDGET
Annual Budget Process Preparing the County’s annual operating and capital budget is a year-round process, as illustrated in the following diagram.
Budget Forecast (January/February) After the fiscal year starts, the initial step in the annual budget process is to update the Forecast in order to develop the budget guidelines for the upcoming budget process. The Forecast is built upon an individual assessment of 10 of the County’s major funds: the General Fund, the Tourist Development Fund, the Transportation Trust Fund, the Capital Projects Fund, the Emergency Medical Services Fund, the Airport Fund and the Water, Sewer, Solid Waste, and Surface Water Funds. The process for developing the FY16 Forecast included updating the projections for the prior fiscal year, FY14, with actual revenue and expenditure information following the year-end closeout. At the same time, current FY15 revenues and expenditures were projected on a preliminary basis by analyzing the actual year-to-date numbers and projecting the remaining months left in the fiscal year. These projections are further refined later in the process as departments provide their projections for revenue and expenditures. The forecast for the upcoming budget year, FY16, was based on available information and formed the underlying basis for developing the strategy to balance the budget. In addition to focusing on the upcoming fiscal year, the Forecast’s multi-year horizon helps determine the long-term financial position of the County’s funds as well as the impact of today’s budget decisions on the future. The “out-years” through FY21 are forecasted using various projection methods such as trend analysis, linear regression and moving averages. Developing a multi-year forecast provides decision-makers with at least three key benefits: (1) assessing the long-
Pinellas County, Florida A-10 FY16 Proposed Budget

OVERVIEW OF THE FY16 BUDGET
term financial sustainability of the County’s funds; (2) understanding the impact of today’s decisions on the future; and (3) providing a holistic financial picture. Targets/Budget Guidelines (February) The targets or budget guidelines are developed by County administration based on the financial forecast. These are communicated to the County's departments and agencies for use during their budget development. At this time all instructions and resources for preparing budget requests are also distributed. Develop and Revise Strategic Plan (January/February/March) During this time period, the Board develops and/or revises its strategic plan. In January of this year, departments prepared for and presented to the Board a report of their ongoing and newly developed tactics or “doing things”—projects and programs—that link back to the strategic plan. This process ensures that departments and agencies under the Board link the various projects and programs funded in the Annual Budget to the five goals of the strategic plan, also ensuring that sound strategy is linked to the big picture driving budget decisions. Budget Submissions (March/April) County departments and agencies submit their completed budget submissions at this time except for the Constitutional Officers which have a due date of May 1. The budget submissions are analyzed by Office of Management and Budget staff in preparation for budget work sessions with the Board. Budget Work Sessions (April/May/June) During this time various budget work sessions are held with the Board to obtain feedback necessary to develop the Proposed Budget such as millage rate policy, proposed program enhancements or reductions and revenue adjustments. Proposed Budget (July) The Proposed Budget is prepared by the County Administrator based on direction acquired from the various budget work sessions with the Board and priorities in the County's Strategic Plan. The Proposed Budget document presents a balanced budget for the coming year. Public Hearings to Adopt Budget (September) Once the Proposed Budget is distributed, additional budget work sessions may be held to provide further guidance to the County Administrator. All changes to the Proposed Budget are finalized and announced at each of the public hearings. The public hearings represent an opportunity for citizens to provide input to the Board regarding the budget process. At the first public hearing the Board approves the tentative millages and budgets. At the second public hearing the Board approves the adopted millages and budgets. New Fiscal Year (October) In October, the new fiscal year begins based on the Adopted Budget and the annual budget process ends.
For specific dates applicable to the current budget process, see the Budget Calendar in the Appendix of this document.
Pinellas County, Florida A-11 FY16 Proposed Budget

OVERVIEW OF THE FY16 BUDGET
FY16 Budget Strategy Development of the Proposed Budget Following the presentation of the Financial Forecast in February, 2015, budget targets for County Administrator departments, Constitutional Officers, and Independent Agencies were prepared using the inflation factors defined in that document. Departments reporting to the BCC prepared their detailed budget requests. The Constitutional Officers and Independent Agencies also prepared their budget requests and presented them to the BCC in a series of budget information sessions in April and May. Overall, the department and agency budget requests met these targets. However, a number of needs which exceeded the forecast expectations were identified. The Board was engaged early in the budget development process, allowing for greater transparency and information flow about all available resources. This yielded greater input from the Board and provided the Board the opportunity to identify budgetary priorities. The additional needs identified by departments, agencies, and the Board were considered in the context of the BCC’s strategic plan. Since available resources in the FY16 Proposed Budget were insufficient to support all needs aligned with the strategic plan, additional factors like public safety, preservation of assets, service level maintenance and restoration, and quality of life were considered. Below is a summary of the needs that have been incorporated into the FY16 Proposed Budget, organized by strategic goal area. Additional information regarding each need is included in each department and agency analysis in Sections C-H. Additional Needs Addressed within the Proposed Budget Create a Quality Workforce in a Positive, Supportive Organization The BCC adopted a minimum pay threshold of $12.50 per hour for all full-time, permanent BCC employees. This threshold, which exceeds federal minimum wage standards, is intended to facilitate maintaining a fair and competitive compensation package and to attract and retain the most diverse and talented Pinellas County workforce. Additional Pinellas County entities like the Sheriff have also committed to adopt this minimum pay threshold. The fiscal impact to the FY16 Proposed Budget is spread across multiple departments and funds and totals approximately $0.1M. Administratively, one (1) position was realigned to Risk Management during FY15 from the former Department of Environment and Infrastructure (DEI) to restore administrative support that will enable greater focus by professional staff on workplace safety programs. Ensure Public Health, Safety, and Welfare The Sheriff will receive $6.0M additional appropriation to support the second phase of a pay plan to be competitive in attracting and retaining sworn and civilian personnel. Additional funding ($0.8M) for the Technical Rescue and Water Rescue programs within Emergency Medical Services and Fire Administration will enable improved planning, coordination,
Pinellas County, Florida A-12 FY16 Proposed Budget

OVERVIEW OF THE FY16 BUDGET
prevention, and protective services to ensure a safe and secure community. Two (2) positions were realigned to Emergency Management during FY15 from DEI to improve planning and response to all types of emergencies. Three initiatives will receive additional funding ($1.2M) via Human Services to contribute to more efficient and effective behavioral health outcomes. The SSI/SSDI Outreach, Access, and Recovery (SOAR) program will be expanded in coordination with the Public Defender and St. Vincent de Paul. A technology project will enable integrated information sharing among partners, thereby improving coordination of care. A high-utilizer stabilization program seeks to establish an integrated systems approach to address the needs of a pilot group of individuals. The Office of Human Rights will receive funding (<$0.1M) to enable implementation of a wage theft ordinance. This funding is a placeholder pending establishment of the ordinance by the BCC. Administratively, the Radio & Technology budget reflects increased costs ($0.1M) for the Motorola radio system contract used by public safety agencies as a result of upgrading to new technology. The Medical Examiner budget includes appropriation (<$0.1M) for replacing lab equipment. Justice and Consumer Services budget includes funding ($0.2M) to support continuation of a juvenile detention alternative pilot program started in FY15, although savings from anticipated reduction in detention days yield no net change in the budget. Practice Superior Environmental Stewardship One (1) FTE (<$0.1M) will be restored at Heritage Village in Parks and Conservation Resources (PCR) as Curator of Collections to acquire, conserve, archive, exhibit, and interpret the collection at the County's historical museums. This position was eliminated during the Great Recession and will have oversight of the collection's activities, including being responsible for preservation of Heritage Village's historical structures. PCR budget will include a second year of funding ($0.3M) for contractual services to clear invasive species through the use of a Fecon mower. This is a pilot program which will be re-evaluated for the FY17 budget. To help improve maintenance services in the parks and environmental lands, $0.3M previously budgeted for transfer to the Capital Projects Fund will support replacement of aging equipment and building repairs. This is not anticipated to negatively impact the schedule for PCR capital projects, as other Penny for Pinellas revenues will be used in lieu of the transfer. Additional appropriation (<$0.1M) will enable maintenance of stormwater ditches adjacent to the incorporated areas of the Pinellas Trail. Since these locations are within cities, the surface water assessment fee is not an allowable funding source. Due to the transfer of several impaired sites, Real Estate Management budget includes additional appropriation ($0.2M) for active and passive remediation required by state law. Urban Forestry within Public Works budget includes additional funding ($0.1M) to support developing a comprehensive tree inventory and replacing capital equipment. These activities will support preservation of assets and workforce safety.
Pinellas County, Florida A-13 FY16 Proposed Budget
OVERVIEW OF THE FY16 BUDGET
Within the Utilities enterprise funds, additional appropriation ($0.6M) and one (1) FTE realigned from DEI will support improvements to the technology utilized for security of sewer system lift stations. One (1) FTE is added to support increased workloads associated with solid waste and watershed management in the laboratory; these services were previously contracted so there is no net fiscal impact to those programs. Two projects ($0.1M) will enable survey of plant locations to improve asset management and establish partnership with University of South Florida to establish methodology for calculating sources of rainfall runoff into the sewer system to improve handling during extreme rainfall events. Within the Solid Waste enterprise funds, appropriation ($0.4M) for capital equipment, technology, and two (2) positions are included for increased outreach for recycling and hazardous materials and compliance with state inspection mandates. Foster Continual Economic Growth and Vitality Additional appropriation of $0.2M is included in the Planning Department to increase investment in the Affordable Housing Trust Fund. These funds are leveraged by partners to support affordable housing projects that help homeowners who might have lost their homes due to recession, and also the working poor who cannot afford rents that are currently available in the marketplace. Three (3) FTE in Code Enforcement are realigned from Utilities water conservation enforcement and DEI to maintain and improve level of service due to increased activity resulting from the economic recovery, enable professional staff to focus on core duties by providing administrative support, and assist with the transition into a new permit tracking software. Additional funding ($0.3M) will support various projects within the MSTU unincorporated areas to enhance quality of life within unincorporated communities. Within the Lealman community, Real Estate Management funding ($0.1M) will repair air conditioning and replace flooring in Clearview Elementary school. The Florida Dream Center will establish this facility as a community center/social services center for some of the poorest and most underserved people in Pinellas County. In June, the Board established a community redevelopment area (CRA) within Lealman to dedicate property tax value increases in this community to programs that will improve opportunities for residents and businesses. Seed money (<$0.1M) is included for resources for public outreach and engagement. The existing intergovernmental liaison position will expand her current scope of responsibilities to enhance service delivery to the unincorporated parts of Pinellas and help guide County efforts to combat poverty, build strong and vibrant communities, and enhance relations with community leaders. This position will act as a direct point of contact for concerns from unincorporated citizens. Additional funding ($0.3M) to support Creative Pinellas will partially restore arts programs in Pinellas County. Creative Pinellas is the county’s non-profit local arts agency, formed in 2011 with a mission to promote, incubate, develop and sustain Pinellas County’s creative communities.
Pinellas County, Florida A-14 FY16 Proposed Budget

OVERVIEW OF THE FY16 BUDGET
PCR additional appropriation (<$0.1M) will enable support for not-for-profit youth sports organizations operating on County-owned property or solely within unincorporated areas of the county to maintain safe and attractive youth sports facilities. Funding will initiate support for each organization and allow continued evaluation of needs in future years. Funding will support groundskeeping and maintenance of fields for Seminole Youth Athletic Association, Seminole Junior Warhawks, and Cross Bayou Little League and will be distributed proportionally based on acreage to be maintained. Administratively, Development Review Services reflects four (4) additional positions to improve customer service, enhance permitting and plan review processing times, and address increased workloads associated with the economic recovery. St. Petersburg-Clearwater Airport reflects two (2) additional positions to maintain service levels in light of record-setting passenger traffic. Deliver First Class Services to the Public and Our Customers Enterprise-wide technology projects will be funded ($4.3M) via Business Technology Services to upgrade and/or replace Microsoft products and enterprise asset management, interactive voice response, and geographic information system (GIS) applications. Light Detection and Ranging (LiDAR) images will also be captured to refresh property elevation and other data primarily used by the Property Appraiser. Additional positions (6.4 FTE, $0.3M) will be supported in the Property Appraiser and Clerk of the Circuit Court to maintain service levels. New voting equipment ($0.4M) for the Supervisor of Elections will improve citizen voting experience and speed and efficiency of tabulating votes. The Real Estate Management (REM) budget reflects additional costs ($0.3M) for the operation of the Public Safety Complex, which became fully operational during FY15. Also, since the recession and during the implementation of the space management plan there has been a moratorium on minor building improvements in County facilities. The space plan reduced ongoing operating costs by eliminating leased space where possible and by relocating and consolidating offices on the various office campuses. With the completion of this plan, funding has been added to REM to support building improvements that are more than just repair but do not reach the threshold for inclusion in the Capital Improvement Program. Communications budget includes additional funding (<$0.1M) to replace audio/video equipment in the BCC Assembly Room. In the Utilities enterprise fund budget, additional appropriation (<$0.1M) will support contractual support to conduct a comprehensive customer expectations survey and to re-procure hosting and support services for the customer information system used for billing and customer support.
Pinellas County, Florida A-15 FY16 Proposed Budget

OVERVIEW OF THE FY16 BUDGET
Departments and Agencies The County’s Annual Operating and Capital Budget includes agencies and departments that report to the Board of County Commissioners and the County Administrator, as well as the budgets of Constitutional Officers and Independent Agencies. The FY16 Proposed Budget totals $2.0B, an increase of $67.5M or 3.4% over the FY15 Revised Budget. While there are no proposed changes to millage rates, property tax revenue is projected to yield an additional $25.8M as a result of increased property values. Another $38.0M is reflected in fund balances, primarily attributable to special revenue and enterprise funds experiencing increased revenues as a result of the improving economy. From a functional perspective, Public Safety, Transportation, and Economic Environment each reflect increases exceeding $20M. Culture and Recreation appropriation is increasing $3.8M or 9.7%. While Human Services reflects a decrease of $1.1M or 1.4%, the reduction is based on decrease to state-mandated Medicaid match ($1.4M) and reduced capital funding ($2.0M) as the grant-funded Pinellas County Health Campus project is anticipated to be completed. Physical Environment reflects a small decrease of $1.7M or 0.3% due to reduced Solid Waste system reserve levels resulting from significant planned capital project expenditures in FY15. Governmental Support reflects a decrease of $25.4M, primarily resulting from decreased debt service payments (repayment of loan to Capital Projects fund from Solid Waste fund and completion on September 30, 2015 of the County's obligation to the City of St. Petersburg's bonds for Tropicana Field). The Board of County Commissioners (BCC) is the legislative body of government responsible for the formulation of policy. The BCC appoints both the County Attorney and the County Administrator, who is responsible for implementing the Board’s policies. These departments include functions ranging from Airport to Solid Waste, Animal Services to Emergency Medical Services, and Parks to Public Works. The FY16 Proposed Budget for the BCC departments is $1.3B, an increase of $38.1M or 3.0% over the FY15 Revised Budget. These functions represent 65.0% of the total County budget. A majority of the increase is reflected in special revenue funds as noted above. Constitutional Officers include the Clerk of the Circuit Court and Comptroller, Property Appraiser, Sheriff, Supervisor of Elections, and Tax Collector. The County also provides Court Support to the Judiciary, Public Defender, and State Attorney as specified in Article V of the Florida Constitution as well as funding certain local options. The FY16 Proposed Budget for the Constitutional Officers is $342.8M, an increase of $24.8M or 7.8% over the FY15 Revised Budget. These functions represent 16.9% of the total County budget. The majority of this category is attributed to the Sheriff ($265.2M). The increase is also primarily related to the Sheriff as this budget increased $15.8M or 6.3% as a result of inflationary increases and an additional $6.0M to complete implementation of a structured pay plan. Independent and Support Funded Agencies in the County include the Construction Licensing Board, the East Lake Library Services District, the East Lake Recreation Services
Pinellas County, Florida A-16 FY16 Proposed Budget

OVERVIEW OF THE FY16 BUDGET
District, the Feather Sound Community Services District, the Health Department, Human Resources, Medical Examiner, Office of Human Rights, Palm Harbor Community Services District, Pinellas Planning Council, and Business Technology Services. The FY16 Proposed Budget for Independent and Support Funded agencies is $367.6M, an increase of $4.6M or 1.3% over the FY15 Revised Budget. These functions represent 18.1% of the total County budget. For additional insight into the FY16 Proposed Budget, including department and agency descriptions, budget analysis, and programmatic budgets and personnel counts, please see Sections C-H. Legislative Impacts The budget of Pinellas County is not solely dependent on our local revenues. The State and Federal government can both impact the County budget through legislation, tax policy and the appropriations process. During the 2015 State Legislative Session, the County successfully secured an appropriation of $3.0M to support the Upham Beach Groin Replacement Project. This appropriation aligns with the Board’s legislative priority to support beach nourishment funding. A major issue in this year’s state legislative session was healthcare, including the Low Income Pool and whether or not to expand healthcare access using Medicaid funds. In the end, funding for the Low Income Pool was extended for one year with some modifications. Healthcare was not expanded using Medicaid funds. The expansion would have offset some County expenses for indigent healthcare. The funding of healthcare will continue to be a major issue in upcoming legislative sessions. The Department of Juvenile Justice Billing issue was also not settled this legislative session. Many counties in Florida have been in a dispute with the State over billing methodology and the repayment of past credits owed to the counties. The appropriations bill that passed this year did include a “claw back” provision that states any underpayment by a County will result in the State withholding revenue sharing in other areas, such as sales tax, to make up the difference. This will continue to be a major issue for the upcoming session with regard to both the future billing and the repayment of credits. Senate Bill 7024 passed this session which will release residual balances in the Local Government Surplus Trust Fund, Fund B that were frozen during the recession. This will allow over $300,000 to flow to Pinellas County. Prior to the passage of the bill the County would not have received any funding out of this account. A $400.0M tax cut package was signed into law during the 2015 session as well. The largest tax cut in the package was to the Communication Services Tax (CST). The funds from the CST are split between the state and local jurisdictions. This cut, however, was structured so
Pinellas County, Florida A-17 FY16 Proposed Budget

OVERVIEW OF THE FY16 BUDGET
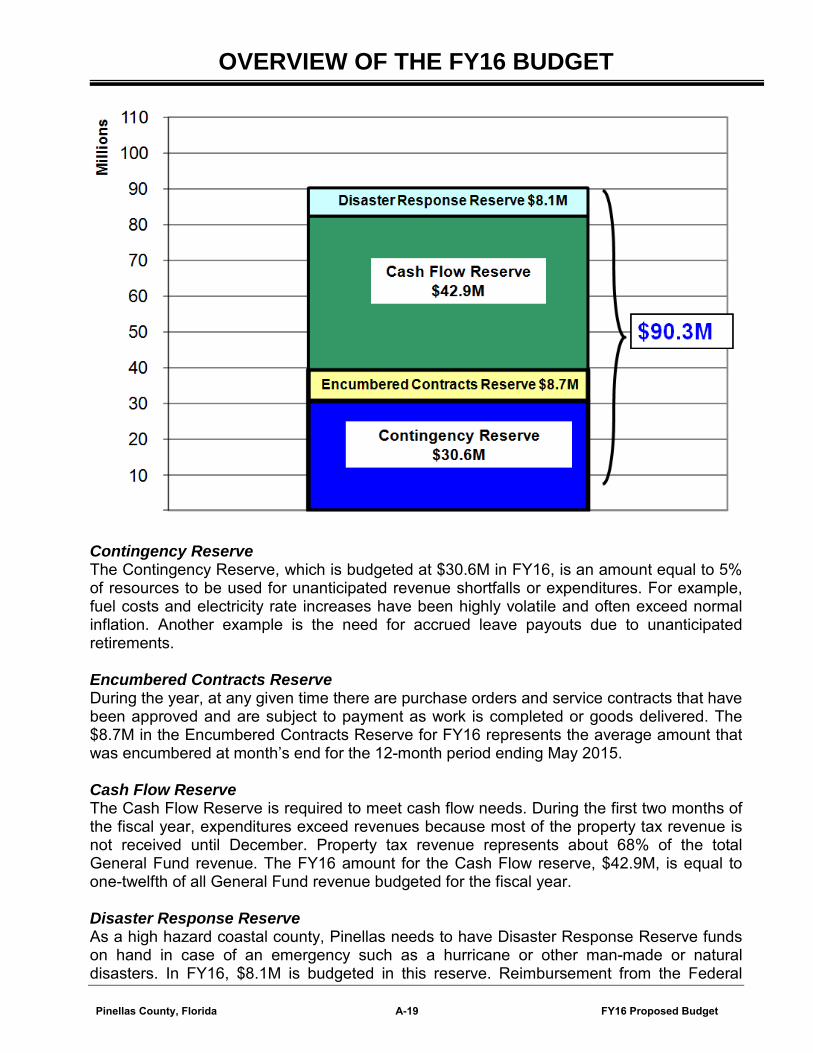
the fiscal impact will apply only to the state share of the funds, holding counties and municipalities harmless. The tax cut package also included an expanded ten day back to school tax holiday. This tax holiday will have a $7.4M impact to counties statewide. On a Federal level, the County has been successful in securing multiple grants to assist in funding everything from airport improvements, to environmental projects and social services. With the demise of Federal earmarks, federal grants have become increasingly competitive. The County will continue to pursue all relevant funding opportunities and support our grant activity with advocacy. As we move forward, the County will closely monitor newly filed legislation and the ongoing appropriation process in both Tallahassee and Washington, D.C. In addition, the impact of new or proposed regulation regarding the Waters of the US, the draft EPA ozone standards rule and the reauthorization of the Highway Bill will be tracked for their impact on both the operations and budget of the County. The County will also continue to monitor state mandated Florida Retirement System contribution rates and advocate for fair rates across all of the classifications to keep the system as solvent as it is today. In addition to the legislative process, we will monitor any proposed state constitutional amendments that may impact property tax revenue. Fund Reserves Maintaining adequate reserves is key to the County’s ability to deal with potential emergencies and unforeseen events such as commodity price hikes, unanticipated dips in revenues or a natural disaster. The level of reserves maintained in each of the County’s funds varies in accordance with the Board’s established budget policies (as presented in the Appendix). The FY16 General Fund budget includes projected year-end reserves of $90.3M, or 14.4% of total resources. While this falls short of the Board’s policy of 15.0% for General Fund reserves, additional opportunities will be pursued to achieve this policy target within the Tentative Budget to be submitted at the first public hearing to adopt the budget on September 10. These opportunities include adding revenue from the pending settlement of the Deepwater Horizon Oil Spill litigation, partial reimbursement from Draper Laboratory of their economic development incentive grant, and re-evaluating fleet operating and maintenance charges to departmental customers. Repairs had been steadily increasing due to deferral of fleet vehicle replacements. The components of the General Fund reserves are Contingency, Encumbered Contracts, Cash Flow, and Disaster Response.
Pinellas County, Florida A-18 FY16 Proposed Budget
OVERVIEW OF THE FY16 BUDGET
Contingency Reserve The Contingency Reserve, which is budgeted at $30.6M in FY16, is an amount equal to 5% of resources to be used for unanticipated revenue shortfalls or expenditures. For example, fuel costs and electricity rate increases have been highly volatile and often exceed normal inflation. Another example is the need for accrued leave payouts due to unanticipated retirements. Encumbered Contracts Reserve During the year, at any given time there are purchase orders and service contracts that have been approved and are subject to payment as work is completed or goods delivered. The $8.7M in the Encumbered Contracts Reserve for FY16 represents the average amount that was encumbered at month’s end for the 12-month period ending May 2015. Cash Flow Reserve The Cash Flow Reserve is required to meet cash flow needs. During the first two months of the fiscal year, expenditures exceed revenues because most of the property tax revenue is not received until December. Property tax revenue represents about 68% of the total General Fund revenue. The FY16 amount for the Cash Flow reserve, $42.9M, is equal to one-twelfth of all General Fund revenue budgeted for the fiscal year. Disaster Response Reserve As a high hazard coastal county, Pinellas needs to have Disaster Response Reserve funds on hand in case of an emergency such as a hurricane or other man-made or natural disasters. In FY16, $8.1M is budgeted in this reserve. Reimbursement from the Federal
Pinellas County, Florida A-19 FY16 Proposed Budget

OVERVIEW OF THE FY16 BUDGET
Emergency Management Agency (FEMA) and the State usually cover only a portion of the costs, is not available at the beginning of a disaster, and often is not received for many months or years. Unincorporated Area Municipal Services Taxing Unit (MSTU) The Municipal Services Taxing Unit (MSTU) is the part of the County budget that is devoted to providing services that are delivered to our unincorporated residents. These services, such as law enforcement and building permitting, are similar to those most cities provide. Florida Statutes require that MSTU services are provided "from funds derived from service charges, special assessments, or taxes within such unit only" {F.S. 125.01(1)(q)}. The Pinellas MSTU was established in 1975 and is codified as Chapter 114, Article X of the County Code. The general operating revenue and expenditures for the MSTU funded primarily by property taxes are part of the County’s General Fund. Two funds, the Building Services Fund and the Surface Water Utility Fund, are entirely devoted to unincorporated area programs. The budget presented below does not include all MSTU-related expenditures budgeted. Examples include traffic sign and signal maintenance and capital improvement expenditures such as Penny for Pinellas projects. MSTU Revenues MSTU Revenues consist of the following:
o Property Taxes: A millage rate is adopted by the Board of County Commissioners and collected in the unincorporated area to support MSTU services. The millage rate for FY16 is 2.0857 mills. This rate has remained the same since FY08. The tax base for the MSTU increased by 5.0% compared to FY15 due to increasing property values.
o Revenues Totally Generated by the MSTU: There are a number of County revenues
that are totally generated by activity in the unincorporated area that have traditionally been credited to the Pinellas MSTU. In FY16, these revenues include: communications services taxes; fees for building permits, tree removal, lot clearing, and zoning; surface water utility fees; and mobile home licenses.
o Revenues Specifically Allowed by State Law: Chapter 218.64 of the Florida Statutes
authorizes the County to allocate a portion of the One-Half Cent Sales Tax state shared revenue to the MSTU. Sales tax support for the MSTU is $3.8M, which is based on the MSTU’s percentage of total General Fund operating expenses.
o Other Revenues: Pinellas County has traditionally assigned a portion of other revenue sources to the MSTU, generally based on the ratio between the MSTU budget and the overall County General Fund budget. In FY16, those revenues include interest income and excess fees for the Tax Collector and Property Appraiser. These revenues are related to specific MSTU expenditures or to the other MSTU revenues previously identified.
Pinellas County, Florida A-20 FY16 Proposed Budget

OVERVIEW OF THE FY16 BUDGET
Unlike many cities, the County does not impose utility taxes or franchise fees in unincorporated Pinellas. Most city residents pay up to a 10% utility tax and a 6% franchise fee on their electricity bills. MSTU Expenditures MSTU Expenditures include both direct and indirect costs and consist of the following activities:
o Sheriff’s Office Law Enforcement: The Sheriff provides law enforcement services (road patrol) to the unincorporated area. The budget is determined by the Sheriff’s Office based on an analysis of the resources (patrol officers, vehicles, etc.). The methodology for this allocation was reviewed and revised by an independent consultant in 2003. Historically, approximately one-third of the Sheriff’s law enforcement activity is dedicated to the MSTU.
o Departments or Programs entirely dedicated to the MSTU: Several agencies are
engaged in providing services exclusively to the unincorporated area. In the FY16 Budget, these activities are building inspection, development review services, code enforcement, surface water, and lot clearing.
o Departments or Programs partially dedicated to the MSTU: Departments whose
services, and therefore costs, are allocated between countywide and MSTU activities include zoning services and Economic Incentive Grants for job creation.
o Activities associated with revenue collection: The budgets for the elected Property
Appraiser and Tax Collector are determined by statutory formulas that spread their costs in proportion to the property tax and other revenue they are responsible for supporting. Their budgets are approved by the State Department of Revenue. At the end of the fiscal year, any charges in excess of what these agencies actually required to operate are returned in the same manner.
o The FY16 Proposed Budget for the MSTU includes several enhancements:
o An appropriation of $250,000 will support various projects within the MSTU unincorporated areas to enhance quality of life within unincorporated communities.
o In the Parks and Conservation Resources budget, $70,000 is included to support not-for-profit youth sports organizations operating on County-owned property or solely within unincorporated areas of the county to maintain safe and attractive youth sports facilities. Funding will initiate support for each organization and allow evaluation of needs in future years.
Pinellas County, Florida A-21 FY16 Proposed Budget

OVERVIEW OF THE FY16 BUDGET
o In June, the Board of County Commissioners established a community
redevelopment area (CRA) within Lealman to dedicate property tax value increases in this community to programs that will improve opportunities for residents and businesses. Seed money ($50,000) for public outreach and engagement is included in the FY16 Proposed Budget.
The following table summarizes the MSTU budget*:
Program Fund FY15 Budget FY16 Budget Sheriff General 36,670,850 39,010,630 Surface Water Surface
Water 19,126,400 20,097,470
Building Permits Building Services
5,211,390 5,370,330
Development Review Services General 2,254,420 2,732,950 Environmental Code Enforcement General 1,792,050 2,130,090 Planning / Economic Development General 1,719,730 2,048,520 Local Road Program General &
Capital Projects
650,000 650,000
MSTU Projects / Lealman CRA General 0 370,000 Tax Collector & Property Appraiser Fees
General & Surface Water
1,228,280 1,252,070
Total 68,653,120 73,662,060
*Note: Budget does not include Reserves associated with General, Building Services, and Surface Water Utility funds.
Pinellas County, Florida A-22 FY16 Proposed Budget
FUND FORECASTS UPDATE
The Fund Forecasts Update portion of the FY2016 Budget Message describes the changes in the ten-year forecasts for ten of the County’s major funds:
• General Fund
• Tourist Development Council Fund
• Transportation Trust Fund
• Capital Projects Fund
• Emergency Medical Services Fund
• Airport Fund
• Water Funds
• Sewer Funds
• Solid Waste Funds
• Surface Water Fund
This section is presented in two parts:
• Changes to Key Forecast Assumptions discusses the most significant changes to the basic assumptions used in preparing the forecast as compared to the assumptions in the February document.
• Updated Individual Fund Forecasts and Forecast Pro-Formas summarizes the impact of the changes in assumptions and the proposed FY16 Budget on the long-term outlook for each fund, and presents the major assumptions and the revenue and expenditure forecast for the fund for the forecast period.
Changes to Key Forecast Assumptions In February 2015, a comprehensive forecast for fiscal years 2016 through 2021 was presented to the Board of County Commissioners as an initial step in the FY16 budget preparation process. This document assessed the long-term financial health of the County’s funds, and provided the context for making decisions in view of their impact on future revenues and expenditures. As in February, the current consensus of leading economists anticipates continued slow growth and moderate inflation and does not include an economic downturn. We have not attempted to project significant future events such as recessions, oil embargos, or natural disasters. In establishing revenue and expenditure assumptions, we reviewed data and forecasts from a variety of economists, government agencies, industry associations, and other sources. In particular, we referenced the State of Florida’s Revenue Estimating Conferences. The State utilizes a professional, nonpartisan consensus process involving the Legislature, the
Pinellas County, Florida A-23 FY16 Proposed Budget

FUND FORECASTS UPDATE
Governor's Office, and the State's Division of Economic and Demographic Research in developing national and state economic forecasts that are used in all state planning and budgeting actions. The current Conference projections end at FY25. The projections are available online at http://edr.state.fl.us/Content/conferences/index.cfm We also referenced federal agencies such as the Bureau of Labor Statistics, the Census Bureau, the Congressional Budget Office, and several Federal Reserve banks; as well as private research firms and educational institutions. County department and agency staff provided valuable input and review of the assumptions to help ensure that they are reasonable, consistent, and reflect the best judgment of those most familiar with the subject areas. Revised Revenue Assumptions Property Taxes – General Fund After five years of decline, County-wide taxable values increased by 3.4% in FY14 and by 6.5% in FY15. The February forecast anticipated an increase in County-wide taxable values of 4.5% in FY16. The actual increase certified by the Property Appraiser for FY16 is 6.8%. The revised forecast maintains the assumption of annual tax base growth between 3.5% and 4.0% through FY21.
Change in Taxable Values – Countywide FY16 FY17 FY18 FY19 FY20 FY21
Forecast 4.5% 4.0% 4.0% 3.5% 3.5% 3.5% Budget 6.8% 4.0% 4.0% 3.5% 3.5% 3.5%
The General Fund MSTU property tax projections have also been updated based on the actual FY16 certified values. Sales Taxes – General Fund and Capital Projects Fund Sales tax revenues are highly elastic, increasing and falling with the health of the overall economy. Sales tax revenue growth in FY15 has continued to be better than anticipated, resulting in an increase in the projected revenue for FY16. The remainder of the forecast reflects annual growth between 4.0% and 5.0% through FY21.
Change in Half-Cent Sales Tax Revenue FY16 FY17 FY18 FY19 FY20 FY21
Forecast 5.0% 5.0% 4.5% 4.0% 4.0% 4.0% Budget 6.1% 5.0% 4.5% 4.0% 4.0% 4.0%
The growth rate in the Capital Projects Fund for the Infrastructure Sales Tax (Penny for Pinellas) is generally slightly lower than the Half-Cent growth rate, because the Courts & Jail allocation is a fixed amount that does not grow over time, resulting in a slightly smaller growth rate for the County’s overall share of the Penny.
Pinellas County, Florida A-24 FY16 Proposed Budget

FUND FORECASTS UPDATE
Other Fund-Specific Revenues General Fund – State Revenue Sharing State Revenue Sharing is primarily based on the State’s sales tax revenue. The formula for Revenue Sharing is subject to adjustment by the Legislature. Similar to the Half-Cent Sales Tax, Revenue Sharing is expected to exceed expectations during FY15. The remainder of the forecast reflects continuing annual growth between 3.5% and 4.5%, slightly lower than that of the Half-Cent based on long-term historical patterns. Tourist Development Council Fund - Tourist Development Taxes Tourism is a key driver of the economy in Pinellas County. The County imposes a 5.0% tourist development tax (i.e. bed tax) on rents collected for temporary lodgings. The revenue, highly sensitive to general economic and other conditions, is driven by several factors, including the number of visitors, the length of stay, and the Average Daily Rate (ADR) that hotels are able to collect for rentals. Tourist development tax revenues have been steadily improving since Spring 2010 and have reached record levels for the past three years. Continued strong growth has resulted in revised projections. FY15 revenues are now estimated to grow 10.2% compared to the FY14 actuals, and are anticipated to increase 5.0% from this higher level base in FY16. The forecast continues to estimate that revenue will increase through the remainder of the forecast period. Emergency Medical Services Fund – Ambulance Service Contract Fees As a result of a new five-year contract for provision of the County’s Sunstar ambulance service, Ambulance Service Contract fee revenue growth is projected at 4.0% annually, an increase over the 2.0% annual growth anticipated in the February forecast. Water and Sewer Funds –Service Fees Projected growth in Water Service Fees, Sewer Service Fees, and Sewer – Reclaimed revenues reflect the multi-year rate increases approved as part of the FY16 budget process. Revised Expenditure Assumptions Personal Services –All Funds The cost of Personal Services (salaries and benefits) is generally the single largest category of expense for local governments. Personal Services costs for FY16 for each department or agency are based on position-by-position projections and reflect reorganizations, changes in the number of positions, vacancies, and other factors specific to each entity.
Pinellas County, Florida A-25 FY16 Proposed Budget
FUND FORECASTS UPDATE
The February forecast anticipated annual growth in Personal Services costs in FY17 through FY21 between 4.3% and 4.5%. This is the net effect of anticipated wage adjustments and other factors such as changes in health insurance costs and State-mandated employer contributions to the Florida Retirement System (FRS). The assumptions for these forecast years have not changed. Each year, the Florida Legislature adopts the employer FRS contribution rates for the upcoming State Fiscal Year (SFY). As of June 2014, the FRS system was 86.6% funded. The February forecast anticipated that FRS rates would remain the same for SFY16 (July 1, 2015 to June 30, 2016) as for SFY15, since these rates were planned to fully fund the FRS system over time. The rates actually adopted by the Legislature for SFY16 were similar for the Regular Class rate (which applies to most County employees). However, the rate for the Special Risk category increased, which resulted in cost increases for sworn personnel in the Sheriff’s budget. For future years, the forecast continues to assume that having reached a fully funded level, the FRS rates should stabilize. Operating Expenses and Capital Outlay- All Funds There were no significant changes to the State’s projections for cost inflation at recent Economic Estimating Conferences. The forecast continues to reflect Consumer Price Index (CPI) inflation adjustments of approximately 2.0% per year for non-specific expenditures. Other factors are used when warranted by analysis of historical trends and projected conditions. These factors are shown in the fund forecast pro-formas.
Change in Consumer Price Index (CPI) FY17 FY18 FY19 FY20 FY21 1.8% 2.3% 2.3% 2.3% 2.1%
Other Fund-Specific Expenditures Capital Outlay – Water, Sewer, and Solid Waste Funds The Water, Sewer, and Solid Waste capital outlay forecasts reflect the construction and purchase needs as estimated by the Pinellas County Office of Engineering and Technical Support in the CIP ten-year work plan. The timing of projects in these funds has been revised as presented in the updated capital improvement work plan. Updated Individual Fund Forecasts and Forecast Pro-Formas The following pages present the long-term outlook for each of the major funds. A description of the fund and a summary of the forecast are followed by the major assumptions and detailed revenue and expenditure forecast for the fund for the forecast period.
Pinellas County, Florida A-26 FY16 Proposed Budget

GENERAL FUND
Description The General Fund includes the primary governmental functions of the County that are not completely supported by dedicated resources. These activities include, but are not limited to Sheriff’s law enforcement, detention, and corrections; human services; emergency management and communications; parks and leisure services; and the operations of the Property Appraiser, Tax Collector, and Supervisor of Elections. The General Fund includes operations for both county-wide functions and the unincorporated area. These segments are tracked separately within the fund. The unincorporated area is commonly referred to as the MSTU (Municipal Services Taxing Unit). MSTU expenditures are about 8.9% of the total (net of reserves). Summary The General Fund encompasses the principal governmental activities of the County that are not primarily supported by dedicated revenues or by user fees. The four main revenue sources for the General Fund are Property Taxes, State Shared Half-Cent Sales Taxes, State Revenue Sharing, and Communications Services Taxes. There have been several significant changes to the General Fund forecast as presented in February 2015. At that time, taxable values were anticipated to increase by 4.5% county-wide, and by 4.0% for the MSTU, in FY16. The actual increases certified by the Property Appraiser for the FY16 Proposed Budget are 6.8% for county-wide taxable values and 5.0% for MSTU taxable values. Since property taxes are about two-thirds of total General Fund revenue, this had a positive impact on the budget, and therefore the forecast. The continuing solid growth in Half-Cent Sales Tax revenue and in State Revenue Sharing also contributed to an improved revenue picture that helped to accommodate the service enhancements and other adjustments described elsewhere in this document. The forecast projects that the General Fund is essentially balanced throughout the forecast period.
Pinellas County, Florida A-27 FY16 Proposed Budget

GENERAL FUND
Pinellas County, Florida A-28 FY16 Proposed Budget
GENERAL FUND FORECASTFund 0001
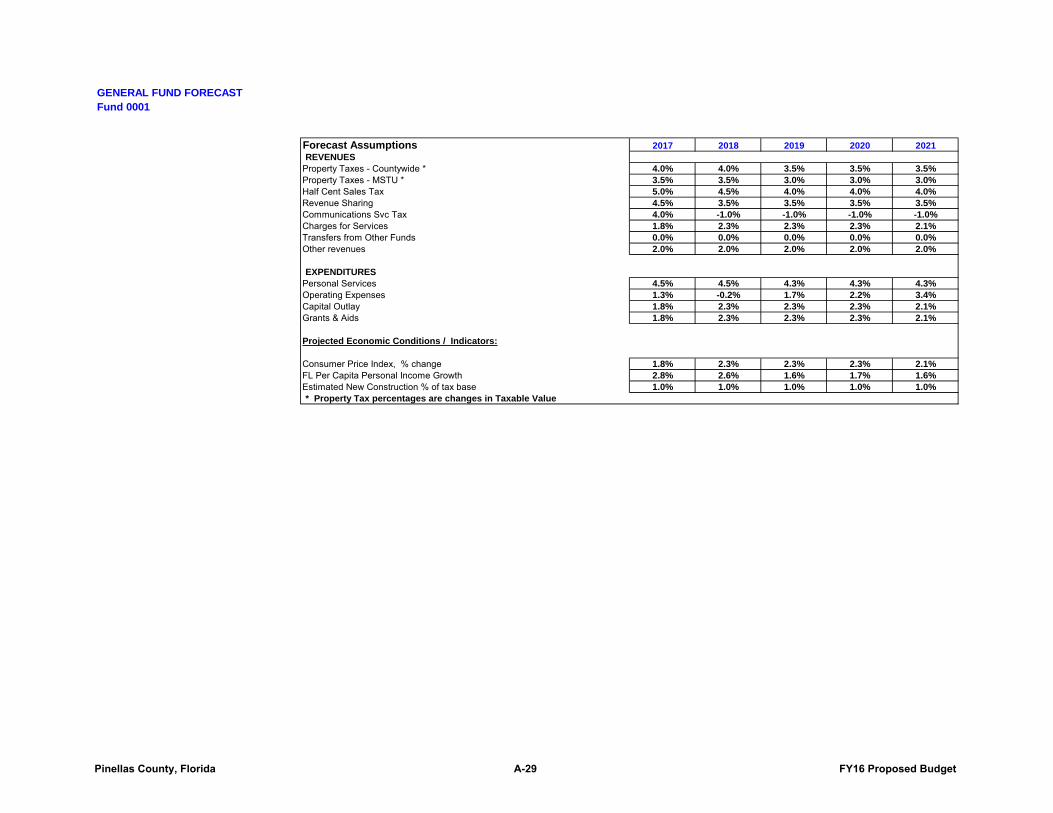
Forecast Assumptions 2017 2018 2019 2020 2021REVENUES
Property Taxes - Countywide * 4.0% 4.0% 3.5% 3.5% 3.5%Property Taxes - MSTU * 3.5% 3.5% 3.0% 3.0% 3.0%Half Cent Sales Tax 5.0% 4.5% 4.0% 4.0% 4.0%Revenue Sharing 4.5% 3.5% 3.5% 3.5% 3.5%Communications Svc Tax 4.0% -1.0% -1.0% -1.0% -1.0%Charges for Services 1.8% 2.3% 2.3% 2.3% 2.1%Transfers from Other Funds 0.0% 0.0% 0.0% 0.0% 0.0%Other revenues 2.0% 2.0% 2.0% 2.0% 2.0%
EXPENDITURESPersonal Services 4.5% 4.5% 4.3% 4.3% 4.3%Operating Expenses 1.3% -0.2% 1.7% 2.2% 3.4%Capital Outlay 1.8% 2.3% 2.3% 2.3% 2.1%Grants & Aids 1.8% 2.3% 2.3% 2.3% 2.1%
Projected Economic Conditions / Indicators:
Consumer Price Index, % change 1.8% 2.3% 2.3% 2.3% 2.1%FL Per Capita Personal Income Growth 2.8% 2.6% 1.6% 1.7% 1.6%Estimated New Construction % of tax base 1.0% 1.0% 1.0% 1.0% 1.0%* Property Tax percentages are changes in Taxable Value
Pinellas County, Florida A-29 FY16 Proposed Budget

GENERAL FUND FORECASTFund 0001
(in $ millions) Actual Budget Estimated Budget Estimated Estimated Estimated Estimated Estimated Estimated2014 2015 2015 2016 2016 2017 2018 2019 2020 2021
BEGINNING FUND BALANCE 111.2 110.5 117.3 110.5 110.5 103.9 100.5 101.8 102.3 103.6
REVENUESProperty Taxes -Countywide 285.3 299.5 302.7 319.2 319.2 332.0 345.3 357.4 369.9 382.8 Property Taxes - MSTU 28.7 29.8 30.1 31.3 31.3 32.4 33.5 34.5 35.5 36.6 Half Cent Sales Tax 40.7 42.3 43.8 44.9 44.9 47.1 49.2 51.2 53.2 55.3 Revenue Sharing 16.1 15.7 17.0 16.9 16.9 17.7 18.3 18.9 19.6 20.3 Communications Svc Tax 10.6 10.5 10.4 10.0 10.0 10.4 10.3 10.2 10.1 10.0 Grants (fed/state/local) 9.8 10.5 9.7 7.6 7.6 7.8 8.0 8.2 8.4 8.6 Interest 0.4 0.5 0.5 0.5 0.5 0.7 1.1 1.4 1.9 2.0 Charges for Services 69.6 69.2 68.2 71.7 71.7 76.3 78.4 80.4 82.4 84.4 Other revenues 12.1 10.3 10.3 13.2 13.2 13.4 13.6 13.8 14.0 14.2
Adjust Property Taxes to 96.0% - - - - 3.7 3.8 4.0 4.1 4.3 4.4 Adjust Major Revenue to 98.0% - - - - 2.3 2.4 2.5 2.5 2.6 2.7 Adjust Other Revenue to 97.0% - - - - 2.0 2.1 2.1 2.2 2.2 2.3 TOTAL REVENUES 473.3 488.3 492.7 515.3 523.3 546.1 566.3 584.8 604.1 623.6
% vs prior year 4.1% 6.2% 4.4% 3.7% 3.3% 3.3% 3.2%
TOTAL RESOURCES 584.5 598.8 610.0 625.8 633.8 650.0 666.8 686.6 706.4 727.2
EXPENDITURESPersonal Services 65.2 72.8 69.1 75.9 75.9 79.3 82.9 86.5 90.2 94.1 Operating Expenses 104.1 115.9 113.0 119.4 119.4 120.9 120.6 122.6 125.3 129.6 Capital Outlay 1.1 2.0 2.0 2.8 2.8 2.9 3.0 3.1 3.2 3.3 Grants & Aids 12.7 19.9 19.6 20.3 20.3 20.8 21.5 22.1 22.7 23.3 Transfers 278.1 297.4 295.8 317.1 317.1 329.5 341.9 354.2 366.8 380.0 Non-recurring expenditures 1.3 - - - - - - - - -
Expenditure Lapse 3.0% ** - - - - (5.6) (5.7) (5.8) (5.9) (6.1) (6.3) Potential Issues:
Non-recurring Transfers to CIP 1.5 1.5 - - - 1.5 1.5 1.5 0.5 - BTS non-recurring project costs 3.2 - - - - - - - - - CIP Operating Impacts (cumulative) - - - - - 0.3 (0.6) 0.2 0.2 0.2
TOTAL EXPENDITURES 467.2 509.5 499.5 535.5 529.9 549.5 565.0 584.3 602.8 624.2 % vs prior year 6.9% 6.1% 3.7% 2.8% 3.4% 3.2% 3.6%
ENDING FUND BALANCE 117.3 89.3 110.5 90.3 103.9 100.5 101.8 102.3 103.6 103.0
Ending balance as % of Resources 14.9% 18.1% 14.4% 16.4% 15.5% 15.3% 14.9% 14.7% 14.2%TOTAL REQUIREMENTS 584.5 598.8 610.0 625.8 633.8 650.0 666.8 686.6 706.4 727.2
REVENUE minus EXPENDITURES 6.1 (21.2) (6.8) (20.2) (6.6) (3.4) 1.3 0.5 1.3 (0.6) (NOT cumulative)
note: non-recurring expenditures 6.1 11.5 11.5 6.6 6.6 1.5 1.5 1.5 0.5 - net recurring rev- exp 12.2 (9.7) 4.7 (13.6) - (1.9) 2.8 2.0 1.8 (0.6)
* Expenditure lapse is calculated on Personal Services, Operating Expenses, Capital Outlay, and Grants & Aids only.
FORECAST
Pinellas County, Florida A-30 FY16 Proposed Budget

TOURIST DEVELOPMENT COUNCIL FUND
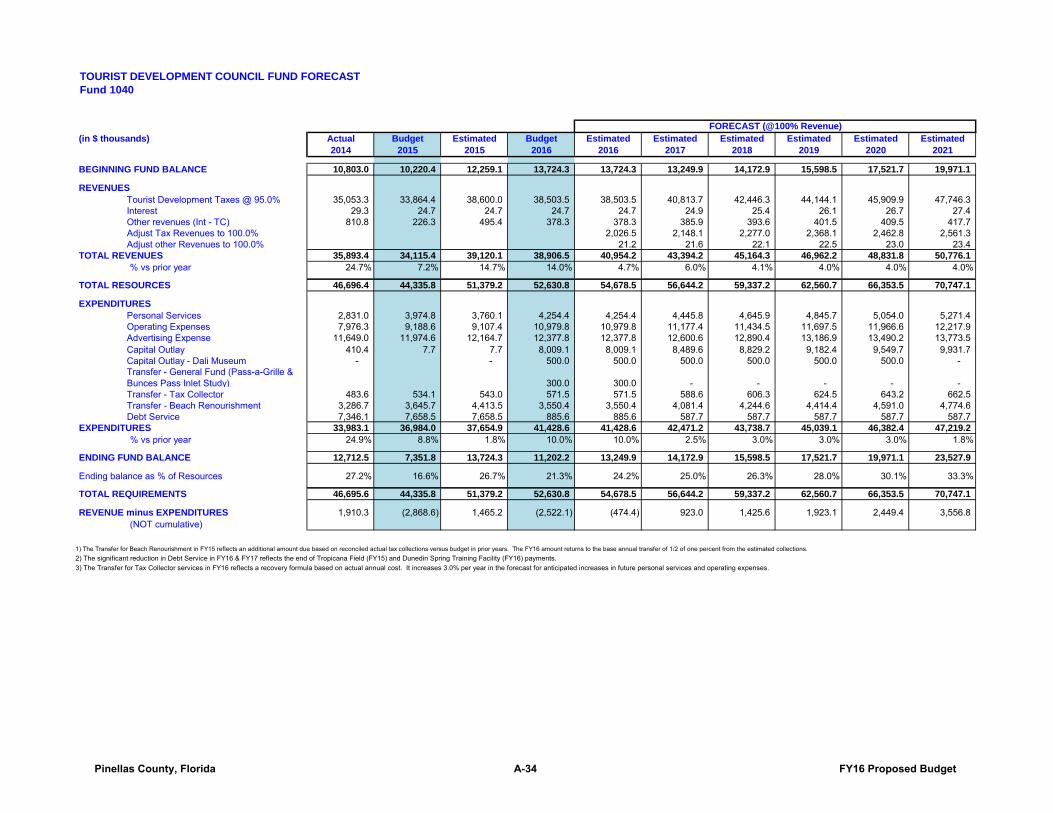
Description The Tourist Development Council (TDC) Fund is a special revenue fund that accounts for the 5.0% Tourist Development Tax (TDT) on rents collected for temporary lodgings. Section 125.0104, Florida Statutes, was enacted by the State in 1977. The Board of County Commissioners (BCC) enacted an ordinance in 1978 to levy a 2.0% tax to promote tourism in Pinellas County, and was approved at a referendum held on October 5, 1978. In 1988, the ordinance was amended to increase the tax by an additional 1.0% with one-half of this amount earmarked to fund beach re-nourishment projects. In January 1996, an additional 1.0% was levied to provide additional funds for promotional activities, beach re-nourishment, and to service debt on the County's obligation to the City of St. Petersburg's bonds for Tropicana Field. In December 2005, an additional 1.0% was levied to provide funding for promoting and advertising tourism. In addition to the current 5.0% TDT, under section 125.0104, once a county generates $600.0M in taxable rents on temporary lodgings, the Florida Department of Revenue will designate the county as a “High Tourism Impact County.” This designation, which Pinellas County received in 2014, allows the County to impose by ordinance an additional 1.0% tax. In Pinellas County, this ordinance would require an extraordinary vote (a majority plus one) by the BCC. The Fund supports the Tourist Development Council, serving as Visit St. Pete/Clearwater through the collection of the TDT, known as the ‘bed tax.’ The ‘bed tax’ is used to enhance the County’s economy by increasing tourism and direct visitor expenditures through marketing, promoting, and supporting the destination. Summary The Tourist Development Council Fund is primarily funded by Tourist Development Tax (TDT) revenues that are extremely sensitive to general economic conditions. Tourist Development Tax revenues have been steadily improving since Spring 2010 and have seen record setting revenues for the past three years. FY15 TDT revenues are estimated to grow 10.2% compared to FY14 actuals, and are anticipated to increase another 5.0% in FY16 and 6.0% in FY17. From FY18 – FY21, revenues are projected to increase by 4.0% annually. Expenditures are projected to increase in step with revenues over the forecast period. At the end of FY15, the County’s obligation to debt service on Tropicana Field expires. This freed up revenue will allow for spending on as-of-yet undesignated projects, as directed by the BCC. In FY16, this amounts to $8.0M for the undesignated projects. Revenues exceed expenditures during the forecast period, and adjustment can be made if revenues fail to meet expectations. The fund maintains reserves between 21.0% and 34.0% throughout the forecast period, well above TDC policy.
Pinellas County, Florida A-31 FY16 Proposed Budget

TOURIST DEVELOPMENT COUNCIL FUND
$28.0
$32.0
$36.0
$40.0
$44.0
$48.0
$52.0
$56.0
$60.0
2016 2017 2018 2019 2020 2021
Mill
ions
Tourist Development Council Fund Forecast FY16 - FY21
TOTAL REVENUES EXPENDITURES
Pinellas County, Florida A-32 FY16 Proposed Budget

TOURIST DEVELOPMENT COUNCIL FUND FORECASTFund 1040
Forecast Assumptions 2017 2018 2019 2020 2021REVENUES
Tourist Development Taxes 6.0% 4.0% 4.0% 4.0% 4.0%Interest 1.0% 2.0% 2.5% 2.5% 2.5%Other revenues (Int - TC) 2.0% 2.0% 2.0% 2.0% 2.0%
EXPENDITURESPersonal Services 4.5% 4.5% 4.3% 4.3% 4.3%Operating Expenses 1.8% 2.3% 2.3% 2.3% 2.1%Advertising Expense 1.8% 2.3% 2.3% 2.3% 2.1%Capital Outlay 1.8% 2.3% 2.3% 2.3% 2.1%
Projected Economic Conditions / Indicators:
Consumer Price Index, % change 1.8% 2.3% 2.3% 2.3% 2.1%FL Per Capita Personal Income Growth 2.8% 2.6% 1.6% 1.7% 1.6%
Pinellas County, Florida A-33 FY16 Proposed Budget
TOURIST DEVELOPMENT COUNCIL FUND FORECASTFund 1040
(in $ thousands) Actual Budget Estimated Budget Estimated Estimated Estimated Estimated Estimated Estimated2014 2015 2015 2016 2016 2017 2018 2019 2020 2021
BEGINNING FUND BALANCE 10,803.0 10,220.4 12,259.1 13,724.3 13,724.3 13,249.9 14,172.9 15,598.5 17,521.7 19,971.1
REVENUESTourist Development Taxes @ 95.0% 35,053.3 33,864.4 38,600.0 38,503.5 38,503.5 40,813.7 42,446.3 44,144.1 45,909.9 47,746.3 Interest 29.3 24.7 24.7 24.7 24.7 24.9 25.4 26.1 26.7 27.4 Other revenues (Int - TC) 810.8 226.3 495.4 378.3 378.3 385.9 393.6 401.5 409.5 417.7 Adjust Tax Revenues to 100.0% 2,026.5 2,148.1 2,277.0 2,368.1 2,462.8 2,561.3 Adjust other Revenues to 100.0% 21.2 21.6 22.1 22.5 23.0 23.4
TOTAL REVENUES 35,893.4 34,115.4 39,120.1 38,906.5 40,954.2 43,394.2 45,164.3 46,962.2 48,831.8 50,776.1 % vs prior year 24.7% 7.2% 14.7% 14.0% 4.7% 6.0% 4.1% 4.0% 4.0% 4.0%
TOTAL RESOURCES 46,696.4 44,335.8 51,379.2 52,630.8 54,678.5 56,644.2 59,337.2 62,560.7 66,353.5 70,747.1
EXPENDITURESPersonal Services 2,831.0 3,974.8 3,760.1 4,254.4 4,254.4 4,445.8 4,645.9 4,845.7 5,054.0 5,271.4 Operating Expenses 7,976.3 9,188.6 9,107.4 10,979.8 10,979.8 11,177.4 11,434.5 11,697.5 11,966.6 12,217.9 Advertising Expense 11,649.0 11,974.6 12,164.7 12,377.8 12,377.8 12,600.6 12,890.4 13,186.9 13,490.2 13,773.5 Capital Outlay 410.4 7.7 7.7 8,009.1 8,009.1 8,489.6 8,829.2 9,182.4 9,549.7 9,931.7 Capital Outlay - Dali Museum - - 500.0 500.0 500.0 500.0 500.0 500.0 - Transfer - General Fund (Pass-a-Grille & Bunces Pass Inlet Study) 300.0 300.0 - - - - - Transfer - Tax Collector 483.6 534.1 543.0 571.5 571.5 588.6 606.3 624.5 643.2 662.5 Transfer - Beach Renourishment 3,286.7 3,645.7 4,413.5 3,550.4 3,550.4 4,081.4 4,244.6 4,414.4 4,591.0 4,774.6 Debt Service 7,346.1 7,658.5 7,658.5 885.6 885.6 587.7 587.7 587.7 587.7 587.7
EXPENDITURES 33,983.1 36,984.0 37,654.9 41,428.6 41,428.6 42,471.2 43,738.7 45,039.1 46,382.4 47,219.2 % vs prior year 24.9% 8.8% 1.8% 10.0% 10.0% 2.5% 3.0% 3.0% 3.0% 1.8%
ENDING FUND BALANCE 12,712.5 7,351.8 13,724.3 11,202.2 13,249.9 14,172.9 15,598.5 17,521.7 19,971.1 23,527.9
Ending balance as % of Resources 27.2% 16.6% 26.7% 21.3% 24.2% 25.0% 26.3% 28.0% 30.1% 33.3%
TOTAL REQUIREMENTS 46,695.6 44,335.8 51,379.2 52,630.8 54,678.5 56,644.2 59,337.2 62,560.7 66,353.5 70,747.1
REVENUE minus EXPENDITURES 1,910.3 (2,868.6) 1,465.2 (2,522.1) (474.4) 923.0 1,425.6 1,923.1 2,449.4 3,556.8 (NOT cumulative)
1) The Transfer for Beach Renourishment in FY15 reflects an additional amount due based on reconciled actual tax collections versus budget in prior years. The FY16 amount returns to the base annual transfer of 1/2 of one percent from the estimated collections.2) The significant reduction in Debt Service in FY16 & FY17 reflects the end of Tropicana Field (FY15) and Dunedin Spring Training Facility (FY16) payments. 3) The Transfer for Tax Collector services in FY16 reflects a recovery formula based on actual annual cost. It increases 3.0% per year in the forecast for anticipated increases in future personal services and operating expenses.
FORECAST (@100% Revenue)
Pinellas County, Florida A-34 FY16 Proposed Budget

TRANSPORTATION TRUST FUND
Description The County Transportation Trust Fund is a special revenue fund required by Florida Statute 336.022 to account for revenues and expenditures used for the operation and maintenance of transportation facilities and associated drainage infrastructure. Activities include road and right-of-way maintenance (e.g., patching, mowing), bridge maintenance and operation, traffic engineering, traffic signal operation including Intelligent Transportation Systems, traffic control signage and striping, sidewalk repair and construction, and maintenance of ditches, culverts and other drainage facilities. Resources to support these activities are provided from fuel taxes collected and distributed on a shared basis to all Florida Counties by the State of Florida, and local option fuel taxes levied by the County. Two local option taxes have been imposed by the Board of County Commissioners. The most recent was a one cent levy (referred to by statute as the “Ninth Cent”) that began January 2007. It is dedicated to the installation, operation, and maintenance of the Intelligent Transportation Systems (ITS). The other local levy is the Six Cent Local Option Fuel Tax (LOFT) per gallon tax that is shared by interlocal agreement between the County and all municipalities within Pinellas County. The County’s share of collections is 60.0% of total receipts and the municipalities receive portions of the remaining 40.0%. The levy and the interlocal agreement expire on December 31, 2017; however, action is currently underway to extend both the agreement and the Six Cent Local Option Fuel Tax for an additional ten years. Summary The Transportation Trust Fund is primarily funded by state and local fuel taxes and has been impacted in the recent past by a downturn in collections due to the recession's effect on the number of miles driven and gallons of fuel sold. Future revenue is projected to now show a gradual incline but not keep pace with inflationary increases for expenditures in this fund. This reflects the built out nature of Pinellas County, more efficient cars and fuel conservation efforts, as well as restrictions imposed by State law that does not allow indexing fuel taxes for inflation. The forecast for the Transportation Trust Fund indicates that expenditures exceed revenues beginning in FY15. In the short-term, fund balance is used to offset this variance in the fund; however, with the expiration of the Six Cent Local Option Fuel Tax in December 2017, the fund balance will be depleted by the end of FY19. Even if this tax is renewed, action will still be necessary by the end of the forecast period due to growing imbalances resulting from inflationary pressures on expenditures coupled with the projected slow growth in fuel tax collections. Potential actions to consider are revenue transfers from the General Fund, imposition of additional local option fuel taxes (beyond the current amounts), or reductions in current service levels.
Pinellas County, Florida A-35 FY16 Proposed Budget

TRANSPORTATION TRUST FUND
Pinellas County, Florida A-36 FY16 Proposed Budget
TRANSPORTATION TRUST FUND FORECASTFund 1001
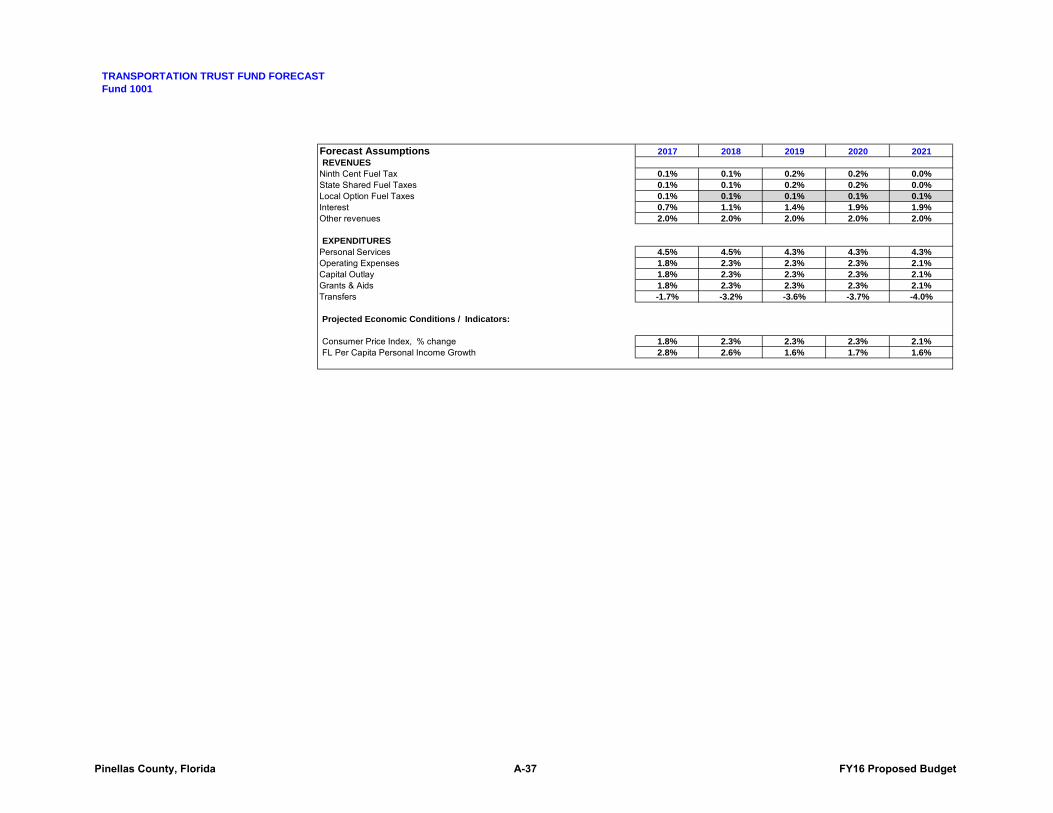
Forecast Assumptions 2017 2018 2019 2020 2021REVENUES
Ninth Cent Fuel Tax 0.1% 0.1% 0.2% 0.2% 0.0%State Shared Fuel Taxes 0.1% 0.1% 0.2% 0.2% 0.0%Local Option Fuel Taxes 0.1% 0.1% 0.1% 0.1% 0.1%Interest 0.7% 1.1% 1.4% 1.9% 1.9%Other revenues 2.0% 2.0% 2.0% 2.0% 2.0%
EXPENDITURESPersonal Services 4.5% 4.5% 4.3% 4.3% 4.3%Operating Expenses 1.8% 2.3% 2.3% 2.3% 2.1%Capital Outlay 1.8% 2.3% 2.3% 2.3% 2.1%Grants & Aids 1.8% 2.3% 2.3% 2.3% 2.1%Transfers -1.7% -3.2% -3.6% -3.7% -4.0%
Projected Economic Conditions / Indicators:
Consumer Price Index, % change 1.8% 2.3% 2.3% 2.3% 2.1%FL Per Capita Personal Income Growth 2.8% 2.6% 1.6% 1.7% 1.6%
Pinellas County, Florida A-37 FY16 Proposed Budget

TRANSPORTATION TRUST FUND FORECASTFund 1001
(in $ thousands) Actual Budget Estimated Budget Estimated Estimated Estimated Estimated Estimated Estimated2014 2015 2015 2016 2016 2017 2018 2019 2020 2021
BEGINNING FUND BALANCE 22,740.8 24,019.5 27,930.4 28,358.3 28,358.3 24,762.2 19,652.4 5,139.0 (13,236.8) (31,978.1)
REVENUESNinth Cent Fuel Tax @ 95% 3,882.4 3,742.9 3,742.9 3,559.3 3,559.3 3,562.8 3,566.4 3,573.5 3,580.7 3,580.7 State Shared Fuel Taxes @ 95% 9,753.3 9,443.2 9,994.5 8,980.0 8,980.0 8,989.0 8,998.0 9,016.0 9,034.0 9,034.0 Local Option Fuel Tax @ 95% *** 12,940.2 12,367.0 12,943.5 11,760.4 11,760.4 11,772.2 3,573.9 838.1 838.9 839.8 Interest 41.2 46.6 81.9 80.5 80.5 173.3 216.2 71.9 - - Other revenues 1,915.4 1,472.5 1,679.6 1,701.9 1,701.9 1,735.9 1,770.6 1,806.0 1,842.2 1,879.0 Adjust Fuel Taxes to 100% 1,278.9 1,280.2 849.4 706.7 708.1 708.1 Adjust Other Revenue to 98.0% 56.3 60.3 62.7 59.3 58.2 59.3
TOTAL REVENUES 28,532.6 27,072.2 28,442.3 26,082.0 27,417.2 27,573.7 19,037.2 16,071.6 16,062.0 16,100.9 % vs prior year -5.1% -0.3% -3.7% -3.6% 0.6% -31.0% -15.6% -0.1% 0.2%
TOTAL RESOURCES 51,273.4 51,091.7 56,372.7 54,440.3 55,775.5 52,336.0 38,689.6 21,210.6 2,825.2 (15,877.2)
EXPENDITURESPersonal Services 10,739.7 10,851.9 10,741.1 11,746.6 11,746.6 12,275.2 12,827.5 13,379.1 13,954.4 14,554.5 Operating Expenses * 8,660.8 12,724.3 12,964.8 14,710.2 14,710.2 14,975.0 15,319.4 15,671.7 16,032.2 16,368.9 Capital Outlay 67.8 467.3 487.0 335.2 335.2 341.2 349.1 357.1 365.3 373.0 Grants & Aids 29.9 33.3 33.0 34.0 34.0 34.6 35.4 36.2 37.0 37.8 Full Cost Allocation 1,688.8 2,004.4 2,004.4 2,701.7 2,701.7 2,720.6 2,750.5 2,789.0 2,842.0 2,896.0 Transfers to Capital Funds 2,156.0 1,784.2 1,784.2 1,753.9 1,753.9 1,697.8 1,635.9 1,575.7 1,513.2 1,441.0 Expenditure Lapse 1.0% ** (268.3) (276.3) (285.3) (294.4) (303.9) (313.3) Potential Issues:CIP Operating Impacts - 915.5 918.0 933.0 363.0 798.0
TOTAL EXPENDITURES 23,342.9 27,865.4 28,014.5 31,281.5 31,013.2 32,683.6 33,550.5 34,447.4 34,803.3 36,155.8 % vs prior year 19.4% 20.0% 12.3% 10.7% 5.4% 2.7% 2.7% 1.0% 3.9%
ENDING FUND BALANCE 27,930.4 23,226.3 28,358.3 23,158.8 24,762.2 19,652.4 5,139.0 (13,236.8) (31,978.1) (52,033.0) ASSUMING NO ACTION TAKEN TORESOLVE SHORTFALLS
Ending balance as % of Resources 45.5% 50.3% 42.5% 44.4% 37.6% 13.3% n/a n/a n/a
TOTAL REQUIREMENTS 51,273.4 51,091.7 56,372.7 54,440.3 55,775.5 52,336.0 38,689.6 21,210.6 2,825.2 (15,877.2)
REVENUE minus EXPENDITURES 5,189.6 (793.3) 427.8 (5,199.5) (3,596.0) (5,109.9) (14,513.3) (18,375.8) (18,741.3) (20,054.9) (NOT cumulative)note: non-recurring expenditures - - - - - - - - - net recurring rev- exp 5,189.6 (793.3) 427.8 (5,199.5) (3,596.0) (5,109.9) (14,513.3) (18,375.8) (18,741.3) (20,054.9)
* Operating Expenses net of Full Cost Allocation** Expenditure lapse is calculated on Personal Services, Operating Expenses, Capital Outlay, and Grants & Aids only.*** Local Option Fuel Tax and interlocal agreement expires December 31, 2017. The forecast assumes no renewal. Revenue remaining related to 6-cent tax on diesel fuel that is applied statewide.
FORECAST (@100%)
Pinellas County, Florida A-38 FY16 Proposed Budget

CAPITAL PROJECTS FUND
Description The Capital Projects Fund is used to account for all governmental capital projects throughout the County. Such projects include roads, bridges, drainage, beach nourishment, park development, and construction of facilities necessary to provide County services. Summary This Fund’s primary revenue source is the “Penny for Pinellas” one cent local option sales tax that is sensitive to general economic conditions. Penny tax revenues declined for several years instead of increasing at the original projected rate due to the Great Recession, but are predicted to increase gradually during the forecast period matching general economic growth as part of the recovery in the local, state, and national economy. With the planned use of fund balance, the forecast for the Capital Projects Fund shows that the Fund is balanced over the forecast period through FY20. The current “Penny for Pinellas” one cent local option sales tax ends December 31, 2019. Projects that would need to continue such as sidewalks, paving and bridges are shown in the forecast as “unfunded” for FY20 – FY21. This is a preliminary estimate of projects that would require a funding source regardless if the Penny is not renewed. During several years of the forecast, expenditures exceed revenues due to project schedules. Additional cash flow required to fund projects is being addressed through an interfund loan from the Solid Waste Renewal & Replacement Fund. The forecast includes repayment of the loan from FY18 – FY20.
Pinellas County, Florida A-39 FY16 Proposed Budget

Pinellas County, Florida A-40 FY16 Proposed Budget

CAPITAL PROJECTS FUND FORECASTFund 3001
Forecast Assumptions 2017 2018 2019 2020 2021REVENUES
Infrastructure Sales Tax 4.5% 4.0% 3.5% 3.5%Ninth Cent Gas Tax (from Transp Trust) -3.2% -3.6% -3.7% -4.0% -4.8%Impact Fees (from Special Revenue Fund) 0.0% 0.0% 0.0% 0.0% 0.0%Grants -17.7% -29.3% 4.2% -59.6% -76.8%Transfer from TDC Fund 12.8% 4.0% 4.0% 4.0% 4.0%Interest Rate 0.7% 1.1% 1.4% 1.9% 1.9%Other revenues 2.0% 2.0% 2.0% 2.0% 2.0%
Projected Economic Conditions / Indicators:Consumer Price Index, % change 1.8% 2.3% 2.3% 2.3% 2.1%
Pinellas County, Florida A-41 FY16 Proposed Budget

CAPITAL PROJECTS FUND FORECASTFund 3001
(in $ thousands) Actual Budget Estimated Budget Estimated Estimated Estimated Estimated Estimated Estimated2014 2015 2015 2016 2016 2017 2018 2019 2020 2021
BEGINNING FUND BALANCE 74,576.6 71,918.0 74,976.1 75,038.2 75,038.4 34,784.5 15,586.2 5,545.2 3,791.9 (45,005.0)
REVENUESInfrastructure Sales Tax (Penny for Pinellas) 84,788.7 83,173.5 89,875.0 89,650.6 94,369.0 98,615.6 102,560.2 106,149.8 27,466.3 - Grants 19,468.0 25,762.0 12,952.8 23,573.2 23,573.2 19,405.7 13,715.5 14,291.0 5,771.5 1,338.3 Ninth Cent Gas Tax (Transfer from Transportation Trust Fund) 2,156.0 1,784.2 1,784.2 1,753.9 1,753.9 1,697.8 1,635.9 1,575.7 1,513.2 1,441.0 Transportation Impact Fees (from Special Revenue Fund) 1,345.4 1,594.2 1,594.2 1,535.6 1,535.6 1,535.6 1,535.6 1,535.6 1,535.6 1,535.6 Transfer from General Fund 2,450.0 2,450.0 650.0 - - 2,150.0 2,150.0 2,150.0 1,150.0 650.0 Transfer from TDC Fund 3,286.7 3,645.7 4,413.5 3,550.4 3,550.4 4,003.6 4,163.7 4,330.3 4,503.5 4,683.6 Sutherland Bayou Marina Mitig. Pymnt 1.2 - 1.5 - - - - - - Compensation for Loss 712.0 770.0 - - - - - - - Interest @ 95% 157.1 367.8 284.2 276.5 285.0 365.2 263.2 140.5 84.3 0.0Interest Adjusted to 97% 7.7 6.0 6.0 7.7 5.5 3.0 1.8 - Other revenues 119.8 8.0 1,293.6 7.7 8.1 8.3 8.4 8.6 8.8 8.9 Interfund Loan-Solid Waste - - - - 35,000.0 - - - -
TOTAL REVENUES 114,484.9 119,563.1 112,855.0 120,347.9 125,081.2 162,789.4 126,038.1 130,184.5 42,034.9 9,657.5 % vs prior year -5.6% 10.8% 30.1% -22.6% 3.3% -67.7% -77.0%
TOTAL RESOURCES 189,061.5 191,481.0 187,831.1 195,386.1 200,119.6 197,573.9 141,624.3 135,729.7 45,826.7 (35,347.5)
EXPENDITURESCapital Projects 114,059.4 137,256.6 97,792.7 165,285.1 165,285.1 181,967.3 123,765.6 119,706.8 42,844.0 9,227.1 Transfer to General Fund 50.0 50.0 Unfunded - - - - - - - - 36,970.3 62,085.0 Debt Service on Interfund Loan 26.0 - - - - 20.4 313.5 231.0 17.4 - Payment on SW Loan - 15,000.0 15,000.0 - - - 12,000.0 12,000.0 11,000.0 -
TOTAL EXPENDITURES 114,085.4 152,256.6 112,792.7 165,335.1 165,335.1 181,987.7 136,079.1 131,937.8 90,831.7 71,312.1 % vs prior year
ENDING FUND BALANCE 74,976.1 39,224.4 75,038.4 30,051.0 34,784.5 15,586.2 5,545.2 3,791.9 (45,005.0) (106,659.6) Ending balance as % of Resources 20.5% 39.9% 15.4% 17.4% 7.9% 3.9% 2.8% -98.2% 301.7%
TOTAL REQUIREMENTS 189,061.5 191,481.0 187,831.1 195,386.1 200,119.6 197,573.9 141,624.3 135,729.7 45,826.7 (35,347.5)
REVENUE minus EXPENDITURES 399.5 (32,693.5) 62.3 (44,987.2) (40,253.9) (19,198.3) (10,041.0) (1,753.3) (48,796.8) (61,654.6) (NOT cumulative)net recurring rev- exp 399.5 (32,693.5) 62.3 (44,987.2) (40,253.9) (19,198.3) (10,041.0) (1,753.3) (48,796.8) (61,654.6)
Note: Current Penny ends December 31, 2019. Projects that would need to continue such as sidewalks, paving, bridges, etc. are shown as "unfunded" for the remainder of FY20 and out years.
FORECAST
Pinellas County, Florida A-42 FY16 Proposed Budget

EMERGENCY MEDICAL SERVICE FUND
Description The Emergency Medical Service (EMS) Fund is a special revenue fund established by referendum in 1980, which allows up to 1.5 mills to be levied annually on a county-wide basis to finance the operation of a comprehensive county-wide emergency medical service system. This system provides advanced life support, emergency medical response, and transport services to all residents and visitors of Pinellas County. The County maintains EMS contracts with 18 fire service agencies (first responders), and one ambulance provider (Paramedics Plus, operating in Pinellas County under the trade name “Sunstar”). The EMS System is funded by a combination of property taxes and ambulance user fees. The ambulance user fees support the ambulance contractual expenditures and property taxes support the first responder expenditures. The EMS System was established by referendum in 1980 by the Special Act (Chapter 80-585, Laws of Florida) that created the EMS Authority as a Dependent Special District. In 1988, Pinellas County Ordinance 88-12 solidified the current EMS system design. The Fiscal Policy guidelines within Ordinance 88-12 state that the Board of County Commissioners, sitting as the Emergency Medical Services Authority, directs the following fiscal policy guidelines that govern the financial operations of the County’s EMS system: (a) to establish sound business controls and long term cost containment incentives throughout the County EMS system; (b) to provide adequate funding to upgrade all EMS components to state-of-the-art-levels, and to maintain that progress in future years; (c) to provide for long term financial stability sufficient to sustain quality EMS operations far into the future; (d) to reduce the County EMS system’s excessive dependence upon local tax support by developing a more balanced approach to EMS funding; and (e) to provide the Board of County Commissioners with a wider range of EMS financing options than have been available in the past. Summary The EMS Fund is sensitive to property values as it is funded by ad valorem (property) tax revenue collected from property owners countywide and ambulance user fee revenues. Property tax revenues declined dramatically in recent years due to the impact of statewide legislation on property taxes and a downturn in property values. While the millage rate remained flat at 0.5832 from FY08 through FY11, annual property tax revenue fell from $42.6M to $30.6M. Increasing deficits were covered with fund balance until accumulated reserves dropped to 25.0% in FY11. Board adopted policy reduced the target level for reserves from 33.0% to 25.0% in December 2011. With property values still falling, the millage rate was increased to 0.8506 in FY12 and to 0.9158 in FY13. Revenue increased enough to meet expenses and maintain the EMS Fund’s reserve at 25.0%. Since FY13, the millage rate has remained at 0.9158. Property values rose in FY14 and FY15, and with continued economic recovery, property tax revenue is projected to increase 7.1% in FY16. While projections for the EMS Fund still indicate the Fund is not balanced over the forecast period, the outlook has improved due to increased revenue from growth in property values and negotiated savings in first responder agreements with the 18 service providers for FY15 - FY17. The first responder expense budget was increased by $725,400 in FY16 to support ongoing training associated with water rescue and specialized technical rescue. First responder expense will also increase with an additional rescue vehicle in Tierra Verde for improved beach access, additional service in the 49th Street Corridor, and reinstatement of Squad 26 to meet high service demand in Indian Shores and the Redington Beaches. A new 5-year contract for provision of the County’s Sunstar ambulance service will begin in FY16, with the addition of four
Pinellas County, Florida A-43 FY16 Proposed Budget

EMERGENCY MEDICAL SERVICE FUND
ambulances to meet increased service demand. Sunstar system expenses are projected to increase by 4% per year beyond FY16, accompanied by a 4% annual increase in ambulance fee revenues. With these known changes, the current millage of 0.9158 is projected to support the service delivery system and allow the fund to remain above the Board adopted reserve target of 25.0% through FY20. The potential for maintaining the 25.0% reserve without a future millage rate increase will be affected by changes in property values, potential changes to Medicare/Medicaid reimbursements, and adjustments in future service agreements with the first responders and ambulance service provider. For FY18 and FY19 this forecast projects two potential 1-year extensions for first responder agreements, with expense growth at 3.3% per year. This reflects parameters in the extensions that tie increases to annual growth in the CPI (2.3%) with a potential additional 1.0% for qualified expenses. The forecast projects FY20 and FY21 adjustments for first responder agreements at 4.0%. Progress in containing costs, combined with better than anticipated growth in revenue, improves the outlook for the EMS Fund over the next six years. Long term sustainability will require continued growth in revenue and diligent management of system costs.
Pinellas County, Florida A-44 FY16 Proposed Budget

EMERGENCY MEDICAL SERVICES FUND FORECASTFund 1006
Forecast Assumptions 2017 2018 2019 2020 2021REVENUES
Ad Valorem Revenue (@95%) 4.0% 4.0% 3.5% 3.5% 3.5%Ambulance Svc Contract Fees 4.0% 4.0% 4.0% 4.0% 4.0%Grant Revenue (EMS Trust Fund) 2.0% 2.0% 2.0% 2.0% 2.0%
EXPENDITURESPersonal Services 4.5% 4.5% 4.3% 4.3% 4.3%Operating Expenses 1.8% 2.3% 2.3% 2.3% 2.1%Operating Expenses-First Resp Med Supplies 3.0% 3.0% 3.0% 3.0% 3.0%Capital Outlay 1.8% 2.3% 2.3% 2.3% 2.1%Ambulance Contract 4.0% 4.0% 4.0% 4.0% 4.0%EMS Trust Fund Grant Expenditures 2.0% 2.0% 2.0% 2.0% 2.0%Grants & Aids (First Responder Agmts) 7.5% 3.3% 3.3% 4.0% 4.0%
Projected Economic Conditions / Indicators:Consumer Price Index, % change 1.8% 2.3% 2.3% 2.3% 2.1%FL Per Capita Personal Income Growth 2.8% 2.6% 1.6% 1.7% 1.6%Estimated New Construction % of tax base 1.0% 1.0% 1.0% 1.0% 1.0%
Pinellas County, Florida A-45 FY16 Proposed Budget

EMERGENCY MEDICAL SERVICES FUND FORECASTFund 1006
(in $ thousands) Actual Budget Estimated Budget Estimated Estimated Estimated Estimated Estimated Estimated2014 2015 2015 2016 2016 2017 2018 2019 2020 2021
BEGINNING FUND BALANCE 23,930.8 24,138.2 27,566.1 32,102.2 32,102.2 32,600.7 31,291.9 30,492.7 30,228.0 29,946.9
REVENUESAd Valorem Revenue @95% 46,017.0 48,287.3 48,708.5 51,637.7 51,637.7 53,703.2 55,851.3 57,806.1 59,829.3 61,923.4 Ambulance Svc Contract Fees @ 95% 45,810.0 45,964.3 49,517.9 47,300.2 47,300.2 49,192.2 51,159.9 53,206.3 55,334.5 57,547.9 Ambulance Annual Members Fees 245.6 237.5 235.0 188.9 188.9 188.9 188.9 188.9 188.9 188.9 Grant Revenue (EMS Trust Fund) 302.2 225.0 157.5 200.0 200.0 204.0 208.1 212.2 216.5 220.8 Cty Off Fees (TC & PA) 305.8 276.3 310.8 308.0 308.0 311.1 314.2 317.3 320.5 323.7 Interest 91.1 90.2 150.0 142.5 142.5 228.2 344.2 426.9 574.3 569.0 Refund of prior yrs exp 2,660.7 - - - - - - - - - Other revenues 42.4 44.7 101.3 54.2 54.2 54.2 54.2 54.2 54.2 54.2
Adjust Tax Revenues to 96% 543.6 565.3 587.9 608.5 629.8 651.8 Adjust Ambulance Revenues to 100% 2,499.4 2,599.0 2,702.6 2,810.3 2,922.3 3,038.8
TOTAL REVENUES 95,474.8 95,125.3 99,181.0 99,831.5 102,874.5 107,046.1 111,411.3 115,630.8 120,070.4 124,518.5 % vs prior year 3.9% 4.9% 3.7% 4.1% 4.1% 3.8% 3.8% 3.7%
TOTAL RESOURCES 119,405.6 119,263.5 126,747.1 131,933.7 134,976.6 139,646.8 142,703.2 146,123.5 150,298.4 154,465.4
EXPENDITURESPersonal Services 3,211.3 3,499.5 3,289.5 3,568.5 3,568.5 3,729.0 3,896.8 4,064.4 4,239.2 4,421.5 Operating Expenses 5,457.4 5,636.4 5,540.9 6,480.2 6,480.2 6,596.9 6,748.6 6,903.8 7,062.6 7,210.9
Operating Expenses - First Responder Medical Supplies 1,223.3 1,318.2 1,318.2 1,224.0 1,224.0 1,260.7 1,298.5 1,337.5 1,377.6 1,419.0 Capital Outlay 688.9 626.3 628.8 1,495.2 1,495.2 1,522.1 1,557.1 1,592.9 1,629.6 1,663.8 Ambulance Contract 39,128.5 40,651.7 40,651.7 43,776.0 43,776.0 45,527.0 47,348.1 49,242.0 51,211.7 53,260.2 EMS Trust Fund Grant Expenditures 302.2 225.0 157.5 200.0 200.0 204.0 208.1 212.2 216.5 220.8 Grants & Aids (First Responder Agmts) 40,474.2 41,526.2 41,611.4 43,012.6 43,012.6 46,244.3 47,770.4 49,346.8 51,320.7 53,373.5 Grants & Aids (First Responder Capital) - - - 1,070.0 1,070.0 1,100.0 1,125.3 1,151.2 1,177.7 1,204.7 Trfrs to PA & TC 1,353.7 1,448.1 1,447.0 1,549.5 1,549.5 2,170.7 2,257.6 2,044.5 2,116.1 2,190.1
TOTAL EXPENDITURES 91,839.5 94,931.4 94,644.9 102,376.0 102,376.0 108,354.8 112,210.5 115,895.4 120,351.6 124,964.5 % vs prior year 3.1% 7.8% 8.2% 5.8% 3.6% 3.3% 3.8% 3.8%
ENDING FUND BALANCE 27,566.1 24,332.1 32,102.2 29,557.7 32,600.7 31,291.9 30,492.7 30,228.0 29,946.9 29,500.9 Ending balance as % of Expenditures 30.0% 25.6% 33.9% 28.9% 31.8% 28.9% 27.2% 26.1% 24.9% 23.6%TOTAL REQUIREMENTS 119,405.6 119,263.5 126,747.1 131,933.7 134,976.6 139,646.8 142,703.2 146,123.5 150,298.4 154,465.4
REVENUE minus EXPENDITURES (NOT cumulative) 3,635.3 193.9 4,536.1 (2,544.5) 498.5 (1,308.7) (799.2) (264.7) (281.2) (446.0)
1) Through FY21, the fund reflects the new ordinance passed by Board action on December 20th, 2011, to maintain as close as possible, a 25% Beginning Fund Balance. 2) EMS Millage increased from 0.8506 in FY12 to 0.9158 in FY13, remained flat through FY15, and is assumed at 0.9158 through the forecast period. Maximum annual EMS levy is 1.5000 mills.3) The First Responder Agreements reflect the negotiated compensation for FY15 through FY17. First Responder service levels are increased in FY17 with three (3) priority additions: 49th Street Corridor, additional Tierra Verde vehicle, and reinstatement of Squad 25 to serve Indian Shores and the Redington Beaches (increased cost totals $1,275,550). The First Respnder Agreements for FY18 and FY19 reflect potential 1-year extensions, with an annual adjustment based on the Consumer Price Index and potential additional 1%. The First Responder Agreements for FY20 and FY21 reflect potential annual adjustments in line with ambulance service assumptions. 4) Increased support for Water Rescue and Technical Rescue training are added to the base budget at a cost of $725,400 in FY17.5) The Expenditure lapse is not calculated on this fund as the majority of the expenditures within this fund are contractual and are fully expended each year.
FORECAST (@ 96% Ad Valorem Revenue and @100% Ambulance Revenue)
Pinellas County, Florida A-46 FY16 Proposed Budget

AIRPORT FUND
Description In March 1941 construction started for the St. Pete-Clearwater International Airport (Airport) at its present site. After Pearl Harbor, the Airport, known as Pinellas Army Airfield, was used as a military flight-training base. After World War II, many army airfields were declared surplus and turned over to cities, counties, and state sponsors to manage. The Pinellas Army Airfield property was granted to Pinellas County by the U.S. Government to operate as a commercial airport. It was originally called the Pinellas International Airport, and given the airport call letters, PIE. The Airport Revenue and Operating Fund is used to account for the self-supporting operations of the Airport. Of the Airport’s 2,000 acres, approximately half is dedicated to the airfield, terminal building, and car parking. The remaining acreage includes the 129 acre future planned development site (formerly the Airco Golf course), a 200 acre Airport Business Center, and leased industrial, commercial, and governmental operations. All of the Airport property is designated as a Foreign Trade Zone. All activities necessary for airport operations (e.g. administration, operating, and maintenance expenses) are included in this fund. Also included are airport capital improvements, which typically receive federal and state grant funding of up to 95.0% of costs, depending on the type of project, with some projects funded 100.0% when Passenger Facility Charges are included. The St. Pete - Clearwater International Airport in 2013 unveiled a major re-branding effort to better promote the Airport. In 2014, the Airport reaped the benefits. At the annual Governor’s Conference on Tourism the Airport received the Flagler Award for Best in Show at a Budget Level Less than $100,000 for its rebranding. It was the first time in the Flagler Award’s history an airport received this special recognition. The airport was recognized by its peers by receiving first place in the annual Airport Council International-North America (ACI-NA) Excellence in Airport Marketing and Communication Contest for its partnership with Allegiant Air in co-sponsoring the Tampa Bay Rays for the 2013 season. It also received second and third place awards from ACI-NA for use of the new logo and rebrand in its redesign of its newsletter and website, respectively. In early 2014, the Airport’s director, Noah Lagos, was named Tourism Person of the Year by the Clearwater Regional Chamber of Commerce. The Airport realized a 22.7% increase in airline passengers in 2014 by serving 1,247,987 passengers in the calendar year. Allegiant Airlines continues to be the Airport’s largest airline. Allegiant now flies non-stop from the Airport to over 40 destinations. In addition, People Express, SunCounty Airlines, and Sunwing Airlines provide service from Pinellas County to various destinations. Summary The Airport Operating and Revenue Fund is an enterprise fund that accounts for all revenues and expenditures at the Airport. This includes management of passenger and cargo airline operations, military, and general aviation, along with commercial and industrial airport property. The Airport is entirely self-supporting, meaning that no property tax dollars are used to support the operation of the airport. Airport airline and concession revenues have grown in recent years due to increased service from Allegiant Airlines. These revenues are forecast to increase by 3.6% per year over the forecast period based on the Airport’s agreement with Allegiant and with the continued recovery
Pinellas County, Florida A-47 FY16 Proposed Budget

AIRPORT FUND
of the U.S. economy. The forecast for availability of capital contributions and other grant funding is based on current Federal and State funding participation ratios. The forecast for the Airport Revenue and Operating Fund shows that the fund is balanced throughout the forecast period. This presumes the timing of capital projects may need to be adjusted to reflect the timing and amounts of any grant revenues, and other adjustments to operating expenses may be required to match operating revenues.
$7.0
$8.0
$9.0
$10.0
$11.0
$12.0
$13.0
$14.0
$15.0
$16.0
2016 2017 2018 2019 2020 2021
Mill
ions
Airport Fund Forecast FY16 - FY21Excluding Capital Contributions/Grants and Capital Expenditures
Non-Capital Revenue Non-Capital Expenditures
$0.0
$5.0
$10.0
$15.0
$20.0
$25.0
$30.0
$35.0
$40.0
2016 2017 2018 2019 2020 2021
Mill
ions
Airport Fund Forecast FY16 - FY21Including Capital Improvement Program
Total Revenues Total Expenditures
Pinellas County, Florida A-48 FY16 Proposed Budget

AIRPORT FUND FORECASTFund 4001
Forecast Assumptions 2017 2018 2019 2020 2021REVENUES
Airfield/Flight Lines 4.3% 2.9% 1.3% 1.1% 1.5%Rents/Leases/Concessions 4.9% 4.7% 4.8% 2.8% 3.1%Capital Contributions -23.4% -42.3% -40.1% -34.5% -39.0%Interest 0.7% 1.1% 1.4% 1.9% 1.9%Other revenues 2.0% 2.0% 2.0% 2.0% 2.0%
EXPENDITURESPersonal Services 4.5% 4.5% 4.3% 4.3% 4.3%Operating Expenses 4.0% 4.0% 4.0% 4.0% 4.0%Capital Outlay 4.0% 4.0% 4.0% 4.0% 4.0%Grants & Aids 1.8% 2.3% 2.3% 2.3% 2.1%
Projected Economic Conditions / Indicators:
Consumer Price Index, % change 1.8% 2.3% 2.3% 2.3% 2.1%FL Per Capita Personal Income Growth 2.8% 2.6% 1.6% 1.7% 1.6%
Pinellas County, Florida A-49 FY16 Proposed Budget

AIRPORT FUND FORECASTFund 4001
(in $ thousands) Actual Budget Estimated Budget Estimated Estimated Estimated Estimated Estimated Estimated2014 2015 2015 2016 2016 2017 2018 2019 2020 2021
BEGINNING FUND BALANCE 18,533.0 18,298.5 21,006.8 25,557.6 25,655.5 31,107.4 29,996.0 31,585.2 32,792.4 28,924.7
REVENUESAirfield/Flight Lines * 3,098.0 3,070.0 3,442.6 3,497.3 3,497.3 3,647.7 3,753.5 3,802.3 3,844.1 3,901.7 Rents/Leases/Concessions * 7,687.5 7,113.2 8,745.7 8,665.7 8,665.7 9,090.3 9,517.6 9,974.4 10,253.7 10,571.6 Grants-Operating 88.9 88.2 88.2 88.2 88.2 90.0 91.8 93.6 95.5 97.4 Capital Contributions 5,939.8 17,367.5 18,230.3 23,636.7 23,636.7 18,100.0 10,450.0 6,261.5 4,100.0 2,500.0 Interest 48.7 88.9 79.3 83.0 83.0 217.8 330.0 442.2 623.1 549.6 Other revenues 158.1 2.2 8.7 1.9 1.9 1.9 2.0 2.0 2.1 2.1
TOTAL REVENUES 17,021.0 27,730.0 30,594.8 35,972.8 35,972.8 31,147.7 24,144.7 20,576.1 18,918.5 17,622.5 % vs prior year 79.7% 17.6% -13.4% -22.5% -14.8% -8.1% -6.9%
TOTAL RESOURCES 35,554.0 46,028.5 51,601.6 61,530.4 61,628.3 62,255.0 54,140.7 52,161.3 51,710.8 46,547.2
EXPENDITURESPersonal Services 4,212.3 4,608.7 4,879.9 4,985.6 4,985.6 5,210.0 5,444.4 5,678.5 5,922.7 6,177.4 Operating Expenses ** 3,948.8 4,781.5 4,864.6 5,379.7 5,379.7 5,594.9 5,818.7 6,051.4 6,293.5 6,545.2
Capital Outlay 367.1 141.6 41.1 176.2 176.2 183.2 190.6 198.2 206.1 214.4 Full Cost Allocation 468.2 483.0 483.0 447.8 447.8 455.9 466.3 477.1 488.0 498.3 Debt Service - - - - - - - - - Non-recurring CIP expenditures 5,560.2 20,270.3 15,775.4 25,918.7 19,637.0 20,925.0 10,750.0 7,083.0 10,000.0 2,500.0 Expenditure Lapse 1% *** (97.9) (105.4) (109.9) (114.5) (119.3) (124.2) (129.4)
TOTAL EXPENDITURES 14,556.6 30,285.1 25,946.1 36,908.0 30,520.9 32,259.1 22,555.5 19,368.9 22,786.1 15,805.9 % vs prior year 78.2% 17.6% 5.7% -30.1% -14.1% 17.6% -30.6%
ENDING FUND BALANCE 20,997.4 15,743.4 25,655.5 24,622.4 31,107.4 29,996.0 31,585.2 32,792.4 28,924.7 30,741.3
Ending balance as % of Resources 34.2% 49.7% 40.0% 50.5% 48.2% 58.3% 62.9% 55.9% 66.0%
TOTAL REQUIREMENTS 35,554.0 46,028.5 51,601.6 61,530.4 61,628.3 62,255.0 54,140.7 52,161.3 51,710.8 46,547.2
REVENUE minus EXPENDITURES 2,464.4 (2,555.1) 4,648.7 (935.2) 5,451.9 (1,111.4) 1,589.3 1,207.1 (3,867.7) 1,816.6
note: non-recurring CIP expenditures 5,560.2 15,775.4 19,637.0 20,925.0 10,750.0 7,083.0 10,000.0 2,500.0 non-recurring rev(capital contrib) (5,939.8) (18,230.3) (23,636.7) (18,100.0) (10,450.0) (6,261.5) (4,100.0) (2,500.0) net recurring rev- exp 2,084.8 2,193.8 1,452.2 1,713.6 1,889.3 2,028.6 2,032.3 1,816.6
* Operating Revenues are forecast at 100.0%** Operating Expenses net of Full Cost Allocation
*** Expenditure lapse is calculated on Personal Services, Operating Expenses, Capital Outlay, and Grants & Aids only.
FORECAST
Pinellas County, Florida A-50 FY16 Proposed Budget
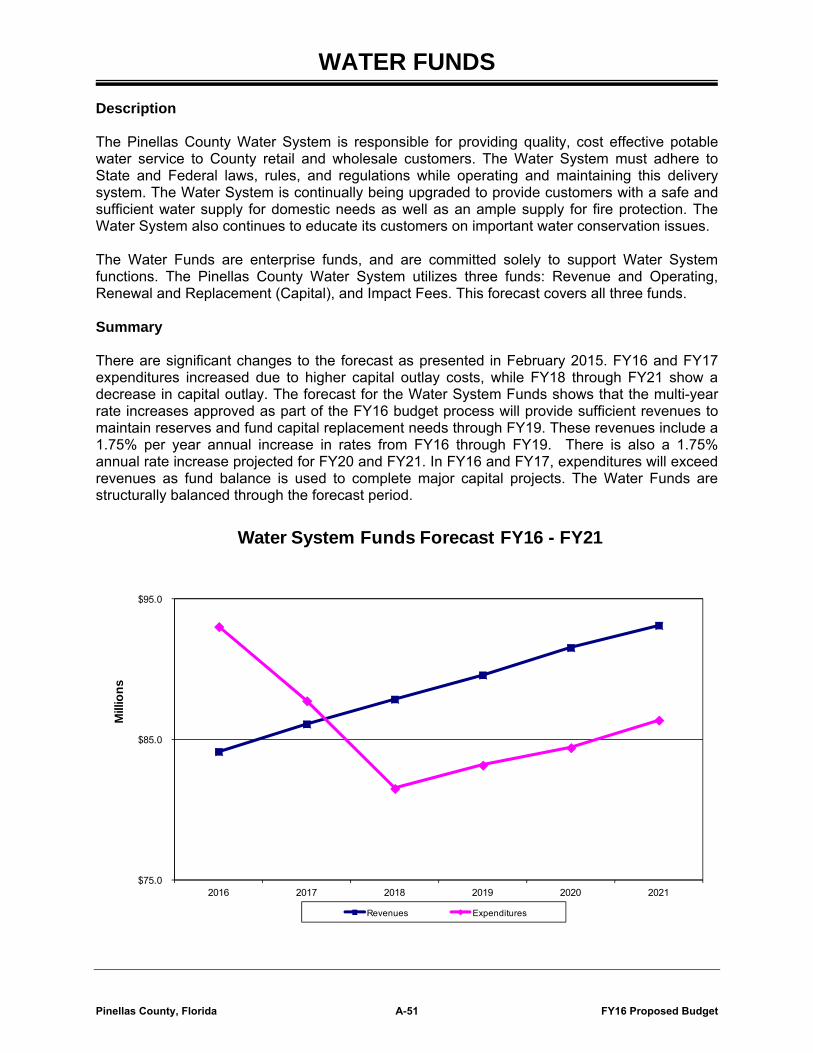
WATER FUNDS
Description The Pinellas County Water System is responsible for providing quality, cost effective potable water service to County retail and wholesale customers. The Water System must adhere to State and Federal laws, rules, and regulations while operating and maintaining this delivery system. The Water System is continually being upgraded to provide customers with a safe and sufficient water supply for domestic needs as well as an ample supply for fire protection. The Water System also continues to educate its customers on important water conservation issues. The Water Funds are enterprise funds, and are committed solely to support Water System functions. The Pinellas County Water System utilizes three funds: Revenue and Operating, Renewal and Replacement (Capital), and Impact Fees. This forecast covers all three funds. Summary There are significant changes to the forecast as presented in February 2015. FY16 and FY17 expenditures increased due to higher capital outlay costs, while FY18 through FY21 show a decrease in capital outlay. The forecast for the Water System Funds shows that the multi-year rate increases approved as part of the FY16 budget process will provide sufficient revenues to maintain reserves and fund capital replacement needs through FY19. These revenues include a 1.75% per year annual increase in rates from FY16 through FY19. There is also a 1.75% annual rate increase projected for FY20 and FY21. In FY16 and FY17, expenditures will exceed revenues as fund balance is used to complete major capital projects. The Water Funds are structurally balanced through the forecast period.
$75.0
$85.0
$95.0
2016 2017 2018 2019 2020 2021
Mill
ions
Water System Funds Forecast FY16 - FY21
Revenues Expenditures
Pinellas County, Florida A-51 FY16 Proposed Budget

Pinellas County, Florida A-52 FY16 Proposed Budget

WATER FUNDS FORECASTFund 4031, 4033, 4034 & 4036
Forecast Assumptions 2017 2018 2019 2020 2021REVENUES
Water Sales-Retail * 2.3% 1.9% 1.9% 1.9% 1.9%Water Sales-Wholesale * 3.6% 1.8% 1.8% 1.7% 1.8%Interest 0.7% 1.1% 1.4% 1.9% 1.9%Other revenues -1.8% 1.5% -0.9% 0.0% -3.2%
EXPENDITURESPersonal Services 4.5% 4.5% 4.3% 4.3% 4.3%Operating Expenses 1.8% 2.3% 2.3% 2.3% 2.1%Purchase of Water ** -0.4% 1.1% 1.0% 1.4% 2.6%Power 5.0% 5.0% 5.0% 5.0% 5.0%Chemicals 7.0% 7.0% 7.0% 7.0% 7.0%
Projected Economic Conditions / Indicators:Consumer Price Index, % change 1.8% 2.3% 2.3% 2.3% 2.1%FL Per Capita Personal Income Growth 2.8% 2.6% 1.6% 1.7% 1.6%
* Revenue percentages reflect the combined impact of changes in rates and/or levels of consumption.
** Purchase of water percentages reflect the combined impact of changes in Tampa Bay Water rates and/or changes in consumption including decreases in wholesale customer base.
Pinellas County, Florida A-53 FY16 Proposed Budget

WATER FUNDS FORECASTFund 4031, 4033, 4034 & 4036
(in $ thousands) Actual Budget Estimated Budget Estimated Estimated Estimated Estimated Estimated Estimated2014 2015 2015 2016 2016 2017 2018 2019 2020 2021
BEGINNING FUND BALANCE* 49,376.8 51,039.7 51,039.7 50,597.3 50,597.3 41,688.7 40,027.2 46,365.9 52,766.9 59,872.3
REVENUESWater Sales - Retail 63,486.2 59,669.9 66,030.9 64,940.8 68,358.8 69,904.3 71,253.9 72,629.4 74,031.1 75,459.7 Water Sales - Wholesale 20,833.3 17,759.8 18,697.8 9,645.0 10,152.7 10,517.5 10,701.6 10,888.9 11,079.4 11,273.3 Interest 102.3 150.3 137.7 130.6 137.5 291.8 440.3 649.1 1,002.6 1,137.6 Other Revenues 6,334.3 5,231.4 5,619.0 5,191.2 5,464.5 5,366.9 5,447.1 5,397.3 5,398.8 5,224.0
TOTAL REVENUES 90,756.2 82,811.5 90,485.3 79,907.6 84,113.4 86,080.6 87,842.9 89,564.7 91,511.9 93,094.6 % vs prior year -8.8% -0.3% -11.7% -7.0% 2.3% 2.0% 2.0% 2.2% 1.7%
TOTAL RESOURCES 140,133.0 133,851.2 141,525.0 130,505.0 134,710.7 127,769.4 127,870.0 135,930.6 144,278.8 152,966.9
EXPENDITURESPersonal Services 12,524.3 12,549.8 11,746.9 12,721.2 12,721.2 13,293.7 13,891.9 14,489.3 15,112.3 15,762.1 OPEB 869.5 908.7 908.7 908.7 908.7 949.6 992.3 1,035.0 1,079.5 1,125.9 Operating Expenses 5,101.4 5,663.6 4,867.9 6,601.7 6,601.7 6,720.5 6,875.1 7,033.2 7,195.0 7,346.0 Purchase of Water 45,911.3 44,500.0 44,500.0 41,000.0 41,000.0 40,835.5 41,292.7 41,688.9 42,266.7 43,386.8 Power 1,410.5 1,648.7 1,342.7 1,425.3 1,425.3 1,496.5 1,571.3 1,649.9 1,732.4 1,819.0 Chemicals 666.3 892.8 881.5 803.2 803.2 859.4 919.6 984.0 1,052.9 1,126.6 Grants & Aids 959.3 919.8 919.8 - - - - - - - Cost Allocation 6,141.7 8,030.7 8,054.9 6,841.5 6,841.5 6,964.7 7,124.9 7,288.7 7,456.4 7,613.0 Expenditure Lapse** (703.0) (711.2) (726.7) (741.7) (759.0) (781.8) Debt Service 6.3 3.0 7.0 7.0 7.0 7.0 7.0 7.0 7.0 7.0 Capital Equipment 599.1 2,544.7 2,595.9 2,511.5 2,511.5 425.9 425.9 425.9 425.9 425.9 Capital Outlay 14,903.8 22,966.0 15,102.5 20,904.8 20,904.8 16,900.4 9,130.0 9,303.4 8,837.4 8,537.4
TOTAL EXPENDITURES 89,093.3 100,627.8 90,927.7 93,724.9 93,021.9 87,742.1 81,504.1 83,163.7 84,406.5 86,368.0 % vs prior year 12.9% 2.1% 3.1% 2.3% -5.7% -7.1% 2.0% 1.5% 2.3%
TOTAL ENDING FUND BALANCE 51,039.7 33,223.4 50,597.3 36,780.0 41,688.7 40,027.2 46,365.9 52,766.9 59,872.3 66,598.9
Ending balance as % of Resources 24.8% 35.8% 28.2% 30.9% 31.3% 36.3% 38.8% 41.5% 43.5%
TOTAL REQUIREMENTS 140,133.0 133,851.2 141,525.0 130,505.0 134,710.7 127,769.4 127,870.0 135,930.6 144,278.8 152,966.9
REVENUE minus EXPENDITURES 1,662.9 (17,816.3) (442.4) (13,817.3) (8,908.6) (1,661.5) 6,338.8 6,401.0 7,105.4 6,726.6 (NOT cumulative)
*Includes OPEB Impact**Expenditure lapse of 1.0% is calculated on all expenses excluding Debt Service and Capital Outlay.Revenues reflect the combined impact of changes in rates and/or levels of consumption.Estimated revenues forecast at 100.0%.
FORECAST (@100%)
Pinellas County, Florida A-54 FY16 Proposed Budget

SEWER FUNDS
Description The Pinellas County Sewer System is responsible for quality, cost effective sewer service to the citizens and business owners within the County sewer service areas. The Sewer System must adhere to State and Federal laws, rules, and regulations while operating and maintaining this system. The Sewer System provides an environmentally safe and sanitary means of collecting and transmitting discharged domestic waste from residential, commercial, and industrial users. The Sewer System provides for the treatment and disposal of objectionable materials and organisms from the waste in order to protect public health, property, and environment. The Sewer Funds are enterprise funds, and are committed solely to support Sewer System functions. The Pinellas County Sewer System utilizes three funds: Revenue and Operating, Renewal and Replacement (capital), and Interest and Sinking (Debt Service). The Sewer System is required to maintain a debt service coverage ratio of 1.25x per the bond covenants; however the fund is maintained at a debt service coverage ratio of at least 1.50x to sustain the current bond ratings. Summary There are significant changes to the forecast as presented in February 2015. In FY16 there is an increase in the debt service expenditure due to timing changes of principal payments, as well as an increase in capital equipment purchases and capital outlay costs. The forecast revenues include a 1.0% per year annual increase in rates from FY17 through FY19, approved as part of the FY16 budget process. There is also a 1.0% annual rate increase projected for FY20 and FY21. Expenditures will exceed revenues in FY16 through FY19 as fund balance is used to complete major capital projects. The Sewer Funds are structurally balanced through the forecast period.
Pinellas County, Florida A-55 FY16 Proposed Budget
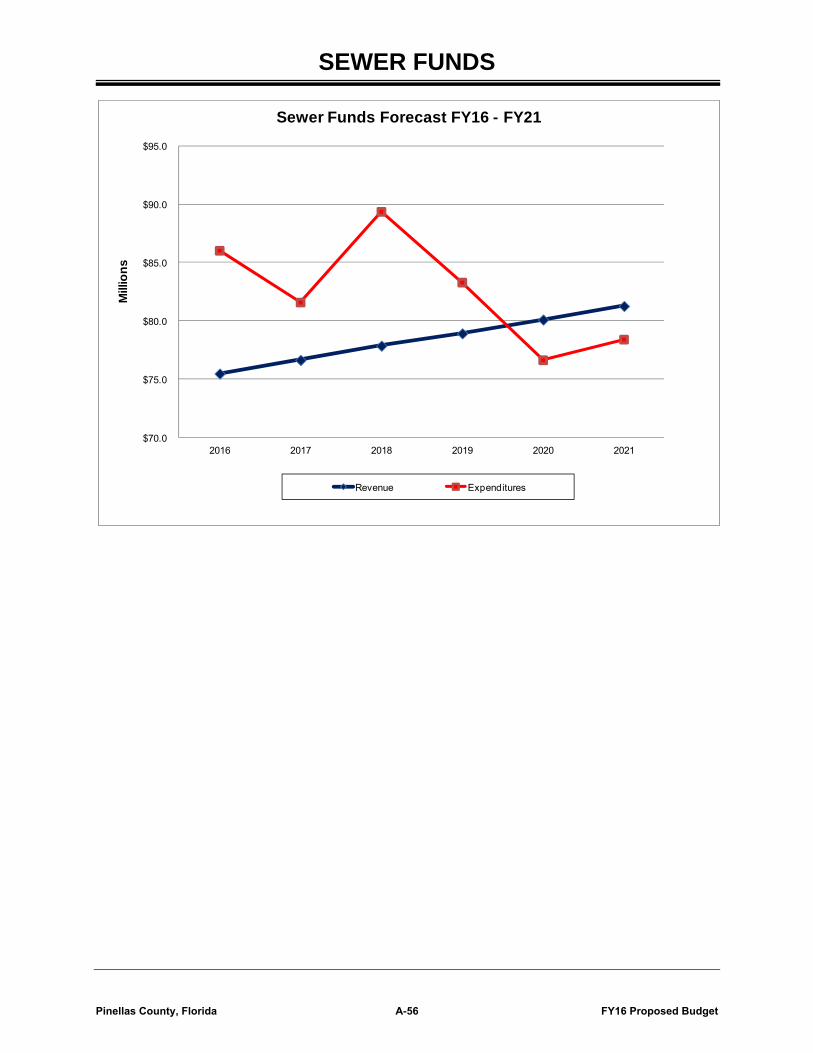
SEWER FUNDS
$70.0
$75.0
$80.0
$85.0
$90.0
$95.0
2016 2017 2018 2019 2020 2021
Mill
ions
Sewer Funds Forecast FY16 - FY21
Revenue Expenditures
Pinellas County, Florida A-56 FY16 Proposed Budget

SEWER FUNDS FORECASTFund 4051, 4052, 4053 & 4055
Forecast Assumptions 2017 2018 2019 2020 2021REVENUES
Sewer Charges - Retail * 0.9% 1.2% 1.2% 1.2% 1.2%Sewer Charges - Wholesale * 2.4% 1.2% 1.2% 1.2% 1.2%Reclaimed - Retail * 5.3% 4.8% 4.5% 4.3% 4.2%Reclaimed - Wholesale * 5.0% 5.0% 5.0% 5.0% 5.0%Interest 0.7% 1.1% 1.4% 1.9% 1.9%Other revenues -1.2% 0.0% 0.0% 0.0% 0.0%
EXPENDITUREPersonal Services 4.5% 4.5% 4.3% 4.3% 4.3%Operating Expenses 1.8% 2.3% 2.3% 2.3% 2.1%Power 5.0% 5.0% 5.0% 5.0% 5.0%Chemicals 7.0% 7.0% 7.0% 7.0% 7.0%
Projected Economic Conditions / Indicators:Consumer Price Index, % change 1.8% 2.3% 2.3% 2.3% 2.1%FL Per Capita Personal Income Growth 2.8% 2.6% 1.6% 1.7% 1.6%
*Revenue percentages reflect the combined impact of changes in rates and/or levels of consumption.
Pinellas County, Florida A-57 FY16 Proposed Budget

SEWER FUNDS FORECASTFund 4051, 4052, 4053 & 4055
(in $ thousands) Actual Budget Estimated Budget Estimated Estimated Estimated Estimated Estimated Estimated2014 2015 2015 2016 2016 2017 2018 2019 2020 2021
Actual2014 Estimated2015 Estimated2016 Estimated2017 Estimated2018 Estimated2019 Estimated2020 Estimated2021BEGINNING FUND BALANCE* 53,119.5 63,421.6 63,421.6 62,655.7 62,655.7 52,129.2 47,203.8 35,728.4 31,372.9 34,846.6
REVENUESSewer Charges - Retail 55,203.5 55,755.3 58,626.4 56,743.3 59,729.8 60,283.7 60,992.0 61,708.4 62,433.1 63,166.1Sewer Charges - Wholesale 9,718.9 8,272.8 9,242.0 8,794.4 9,257.2 9,479.0 9,593.8 9,709.8 9,827.3 9,946.1Reclaimed - Retail 4,239.2 4,169.0 4,388.4 4,377.4 4,607.8 4,850.3 5,081.3 5,312.3 5,543.2 5,774.2Reclaimed - Wholesale 255.1 234.7 247.0 246.2 259.2 273.0 286.0 299.0 312.0 325.0Interest 128.1 233.9 217.0 207.4 218.3 364.9 519.2 500.2 596.1 662.1Other Revenues** 1,928.5 1,343.5 1,500.6 1,355.6 1,427.0 1,410.2 1,410.2 1,410.2 1,410.2 1,410.2
TOTAL REVENUES 71,473.2 70,009.2 74,221.4 71,724.2 75,499.3 76,661.2 77,882.5 78,940.0 80,122.0 81,283.8% vs prior year -2.0% 3.8% -3.4% 1.7% 1.5% 1.6% 1.4% 1.5% 1.5%
TOTAL RESOURCES 124,592.7 133,430.8 137,643.0 134,380.0 138,155.0 128,790.3 125,086.4 114,668.3 111,494.9 116,130.3
EXPENDITURESPersonal Services 15,653.1 15,279.0 15,065.1 15,979.2 15,979.2 16,698.2 17,449.6 18,200.0 18,982.6 19,798.8OPEB 1,048.3 1,095.5 1,095.5 1,095.5 1,095.5 1,144.8 1,196.3 1,247.8 1,301.4 1,357.4Operating Expenses 10,887.2 9,509.5 10,078.7 13,080.5 13,080.5 13,315.9 13,622.2 13,935.5 14,256.0 14,555.4Power 4,280.1 5,062.1 4,959.0 5,062.1 5,062.1 5,315.2 5,581.0 5,860.0 6,153.0 6,460.7Chemicals 3,065.2 3,887.8 3,641.0 3,887.8 3,887.8 4,160.0 4,451.2 4,762.8 5,096.2 5,452.9Cost Allocation 4,853.8 8,211.3 8,364.8 7,508.2 7,508.2 7,643.4 7,819.2 7,999.0 8,183.0 8,354.8Expenditure Lapse*** (466.1) (482.8) (501.2) (520.1) (539.7) (559.8)Transfer from Water (959.3) (919.8) (919.8) - - - - - - - Debt Service**** 10,639.2 14,386.0 14,386.0 18,372.7 18,372.7 14,451.6 14,771.8 14,771.3 14,778.7 14,762.0Capital Equipment 1,160.3 2,949.5 3,165.5 4,245.6 4,245.6 709.9 709.9 709.9 709.9 709.9Capital Outlay 10,543.0 19,287.0 15,151.5 17,260.4 17,260.4 18,630.2 24,258.0 16,329.2 7,727.2 7,522.2
TOTAL EXPENDITURES 61,171.1 78,747.9 74,987.3 86,492.0 86,025.8 81,586.5 89,358.0 83,295.4 76,648.3 78,414.3% vs prior year 28.7% 22.6% 15.3% 14.7% -5.2% 9.5% -6.8% -8.0% 2.3%
TOTAL ENDING FUND BALANCE 63,421.6 54,682.9 62,655.7 47,888.0 52,129.2 47,203.8 35,728.4 31,372.9 34,846.6 37,716.1
Ending balance as % of Resources 41.0% 45.5% 35.6% 37.7% 36.7% 28.6% 27.4% 31.3% 32.5%
TOTAL REQUIREMENTS 124,592.7 133,430.8 137,643.0 134,380.0 138,155.0 128,790.3 125,086.4 114,668.3 111,494.9 116,130.3Debt Service Coverage 3.02 1.90 2.17 1.70 1.99 1.95 1.85 1.80 1.74 1.68
REVENUE minus EXPENDITURES 10,302.1 (8,738.7) (765.9) (14,767.7) (10,526.5) (4,925.3) (11,475.5) (4,355.5) 3,473.7 2,869.5(NOT cumulative)
*Includes OPEB Impact** Does not include Capital Contribution from the Water Fund for Reclaimed Water*** Expenditure lapse of 1.0% is calculated on all expenses excluding Debt Service and Capital Outlay****FY16 Budget and Estimate Debt Service higher due to timing change of principal payments
Revenues reflect the combined impact of changes in rate and/or levels of consumptionEstimated revenues forecasted at 100.0%
FORECAST (@100%)
Pinellas County, Florida A-58 FY16 Proposed Budget

SOLID WASTE FUNDS
Description Pinellas County Solid Waste provides safe and environmentally sound integrated solid waste services to all citizens of Pinellas County. These services emphasize public awareness and communication to enable the citizens to make educated choices concerning proper management of their solid waste and to help maintain the quality of life in Pinellas County. In support of that mission, Solid Waste operates the landfill, the waste to energy (WTE) plant, household hazardous waste collection, waste reduction, and other solid waste management related functions. The Solid Waste Funds are enterprise funds and are committed solely to support Solid Waste functions. Solid Waste utilizes two funds: Revenue and Operating, and Renewal and Replacement (capital). Summary The Pinellas County Solid Waste Funds are enterprise funds dedicated solely to supporting the Solid Waste functions. There are significant changes to the forecast as presented in February 2015. In FY16, CIP expenditures are $77.1M higher, and total CIP from FY15-21 is $54.2M higher to meet capital needs for the WTE plant. The forecast for the Solid Waste Funds shows that the fund is balanced through the forecast period. Solid Waste tipping fee revenues are not expected to grow in the forecasted six-year period. As was expected with the change in WTE service contractor, the cost to operate the WTE plant increased in FY15, then declines in FY17.
$60.0
$80.0
$100.0
$120.0
$140.0
$160.0
$180.0
$200.0
$220.0
FY16 FY17 FY18 FY19 FY20 FY21
Revenues Expenditures
NOTE: Does not include Capital Projects Fund loan activity
Solid Waste Funds Forecast FY16 -FY21
Mill
ions
Pinellas County, Florida A-59 FY16 Proposed Budget

Pinellas County, Florida A-60 FY16 Proposed Budget
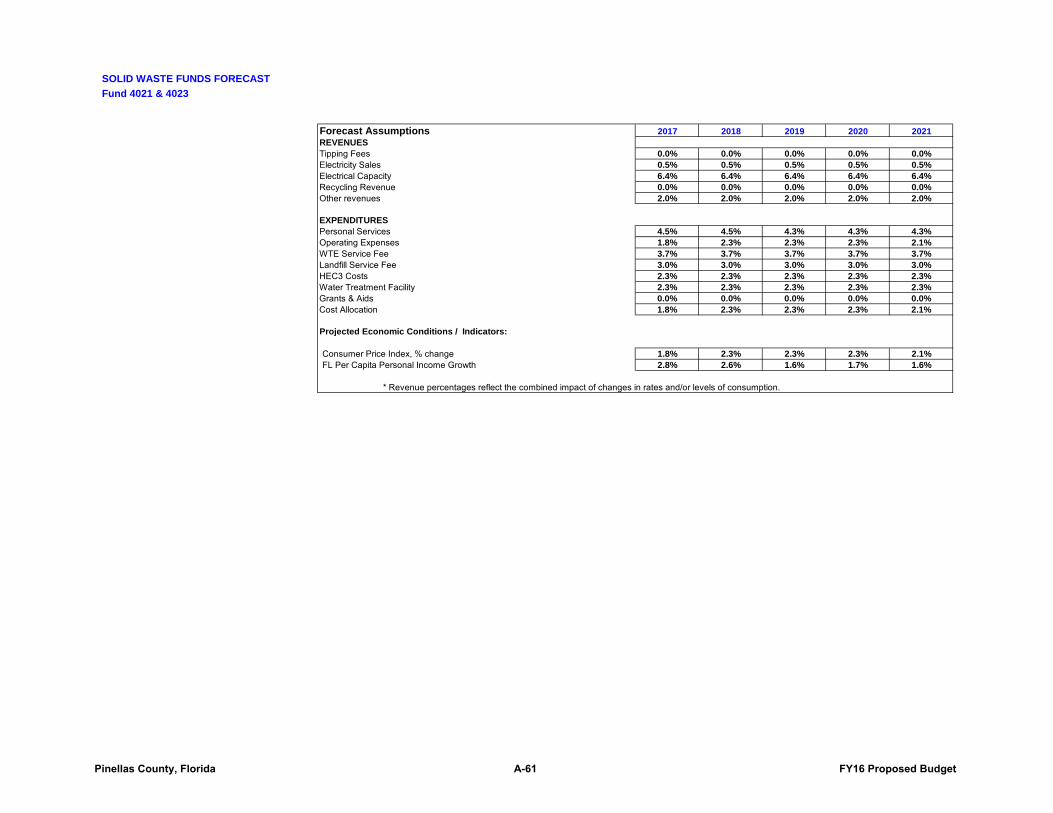
SOLID WASTE FUNDS FORECASTFund 4021 & 4023
Forecast Assumptions 2017 2018 2019 2020 2021REVENUESTipping Fees 0.0% 0.0% 0.0% 0.0% 0.0%Electricity Sales 0.5% 0.5% 0.5% 0.5% 0.5%Electrical Capacity 6.4% 6.4% 6.4% 6.4% 6.4%Recycling Revenue 0.0% 0.0% 0.0% 0.0% 0.0%Other revenues 2.0% 2.0% 2.0% 2.0% 2.0%
EXPENDITURESPersonal Services 0.0% 4.5% 4.5% 4.3% 4.3% 4.3%Operating Expenses 1.8% 2.3% 2.3% 2.3% 2.1%WTE Service Fee 3.7% 3.7% 3.7% 3.7% 3.7%Landfill Service Fee 3.0% 3.0% 3.0% 3.0% 3.0%HEC3 Costs 2.3% 2.3% 2.3% 2.3% 2.3%Water Treatment Facility 2.3% 2.3% 2.3% 2.3% 2.3%Grants & Aids 0.0% 0.0% 0.0% 0.0% 0.0%Cost Allocation 1.8% 2.3% 2.3% 2.3% 2.1%
Projected Economic Conditions / Indicators:
Consumer Price Index, % change 1.8% 2.3% 2.3% 2.3% 2.1%FL Per Capita Personal Income Growth 2.8% 2.6% 1.6% 1.7% 1.6%
* Revenue percentages reflect the combined impact of changes in rates and/or levels of consumption.
Pinellas County, Florida A-61 FY16 Proposed Budget

SOLID WASTE FUNDS FORECASTFund 4021 & 4023
(in $ thousands) Actual Budget Estimated Budget Estimated Estimated Estimated Estimated Estimated Estimated2014 2015 2015 2016 2016 2017 2018 2019 2020 2021
BEGINNING FUND BALANCE * 214,306.6 223,803.0 232,629.4 209,922.2 209,922.2 86,017.0 27,683.4 21,432.4 61,337.0 103,594.1
REVENUESTipping Fees 35,012.2 32,119.5 33,810.0 32,119.5 33,810.0 33,810.0 33,810.0 33,810.0 33,810.0 33,810.0Electricity Sales 12,001.4 10,994.3 11,572.9 10,994.3 11,572.9 11,630.8 11,688.9 11,747.4 11,806.1 11,865.1Electrical Capacity 41,737.6 42,170.7 44,390.2 47,212.0 47,212.0 50,219.4 53,412.5 56,814.1 60,432.5 64,277.6Recycling Revenue 3,395.3 1,746.8 1,941.0 2,129.3 2,241.3 2,241.3 2,241.3 2,241.3 2,241.3 2,241.3Interest 659.7 845.2 845.2 786.5 827.9 602.1 304.5 300.1 1,165.4 1,968.3Other revenues 262.9 102.5 67.9 36.6 37.7 38.4 39.2 40.0 40.8 41.6Debt Service on Loan from Capital Fund 26.0 0.0 0.0 0.0 0.0 20.4 313.5 231.0 17.4 0.0Loan repayment from Capital Fund 0.0 13,500.0 15,000.0 0.0 0.0 0.0 12,000.0 12,000.0 11,000.0 0.0
TOTAL REVENUES 93,094.9 101,478.9 107,627.2 93,278.1 95,701.8 98,562.5 113,809.9 117,183.8 120,513.5 114,204.0% vs prior year 14.3% -13.3% -11.1% 3.0% 15.5% 3.0% 2.8% -5.2%
TOTAL RESOURCES 307,401.5 325,281.9 340,256.6 303,200.3 305,624.0 184,579.6 141,493.4 138,616.1 181,850.5 217,798.0
EXPENDITURESPersonal Services1 4,327.1 4,371.5 4,169.9 4,276.4 4,276.4 4,468.9 4,670.0 4,870.8 5,080.2 5,298.7OPEB 401.0 508.0 508.0 401.0 401.0 419.0 437.9 456.7 476.3 496.8Operating Expenses2 6,054.6 5,559.5 7,223.9 9,797.6 9,797.6 9,974.0 10,203.4 10,438.0 10,678.1 10,902.4WTE Service Fee 41,741.1 65,424.5 68,167.7 54,338.0 54,338.0 30,423.5 31,549.2 32,716.5 33,927.0 35,182.3Landfill Service Fee 10,742.9 10,962.0 10,493.0 12,261.3 12,261.3 12,629.2 13,008.0 13,398.3 13,800.2 14,214.2HEC3 Costs3 1,382.9 2,072.2 2,089.9 2,228.1 2,228.1 2,279.3 2,331.7 2,385.3 2,440.2 2,496.3Water Treatment Facility3 1,420.3 2,366.9 2,515.0 2,527.0 2,527.0 2,585.2 2,644.6 2,705.4 2,767.7 2,831.3Grants & Aids 505.0 500.0 500.0 500.0 500.0 500.0 500.0 500.0 500.0 500.0Cost Allocations 3,728.4 6,335.7 6,335.7 5,550.5 5,550.5 5,650.4 5,780.4 5,913.3 6,049.3 6,176.3Capital Equipment 410.0 1,929.8 947.5 1,236.7 1,236.7 224.2 224.2 224.2 224.2 224.2Capital Outlay 4,058.8 31,871.0 27,384.0 127,409.2 127,409.2 53,432.0 49,423.0 4,404.4 3,070.4 2,409.4Interfund Loan to Capital Fund4 0.0 0.0 0.0 0.0 0.0 35,000.0 0.0 0.0 0.0 0.0Expenditure Lapse5 0.0 0.0 0.0 0.0 (918.8) (689.3) (711.3) (733.8) (757.2) (781.0)
TOTAL EXPENDITURES 74,772.2 131,901.1 130,334.5 220,525.8 219,607.0 156,896.2 120,061.0 77,279.1 78,256.5 79,951.0% vs prior year 74.3% 69.2% 68.5% -28.6% -23.5% -35.6% 1.3% 2.2%
TOTAL ENDING FUND BALANCE 232,629.4 193,380.8 209,922.2 82,674.5 86,017.0 27,683.4 21,432.4 61,337.0 103,594.1 137,847.0
Ending balance as % of Resources 75.7% 59.5% 61.7% 27.3% 28.1% 15.0% 15.1% 44.2% 57.0% 63.3%
TOTAL REQUIREMENTS 307,401.5 325,281.9 340,256.6 303,200.3 305,624.0 184,579.6 141,493.4 138,616.1 181,850.5 217,798.0
REVENUE minus EXPENDITURES 18,322.7 (30,422.2) (22,707.2) (127,247.7) (123,905.1) (58,333.7) (6,251.1) 39,904.7 42,257.1 34,253.0 (NOT cumulative)
* Includes OPEB impact1) Excludes Personal Services cost for HEC3 and Water Treatment Facility2) Operating Expenses net of Cost Allocation3) Total cost, including Personal Services4) Interfund Loan to Capital Fund will be made only if Solid Waste funding is available to support it.5) Expenditure lapse of 1.0% is calculated on all expenses excluding Debt Service and Capital Outlay.Revenues reflect the combined impact of changes in rates and/or levels of consumption.Estimated revenues forecasted at 100.0%.
FORECAST (@100%)
Pinellas County, Florida A-62 FY16 Proposed Budget

SURFACE WATER SPECIAL ASSESSMENT FUND
Description In response to public demand and increased federal regulations imposed by the U.S. Environmental Protection Agency’s National Pollution Discharge Elimination System (NPDES) stormwater permitting program as implemented by the Florida Department of Environmental Protection (FDEP), Pinellas County has been mandated to improve stormwater management services. The Clean Water Act requires the control of the discharges of pollutants to the waters of the United States through NPDES permits. The control of pollutant discharge via Municipal Separate Storm Sewer System (MS4) permits is a best management practice. In FY14, Pinellas County began a surface water assessment program to generate dedicated revenues in support of the provision of these services. In FY13, the Board of County Commissioners adopted a Master Surface Water Utility Ordinance (Master Ordinance) that outlined the procedural process by which special assessments and fees for surface water management services and improvements can be imposed and collected. It established a Surface Water Utility to be the operational means of implementing and carrying out the functional requirements of the County’s surface water management system. It did not mandate that the County impose any surface water charges nor did it set any rates. The Master Ordinance in its present form is only applicable to the unincorporated County. On June 23, 2015, the Board approved the Initial Surface Water Rate Resolution for FY16 which allows for the affected public to be notified of the structure and method as well as the initial rate that the County is considering assessing for its Surface Water Utility program for FY16. The rate preliminarily approved by the Board is $117.74 per Equivalent Residential Unit (ERU) per year and includes a 1.5% increase for Consumer Price Index (CPI) from the FY15 rate of $116.00. Although the rate is increasing, assessment revenue is decreasing from FY15 due to annexations and the removal of such features as private roads and walkways from the assessment. While the forecasted revenue was expected to decrease from FY15 to FY16 by 1%, the actual reduction in assessment revenue is 3.7%. This decrease will be offset by grant revenue and fund balance for FY16. Summary The Surface Water Special Assessment Fund is solely reliant on the fee and its assessment on unincorporated properties. This assessment and revenue is primarily based on ERU and program funding needs. ERUs are based on the estimated median impervious area of single family detached parcels. The forecast for the Surface Water Fund indicates that the fund is not balanced throughout the forecast period. Beginning in FY16, the assessment revenues will not be enough to cover estimated inflationary increases for expenditures and maintain the fund’s reserve. The FY16 budget is balanced using fund balance which is not sustainable. It is expected that revenue increases beyond the CPI and/or planned program expenditure savings will be needed to address projected deficits and to maintain adequate reserve levels throughout the forecast period.
Pinellas County, Florida A-63 FY16 Proposed Budget

SURFACE WATER SPECIAL ASSESSMENT FUND
$15.0
$17.5
$20.0
$22.5
$25.0
2016 2017 2018 2019 2020 2021
Mill
ions
Surface Water Special Assessment Fund Forecast FY16 - FY21
REVENUES EXPENDITURES
Pinellas County, Florida A-64 FY16 Proposed Budget

SURFACE WATER SPECIAL ASSESSMENT FUND FORECASTFund 1094
Forecast Assumptions 2017 2018 2019 2020 2021REVENUES
Surface Water Assessmt - ERU Growth -0.5% -0.5% -0.5% -0.5% -0.5%Surface Water Assessmt - CPI incr 1.8% 2.3% 2.3% 2.3% 2.1%Surface Water Assessmt-Total incr 1.3% 1.8% 1.8% 1.8% 1.6%ERU (excludes govt) 164,702 163,878 163,059 162,244 161,433
Interest 0.7% 1.1% 1.4% 1.9% 1.9%Other revenues 2.0% 2.0% 2.0% 2.0% 2.0%
EXPENDITURESPersonal Services 4.5% 4.5% 4.3% 4.3% 4.3%Operating Expenses 1.8% 2.3% 2.3% 2.3% 2.1%Capital Outlay 1.8% 2.3% 2.3% 2.3% 2.1%
Projected Economic Conditions / Indicators:Consumer Price Index, % change 1.8% 2.3% 2.3% 2.3% 2.1%FL Per Capita Personal Income Growth 2.8% 2.6% 1.6% 1.7% 1.6%
Pinellas County, Florida A-65 FY16 Proposed Budget

SURFACE WATER SPECIAL ASSESSMENT FUND FORECASTFund 1094
(in $ thousands) Actual Budget Estimated Budget Estimated Estimated Estimated Estimated Estimated Estimated2014 2015 2015 2016 2016 2017 2018 2019 2020 2021
Annual Rate ** 116.00 116.00 116.00 117.74 117.74 119.85 122.60 125.41 128.29 130.98BEGINNING FUND BALANCE 3,152.8 3,661.6 3,847.8 3,847.8 3,697.6 1,624.4 (754.9) (3,457.0) (6,456.5)
REVENUESSurface Water Assessment *
Non-Ad Valorem Assessment @ 95% 16,323.4 20,231.8 18,601.8 18,515.0 18,515.0 19,739.5 20,091.4 20,449.2 20,814.3 21,144.5 Grants (fed/state/local) 231.6 706.7 481.6 481.6 Interest 21.4 20.0 26.0 29.2 29.2 25.9 17.9 - - - Other revenues 169.5 16.8 33.0 27.6 27.6 28.1 28.7 29.2 29.8 30.4 Adjust Assessment Revenue to 100% 974.5 (987.0) (1,004.6) (1,022.5) (1,040.7) (1,057.2) Adjust Non-Fee Revenue to 98% 13.0 1.7 1.5 0.9 0.9 1.0
TOTAL REVENUES 16,746.0 20,268.6 19,367.5 19,053.4 20,040.9 18,808.2 19,134.9 19,456.9 19,804.3 20,118.6 % vs prior year -4.4% -1.6% 3.5% -6.2% 1.7% 1.7% 1.8% 1.6%
TOTAL RESOURCES 16,746.0 23,421.4 23,029.1 22,901.1 23,888.7 22,505.9 20,759.3 18,702.0 16,347.4 13,662.1
EXPENDITURESPersonal Services 5,288.4 5,776.7 5,809.7 6,271.4 6,271.4 6,553.6 6,848.5 7,143.0 7,450.1 7,770.5 Operating Expenses 6,948.9 12,820.7 9,920.4 11,244.6 11,244.6 11,447.0 11,710.3 11,979.6 12,255.2 12,512.5 Capital Outlay 601.2 529.0 3,170.2 2,581.5 2,581.5 2,627.9 2,688.4 2,750.2 2,813.5 2,872.6 Debt 1.3 Constitutional Officer Transfers 244.5 314.7 281.0 294.6 294.6 296.2 301.5 306.8 312.3 317.3 Expenditure Lapse *** (201.0) (206.3) (212.5) (218.7) (225.2) (231.6) CIP Operating Impacts (cumulative) 163.0 178.0 198.0 198.0 198.0
TOTAL EXPENDITURES 13,084.4 19,441.1 19,181.3 20,392.0 20,191.0 20,881.5 21,514.2 22,159.0 22,803.9 23,439.3 % vs prior year -1.3% 5.3% 3.4% 3.0% 3.0% 2.9% 2.8%
ENDING FUND BALANCE 3,661.6 3,980.3 3,847.8 2,509.1 3,697.6 1,624.4 (754.9) (3,457.0) (6,456.5) (9,777.2) Ending balance as % of Resources 17.0% 16.7% 11.0% 15.5% 7.2% -3.6% -18.5% -39.5% -71.6%
TOTAL REQUIREMENTS 16,746.0 23,421.4 23,029.1 22,901.1 23,888.7 22,505.9 20,759.3 18,702.0 16,347.4 13,662.1
REVENUE minus EXPENDITURES 3,661.6 827.5 186.2 (1,338.7) (150.2) (2,073.2) (2,379.3) (2,702.0) (2,999.6) (3,320.7) (NOT cumulative)note: non-recurring expenditures - - - - - - - - - net recurring rev- exp 3,661.6 827.5 186.2 (1,338.7) (150.2) (2,073.2) (2,379.3) (2,702.0) (2,999.6) (3,320.7)
* Per Statute, revenue is budgeted at 95.0% of total calculated amount. ** Annual rate based on 165,529.50 ERU in FY16 . Subsequent rate increases based on CPI and rounded down to nearest penny.*** Expenditure lapse is calculated at 1.0%.
FORECAST (@100%)
Pinellas County, Florida A-66 FY16 Proposed Budget