fy11 2nd quarter financial results - t. hasegawa · fragrances and flavors are custom-made in...
TRANSCRIPT

T.HASEGAWA CO., LTD.
FYFY1111 2nd2nd Quarter Quarter Financial ResultsFinancial Results
TT..HASEGAWAHASEGAWA
CO.CO., , LTDLTD..

1T.HASEGAWA CO., LTD.
Caution with Respect to Forward-Looking Statements:
This material contains forward-looking statements about the future performance of T. Hasegawa, which are based on management’s assumptions and beliefs in the light of information currently available to it. Therefore, please understand that a number of important risks and uncertainties could cause actual results to differ materially from those discussed in the forward-looking statements, and that you should not place undue reliance on them. Please also note that we will assume no responsibility for any omission or error in the statements and data in this material.

2T.HASEGAWA CO., LTD.
IndexIndex
Ⅰ.Business Outline
・・・
P3-P14
-Outlines of Flavors & Fragrances Business-Market Size of Flavors & Fragrances Industry-Business Outline of T. Hasegawa Co.,
Ltd
Ⅱ.Summary of the Consolidated Financial Settlement
・・・
P15-P19
Ⅲ.Revision of the FY11
Plan
・・・
P20-P21
Ⅳ.Management Strategies
・・・
P22-P26
Appendix Tables
・・・
P27-P38

3T.HASEGAWA CO., LTD.
I.I. Business OutlineBusiness Outline
4T.HASEGAWA CO., LTD.
Outlines of Outlines of Flavors & Fragrances Flavors & Fragrances
BusinessBusiness

5T.HASEGAWA CO., LTD.
The experts who formulate fragrances are known as “perfumers”The experts who formulate flavors are known as “flavorists”
Fragrances and Flavors are custom-made in accordance with our customers’
requests
Recipes formulated by perfumers and flavorists
are the integration of all the
R&D capabilities of flavors & fragrances companies
① Natural aromatics①①
Natural aromaticsNatural aromatics
② Aromatic chemicals②②
Aromatic chemicalsAromatic chemicals
③ Flavoring(Flavors)③③
FlavoringFlavoring((FlavorsFlavors))
④
Fragrances④④
FragrancesFragrances
Main Products of Flavor & Fragrance CompaniesMain Products of Flavor & Fragrance Companies
Recipes
Integration of all the R&D capabilities
CompoundingCompounding
6T.HASEGAWA CO., LTD.
Market Size Market Size ofof
Flavors & FragrancesFlavors & Fragrances IndustryIndustry
7T.HASEGAWA CO., LTD.
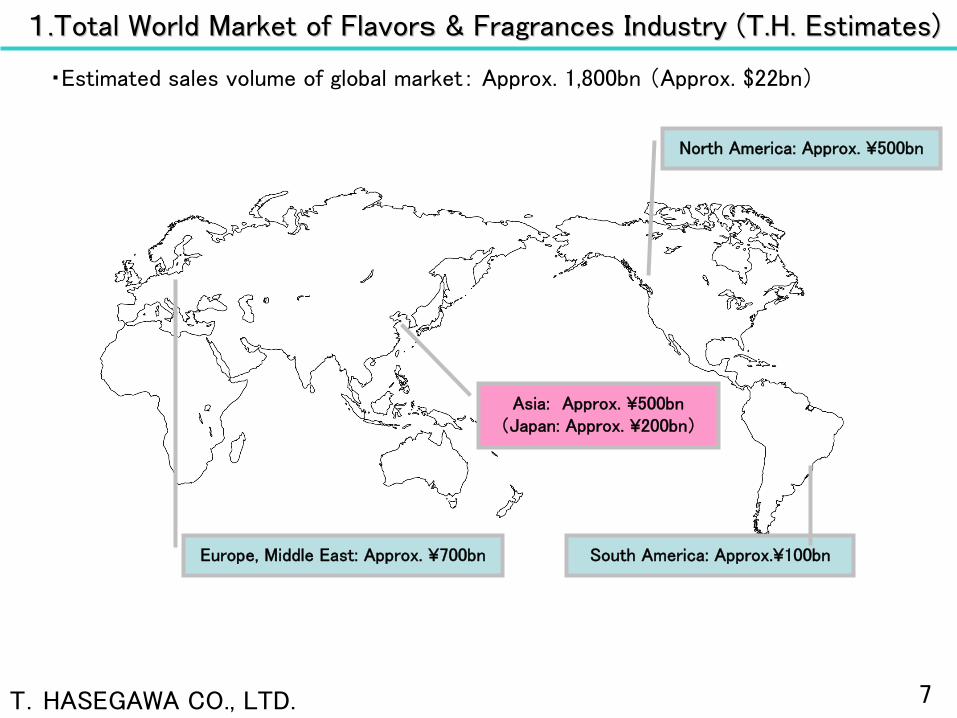
Europe, Middle East: Approx. ¥700bn
Asia:
Approx. ¥500bn(Japan: Approx. ¥200bn)
South America: Approx.¥100bn
North America: Approx. ¥500bn
・Estimated sales volume of global market:
Approx. 1,800bn (Approx. $22bn)
11..Total World Market of FlavorTotal World Market of Flavorss
& Fragrances Industry (T.H. Estimates)& Fragrances Industry (T.H. Estimates)
8T.HASEGAWA CO., LTD.
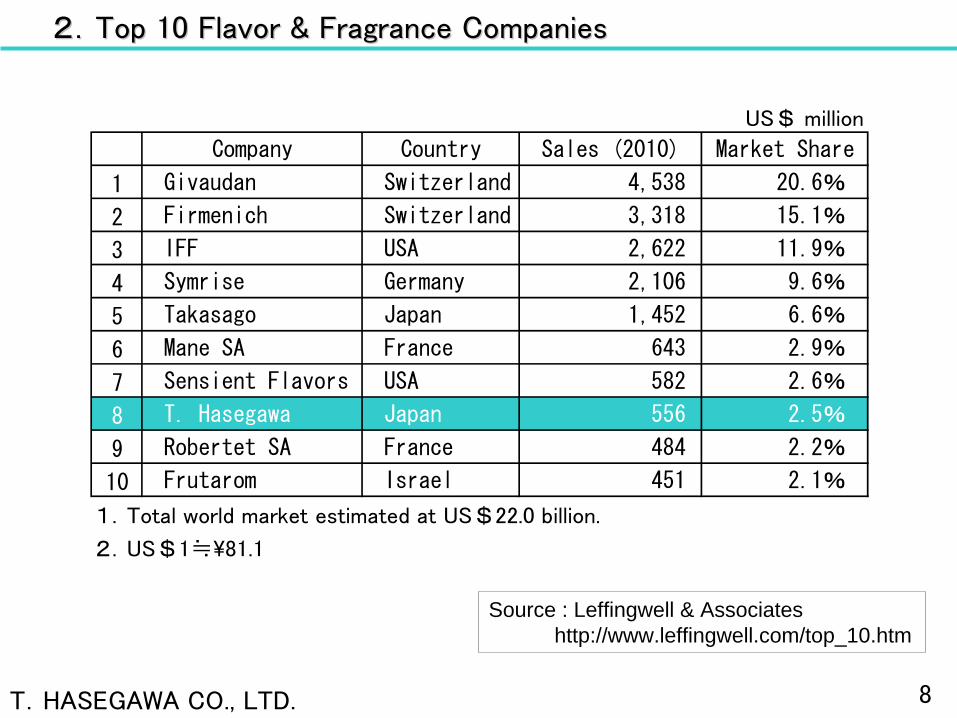
2.2.Top 10 Flavor & Fragrance CompaniesTop 10 Flavor & Fragrance Companies
Source : Leffingwell & Associateshttp://www.leffingwell.com/top_10.htm
Company Country Sales (2010) Market Share
1 Givaudan Switzerland 4,538 20.6%
2 Firmenich Switzerland 3,318 15.1%
3 IFF USA 2,622 11.9%
4 Symrise Germany 2,106 9.6%
5 Takasago Japan 1,452 6.6%
6 Mane SA France 643 2.9%
7 Sensient Flavors USA 582 2.6%
8 T. Hasegawa Japan 556 2.5%
9 Robertet SA France 484 2.2%
10 Frutarom Israel 451 2.1%
2.US$1≒\81.1
US$ million
1.Total world market estimated at US$22.0 billion.

9T.HASEGAWA CO., LTD.
Composition Rate of 2010Value of Sales
17.7%
12.8%
69.5%
Flavors
Fragrances
AromaticChemicals
Yen million
3.3.Trends in the Domestic Flavors & Fragrances MarketTrends in the Domestic Flavors & Fragrances Market・Extremely hot summer contributed to sales
increase in 2010・Flavors account for
about 70% of
the market
Source : Japan Flavor & Fragrance Materials Association*Line graphs show the semiannual values of sales
2005 2006 2007 2008 2009 2010
Flavors 137,734 133,126 133,928 131,884 129,065 134,089
Fragrances 21,947 22,043 22,685 23,751 23,360 24,804
Aromatic Chemials
31,889 37,789 38,944 37,627 25,725 34,136
Total 191,570 192,958 195,557 193,262 178,150 193,029
Year-on-year 0.9% 0.7% 1.3% △1.2% △7.8% 8.4%
0
10,000
20,000
30,000
40,000
50,000
60,000
70,000
80,000
Flavors
Fragrances
AromaticChemicals

10T.HASEGAWA CO., LTD.
Business Outline Business Outline ofof
T. Hasegawa CoT. Hasegawa Co.,., LtdLtd

11T.HASEGAWA CO., LTD.
Sales Breakdown Sales Breakdown ––Flavors, Fragrances, Aromatic Chemicals/ChemicalsFlavors, Fragrances, Aromatic Chemicals/Chemicals--
・T. Hasegawa integrates business resources into flavors and fragrances・High-mix low-volume production ⇒ T. Hasegawa sells approx. 14,000 products per annum
T. Hasegawa
Fragrances
Flavors
Company A
Aromatic
Chemicals,
Chemicals
Others
Fragrances
Flavors
Company B
Flavors
Fragrances
Aromatic
Chemicals,
Chemicals
Yen million
Sales Share Sales Share Sales Share
Fragrances 5,651 12.5% 23,525 20.6% 1,703 10.6%
Flavors 39,516 87.5% 68,710 60.1% 8,178 50.7%Aromatic Chemicals,Chemicals
0 0.0% 20,598 18.0% 6,233 38.7%
Others 0 0.0% 1,512 1.3% 0 0.0%
Total 45,167 100.0% 114,347 100.0% 16,117 100.0%
Sales Cost Ratio
T. Hasegawa(non-consolidated)
Company A(non-consolidated)
Company B(non-consolidated)
FY ended in Sep. 2010 FY ended in Mar. 2010 FY ended in Mar. 2010
34.2% 29.4% 30.3%

12T.HASEGAWA CO., LTD.
・Concentrate on core business of compound flavors and fragrances as well as derivative areas (such as extracts and fruit preparations)⇒ Global expansion to take place where market for compound flavors and fragrances exist
(Triangular network of Japan, the United States, and China)
・Proportion of overseas sales to net sales is increasing along with the sales growth of the subsidiaries in China
Global Business OperationsGlobal Business Operations
FY06 FY07 FY08 FY09 FY10
Net Sales(Consolidated) 47,000 50,066 45,421 43,244 45,167
Overseas Sales 7,279 8,279 8,208 8,030 8,937Sales in Asian Market withinOverseas Sales 5,774 6,445 6,513 6,635 7,457Sales of Subsidiary in Shanghaiwithin Sales in Asian Market 2,841 3,289 3,457 3,740 4,177
Ratio of Overseas Sales to NetSales 15.5% 16.5% 18.1% 18.6% 19.8%
Ratio of Sales in Asian Marketto Net Sales 12.3% 12.9% 14.3% 15.3% 16.5%
Ratio of Sales of Subsidiary inShanghai to Net Sales 6.0% 6.6% 7.6% 8.6% 9.2%
(Yen milion)
13T.HASEGAWA CO., LTD.
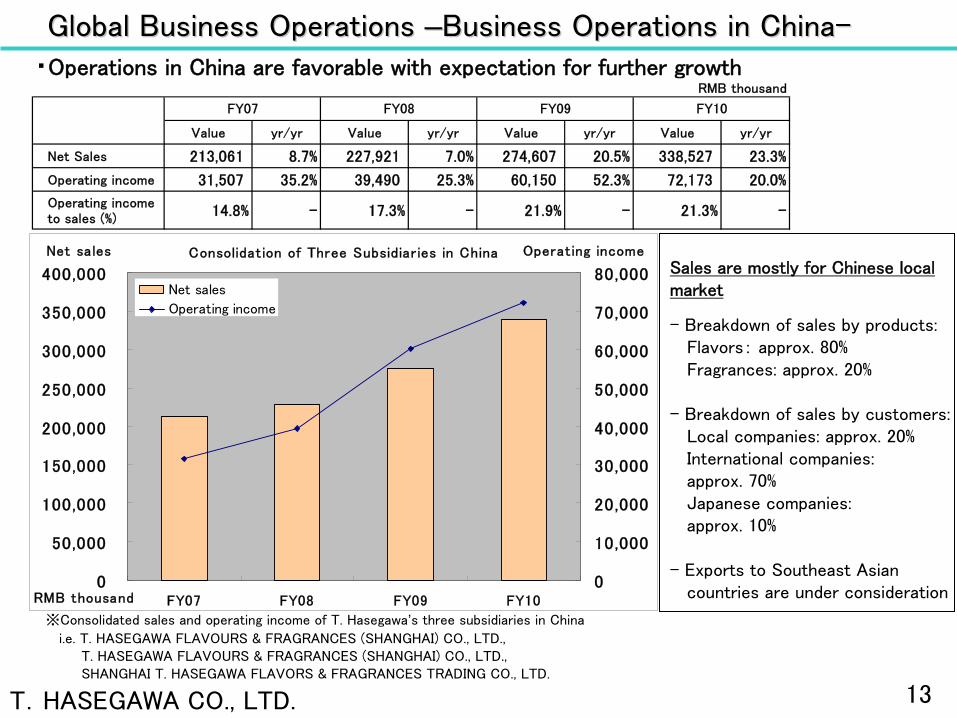
Sales are mostly for
Chinese local market
-
Breakdown of sales by products:Flavors:
approx. 80%Fragrances: approx. 20%
-
Breakdown of sales by customers: Local companies: approx. 20%International companies: approx. 70%Japanese companies: approx. 10%
- Exports to Southeast Asian countries are under consideration
蘇州工場蘇州工場稼働開始稼働開始
Global Business Operations Global Business Operations ––Business Operations in ChinaBusiness Operations in China--・Operations in China
are favorable with expectation for further growth
※Consolidated sales and operating income of T. Hasegawa’s three subsidiaries in China
i.e. T. HASEGAWA FLAVOURS & FRAGRANCES (SHANGHAI) CO., LTD., T. HASEGAWA FLAVOURS & FRAGRANCES (SHANGHAI) CO., LTD.,SHANGHAI T. HASEGAWA FLAVORS & FRAGRANCES TRADING CO., LTD.
RMB thousand
Value yr/yr Value yr/yr Value yr/yr Value yr/yr
Net Sales 213,061 8.7% 227,921 7.0% 274,607 20.5% 338,527 23.3%
Operating income 31,507 35.2% 39,490 25.3% 60,150 52.3% 72,173 20.0%
Operating incometo sales (%)
14.8% - 17.3% - 21.9% - 21.3% -
FY07 FY08 FY09 FY10
Consolidation of Three Subsidiar ies in China
0
50,000
100,000
150,000
200,000
250,000
300,000
350,000
400,000
FY07 FY08 FY09 FY100
10,000
20,000
30,000
40,000
50,000
60,000
70,000
80,000Net sales
Operating income
Net sales Operating income
RMB thousand

14T.HASEGAWA CO., LTD.
Effects of the Recent EarthquakeEffects of the Recent Earthquake1. Effects on T. Hasegawa
・All employees were safe, and there were no severe damages to our buildings and production facilities・Production volume temporarily decreased due to scheduled power blackout and fuel shortage・Production divisions operated on irregular work hours to mitigate the effects of scheduled power
blackout
2. Circumstances of Domestic Market・Decrease in production volume due to the damages on customers’ production facilities and the scheduled power blackout
・Shortage of materials due to the damages incurred on the production facilities of packaging materials
3. Circumstances of Overseas Market・Import restrictions on Japanese products by foreign governments
4. Measures to save electricity for the coming summer・Installation of in-house electric generators・Rotation of holidays between manufacturing divisions at production sites・Introduction of daylight saving time (summertime) under consideration
Before After
Customers Diversification of products Streamlining of production lines
Postponement or cancellation of newproduct launches
T. HasegawaProduction of wide variety of products insmall quantity
Increase in production volume of mainproducts
Decrease in number of items produced
Before After
T. HasegawaExports of raw materils and intermediate materialsto the overseas subsdiaries
Increase local procurment by overseassubsidiaries
Shifting of production to overseas subsidiaries isunder consideration (partially implemented)

15T.HASEGAWA CO., LTD.
IIII..Summary of the Summary of the
Consolidated Consolidated FinancialFinancial SettlementSettlement

16T.HASEGAWA CO., LTD.
・Year-on-Year: Although net sales almost unchanged from prior year, profitability improved・vs
Plan: Although net sales were favorable until February, sales decline in March due to the earthquake and tsunami disaster pushed the 2Q YTD net sales downward
Consolidated ResultsConsolidated Results
Value % Value %
Net sales 20,649 100.0% 21,230 100.0% 20,734 100.0% 85 0.4% -495 -2.3%
Cost of sales 13,916 67.4% 14,190 66.8% 13,722 66.2% -194 -1.4% -467 -3.3%
Gross profit 6,732 32.6% 7,040 33.2% 7,011 33.8% 279 4.2% -28 -0.4%
SGA expenses 5,419 26.2% 5,430 25.6% 5,205 25.1% -214 -4.0% -224 -4.1%
Operating income 1,312 6.4% 1,610 7.6% 1,806 8.7% 493 37.6% 196 12.2%
Ordinary income 1,493 7.2% 1,700 8.0% 1,974 9.5% 481 32.2% 274 16.2%
Income beforeincome taxes
1,225 5.9% 1,820 8.6% 2,091 10.1% 866 70.7% 271 14.9%
Net income 830 4.0% 1,200 5.7% 1,333 6.4% 502 60.5% 133 11.1%
FY10 2Q YTDActual
FY11 2Q YTDPlan
FY11 2Q YTDActual
Value Share Value Share Value Shareyr/yr vs Plan
Achievement
Yen million

17T.HASEGAWA CO., LTD.
・Sales for tea beverages increased by approx. ¥200mn
・Sales of fruit preparations decreased by approx. ¥300mn
・Sales of flavors slightly increased, sales of fragrances almost unchanged from prior year
Sales by SegmentsSales by Segments
Value %
Fragrances 2,536 2,529 -6 -0.3% Almost unchanged from prior year
Flavors 16,587 16,911 323 1.9% Sales for tea beverages increased
19,124 19,441 316 1.7% -
Fragrances 272 230 -41 -15.3% Sales for cosmetics decreased
Flavors 1,252 1,062 -189 -15.1% Sales of fruit preparation decreased
1,524 1,293 -231 -15.2% -
20,649 20,734 85 0.4% -
Remark
Sub total
Total
yr/yr
Products
Sub total
Traded
items
SegmentFY10
2Q YTDFY11
2Q YTD
Yen million

18T.HASEGAWA CO., LTD.
Yen million
・Profitability increased due to the improvement of sales cost ratio and the decrease of SGA expenses
Profit and Loss Statements (YearProfit and Loss Statements (Year--onon--Year Analysis)Year Analysis)
Value %
Net sales 20,649 100.0% 20,734 100.0% 85 0.4%
Cost of sales 13,916 67.4% 13,722 66.2% -194 -1.4%Sales cost ratio improved by 1.6 percentage points from 68.4% to 66.8% onnon-consolidated basis mainly due to decrease in depreciation&amortization by \154mn
Gross profit 6,732 32.6% 7,011 33.8% 279 4.2%
SGA expenses 5,419 26.2% 5,205 25.1% -214 -4.0%Expenses related to the building of new R&D center of \164mn and real estateacquisition tax of \53mn were posted in FY10
Operatingincome 1,312 6.4% 1,806 8.7% 493 37.6%
Ordinaryincome 1,493 7.2% 1,974 9.5% 481 32.2%
Income beforeincome taxes 1,225 5.9% 2,091 10.1% 866 70.7%
Extra ordinary income: Gain on abolishment of retirement benefit plan of \333mnExtra ordinary losses: Loss on disposal of fixed assets of \257mn in FY10,loss on revaluation of investments in securities of \84mn, asset retirement obligationsof \79mn in FY11
Net income 830 4.0% 1,333 6.4% 502 60.5%
FY10 2Q YTDActual
FY11 2Q YTDActual
Remarkyr/yr

19T.HASEGAWA CO., LTD.
0
500
1,000
1,500
2,000
2,500
FY10 YTD Non-
consolidated
Shanghai Suzhou USA Adjustment FY11YTD
1,312
1,806
-197 +26 -9+158
+516
・Non-consolidated operating income increased・Operating income of the subsidiary in Shanghai deceased mainly due to the payment for
toll manufacturing
at
T. Hasegawa Flavours (Suzhou) Co. Ltd.
Breakdown of Operating Income by SubsidiariesBreakdown of Operating Income by Subsidiaries
Yen million
Non-consolidated Shanghai USA Adjustment
FY11YTDConsolidatedSuzhou
FY10
YTDConsolidated

20T.HASEGAWA CO., LTD.
ⅢⅢ.. Revision of the FY1Revision of the FY111 PlanPlan
21T.HASEGAWA CO., LTD.
Yen million
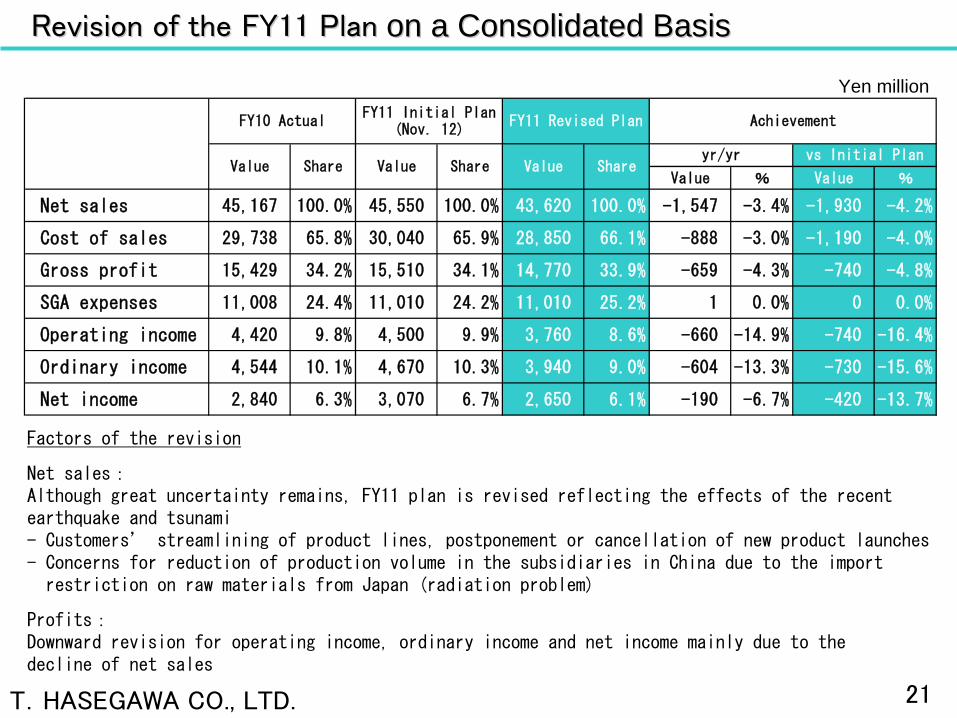
Factors of the revision
Net sales:Although great uncertainty remains, FY11 plan is revised reflecting the effects of the recent earthquake and tsunami -
Customers’
streamlining of product lines, postponement or cancellation of new product launches- Concerns for reduction of production volume in the subsidiaries
in China due to the import restriction on raw materials from Japan (radiation problem)
Profits:Downward revision for operating income, ordinary income and net income mainly due to the decline of net sales
Revision of the FY1Revision of the FY111
PlanPlan
on a Consolidated Basison a Consolidated Basis
Value % Value %
Net sales 45,167 100.0% 45,550 100.0% 43,620 100.0% -1,547 -3.4% -1,930 -4.2%
Cost of sales 29,738 65.8% 30,040 65.9% 28,850 66.1% -888 -3.0% -1,190 -4.0%
Gross profit 15,429 34.2% 15,510 34.1% 14,770 33.9% -659 -4.3% -740 -4.8%
SGA expenses 11,008 24.4% 11,010 24.2% 11,010 25.2% 1 0.0% 0 0.0%
Operating income 4,420 9.8% 4,500 9.9% 3,760 8.6% -660 -14.9% -740 -16.4%
Ordinary income 4,544 10.1% 4,670 10.3% 3,940 9.0% -604 -13.3% -730 -15.6%
Net income 2,840 6.3% 3,070 6.7% 2,650 6.1% -190 -6.7% -420 -13.7%
yr/yr vs Initial PlanValue Share Value Share
FY10 ActualFY11 Initial Plan
(Nov. 12)FY11 Revised Plan Achievement
Value Share

22T.HASEGAWA CO., LTD.
ⅣⅣ..Management StrategiesManagement Strategies

23T.HASEGAWA CO., LTD.
Basic StrategiesBasic Strategies
1.1.Concentrate management resources on coreConcentrate management resources on corebbusiness of compound flavors and fragrancesusiness of compound flavors and fragrances
2.2.Make steady revenues in theMake steady revenues in the Japanese domestic Japanese domestic market since it is the main revenue base of market since it is the main revenue base of T. HasegawaT. Hasegawa
3.3.Aim for growth in overseas marketAim for growth in overseas market

24T.HASEGAWA CO., LTD.
StrategiesStrategies
Under the Current Circumstances of the Domestic MarketUnder the Current Circumstances of the Domestic Market
Shorter product life cycles⇒ Maintain optimum inventory levels and reduce inventory losses by
utilizing the enterprise resource management system (ERP)
Thorough cost‐consciousness of customers
Sales orders with shorter lead time
⇒ Cut production cost (streamline recipes, improve production efficiency)
⇒ Contribute to our customers’
cost-cutting efforts by replacing the raw materials such as dairy products, vegetables, fruit juice, and animal products with our flavors
⇒ Improve production efficiency, automation of the production procedures, thorough inventory control
Rising demand for quality assurances⇒ Comprehensive quality assurance system through Quality Assurance
Division under the direct control of CEO
⇒ Ensure product traceability for customers
Maturity of market⇒ Improve winning percentages of customer projects
⇒ Penetrate into the new fields such as alcoholic drinks, health food, foods for medical use etc
⇒ Penetrate into the areas where T. Hasegawa’s market share is relatively small
⇒ Promote globalization

25T.HASEGAWA CO., LTD.
Globalization StrategiesGlobalization StrategiesBasic Strategies for Global Business・Concentrate on core business of compound flavors and fragrances as well as derivative
areas (such as extracts and fruit preparations)⇒ Global expansion to take place where market for compound flavors and fragrances exist
(Triangular network of Japan, the United States, and China)
- Achieve sustainable growth by capturing demand of rapidly growing Asian market including China
・Strengthen information sharing between business bases
- Utilize the developed-in-Japan technologies in overseas market
Chinese Market・Enhance the R&D and sales ability of the subsidiary in China・Cultivate new local customers・Make a timely capital investment based on market demand
The US Market・Enhance sales and R&D capability through cultivation of human
resources ・Increase sales by utilizing the equipment for powdered flavors
Southeast Asian Market・Currently under survey to establish a solid foundation for sales growth
-Enhance functions of the sales office in Thailand-Establish an efficient supply chain system covering the market

26T.HASEGAWA CO., LTD.
Management Resources
Establishment of Establishment of R&D CenterR&D CenterOctober, October, 20092009
・Enhance collaboration between three research institutes in Japan(Flavor Institute, Fragrance Institute, Technical Research Center)
・Promote
solution-oriented sales activities
by collaborative efforts between the R&D and the sales divisions
Improve winning percentages of Improve winning percentages of customer customer projectprojectss
Penetrate into the new fields such Penetrate into the new fields such as alcoholic drinks, health food, as alcoholic drinks, health food,
foods for medical use etcfoods for medical use etcPromote globalizationPromote globalization
Penetrate into the areas where T. Penetrate into the areas where T. HasegawaHasegawa’’s market share is s market share is
relatively smallrelatively small
Enhancement of CollaborationsEnhancement of Collaborations
Reorganization
Solid Foundation of TechnologySolid Foundation of Technology
Sales NetworkSales Network
AccumulationAccumulationofof
KnowKnow--howhow
Establishment of Global Establishment of Global Business DivisionBusiness Division
December, December, 20102010
・Enhance collaboration between R&D
functions
of Japan, USA, and China
・Strengthen the network of business basis in Japan, USA, and China
Human ResourcesHuman Resources

27T.HASEGAWA CO., LTD.
Appendix TablesAppendix Tables

28T.HASEGAWA CO., LTD.
Market Share(As of Mar. 2010)
35.5%
20.9%
10.0%
7.9%
5.3%
20.5%
Company T
T. hasegawa
Company O
Company S
Company N
Others
・Intensified competition within the maturing domestic market
・Top 5 companies account for approx. 80% of the market
Sales of Domestic Flavor & Fragrance CompaniesSales of Domestic Flavor & Fragrance Companies
*Based on a survey conducted by a private market
research firm, T. Hasegawa accounts for 20.1% of
the total sales of the top 10 companies in Japan.
*Fiscal year of Company T, O, S, and N: Apr. –
Mar.
*Since fiscal year of T. Hasegawa is Oct. -
Sep., numbers
indicated in the above pie chart has been adjusted to
correspond to the Apr. –Mar. fiscal year
Consolidated Sales '05 - '10
0
10,000
20,000
30,000
40,000
50,000
60,000
70,000
Oct. '0
4- M
ar. '0
5
Apr.
'05-
Sep.
'05
Oct. '0
5- M
ar. '0
6
Apr.
'06-
Sep.
'06
Oct. '0
6- M
ar. '0
7
Apr.
'07-
Sep.
'07
Oct. '0
7- M
ar '0
8
Apr '
08-
Sep
'08
Oct '0
8- M
ar. '0
9
Apr.
'09-
Sep
'09
Oct '0
9- M
ar '1
0
Apr '
10-
Sep
'10
Company T
T. Hasegawa
Company S
Yen mill ion

29T.HASEGAWA CO., LTD.
Sales BreakdownSales Breakdown
Flavors
Used in a wide variety of beverages, confections, snacks, soups, desserts, frozen desserts etc.
Used in a wide variety of cosmetics,toiletries, household products etc.
Fragrances
・Flavors account for
about 90% of our sales
Yen million
Value % Value % Value %
17,973 86.7% 2,760 13.3% 20,734 100.0%
*Sales of Fruit Preparations: \2,375mn
Net Sales(FY11 2Q YTD)
Flavors Fragrances
30T.HASEGAWA CO., LTD.
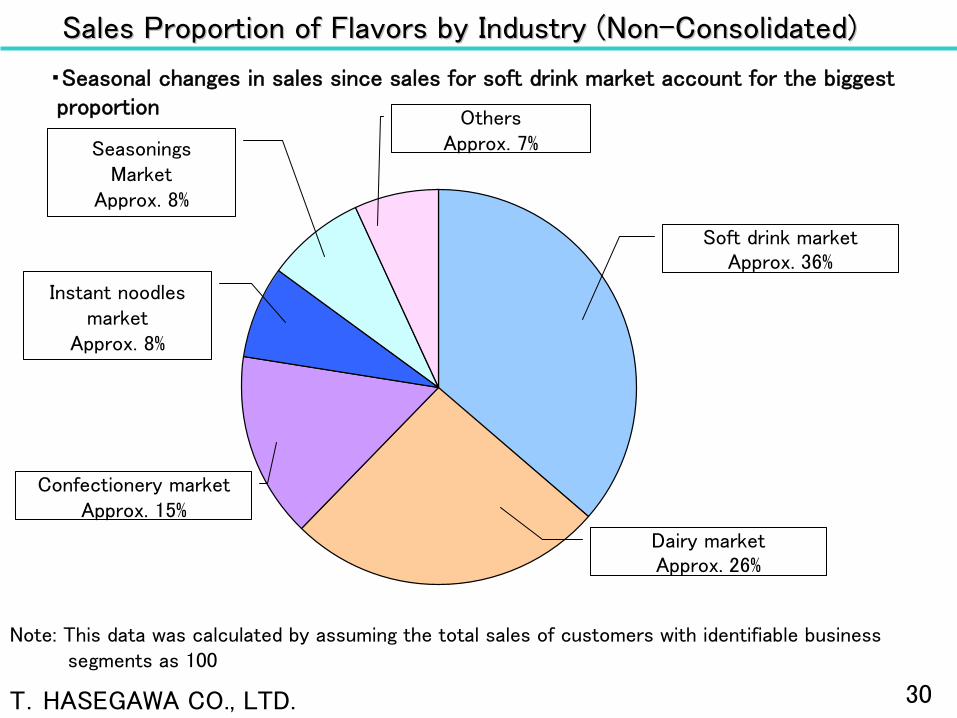
Sales Proportion of Flavors by Industry (NonSales Proportion of Flavors by Industry (Non--Consolidated)Consolidated)
・Seasonal changes in sales since sales for soft drink market account for the biggest proportion
Note: This data was calculated by assuming the total sales of customers with identifiable business segments as 100
Soft drink marketApprox.
36%
Dairy marketApprox.
26%
Confectionery marketApprox. 15%
Instant noodles market
Approx. 8%
Seasonings Market
Approx. 8%
OthersApprox. 7%

31T.HASEGAWA CO., LTD.
Sales Breakdown Sales Breakdown ––Products & Traded ItemsProducts & Traded Items--
・High proportion of production sales for T. Hasegawa
T. Hasegawa
Products
TradedItems
Company A
Products
TradedItems
Others
Company B
Products
TradedItems
Yen million
Sales Share Sales Share Sales Share
Products 37,004 92.0% 44,181 66.6% 11,447 77.6%
Traded Items 3,204 8.0% 20,185 30.4% 3,309 22.4%
Others 0 0.0% 1,999 3.0% 0 0.0%
Total 40,208 100.0% 66,366 100.0% 14,756 100.0%
Sales Cost Ratio 33.0% 28.4% 28.6%
T. Hasegawa(non-consolidated)
Company A(non-consolidated)
Company B(non-consolidated)
FY ended in Sep. 2010 FY ended in Mar. 2010 FY ended in Mar. 2010
32T.HASEGAWA CO., LTD.
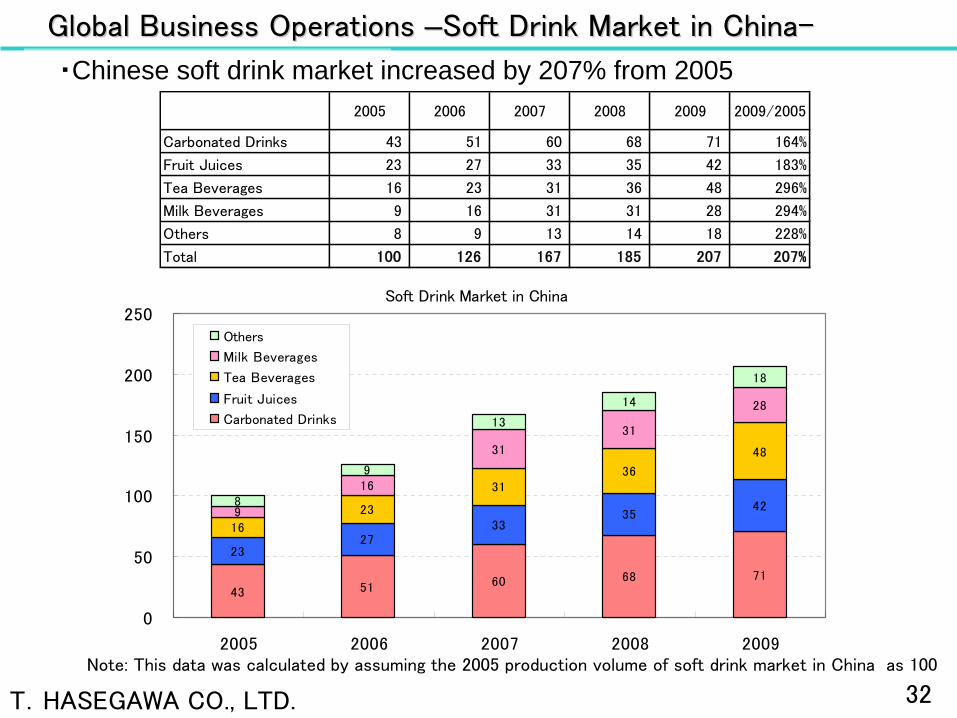
Global Business Operations Global Business Operations ––Soft Drink Market in ChinaSoft Drink Market in China--
・Chinese soft drink market increased by 207% from 2005
Note: This data was calculated by assuming the 2005 production
volume
of soft drink market in China as 100
Soft Drink Market in China
43 51 60 68 71
2327
3335
42
16
23
3136
48
9
16
31
31
28
8
9
13
14
18
0
50
100
150
200
250
2005 2006 2007 2008 2009
Others
Milk Beverages
Tea Beverages
Fruit Juices
Carbonated Drinks
2005 2006 2007 2008 2009 2009/2005
Carbonated Drinks 43 51 60 68 71 164%
Fruit Juices 23 27 33 35 42 183%
Tea Beverages 16 23 31 36 48 296%
Milk Beverages 9 16 31 31 28 294%
Others 8 9 13 14 18 228%
Total 100 126 167 185 207 207%

33T.HASEGAWA CO., LTD.
Yen million
Balance SheetsBalance Sheets
FY10 2Q FY11 2Q Change Remark
Current assets 33,433 38,714 5,280Decrease in cash and time deposits: △\689mnIncrease in marketable securities: \5,999mn
Fixed assets 40,173 37,241 △ 2,931Decrease in tangible fixed assets: △\1,980mnDecrease in investments in securities: △\1,254mn
Total assets 73,607 75,956 2,348
Current liabilities 9,226 10,200 974Increase in accrued income taxes: \320mnIncrease in notes payable, trade and accounts payable, trade: \222mnIncrease in current portion of long-term loans payable: \171mn
Long-termliabilities 6,880 7,228 348
Increase in long-term loans payable (introduction of the incentive schemefor empoyees' stock ownership): \554mnIncrease in long-term accounts payable, other (defined contribution):\147mn
Shareholders' equity 57,501 58,527 1,026Increase in retained earnings: \2,310mnDecrease in unrealized gains on available-for- sale securities: △\729mnDecrease in foreign currency translation adjustments: △\649mn
Total liabilitiesand shareholders'equity
73,607 75,956 2,348

34T.HASEGAWA CO., LTD.
Yen million
Statements of Cash FlowStatements of Cash Flow
FY10 2Q FY11 2Q Change Remark
Cash flows fromoperating activities 3,970 3,478 △ 492
Income before income taxes: \2,091mnDepreciation & Amortization: \1,577mnDecrease in trade receivable: \2,676mnIncome taxes paid: △\1,092mnDecrease in trade payables: △\777mn
Cash flows frominvesting activities △ 2,531 △ 951 1,580 Acquisition of tangible fixed assets: △\934mn
Cash flows fromfinancing activities △ 2,445 △ 637 1,807 Cash Dividends: △\622mn
Effect of currencychange on cash and cashequivalents
58 21 △ 37 ―
Net change in cash andcash equivalents △ 948 1,910 2,858 ―
Cash and cashequivalents atbeginning of period
9,746 13,097 3,350 ―
Cash and cashequivalents at end ofperiod
8,798 15,007 6,209 ―

35T.HASEGAWA CO., LTD.
Capital Investment, Depreciation & Amortization, R&D ExpensesCapital Investment, Depreciation & Amortization, R&D Expenses
(Yen milion)
FY11Plan
FY11 2Q YTD(Actual)
Progress(%)
Consolidated 2,089 735 35.2%
Non-consolidated 1,804 686 38.0%
Consolidated 3,354 1,577 47.0%
Non-consolidated 2,987 1,404 47.0%
Consolidated 3,767 1,823 48.4%
Non-consolidated 3,332 1,617 48.5%
Depreciation&
Amortization
R&DExpenses
CapitalInvestment

36T.HASEGAWA CO., LTD.
T. T. HASEGAWAHASEGAWA
COCO.,.,
LTD. (NonLTD. (Non--consolidated)consolidated)
Value % Value %
Net sales 18,411 100.0% 18,740 100.0% 18,424 100.0% 13 0.1% -315 -1.7%
Cost of sales 12,586 68.4% 12,730 67.9% 12,302 66.8% -284 -2.3% -427 -3.4%
Gross profit 5,824 31.6% 6,010 32.1% 6,122 33.2% 298 5.1% 112 1.9%
SGA expenses 4,813 26.1% 4,820 25.7% 4,594 24.9% -218 -4.5% -225 -4.7%
Operating income 1,010 5.5% 1,190 6.4% 1,527 8.3% 516 51.1% 337 28.4%
Ordinary income 1,199 6.5% 1,960 10.5% 2,314 12.6% 1,114 92.9% 354 18.1%
Income beforeincome taxes
946 5.1% 2,080 11.1% 2,432 13.2% 1,485 156.9% 352 16.9%
Net income 566 3.1% 1,450 7.7% 1,731 9.4% 1,165 205.7% 281 19.4%
FY11 2Q YTDRevised Plan(Mar. 25)
FY11 2Q YTDActual
Achievement
Value Share Value Share Value Shareyr/yr vs Plan
FY10 2Q YTDActual
Yen million

37T.HASEGAWA CO., LTD.
Overseas SubsidiariesOverseas Subsidiaries
・
Recovery trend from sales decline after the downturn of the U.S.
economy・
Sales of new products contributed to the increase of net sales ・
Sales composition →
flavors and food colors
T. T. HASEGAWAHASEGAWA
FLAVOURSFLAVOURS
& & FRAGRANCESFRAGRANCES
((SHANGHAISHANGHAI) CO) CO.,.,
LTD.LTD.
T. HASEGAWA U.S.AT. HASEGAWA U.S.A.,.,
INC.INC.
・
Net sales increased on the local currency basis, decreased on the yen basis・
Sales cost ratio was higher than the same period last year mainly due to the payment of the transfer expenses to T. Hasegawa Flavours (Suzhou) Co. Ltd.

38T.HASEGAWA CO., LTD.
Management IndicesManagement Indices
1. Sales Growth Rate higher than 3.0%
2. Operating Income to Net Sales higher than 14.0%
3. Ordinary
Income to Net Sales higher than 13.0%
4. ROE higher than 8.0%
The management indices are determined, incorporating necessary and attainable goals for T. Hasegawa Group to achieve stable andsustainable growth.