fy07-12 diversity and inclusion strategy annual...
TRANSCRIPT
FY07-12 Diversity and Inclusion Strategy
ANNUAL UPDATE TO THE HUMAN RESOURCES COMMITTEE
DECEMBER 8, 2010
Pub
lic D
iscl
osur
e A
utho
rized
Pub
lic D
iscl
osur
e A
utho
rized
Pub
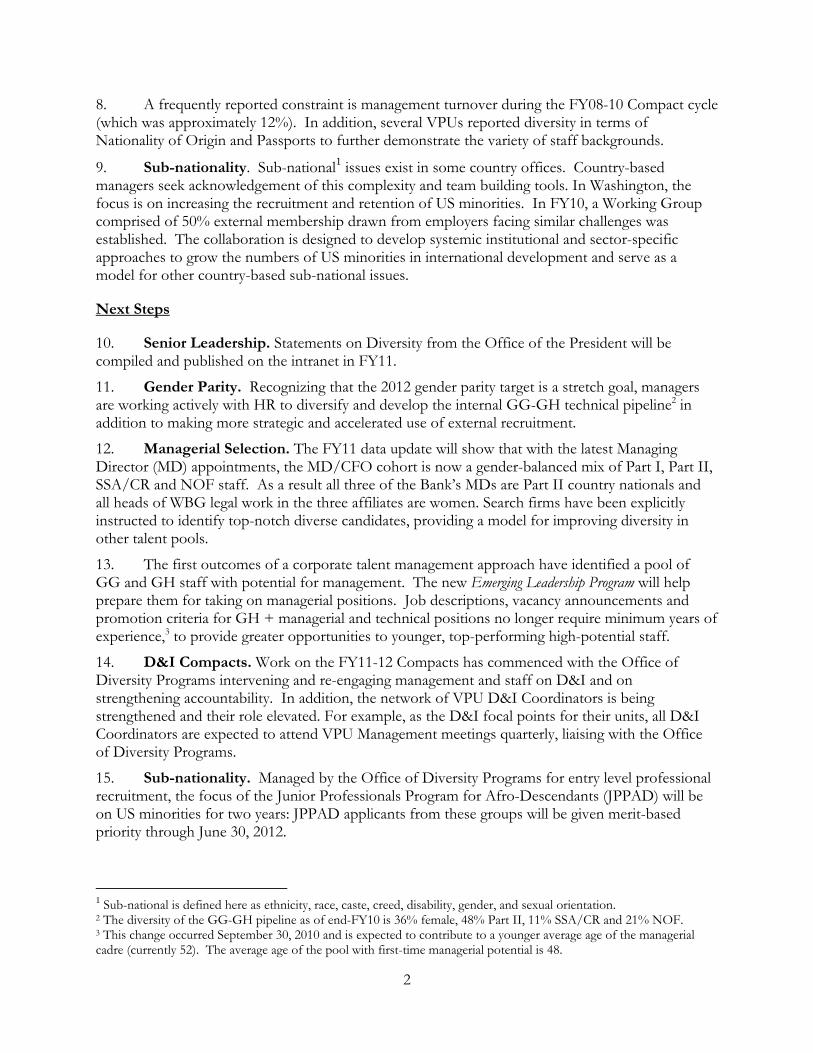
lic D
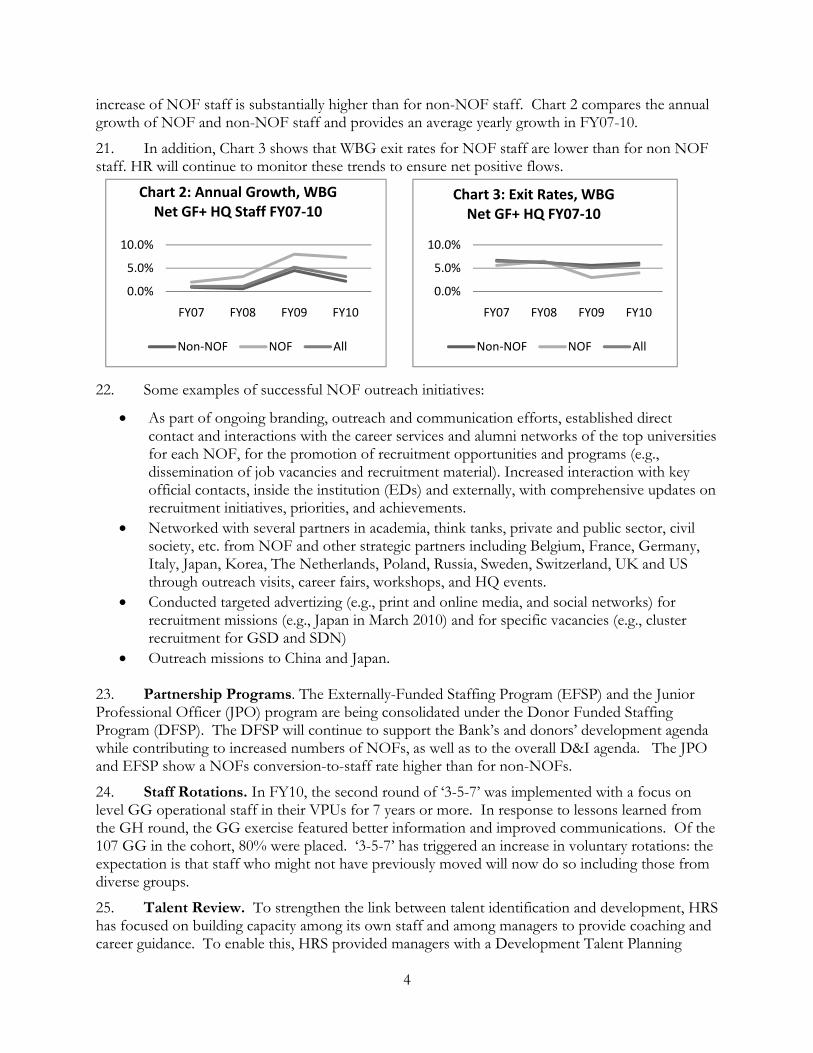
iscl
osur
e A
utho
rized
Pub
lic D
iscl
osur
e A
utho
rized
Pub
lic D
iscl
osur
e A
utho
rized
Pub
lic D
iscl
osur
e A
utho
rized
Pub
lic D
iscl
osur
e A
utho
rized
Pub
lic D
iscl
osur
e A
utho
rized
Diversity and Inclusion Strategy Table of Contents Executive Summary .............................................................................................................................. i I. D&I Action Plan Implementation ................................................................................................. 1 II. D&I at MIGA ............................................................................................................................... 12 III. D&I at IFC ................................................................................................................................... 14 Annex 1: D & I Activities Strategy Action Plan ............................................................................ 17 Annex 2: Educational Diversity ....................................................................................................... 22 Annex 3: Staff Survey Questions ..................................................................................................... 27 Annex 4: IFC’s Talent Review Process ........................................................................................... 28 Annex 5: Results of IFC’s Second Talent Review Process FY10 ............................................... 29 Box 1: The Junior Professionals Program for Afro-Descendants ................................................ 6 Box 2: What is Inclusion? ............................................................................................................... 9 Box 3: Educational Diversity .......................................................................................................... 10 Box 4: Language Diversity ............................................................................................................... 11 Box 5: IFC Women Helping Women ............................................................................................. 16 Chart 1: WBG Diversity Index ........................................................................................................... i Chart 2: Annual Growth WBG GF+ HQ Net Staff FY07-10 ..................................................... 4 Chart 3: Exit Rates, WBG Net GF+ on HQ Appointments ........................................................ 4 Chart 4: Diversity of the Managerial Cadre FY08-10 ..................................................................... 8 Table 1: Diversity of Grade GF HQ Hires, FY07-10 .................................................................... 3 Table 2: WBG Diversity Targets Net and All Staff by Organization FY08-10 .......................... 7 Table 3: Ratios of Average Salaries by Group and Grade ............................................................. 8 Table 4: Exits by Diversity Group of WBG GF+ Net Staff FY08-10 ....................................... 8
Acknowledgements This paper was produced by the Office of Diversity Programs, Julie Oyegun (Chief Diversity Officer), Richard Crabbe, Paula Donovan, Pauline Ramprasad, and Moira Sutherland, under the supervision of Hasan Tuluy, Vice President, HRS and Dorothy Berry, Vice President, CHA. Input was provided by Emmett Cunningham, Anna-Maria Eftimiadis, Conchita Espino, Paolo Gallo, Declan Heery, Véronique Kabongo, Maneesh Limaye, Daryl Lucas, Mohini Malhotra, Patricia Neill, Vinh Nguyen, Helen Diaz Page, Negar Rafikian, Sheila Reines, Oumar Seydi, Yaminee Sharma, Sandor Vegh, Rajesh Vidyasagar, and Rosan Zorrilla.
Acronyms & Abbreviations
CD Country Director CHA Human Resources, Communications, and Administration (IFC) CM Country Manager CO Country Office D&I Diversity & Inclusion DFSP Donor Funded Staffing Program DIAG Diversity & Inclusion Advisory Group EFSP Externally Funded Staffing Program FACs Finance, Administrative and Corporate units FPD Financial and Private Sector Development Unit GLOBE GSD
Gay, Lesbian, and Bisexual Employees General Services Department
HD Human Development Network HRC Human Resources Committee of the Board HRO Human Resources Officer HRS Human Resources Vice-Presidency HRSDP WBG Office of Diversity Programs HRSLB Learning Board Unit HRSLO Leadership and Organizational Effectiveness Unit IO Investment Officer JPO Junior Professional Officer JPPAD Junior Professionals Program for Afro-Descendants LCR Latin America and Caribbean Region LGBT Lesbian, Gay, Bisexual, Transgender MD Managing Director MLP Managerial Leadership Program MPP MIGA Professionals Program NOF Nationalities of Focus OPE Overall Performance Evaluation OVPs Operations Vice Presidents PMU Primary Management Unit SMT Senior Management Team SSA/CR Sub-Saharan Africa/Caribbean nationals TOR Terms of Reference VPU Vice Presidential Units WBG World Bank Group YPP Young Professionals Program

This page left intentionally blank.
i
75%
80%
85%
90%
95%
FY07 FY08 FY09 FY10
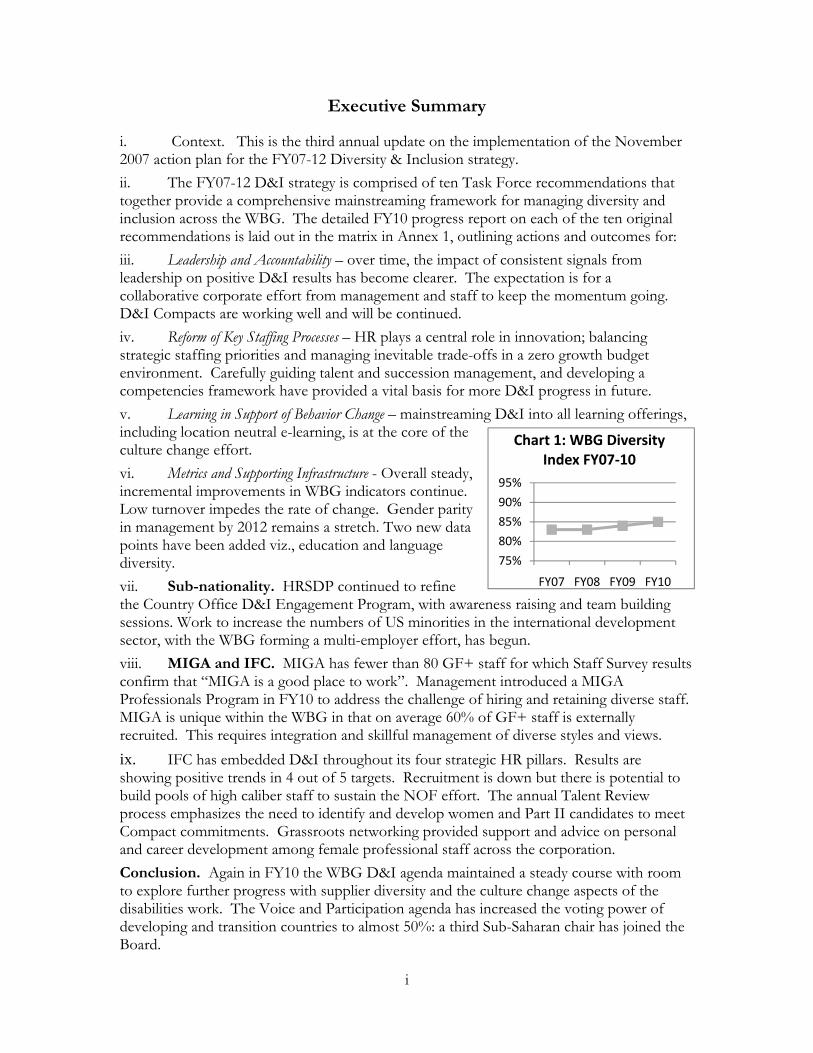
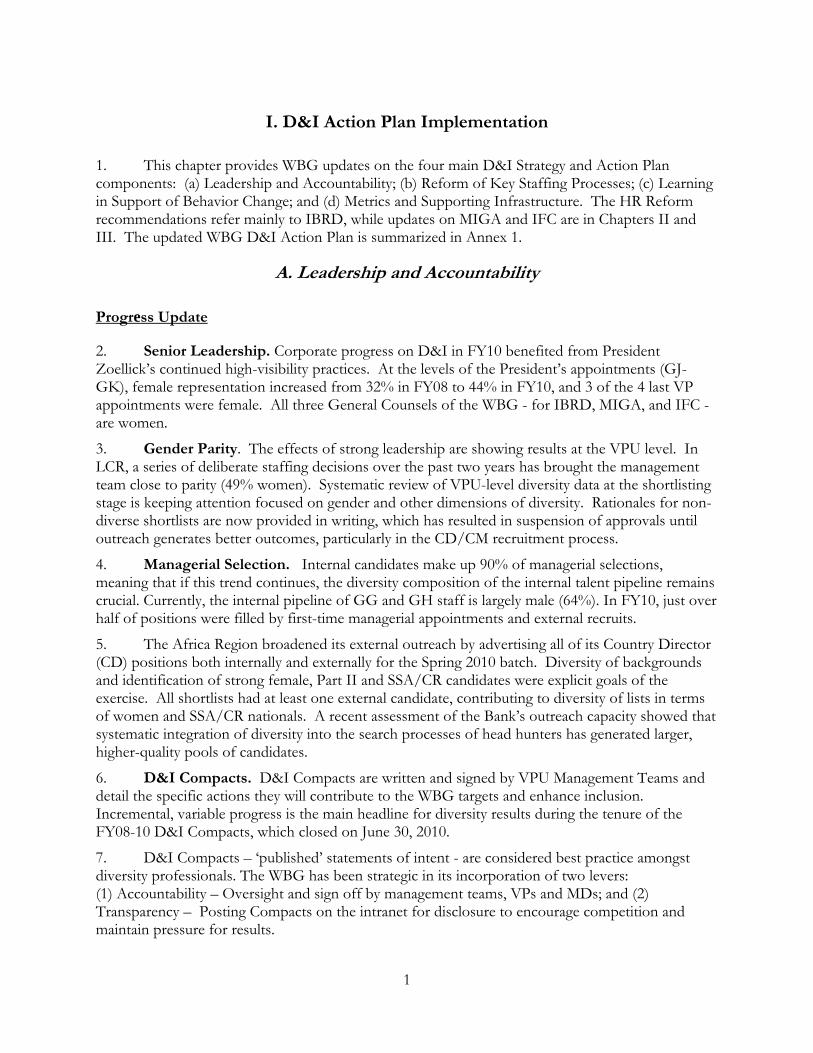
Chart 1: WBG Diversity Index FY07‐10
Executive Summary
i. Context. This is the third annual update on the implementation of the November 2007 action plan for the FY07-12 Diversity & Inclusion strategy.
ii. The FY07-12 D&I strategy is comprised of ten Task Force recommendations that together provide a comprehensive mainstreaming framework for managing diversity and inclusion across the WBG. The detailed FY10 progress report on each of the ten original recommendations is laid out in the matrix in Annex 1, outlining actions and outcomes for:
iii. Leadership and Accountability – over time, the impact of consistent signals from leadership on positive D&I results has become clearer. The expectation is for a collaborative corporate effort from management and staff to keep the momentum going. D&I Compacts are working well and will be continued.
iv. Reform of Key Staffing Processes – HR plays a central role in innovation; balancing strategic staffing priorities and managing inevitable trade-offs in a zero growth budget environment. Carefully guiding talent and succession management, and developing a competencies framework have provided a vital basis for more D&I progress in future.
v. Learning in Support of Behavior Change – mainstreaming D&I into all learning offerings, including location neutral e-learning, is at the core of the culture change effort.
vi. Metrics and Supporting Infrastructure - Overall steady, incremental improvements in WBG indicators continue. Low turnover impedes the rate of change. Gender parity in management by 2012 remains a stretch. Two new data points have been added viz., education and language diversity.
vii. Sub-nationality. HRSDP continued to refine the Country Office D&I Engagement Program, with awareness raising and team building sessions. Work to increase the numbers of US minorities in the international development sector, with the WBG forming a multi-employer effort, has begun.
viii. MIGA and IFC. MIGA has fewer than 80 GF+ staff for which Staff Survey results confirm that “MIGA is a good place to work”. Management introduced a MIGA Professionals Program in FY10 to address the challenge of hiring and retaining diverse staff. MIGA is unique within the WBG in that on average 60% of GF+ staff is externally recruited. This requires integration and skillful management of diverse styles and views.
ix. IFC has embedded D&I throughout its four strategic HR pillars. Results are showing positive trends in 4 out of 5 targets. Recruitment is down but there is potential to build pools of high caliber staff to sustain the NOF effort. The annual Talent Review process emphasizes the need to identify and develop women and Part II candidates to meet Compact commitments. Grassroots networking provided support and advice on personal and career development among female professional staff across the corporation.
Conclusion. Again in FY10 the WBG D&I agenda maintained a steady course with room to explore further progress with supplier diversity and the culture change aspects of the disabilities work. The Voice and Participation agenda has increased the voting power of developing and transition countries to almost 50%: a third Sub-Saharan chair has joined the Board.

This page left intentionally blank.
1
I. D&I Action Plan Implementation
1. This chapter provides WBG updates on the four main D&I Strategy and Action Plan components: (a) Leadership and Accountability; (b) Reform of Key Staffing Processes; (c) Learning in Support of Behavior Change; and (d) Metrics and Supporting Infrastructure. The HR Reform recommendations refer mainly to IBRD, while updates on MIGA and IFC are in Chapters II and III. The updated WBG D&I Action Plan is summarized in Annex 1.
A. Leadership and Accountability
Progress Update
2. Senior Leadership. Corporate progress on D&I in FY10 benefited from President Zoellick’s continued high-visibility practices. At the levels of the President’s appointments (GJ-GK), female representation increased from 32% in FY08 to 44% in FY10, and 3 of the 4 last VP appointments were female. All three General Counsels of the WBG - for IBRD, MIGA, and IFC - are women.
3. Gender Parity. The effects of strong leadership are showing results at the VPU level. In LCR, a series of deliberate staffing decisions over the past two years has brought the management team close to parity (49% women). Systematic review of VPU-level diversity data at the shortlisting stage is keeping attention focused on gender and other dimensions of diversity. Rationales for non-diverse shortlists are now provided in writing, which has resulted in suspension of approvals until outreach generates better outcomes, particularly in the CD/CM recruitment process.
4. Managerial Selection. Internal candidates make up 90% of managerial selections, meaning that if this trend continues, the diversity composition of the internal talent pipeline remains crucial. Currently, the internal pipeline of GG and GH staff is largely male (64%). In FY10, just over half of positions were filled by first-time managerial appointments and external recruits.
5. The Africa Region broadened its external outreach by advertising all of its Country Director (CD) positions both internally and externally for the Spring 2010 batch. Diversity of backgrounds and identification of strong female, Part II and SSA/CR candidates were explicit goals of the exercise. All shortlists had at least one external candidate, contributing to diversity of lists in terms of women and SSA/CR nationals. A recent assessment of the Bank’s outreach capacity showed that systematic integration of diversity into the search processes of head hunters has generated larger, higher-quality pools of candidates.
6. D&I Compacts. D&I Compacts are written and signed by VPU Management Teams and detail the specific actions they will contribute to the WBG targets and enhance inclusion. Incremental, variable progress is the main headline for diversity results during the tenure of the FY08-10 D&I Compacts, which closed on June 30, 2010.
7. D&I Compacts – ‘published’ statements of intent - are considered best practice amongst diversity professionals. The WBG has been strategic in its incorporation of two levers: (1) Accountability – Oversight and sign off by management teams, VPs and MDs; and (2) Transparency – Posting Compacts on the intranet for disclosure to encourage competition and maintain pressure for results.
2
8. A frequently reported constraint is management turnover during the FY08-10 Compact cycle (which was approximately 12%). In addition, several VPUs reported diversity in terms of Nationality of Origin and Passports to further demonstrate the variety of staff backgrounds.
9. Sub-nationality. Sub-national1 issues exist in some country offices. Country-based managers seek acknowledgement of this complexity and team building tools. In Washington, the focus is on increasing the recruitment and retention of US minorities. In FY10, a Working Group comprised of 50% external membership drawn from employers facing similar challenges was established. The collaboration is designed to develop systemic institutional and sector-specific approaches to grow the numbers of US minorities in international development and serve as a model for other country-based sub-national issues.
Next Steps
10. Senior Leadership. Statements on Diversity from the Office of the President will be compiled and published on the intranet in FY11.
11. Gender Parity. Recognizing that the 2012 gender parity target is a stretch goal, managers are working actively with HR to diversify and develop the internal GG-GH technical pipeline2 in addition to making more strategic and accelerated use of external recruitment.
12. Managerial Selection. The FY11 data update will show that with the latest Managing Director (MD) appointments, the MD/CFO cohort is now a gender-balanced mix of Part I, Part II, SSA/CR and NOF staff. As a result all three of the Bank’s MDs are Part II country nationals and all heads of WBG legal work in the three affiliates are women. Search firms have been explicitly instructed to identify top-notch diverse candidates, providing a model for improving diversity in other talent pools.
13. The first outcomes of a corporate talent management approach have identified a pool of GG and GH staff with potential for management. The new Emerging Leadership Program will help prepare them for taking on managerial positions. Job descriptions, vacancy announcements and promotion criteria for GH + managerial and technical positions no longer require minimum years of experience,3 to provide greater opportunities to younger, top-performing high-potential staff.
14. D&I Compacts. Work on the FY11-12 Compacts has commenced with the Office of Diversity Programs intervening and re-engaging management and staff on D&I and on strengthening accountability. In addition, the network of VPU D&I Coordinators is being strengthened and their role elevated. For example, as the D&I focal points for their units, all D&I Coordinators are expected to attend VPU Management meetings quarterly, liaising with the Office of Diversity Programs.
15. Sub-nationality. Managed by the Office of Diversity Programs for entry level professional recruitment, the focus of the Junior Professionals Program for Afro-Descendants (JPPAD) will be on US minorities for two years: JPPAD applicants from these groups will be given merit-based priority through June 30, 2012.
1 Sub-national is defined here as ethnicity, race, caste, creed, disability, gender, and sexual orientation. 2 The diversity of the GG-GH pipeline as of end-FY10 is 36% female, 48% Part II, 11% SSA/CR and 21% NOF. 3 This change occurred September 30, 2010 and is expected to contribute to a younger average age of the managerial cadre (currently 52). The average age of the pool with first-time managerial potential is 48.

3
B. Reform of Key Staffing Processes
Progress Update
16. Clustered Recruitment. The Young Professionals Program (YPP) in IBRD4 continues to be the most successful example of WBG clustered recruitment, consistently adding to the institution’s staff diversity by bringing onboard high quality candidates, with diversity of nationality, gender, professional discipline and perspective, culture and social background. GSD and LEG also conducted successful clustered recruitment pilots in FY10.
17. Table 1 compares the aggregate diversity breakdown of the last 4 YPP cohorts to non-YPP GF HQ recruitment in the same years. It shows that the YPP clustered recruitment out-performed non-YPP GF HQ hires in all diversity indicators tracked.
Table 1. Diversity of Grade GF HQ Net Staff Hires in IBRD, FY07-10
Demographic Non YPP YPP Total GF HQ net hires Women 47 % (195) 50 % (63) 47 % (258)Part 2 44 % (184) 50 % (64) 46 % (248)SSA/CR 9 % (38) 14 % (18) 10 % (56)NOF 23 % (94) 39 % (49) 26 % (143)
18. The YPP contributed to about 30% of the total international staff recruited at GF in operations over the last 5 years although hundreds of highly qualified candidates were thoroughly vetted in the course of the rigorous YPP selection process. Regional management teams now review lists of the ‘near misses’: thoroughly vetted but not selected (often for budgetary reasons) NOF YP candidates for potential appointments. Success is also due to the use of targeted recruitment and strategic staffing plans to specifically match NOF candidates to growth sectors and/or vacant positions. Consequently, the number of NOFs has steadily increased in the regions, particularly in LCR, MNA, and SAR.
19. Nationalities of Focus (NOF). As described in earlier HRC D&I Updates, the current list of 225 NOFs was drawn up in 2007 with the proviso that the list would be reviewed and revised by management every two years. At the December 2009 HRC meeting, members agreed with management to delay updating the NOF list, pending the outcome of the Voice and Participation agenda at the 2010 Spring Meetings (which should be finalized by March 31, 2011).
20. The WBG was able to achieve an aggregate net positive inflow of staff from NOFs in FY10, despite the constraint of low turnover. Over the last four years, the annual net flow of NOF staff at grades GF+ has gone from 20 in FY07 to 78 in FY10 (33 in FY08 and 86 in FY09). The relative
4 IFC’s Global Transactions Team (GTT) was on hold in FY10. It is being updated to better align with IFC’s decentralized model now in place. 5 The underlying principle is that WBG staffing (GF+) should bear some relationship to each member country’s participation in WBG activities. NOFs criteria are a combination of three factors: (1) Contribution to the Bank’s equity, as reflected by IBRD or IFC voting shares; (2) Contribution to the Bank’s operating income, as reflected by the cumulative volume of loans and credits (IBRD) and portfolio numbers (IFC); and (3) Cash transfers most directly linked to poverty alleviation, as reflected by cumulative contributions to IDA. The 22 NOF countries in FY07-11 are: Argentina, Brazil, China, Egypt, Germany, Indonesia, Italy, Japan, Korea, Kuwait, Mexico, Morocco, Netherlands, Norway, Poland, Romania, Russia, Saudi Arabia, Sweden, Switzerland, Thailand and Turkey.
4
0.0%
5.0%
10.0%
FY07 FY08 FY09 FY10
Chart 2: Annual Growth, WBG Net GF+ HQ Staff FY07‐10
Non‐NOF NOF All
0.0%
5.0%
10.0%
FY07 FY08 FY09 FY10
Chart 3: Exit Rates, WBG Net GF+ HQ FY07‐10
Non‐NOF NOF All
increase of NOF staff is substantially higher than for non-NOF staff. Chart 2 compares the annual growth of NOF and non-NOF staff and provides an average yearly growth in FY07-10.
21. In addition, Chart 3 shows that WBG exit rates for NOF staff are lower than for non NOF staff. HR will continue to monitor these trends to ensure net positive flows.
22. Some examples of successful NOF outreach initiatives:
As part of ongoing branding, outreach and communication efforts, established direct contact and interactions with the career services and alumni networks of the top universities for each NOF, for the promotion of recruitment opportunities and programs (e.g., dissemination of job vacancies and recruitment material). Increased interaction with key official contacts, inside the institution (EDs) and externally, with comprehensive updates on recruitment initiatives, priorities, and achievements.
Networked with several partners in academia, think tanks, private and public sector, civil society, etc. from NOF and other strategic partners including Belgium, France, Germany, Italy, Japan, Korea, The Netherlands, Poland, Russia, Sweden, Switzerland, UK and US through outreach visits, career fairs, workshops, and HQ events.
Conducted targeted advertizing (e.g., print and online media, and social networks) for recruitment missions (e.g., Japan in March 2010) and for specific vacancies (e.g., cluster recruitment for GSD and SDN)
Outreach missions to China and Japan.
23. Partnership Programs. The Externally-Funded Staffing Program (EFSP) and the Junior Professional Officer (JPO) program are being consolidated under the Donor Funded Staffing Program (DFSP). The DFSP will continue to support the Bank’s and donors’ development agenda while contributing to increased numbers of NOFs, as well as to the overall D&I agenda. The JPO and EFSP show a NOFs conversion-to-staff rate higher than for non-NOFs.
24. Staff Rotations. In FY10, the second round of ‘3-5-7’ was implemented with a focus on level GG operational staff in their VPUs for 7 years or more. In response to lessons learned from the GH round, the GG exercise featured better information and improved communications. Of the 107 GG in the cohort, 80% were placed. ‘3-5-7’ has triggered an increase in voluntary rotations: the expectation is that staff who might not have previously moved will now do so including those from diverse groups.
25. Talent Review. To strengthen the link between talent identification and development, HRS has focused on building capacity among its own staff and among managers to provide coaching and career guidance. To enable this, HRS provided managers with a Development Talent Planning
5
Toolkit. The toolkit links managers to information on developmental and stretch assignments, coaching, mentoring and leadership learning programs for their staff.
26. The FY09/10 corporate exercise introduced a method for identifying future managers based on potential as well as performance indicators.6 The exercise generated a pool of nearly 600 staff at various stages of readiness for managerial positions. The diversity profile of this pool—38% women, 42% Part II, 10% SSA/CR, 18% NOFs—is not markedly different from that of the existing managerial cadre. This indicates the need for more selective and targeted talent identification and development as well as sustained managerial focus on diversity, inclusion and talent development.
27. 33% of candidates for leadership training programs and vacancies are drawn from this pool. Identification of diverse groups within the pool (women, SSA/CR and NOF candidates) has helped managers improve the diversity of their nominations for training and candidate rosters.
28. Exit Interviews. In the third cohort of exit interviews conducted by HRSDP, a random sample of 10 former YPs who left at midcareer were contacted. The purpose of the research was to assess, from a D&I perspective, how each targeted participant experienced his/her own career development and the extent to which HR policies were perceived to help or hinder D&I retention goals. The FY10 interviews yielded consistent messages regardless of gender:
Deskilling was the most significant concern cited. Management is the only career progression option, a feature that moves staff away from technical work.
Work location was a key determinant with implications for decentralization. Staff interviewed expressed the preference for raising their families closer to home.
Competition for the profile of staff sampled is high from a host of agencies including consulting, making retention a challenge.
Next Steps
29. Clustered Recruitment. Management is considering expanding the YPP annual intake in phases up to 50 YPs from the current 35. The expansion will be accompanied by improvements in the orientation and training programs for incoming YPs.
30. Network Sector Boards will be expected to play a greater role in identification of and outreach to diverse candidates. The FPD Network has presented a proposal to the Matrix Leadership team to pilot an improved talent management program (amongst other themes) to encourage cross support; match skills to demand; nurture technical talent; address skills issues and manage performance, all of which will facilitate better diversity management and enhance inclusion.
31. NOFs. At the end of FY11, a new NOFs list will be created using existing criteria, adjusted for the new Voice and Participation share allocations, which will be finalized by March 31, 2011. The practice of review and revision will continue at regular intervals, based on strategic criteria including shareholding and salient business imperatives going forward.
32. The WBG will continue to undertake activities aimed at attracting NOF staff from the list of 22 countries. HRS continues to contact high performing NOF staff for referrals (e.g., associations, fellow alumni, and networks) to identify potential recruits and generate a talent pool of staff-referred NOF candidates. HR Teams, seeking diverse candidates on behalf of hiring managers, are
6 26 VPUs used a performance-potential matrix to organize the outcomes of discussions on managerial potential (staff ready now or ready in 1-3 years for management and Director positions).
6
encouraged to use i-Refer, the Bank’s staff referral incentive program, and its “hot jobs” feature to market vacancies.
33. Competencies. Inclusion of CO staff and their perspectives is a component of the new work coming from the Competencies’ Steering Group. Going forward performance expectations will be more explicit and transparent, thereby reducing room for implicit bias in decision-making that can affect career outcomes for non-traditional talent.
34. Talent Review. A goal of the FY11 talent identification exercise is to ensure that 100% of the talent pool have development plans, up from the current 15%.
35. A feature of the new eTalent system is better tracking of the talent pool, including diversity monitoring. The tool will improve the identification of trends and potential gaps to inform internal pipeline management.
C. Learning in Support of Behavior Change
Progress Update
36. Learning strategy. There has been strong endorsement by the OVPs for both the Learning Strategy and its proposed implementation. The strategy is designed for staff to master team building, utilizing different perspectives from clients and partners. It also:
Proposes a more structured Staff Learning Program to equip staff to be globally deployable.
Requires increased rigor in monitoring and evaluating staff learning programs, incorporating D&I indicators.
Calls for geographically neutral access to learning opportunities – and data shows that more field offerings increase participation by Part II nationals.
37. The Rosetta Stone Pilot Project was launched to leverage commercially available language software to extend the Bank’s language training programs into the field.
Box 1: Junior Professionals Program for Afro-Descendents & US Minorities (JPPAD)
The Junior Professionals Program for Afro-Descendents & US Minorities (JPPAD) is a recruitment program housed in the World Bank Group Office of Diversity Programs (administered by HRSDP) designed to provide young, and highly motivated black international talent of outstanding potential with a unique career opportunity to gain experience in a global development environment.
JPADs are encouraged to compete for staff appointments towards the end of their two year term to improve the Bank’s overall diversity and inclusion composition.
Since its inception in 1999, 47 JPADs have graduated, 19 (40%) of whom have continued at the Bank Group; and an additional 6 are STCs or ETCs (for a retention total of 53%). At the end of FY10, there were 15 JPADs, 5 of whom are African-American.
The program has been expanded to include all US minorities. In FY11 and FY12, priority will be given to US minorities.
7
38. Leadership Learning includes a peer learning component that is designed to bring Bank leaders together to share and exchange business knowledge and skills. D&I is becoming an integral part of this and CD/CM training.
Next Steps
39. Leadership Learning. Both the Emerging Leadership Program (ELP) and the Managerial Leadership Program (MLP) will include new D&I modules and ensure participation of a good mix of diverse staff. A Managerial Survival Kit is being designed for e-Platform. It is expected that D&I will be a component of the tool.
D. Metrics and Supporting Infrastructure
Progress Update
40. Staff on Board. The WBG continues to track progress on gender, nationality and a proxy for race (SSA/CR nationals) against a set of indicators with targets established in FY98, based on professional-level (GF+) staff on the Administrative budget (net).
41. The Diversity Index7 shows that, overall, incremental but systematic progress has been accomplished since FY06, moving the cumulative score from .81 to .85 (see Chart 1 on page i).
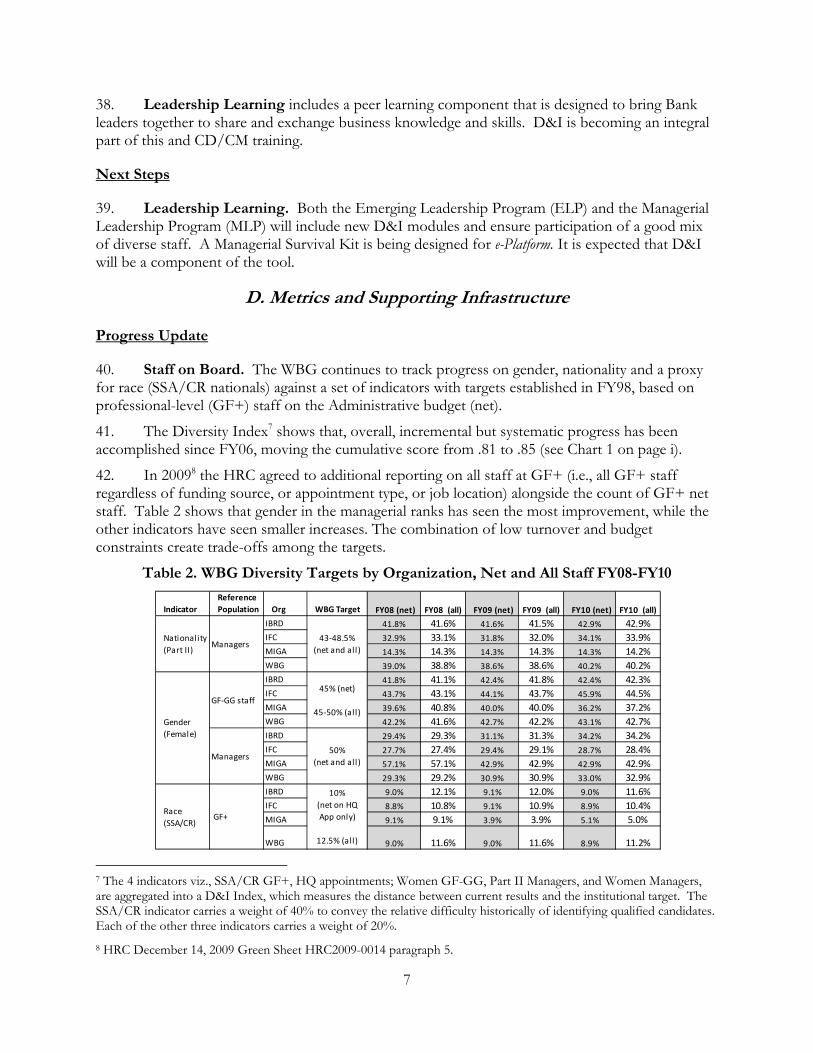
42. In 20098 the HRC agreed to additional reporting on all staff at GF+ (i.e., all GF+ staff regardless of funding source, or appointment type, or job location) alongside the count of GF+ net staff. Table 2 shows that gender in the managerial ranks has seen the most improvement, while the other indicators have seen smaller increases. The combination of low turnover and budget constraints create trade-offs among the targets.
Table 2. WBG Diversity Targets by Organization, Net and All Staff FY08-FY10
7 The 4 indicators viz., SSA/CR GF+, HQ appointments; Women GF-GG, Part II Managers, and Women Managers, are aggregated into a D&I Index, which measures the distance between current results and the institutional target. The SSA/CR indicator carries a weight of 40% to convey the relative difficulty historically of identifying qualified candidates. Each of the other three indicators carries a weight of 20%. 8 HRC December 14, 2009 Green Sheet HRC2009-0014 paragraph 5.
Indicator
Reference
Population Org WBG Target FY08 (net) FY08 (all) FY09 (net) FY09 (all) FY10 (net) FY10 (all)
IBRD 41.8% 41.6% 41.6% 41.5% 42.9% 42.9%
IFC 32.9% 33.1% 31.8% 32.0% 34.1% 33.9%
MIGA 14.3% 14.3% 14.3% 14.3% 14.3% 14.2%
WBG 39.0% 38.8% 38.6% 38.6% 40.2% 40.2%
IBRD 41.8% 41.1% 42.4% 41.8% 42.4% 42.3%
IFC 43.7% 43.1% 44.1% 43.7% 45.9% 44.5%
MIGA 39.6% 40.8% 40.0% 40.0% 36.2% 37.2%
WBG 42.2% 41.6% 42.7% 42.2% 43.1% 42.7%
IBRD 29.4% 29.3% 31.1% 31.3% 34.2% 34.2%
IFC 27.7% 27.4% 29.4% 29.1% 28.7% 28.4%
MIGA 57.1% 57.1% 42.9% 42.9% 42.9% 42.9%
WBG 29.3% 29.2% 30.9% 30.9% 33.0% 32.9%
IBRD 9.0% 12.1% 9.1% 12.0% 9.0% 11.6%
IFC 8.8% 10.8% 9.1% 10.9% 8.9% 10.4%
MIGA 9.1% 9.1% 3.9% 3.9% 5.1% 5.0%
WBG 9.0% 11.6% 9.0% 11.6% 8.9% 11.2%
Race
(SSA/CR) GF+
10%
(net on HQ
App only)
12.5% (al l)
Nationality
(Part II)Managers
43‐48.5%
(net and all)
Gender
(Female)
GF‐GG staff
45% (net)
45‐50% (all)
Managers50%
(net and all)
8
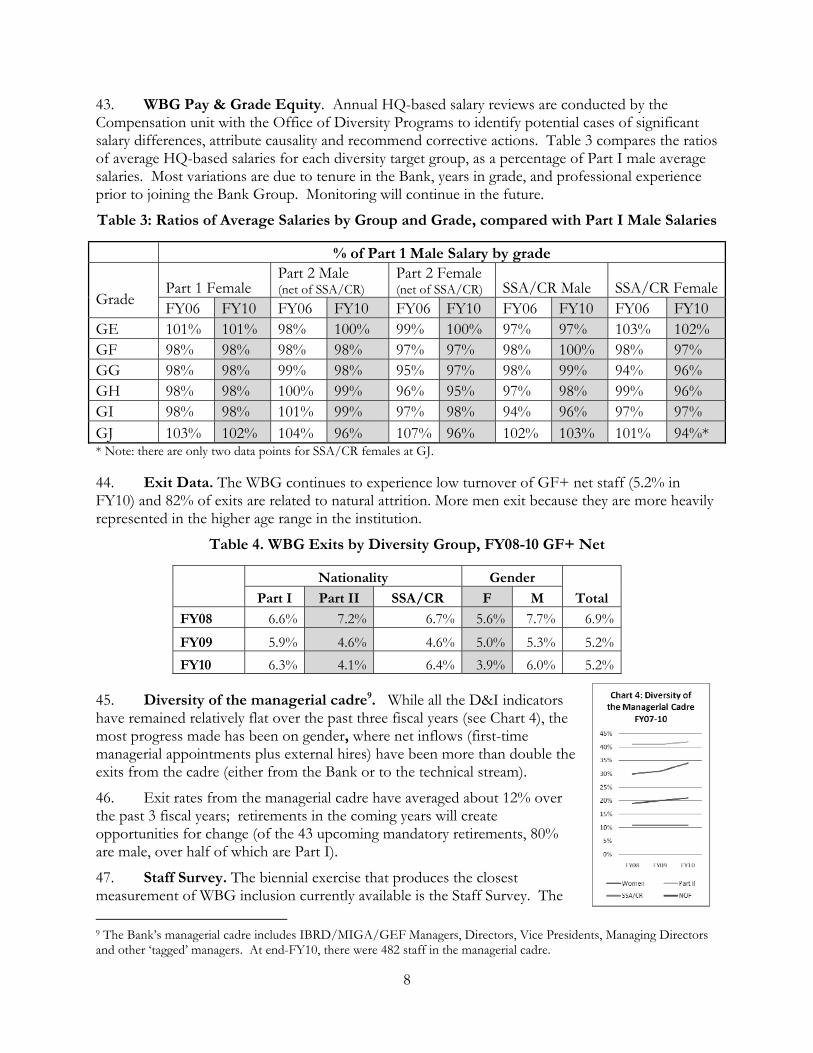
43. WBG Pay & Grade Equity. Annual HQ-based salary reviews are conducted by the Compensation unit with the Office of Diversity Programs to identify potential cases of significant salary differences, attribute causality and recommend corrective actions. Table 3 compares the ratios of average HQ-based salaries for each diversity target group, as a percentage of Part I male average salaries. Most variations are due to tenure in the Bank, years in grade, and professional experience prior to joining the Bank Group. Monitoring will continue in the future.
Table 3: Ratios of Average Salaries by Group and Grade, compared with Part I Male Salaries
% of Part 1 Male Salary by grade
Grade
Part 1 Female Part 2 Male (net of SSA/CR)
Part 2 Female (net of SSA/CR) SSA/CR Male SSA/CR Female
FY06 FY10 FY06 FY10 FY06 FY10 FY06 FY10 FY06 FY10 GE 101% 101% 98% 100% 99% 100% 97% 97% 103% 102% GF 98% 98% 98% 98% 97% 97% 98% 100% 98% 97% GG 98% 98% 99% 98% 95% 97% 98% 99% 94% 96% GH 98% 98% 100% 99% 96% 95% 97% 98% 99% 96% GI 98% 98% 101% 99% 97% 98% 94% 96% 97% 97% GJ 103% 102% 104% 96% 107% 96% 102% 103% 101% 94%* * Note: there are only two data points for SSA/CR females at GJ. 44. Exit Data. The WBG continues to experience low turnover of GF+ net staff (5.2% in FY10) and 82% of exits are related to natural attrition. More men exit because they are more heavily represented in the higher age range in the institution.
Table 4. WBG Exits by Diversity Group, FY08-10 GF+ Net
Nationality Gender
Total Part I Part II SSA/CR F M
FY08 6.6% 7.2% 6.7% 5.6% 7.7% 6.9%
FY09 5.9% 4.6% 4.6% 5.0% 5.3% 5.2%
FY10 6.3% 4.1% 6.4% 3.9% 6.0% 5.2%
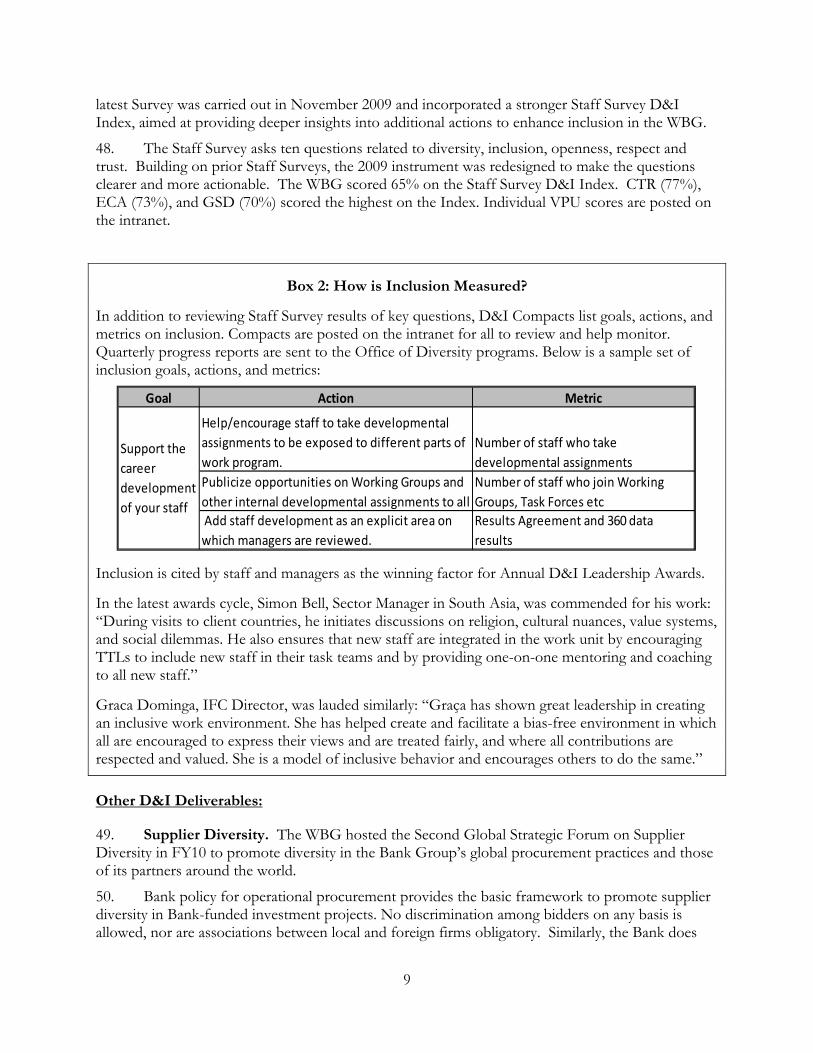
45. Diversity of the managerial cadre9. While all the D&I indicators have remained relatively flat over the past three fiscal years (see Chart 4), the most progress made has been on gender, where net inflows (first-time managerial appointments plus external hires) have been more than double the exits from the cadre (either from the Bank or to the technical stream).
46. Exit rates from the managerial cadre have averaged about 12% over the past 3 fiscal years; retirements in the coming years will create opportunities for change (of the 43 upcoming mandatory retirements, 80% are male, over half of which are Part I).
47. Staff Survey. The biennial exercise that produces the closest measurement of WBG inclusion currently available is the Staff Survey. The
9 The Bank’s managerial cadre includes IBRD/MIGA/GEF Managers, Directors, Vice Presidents, Managing Directors and other ‘tagged’ managers. At end-FY10, there were 482 staff in the managerial cadre.
9
latest Survey was carried out in November 2009 and incorporated a stronger Staff Survey D&I Index, aimed at providing deeper insights into additional actions to enhance inclusion in the WBG.
48. The Staff Survey asks ten questions related to diversity, inclusion, openness, respect and trust. Building on prior Staff Surveys, the 2009 instrument was redesigned to make the questions clearer and more actionable. The WBG scored 65% on the Staff Survey D&I Index. CTR (77%), ECA (73%), and GSD (70%) scored the highest on the Index. Individual VPU scores are posted on the intranet.
Box 2: How is Inclusion Measured?
In addition to reviewing Staff Survey results of key questions, D&I Compacts list goals, actions, and metrics on inclusion. Compacts are posted on the intranet for all to review and help monitor. Quarterly progress reports are sent to the Office of Diversity programs. Below is a sample set of inclusion goals, actions, and metrics:
Inclusion is cited by staff and managers as the winning factor for Annual D&I Leadership Awards.
In the latest awards cycle, Simon Bell, Sector Manager in South Asia, was commended for his work: “During visits to client countries, he initiates discussions on religion, cultural nuances, value systems, and social dilemmas. He also ensures that new staff are integrated in the work unit by encouraging TTLs to include new staff in their task teams and by providing one-on-one mentoring and coaching to all new staff.”
Graca Dominga, IFC Director, was lauded similarly: “Graça has shown great leadership in creating an inclusive work environment. She has helped create and facilitate a bias-free environment in which all are encouraged to express their views and are treated fairly, and where all contributions are respected and valued. She is a model of inclusive behavior and encourages others to do the same.”
Other D&I Deliverables:
49. Supplier Diversity. The WBG hosted the Second Global Strategic Forum on Supplier Diversity in FY10 to promote diversity in the Bank Group’s global procurement practices and those of its partners around the world.
50. Bank policy for operational procurement provides the basic framework to promote supplier diversity in Bank-funded investment projects. No discrimination among bidders on any basis is allowed, nor are associations between local and foreign firms obligatory. Similarly, the Bank does
Goal Action Metric
Help/encourage staff to take developmental
assignments to be exposed to different parts of
work program.
Number of staff who take
developmental assignments
Publicize opportunities on Working Groups and
other internal developmental assignments to all
Number of staff who join Working
Groups, Task Forces etc
Add staff development as an explicit area on
which managers are reviewed.
Results Agreement and 360 data
results
Support the
career
development
of your staff
10
not include mandatory conditions in bidding documents based on any criteria other than technical and financial. Bidders decide on the content of their bids in terms of personnel, supplies, equipment, and associations.
51. While this degree of neutrality alone cannot guarantee equality of access, in FY10, the Bank developed an electronic tool to make all procurement notices under Bank-funded projects available on the internet, a reflection of the harmonization efforts with the other IFIs, who already publish their notices. This free and transparent service will help raise awareness of bidding opportunities to prospective bidders across the globe, including small- and medium-sized businesses.
52. Sexual Orientation. In March 2010, HRSDP partnered with GLOBE to present three external speakers on various aspects of LGBT work place equity, with particular emphasis on immigration rights in the USA for domestic partners of LGBT G4 visa holders.
Box 3: Educational Diversity
A review of World Bank Group staff educational data indicates that staff earned academic degrees from 3,400 different educational institutions in 150 countries. Over 62% of staff, at all levels, who completed degrees indicated at least a Masters degree in their profile, and almost 16% a Doctoral degree. About 47% of all degree studies had some economics, business, or finance focus, but academic areas covered a range of disciplines from Accounting to Zoology. Overall, more than 50% of staff have obtained at least one degree from a school in a country different than their nationality.
Over the last 20-30 years the academic background of staff has continued to be drawn from a wider variety of countries, schools, and disciplines. While degrees from the United States and, to some extent, the Philippines are highly concentrated in the population with the longest service, degrees, for example, from Germany, Australia, and Italy are becoming more prevalent among newer staff.
The majority of highest degrees earned by current managers were obtained in the U.S. (51%), the UK (13%), and France (8%). Among this group, 50% received their highest degrees from the same 25 schools. However, one third of current managers have at least one degree from a university in a Part II country. At the same time, universities in the U.S., the UK, France, and elsewhere have diversified their student population. For example, 75% of UK degrees held by Bank staff were earned by non-UK nationals.
Annex 2 details educational diversity further.
53. Disabilities. The Bank continues to make its policies and facilities more accessible to people with disabilities, and to provide awareness training to staff. GSD reports that 24 IBRD-owned country offices and 37 leased spaces are now accessible to persons with disabilities. Work has been suspended on 29 leased spaces due to upcoming relocations. This ongoing effort ensures that as new offices come on line or relocate they will also be functionally accessible. The Disability Accommodation Fund (DAF) provides accommodations for staff with short term or long term disabilities. The DAF provided over 70 accommodations in FY10 totaling just under $200,000. The WBG disabilities policy and practices draws interest from external partners as a model.
11
Next Steps
54. New Indicators. The current SSA/CR target needs to be adjusted to ensure it is meaningful for the ‘all staff’ count (see para. 42). The FY10 SSA/CR all GF+ staff count is 11.2%. The difference is mainly attributed to SSA/CR nationals on CO appointments in the Africa region. The target for all SSA/CR will be increased to 12.5%, since that representation has consistently been about 2.5% higher than the HQ appointment-based target of 10%.
55. To better align with the managerial target of gender parity, the GF-GG gender target will become a range of 45-50%.
56. Staff Survey follow up action plans for every VPU have been created and posted on the intranet for full transparency. Many VPUs such as AFR have committed to inclusion-related activities including targeting the career growth of women and SSA/CRs, among other D&I actions. The next Staff Survey will be in November 2011 and will trend based on the 2009 D&I questions with a particular emphasis on six questions: 18, 30, 48, 56, 57, and 58 (see Annex 3).
57. Disabilities. In FY11, the Procurement Anchor is coordinating the authoring of a Bank-wide guidance note on accessibility/universal design in Bank projects. For example, if a WBG affiliate or partner helps build a school, it would be designed with accessibility features for the handicapped; computers for the school would allow access to deaf or blind persons. The note will be available to Bank staff. The Procurement Anchor, the Sustainable Development Network, and the Infrastructure Sector will hold a BBL and similar events to promote better awareness among Bank staff. These events will also create a means to exchange ideas on the development of case studies.
Box 4: Language Diversity
Similar to staff education data, language skills data are mostly self-reported. At the end of FY10, 61% of World Bank staff had language information entered into the system. Based on these records, 157 different languages are spoken at various levels, 144 of which are a staff member’s native tongue. Knowledge of English is indicated for 89% of staff. The average number of languages spoken by IBRD GF+ operational staff is 3.4. Three hundred forty seven staff tested “proficient” in one of the six Bank languages (i.e., Arabic, Chinese, French, Portuguese, Russian, Spanish), while 2,013 are native speakers of these languages.
Annex 2 has a chart on the top 20 languages spoken at the WBG.
12
II. D&I at MIGA 58. MIGA’s 2009 Staff Survey results validated to its Senior Management Team (SMT) that their efforts were paying off: half of the Survey questions showed that favorable ratings had improved by at least 10 points over the 2007 Survey; another 20% of questions showed improvements of at least five points10. One specific question summed up results best: MIGA is a good place to work. Favorable responses were now 60%, a significant improvement over the 32% in the 2007 Survey and the 26% in the 2005 Survey.
59. The arrival of the new Executive Vice President in late 2008, preceded by the arrival of the new Chief Operating Officer a few months earlier, energized the SMT into addressing MIGA’s culture challenge: staff were unhappy, and felt unappreciated, marginalized, and not sufficiently heard or respected. MIGA’s FY09-10 Diversity and Inclusion Compact main goal was to “create a respectful and inclusive work environment where diverse perspectives are valued”. The SMT initiated Open Houses to brief all MIGA staff on corporate issues and give staff an open forum to provide feedback. Those gatherings also served to celebrate various successes or milestones of the Agency and its staff: the conclusion of a challenging deal, an engaging Board discussion, a good-luck sendoff for someone retiring or leaving MIGA for another assignment.
60. In addition to Open Houses, several other initiatives were put in place to address staff concerns. For example:
Established an Induction Program for new MIGA staff, to provide clarity on the Agency’s goals and business model, and to initiate staff into MIGA culture, with the full participation of all SMT members.
Created Executive Vice President Awards, to reward teams that demonstrated creativity and success in their work.
Streamlined several operational procedures and established service standards, in response to staff’s frustration with burdensome processes and lack of clarity on standards.
Provided training sessions on OPEs, to improve the transparency of the process and clarify criteria.
61. Finally, to further demonstrate their accessibility and informality, SMT members walk the halls. They stop by for informal chats with staff and meet in staff’s offices. The exchanges are casual and friendly and staff respond positively to the new ethos.
62. The great strides that have been made to improve the culture have not yet resulted in improving diversity metrics. In fact, in response to the then-prevailing culture, many staff left the Agency in the last two years, including several diverse staff who felt particularly marginalized by the previous environment. This resulted in a drop in representation of women at grades GF and GG, and of SSA/CR staff at grades GF and above.
63. MIGA has fewer than 80 GF+ staff and therefore small changes in the composition of the group result in marked percentage changes. MIGA’s business – political risk insurance – is concentrated in Part I countries and many of its professionals have adopted the nationality of the
10 In addition, 25% of responses were about the same. Only 3 questions (6%) had less favorable ratings than in 2007. Total adds to more than 100% because of rounding.
13
host country. For example, while 51% of MIGA staff originated in Part 2 countries due to naturalization that number drops to 31%.
64. To address the challenge of hiring and retaining SSA/CRs, the SMT created the MIGA Professionals Program (MPP) to attract new and diverse talent. The main criteria of the program are:
Age limit of 35
Advanced degree with a minimum of 5 years relevant working experience
Fluency in a second language (besides English) highly desirable
65. The goal is an intake of up to three new entry level staff every year, funded by the front office. Each year, the SMT decides on the priority diversity group for recruitment. For 2010, the SMT decided to focus on candidates of African descent and more particularly on SSA/CR.
66. In FY10, MIGA advertised three positions globally. It contacted graduate schools in relevant fields, visited universities with significant SSA enrolment, worked closely with the YPP office and the IFC’s GTT Program, and searched the JPPAD11database. Through these efforts, it received over 800 applications, from which 50 applicants were identified. Following a rigorous interview process, three offers were made to SSA/CR candidates. Two have accepted and will be joining MIGA in FY11. (The third candidate declined for family reasons. MIGA is looking at options to negotiate with this candidate or identify a substitute.)
67. The SMT has decided that the focus will continue to be SSA/CR for the FY11 recruitment effort. If the intake in FY11 and FY12 is as expected, the SSA/CR representation at the end of the FY11-12 D&I Compact period would be at around 8%, a marked improvement over the 5.1% at the end of FY10.
68. MIGA will also tackle representation of women at grades GF-GG. The SMT will ensure half of the new hires at these grades are women. to increase from the current 36.2% to over 39%. MIGA anticipates filling only about a dozen GF-GG positions in FY11-12. In addition, there will be some departures, possibly including women. To further strengthen the commitment, the SMT will require that all shortlists include candidates of both genders, and that every decision to hire a male be justified to the Chief Operating Officer.
69. Recognizing the very narrow scope for change at managerial ranks, MIGA SMT has decided to focus its efforts on the two diversity dimensions where it can improve representation. If the planned improvements in SSA/CR and in female representation materialize --and the SMT will do its utmost to ensure that they do-- MIGA’s diversity index would increase to .75-.80 by the end of FY12, the end of the FY11-12 D&I Compact period.
70. More Dimensions of Diversity: External Hires. There is one more dimension of diversity that the Bank Group does not generally recognize. It relates to the proportion of new staff that is truly “new”. On average, every year, close to 60% of GF+ MIGA recruits are external, which is substantially higher than IBRD and reflects the value MIGA puts on diversity of experiences and perspectives. The fact that MIGA’s business is very different from that of the Bank makes it necessary for MIGA to hire the expertise it needs from outside the Group. It also makes it necessary for MIGA to integrate and adapt to different points of view. This requires skillful management: the SMT is aware of this and will prioritize it in training design and delivery.
14
III. D&I at IFC 71. The foundation of IFC’s HR strategy, which continues to promote a strong talent culture, remains its four pillars: Accountability, Differentiation, Incentives and Inclusion. Diversity and inclusion are embedded in every HR process and their relevance is integrated in each of the four pillars.
72. IFC continues to sustain progress against its D&I Compact and Board diversity targets with positive trends in four out of five targets since FY06. IFC reported gains for women GF-GG and for SSA/CR staff. It has also exceeded its Compact target for women managers and for NOFs. While results for Part II Managers were slightly below what was reported in FY06, the Corporation made a notable improvement in this category over last year.
73. Managerial Cadre. IFC’s main diversity challenge remains its managerial cadre. In order to reach the President’s gender parity target by 2012, IFC needs to recruit 71 new female managers or replace 36 departing male managers with female managers. Likewise, the “gap to-goal” for Part II managers calls for the recruitment of 26 Part II managers or replacement of 15 existing Part I managers. IFC maintains its commitment to reaching these targets, both through focused recruitment efforts and pro-active talent management, including coaching for existing managers and the rest of the talent pool. One potential area for improvement is within IFC’s Advisory Services business, where recent analysis indicates a need to recruit or promote additional managers.
74. Recruitment. In a deliberate effort to address challenging market conditions, the Corporation’s workforce was reduced from 3,402 in FY09 to 3,354 in FY10. This is a marked change from the sustained period of growth that led to an 18% increase in headcount from FY06 to FY09, which in turn was fuelled by decentralization aimed at getting closer to IFC clients. While this new environment of curtailed recruitment significantly reduced hiring opportunities that would have improved IFC’s diversity profile, the Corporation focused its effort on monitoring staffing decisions and providing frequent avenues for D&I discussions with hiring managers.
75. In line with commitments made in the FY08-10 D&I Compact, the Corporation continues to monitor all shortlists to ensure that GF+ appointments include qualified female and SSA/CR or Part II candidates. IFC HR sends a strong signal to hiring managers when they restart a search process to include diverse candidates whenever it is deemed necessary. These practices are supported by diversity awareness sessions within the HR team and with Directors who can now use “gap-to-goal” scorecards to enable them to review their current diversity profile as well as quantify the number of diverse candidates they have to hire in order to meet their targets.
76. Talent Management. The Talent Review process, a corporate-wide effort to continuously identify talent in the institution, has now become an established HR undertaking at IFC. It has provided the Corporation with a unique opportunity to systematically integrate D&I into key stages of staff career development as exhibited in Annex 5.
77. IFC’s People and Leadership Committee, comprised of four Vice Presidents (including the VP of Human Resources) and five Directors, makes decisions on corporate human resources-related practices and closes the Talent Review process. This entails a review of the Corporation’s top talent to identify high potential candidates, and those with leadership, mobility and promotion potential – all with a view to building a strong managerial bench from a diverse talent pool. This review emphasizes the need to develop women and Part II candidates in a deliberate effort to meet IFC’s commitment to its D&I Compact.
15
78. Results of the corporate leadership program (CLP), a flagship program that has contributed to the Corporation’s leadership bench (76% of existing IFC staff that attended the first CLP Cohort in FY06 have become Managers or Directors) and diversity profile, indicate that 50% or more of its FY10 participants are female and Part II staff. This compares with 41% of female staff and 42% of Part II staff that were identified in FY09 as potential participants in the FY10 CLP. This also demonstrates that IFC’s deliberate effort to provide diverse staff with opportunities for future leadership roles is yielding results. Details on the Corporation’s FY10 talent review process are provided in Annex 6.
79. Career Development. IFC is in the process of implementing its Global Career Framework (GCF) for all job streams in FY11, starting with Advisory Services. The GCF was developed to support the organization’s growth and decentralization strategy by providing opportunities for staff to grow professionally based on merit and regardless of location, contract type, or any diversity indicator. The GCF and its competency models will ensure that career development is fully inclusive and merit-based, which would build opportunities for all staff in the field in particular to also expand their experience. The effective implementation of the GCF, which will be undergoing relevant adjustments to account for the unfolding change management process at IFC, is expected to enhance sub-national diversity across our regional and field offices, and contribute to the diversity of IFC’s workforce.
80. Promotion Process. To ensure that the ultimate outcome of promotions reflects the composition of IFC’s workforce, diversity is systematically tracked as a core measure in its within-grade progression and promotion process. Promotion nominations are monitored throughout the process, by comparing them with the diversity profile of the Corporation’s workforce at all grades. The promotion process underway mirrors the past two years’ monitoring practice, which resulted in IFC improving the overall diversity outcome of its managerial promotions.
81. Performance Management. Starting in FY11, IFC is putting in place a new performance management framework that will ensure better alignment between its corporate goals and staff performance. In this context, an approach to cascading objectives (from VPs to Directors, and down to Managers and staff) is being introduced where D&I indicators, reflecting WBG board targets, will consistently feature in staff evaluation. This, together with the monitoring of the D&I index in staff survey follow-up, will contribute to a greater focus on the diversity of our workforce.
82. Challenges and Opportunities Ahead. With the curtailment of external recruitment, IFC will face increased challenges in meeting its diversity targets. To maintain the gains of recent years and still improve against diversity targets, IFC will not only have to monitor its hiring decisions for the limited opportunities, it will have to also focus on retention with a sustained effort. The talent review process presents one of IFC’s best prospects for developing and retaining a diverse workforce towards this objective.
83. There are other opportunities for IFC to meet its diversity targets. First, as the Corporation expands its work with other IFIs and bilateral institutions through mobilization efforts, it will increase opportunities to build the cadre of NOF staff. The strategic focus on decentralization will enable larger pools of high caliber local staff, and enhance the diversity profile. Finally, these challenges and opportunities will have to be balanced against additional demands for expanding the scope of diversity targets to include staff with disabilities and more diverse educational backgrounds, as well as to dig deeper into sub-national diversity in field offices.
16
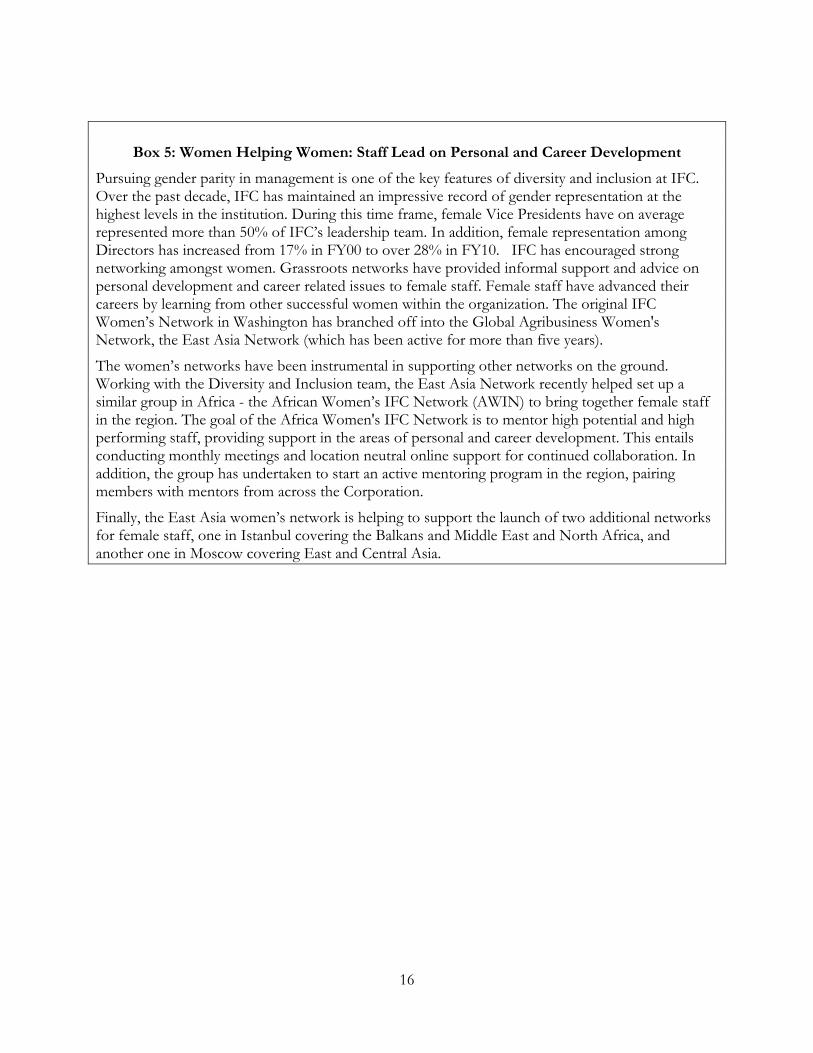
Box 5: Women Helping Women: Staff Lead on Personal and Career Development
Pursuing gender parity in management is one of the key features of diversity and inclusion at IFC. Over the past decade, IFC has maintained an impressive record of gender representation at the highest levels in the institution. During this time frame, female Vice Presidents have on average represented more than 50% of IFC’s leadership team. In addition, female representation among Directors has increased from 17% in FY00 to over 28% in FY10. IFC has encouraged strong networking amongst women. Grassroots networks have provided informal support and advice on personal development and career related issues to female staff. Female staff have advanced their careers by learning from other successful women within the organization. The original IFC Women’s Network in Washington has branched off into the Global Agribusiness Women's Network, the East Asia Network (which has been active for more than five years).
The women’s networks have been instrumental in supporting other networks on the ground. Working with the Diversity and Inclusion team, the East Asia Network recently helped set up a similar group in Africa - the African Women’s IFC Network (AWIN) to bring together female staff in the region. The goal of the Africa Women's IFC Network is to mentor high potential and high performing staff, providing support in the areas of personal and career development. This entails conducting monthly meetings and location neutral online support for continued collaboration. In addition, the group has undertaken to start an active mentoring program in the region, pairing members with mentors from across the Corporation.
Finally, the East Asia women’s network is helping to support the launch of two additional networks for female staff, one in Istanbul covering the Balkans and Middle East and North Africa, and another one in Moscow covering East and Central Asia.
17
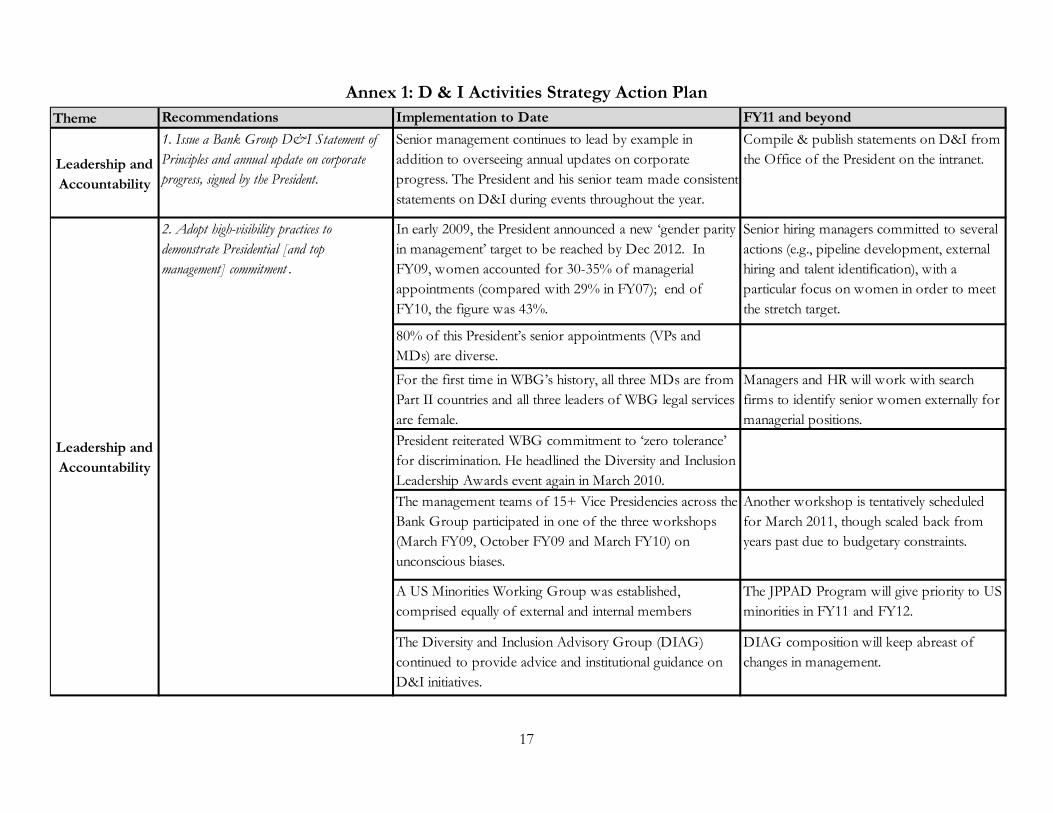
Annex 1: D & I Activities Strategy Action Plan
Theme Recommendations Implementation to Date FY11 and beyond
Leadership and Accountability
1. Issue a Bank Group D&I Statement of Principles and annual update on corporate progress, signed by the President.
Senior management continues to lead by example in addition to overseeing annual updates on corporate progress. The President and his senior team made consistent statements on D&I during events throughout the year.
Compile & publish statements on D&I from the Office of the President on the intranet.
In early 2009, the President announced a new ‘gender parity in management’ target to be reached by Dec 2012. In FY09, women accounted for 30-35% of managerial appointments (compared with 29% in FY07); end of FY10, the figure was 43%.
Senior hiring managers committed to several actions (e.g., pipeline development, external hiring and talent identification), with a particular focus on women in order to meet the stretch target.
80% of this President’s senior appointments (VPs and MDs) are diverse.
For the first time in WBG’s history, all three MDs are from Part II countries and all three leaders of WBG legal services are female.
Managers and HR will work with search firms to identify senior women externally for managerial positions.
President reiterated WBG commitment to ‘zero tolerance’ for discrimination. He headlined the Diversity and Inclusion Leadership Awards event again in March 2010.The management teams of 15+ Vice Presidencies across the Bank Group participated in one of the three workshops (March FY09, October FY09 and March FY10) on unconscious biases.
Another workshop is tentatively scheduled for March 2011, though scaled back from years past due to budgetary constraints.
A US Minorities Working Group was established, comprised equally of external and internal members
The JPPAD Program will give priority to US minorities in FY11 and FY12.
The Diversity and Inclusion Advisory Group (DIAG) continued to provide advice and institutional guidance on D&I initiatives.
DIAG composition will keep abreast of changes in management.
2. Adopt high-visibility practices to demonstrate Presidential [and top management] commitment .
Leadership and Accountability
18
Theme Recommendations Implementation to Date FY11 and beyond
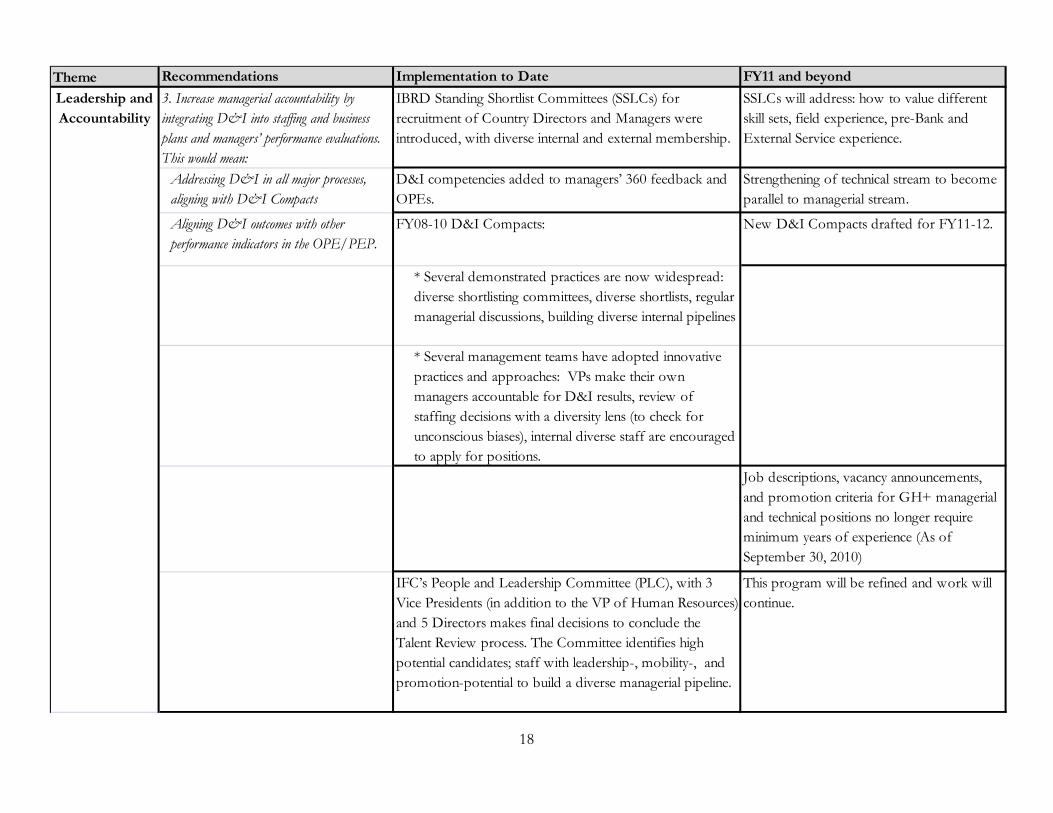
3. Increase managerial accountability by integrating D&I into staffing and business plans and managers’ performance evaluations. This would mean:
IBRD Standing Shortlist Committees (SSLCs) for recruitment of Country Directors and Managers were introduced, with diverse internal and external membership.
SSLCs will address: how to value different skill sets, field experience, pre-Bank and External Service experience.
Addressing D&I in all major processes, aligning with D&I Compacts
D&I competencies added to managers’ 360 feedback and OPEs.
Strengthening of technical stream to become parallel to managerial stream.
Aligning D&I outcomes with other performance indicators in the OPE/PEP.
FY08-10 D&I Compacts: New D&I Compacts drafted for FY11-12.
* Several demonstrated practices are now widespread: diverse shortlisting committees, diverse shortlists, regular managerial discussions, building diverse internal pipelines
* Several management teams have adopted innovative practices and approaches: VPs make their own managers accountable for D&I results, review of staffing decisions with a diversity lens (to check for unconscious biases), internal diverse staff are encouraged to apply for positions.
Job descriptions, vacancy announcements, and promotion criteria for GH+ managerial and technical positions no longer require minimum years of experience (As of September 30, 2010)
IFC’s People and Leadership Committee (PLC), with 3 Vice Presidents (in addition to the VP of Human Resources) and 5 Directors makes final decisions to conclude the Talent Review process. The Committee identifies high potential candidates; staff with leadership-, mobility-, and promotion-potential to build a diverse managerial pipeline.
This program will be refined and work will continue.
Leadership and Accountability
19
Theme Recommendations Implementation to Date FY11 and beyond
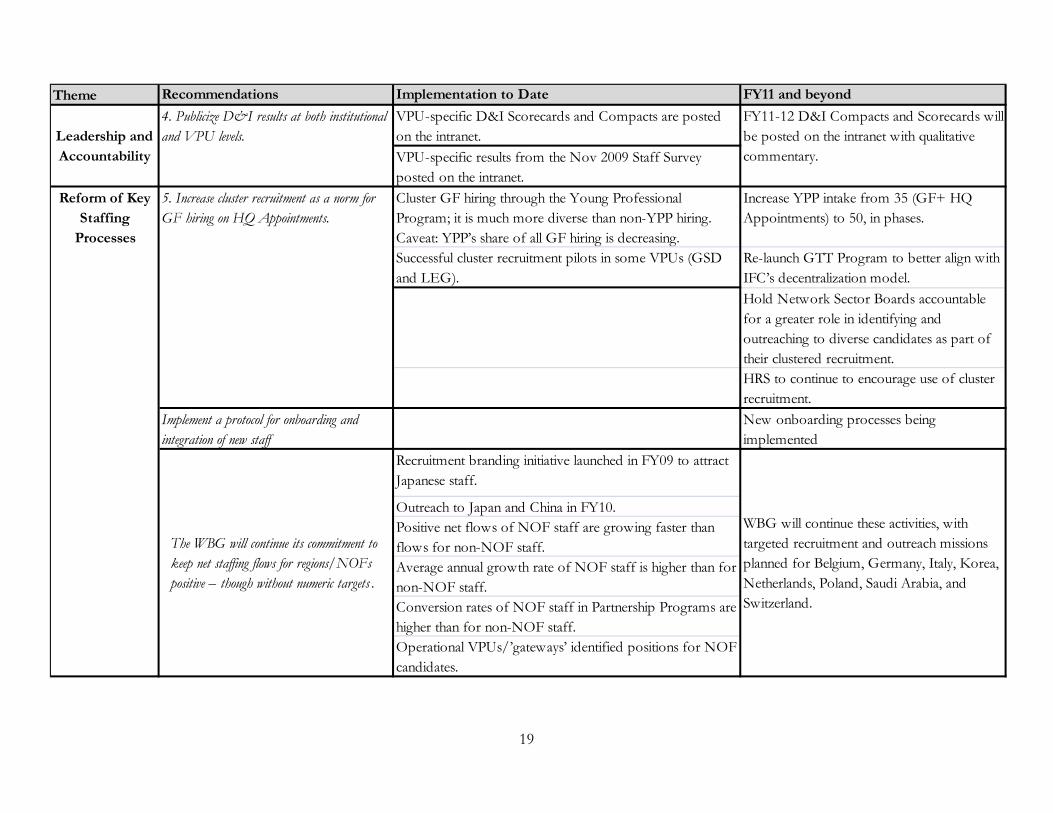
VPU-specific D&I Scorecards and Compacts are posted on the intranet.VPU-specific results from the Nov 2009 Staff Survey posted on the intranet.Cluster GF hiring through the Young Professional Program; it is much more diverse than non-YPP hiring. Caveat: YPP’s share of all GF hiring is decreasing.
Increase YPP intake from 35 (GF+ HQ Appointments) to 50, in phases.
Successful cluster recruitment pilots in some VPUs (GSD and LEG).
Re-launch GTT Program to better align with IFC’s decentralization model.Hold Network Sector Boards accountable for a greater role in identifying and outreaching to diverse candidates as part of their clustered recruitment.HRS to continue to encourage use of cluster recruitment.
Implement a protocol for onboarding and integration of new staff
New onboarding processes being implemented
Recruitment branding initiative launched in FY09 to attract Japanese staff.
Outreach to Japan and China in FY10.Positive net flows of NOF staff are growing faster than flows for non-NOF staff.Average annual growth rate of NOF staff is higher than for non-NOF staff.Conversion rates of NOF staff in Partnership Programs are higher than for non-NOF staff.Operational VPUs/’gateways’ identified positions for NOF candidates.
WBG will continue these activities, with targeted recruitment and outreach missions planned for Belgium, Germany, Italy, Korea, Netherlands, Poland, Saudi Arabia, and Switzerland.
The WBG will continue its commitment to keep net staffing flows for regions/NOFs positive – though without numeric targets .
Reform of Key Staffing
Processes
4. Publicize D&I results at both institutional and VPU levels.
FY11-12 D&I Compacts and Scorecards will be posted on the intranet with qualitative commentary.
5. Increase cluster recruitment as a norm for GF hiring on HQ Appointments.
Leadership and Accountability
20
Theme Recommendations Implementation to Date FY11 and beyond
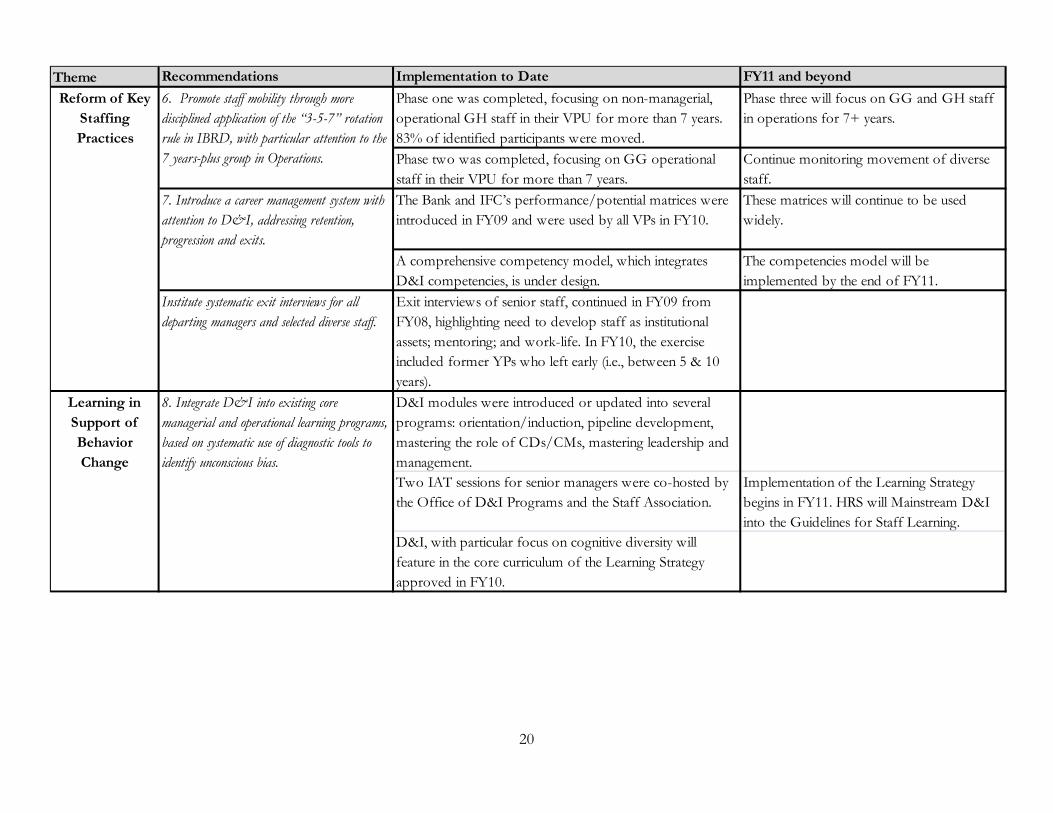
Phase one was completed, focusing on non-managerial, operational GH staff in their VPU for more than 7 years. 83% of identified participants were moved.
Phase three will focus on GG and GH staff in operations for 7+ years.
Phase two was completed, focusing on GG operational staff in their VPU for more than 7 years.
Continue monitoring movement of diverse staff.
The Bank and IFC’s performance/potential matrices were introduced in FY09 and were used by all VPs in FY10.
These matrices will continue to be used widely.
A comprehensive competency model, which integrates D&I competencies, is under design.
The competencies model will be implemented by the end of FY11.
Institute systematic exit interviews for all departing managers and selected diverse staff.
Exit interviews of senior staff, continued in FY09 from FY08, highlighting need to develop staff as institutional assets; mentoring; and work-life. In FY10, the exercise included former YPs who left early (i.e., between 5 & 10 years).D&I modules were introduced or updated into several programs: orientation/induction, pipeline development, mastering the role of CDs/CMs, mastering leadership and management.Two IAT sessions for senior managers were co-hosted by the Office of D&I Programs and the Staff Association.
Implementation of the Learning Strategy begins in FY11. HRS will Mainstream D&I into the Guidelines for Staff Learning.
D&I, with particular focus on cognitive diversity will feature in the core curriculum of the Learning Strategy approved in FY10.
7. Introduce a career management system with attention to D&I, addressing retention, progression and exits.
Reform of Key Staffing Practices
Learning in Support of Behavior Change
6. Promote staff mobility through more disciplined application of the “3-5-7” rotation rule in IBRD, with particular attention to the 7 years-plus group in Operations.
8. Integrate D&I into existing core managerial and operational learning programs, based on systematic use of diagnostic tools to identify unconscious bias.
21
Theme Recommendations Implementation to Date FY11 and beyond
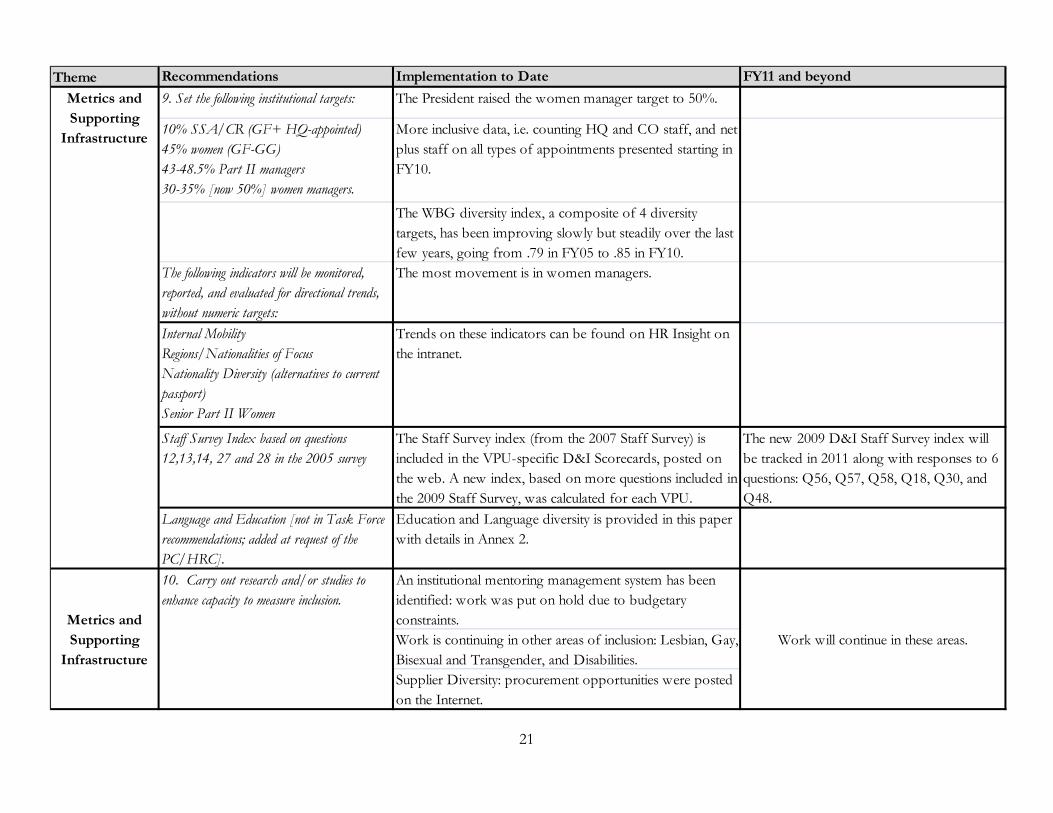
9. Set the following institutional targets: The President raised the women manager target to 50%.
10% SSA/CR (GF+ HQ-appointed)45% women (GF-GG)43-48.5% Part II managers30-35% [now 50%] women managers.
More inclusive data, i.e. counting HQ and CO staff, and net plus staff on all types of appointments presented starting in FY10.
The WBG diversity index, a composite of 4 diversity targets, has been improving slowly but steadily over the last few years, going from .79 in FY05 to .85 in FY10.
The following indicators will be monitored, reported, and evaluated for directional trends, without numeric targets:
The most movement is in women managers.
Internal MobilityRegions/Nationalities of FocusNationality Diversity (alternatives to current passport)Senior Part II Women
Trends on these indicators can be found on HR Insight on the intranet.
Staff Survey Index based on questions 12,13,14, 27 and 28 in the 2005 survey
The Staff Survey index (from the 2007 Staff Survey) is included in the VPU-specific D&I Scorecards, posted on the web. A new index, based on more questions included in the 2009 Staff Survey, was calculated for each VPU.
The new 2009 D&I Staff Survey index will be tracked in 2011 along with responses to 6 questions: Q56, Q57, Q58, Q18, Q30, and Q48.
Language and Education [not in Task Force recommendations; added at request of the PC/HRC].
Education and Language diversity is provided in this paper with details in Annex 2.
An institutional mentoring management system has been identified: work was put on hold due to budgetary constraints.Work is continuing in other areas of inclusion: Lesbian, Gay, Bisexual and Transgender, and Disabilities.Supplier Diversity: procurement opportunities were posted on the Internet.
Metrics and Supporting
Infrastructure
Work will continue in these areas.Metrics and Supporting
Infrastructure
10. Carry out research and/or studies to enhance capacity to measure inclusion.
22
Annex 2: Educational Diversity Main messages:
Staff throughout WBG and at all levels hold degrees from 3,400 institutions, 150+ countries
US, UK, India and France have the highest numbers of graduates; there is a higher concentration of post-graduate degrees in US, UK and France. Fifty-two percent of staff with completed degrees obtained at least one degree from a school in a country different than their nationality.
Over time, there has been much greater diversity. For example, 36% of staff with tenure of less than two years hold a US degree, compared to 57% for staff at WBG 20 years or more; other countries where we see more degrees from include Canada, Philippines, and China.
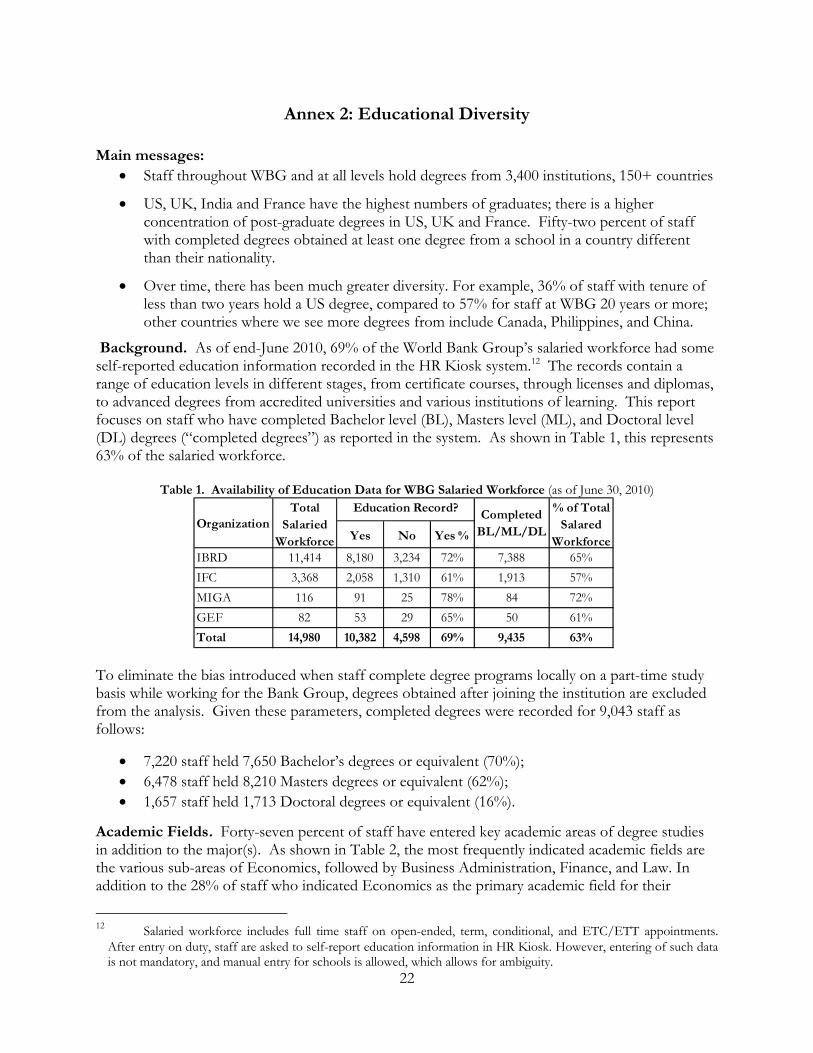
Background. As of end-June 2010, 69% of the World Bank Group’s salaried workforce had some self-reported education information recorded in the HR Kiosk system.12 The records contain a range of education levels in different stages, from certificate courses, through licenses and diplomas, to advanced degrees from accredited universities and various institutions of learning. This report focuses on staff who have completed Bachelor level (BL), Masters level (ML), and Doctoral level (DL) degrees (“completed degrees”) as reported in the system. As shown in Table 1, this represents 63% of the salaried workforce.
Table 1. Availability of Education Data for WBG Salaried Workforce (as of June 30, 2010)
To eliminate the bias introduced when staff complete degree programs locally on a part-time study basis while working for the Bank Group, degrees obtained after joining the institution are excluded from the analysis. Given these parameters, completed degrees were recorded for 9,043 staff as follows:
7,220 staff held 7,650 Bachelor’s degrees or equivalent (70%); 6,478 staff held 8,210 Masters degrees or equivalent (62%); 1,657 staff held 1,713 Doctoral degrees or equivalent (16%).
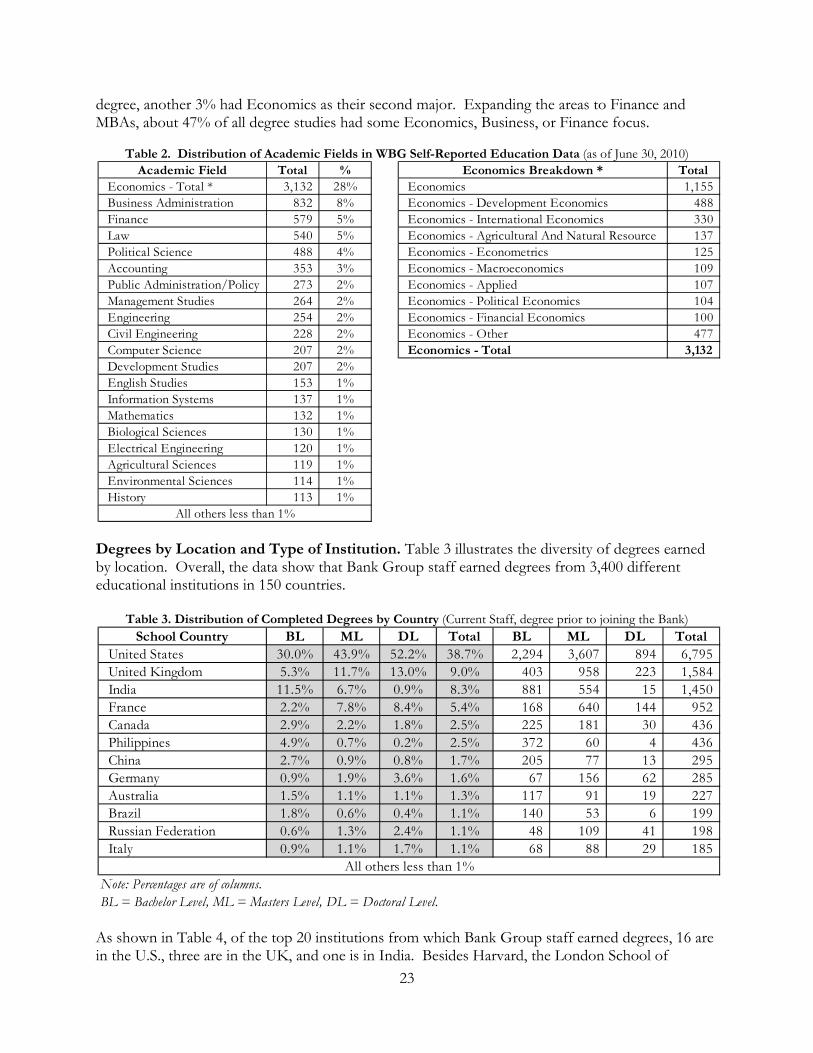
Academic Fields. Forty-seven percent of staff have entered key academic areas of degree studies in addition to the major(s). As shown in Table 2, the most frequently indicated academic fields are the various sub-areas of Economics, followed by Business Administration, Finance, and Law. In addition to the 28% of staff who indicated Economics as the primary academic field for their
12 Salaried workforce includes full time staff on open-ended, term, conditional, and ETC/ETT appointments.
After entry on duty, staff are asked to self-report education information in HR Kiosk. However, entering of such data is not mandatory, and manual entry for schools is allowed, which allows for ambiguity.
Yes No Yes %
IBRD 11,414 8,180 3,234 72% 7,388 65%
IFC 3,368 2,058 1,310 61% 1,913 57%
MIGA 116 91 25 78% 84 72%
GEF 82 53 29 65% 50 61%
Total 14,980 10,382 4,598 69% 9,435 63%
Education Record?Organization
Total Salaried
Workforce
Completed BL/ML/DL
% of Total Salared
Workforce
23
degree, another 3% had Economics as their second major. Expanding the areas to Finance and MBAs, about 47% of all degree studies had some Economics, Business, or Finance focus.
Table 2. Distribution of Academic Fields in WBG Self-Reported Education Data (as of June 30, 2010)
Degrees by Location and Type of Institution. Table 3 illustrates the diversity of degrees earned by location. Overall, the data show that Bank Group staff earned degrees from 3,400 different educational institutions in 150 countries.
Table 3. Distribution of Completed Degrees by Country (Current Staff, degree prior to joining the Bank)
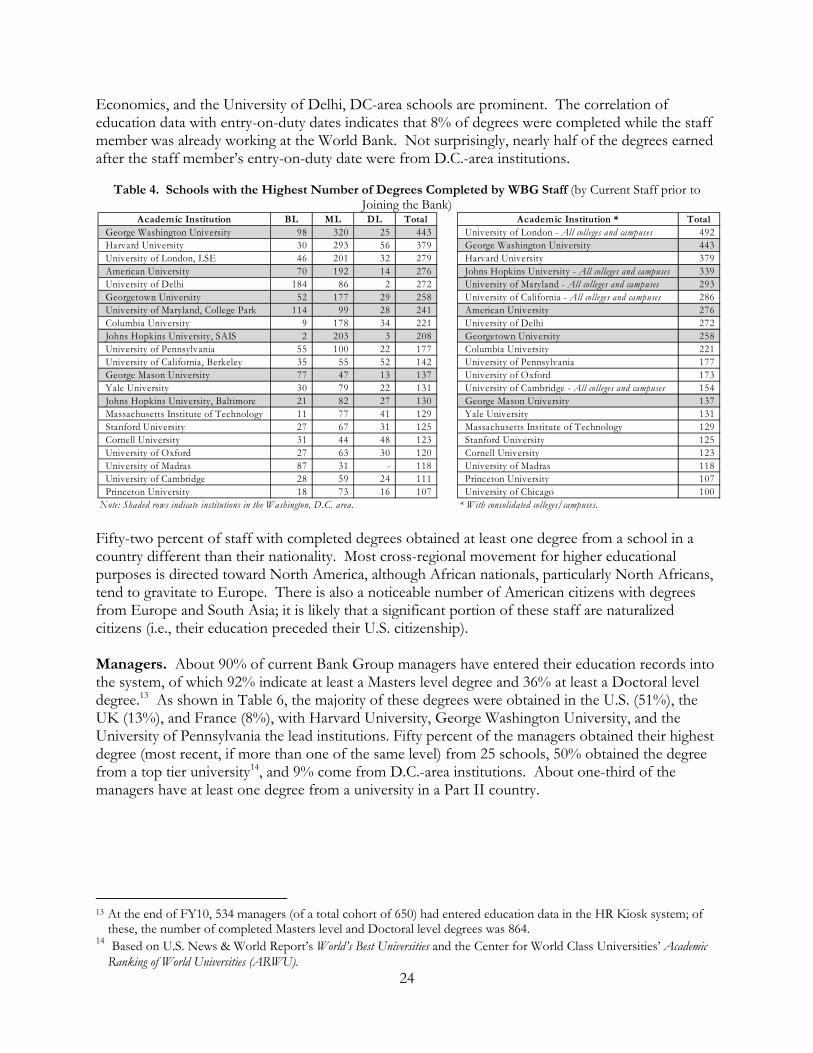
As shown in Table 4, of the top 20 institutions from which Bank Group staff earned degrees, 16 are in the U.S., three are in the UK, and one is in India. Besides Harvard, the London School of
Academic Field Total % Economics Breakdown * TotalEconomics - Total * 3,132 28% Economics 1,155 Business Administration 832 8% Economics - Development Economics 488 Finance 579 5% Economics - International Economics 330 Law 540 5% Economics - Agricultural And Natural Resource 137 Political Science 488 4% Economics - Econometrics 125 Accounting 353 3% Economics - Macroeconomics 109 Public Administration/Policy 273 2% Economics - Applied 107 Management Studies 264 2% Economics - Political Economics 104 Engineering 254 2% Economics - Financial Economics 100 Civil Engineering 228 2% Economics - Other 477 Computer Science 207 2% Economics - Total 3,132 Development Studies 207 2%English Studies 153 1%Information Systems 137 1%Mathematics 132 1%Biological Sciences 130 1%Electrical Engineering 120 1%Agricultural Sciences 119 1%Environmental Sciences 114 1%History 113 1%
All others less than 1%
School Country BL ML DL Total BL ML DL TotalUnited States 30.0% 43.9% 52.2% 38.7% 2,294 3,607 894 6,795 United Kingdom 5.3% 11.7% 13.0% 9.0% 403 958 223 1,584 India 11.5% 6.7% 0.9% 8.3% 881 554 15 1,450 France 2.2% 7.8% 8.4% 5.4% 168 640 144 952 Canada 2.9% 2.2% 1.8% 2.5% 225 181 30 436 Philippines 4.9% 0.7% 0.2% 2.5% 372 60 4 436 China 2.7% 0.9% 0.8% 1.7% 205 77 13 295 Germany 0.9% 1.9% 3.6% 1.6% 67 156 62 285 Australia 1.5% 1.1% 1.1% 1.3% 117 91 19 227 Brazil 1.8% 0.6% 0.4% 1.1% 140 53 6 199 Russian Federation 0.6% 1.3% 2.4% 1.1% 48 109 41 198 Italy 0.9% 1.1% 1.7% 1.1% 68 88 29 185
Note: Percentages are of columns.BL = Bachelor Level, ML = Masters Level, DL = Doctoral Level.
All others less than 1%
24
Economics, and the University of Delhi, DC-area schools are prominent. The correlation of education data with entry-on-duty dates indicates that 8% of degrees were completed while the staff member was already working at the World Bank. Not surprisingly, nearly half of the degrees earned after the staff member’s entry-on-duty date were from D.C.-area institutions.
Table 4. Schools with the Highest Number of Degrees Completed by WBG Staff (by Current Staff prior to
Joining the Bank)
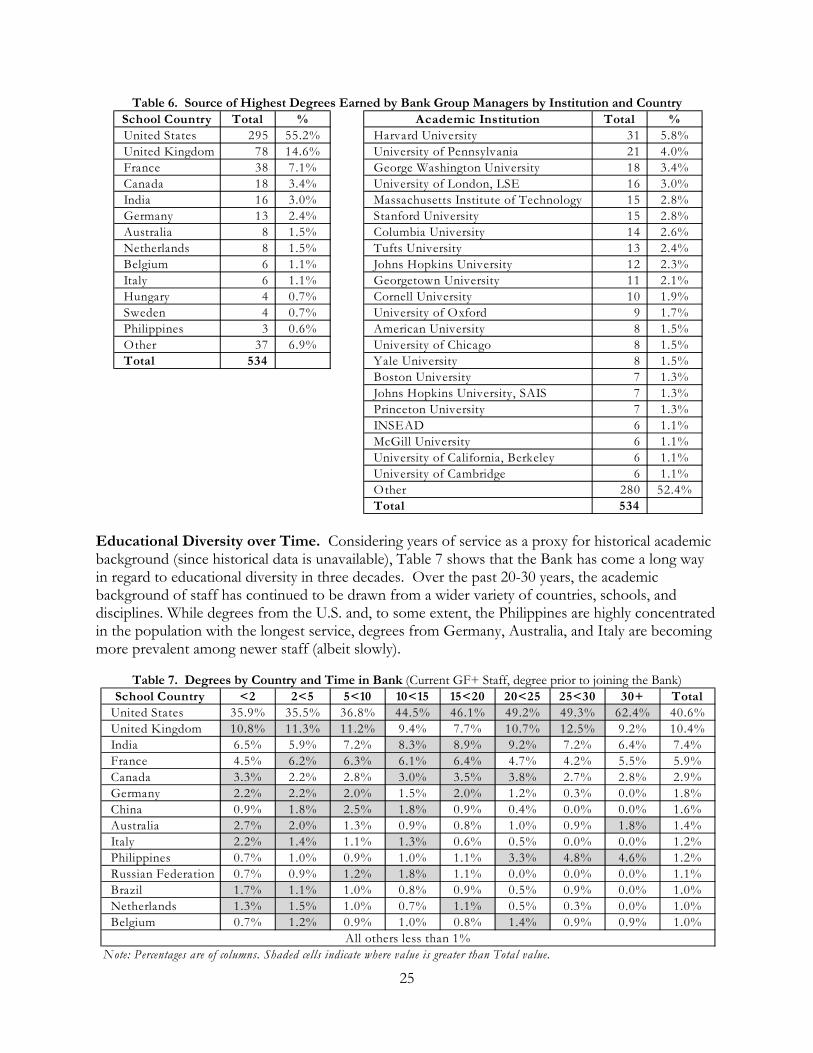
Fifty-two percent of staff with completed degrees obtained at least one degree from a school in a country different than their nationality. Most cross-regional movement for higher educational purposes is directed toward North America, although African nationals, particularly North Africans, tend to gravitate to Europe. There is also a noticeable number of American citizens with degrees from Europe and South Asia; it is likely that a significant portion of these staff are naturalized citizens (i.e., their education preceded their U.S. citizenship). Managers. About 90% of current Bank Group managers have entered their education records into the system, of which 92% indicate at least a Masters level degree and 36% at least a Doctoral level degree.13 As shown in Table 6, the majority of these degrees were obtained in the U.S. (51%), the UK (13%), and France (8%), with Harvard University, George Washington University, and the University of Pennsylvania the lead institutions. Fifty percent of the managers obtained their highest degree (most recent, if more than one of the same level) from 25 schools, 50% obtained the degree from a top tier university14, and 9% come from D.C.-area institutions. About one-third of the managers have at least one degree from a university in a Part II country.
13 At the end of FY10, 534 managers (of a total cohort of 650) had entered education data in the HR Kiosk system; of
these, the number of completed Masters level and Doctoral level degrees was 864. 14 Based on U.S. News & World Report’s World’s Best Universities and the Center for World Class Universities’ Academic
Ranking of World Universities (ARWU).
Academic Institution BL ML DL Total Academic Institution * TotalGeorge Washington University 98 320 25 443 University of London - All colleges and campuses 492 Harvard University 30 293 56 379 George Washington University 443 University of London, LSE 46 201 32 279 Harvard University 379 American University 70 192 14 276 Johns Hopkins University - All colleges and campuses 339 University of Delhi 184 86 2 272 University of Maryland - All colleges and campuses 293 Georgetown University 52 177 29 258 University of California - All colleges and campuses 286 University of Maryland, College Park 114 99 28 241 American University 276 Columbia University 9 178 34 221 University of Delhi 272 Johns Hopkins University, SAIS 2 203 3 208 Georgetown University 258 University of Pennsylvania 55 100 22 177 Columbia University 221 University of California, Berkeley 35 55 52 142 University of Pennsylvania 177 George Mason University 77 47 13 137 University of Oxford 173 Yale University 30 79 22 131 University of Cambridge - All colleges and campuses 154 Johns Hopkins University, Baltimore 21 82 27 130 George Mason University 137 Massachusetts Institute of Technology 11 77 41 129 Yale University 131 Stanford University 27 67 31 125 Massachusetts Institute of Technology 129 Cornell University 31 44 48 123 Stanford University 125 University of Oxford 27 63 30 120 Cornell University 123 University of Madras 87 31 - 118 University of Madras 118 University of Cambridge 28 59 24 111 Princeton University 107 Princeton University 18 73 16 107 University of Chicago 100
Note: Shaded rows indicate institutions in the Washington, D.C. area. * With consolidated colleges/campuses.
25
Table 6. Source of Highest Degrees Earned by Bank Group Managers by Institution and Country
Educational Diversity over Time. Considering years of service as a proxy for historical academic background (since historical data is unavailable), Table 7 shows that the Bank has come a long way in regard to educational diversity in three decades. Over the past 20-30 years, the academic background of staff has continued to be drawn from a wider variety of countries, schools, and disciplines. While degrees from the U.S. and, to some extent, the Philippines are highly concentrated in the population with the longest service, degrees from Germany, Australia, and Italy are becoming more prevalent among newer staff (albeit slowly).
Table 7. Degrees by Country and Time in Bank (Current GF+ Staff, degree prior to joining the Bank)
School Country Total % Academic Institution Total %United States 295 55.2% Harvard University 31 5.8%United Kingdom 78 14.6% University of Pennsylvania 21 4.0%France 38 7.1% George Washington University 18 3.4%Canada 18 3.4% University of London, LSE 16 3.0%India 16 3.0% Massachusetts Institute of Technology 15 2.8%Germany 13 2.4% Stanford University 15 2.8%Australia 8 1.5% Columbia University 14 2.6%Netherlands 8 1.5% Tufts University 13 2.4%Belgium 6 1.1% Johns Hopkins University 12 2.3%Italy 6 1.1% Georgetown University 11 2.1%Hungary 4 0.7% Cornell University 10 1.9%Sweden 4 0.7% University of Oxford 9 1.7%Philippines 3 0.6% American University 8 1.5%Other 37 6.9% University of Chicago 8 1.5%Total 534 Yale University 8 1.5%
Boston University 7 1.3%Johns Hopkins University, SAIS 7 1.3%Princeton University 7 1.3%INSEAD 6 1.1%McGill University 6 1.1%University of California, Berkeley 6 1.1%University of Cambridge 6 1.1%Other 280 52.4%Total 534
School Country <2 2<5 5<10 10<15 15<20 20<25 25<30 30+ TotalUnited States 35.9% 35.5% 36.8% 44.5% 46.1% 49.2% 49.3% 62.4% 40.6%United Kingdom 10.8% 11.3% 11.2% 9.4% 7.7% 10.7% 12.5% 9.2% 10.4%India 6.5% 5.9% 7.2% 8.3% 8.9% 9.2% 7.2% 6.4% 7.4%France 4.5% 6.2% 6.3% 6.1% 6.4% 4.7% 4.2% 5.5% 5.9%Canada 3.3% 2.2% 2.8% 3.0% 3.5% 3.8% 2.7% 2.8% 2.9%Germany 2.2% 2.2% 2.0% 1.5% 2.0% 1.2% 0.3% 0.0% 1.8%China 0.9% 1.8% 2.5% 1.8% 0.9% 0.4% 0.0% 0.0% 1.6%Australia 2.7% 2.0% 1.3% 0.9% 0.8% 1.0% 0.9% 1.8% 1.4%Italy 2.2% 1.4% 1.1% 1.3% 0.6% 0.5% 0.0% 0.0% 1.2%Philippines 0.7% 1.0% 0.9% 1.0% 1.1% 3.3% 4.8% 4.6% 1.2%Russian Federation 0.7% 0.9% 1.2% 1.8% 1.1% 0.0% 0.0% 0.0% 1.1%Brazil 1.7% 1.1% 1.0% 0.8% 0.9% 0.5% 0.9% 0.0% 1.0%Netherlands 1.3% 1.5% 1.0% 0.7% 1.1% 0.5% 0.3% 0.0% 1.0%Belgium 0.7% 1.2% 0.9% 1.0% 0.8% 1.4% 0.9% 0.9% 1.0%
Note: Percentages are of columns. Shaded cells indicate where value is greater than Total value. All others less than 1%
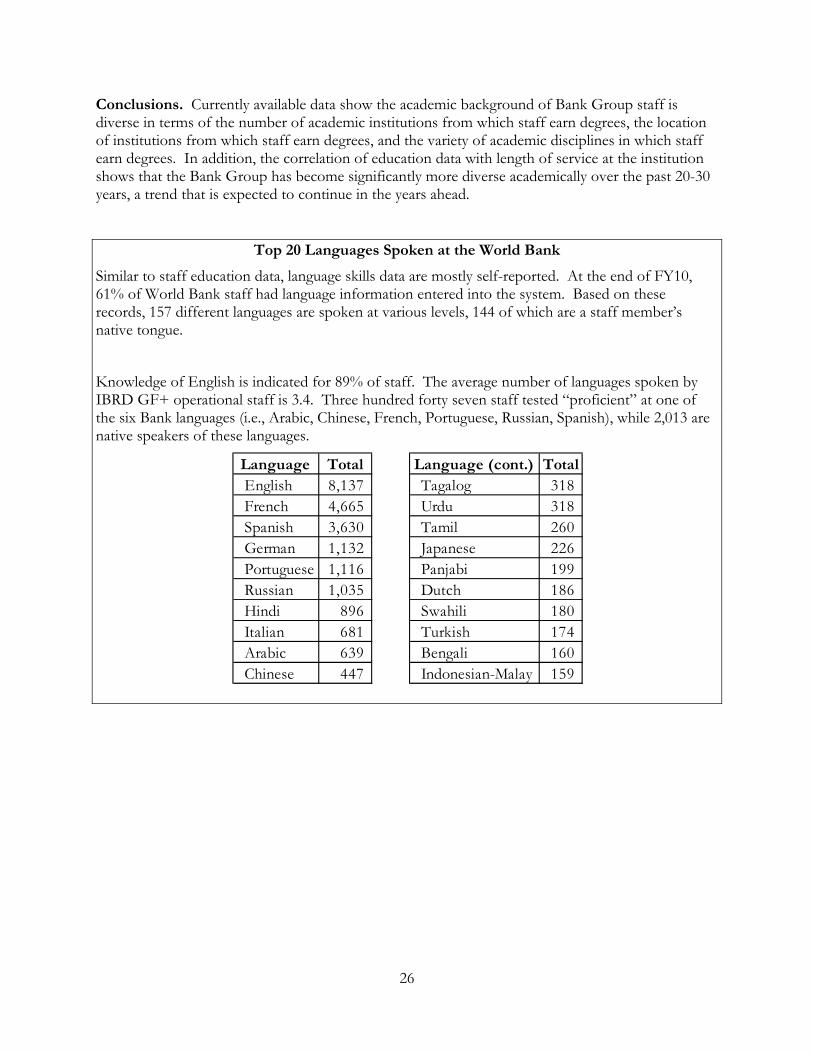
26
Conclusions. Currently available data show the academic background of Bank Group staff is diverse in terms of the number of academic institutions from which staff earn degrees, the location of institutions from which staff earn degrees, and the variety of academic disciplines in which staff earn degrees. In addition, the correlation of education data with length of service at the institution shows that the Bank Group has become significantly more diverse academically over the past 20-30 years, a trend that is expected to continue in the years ahead.
Top 20 Languages Spoken at the World Bank
Similar to staff education data, language skills data are mostly self-reported. At the end of FY10, 61% of World Bank staff had language information entered into the system. Based on these records, 157 different languages are spoken at various levels, 144 of which are a staff member’s native tongue.
Knowledge of English is indicated for 89% of staff. The average number of languages spoken by IBRD GF+ operational staff is 3.4. Three hundred forty seven staff tested “proficient” at one of the six Bank languages (i.e., Arabic, Chinese, French, Portuguese, Russian, Spanish), while 2,013 are native speakers of these languages.
Language Total Language (cont.) TotalEnglish 8,137 Tagalog 318 French 4,665 Urdu 318 Spanish 3,630 Tamil 260 German 1,132 Japanese 226 Portuguese 1,116 Panjabi 199 Russian 1,035 Dutch 186 Hindi 896 Swahili 180 Italian 681 Turkish 174 Arabic 639 Bengali 160 Chinese 447 Indonesian-Malay 159
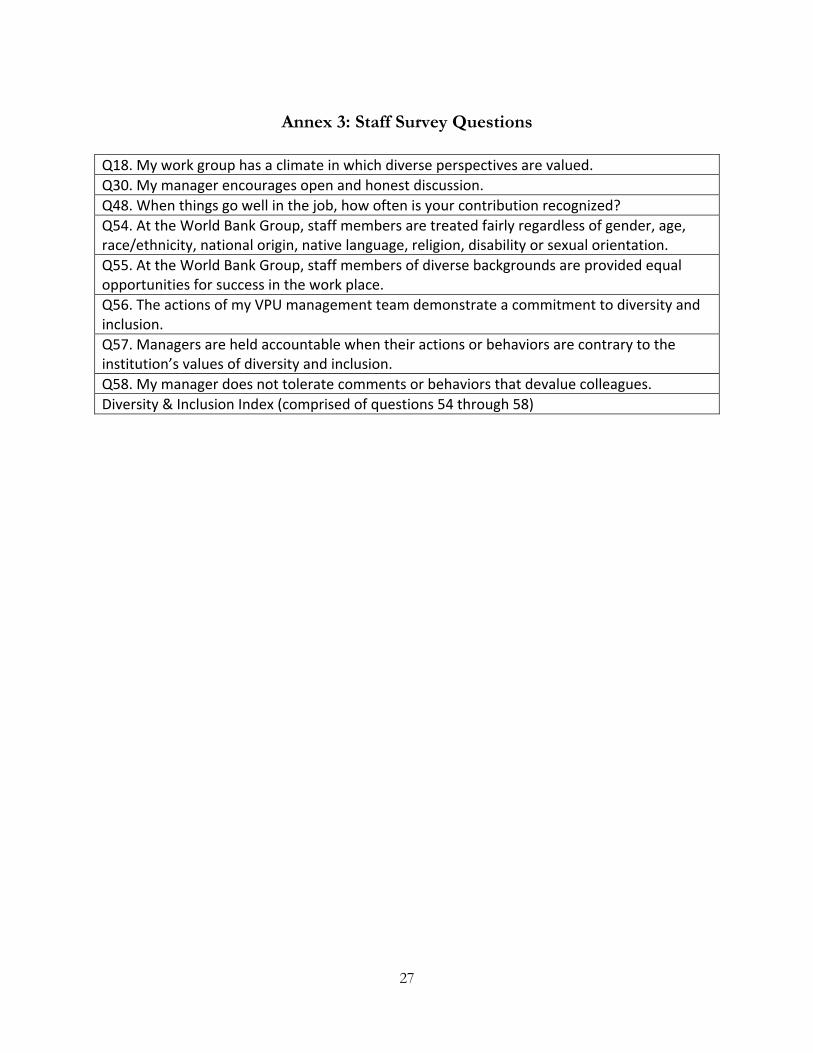
27
Annex 3: Staff Survey Questions Q18. My work group has a climate in which diverse perspectives are valued.
Q30. My manager encourages open and honest discussion.
Q48. When things go well in the job, how often is your contribution recognized?
Q54. At the World Bank Group, staff members are treated fairly regardless of gender, age, race/ethnicity, national origin, native language, religion, disability or sexual orientation.
Q55. At the World Bank Group, staff members of diverse backgrounds are provided equal opportunities for success in the work place.
Q56. The actions of my VPU management team demonstrate a commitment to diversity and inclusion.
Q57. Managers are held accountable when their actions or behaviors are contrary to the institution’s values of diversity and inclusion.
Q58. My manager does not tolerate comments or behaviors that devalue colleagues.
Diversity & Inclusion Index (comprised of questions 54 through 58)
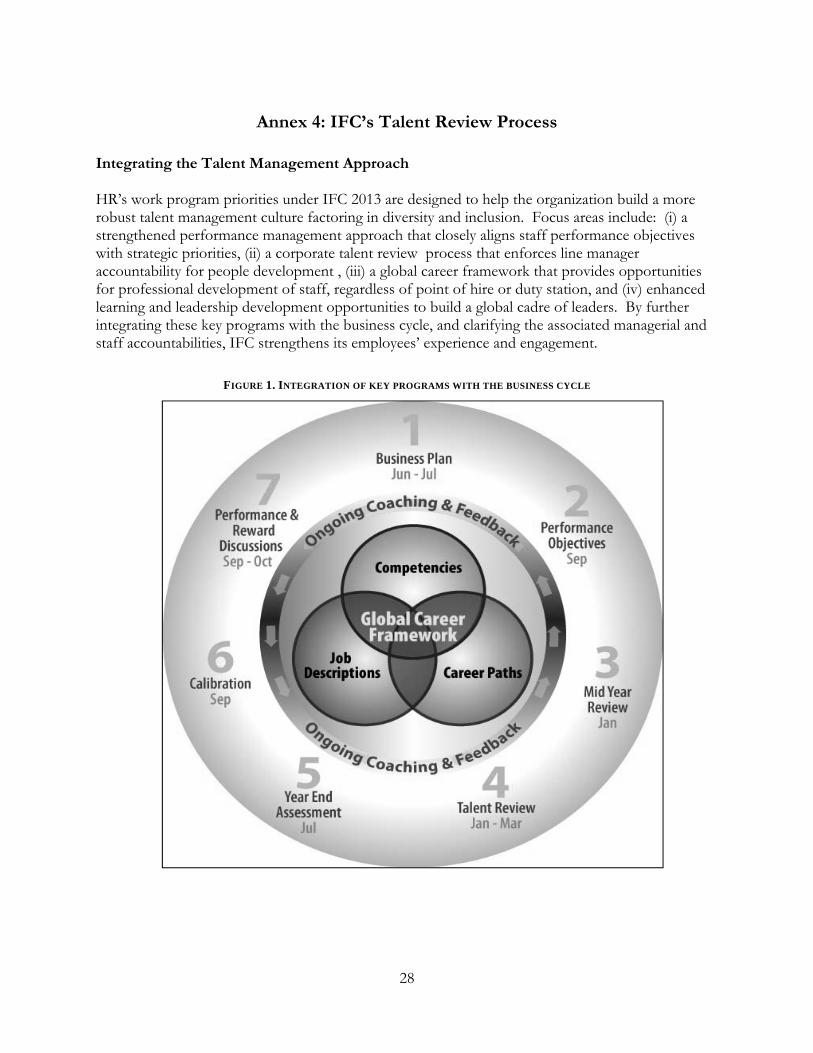
28
Annex 4: IFC’s Talent Review Process Integrating the Talent Management Approach HR’s work program priorities under IFC 2013 are designed to help the organization build a more robust talent management culture factoring in diversity and inclusion. Focus areas include: (i) a strengthened performance management approach that closely aligns staff performance objectives with strategic priorities, (ii) a corporate talent review process that enforces line manager accountability for people development , (iii) a global career framework that provides opportunities for professional development of staff, regardless of point of hire or duty station, and (iv) enhanced learning and leadership development opportunities to build a global cadre of leaders. By further integrating these key programs with the business cycle, and clarifying the associated managerial and staff accountabilities, IFC strengthens its employees’ experience and engagement.
FIGURE 1. INTEGRATION OF KEY PROGRAMS WITH THE BUSINESS CYCLE
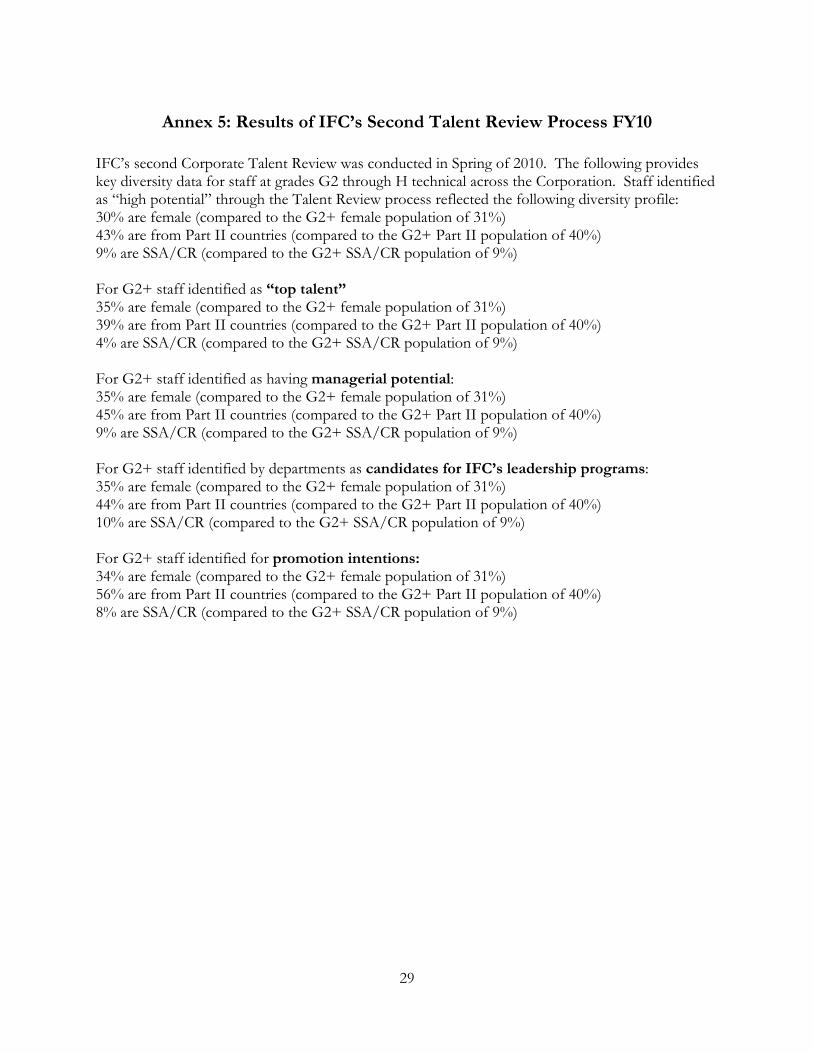
29
Annex 5: Results of IFC’s Second Talent Review Process FY10 IFC’s second Corporate Talent Review was conducted in Spring of 2010. The following provides key diversity data for staff at grades G2 through H technical across the Corporation. Staff identified as “high potential” through the Talent Review process reflected the following diversity profile: 30% are female (compared to the G2+ female population of 31%) 43% are from Part II countries (compared to the G2+ Part II population of 40%) 9% are SSA/CR (compared to the G2+ SSA/CR population of 9%) For G2+ staff identified as “top talent” 35% are female (compared to the G2+ female population of 31%) 39% are from Part II countries (compared to the G2+ Part II population of 40%) 4% are SSA/CR (compared to the G2+ SSA/CR population of 9%) For G2+ staff identified as having managerial potential: 35% are female (compared to the G2+ female population of 31%) 45% are from Part II countries (compared to the G2+ Part II population of 40%) 9% are SSA/CR (compared to the G2+ SSA/CR population of 9%) For G2+ staff identified by departments as candidates for IFC’s leadership programs: 35% are female (compared to the G2+ female population of 31%) 44% are from Part II countries (compared to the G2+ Part II population of 40%) 10% are SSA/CR (compared to the G2+ SSA/CR population of 9%) For G2+ staff identified for promotion intentions: 34% are female (compared to the G2+ female population of 31%) 56% are from Part II countries (compared to the G2+ Part II population of 40%) 8% are SSA/CR (compared to the G2+ SSA/CR population of 9%)