fy 2021 oregon transportation needs and issues …
TRANSCRIPT
FY 2021 OREGON TRANSPORTATION
NEEDS AND ISSUES
Summary of Statewide Results
PROJECT SPR 043


FY 2021 OREGON TRANSPORTATION NEEDS AND ISSUES
SURVEY
Summary of Statewide Results
PROJECT SPR 043
by
Tony Knudson,
Oregon Department of Transportation: Research Section
for
Oregon Department of Transportation
Research Section
555 13th St. NE
Salem, OR 97301
January 2021

i
Technical Report Documentation Page
1. 1. Report No.
FHWA-OR-PR-21-07
2. Government Accession No.
3. Recipient’s Catalog No.
4. Title and Subtitle
FY 2021 Oregon Transportation Needs and Issues Survey
5. Report Date
January 2021
6. Performing Organization
Code
7. Author(s)
Tony Knudson, https://orcid.org/0000-0002-1223-6163
8. Performing Organization
Report No.
9. Performing Organization Name and Address
Oregon Department of Transportation
Research Section
555 13th St. NE
Salem, OR 97301
10. Work Unit No.
(TRAIS)
11. Contract or Grant No.
19RFTNIS
12. Sponsoring Agency Name and Address
Oregon Department of Transportation
Research Section
555 13th St. NE
Salem, OR 97301
13. Type of Report and
Period Covered
Summary Report
14. Sponsoring Agency
Code
15. Supplementary Notes
16. Abstract
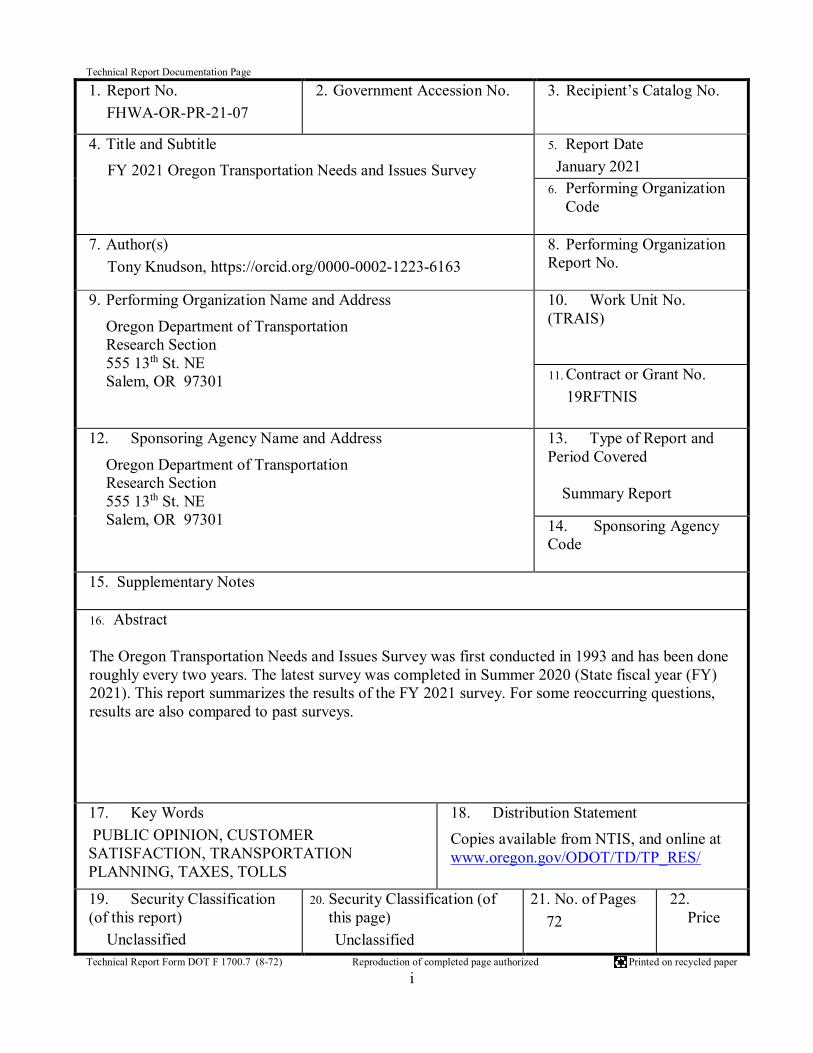
The Oregon Transportation Needs and Issues Survey was first conducted in 1993 and has been done
roughly every two years. The latest survey was completed in Summer 2020 (State fiscal year (FY)
2021). This report summarizes the results of the FY 2021 survey. For some reoccurring questions,
results are also compared to past surveys.
17. Key Words
PUBLIC OPINION, CUSTOMER
SATISFACTION, TRANSPORTATION
PLANNING, TAXES, TOLLS
18. Distribution Statement
Copies available from NTIS, and online at
www.oregon.gov/ODOT/TD/TP_RES/
19. Security Classification
(of this report)
Unclassified
20. Security Classification (of
this page)
Unclassified
20. 21. No. of Pages
72
22.
Price
Technical Report Form DOT F 1700.7 (8-72) Reproduction of completed page authorized Printed on recycled paper

ii

iii
SI* (MODERN METRIC) CONVERSION FACTORS
APPROXIMATE CONVERSIONS TO SI UNITS APPROXIMATE CONVERSIONS FROM SI UNITS
Symbo
l
When You
Know Multiply By To Find
Symbo
l
Symb
ol When You Know
Multiply
By To Find Symbol
LENGTH LENGTH
in inches 25.4 millimeters mm mm millimeters 0.039 Inches in
ft feet 0.305 meters m m meters 3.28 feet ft
yd yards 0.914 meters m m meters 1.09 yards yd
mi miles 1.61 kilometers km km kilometers 0.621 miles mi
AREA AREA
in2 square inches 645.2 millimeters
squared mm2 mm2 millimeters
squared 0.0016 square inches in2
ft2 square feet 0.093 meters squared m2 m2 meters squared 10.764 square feet ft2
yd2 square yards 0.836 meters squared m2 m2 meters squared 1.196 square yards yd2
ac acres 0.405 hectares ha ha hectares 2.47 acres ac
mi2 square miles 2.59 kilometers
squared km2 km2
kilometers
squared 0.386 square miles mi2
VOLUME VOLUME
fl oz fluid ounces 29.57 milliliters ml ml milliliters 0.034 fluid ounces fl oz
gal gallons 3.785 liters L L liters 0.264 gallons gal
ft3 cubic feet 0.028 meters cubed m3 m3 meters cubed 35.315 cubic feet ft3
yd3 cubic yards 0.765 meters cubed m3 m3 meters cubed 1.308 cubic yards yd3
~NOTE: Volumes greater than 1000 L shall be shown in m3.
MASS MASS
oz ounces 28.35 grams g g grams 0.035 ounces oz
lb pounds 0.454 kilograms kg kg kilograms 2.205 pounds lb
T short tons (2000
lb) 0.907 megagrams Mg Mg megagrams 1.102
short tons (2000
lb) T
TEMPERATURE (exact) TEMPERATURE (exact)
°F Fahrenheit (F-
32)/1.8 Celsius °C °C Celsius
1.8C+3
2 Fahrenheit °F
*SI is the symbol for the International System of Measurement

iv

v
ACKNOWLEDGEMENTS
The author wishes to thank the members of the Needs and Issues Steering Committee, who
provided the oversight and guidance for this project:
Tony Knudson, ODOT Research Section (chair)
Travis Brouwer, ODOT Assistant Director
Tom Fuller, ODOT Communications
Bob Melbo, ODOT Public Transportation Division
Amanda Pietz, ODOT Planning, Data and Analysis Division
Collen O’Hogan, ODOT Transportation Safety Division
Kathryn Ryan, ODOT Driver and Motor Vehicles Division
Phillip Kase, ODOT Office of the Director
Maureen Bock, ODOT OReGO Program Manager
Sarah Hackett, ODOT Public Transportation Division
Stephanie Millar, ODOT Public Transportation Division
Susan Peithman, ODOT Public Transportation Division
In addition, the author would like to acknowledge Dr. Virginia Lesser and Lydia Newton of the
Oregon State University Survey Research Center for their contribution and expertise in designing
and conducting the survey and compiling the data.
DISCLAIMER
This document is disseminated under the sponsorship of the Oregon Department of
Transportation and the United States Department of Transportation in the interest of information
exchange. The State of Oregon and the United States Government assume no liability of its
contents or use thereof.
The contents of this report reflect the view of the author who is solely responsible for the facts
and accuracy of the material presented. The contents do not necessarily reflect the official views
of the Oregon Department of Transportation or the United States Department of Transportation.

vi
The State of Oregon and the United States Government do not endorse products of
manufacturers. Trademarks or manufacturers’ names appear herein only because they are
considered essential to the object of this document.
This report does not constitute a standard, specification, or regulation.

vii
TABLE OF CONTENTS
1.0 INTRODUCTION .........................................................................................................1
1.1 BACKGROUND AND PURPOSE OF THE SURVEY ...............................................................1 1.2 METHODOLOGY ............................................................................................................1
1.2.1 Weighting ........................................................................................................................................ 2 1.3 ORGANIZATION OF THE RESULTS...................................................................................3
2.0 SURVEY FINDINGS ....................................................................................................5
2.1 FUNDING ......................................................................................................................5 2.1.1 Fuel Taxes ....................................................................................................................................... 5 2.1.2 Toll Roads ....................................................................................................................................... 6
2.2 SPENDING .....................................................................................................................8 2.3 SATISFACTION WITH ODOT SERVICES ........................................................................ 10
2.4 PUBLIC TRANSPORTATION .......................................................................................... 11 2.5 HIGHWAY ................................................................................................................... 12
2.5.1 Highway and Bridge Conditions Compared to Ten Years Ago ........................................................ 13 2.5.2 Traffic Congestion ......................................................................................................................... 17
2.6 RAIL .......................................................................................................................... 19 2.7 DRIVER AND MOTOR VEHICLE (DMV) SERVICES ........................................................ 20
2.8 TRAVEL CHOICES AND BEHAVIOR ............................................................................... 20 2.8.1 Travel Behavior ............................................................................................................................. 20 2.8.2 Commuting Behavior ..................................................................................................................... 20
2.9 OVERALL AGENCY PERFORMANCE.............................................................................. 24
3.0 OPINION TRENDS 2006-2020 ................................................................................... 27
3.1 SATISFACTION WITH ODOT SERVICES AND ACTIVITIES ............................................... 27 3.2 FUNDING .................................................................................................................... 29
3.3 OVERALL AGENCY PERFORMANCE.............................................................................. 31 3.4 CONGESTION TRENDS ................................................................................................. 31
3.5 ALTERNATIVE TRANSPORTATION ................................................................................ 34
4.0 RESPONDENTS’ COMMENTS ................................................................................ 37
4.1 CONCLUSION .............................................................................................................. 37
APPENDIX A: RESPONDENT DEMOGRAPHICS ............................................................ 39
APPENDIX B: ...........................................................................................................................1
LIST OF FIGURES
Figure 1.1: ODOT Regions .........................................................................................................2
Figure 2.1: Value and adequacy of the gas tax .............................................................................5 Figure 2.2: Which funding is most fair? ......................................................................................6
Figure 2.3: Support for tolls by area ............................................................................................7

viii
Figure 2.4: Travel behavior change .............................................................................................8 Figure 2.5: Importance of where ODOT funds are spent ..............................................................9
Figure 2.6: Level of satisfaction with ODOT services ............................................................... 11 Figure 2.7: Condition of ODOT's roads and bridges compared to ten years ago ......................... 13
Figure 2.8: When should ODOT use salt to address icy/snowy conditions? ............................... 14 Figure 2.9: Use of salt by Region for icy/snowy conditions ....................................................... 15
Figure 2.10: Are changes in climate affecting Oregon's transportation? ..................................... 16 Figure 2.11: Is ODOT adapting to transportation challenges due to climate change? ................. 17
Figure 2.12: Seriousness of traffic congestion by area ............................................................... 18 Figure 2.14: Preferences for expanding or preserving the highways by area .............................. 19
Figure 2.13: Reasons for not using Amtrak Cascades in the last two years................................. 20 Figure 2.14: Commute miles distribution................................................................................... 21
Figure 2.15: Commute minutes distribution ............................................................................... 22 Figure 2.16: Commuter (work or school) mode choice .............................................................. 23
Figure 2.17: Commuting behavior change factors ...................................................................... 24 Figure 2.18: Rating of ODOT's overall performance ................................................................. 25
Figure 2.19: Attitude towards ODOT's overall performance by region ...................................... 26 Figure 2.20: ODOT approval by geographic area ...................................................................... 26
Figure 3.1: Opinion of ODOT maintenance (2006 – 2020) ........................................................ 28 Figure 3.2 - Satisfaction with ODOT's expansion and improvement of roads (2006 - 2020) ....... 28
Figure 3.3: Opinion of gas taxes and fees value over time (2006 – 2020) ................................... 29 Figure 3.4: Opinion of funding protection of fish and wildlife habitat over time (2006 – 2020) . 30
Figure 3.5: Importance of ODOT funding expansion trend (2006 – 2020) ................................. 30 Figure 3.6: Rating of ODOT's overall performance trend (2006 - 2020) .................................... 31
Figure 3.7: How serious is traffic congestion trend (2006 - 2020) .............................................. 32 Figure 3.8: Importance of expanding highways trend (2006 - 2020) .......................................... 33
Figure 3.9: Importance of preserving what we have trend (2006 - 2020) .................................... 33 Figure 3.10: Percent using public transportation in the last month trends (2006 – 2020) ............ 34
Figure 3.11: Satisfaction with local bus service trend (2006 - 2020) .......................................... 35 Figure A.1 Respondents’ age distribution by gender ....................................................................1
Figure A.2 - Distribution graph of years resident in Oregon.........................................................2 Figure A.3 – Distribution of respondents’ education level ...........................................................3

1
1.0 INTRODUCTION
1.1 BACKGROUND AND PURPOSE OF THE SURVEY
The Oregon Department of Transportation (ODOT) collects data from Oregon residents through
the Transportation Needs and Issues Survey to:
assess perceptions about the transportation system;
determine how the system is used; and
identify transportation-related concerns.
The survey was first conducted in FY 1993 and has been done roughly every two years. For each
iteration, ODOT has contracted with a survey research center. In FY 1993, 1994, and 1995
ODOT worked with the Gallup Organization; in FY 1998, 2001, 2003, and 2005 ODOT
contracted with the Oregon Survey Research Laboratory at the University of Oregon; and the
most recent surveys for every other fiscal year from 2007 to 2021, ODOT worked with the
Oregon State University Survey Research Center.
All of the surveys conducted through 2009 used a random digit dialing telephone survey method
to achieve a sample of approximately 1,000 Oregon residents. In 2007 and 2009, with the
growing popularity of caller identification and the increase in cell phone-only households,
supplemental mail and web versions of the survey were also distributed. Analysis of the survey
results from 2009 showed a potential bias in the telephone data, and it was determined that the
phone survey mode should be discontinued. Therefore, since FY 2011, only web and mail survey
modes were sent to over 5,000 households.
1.2 METHODOLOGY
The FY 2021 needs and issues survey consisted of 39 questions, which represented 65 variables
(Appendix B). Questions were selected by a project steering committee, which was comprised of
representatives from each ODOT Division. The majority of questions have appeared on past
needs and issues surveys, some dating as far back as 1996.
The FY 2021 survey was conducted by mail and web. Only adults (age 18 and over) were
eligible to take the survey. The survey consisted of a stratified random sample, targeting a
proportionate number of responses per ODOT Region (Error! Reference source not found.). T
he sample size was selected in order to obtain 350 completed surveys per region, which is similar
to past surveys. For the web mode, mailed letters introduced the survey and contained a personal
access code and instructions for logging onto the survey website.

2
Figure 1.1: ODOT Regions
A total of 1,808 surveys were completed: 590 via the Web, and 1,218 by paper mail in.
Households in the mail group were contacted using the United States Post Office (USPS) and
received paper questionnaire copies only, whereas households in the mail/web group were also
recruited using the USPS, but were asked in the first and second postcards to complete the
questionnaire online. The third and fourth contacts with this group contained paper
questionnaires just like the mail group. Data from each survey mode (mail and web) were
compiled and given a unique identification code. All data were then combined, cleaned, and
weighted. The adjusted response rate was 24.3%, a 3.2 percentage point increase from the FY
2019 survey. Region 2 had the best adjusted response rate of 26.5%.
1.2.1 Weighting
The sampling design was a stratified random sample. Therefore, the statewide weighted
analyses for these data incorporate sampling weights to reflect the variable selection probabilities
within each region. In addition to the sampling weight, a weighting was included to account for
household nonresponse which varied slightly by region. Finally, a post-stratification adjustment
was done to account for the imbalance due to differential nonresponse across demographic
variables. The demographic variables obtained from the completed sample were compared to the
latest available data from the 2018 American Community Survey population values for Oregon.
As in the past three surveys, age and education for the sample data appeared to be more out of
line than other demographic variables with respect to population values (comparisons were made
using chi-square tests). In addition, the responses to questions from the questionnaire showed
differences across age and education levels. Therefore, these two variables were used to adjust
the sample post-stratification.
3
1.3 ORGANIZATION OF THE RESULTS
The survey results are organized into two sections. Section 2.0 summarizes findings from the FY
2021 survey, and Section 3.0 presents trend analyses of select questions that have also been
included in preceding years. Section 4.0 gives a summary of respondents’ comments. Appendix
A shows respondent demographics that did not appear elsewhere in the report. Appendix B is the
survey instrument that was sent out.

4

5
2.0 SURVEY FINDINGS
This section of the report presents noteworthy results from the FY 2021 Oregon Transportation
Needs and Issues Survey. Results are organized according to topic, such as satisfaction with
ODOT services, transportation modes, spending, and funding. Some of the demographics of the
respondents can be found in (Appendix A). Except where noted, those respondents who
responded “no answer” were dropped from the analysis. The frequencies that are now reported
are based on the respondents who had an opinion on the question and selected an answer
including the response of don’t know. Due to rounding, not all percentages will sum to 100%.
2.1 FUNDING
2.1.1 Fuel Taxes
The Oregon DOT uses several revenue sources to fund the transportation system, with the
gasoline tax being one of the predominant funding sources. The money collected through state
gasoline taxes and motor vehicle registration fees goes to build and maintain highways, streets,
roads, bridges, and roadside rest areas. Respondents were asked if they felt they were getting a
good value for their money from the gasoline tax. They were also asked if the funds collected
were adequate for Oregon’s transportation needs (Figure 2.1).
Figure 2.1: Value and adequacy of the gas tax

6
Of the respondents who answered the question, 40% thought the gas tax was a good value. When
asked if respondents felt the gas tax was adequate for covering transportation costs, around 46%
thought that it was and 29% were unsure. The uncertainty around this question is among the
highest of any question in the survey. Compared to the last survey conducted, there was a one
percentage point increase for both the perception of value of the gas tax and a 6.7 percentage
point increase in respondents who felt the tax was adequate.
2.1.2 Toll Roads
Respondents were also asked, “If more funds had to be raised for transportation projects within
the state, which method do you feel would be most fair: increasing the gasoline tax to pay for the
facilities; OR charging users of certain facilities a toll that would fund the cost of building and
maintaining the facilities; OR increasing vehicle registration fees; OR charging users a
mileage/distance fee” (Figure 2.2). Respondents felt increasing the gas tax was fairer than the
other options; this question also had a large percentage of respondents who didn’t have a strong
opinion.
Figure 2.2: Which funding is most fair?
Respondents were also asked if they would favor or oppose tolls in their area to reduce
congestion. Broken out by metro and rural areas shows that Portland residents are favor tolls the
most, with the Rogue Valley MPO favoring them the least as seen in Figure 2.3.

7
Figure 2.3: Support for tolls by area
Oregonians were also asked if they would change their travel behavior if tolls were required or if
public transit improved in your area or if bike lanes and sidewalks improved. As seen in Figure
2.4, respondents were most likely to change their travel behavior if tolls became required, and
least likely to change behavior if bike lanes were improved.

8
Figure 2.4: Travel behavior change
2.2 SPENDING
In addition to transportation funding questions, the survey asked a series of questions to gauge
public opinion on transportation spending. The survey provided a list of several expenditure
categories (e.g. reducing congestion, increasing bus services between cities, and protecting fish
and wildlife habitat), and respondents were asked to rate the importance of spending for each
category as “very important,” “somewhat important,” or “not at all important.” The results are
shown in Figure 2.5.

9
Figure 2.5: Importance of where ODOT funds are spent
The highest proportions of satisfaction from respondents were found in the following areas of
spending:
The highest percent of very important responses was with spending funds on
maintaining current highways, roads, and bridges (84%), followed by conserving and
protecting the environment (62%). Protecting fish and wildlife habitat was considered
very important by 60% and reducing greenhouse gas emissions, and seismic
improvements on bridges each had 57% of the respondents rate them very important.
The highest percent of important overall (percent very and somewhat important)
responses was with spending funds on maintaining current highways, roads, and
bridges (99%), improve roadway safety features (94%), and reduce traffic congestion
(93%).

10
The highest percent of not at all important responses was with funding to add
sidewalks and bike lanes to existing streets (20%), and Amtrak rail service between
cities (18%).
2.3 SATISFACTION WITH ODOT SERVICES
Survey questions regarding satisfaction with agency services were organized as follows: “very
satisfied,” “somewhat satisfied,” “not very satisfied,” and “not at all satisfied”. The very or
somewhat satisfied ratings will be combined to indicate overall satisfaction.
Respondents were prompted to indicate their level of satisfaction with select ODOT services.
Results from these questions are highlighted below, and comparison results are shown in Figure
2.6.
Within the satisfaction categories, the following are notable:
Bridge conditions (smoothness, quietness, durability, and appearance) were found
more satisfactory by 75% of respondents – a two percentage point increase from
2018, while 69% - an eight percentage point increase from 2018, were satisfied with
pavement conditions.
People were most satisfied with the safety of Oregon highways (such as guardrails,
hazard signs, lighting, lane width, warning signs, pavement stripes, shoulder width,
and fog lines), which earned an 78% satisfaction rating – a similar percentage from
the last survey, and least satisfied about ODOT’s efforts to improve the overall
transportation system, including railroads, buses, and transit, which earned a 52%
satisfaction rating, also similar to the previous survey.
Respondents were the most dissatisfied with ODOT’s expansion and improvement of
highways, roads and bridges to meet state residents’ needs with a 38% unsatisfactory
rating – this is a four percentage point decrease in dissatisfaction from the 2018
survey.

11
Figure 2.6: Level of satisfaction with ODOT services
2.4 PUBLIC TRANSPORTATION
A series of questions was asked regarding the use and satisfaction with select public
transportation services. Respondents were first asked if they had used van pool/rideshare,
community bus, and/or services for seniors and individuals with disabilities during the month
prior to the survey. Only those who had used one or more of the services were asked about their
level of satisfaction and perception of safety. Of people who had used transportation services:
1.8% of Oregonians used a community transportation service for senior or individuals
with a disability in the last month and 96.5% were somewhat or very satisfied with
the service.
10% of Oregonians used a local community bus in the last month, and 85% were
somewhat or very satisfied with the service and 86% felt very or somewhat safe while
doing so.

12
People were also asked if safety concerns affect their interest in public transportation
or transit. 35% stated that it did not affect their interest. Women were more likely to
state safety affected their interest with 21% saying it did, versus 14% of men.
Next, people were asked how frequently the bike or walked in their community and
how safe they felt doing so. 15% of respondents frequently rode a bike in their
community and 81% felt very or somewhat safe doing so as seen in Tables 2.1 and
2.2.
Table 2.1: Frequency of Bike Riding in Community
Yes, I ride a bike
frequently
I ride some but not
much
No, I don’t ride a bike at
all
Don’t
know
14.6 26.9 58 0.6
Perception of safety for respondents stated they do ride a bike in their community.
Table 2.2: Perception of Safety While Riding a Bike
Very safe Somewhat safe Not very safe Not at all safe
29 51.9 16.1 3
The survey then asked if the respondent walked in their community. 56% stated they frequently
walked in the community and 90% felt very or somewhat safe doing so as seen in Tables 2.3 and
2.4.
Table 2.3: Frequency of Walking in the Community
Yes, I walk frequently I walk some but not much No, I don’t walk at all Don’t know
55.5 31.6 12.4 0.5
Perception of safety for respondents who state they walked in their community
Table 2.4: Perception of Safety While Walking
Very safe Somewhat safe Not very safe Not at all safe
51.6 38.2 9.2 1
2.5 HIGHWAY
One of the Oregon Department of Transportation’s responsibilities is to build and maintain the
state highway system, which includes freeways, major roads, and bridges. The survey examined
residents’ overall satisfaction with these elements compared to ten years ago.

13
2.5.1 Highway and Bridge Conditions Compared to Ten Years Ago
Comparing the overall condition of Oregon’s roads, highways, and bridges to their condition ten
years ago (Figure 2.7):
38% thought they were about the same.
21% thought they were better.
24% thought they were worse, down from 32% in the last survey.
Figure 2.7: Condition of ODOT's roads and bridges compared to ten years ago
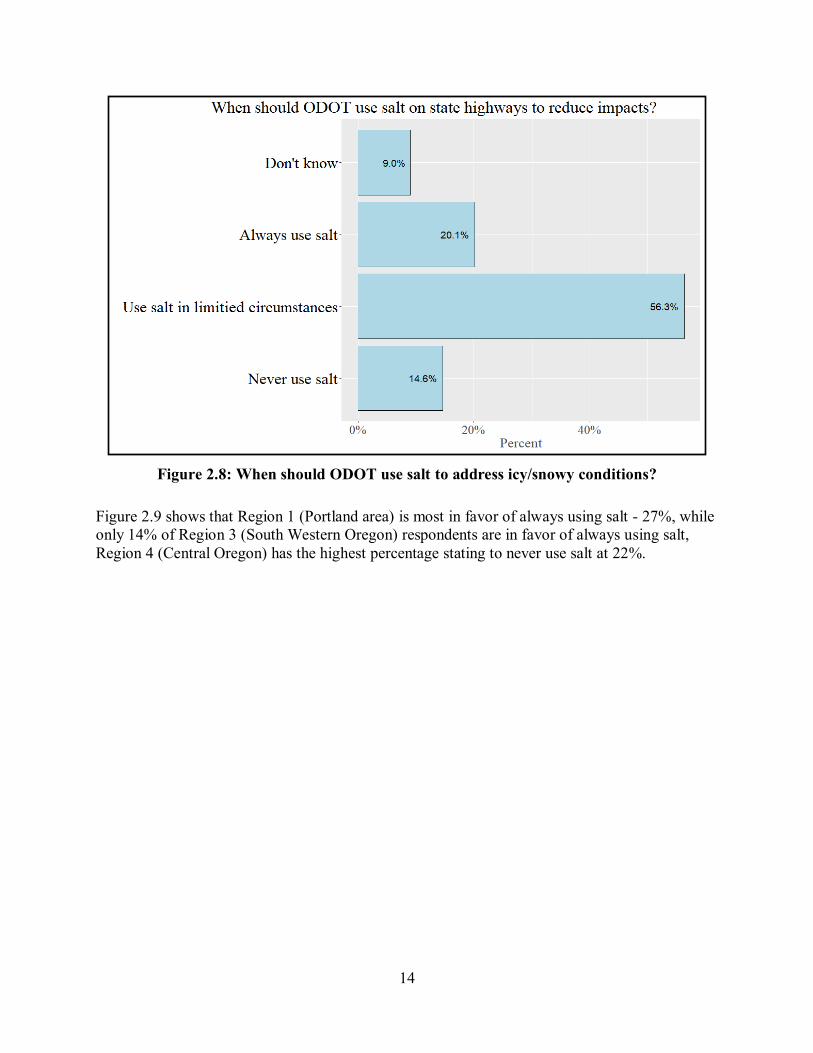
A question asked for the first time two years ago was when should ODOT use salt on state
highways to reduce travel-related impacts of ice and snow. As shown in Figure 2.8, 20% of
Oregonians felt ODOT should always use salt, while 15% said it should never be used.
14
Figure 2.8: When should ODOT use salt to address icy/snowy conditions?
Figure 2.9 shows that Region 1 (Portland area) is most in favor of always using salt - 27%, while
only 14% of Region 3 (South Western Oregon) respondents are in favor of always using salt,
Region 4 (Central Oregon) has the highest percentage stating to never use salt at 22%.

15
Figure 2.9: Use of salt by Region for icy/snowy conditions
A new question this year asked Oregonians if changes in our climate are affecting transportation
in Oregon. 54% of the respondents strongly or somewhat agreed that it was, with 20% strongly
disagreeing (Figure 2.10).

16
Figure 2.10: Are changes in climate affecting Oregon's transportation?
Oregonians were also asked if ODOT was doing enough to adapt to the transportation challenges
posed by climate change. 32% strongly or somewhat agree ODOT was, while 28% somewhat or
strongly disagreed they were doing enough, and 20% stated they don’t believe climate change is
affecting transportation as shown in Figure 2.11 below. 20% felt climate change is not affecting
transportation in Oregon, similar to those who strongly disagreed in the previous question.

17
Figure 2.11: Is ODOT adapting to transportation challenges due to climate change?
2.5.2 Traffic Congestion
Respondents were asked to rate the seriousness of traffic congestion in their community. For the
state as a whole:
15% did not think that it was a problem at all, a four percentage point increase from
2018.
33% thought it was a minor problem, also a four percentage point increase from the
last survey.
30% saw it as a somewhat serious issue, a five percentage point decrease from 2018.
20% thought that their local traffic congestion was a very serious problem, a four
percentage point decrease from the last survey.
These results varied the most between Portland/Bend and other areas of the state (Figure 2.12).
Percent of Portland metro residents who felt traffic congestion was very serious was 30%, Bend
residents responded similarly.

18
Figure 2.12: Seriousness of traffic congestion by area
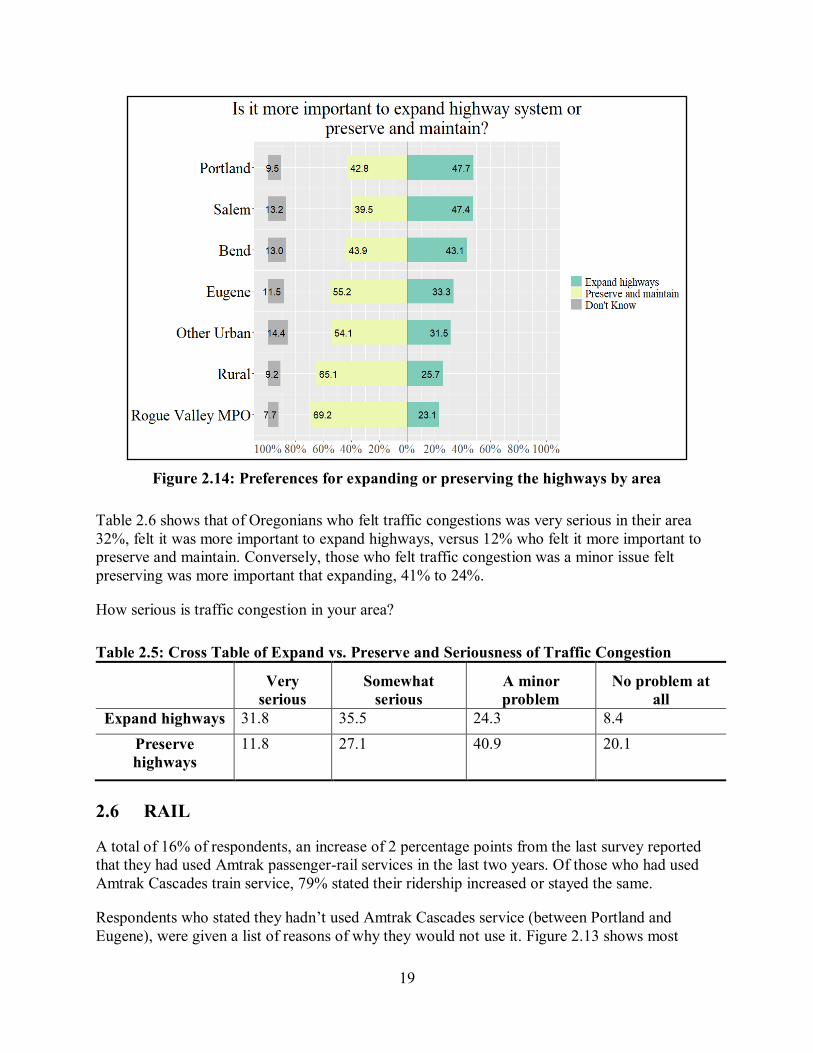
Next, respondents were asked to choose between the importance of expanding the highway
system to reduce traffic congestion or preserving and maintaining the highways Oregon already
has. Slightly less than half of Oregonians (49%) feel that the preservation and maintenance of
existing roads is a higher priority than expanding the highway system to reduce congestion.
Portland metro residents were more in favor (48%) of expanding highways to reduce congestion
than other areas, this is a two percentage point increase over the last survey. Rogue Valley
residents were least in favor of expansion (69%). Similar to the question on traffic congestion,
the results varied noticeably between those living in the larger metro areas and those elsewhere
in the state (Figure 2.14).
19
Figure 2.14: Preferences for expanding or preserving the highways by area
Table 2.6 shows that of Oregonians who felt traffic congestions was very serious in their area
32%, felt it was more important to expand highways, versus 12% who felt it more important to
preserve and maintain. Conversely, those who felt traffic congestion was a minor issue felt
preserving was more important that expanding, 41% to 24%.
How serious is traffic congestion in your area?
Table 2.5: Cross Table of Expand vs. Preserve and Seriousness of Traffic Congestion
Very
serious
Somewhat
serious
A minor
problem
No problem at
all
Expand highways 31.8 35.5 24.3 8.4
Preserve
highways
11.8 27.1 40.9 20.1
2.6 RAIL
A total of 16% of respondents, an increase of 2 percentage points from the last survey reported
that they had used Amtrak passenger-rail services in the last two years. Of those who had used
Amtrak Cascades train service, 79% stated their ridership increased or stayed the same.
Respondents who stated they hadn’t used Amtrak Cascades service (between Portland and
Eugene), were given a list of reasons of why they would not use it. Figure 2.13 shows most

20
people did not utilize the service due to not living near the service (41%). The least important
reason was that arrival and departure times do not fit their needs (11%). Don’t know responses
were excluded from this figure for clarity.
Figure 2.13: Reasons for not using Amtrak Cascades in the last two years
2.7 DRIVER AND MOTOR VEHICLE (DMV) SERVICES
A series of questions was asked about whether respondents who used DMV online services
recently, as well as potential future services. 51% of Oregonians had used DMV online services
in the last twelve months. Of those that did, 36% felt there should be more services available
online. 68% also felt they would use DMV self-service kiosks, if they were available, to
purchase DMV products such as registration tags.
2.8 TRAVEL CHOICES AND BEHAVIOR
2.8.1 Travel Behavior
Nearly all respondents reported that they were licensed drivers (96%).
2.8.2 Commuting Behavior
Of respondents who had an opinion, 65% said they commuted to work or school.

21
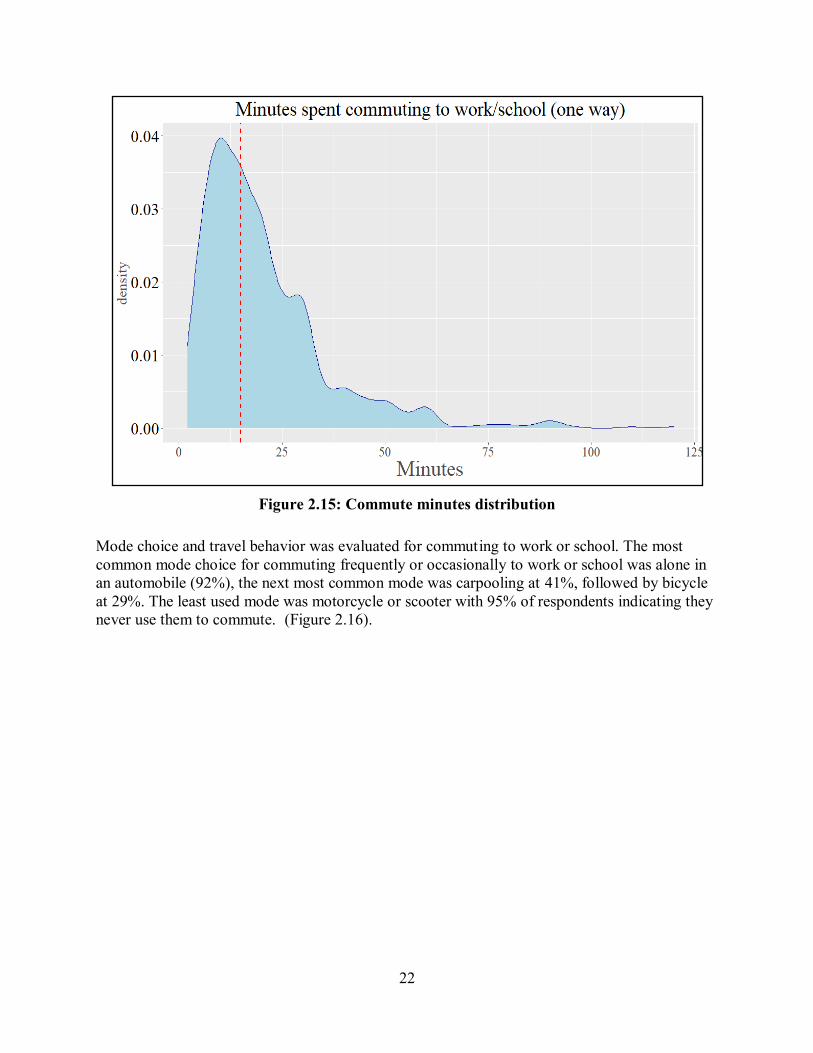
The average Oregonian traveled 11 miles to get to work or school one-way and it took them 23
minutes, Figure 2.14 and 2.15 shows the distribution of the number of miles and minutes to
commute respectively. The dashed red lines are the median number of miles to commute (8
miles) and median minutes to commute (20 minutes), this is unchanged from the previous
survey.
Commuting times between urban and rural were not very different, with rural commutes about
one minute longer. Commuting miles were also similar with the rural residents having a
commute of about a half mile more.
Figure 2.14: Commute miles distribution
22
Figure 2.15: Commute minutes distribution
Mode choice and travel behavior was evaluated for commuting to work or school. The most
common mode choice for commuting frequently or occasionally to work or school was alone in
an automobile (92%), the next most common mode was carpooling at 41%, followed by bicycle
at 29%. The least used mode was motorcycle or scooter with 95% of respondents indicating they
never use them to commute. (Figure 2.16).

23
Figure 2.16: Commuter (work or school) mode choice
Respondents were asked whether or not they would change how or when they travel to work or
school, based on changes to the transportation system (Figure 2.17). The majority of people
(57%) said they definitely or possibly would change their behavior if new tolls became required
for roadways or bridges they currently use, this is a nine percentage point decrease from the last
survey.
About 44% of people responded that they would or might change if public transit options such as
rail or bus-lines were added or improved in their area, a five percentage point decrease from the
last survey. When asked if they might change their commuting habits if biking or walking
facilities (bike-lanes, sidewalks) were added or improved in their area, 47% of respondents said
they would not, a four percentage point decrease from the previous survey.

24
Figure 2.17: Commuting behavior change factors
2.9 OVERALL AGENCY PERFORMANCE
Respondents were asked to rate ODOT’s overall performance: excellent, good, fair, or poor. The
majority of Oregonians thought that ODOT was doing a good or excellent job (48%) (Figure
2.18), a six percentage point drop from two years ago, and twelve percentage points down from
four years ago. Those respondents no longer rating ODOT performance as good or excellent,
now rate it as fair.

25
Figure 2.18: Rating of ODOT's overall performance
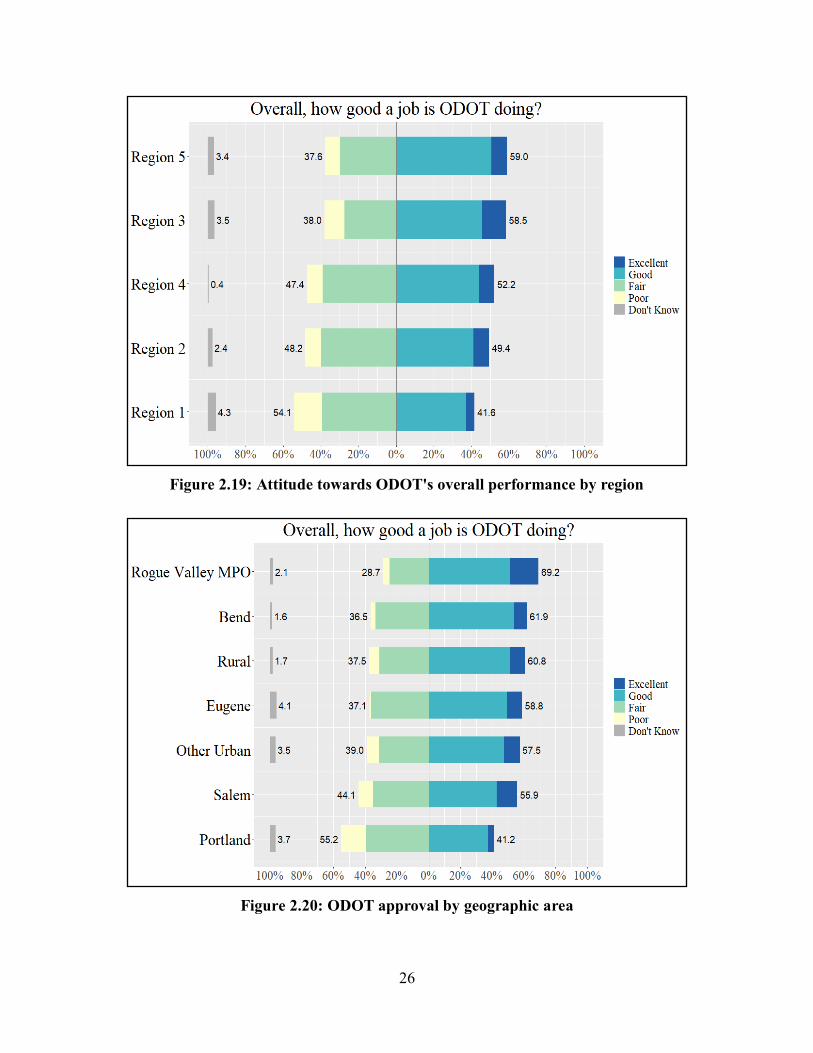
Figure 2.19 shows how each region feels about the overall job ODOT is doing. Region 5 gave
ODOT the highest marks (59%), while Region 1 gave the lowest opinion with (42%), this is a 2
percentage point drop in approval from the previous survey for that region. Region 3 saw a
thirteen percentage point drop in approval since the last survey. Figure 2.20 shows the approval
rating by area, and shows Portland has the lowest opinion on ODOT job performance.
26
Figure 2.19: Attitude towards ODOT's overall performance by region
Figure 2.20: ODOT approval by geographic area
27
3.0 OPINION TRENDS 2006-2020
The following section examines how Oregonian’s opinions of the transportation system have
varied of over time. Although some survey questions date back to earlier iterations, the trend
analysis uses FY 2007 data forward, as these surveys included comparable mail and web modes.
In FY 2007 and FY 2009, the survey was also conducted by phone, but the phone data were not
used in this analysis, as the phone survey mode was discontinued after FY 2009.
The data presented below is weighted, percentages may differ from previous graphs since “no
answer” is included in the analysis, whereas in previous graphs it was excluded. This was done
to provide consistency across the biennial surveys. Graphs shown here were selected since they
showed significant changes between years.
3.1 SATISFACTION WITH ODOT SERVICES AND ACTIVITIES
The Transportation Needs and Issues Survey consistently asks a large number of questions about
the level of satisfaction with a variety of ODOT services. Figure 3.1 shows the percentage of
respondents who indicated they were “very satisfied” or “somewhat satisfied” with the particular
activity in each year.
Satisfaction with ODOT’s maintenance had been on a somewhat downward trend over time, but
did recover a bit this year (Figure 3.1), satisfaction with ODOT’s expansion and improvement
efforts had been rising until the 2012 survey, but then dropped off until this year (Figure 3.2).

28
Figure 3.1: Opinion of ODOT maintenance (2006 – 2020)
Figure 3.2 - Satisfaction with ODOT's expansion and improvement of roads (2006 - 2020)

29
3.2 FUNDING
Figure 3.3 shows respondents who said they get good value from the gas tax has declined every
year but the 2016 survey. It started out at 59% in 2006 and has now declined to about 40% in the
most recent survey, that percentage is similar to the last survey.
Figure 3.3: Opinion of gas taxes and fees value over time (2006 – 2020)
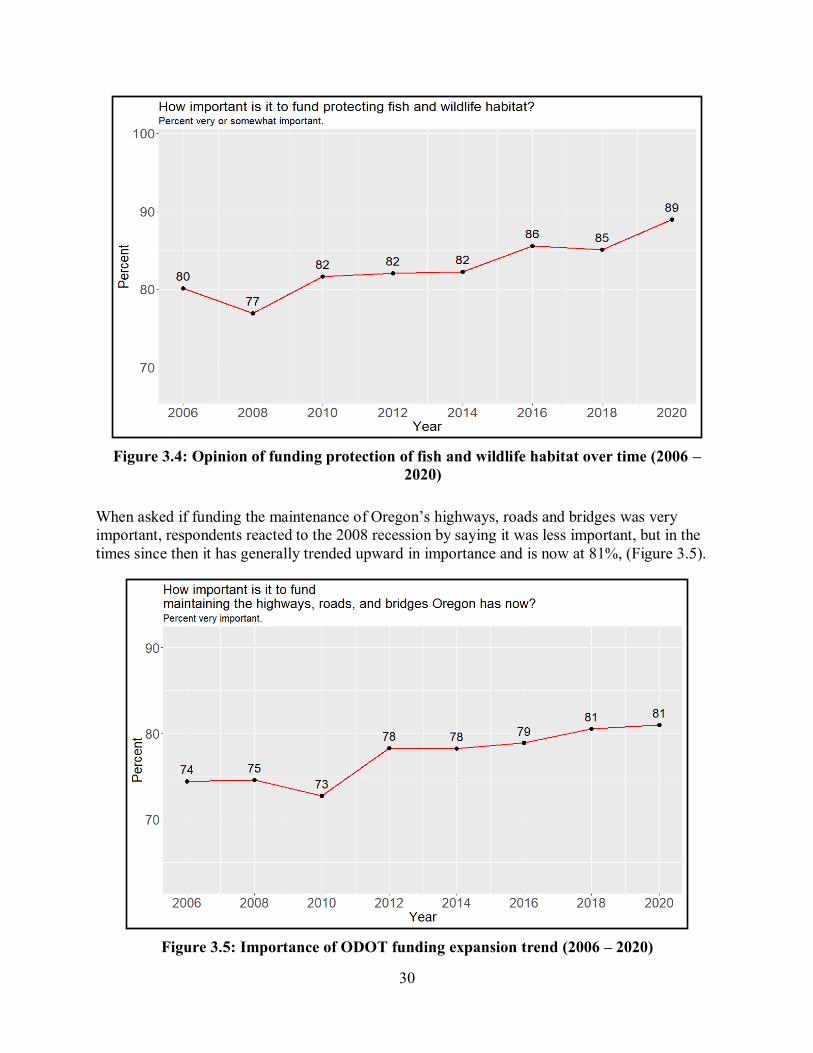
In general, Oregonians have felt it is more and more important to fund protecting fish and
wildlife habitat as seen by the general uptrend of those who feel it is very or somewhat important
in Figure 3.4
30
Figure 3.4: Opinion of funding protection of fish and wildlife habitat over time (2006 –
2020)
When asked if funding the maintenance of Oregon’s highways, roads and bridges was very
important, respondents reacted to the 2008 recession by saying it was less important, but in the
times since then it has generally trended upward in importance and is now at 81%, (Figure 3.5).
Figure 3.5: Importance of ODOT funding expansion trend (2006 – 2020)

31
3.3 OVERALL AGENCY PERFORMANCE
Each Transportation Needs and Issues Survey has asked, “Overall, how good a job do you think
the Oregon Department of Transportation is doing – excellent, good, fair, or poor?” Oregonians
who felt ODOT was doing a “good” or “excellent” job gradually declined from 2006 to 2016, the
last two surveys have shown a steeper decline in their opinion of ODOT’s performance. (Figure
3.6)
Figure 3.6: Rating of ODOT's overall performance trend (2006 - 2020)
3.4 CONGESTION TRENDS
After declining for several years, the percentage of respondents who felt traffic congestion in
their community was very or somewhat serious decreased from 2006 to 2012, then increased for
the three straight years, but dropped eight percentage points in 2020 as seen in Figure 3.7. At the
time the survey was conducted, Oregon was in various states of being shut down due to the
COVID-19 pandemic. Traffic volumes were down 10% - 20% on average statewide during this
time. This could be part of the reason respondents perceived traffic congestion was not as much
of a problem as it had been.

32
Figure 3.7: How serious is traffic congestion trend (2006 - 2020)
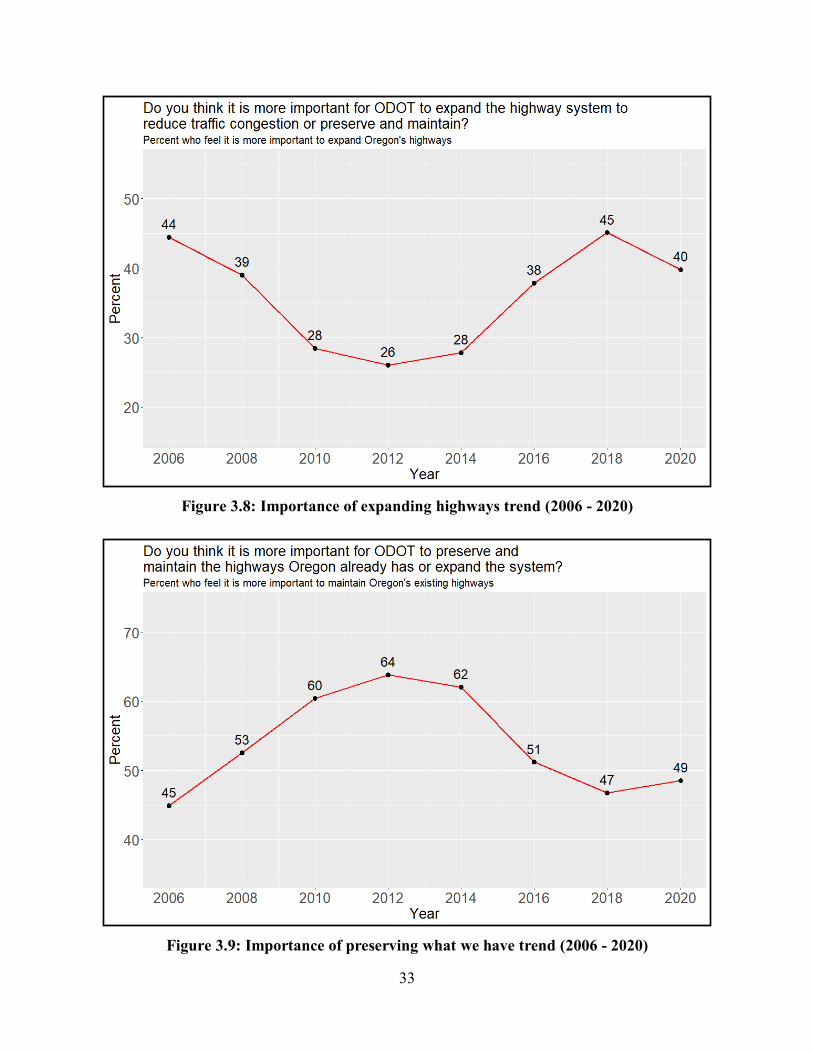
Oregonians were asked if they felt it was more important to expand the highway system to
reduce congestion, or preserve and maintain the highways Oregon already has. Figure 3.8 shows
that since 2012 and up until this year, Oregon residents felt it is of increasing importance to
expand the highway system, but possibly again due to reduced traffic volume due to the
pandemic feel it has less importance this year than in previous years. Figure 3.9 shows a
corresponding slight increase in the percent of respondents who feel it is more important to
preserve the highways we already have. After being almost evenly split on this opinion in 2018,
Oregonians now feel more inclined to preserve what we have versus expand.
33
Figure 3.8: Importance of expanding highways trend (2006 - 2020)
Figure 3.9: Importance of preserving what we have trend (2006 - 2020)

34
3.5 ALTERNATIVE TRANSPORTATION
This section looks at significant trends seen in community bus service satisfaction and use.
Figure 3.10 shows that after years of level local community bus use, there was a drop this year,
possibly due the COVID-19 restrictions imposed during the time this survey was taken.
Figure 3.10: Percent using public transportation in the last month trends (2006 – 2020)
After a large drop in satisfaction in the 2008 survey, satisfaction with the local community bus
service has seen a slow but increasing trend and now currently stands at 85% (Figure 3.11).

35
Figure 3.11: Satisfaction with local bus service trend (2006 - 2020)

36

37
4.0 RESPONDENTS’ COMMENTS
Respondents’ comments were generally positive. Many people thanked ODOT for doing a good
job, especially for keeping highways open during inclement weather. Negative comments
focused on congestion in Portland, studded tires, the increase in rural speed limits, and narrowing
roadways for bike lanes. Respondents also had several comments about where money should be
spent and generally felt more money should be spent on roads for cars and trucks as well as
public transportation.
Below is a small sample of respondent’s comments.
Portland traffic is abysmal. What can be done to ease congestion there?
Would be nice to have more buses in Portland and surrounding communities.
Portland needs to stop so many people moving to here until our road system can catch
up.
Thank you for all the work you do, especially keeping the bike lanes clean.
Would like to see increased Amtrak options, which is a great way to travel.
Stop wasting money by sending out surveys, you’ll just do whatever you want
anyway.
I see a lot of roadway being converted to bike use, but you hardly ever see bikes using
it. We need more sidewalks so people can walk safely, not bike lanes.
We need a new bridge across the Columbia and another bridge in Salem.
Need to look at other funding sources rather than gas taxes and fees on cars, but not
tolling. Tolling will just increase congestion on side streets.
Ban studded tires.
Build more bike lanes and add buses.
The positive side of this pandemic is the reduced congestion in Portland.
So many potholes, please fix them.
ODOT needs to be more cost effective and efficient.
4.1 CONCLUSION
38
The Transportation Needs and Issues Survey is conducted to assess the opinions of Oregonians
regarding the state transportation system. The FY 2021 survey was the 15th iteration of survey in
this series. The survey was sent out after Oregon began restricting activities due to the COVID-
19 pandemic. Since traffic volumes were down 10% to 20% during this time, it may have
changed how people responded to this survey, especially in the areas of congestion and public
transportation use.
The FY 2021 survey results were fairly consistent with past needs and issues surveys and
reflected mixed opinions. Unlike recent surveys, where respondents were more likely to
prioritize expansion of the highway system to reduce congestion, there seems to be more interest
in maintaining the highway system we currently have. The Portland and Salem metro areas
continue to favor expanding over maintain however.
Fewer Oregonians felt ODOT was doing an excellent or good job overall, as that rating has
continued to decline. More felt ODOT was doing a fair job than in recent years, the number who
stated the performance was poor is unchanged. In general, there is a perception that road and
bridge conditions as well as congestion were improving. The number of respondents who feel
they get good value from the gas tax and license/registration fees they pay remained flat at forty
percent. There is quite a bit of uncertainty about whether current funding is adequate to maintain
the roads and whether tolls would be a fair way to fund the system. Respondents in the Portland
metro area were much more likely to support tolls than other areas of the state.
A large majority of commutes, ninety-two percent, are done alone in an automobile. Forty-four
percent stated they would use public transportation more if the system was improved and thirty-
eight percent said they would bike more if the lanes were added or improved in their area.
The 2021 Transportation Needs and Issues Survey was scientifically conducted to gauge the
opinions of adult Oregonians on many aspects of the transportation system managed by ODOT.
As such, the results of this survey can be said to have a reasonable probability that they are
representative of the views of Oregonians. It is a well-known fact in survey research, however,
that how a question is posed, as well as what questions are asked, can make a difference in
people’s responses. Thus, it is advisable that the reader consider the results of this survey in
concert with other information on people’s views, rather than taking these results as the final
word on how people view the transportation system and ODOT’s role in managing it.

APPENDIX A: RESPONDENT DEMOGRAPHICS


A-1
Figure A.1: Respondents’ age distribution by gender
Figure A.1 shows the respondents age distribution broken out by gender. Overall, people who
filled out the survey are generally older than average, with the median female age being 62 and
males being 64.
Figure A.2 below shows a distribution of the number of years the survey respondents have been
resident in Oregon. The median resident time was 37 years as shown by the dashed red line.

A-2
Figure A.2: Distribution graph of years resident in Oregon
Respondents were also asked if the place they live in is urban rural or other. A little over two-
thirds of Oregonians reported that they lived in an urban or suburban area as shown in Table A.1.
Table A.1 - Percent Urban, Rural or Other
Urban or Suburban Rural Other Don’t know
67.2 29.3 1.5 2
The Americans with Disability Act defines a person with a disability as somebody who has a
physical or mental impairment that substantially limits one or more major life activities.
Respondents were asked whether based on this definition; are you a person with a disability?
Table A.2 shows that 11% answered yes, they are disabled.
Table A.2 – Percent Respondents who are disabled
Yes No Don’t know
10.7 87.1 2.2

A-3
Figure A.3: Distribution of respondents’ education level
As seen in Figure A.3, the majority of respondents have at least some college, and fifty-four
percent have a two-year college degree or higher.
Table A.5 shows that ninety-one percent of the respondents were white, the next highest race
category was Latino and Asian, at 2.7% and 2.5% respectively. In general, the non-White
percentages of race are lower than what you would expect from the census. In part this is due to
how the survey sample is split evenly between the five ODOT Regions. Most non-Whites in
Oregon live in Region 1 which includes Portland, for instance 75% of Blacks live in Region 1.
Since Region 1 only makes up 20% of the survey sample it is under sampling minorities in
Oregon. Work is currently underway to determine the best way to address this issue while still
retaining the ability to conduct comparisons across survey years.

A-4
Table A.5: Respondents’ Race
Race Percent
White 91.1
Black, African Am. 0.7
Asian 2.5
Native 2.2
Hawaiian 0.5
Latino 2.7
Other 0.3
Lastly, respondents were asked about their total household income. As shown in Table A.6,
almost two-thirds of them earned more than $50,000, while twenty-four percent earned less than
$35,000. There was a four percentage point decrease in the number of respondents who stated
they earned more than $100K compared to the last survey.
Table A.6: Respondents’ total household income
<$15K
$15K-
$25K
$25K-
$35K
$35K-
$50K
$50K-
$75K
$75K-
$100K
$100K-
$150K
$150K-
$200K >$200K
6 9.3 7.5 12.3 20 16 17.3 6.1 5.5

APPENDIX B:


B-1
O 2020 Oregon Transportation Needs and Issues Survey
To be completed by the adult (age 18 or over) who has had the most recent birthday in your household.
Information about this survey is in the letters you received.
Please return your completed survey in the pre-paid envelope to:
Oregon State University Survey Research Center
239 Weniger Hall Corvallis, OR 97331-8574
Corvallis, OR 97331-8574

B-2

B-3
Q1. How many years, altogether, have you lived in Oregon? (Please write a ‘0’ if less than one year)
Years
Q2. In which Oregon county do you live?
County
Q3. How satisfied, if at all, are you with each of the following services the Oregon Department of
Transportation (ODOT) provides? (Select one for each item)
Very satisfied Somewhat satisfied
Not very satisfied
Not at all satisfied
Don't know
ODOT’s maintenance of Oregon’s highways, roads, and bridges
1 2 3 4 5
Pavement conditions on
major Oregon highways (such as smoothness, quietness, durability, and appearance)
1 2 3 4 5
Bridge conditions on
major Oregon highways (such as smoothness, quietness, durability, and appearance)
1 2 3 4 5
Safety features on major
Oregon highways (such
as guardrails, hazard
signs, lighting, warning
signs, pavement stripes,
shoulder width, lane
width, fog lines)
1 2 3 4 5
ODOT's expansion and improvement of highways, roads, and bridges to meet state residents' needs
1 2 3 4 5
ODOT's efforts to improve Oregon's transportation system (including railroads, buses, and transit; in addition to highways)
1 2 3 4 5

B-4
Q4. Compared to ten years ago, would you say that Oregon’s highways, roads, and bridges are better,
about the same, or worse?
1 Better than 10 years ago
2 About the same as 10 years ago
3 Worse than 10 years ago
4 Don't know
Q5. How much do you agree or disagree with this statement: "Changes in our climate are affecting
transportation in Oregon."
1 Strongly agree
2 Somewhat agree
3 Somewhat disagree
4 Strongly disagree
5 Don't know
Q6. How much do you agree or disagree with this statement: “ODOT is doing enough to adapt to
transportation challenges brought on by changes in our climate.”
1 Strongly agree
2 Somewhat agree
3 Somewhat disagree
4 Strongly disagree
5 Don't know
6 I don’t believe climate is affecting transportation in Oregon
Q7. Overall, how good a job do you think the ODOT is doing?
1 Excellent
2 Good
3 Fair
4 Poor
5 Don't know
Q8. The money collected through state gasoline taxes and motor vehicle registration fees goes to build
and maintain highways, streets, roads, bridges, and roadside rest areas. Do you feel that you get
good value for your money?
1 Yes, get good value
2 No, do not get good value
3 Don't know
Q9. Do you think that funds collected through the gas tax are adequate or inadequate for Oregon’s
transportation needs?
1 Adequate
2 Inadequate
3 Don't know

B-5
Q10. If more funds had to be raised for transportation maintenance, repair, and development within the state, which method do you feel would be most fair: increasing the gasoline tax; OR charging users of certain roads and bridges a toll; OR increasing vehicle registration fees; OR charging drivers a mileage/distance fee?
1 Increase the gasoline tax
2 Charge users a toll
3 Increase vehicle registration fees
4 Charge drivers a mileage or distance fee
5 Don't know
Q11. Charging drivers a fee (for example, a toll) for their use of a road or bridges is one method Oregon
could use to influence driver behavior and reduce congestion. Would you favor or oppose the use of
tolls in your area to reduce traffic congestion?
1 I would strongly favor
2 I would somewhat favor
3 I would somewhat oppose
4 I would strongly oppose
5 Don't know
Q12. Would you change how or when you travel to work or school if any of the following became true?
Definitely would change travel
Possibly would change travel
Would not change travel
Don't know/Not applicable
New tolls became required for roadways or bridges that you currently use
1 2 3 4
Biking or walking facilities (bike lanes, sidewalks) were added or improved
1 2 3 4
Public transportation/transit options such as rail or bus lines were added or improved
1 2 3 4
Q13. GetThere is an online ride-matching/carpooling database that is offered to Oregon and Washington
residents and sponsored by ODOT. GetThere also has a trip logging feature for tracking your trips.
Before now, have you read, heard, or seen anything about GetThere?
1 Yes
2 No Skip to Q14 on the next page
3 Don’t know Skip to Q14 on the next page
Q13a. If yes, have you used GetThere?
1 Yes
2 No

B-6
Q14. Safe Routes to School (SRS) is an ODOT program designed to create safer routes to school for children. Before now, have you read, heard or seen anything about SRS?
1 Yes
2 No
3 Don’t know
Q15. Have you personally used public transportation/transit (local/regional buses, light rail, trains, etc.)
in the last month?
1 Yes
2 No Skip to Q16
3 Don't know Skip to Q16
Q15a. How satisfied, if at all, are you with the public transportation/transit service you have used?
1 Very satisfied
2 Somewhat satisfied
3 Not very satisfied
4 Not at all satisfied
5 Don't know
Q15b. How safe do you feel using public transportation/transit?
1 Very safe
2 Somewhat safe
3 Not very safe
4 Not at all safe
5 Don't know
Q16. Do safety concerns affect your interest in taking public transportation/transit?
1 Yes, this affects my interest
2 No, this does not affect my interest
3 I don't use public transportation/transit
Q17. Have you personally used a bus or van specifically provided for seniors or persons with disabilities
in the last month (such as dial-a-ride, paratransit, non-emergency medical transport, etc.)?
1 Yes
2 No Skip to Q18 on the next page
3 Don't know Skip to Q18 on the next page
Q17a. How satisfied, if at all, are you with the bus or van service for seniors or persons with
disabilities?
1 Very satisfied
2 Somewhat satisfied
3 Not very satisfied
4 Not at all satisfied
5 Don't know

B-7
Q18. Do you ride a bicycle in your community?
1 Yes, I ride a bike frequently in my community
2 I ride some but not much in my community
3 No, I don’t ride a bike at all in my community Skip to Q19
4 Don’t know Skip to Q19
Q18a. How safe do you feel bicycling in your community?
1 Very safe
2 Somewhat safe
3 Not very safe
4 Not at all safe
Q19. Do you walk in your community?
1 Yes, I walk frequently in my community
2 I walk some but not much in my community
3 No, I don’t walk at all in my community Skip to Q20
4 Don’t know Skip to Q20
Q19a. How safe do you feel walking in your community?
1 Very safe
2 Somewhat safe
3 Not very safe
4 Not at all safe
Q20. In your opinion, how safe to use are your community sidewalks for people who use assistive mobility devices such as
walkers, wheelchairs, canes, scooters, etc.?
1 Very safe
2 Somewhat safe
3 Not very safe
4 Not at all safe
5 Don't know
Q21. How serious of a problem is traffic congestion in your community?
1 Very serious
2 Somewhat serious
3 A minor problem
4 No problem at all
5 Don't know
Q22. Do you think it is more important for ODOT to expand the highway system to reduce traffic congestion OR to preserve
and maintain the highways Oregon already has?
1 Expand highway system
2 Preserve and maintain highway system
3 Don't know
Q23. Which option best describes your view on when ODOT should use salt on state highways to reduce travel-related impacts
of ice and snow?
1 ODOT should never use salt on state highways when ice and snow affect conditions
2 ODOT should use salt in limited circumstances, such as where other options are not as effective and only on certain
highways.
3 ODOT should always use salt on state highways when ice and snow affect conditions.
4 Don’t know
B-8
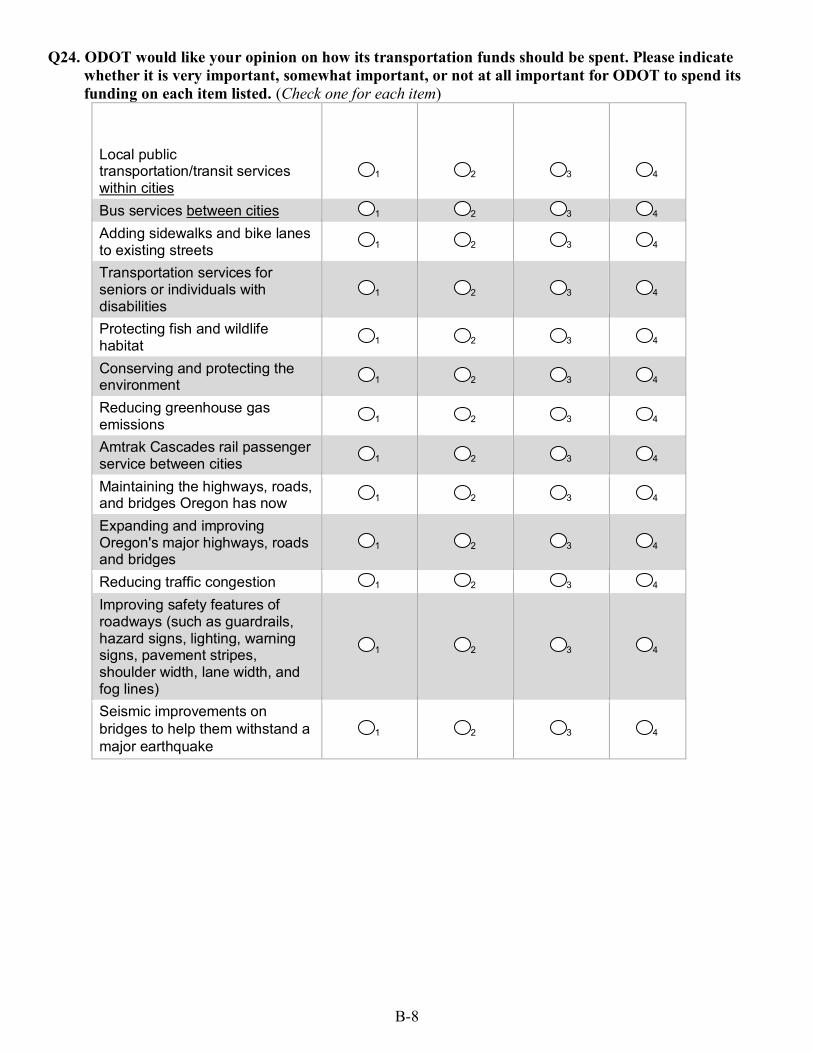
Q24. ODOT would like your opinion on how its transportation funds should be spent. Please indicate
whether it is very important, somewhat important, or not at all important for ODOT to spend its
funding on each item listed. (Check one for each item)
Very
important Somewhat important
Not at all important
Don't know
Local public transportation/transit services within cities
1 2 3 4
Bus services between cities 1 2 3 4
Adding sidewalks and bike lanes to existing streets
1 2 3 4
Transportation services for seniors or individuals with disabilities
1 2 3 4
Protecting fish and wildlife habitat
1 2 3 4
Conserving and protecting the environment
1 2 3 4
Reducing greenhouse gas emissions
1 2 3 4
Amtrak Cascades rail passenger service between cities
1 2 3 4
Maintaining the highways, roads, and bridges Oregon has now
1 2 3 4
Expanding and improving Oregon's major highways, roads and bridges
1 2 3 4
Reducing traffic congestion 1 2 3 4
Improving safety features of roadways (such as guardrails, hazard signs, lighting, warning signs, pavement stripes, shoulder width, lane width, and fog lines)
1 2 3 4
Seismic improvements on
bridges to help them withstand a
major earthquake 1 2 3 4

B-9
Q25. Have you used the Amtrak Cascades train service to start or end a trip in Oregon anytime within
the last two years?
1 Don’t know Skip to Q26 on the next page
2 Yes Skip to Q25b
3 No
Q25a. Since you have not used Amtrak Cascades, please indicate whether or not each of the
following is a reason why.
A reason Not a reason
I don’t live in the part of the state with Amtrak Cascades service (between Portland and Eugene).
1 2
The current arrival and departure times do not fit my needs.
1 2
The location of the station is inconvenient for me. 1 2
It costs too much. 1 2
Trip time is inconsistent or trains often arrive late. 1 2
The service is not frequent enough to meet my schedule. 1 2
I am not familiar with Amtrak Cascades train service in Oregon.
1 2
Please skip Q25b if you have not used Amtrak Cascades and go to Question 26 on
the next page.
Q25b. If you have used Amtrak Cascades, has your ridership increased, decreased, or stayed the same
compared to two years ago?
1 Increased from 2 years ago
2 Decreased from 2 years ago
3 Stayed the same since 2 years ago
4 Don't know/Not sure
B-10
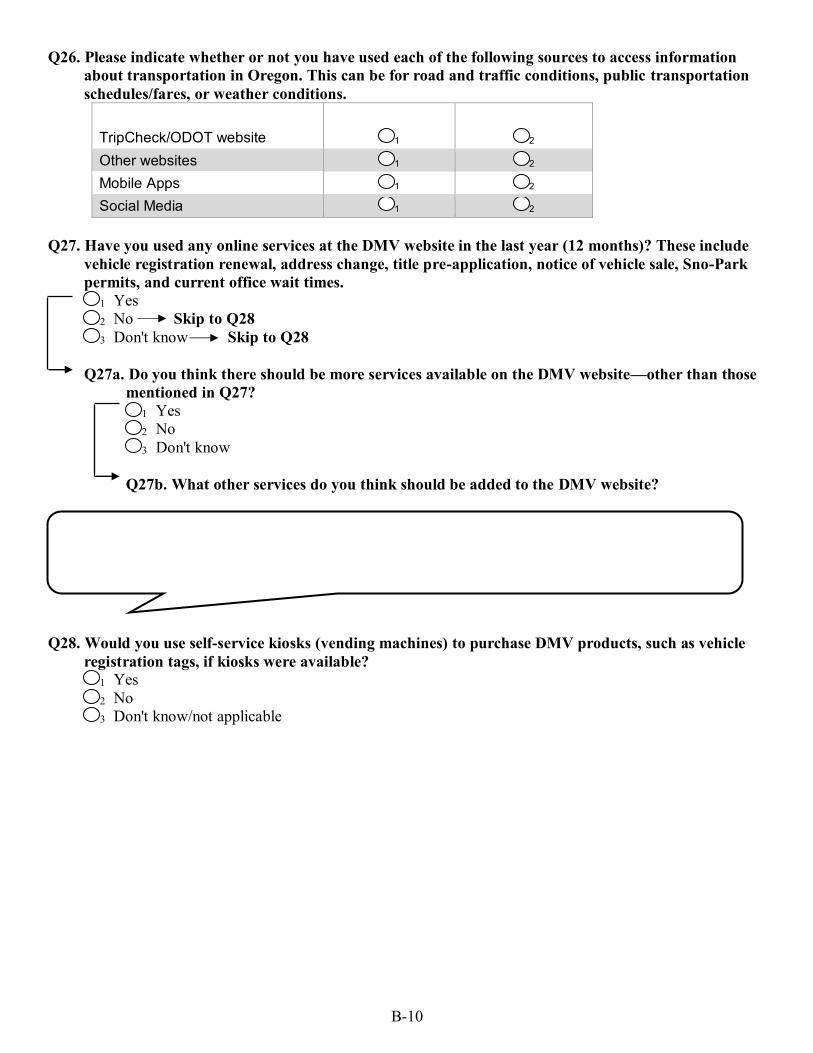
Q26. Please indicate whether or not you have used each of the following sources to access information
about transportation in Oregon. This can be for road and traffic conditions, public transportation
schedules/fares, or weather conditions.
Have used Have not used
TripCheck/ODOT website 1 2
Other websites 1 2
Mobile Apps 1 2
Social Media 1 2
Q27. Have you used any online services at the DMV website in the last year (12 months)? These include
vehicle registration renewal, address change, title pre-application, notice of vehicle sale, Sno-Park
permits, and current office wait times.
1 Yes
2 No Skip to Q28
3 Don't know Skip to Q28
Q27a. Do you think there should be more services available on the DMV website—other than those
mentioned in Q27?
1 Yes
2 No
3 Don't know
Q27b. What other services do you think should be added to the DMV website?
Q28. Would you use self-service kiosks (vending machines) to purchase DMV products, such as vehicle
registration tags, if kiosks were available?
1 Yes
2 No
3 Don't know/not applicable

B-11
The following and final questions are for statistical purposes only. They allow your responses to be
grouped with those of others with similar backgrounds. Please remember that all the information you
provide will remain strictly confidential.
Q29. Are you a licensed driver?
1 Yes
2 No Skip to Q30
Q29a. Have you used studded snow traction tires on one or more of your vehicles in the last 12
months?
1 Yes
2 No
3 Not applicable
Q30. Would you consider the place you live as urban/suburban or rural?
1 Urban/suburban
2 Rural
3 Other (describe ____________________)
4 Don't know
Q31. How old were you on your last birthday?
Years
Q32. What is your gender?
1 Male
2 Female
3 Non-binary
Q33. Do you typically commute to work or school?
1 Yes, I commute to work or school typically
2 No, I do not commute to work or school typically Skip to Q36 on the next page
Q33a. Please indicate the frequency with which you use each of the following to get to work or
school.
Frequently use Occasionally use Do not use
Alone in automobile 1 2 3
With others in automobile (carpool)
1 2
3
Public bus 1 2 3
Light rail or train 1 2 3
Taxi or Uber 1 2 3
Motorcycle or scooter 1 2 3
Bicycle 1 2 3
Walk 1 2 3
Other (describe____________________________________________________________)

B-12
Q34. On average, how many minutes does it usually take you to get to work or school (one-way)?
Minutes
Q35. On average, how many miles do you travel to get to work or school (one-way)?
Miles
Q36. The Americans with Disability Act (ADA) defines a person with a disability as somebody who has a
physical or mental impairment that substantially limits one or more major life activity. Based on
this definition, are you a person with a disability?
1 Yes
2 No
3 Don’t know
Q37. What is the highest level of education you have completed? (Select one)
1 0-8 years, No GED
2 9-12 years, no high school diploma or GED
3 High school diploma or GED
4 Some college, no degree
5 Associate's degree (AA, AS) or postsecondary certificate from community college or technical school
6 Bachelor's degree
7 Master's degree
8 Doctorate or professional degree
0 Other (describe ____________________)
Q38. What is your race? (Select all that apply)
1 White/Caucasian 3 Asian 5 Native Hawaiian or Pacific Islander
2 Black/African
American
4 American Indian or
Alaskan Native 6 Hispanic or Latino
7 Other (Describe_______________)
Q39. What is your total annual household income, from all sources, before taxes? Include money from
jobs (wages, salary, tips, and bonuses), interest, dividends, child support, alimony, welfare, social
security, disability, and retirement payments, net income from a business, farm or rent, or any
other money income received by members of your family. Do not include lump-sum payments, such
as money from an inheritance or sale of a home.
01 Under $15,000 04 $35,000 to $49,999 07 $100,000 to $149,999
02 $15,000 to $24,999 05 $50,000 to $74,999 08 $150,000 to $199,999
03 $25,000 to $34,999 06 $75,000 to $99,999 09 $200,000 or more
10 Don't know
Please turn the page. There is space to provide comments of your choice on this last page.
1
1 1
1 1
1 1
1 1
1 1
1
1
1

B-13
Q54. What else would you like to say about Oregon Department of Transportation and the services it
provides?
Thank you for your help!
Please fold in half and return your survey in the prepaid envelope provided.

B-14
Thank you for your help!
Please return your survey in the prepaid envelope provided.