fy 2017 six plus six financial report & fy 2018 –fy 2022 five year financial forecast ·...
TRANSCRIPT

FY 2017 Six Plus Six Financial Report & FY 2018 –FY 2022 Five Year Financial Forecast
City Council “B” Session May 10, 2017

Presentation Overview Federal & State Budget Update
Five Year Forecast
FY 2017 6+6 Budget and Finance Report
Mid – Year Budget Adjustments 2

Federal Budget Blue Print March 2017
$18 Million
Annual Reduction in
Grants
$36.2 Million
HUD 108 Outstanding Loan
($4.5 M annual payment thru
2026) 3

$18 Million
in Annual Reduction
Grant ($ in Millions)
Annual Amount
City Positions
Eliminates Community Development Block Grant
$11.5 35
Eliminates HOME Investment Partnership Program 3.8 9
Eliminates Community Services Block Grant 2.0 26
Reduces Supplemental Nutrition Program for Women, Infants, and Children (WIC) by 5.9%
0.4 6
Total $17.7 76 4

CDBG/HOME Reprogramming • In light of federal cuts, Planning and Finance staff
recently finalized detailed review of entitlement funding and program Income for the past 13 years (FY2004 to FY2017)
• Reprogramming available: – $560,000 on average per year in CDBG – $143,000 on average per year in HOME
• Briefing to the Council Housing Committee scheduled on May 24
5

Women, Infants & Children (WIC) • FY 2017 WIC budget is $6.3M • Participation declined sharply
starting December 2016 • Staff adjustments
– Holding 11 vacant – Proposed reduction of 2 vacancies
• Implementing aggressive marketing plan aimed at increasing WIC participation planned for summer
6

Impact of Federal Budget Blue Print on COSA Partners
7
Support Services to Seniors
After School Programs and
Challenge
Utility Assistance for Low Income
Households

State Budget – Revenue Caps
8
8% Current Rollback
Rate
4% Initial
proposal (January 2017)
5% Senate
approval (April 2017)
3% Plus Inflation House
proposal (May 2017)

Had a revenue cap been in place during the past decade
$163 to $300
Million
$2.33 to $4.30
Dollars
Less revenue to the City over
10 years
Smaller General Fund
in FY 2017
Monthly average savings to City
average Homeowner
$43 to $58
Million
9

10
$58 Million in the General Fund pays for
Hiring 580 Police Officers
More than the Parks
Budget of $50 Million
More than the Library Budget of $40 Million

Loss of economic
activity
Potential Impact of “Bathroom Bill”
$411.9 M annually
Potential effect on Metropolitan Statistical Area as a result of less out of state travel
4,650
Jobs lost
$135 M Economic
activity from NCAA Final
Four
Potential effect on San Antonio as a result of relocation of the Final Four
11

FY 2017 Six Plus Six Financial Report

FY 2017 Total City Budget: $2.5 Billion
Restricted Funds
$824 Million General Fund
$1.14 Billion
Capital Budget
$585 Million 13

FY 2017 General Fund Budget: $1.14B
CPS Payment $342.7
30%
Property Tax $317.5
28%
Sales Tax $275.8
24%
Other Resources $207.0
18%
OTHER OPERATING DEPARTMENTS - $253 M
Human Services Library Center City Code Enforcement Animal Care Health Finance Municipal Court Economic Development City Attorney Mayor & Council Government & Public Affairs Human Resources Planning City Clerk City Manager Municipal Detention Center City Auditor Management & Budget Transfers Historic Preservation Municipal Elections Innovation Eastpoint Non-Departmental
Police* & Fire $751 M
* INCLUDES PARKS POLICE 14

General Fund FY 2017 Six Plus Six Projections
• Overall $8.2M better in general fund ending balance since FY 2016 Year End Report presentation in December 2016 – $2.9M in slightly more
revenues – $5.3M in department savings
15
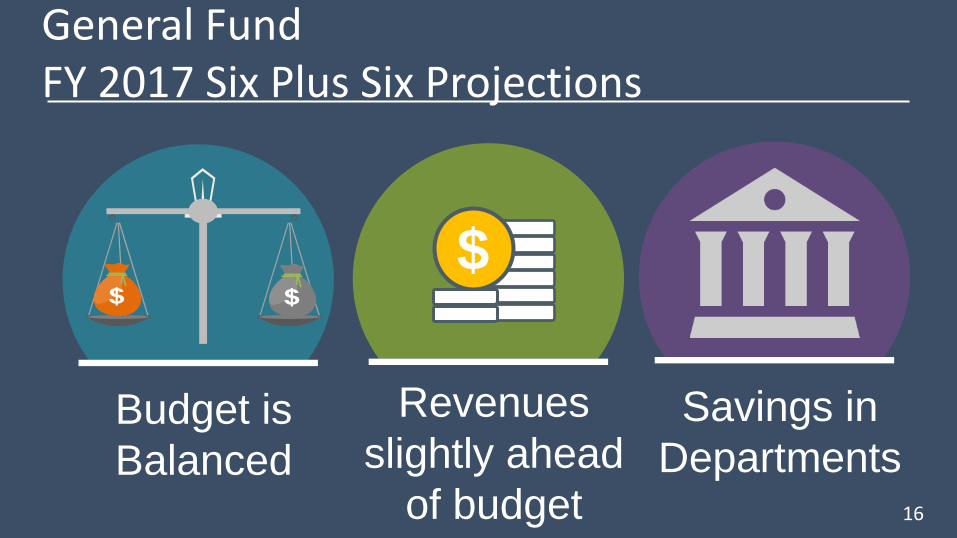
General Fund FY 2017 Six Plus Six Projections
Savings in Departments
Revenues slightly ahead
of budget
$
Budget is Balanced
16

FY 2017 General Fund Revenues
Revenue Source ($ in Millions)
FY 2017 Adopted Budget
FY 2017 6+6 Estimate Variance
Property Tax $317.5 $317.5 $0 Sales Tax 275.8 275.8 0 CPS 342.7 341.1 (1.6) Other 199.3 203.8 4.5
Total $1,135.3 $1,138.2 $2.9
$2.9 Million in projected additional revenue
17

FY 2017 General Fund Property Tax Revenue ($ in Millions)
2nd Quarter Results Budget $290.1 Actual (Oct to March) $290.1 Variance $0
Budget $317.5 Projection (Oct to Sept) $317.5
Variance $0 18
FY 2017 Estimate
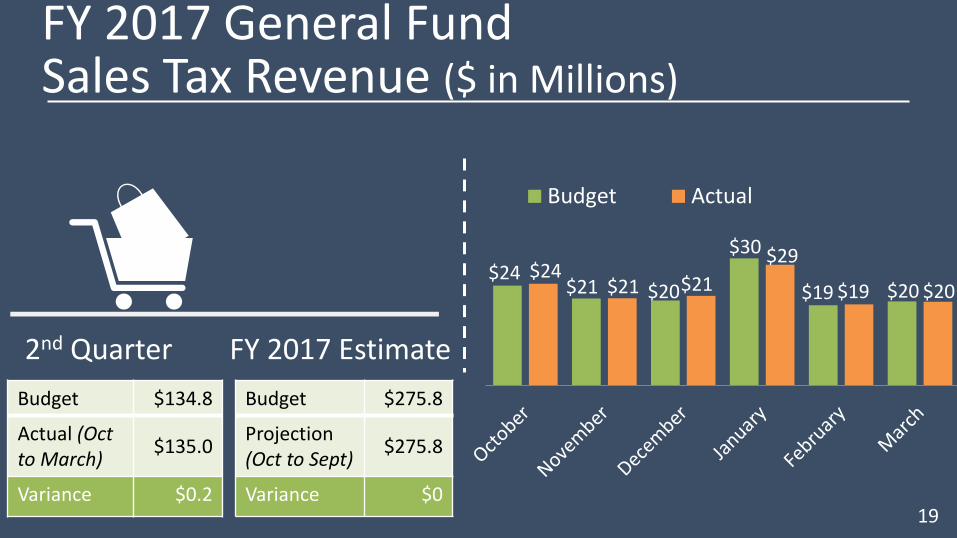
2nd Quarter FY 2017 Estimate Budget $275.8
Projection (Oct to Sept) $275.8
Variance $0
$24 $21 $20
$30
$19 $20 $24
$21 $21 $29
$19 $20
Budget Actual
Budget $134.8
Actual (Oct to March) $135.0
Variance $0.2 19
FY 2017 General Fund Sales Tax Revenue ($ in Millions)

Note 1: May receipts reflect March Sales Tax Source: Texas Comptroller of Public Accounts
City 2017 Jan to May
(% changes over 2016) Austin 4.51% Dallas 3.79% Houston -0.24% Fort Worth 7.1% San Antonio 2.57%
20
Texas Cities Sales Tax Revenues

FY 2017 General Fund CPS Revenues ($ in Millions) 2nd Quarter Results
FY 2017 Estimate
Budget $156.2
Actual (Oct to March) $154.6
Variance $(1.6)
Budget $342.7
Projection (Oct to Sept) $341.1
Variance $(1.6) 21
$26 $22 $23
$27
$35
$23 $27
$22 $23 $26
$34
$22
Budget Actuals

General Fund Expenditures FY 2017 Six Plus Six Projections
• Less Expense in Department Budgets of $5.3M or 0.5% of total General Fund – Injunction on FLSA Overtime – Less Fuel expense – Overall Departmental Expenditure Savings
22

FY 2018 to FY 2022 Five Year General Fund Forecast

What is the Financial Forecast?
Initiates Council Policy discussions for budget
Financial Forecast is not a budget
Early financial outlook for the City as the budget development process begins for FY 2018
24

General Fund Five Year Financial Forecast
• Structurally Balanced • Overall General Fund revenues
projected to increase by 3% while expenditures projected to grow by 2.7% on average every year of forecast
25

Property Tax Value Growth
Property Tax Value Growth FY 2018 FY 2019 FY 2020 FY 2021 FY 2022
Base Valuation 3.34% 2.5% 1.5% 1.5% 1.5%
New Improvements 3.04% 1.5% 1.5% 1.5% 1.5%
Total 6.38%1 4.0% 3.0% 3.0% 3.0%
Note 1: After appeals, protests, and corrections City Property Tax rate of 55.83 cents per $100 in valuation is maintained during the forecast period 26

Distribution of Property Tax Bill
• The City of San Antonio receives approximately 22% of the property tax bill
30% County,
Community Colleges,
SA River Authority, University Health
District
22% City of
San Antonio
48% K-12 Public
School Districts
27

Property Tax – Taxable Valuation % Change from Prior Year Actual
13.8%
16.2%
10.0%
0.3%
-2.4%
-0.5% 1.0%
4.5% 6.2%
12.8% 11.1%
-4%
-2%
0%
2%
4%
6%
8%
10%
12%
14%
16%
18%
20%
2007 2008 2009 2010 2011 2012 2013 2014 2015 2016 2017Est.
City’s Property Tax Rate has not been increased in the last 24 years, it has been decreased 4 times since 2007 28
Property Tax Valuation Projections
FY 2018 6.4%
FY 2019 4.0%
FY 2020 3.0%
FY 2021 3.0%
FY 2022 3.0%
10 Year Property Tax – Taxable Valuation History

Sales Tax % Change from Prior Year’s Actual Collections
The Five Year Forecast projects a 3.5% average annual growth in sales tax revenue
6.7%
3.5%
-4.5%
0.7%
6.1%
9.7%
5.2%
7.3%
4.5%
3.3%
3.8%
-5%
-3%
-1%
1%
3%
5%
7%
9%
11%
2007 2008 2009 2010 2011 2012 2013 2014 2015 2016 2017Est.
Sales Tax Projections
FY 2018 3.5%
FY 2019 3.5%
FY 2020 3.5%
FY 2021 3.5%
FY 2022 3.5%
10 Year Sales Tax History
29

CPS Payment to City % Change from Prior Year’s Actual Collections
5.0%
18.2%
-9.6%
6.8% 5.0%
-3.2%
2.0%
13.1%
0.0% 2.8%
-10%
-5%
0%
5%
10%
15%
20%
25%
2007 2008 2009 2010 2011 2012 2013 2014 2015 2016 2017 Est.
30
10 Year CPS Payment History
CPS Payment Projections
FY 2018 3.3%
FY 2019 3.0%
FY 2020 3.0%
FY 2021 2.5%
FY 2022 2.5%

General Fund Assumptions
31
Maintains current level of service Maintains General Fund Ending Balance at a minimum of 15% Structurally Balanced – Revenues sufficient to cover Expenditures Includes Operations and Maintenance Costs for FY 2017 Bond Program Continues 3-Year implementation of SA Tomorrow

General Fund Assumptions
32
Includes required increase in City contribution to Fire and Police Pre-Fund Retiree Healthcare Fund
Reflects new Collective Bargaining Agreement with Police and Evergreen for Fire
Includes Step Pay Plan and Performance Pay for Civilian & Maintains Civilian Entry Wage at $13.75 Includes Revenues and Expenses associated with the I-10 West Full Purpose Annexation

General Fund - 5-Year Forecast ($ in Millions)
a) Includes Use of Reserves from Prior Fiscal Year b) Includes Set Aside of Reserves for Following Fiscal Year 33
• Forecast structurally Balanced before policy issues
Projected Resources a $1,246.3 $1,273.4 $1,305.1 $1,349.4 $1,386.8
Projected Expenses b 1,231.3 1,264.8 1,304.8 1,343.7 1,375.1
Available for Policy Issues $15.0 $8.6 $0.3 $5.7 $11.7
FY 2018 FY 2019 FY 2020 FY 2021 FY 2022
• Policy Issues in total exceed available balance Maintain Streets at $64 M 10.0 14.1 14.1 14.1 14.1
Police - 25 New Officers/Year 1.7 3.8 6.6 9.8 13.1
Fire - 1 EMS Unit, 3 Ladders & 57 New Firefighters 3.3 4.6 6.4 9.2 10.3
Total Policy Issues $15.0 $22.5 $27.1 $33.1 $37.5

FY 2018 to FY 2022 Five Year Forecast – Development Services

FY 2017 Development Services Fund Revenues 2nd Quarter Financial Results
$15.5 M Actual
$15.7 M Budget
$240,000 Below Budget
2nd Quarter
$32.7 M Estimate
$32.7 M Budget
$10,000 Above Budget
FY 2017 Estimate
35

FY 2017 Development Services Fund Expenditures 2nd Quarter Financial Results
$14.3 M Actual
$14.9 M Budget
$570,000 Below Budget
2nd Quarter
$31.2 M Estimate
$31.9 M Budget
$680,000 Below Budget
FY 2017 Estimate
36

Development Services Fund ($ in Millions) Residential Permit Valuation
37
$0
$100
$200
$300
$400
$500
FY 2008 FY 2009 FY 2010 FY 2011 FY 2012 FY 2013 FY 2014 FY 2015 FY 2016 FY 20176+6
$435 $339 $312 $258 $317 $353 $386 $411 $430 $475
ResidentialResidential permit valuation are back to pre-recession levels

Development Services Fund ($ in Millions) Commercial Permit Valuation
38
$0
$500
$1,000
$1,500
$2,000
$2,500
$3,000
FY 2008 FY 2009 FY 2010 FY 2011 FY 2012 FY 2013 FY 2014 FY 2015 FY 2016 FY 20176+6
$2,612
$1,785 $1,240 $1,440
$1,901 $1,892
$2,655 $2,334 $2,370
$2,665

Development Services Fund 5-Year Forecast ($ in Millions)
$33.6 $34.4 $35.7 $35.3 $36.1
$35.4 $36.1 $36.4 $36.2 $36.9
$0.0$5.0
$10.0$15.0$20.0$25.0$30.0$35.0$40.0
FY 2018 FY 2019 FY 2020 FY 2021 FY 2022
Surplus $1.8 $1.7 $0.7 $0.9 $0.8
Revenues (Includes Fund Balance)
Expenditures (Includes amount added to Financial Reserves)
39

FY 2018 to FY 2022 Five Year Forecast – Hotel Occupancy Tax

Hotel Occupancy Tax Rate Adopted FY 2017 Hotel Occupancy Tax
(HOT) Rate (16.75%)
State 6%
County 1.75%
City 7%
Convention Center
2%
* Department supported by Alamodome and Convention Center Revenues
Adopted Allocation of City’s 7% of HOT Rate
Arts 15%
VisitSA 35%
Convention Facilities*
35%
History & Preservation
15%
41

Hotel Occupancy Tax Fund Revenues
2nd Quarter Results FY 2017 Estimate
Budget Actuals Variance
$31.5 $32.2 $0.7
Budget Estimate Variance
$65.7 $66.4 $0.7
42
($ in Millions)

Hotel Occupancy Tax Fund Expenses
Departments supported by HOT tax within Budget
$42.8 Million 43 $22.8 Million $10.3 Million

Hotel Occupancy Tax 5-Year Forecast ($ in Millions)
$69.1 $71.0 $73.5 $76.0 $78.7
$69.1 $71.0 $73.5 $76.0 $78.7
$0.0$10.0$20.0$30.0$40.0$50.0$60.0$70.0$80.0
FY 2018 FY 2019 FY 2020 FY 2021 FY 2022
Surplus $0.0 $0.0 $0.0 $0.0 $0.0
HOT & Miscellaneous Revenues
Expenditures
44

FY 2018 to FY 2022 Five Year Forecast – Solid Waste

2nd Quarter
$53.6M Actual
$52.5M Budget
$1.1 Million Ahead of Budget
FY 2017 Estimate
$106.8M Estimate
$104.9M Budget
$1.9 Million Ahead of Budget
FY 2017 Solid Waste Fund Revenues 2nd Quarter Financial Results
46

2nd Quarter
$55.6M Actual
$55.6M Budget
$31,000 Less Spending
FY 2017 Estimate
$113.2M Estimate
$113.3M Budget
$63,000 Less Spending
FY 2017 Solid Waste Fund Expenditures 2nd Quarter Financial Results
47

Solid Waste Forecast Assumptions
48
Organics Recycling Garbage
April 2017 – Pay as You Throw fully Implemented
Includes resources to reduce Contamination through inspections, Education and Marketing Adds crews and equipment
to address increased participation in organics program

49
Solid Waste Monthly Rate 2017 Current
2018 Projected
2019 Projected
2020 Projected
2021 Projected
2022 Projected
$20.43
$19.93
$19.43
$18.93
$18.43
$17.93
$20.93
$21.93
$21.93
$21.93
$21.93
$21.93
$22.18 $25.43 $28.68 $31.93 $35.18 $38.43
48 Gallons
64 Gallons
96 Gallons

Solid Waste Fund 5-Year Forecast ($ in Millions)
$123.3 $126.6 $126.3 $130.4 $129.3
$124.6 $128.5 $133.4 $138.1 $132.8
$0
$40
$80
$120
$160
FY 2018 FY 2019 FY 2020 FY 2021 FY 2022
Surplus $1.3 $1.9 $7.1 $7.7 $3.5
Revenues (Includes Beginning Balance)
Expenditures
50

FY 2017 Mid Year Budget Adjustments

General Fund Reallocation of $1M COPS Hiring Grant Match
$700,000 for 15 new Police
Officers
$300,000 Cure Violence Program
52

General Fund Legal Services for Low-Income Residents - $150,000
• Services for veterans, landlord-tenant, ID recovery for Haven for Hope community, immigration, and simple wills
• Partnership with St. Mary’s University recommended
• Alternative is to release a Request for Proposal (RFP)
53

Legal Services for Low-Income San Antonio Residents • Grant-match opportunity for Immigrant legal services from
VERA Institute of Justice • Keeps families together by assisting immigrants • Requires a letter of interest by this week • VERA will invite cities to apply in early May. If COSA is
invited to apply, application will be brought to City Council for approval
• Funds will be awarded by VERA before September 2017
54

General Fund Augment Ambassador Program - $30,000
• Current program of $400,000 supports 120 participants city-wide
• Amendment would double CD2 participants from 10 to 20 55

Convention, Sports Facilities Fund Alamodome Improvements - $3.9 Million
• Adjustment funded with better than projected Alamodome and Convention Revenues
• Smoke Control Testing and general improvements $633K
• Contractual event staffing $278K • Audio System, Video Scoreboards and Wi-Fi
– Estimated project cost $9 million; City would invest $3M and will seek partnerships for the balance
56

Hotel Occupancy Tax Fund Tricentennial -$100,000
New Year’s Event Support $50,000
57
Fundraising & Marketing Support $50,000

Capital Budget • Budget approved $1 Million contribution to
Child Safe headquarters contingent upon Bexar County Contribution
• CD2 requests removal of condition
58

Next Steps in FY 2018 Budget Process
Community Input for Budget
May
City Council Policy
Direction for Budget
June 28
Proposed Budget
August 10
City Council Budget Work
Sessions & Community Input
Aug. to
Sept.
Budget Adoption
Sept. 14
59

Conclusion • Uncertainty in Federal Budget and potential grant
eliminations/reductions
• State revenue caps that would significantly impact the growing needs of the community
• Today, General Fund financial position is slightly better than at budget adoption; recommend reserving better ending balance for FY 2018 Budget
60

FY 2017 Six Plus Six Financial Report & FY 2018 –FY 2022 Five Year Financial Forecast
City Council “B” Session May 10, 2017