fy 2017 budget in brief
TRANSCRIPT

FY 2017
DEPARTMENT OF LABOR
BUDGET IN BRIEF

This page is intentionally left blank.

i
Table of Contents
Budget Summary ............................................................................................................................ 1
Employment and Training Administration ..................................................................................... 8 Overview ..................................................................................................................................... 8
Training and Employment Services ................................................................................................ 9 Adult Employment and Training Activities ................................................................................ 9 Youth Activities ........................................................................................................................ 10 Dislocated Worker Employment and Training Activities ........................................................ 10 Indian and Native American Programs ..................................................................................... 11 Migrant and Seasonal Farmworkers ......................................................................................... 11 Technical Assistance ................................................................................................................. 11 Reintegration of Ex-Offenders .................................................................................................. 12 Apprenticeship Grants .............................................................................................................. 12 Workforce Data Quality Initiative ............................................................................................ 12 YouthBuild ................................................................................................................................ 13 Women in Apprenticeship ........................................................................................................ 13 Job Training for Employment in High Growth Industries ........................................................ 14
Job Corps ...................................................................................................................................... 15
Community Service Employment For Older Americans .............................................................. 17
Federal Unemployment Benefits and Allowances ........................................................................ 18
State Unemployment Insurance and Employment Service Operations ........................................ 19 Unemployment Insurance ......................................................................................................... 19 Employment Service ................................................................................................................. 21 Foreign Labor Certification ...................................................................................................... 22 Workforce Information-Electronic Tools-System Building ..................................................... 22
Job Driven Training Proposals...................................................................................................... 24
Advances to the Unemployment Trust fund ................................................................................. 27
Program Administration................................................................................................................ 28
Paid Leave Partnership Initiative .................................................................................................. 30
Employee Benefits Security Administration ................................................................................ 31
Pension Benefit Guaranty Corporation ......................................................................................... 33
Wage and Hour Division .............................................................................................................. 35
Office of Federal Contract Compliance Programs........................................................................ 37
Office of Labor-Management Standards ...................................................................................... 38

ii
Office of Workers' Compensation Programs ................................................................................ 39
Occupational Safety and Health Administration .......................................................................... 42
Mine Safety and Health Administration ....................................................................................... 44
Bureau of Labor Statistics ............................................................................................................. 46
Office of Disability Employment Policy ...................................................................................... 47
Departmental Management ........................................................................................................... 48
DOL IT Modernization ................................................................................................................. 52
Veterans' Employment and Training Service ............................................................................... 53
Office of the Inspector General ..................................................................................................... 55
Working Capital Fund................................................................................................................... 56
Appendices .................................................................................................................................... 57 Summary of Discretionary Funds, FY 2008-2017 .................................................................... 57 All Purpose Table ..................................................................................................................... 58 Full Time Equivalent Table ...................................................................................................... 67

1
Budget Summary The FY 2017 request for the Department of Labor (DOL) is $12.8 billion in discretionary authority, coupled with mandatory funding, and 17,663 full-time equivalent employees (FTE). The FY 2017 Budget reflects our optimism about the future. It builds on seven years of investments in job creation, economic growth, and the strengthening of the middle class. In this time of change, the President envisions a future of greater opportunity for all – one where the zip code where someone is born does not dictate his or her job prospects or lifetime earnings; one where a full-time job pays a living wage; one where we expand retirement security options for all workers; and one where job security also means that the workplace is safe from workplace hazards and retaliation for exercising one’s rights. Our Budget supports this future. Training Workers for the Jobs of the Future One of the nation’s greatest assets is a skilled, educated, and adaptable workforce. The creation of 14 million new jobs and the longest streak of private sector job creation in history is a testament to this fact. In today’s economy, employers are looking for an educated and nimble workforce. They want workers trained for the jobs that are available with the skills that can help both workers and businesses succeed. As noted in the Vice President’s Ready to Work report, the Administration needs to help employers and educators create more pathways to middle class jobs – particularly for those who have been out of the workforce, dislocated workers, at-risk youth, and veterans. In 2014, Congress demonstrated a commitment to these ideals with the bipartisan passage of the Workforce Innovation and Opportunity Act (WIOA), which improves the nation’s job training system by emphasizing career pathways, improving performance measurement and evaluation of program outcomes, empowering job seekers with valuable information about their training options, and directing more resources to out-of-school youth. The Budget builds on the work accomplished to date by training and connecting workers to jobs that are currently available and ensuring that employers can find the talent they need to grow.
• The Budget fulfills the promise of WIOA by providing the full WIOA-authorized funding levels for the core formula grants to states and localities to provide training and employment services—a $138 million increase over 2016. The Budget’s WIOA funding will support more than 20 million Americans served by the over 2,500 American Job Centers across the country. The request also enables the Department to continue the measurement, evaluation, and continuous program improvement envisioned in the law. The Budget further supports states’ program management and evaluation activities with a discretionary request of $40 million to build capacity to track employment and educational outcomes of WIOA program participants.
• The Budget’s $1.75 billion request for Job Corps continues the Administration’s commitment to strengthening and reforming the Job Corps program. The request includes resources to create a safer learning environment, test new variations on the Job Corps model, and strengthen oversight of the program. The Budget also announces the initiation of an external review of the Job Corps program, with the goal of building a strong
2
foundation of ideas to help the program to help young people prepare for the jobs of the 21st century.
• To help meet the employment needs of veterans, the Department’s request for the Veterans’ Employment and Training Service (VETS) is $286 million. VETS prepares transitioning service members and military spouses for civilian employment and protects service members and veterans’ rights to employment and reemployment. This request includes an additional $12 million over current funding levels for the Homeless Veterans’ Reintegration Program to bring the program to its full authorized level.
• Too often, workers — including returning veterans and their spouses — face unnecessary licensing barriers for jobs in which they already have the required training and experience. The Budget builds on the resources provided in the FY 2016 Omnibus for states to identify and address areas where occupational licensing requirements create an unnecessary barrier to labor market entry or mobility and where interstate portability of licenses can improve economic opportunity.
• The President has committed to doubling the number of apprentices nationwide to give more workers the opportunity to develop job-relevant skills while earning a paycheck. On average, apprentices earn $50,000 a year after graduating while employers create a pipeline of qualified workers. The Budget invests in this proven strategy, providing $90 million for a second year of support for the state, local, and industry recipients of the new ApprenticeshipUSA grants — first funded in FY 2016 — and proposes a $2 billion mandatory Apprenticeship Training Fund to double the number of apprentices nationwide. Of the $2 billion, $1.3 billion would be used to support state-led strategies to increase employer take-up of the model, $500 million would be dedicated to an innovation fund that rewards local and national partnerships that expand access to apprenticeships, and $200 million would support the development and expansion of youth apprenticeships and pre-apprenticeship programs.
• A key to successful job training is ensuring that employers and training providers – including the nation’s community and technical colleges – work together so that students learn the skills needed for jobs and careers that are available in their communities. The Budget puts forward a substantial investment in this high-quality training, investing $3.0 billion in mandatory funding for training efforts that feature strong industry partnerships and focus on in-demand sectors.
• Approximately 6 million Americans between the ages of 16 and 24 are out of school and not working, a tremendous untapped resource. Most of these youth are from low-income families, and have little access to the networks and guidance needed to connect to the workforce. The Budget invests $3.5 billion in mandatory funding over four years to provide these youth with the valuable experience of a paid job. Of this total, $1.5 billion would support summer job opportunities linked to career information and training opportunities and $2.0 billion would provide year-long first jobs to 150,000 “Opportunity Youth” (youth who are out of school and out of work). The Budget further proposes an additional $2.0 billion in mandatory funding over four years to transform communities

3
struggling with high rates of youth disengagement, high school dropouts, and unemployment into places of opportunity for young adults. The program will provide funds to local governments to locate and reengage youth, and connect them with the counseling, support services, employment opportunities, and education they need to succeed.
Bolstering Economic Security for Workers Despite widespread economic growth, a number of people have been left on the sidelines of the recovery. The Administration proposes to update the services available so that workers can manage the loss of a job, learn about which training options would bear the most fruit, and secure a new job that pays a living wage. These proposals will modernize the unemployment insurance system, reconnect workers to jobs, support working families, and expand access to retirement savings options.
• Reemployment Services. The Budget provides $186 million for Reemployment Services and Eligibility Assessments—in person assistance to help workers find jobs paired with assessments to ensure claimants are still eligible for benefits. In 2017, the Budget provides sufficient funding for all veterans receiving unemployment compensation and approximately the one-third of benefit claimants who are most likely to exhaust their benefits to be provided these services. In 2018 and beyond, the Budget proposes mandatory funding sufficient to continue to serve these workers. Evidence suggests these services are a cost-effective strategy that gets workers back into jobs faster with higher wages.
• Career Navigators. To assist American workers with navigating the daunting and
difficult job search process, the Budget proposes to use $1.5 billion in mandatory funds to launch a network of Career Navigators, who will reach out and provide help in finding a job to those who are long-term unemployed, only able to find part-time work, or who have dropped out of the labor force entirely.
• Unemployment Insurance Reforms. Because the current Unemployment Insurance (UI) program does not reflect the modern economy or workforce – and provides benefits for fewer than one-third of unemployed Americans today - the Budget proposes a cost-neutral suite of reforms to modernize and strengthen the program. These reforms would ensure that more low-income and part-time workers as well as workers who must leave work for compelling family reasons would qualify for UI benefits; strengthen the program’s connections to work and help jobless workers reconnect to jobs; provide wage insurance to protect experienced workers if they have to take a pay cut when starting a new job; and make the UI program more responsive to economic downturns. At the same time, the Budget puts in place important improvements to improve the solvency of State programs.
• Paid Leave. Too often, American workers have to make the painful choice between caring for family members they love and earning the paycheck they desperately need.

4
The Family and Medical Leave Act allows many workers to take job-protected unpaid time off to care for a new baby or sick family member, or tend to their own health during a serious illness. But millions of families cannot afford to use unpaid leave. The United States is the only industrialized country in the world that fails to offer all workers paid maternity leave. The Budget includes $2 billion for the Paid Leave Partnership Initiative to assist up to five states to launch paid leave programs, following the example of California, New Jersey, and Rhode Island. States that choose to participate in the Initiative would be eligible to receive funds for the initial set up and three years of benefits.
• Retirement Savings. Many workers, particularly those without employer-based retirement plans, struggle saving money for retirement. The Department has proposed regulations and guidance to facilitate the creation of state retirement savings programs. To further states’ efforts, the Budget sets aside $6.5 million to allow a few states to pilot and evaluate state-based 401(k)-type programs or automatic enrollment in individual retirement accounts. The Budget further proposes $100 million in mandatory funding to allow states and nonprofits to design, implement, and evaluate new approaches to expand retirement and other employer-provided benefit coverage, with a focus on developing models that are portable across employers and can accommodate contributions from multiple employers for an individual worker.
• Workforce Data Science and Innovation Fund. To jumpstart efforts to improve the data around the best training programs and the labor market trends for jobs and skills, the Budget calls on Congress to use $500 million in mandatory funds to create a Workforce Data Science and Innovation Fund. By creating new data standards, analytical datasets, and open data products, the government will be creating a resource for researchers, developers, and entrepreneurs to develop applications and services to support the American workers.
Protecting Wages, Workplace Safety, and Retirement Security The Department’s worker protection agencies build a shared prosperity for a stronger America by leveling the playing field, so that employers who follow the rules are not at a competitive disadvantage when compared to those who cut corners to the detriment of their workers. The Administration continues to pursue a combination of strategies to strengthen worker protection laws and their enforcement, so workers can earn family-sustaining wages, be protected from discrimination, and return home safely at the end of a day’s work.
• The Budget provides $277 million for the Wage and Hour Division (WHD) to enforce laws that establish the minimum standards for wages and working conditions in many of the workplaces in the United States, particularly in industries where workers are most at risk. The Budget also expands funding for efforts to ensure that workers receive back wages they are owed and cracks down on the illegal misclassification of some employees as independent contractors, a practice that deprives workers of basic protections like UI, workers’ compensation, and overtime pay.

5
• The FY 2017 Budget enhances worker safety and whistleblower protections to make sure
workers are kept safe on the job and are not retaliated against for reporting unsafe and unscrupulous practices. In particular, the Budget provides $595 million for the Occupational Safety and Health Administration (OSHA), including additional funding to improve safety and security at chemical facilities and heighten response procedures when major incidents at these sites occur. The Budget requests $143 million for compliance assistance activities, an increase of $6 million over 2016. The Budget also requests a $4 million increase to bolster OSHA’s ability to enforce the more than 20 whistleblower laws that protect workers from discrimination when they report unlawful practices.
• Workers in the mining industry rely on the Mine Safety and Health Administration (MSHA) to meet its statutory obligation to inspect every mine and to put strategies in place to address the risks posed to miners by the nation’s most dangerous mines. The budget invests $397 million in MSHA, a $21 million increase, including funds to fully operationalize the Final Rule on respirable coal dust exposure, upgrade technology, and strengthen the agency’s targeted enforcement activities.
• The Budget provides $101 million for ILAB, a $15 million increase over 2016, to enable the agency to promote workers’ rights abroad and monitor, enforce, and assist countries in meeting their commitments under labor provisions of free trade agreements and trade preference programs, as well as fund efforts to prevent child labor, forced labor, and human trafficking. These funds will substantially increase ILAB’s technical assistance to countries on workers’ rights issues and double the number of staff responsible for monitoring and enforcement.
• The Administration supports raising the minimum wage so hard-working Americans can earn enough to support their families and make ends meet. We are encouraged that 17 states and the District of Columbia have passed increases in their minimum wage since the President called for a minimum wage increase during his State of the Union remarks in February 2013. Those increases are benefiting millions of workers. The Department is eager to work with the Congress to pass legislation to increase the minimum wage for the rest of the workforce as soon as possible.
• To protect workers’ retirement security, the Pension Benefit Guaranty Corporation (PBGC) acts as a backstop to insure pension payments for workers whose companies or plans have failed. PBGC’s single employer program covers plans that are sponsored by an individual company; the multiemployer program covers plans set up by collectively bargained agreements involving more than one unrelated employer. Both programs are underfunded, with combined liabilities exceeding assets by $76 billion at the end of 2015. While the single-employer program’s financial position is projected to improve over the next 10 years, the multiemployer plan is projected to run out of funds in 2024. The Budget proposes to give the PBGC Board the authority to adjust premiums, and directs the Board to raise $15 billion in additional premium revenue within the Budget window only from the multiemployer program. This level of multiemployer premium revenue

6
would nearly eliminate the risk of the multiemployer program becoming insolvent within 20 years.
Modernizing the Department of Labor The Budget includes $63 million to modernize and transform the Department’s aging IT infrastructure. These investments are vital to the Department’s efforts to improve data sharing and mobile computing for DOL employees, allowing the Department to provide better, faster, smarter service to the American public and ensure the security of its systems.

7
FY 2017 DOL Request (Budget Authority in Billions)
FY 2016 FY 2017 Change Revised Enacted Request
Discretionary: $12.2 $12.8 $0.6
Mandatory: $33.5 $33.1 -$0.4
Total, Current Law $45.7 $45.9 $0.2 Legislative Proposals,
Mandatory: $0 $17.6 $17.6
Total with Leg. Props. $45.7 $63.5 $17.8
Full Time Equivalents (FTE) 16,884 17,663 779
NOTE: The FY 2016 Revised Enacted reflects sequestration reductions for mandatory programs.

8
EMPLOYMENT AND TRAINING ADMINISTRATION The Employment and Training Administration (ETA) provides high-quality employment assistance, labor market information, job training, and income support through the administration of the following programs: adult, dislocated worker, youth, and other targeted programs; Trade Adjustment Assistance (TAA); Employment Services; UI; Foreign Labor Certification (FLC) activities; Apprenticeship programs; the Office of Job Corps; YouthBuild; the Indian and Native American training program; the Migrant and Seasonal Farmworker program; the Workforce Data Quality Initiative; the Reintegration of Ex-Offenders program; and the Senior Community Service Employment Program. The American economy is growing again and our competitive edge is sharper than ever, creating new opportunities for those with skills to not only find jobs, but to launch new careers. The United States has experienced years of net private sector job growth, the longest streak on record. The unemployment rate is the lowest level in more than five years, signaling a turn for the economy from the Great Recession. While these improvements are encouraging, many Americans have still not fully shared in the economic recovery. More needs to be done to help those still out of work find jobs, boost wage growth, and address longer-standing challenges around both the quality of jobs and the growth of wages. Far too many hard-working individuals still have not been able to find a job or increase their earnings, and many businesses report difficulty hiring workers with the right skills for jobs that they want to fill. The long-term unemployed make up about a quarter of all the unemployed. There are millions of workers who are still just marginally attached to the labor force. There are thousands of workers who have even given up searching for employment, believing they cannot find a job. For this reason, the Administration remains focused on doing everything possible to strengthen the labor market and create good-paying jobs. ETA is taking the necessary steps to ensure that its programs reflect a job-driven approach for training and employment services, and that they are successful in getting job seekers into good jobs and careers as quickly as possible. A job-driven public workforce system contributes to a strong, growing economy by responding to the workforce needs of regional and local businesses and other employers to ensure positive employment outcomes for job seekers, a solid bottom line for business, and more productive and resilient regional economies. The ETA budget includes requests that transform the nation’s Registered Apprenticeship program; break down barriers to accessing job-driven training opportunities; make available more transparent, better workforce data; reengage disconnected youth; and expand the capacity and infrastructure of the workforce system.

9
TRAINING AND EMPLOYMENT SERVICES
2015
Enacted 2016
Enacted 2017
Request Adult Employment and Training Activities 776,736 815,556 842,376 Youth Activities 831,842 873,416 902,139 Dislocated Workers Employment and Training Activities 1,236,389 1,241,719 1,334,205
Formula Grants 1,015,530 1,020,860 1,103,346 National Dislocated Worker Grants 220,859 220,859 230,859
Indian and Native American Programs 46,082 50,000 52,000 Migrant and Seasonal Farmworkers 81,896 81,896 81,896 Technical Assistance 0 3,232 3,232 Reintegration of Ex-Offenders 82,078 88,078 95,078 Apprenticeship Grants 0 90,000 90,000 Workforce Data Quality Initiative 4,000 6,000 40,000 Youthbuild 79,689 84,534 84,534 Women in Apprenticeship 994 994 0
Total Budget Authority 3,139,706 3,335,425 3,525,460 The Training and Employment Services (TES) appropriation funds a system of education, skills training, and employment services directed toward increasing the post-program employment and earnings of current and future workers, particularly low-income persons, dislocated workers, and at-risk and out-of-school youth. The majority of the activities are authorized by the Workforce Innovation and Opportunity Act of 2014 (WIOA). Beginning in PY 2016, performance measures in WIOA-authorized programs will be aligned with the measures required by WIOA. The Department will be issuing guidance to assist states with this transition and ensure continuation of services in a manner that supports positive employment outcomes for participants.
Adult Employment and Training Activities The WIOA Adult program provides employment and training services for disadvantaged, low-skilled, unemployed, and underemployed adults and is a core program under the Act. The program helps prepare lower-skilled adult workers for good jobs through formula grants to

10
states. Services are primarily delivered through a network of nearly 2,500 American Job Centers across the United States.
The Department is requesting $842,376,000 in FY 2017, a $26,820,000 increase over the FY 2016 enacted level. The Budget funds these grants at their full authorized level and maintains the Governor’s Reserve at 15 percent. These additional resources will increase local areas’ training and employment services.
Youth Activities
Under Title I of the WIOA, Youth Activities funds are allotted by formula to states that, in turn, allocate funds to local areas to deliver a comprehensive array of youth workforce investment activities. These activities help ensure that young people obtain skills and education to succeed in a knowledge-based economy, including growing and emerging industry sectors, such as health care and IT. WIOA authorizes services to low-income youth ages 14 through 21 for in-school youth and ages 16 to 24 for out-of-school youth with barriers to employment. While the program serves both in-school and out-of-school youth, WIOA requires that 75% of funds be used to serve out-of-school youth, in order to focus resources on youth facing the greatest challenges in gaining skills and good employment. The FY 2017 Budget requests $902,139,000 for WIOA Youth activities, a $28,723,000 increase compared to the FY 2016 enacted level. The Budget funds these grants at their full authorized level and maintains the Governor’s Reserve at 15 percent. These additional resources will increase local areas’ training and employment services.
Dislocated Worker Employment and Training Activities The WIOA Dislocated Worker (DW) program serves as the primary vehicle to help workers who have lost their jobs gain new skills and find meaningful jobs in sectors that are projected to grow. The DW program provides an array of employment, supportive, and training services to recently separated veterans; formerly self-employed individuals; and displaced homemakers who have been dependent on the income of another family member, but are no longer supported by that income. Additionally, a portion of DW program funds are set aside to the National Reserve, which funds National Dislocated Worker Grants, demonstrations, technical assistance and training activities, and DW programs in the United States’ outlying areas. The FY 2017 Budget requests $1,334,205,000 for DW activities, an increase of $92,486,000 from the FY 2016 appropriation. Of the requested amount, $1,103,346,000 will be directed by formula to states to provide reemployment assistance. The Budget funds these grants at their full authorized level and maintains the Governor’s Reserve at 15 percent. The FY 2017 Budget request also includes $230,859,000 in the National Reserve Account, which is an increase of $10,000,000 above the PY 2016 appropriation. As part of the National Reserve, $20,000,000 of the requested amount will be provided as grants to support workers dislocated from the coal economy.

11
Indian and Native American Programs The Indian and Native American (INA) program is designed to help American Indian, Alaska Native, and Native Hawaiian individuals obtain good jobs and stay employed through the provision of employment, education, training and supportive services necessary for them to succeed in the labor market. To meet the employment and training needs of the American Indian, Alaskan Native, and Native Hawaiian population in FY 2017, the Department requests $52,000,000, an increase of $2,000,000 above the FY 2016 enacted level. This increase will be used to launch a pilot program to serve youth who do not live on reservations. Lessons learned from this pilot will be shared across the government to improve services for Native American youth. In FY 2017, the Department is proposing to change the period of availability from July 1, 2017 – June 30, 2018 to April 1, 2017 to June 30, 2018. The current obligation period that starts on July 1 coincides with the beginning of the grantees’ performance period for these programs, which means that grantees often experience a delay before the grants can be funded. Migrant and Seasonal Farmworkers The National Farmworker Jobs Program (NFJP) provides job training and employment assistance for migrant and seasonal farmworkers and their dependents to address the chronic unemployment and underemployment they face and help them prepare for jobs that provide stable, year-round employment both within and outside agriculture. Services include classroom and on-the-job training, as well as some supportive services such as nutrition, health, child care and temporary shelter. The request for NFJP for FY 2017 is $81,896,000, which will serve approximately 20,600 participants with core, intensive, training, and related assistance services. In FY 2017, the Department is proposing to change the period of availability from July 1, 2017 – June 30, 2018 to April 1, 2017 to June 30, 2018. The current obligation period that starts on July 1 coincides with the beginning of the grantees’ performance period for these programs, which means that grantees often experience a delay before the grants can be funded.
Technical Assistance
WIOA specifically authorized separate funding for a Technical Assistance activity, which is an essential element of grant management and continuous improvement of the public workforce system. The Department is requesting $3,232,000 in FY 2017, the same level that was appropriated FY 2016, which will allow it to be responsive to the needs of the workforce system and assist states and localities in the third year of WIOA enactment.
12
Reintegration of Ex-Offenders The Reintegration of Ex-Offenders (RExO) program promotes and protects opportunity by preparing adult and youth ex-offenders for the job market. The RExO program helps adult and juvenile ex-offenders obtain training and employment in industries and occupations that offer good wages and opportunities for advancement. RExO participants receive comprehensive career assistance and supportive services to ensure they can complete education and training programs that they have started. RExO programs promote a seamless progression along career pathways that combine education and training and result in participant progress and long-term success. The Department requests $95,078,000 in FY 2017, which is an increase of $7,000,000 over the FY 2016 appropriation, to fund RExO projects that serve adult and juvenile offenders, particularly in areas that were affected by recent and significant unrest. Apprenticeship Grants The FY 2016 appropriation provided $90,000,000 for ApprenticeshipUSA grants, the first-ever funding provided by Congress and directed specifically to support wide-scale apprenticeship expansion across the United States. Funding will be used to support innovative, job-driven approaches that result in the growth of Registered Apprenticeship programs to train workers with 21st century skills that meet employer and industry workforce needs. In FY 2017, the Department requests $90,000,000 for ApprenticeshipUSA grants, which will continue the FY 2016 funding levels for the program and support grant recipients in a second year of their work to expand apprenticeships. This request will include $45,000,000 for Apprenticeship State Funds to both federally administered and DOL-recognized SAAs, $22,500,000 for Apprenticeship Industry and Workforce Intermediary Funding, $13,500,000 in funding for Community-Based Organization and Workforce Intermediary Funding, and $9,000,000 for National Activities that include promotion, outreach, technical assistance, electronic tools and research. At these funding levels, it is estimated that 36,000 new apprentices will be supported by this program. In addition, it is expected that ETA’s promotion and technical assistance activities, which are supported by this program and the Office of Apprenticeship, will expand the adoption of the apprenticeship model beyond what is directly supported by these grants.
Workforce Data Quality Initiative
The Workforce Data Quality Initiative provides competitive grants to states to support the development and enhancement of longitudinal data systems that integrate education and workforce data.
The Department of Labor collaborates with the Department of Education, which has provided state grants since 2005 to assist with longitudinal educational data system development. Grants will help states to incorporate workforce information into their longitudinal data systems,

13
integrate data across WIOA programs and improve the quality and accessibility of performance data reported by training providers. Improving information available from training providers is crucial to helping consumers make informed decisions when choosing among training programs. In FY 2017, the Department is requesting $40,000,000, which is a $34,000,000 increase over the FY 2016 enacted level. Of the total funding, $33,000,000 will help states build integrated or bridged data systems to facilitate WIOA implementation, including building state-based wage data matching infrastructure to improve performance reporting for the workforce system, including training providers. To make the most efficient use of these funds, the Department will explore strategies that allow multiple states to build and use common systems solutions. To streamline states’ ability to access wage data for WIOA participants who cross state lines, the Budget includes $1,000,000 to improve the facilitated support for two systems that states use to access wage data housed in another state: the Wage Record Interchange System and the Common Reporting Information System. The Department intends to fund a single entity to receive and coordinate responses to state wage data access requests, which should make it easier for states to request wage data and help reduce the burden on UI agencies in responding to data requests. Finally, the request includes $6,000,000 to help high-achieving states fully realize integrated data systems.
YouthBuild The YouthBuild program specifically targets at-risk, high school dropouts ages 16-24 and addresses the challenges they face by providing them with an opportunity to gain both the education and occupational skills that will prepare them for employment with a living wage. In 2017, the Department’s YouthBuild program will continue to provide education and occupational skills training to program participants leading to entry into a chosen career field. Participants obtain industry-recognized credentials which support placements in post-secondary education, Registered Apprenticeships, and employment. WIOA adds an additional element to the overall purpose of the YouthBuild program, which is an emphasis on ensuring the quality and energy efficiency of community and other non-profit and public facilities, including those that serve homeless and low-income families. The Department requests $84,534,000 for the YouthBuild program to support approximately 82 grants to programs that will serve over 5,200 youth. Women in Apprenticeship Over the past few years, Congress has appropriated approximately $1,000,000 annually for the Women in Apprenticeship and Non-Traditional Occupations Act (WANTO) of 1992 (Public Law 102-530). ETA and the Department’s Women’s Bureau have jointly administered the program, which awards competitive grants to recruit, hire, train, and retain women in Registered Apprenticeships and non-traditional occupations (defined by the WANTO Act as occupations in which women comprise less than 25% of the workforce). The 2017 Budget requests no funds for this program. The goal of improving the recruitment and
14
participation of women in apprenticeships, including in non-traditional occupations, will be addressed more effectively through the Apprenticeship Grants, including the funding for Community-Based Organizations and Workforce Intermediaries for innovative strategies that increase diversity in apprenticeship. Job Training for Employment in High Growth Industries To address the Department's goal of preparing workers for good jobs and ensuring fair compensation, the Job Training for Employment in High Growth Industries Grants are designed to provide training for workers in different high-growth sectors of the economy. This program is funded through fees collected from employers who file applications seeking to hire temporary foreign workers under the H-1B visa program, for occupations that require highly specialized knowledge. The Department’s long-term goal is to decrease the need for H-1B visas by helping American workers develop the high-level skills needed by these employers. The Department’s ongoing dialogue with employers in in-demand sectors, such as information technology, communication and broadband technology, advanced manufacturing, and health care and health information technology, has confirmed that there are high-skilled jobs in the United States going unfilled. Furthermore, moving workers up along a career pathway facilitates the entry of new workers into technical careers. The Department intends to support training and education models that lead to highly-skilled technical jobs.
15
JOB CORPS
2015
Enacted 2016
Enacted 2017
Request Operations 1,580,825 1,581,825 1,608,535 Construction 75,000 75,000 105,000 Administration 32,330 32,330 41,055
Total Budget Authority 1,688,155 1,689,155 1,754,590 Total FTE 157 160 187
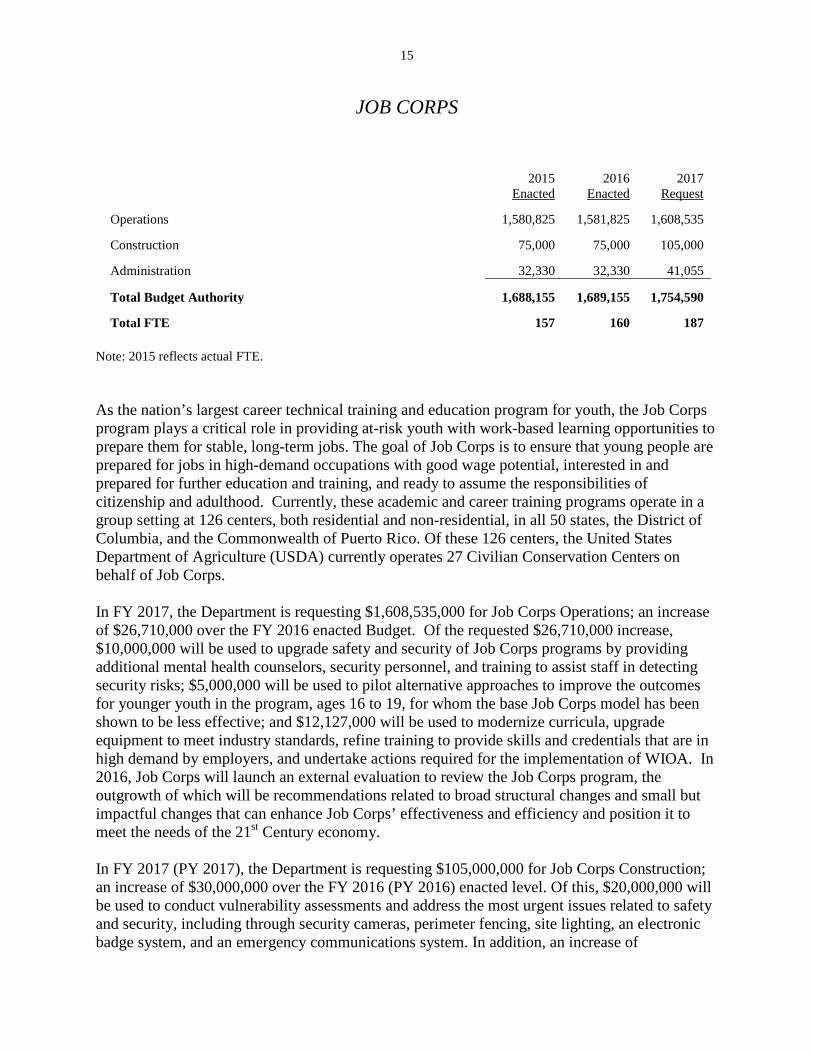
Note: 2015 reflects actual FTE. As the nation’s largest career technical training and education program for youth, the Job Corps program plays a critical role in providing at-risk youth with work-based learning opportunities to prepare them for stable, long-term jobs. The goal of Job Corps is to ensure that young people are prepared for jobs in high-demand occupations with good wage potential, interested in and prepared for further education and training, and ready to assume the responsibilities of citizenship and adulthood. Currently, these academic and career training programs operate in a group setting at 126 centers, both residential and non-residential, in all 50 states, the District of Columbia, and the Commonwealth of Puerto Rico. Of these 126 centers, the United States Department of Agriculture (USDA) currently operates 27 Civilian Conservation Centers on behalf of Job Corps. In FY 2017, the Department is requesting $1,608,535,000 for Job Corps Operations; an increase of $26,710,000 over the FY 2016 enacted Budget. Of the requested $26,710,000 increase, $10,000,000 will be used to upgrade safety and security of Job Corps programs by providing additional mental health counselors, security personnel, and training to assist staff in detecting security risks; $5,000,000 will be used to pilot alternative approaches to improve the outcomes for younger youth in the program, ages 16 to 19, for whom the base Job Corps model has been shown to be less effective; and $12,127,000 will be used to modernize curricula, upgrade equipment to meet industry standards, refine training to provide skills and credentials that are in high demand by employers, and undertake actions required for the implementation of WIOA. In 2016, Job Corps will launch an external evaluation to review the Job Corps program, the outgrowth of which will be recommendations related to broad structural changes and small but impactful changes that can enhance Job Corps’ effectiveness and efficiency and position it to meet the needs of the 21st Century economy. In FY 2017 (PY 2017), the Department is requesting $105,000,000 for Job Corps Construction; an increase of $30,000,000 over the FY 2016 (PY 2016) enacted level. Of this, $20,000,000 will be used to conduct vulnerability assessments and address the most urgent issues related to safety and security, including through security cameras, perimeter fencing, site lighting, an electronic badge system, and an emergency communications system. In addition, an increase of

16
$10,000,000 will allow Job Corps to renovate existing buildings (or construct new buildings when it is more cost effective than a renovation) and modernize career technical training laboratories. Job Corps is pursuing a goal that 15 percent of its facilities meet sustainability standards by FY 2025 but currently has large backlogs of repairs that need to occur. For Job Corps Administration, the Department is requesting $41,055,000 and 187 FTE, an increase of $8,725,000 and 27 FTE over the FY 2016 enacted level. The request includes $3,500,000 and 17 FTE for Job Corps Oversight. These staff will help institutionalize strong quality assurance and risk management practices across the Job Corps program. An increase of $1,320,000 and 10 FTE will allow Job Corps to complete the WIOA implementation process, as the performance reporting changes go into effect in 2016, and the first year of data will become available in 2017. Lastly, an increase of $1,435,000 will be used to improve the Regional Office Center Assessment process, enabling the agency to more smoothly and quickly incorporate the information gleaned from center visits into the risk-based analysis model Job Corps has developed. The Budget also announces the initiation of an external review of the Job Corps program, with the goal of building a strong foundation of ideas to help the program to help young people prepare for the jobs of the 21st century.

17
COMMUNITY SERVICE EMPLOYMENT FOR OLDER AMERICANS
2015
Enacted 2016
Enacted 2017
Request Community Service Employment for Older Americans 434,371 434,371 434,371
Total Budget Authority 434,371 434,371 434,371 The Community Service Employment for Older Americans (CSEOA) program, also known as the Senior Community Service Employment Program (SCSEP), supports employment of older workers by providing part-time, paid community service positions and work-based training for unemployed, low-income individuals, age 55 and older. The income eligibility requirement allows participants at income levels up to 133 percent of the Federal poverty level. The average age of participants at entry is 62 years. The Department is requesting $434,371,000 in FY 2017. The FY 2017 Budget reforms the program by awarding more competitive grants, adjusting income eligibility to serve those most in need, and promoting employment in for-profit organizations, which can offer seniors better long-term unsubsidized employment prospects. It is projected that SCSEP grantees will serve over 67,000 participants in PY 2017.
The Department is also proposing an appropriations language change that will alter the obligation period from July 1, 2017 – June 30, 2018 to April 1, 2017 – June 30, 2018 to allow for funding to be disbursed prior to the first day of the grantees’ performance period and avoid any breaks in service for participants.

18
FEDERAL UNEMPLOYMENT BENEFITS AND ALLOWANCES
2015
Enacted 2016
Enacted 2017
Request Trade Adjustments Assistance 507,000 802,452 849,000
TAA Benefits 241,000 384,000 357,000 TAA Training 236,000 391,452 450,000 Alternative-Reemployment TAA 30,000 27,000 42,000
Total Budget Authority 507,000 802,452 849,000 Note: FY 2015 reflects benefits used. FY 2016 reflects sequestration reductions for mandatory accounts pursuant to the Balanced Budget and Emergency Deficit Control Act, as amended.
The Trade Adjustment Assistance (TAA) program is a federal program that assists U.S. workers who have lost their jobs as a result of globalization. The Trade Adjustment Assistance Reauthorization Act of 2015 reauthorized the TAA Program through June 30, 2021.
The FY 2017 Budget request is $849,000,000 for the TAA program. This request includes $450,000,000 for Training and Other Activities, $357,000,000 for Trade Readjustment Allowances (TRA) and $42,000,000 for Alternative/Reemployment Trade Adjustment Assistance (A/RTAA). The $12,000,000 decrease is a result of an expected reduction in the national unemployment rate, which reduces the number of workers who are eligible for TRA.

19
STATE UNEMPLOYMENT INSURANCE AND EMPLOYMENT SERVICE OPERATIONS
2015
Enacted 2016
Enacted 2017
Request Unemployment Insurance 2,790,685 2,760,097 2,758,166
State Administration 2,687,793 2,630,550 2,582,019 Misclassification 10,000 0 10,000 Reemployment Services and Eligibility Assessments-UI Integrity 80,000 115,000 185,900 National Activities 12,892 14,547 15,247
Employment Service 684,002 699,818 699,818 Grants to States 664,184 680,000 680,000 Employment Service National Activities 19,818 19,818 19,818
Foreign Labor Certification 62,310 62,310 62,948 Federal Administration 48,028 48,028 48,666 FLC State Grants 14,282 14,282 14,282
Workforce Information-Electronic Tools-System Building 60,153 67,653 75,153
Total Budget Authority 3,597,150 3,589,878 3,631,085 Total FTE 165 182 182
Note: 2015 reflects actual FTE. Note: FY 2017 totals for SUIESO include the $35.0 million cap adjustment for RESEA. The State Unemployment Insurance and Employment Service Operations (SUIESO) account provides funding to support the UI system, including State Administration, Reemployment Services and Eligibility Assessments (RESEA), and National Activities. The SUIESO account also funds Employment Service Grants to States; Employment Service National Activities, which includes administration of the Work Opportunity Tax Credit and of Technical Assistance and Training for Employment Service Activities; the Foreign Labor Certification (FLC) Program including FLC Federal Administration and FLC State Grants; and Workforce Information-Electronic Tools-System Building. Unemployment Insurance The UI program provides temporary, partial wage replacement to workers temporarily or permanently laid off from their jobs. An integral part of the public workforce investment system, the UI program is the entry point for unemployed workers into the American Job Centers and to the services that speed their return to work. States administer the UI program directly and

20
also administer certain federal benefit programs. The federal role in this federal-state cooperative relationship includes setting broad policy for the program, establishing performance measures and standards, providing technical assistance to states, monitoring state performance, ensuring conformity and compliance of state laws and operations with Federal law, and funding the cost of administering state and federal UI laws. The UI budget activity includes three activities (1) State Administration, which is grants to states to administer their UI programs; (2) RESEA, which funds reemployment services and eligibility assessments in American Job Centers with selected UI beneficiaries; and (3) National Activities, which supports federal activities in support of the states. States administer the UI program directly. The major functions performed by the states are: (1) determining benefit entitlement; (2) paying benefits; and (3) collecting State UI taxes from employers. The states also administer Federal programs for payments to former Federal military and civilian personnel; claimants who qualify for extended or special Federal unemployment benefits; workers certified under the Trade Adjustment Assistance and Reemployment Trade Adjustment Assistance programs; and individuals unemployed due to disasters. The FY 2017 Budget request for UI State Administration is $2,592,019,000. The funds requested are sufficient to process, on average, 2,249,000 continued claims per week. During the year, states are expected to collect $40.6 billion in state unemployment taxes and pay an estimated $32.3 billion in Federal and State UI benefits to 6.6 million beneficiaries. The request continues the contingency reserve language that provides for additional funds to meet unanticipated UI workloads. This level of UI State Administration funding also includes $10,000,000 to improve state efforts to detect and remedy misclassification of workers as independent contractors, $50,000,000 to support IT improvements in the UI program, and $7,000,000 for the UI Integrity Center of Excellence, a $4,000,000 increase to support an integrated data hub and data analytics capacity to help states reduce fraud. The Budget also includes $185,900,000 for RESEA, which consists of in-person reemployment services combined with an assessment of claimants’ continuing eligibility for UI benefits. Research has shown that these services reduce UI benefit outlays by helping beneficiaries get back to work more quickly at higher wages and eliminating improper payments to ineligible individuals. The Department is proposing that $35,000,000 of this request be funded through a program integrity cap adjustment. The requested level of discretionary funding will allow states to serve the approximately one-third of claimants profiled as most likely to exhaust their benefits and all claimants receiving unemployment compensation for ex-servicemembers (UCX). In addition, the Budget proposes mandatory funding beginning in 2018 to ensure that states can continue to provide RESEAs to reach this segment of the UI population. UI National Activities provides funds to support States in administering their State UI programs. The FY 2017 Budget Request for UI National Activities is $15,247,000, an increase of $700,000 over the FY 2016 enacted level of $14,547,000. In addition to funding activities which support States collectively, the request will support the continuation of IT upgrades and technical assistance activities that focus on three priority areas: 1) program performance and accountability, 2) program integrity, and 3) connecting UI claimants to reemployment services through the American Job Centers.

21
UI National Activities provides funds to support states in administering their State UI programs. The FY 2017 Budget Request for UI National Activities is $15,247,000, an increase of $700,000 over the FY 2016 enacted level of $14,547,000. In addition to funding activities which support states collectively, the request will support the continuation of IT upgrades and technical assistance activities that focus on three priority areas: 1) program performance and accountability, 2) program integrity, and 3) connecting UI claimants to reemployment services through the American Job Centers. The Budget also proposes a cost-neutral suite of reforms to strengthen and modernize the UI program. UI provides critical income support to unemployed workers. But after cutbacks in coverage by States and broader changes in the evolving economy, fewer than one out of every three unemployed workers today receives UI benefits. The Budget’s reforms would address this by providing coverage for more workers—including more part-time workers, low-wage and intermittent workers, and workers who must leave a job for compelling family reasons. The Budget would also help unemployed workers get back to work more quickly; reform UI to help prevent layoffs; make the UI program more responsive to economic downturns; and shore up the solvency of State UI programs so they are prepared if unemployment in their State rises. In addition, the Budget establishes wage insurance to help workers make ends meet if a new job pays less than an old one, at least initially, while encouraging workers to get off the sidelines quickly and stay in the workforce. The goal is a modernized, well-funded UI program that better serves the diverse set of workers in today’s economy and better supports economic recoveries. Employment Service The Wagner-Peyser Act of 1933 established a nationwide system of public employment offices, known as the Employment Service (ES). WIOA maintains ES as a core program in the one-stop system and further integrates ES by introducing new colocation requirements. WIOA also broadens ES activities by requiring ES to provide greater assistance to UI claimants and granting flexibility for ES staff to provide their customers with increased referrals and application assistance to other training and employment opportunities, such as Pell Grants and GI Bill benefits. Activities within the ES include Employment Service Grants to States and Employment Service National Activities funding to support Technical Assistance and Training activities. The FY 2017 Budget requests $680,000,000 to operate the ES in all 50 states and three territories, which maintains the FY 2016 enacted level. The Employment Service funding allotments for states are based on formula provisions defined in the Wagner-Peyser Act. States then distribute resources to local employment service offices, which are part of the American Job Center network. The Employment Service National Activities appropriation provides funding to support technical assistance and training activities within the American Job Center delivery system. Employment Service National Activities also support the Work Opportunity Tax Credit, which is a Federal tax incentive provided to private-sector businesses that hire individuals who face significant barriers to employment. In FY 2017, the Department is requesting $19,818,000 for National Activities. To support states’ processing of certification requests, the Department requests $18,485,000 to

22
operate the WOTC program, and $1,333,000 for employment service technical assistance activities. Technical assistance resources will be used to support online and in-person assistance for states to implement promising strategies in addressing the skills mismatch and speeding reemployment of long term unemployed, as well as increasing employment opportunities for all populations. Foreign Labor Certification The programs currently administered by the Office of Foreign Labor Certification (OFLC) include the: immigrant Permanent Labor Certification Program (PERM) or the “Green Card”; nonimmigrant H-1B and H-1B1 Specialty Occupations Programs; E-3 Specialty Worker Program; H-2A Temporary Agricultural Program; H-2B Temporary Non-agricultural Program; Determination of Prevailing Wages; and D-1 Longshore Crewmember Program. For FY 2017, the Department requests $48,666,000 and 182 FTE for Federal Administration. These resources will support the operation, management, and oversight of the Foreign Labor Certification programs. In addition, the FY 2016 appropriation authorized OFLC to utilize up to $13,000,000 of H-1B training funds through the end of FY 2017 to further reduce the backlog of un-adjudicated Permanent Labor Certification (PERM) applications. This work will commence in FY 2016 and will continue in FY 2017. The Budget also proposes legislation to establish and retain fees to cover the costs of operating DOL’s foreign labor certification programs, providing DOL a more reliable, workload-based source of funding for this function and ultimately eliminate the need for discretionary appropriations. For FY 2017, the Department requests $14,282,000 to support State Workforce Agencies’ (SWA) foreign labor certification activities. Under the State Grant activity, the Department provides annual grants to SWAs in 55 states and U.S. territories to fund employment-based immigration activities that are required components of the various foreign labor certification programs. These activities include, but are not limited to, SWA posting and circulation of inter- and intra-state job orders and other assistance to employers in the effective recruitment of U.S. workers, state safety inspection of employer-provided H-2A housing, and developing and conducting prevailing practice and wage surveys used to set wages and standards in a defined occupation within their state. Workforce Information-Electronic Tools-System Building U.S. Department of Labor programs funded through the Workforce Information/E-Tools/System Building line item assist working-age individuals, employers, government entities, and non-profit organizations. The resources supported through this line item are foundational to creating innovative workforce strategies to ensure a skilled workforce for high demand and emerging industries and occupations providing good jobs for workers. Program strategies that support the goal of providing advice, tools and knowledge about careers, skills and employment include: 1) collecting, producing, and analyzing workforce information

23
through activities such as state and local employment projections for occupations and industries; 2) collecting information on the skills necessary to perform work in occupations; and 3) disseminating information through Web-based guidance on how to search for work; where to obtain employment counseling; how to identify related education, training, credentials or licenses to qualify for careers; where to find relevant course offerings; and how to locate and benefit from government-financed employment programs and other assistance. In FY 2017, the Department requests $75,153,000, an increase of $7,500,000 over the FY 2016 enacted amount. The FY 2016 Omnibus provided an increase to fund Occupational Licensing Grants to identify, explore, and address areas where occupational licensing requirements create an unnecessary barrier to labor market entry or labor mobility and where interstate portability of licenses can improve economic opportunity. The FY 2017 Budget request builds on this proposal and provides a total of $10 million for these grants. In addition, the Department is proposing an increase of $5,000,000 for O*NET Modernization and customer service tools. These funds will establish a technology platform that all 2,500 American Job Centers can use to report on customer service and develop a mechanism (e.g. a Yelp-like tool) that will allow job seekers to quickly view customer satisfaction rating for the job centers in their area, helping customers make informed decisions and providing feedback to job centers on their customer service.
24
JOB DRIVEN TRAINING PROPOSALS
2015
Enacted 2016
Enacted
2017 Legislative
Proposal Apprenticeship Training Fund 0 0 2,000,000 American Talent Compact 0 0 3,000,000 Career Navigators and WIOA Workforce Data Science and Innovation Fund 0 0 2,000,000 Opening Doors for Youth 0 0 5,500,000
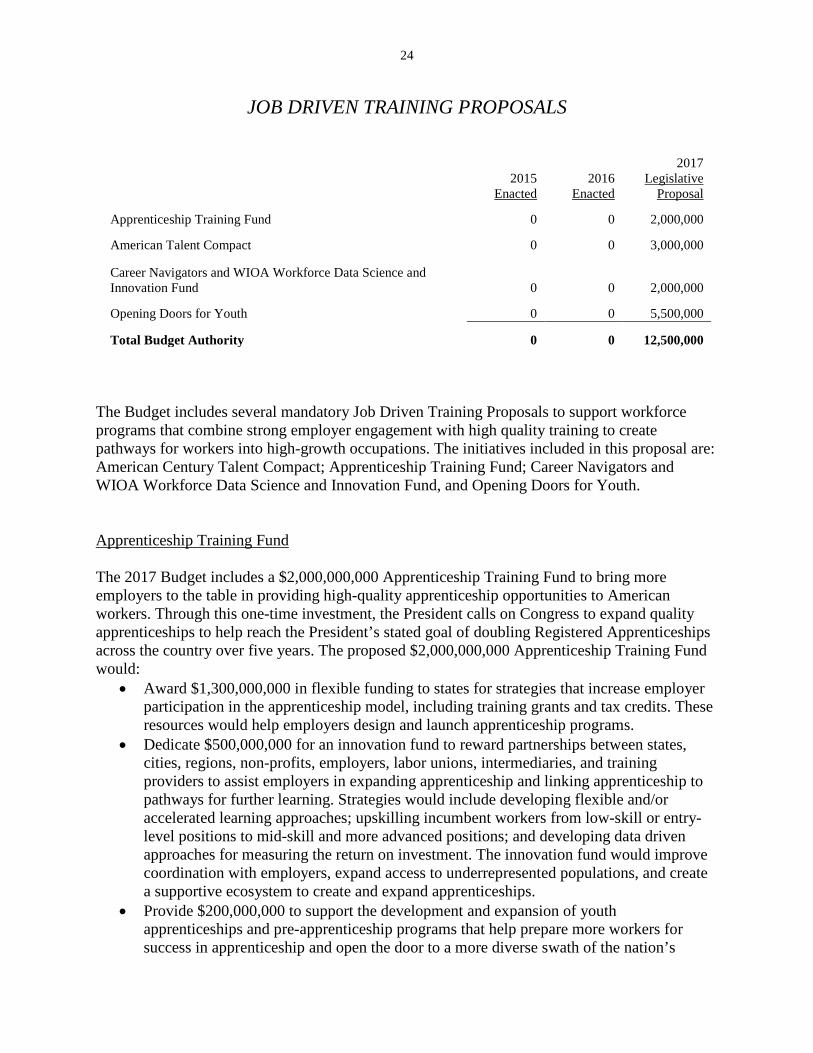
Total Budget Authority 0 0 12,500,000 The Budget includes several mandatory Job Driven Training Proposals to support workforce programs that combine strong employer engagement with high quality training to create pathways for workers into high-growth occupations. The initiatives included in this proposal are: American Century Talent Compact; Apprenticeship Training Fund; Career Navigators and WIOA Workforce Data Science and Innovation Fund, and Opening Doors for Youth. Apprenticeship Training Fund The 2017 Budget includes a $2,000,000,000 Apprenticeship Training Fund to bring more employers to the table in providing high-quality apprenticeship opportunities to American workers. Through this one-time investment, the President calls on Congress to expand quality apprenticeships to help reach the President’s stated goal of doubling Registered Apprenticeships across the country over five years. The proposed $2,000,000,000 Apprenticeship Training Fund would:
• Award $1,300,000,000 in flexible funding to states for strategies that increase employer participation in the apprenticeship model, including training grants and tax credits. These resources would help employers design and launch apprenticeship programs.
• Dedicate $500,000,000 for an innovation fund to reward partnerships between states, cities, regions, non-profits, employers, labor unions, intermediaries, and training providers to assist employers in expanding apprenticeship and linking apprenticeship to pathways for further learning. Strategies would include developing flexible and/or accelerated learning approaches; upskilling incumbent workers from low-skill or entry-level positions to mid-skill and more advanced positions; and developing data driven approaches for measuring the return on investment. The innovation fund would improve coordination with employers, expand access to underrepresented populations, and create a supportive ecosystem to create and expand apprenticeships.
• Provide $200,000,000 to support the development and expansion of youth apprenticeships and pre-apprenticeship programs that help prepare more workers for success in apprenticeship and open the door to a more diverse swath of the nation’s

25
workforce. Education agencies, school systems, colleges and universities, apprenticeship sponsors, and industry-led consortiums could receive grants for the cost of training and education; stipends for pre-apprentices and youth apprentices; curriculum development; and marketing to help youth and their parents recognize the benefits of apprenticeship.
American Talent Compact The 2017 Budget includes a request for $3,000,000,000 over five years to enhance our job-driven, regional training efforts. The Department intends to work with regions across the country to establish an American Talent Compact. Communities will recruit, assess, and train American workers to meet the needs of local businesses that are willing to provide workers with good jobs at good wages, without discriminating against the long-term unemployed and other workers who have been relegated to the sidelines. This effort would focus on making local employers more competitive and encouraging U.S. job growth and in-sourcing. While the first priority would be on filling jobs of existing local business, we would also promote the Talent Compact to prospective international investors and businesses operating in the United States through programs that work directly with domestic and international firms, including SelectUSA. The Compact would build on the Workforce Innovation and Opportunity Act (WIOA) requirements that state and local areas develop, implement, and expand occupational cluster and sector-based training strategies with a focus on regional growth industries. Under the law, Governors must designate regions to undertake local economic planning, including partnerships across Federal programs to coordinate and streamline job training programs, leading to greater impacts for workers and employers. Funding would be provided through a competitive grant process and would go to 50-60 regions each year. 75 percent of the funding would be focused on training and 25 percent to source talent and develop new training. Regions would be required to form or leverage existing collaborations of workforce boards, economic development organizations, employers, K-12 Career and Technical Education programs, and community colleges. Career Navigators and WIOA Workforce Data Science and Innovation Fund Each year, millions of Americans make one of the most important investment decisions of their lives—how to invest in education and training—with very little information. The Department’s FY 2017 Budget includes a request for $2,000,000,000 over five years to establish a Career Navigators Program. The request is for $1,500,000,000 over five years and will start with the launch of Career Navigators. The Career Navigators will proactively reach out to individuals who have been left behind in the new economy, rather than putting the onus on the individuals to come into a One Stop Center. Americans who have exhausted UI, have dropped out of the labor force, and are only able to find part-time work will be assigned a Career Navigator who would engage with them as much or as little as needed. In parallel, the Department proposes to provide $150 per person for career navigation services and eligibility assessments to the one-third of UI claimants profiled as most likely to exhaust benefits. This would reach more than 1 million people in FY 2017.

26
Career Navigators would focus on helping workers as they look for a new job, identifying training options that are producing strong outcomes, and helping workers to complete eligibility forms and assessing what funding they qualify for and where they could get additional services if needed. Navigators would also support workers past the point of initial reemployment and would advise them on leveraging that job to shift to higher-paying jobs. Assuming counseling costs of $300 per worker, this proposal would reach one million people per year and five million people total over five years. The FY 2017 Budget also includes a request for $500,000,000 over five years for the Workforce Data Science and Innovation Fund to focus on reducing the costs and increasing the quality of integrated state labor data systems through foundational investments to develop open source data analytics tools, standard data exchange formats, and scalable, open-source database architectures that allow for easier integration of fiscal and case management information with performance and outcome data at the Federal, state, and local levels. It will also focus on developing new data standards and open data products on jobs, skills, and training outcomes. Lastly, the Fund will establish a Center of Excellence for data science and development services with a best-in-class team of private sector data scientists, innovators, entrepreneurs, behavioral scientists, and engineers who would implement cutting-edge data and technology practices on the nation’s highest impact programs in workforce development and training. Opening Doors for Youth In FY 2017, the Department is requesting $5,500,000,000 over four years for the Opening Doors for Youth Program. This program will center on making a commitment to a first job and a degree for out-of-school and at-risk youth. The focus will be on expanding proven skills training and education models to more young people, particularly those not engaged in either work or school. To work toward ensuring that all American youth can have the valuable experience of a first job and a paid summer learning opportunity, this program would provide $3,500,000,000 over four years in formula grants to support paid employment opportunities to youth. Of this amount, $1,500,000,000 would support summer job opportunities linked to career information and training opportunities. This funding would require a 50 percent match of youth wages through a combination of other public, business sector, and philanthropic funding, and would provide approximately 1 million more youth summer employment opportunities. Another $2,000,000,000 would invest in first jobs for Opportunity Youth (out-of-school, out-of-work youth), providing up to a year of paid work. Each state would be able to design its own implementation, but there would be a 20 percent non-federal match. With this investment, about 150,000 young adults who are out of school and work would gain access to paid employment. An additional $2,000,000,000 would be used to launch Connecting for Opportunities, competitive grants to transform communities with high rates of youth disengagement, high school dropouts, and unemployment into places of opportunity for young adults to help them succeed in school and the labor force. The Departments of Education and Labor will jointly administer the Connecting for Opportunities program.

27
ADVANCES TO THE UNEMPLOYMENT TRUST FUND
2015
Enacted 2016
Enacted 2017
Request Advances to the Unemployment Trust Fund (Non-add) 300,000 0 0
Total Budget Authority 300,000 0 0 This account makes available funding for repayable advances (loans) to two accounts in the Unemployment Trust Fund (UTF): the Extended Unemployment Compensation Account (EUCA) which pays the Federal share of extended unemployment benefits, and the Federal Unemployment Account (FUA) which makes loans to states to fund unemployment benefits. In addition, the account provides repayable advances to the Black Lung Disability Trust Fund (BLDTF) whenever its balances prove insufficient to make payments from that account. These repayable advances are shown as borrowing authority within the UTF or the BLDTF, and they do not appear as budget authority or outlays in the Advances to the Unemployment Trust Fund and Other Funds account. This account also makes available funding as needed for non-repayable advances to the Federal Employees Compensation Account (FECA) to pay the costs of unemployment compensation for former Federal employees and ex-servicepersons, to a revolving fund from which the Employment Security Administration Account (ESAA) may borrow to cover administrative costs, and to the Federal Unemployment and Benefits and Allowances (FUBA) account to pay the costs of benefits and services under the Trade Adjustment Assistance for Workers (TAA) program. The Department estimates that no advances will be necessary in FY 2017. This request assumes continuation of the Advances appropriations language providing “such sums as may be necessary” authority for advances to the accounts described above, to permit advances should they become necessary.
28
PROGRAM ADMINISTRATION
2015
Enacted 2016
Enacted 2017
Request Training and Employment 68,713 68,713 86,946 Workforce Security 42,733 42,733 43,461 Apprenticeship 34,000 34,000 40,089 Executive Direction 9,113 9,113 10,330
Total Budget Authority 154,559 154,559 180,826 Total FTE 731 750 812
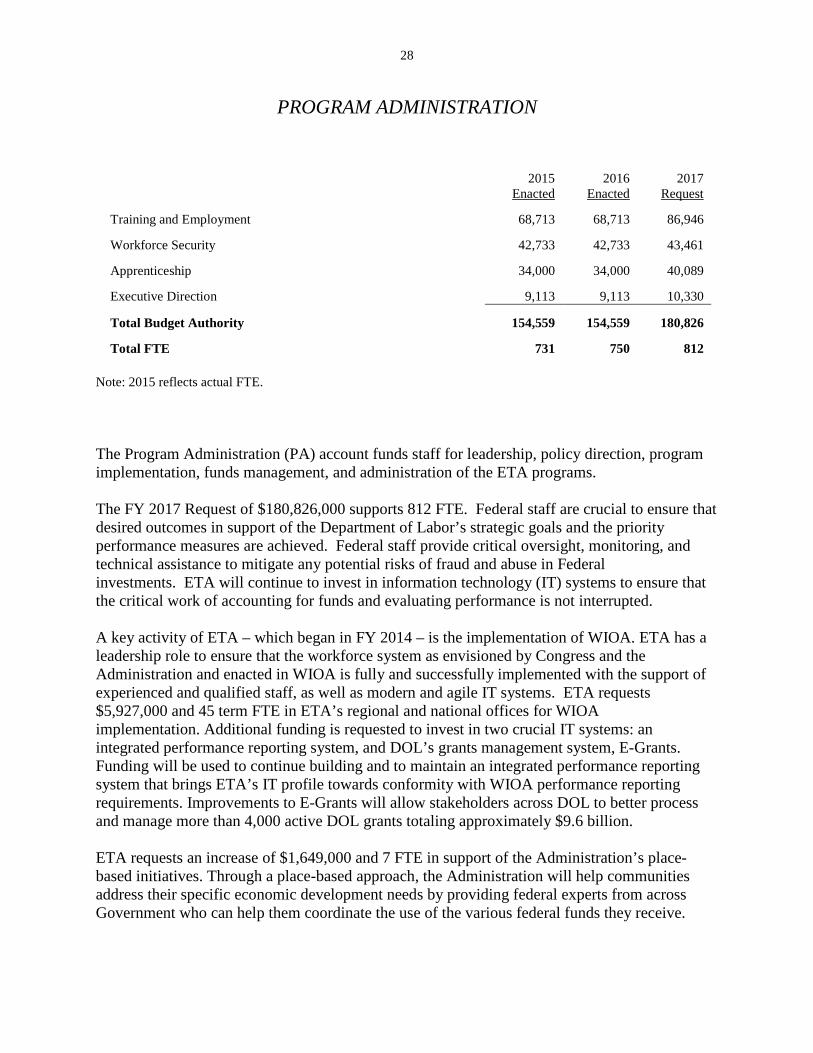
Note: 2015 reflects actual FTE. The Program Administration (PA) account funds staff for leadership, policy direction, program implementation, funds management, and administration of the ETA programs. The FY 2017 Request of $180,826,000 supports 812 FTE. Federal staff are crucial to ensure that desired outcomes in support of the Department of Labor’s strategic goals and the priority performance measures are achieved. Federal staff provide critical oversight, monitoring, and technical assistance to mitigate any potential risks of fraud and abuse in Federal investments. ETA will continue to invest in information technology (IT) systems to ensure that the critical work of accounting for funds and evaluating performance is not interrupted. A key activity of ETA – which began in FY 2014 – is the implementation of WIOA. ETA has a leadership role to ensure that the workforce system as envisioned by Congress and the Administration and enacted in WIOA is fully and successfully implemented with the support of experienced and qualified staff, as well as modern and agile IT systems. ETA requests $5,927,000 and 45 term FTE in ETA’s regional and national offices for WIOA implementation. Additional funding is requested to invest in two crucial IT systems: an integrated performance reporting system, and DOL’s grants management system, E-Grants. Funding will be used to continue building and to maintain an integrated performance reporting system that brings ETA’s IT profile towards conformity with WIOA performance reporting requirements. Improvements to E-Grants will allow stakeholders across DOL to better process and manage more than 4,000 active DOL grants totaling approximately $9.6 billion. ETA requests an increase of $1,649,000 and 7 FTE in support of the Administration’s place-based initiatives. Through a place-based approach, the Administration will help communities address their specific economic development needs by providing federal experts from across Government who can help them coordinate the use of the various federal funds they receive.

29
ETA’s Office of Apprenticeship administers the National Apprenticeship Act of 1937, which established a foundation for developing and expanding the nation’s skilled workforce through Registered Apprenticeship programs with standards for safeguarding the safety and welfare of apprentices. Today there are more than 450,000 active apprentices across the United States. The FY 2017 Budget request continues the efforts begun in 2014 to make Registered Apprenticeship opportunities available to a significantly greater number of American workers. ETA aims to meet the President’s goal of doubling the number of apprenticeships by the end of 2019 through a combination of outreach and information dissemination, incentives and new programmatic funding. The Budget includes an increase of $3,616,000 and 10 FTE in the Office of Apprenticeship to provide sector-based technical assistance efforts, industry subject matter experts, and additional staff to increase and manage partnerships with states, industries, and community colleges. These additional staff would also support the new apprenticeship grants program appropriated in FY 2016 and proposed for continuation in FY 2017. The FY 2017 Budget also includes an increase to modernize the Office of Apprenticeship’s data management system, which will improve services to programs and businesses with Registered Apprenticeship programs. Federal staff work closely with grantees to maximize program effectiveness, document innovations and disseminate those best practices, document issues and improvements, develop and deliver training curricula on federal policies and priorities, and support the activity of the Department in the field. Federal staff activities such as these are not fully reflected in the workload and performance numbers for grants. In FY 2017, the Department also is requesting authority to transfer up to 0.5 percent of program resources for program integrity activities. In the past few years, limited direct program administration funding has made it difficult for ETA to meet its responsibility for adequate oversight of its programs. Taking this small amount from program funding to address the integrity of the programs for users and taxpayers will allow for improved stewardship of those programs.
30
PAID LEAVE PARTNERSHIP INITIATIVE
2015
Enacted 2016
Enacted
2017 Legislative
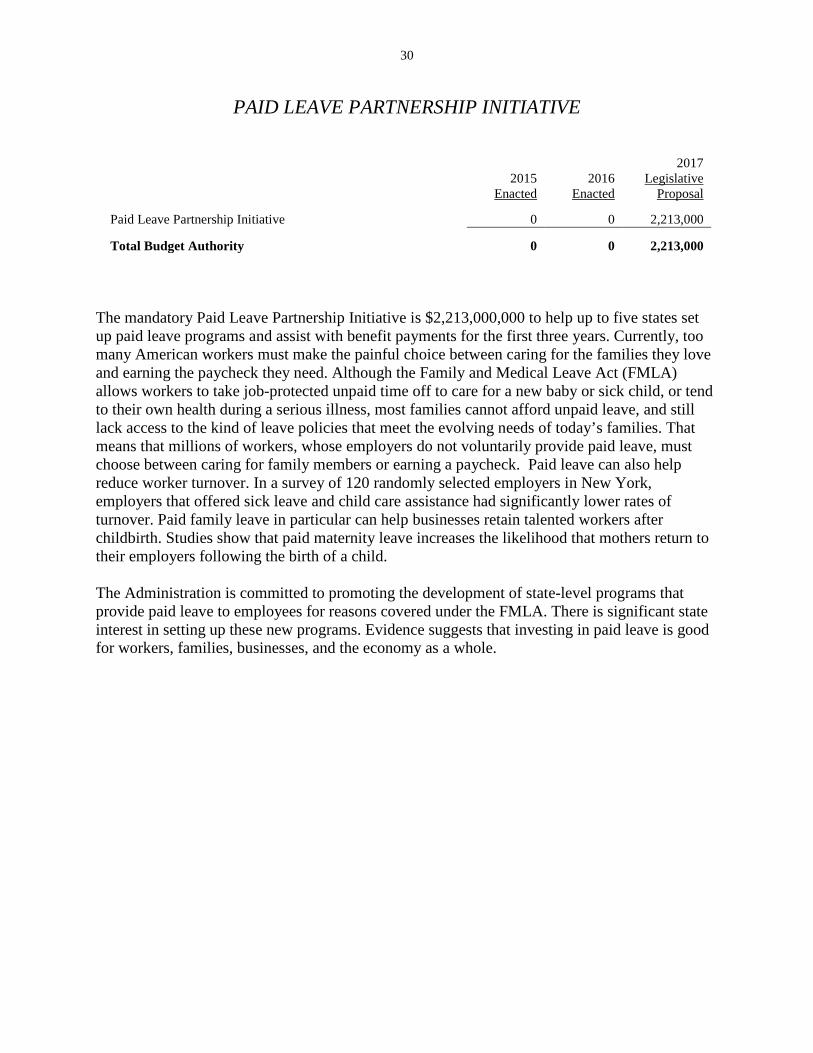
Proposal Paid Leave Partnership Initiative 0 0 2,213,000
Total Budget Authority 0 0 2,213,000 The mandatory Paid Leave Partnership Initiative is $2,213,000,000 to help up to five states set up paid leave programs and assist with benefit payments for the first three years. Currently, too many American workers must make the painful choice between caring for the families they love and earning the paycheck they need. Although the Family and Medical Leave Act (FMLA) allows workers to take job-protected unpaid time off to care for a new baby or sick child, or tend to their own health during a serious illness, most families cannot afford unpaid leave, and still lack access to the kind of leave policies that meet the evolving needs of today’s families. That means that millions of workers, whose employers do not voluntarily provide paid leave, must choose between caring for family members or earning a paycheck. Paid leave can also help reduce worker turnover. In a survey of 120 randomly selected employers in New York, employers that offered sick leave and child care assistance had significantly lower rates of turnover. Paid family leave in particular can help businesses retain talented workers after childbirth. Studies show that paid maternity leave increases the likelihood that mothers return to their employers following the birth of a child. The Administration is committed to promoting the development of state-level programs that provide paid leave to employees for reasons covered under the FMLA. There is significant state interest in setting up these new programs. Evidence suggests that investing in paid leave is good for workers, families, businesses, and the economy as a whole.

31
EMPLOYEE BENEFITS SECURITY ADMINISTRATION
2015
Enacted 2016
Enacted 2017
Request
2017 Legislative
Proposal Enforcement and Participant Assistance 147,400 147,400 0 0 Policy and Compliance Assistance 26,901 26,901 0 0 Executive Leadership, Program Oversight and Administration 6,699 6,699 0 0 Employee Benefits Security Programs 0 0 205,761 100,000
Total Budget Authority 181,000 181,000 205,761 100,000 Total FTE 962 949 965 0
Note: Reflects the proposal to restructure EBSA budget activities for enforcement and participant assistance; policy and compliance assistance; and executive leadership, program oversight and administration into a consolidated single budget activity for employee benefits security programs. Note: 2015 reflects actual FTE. The Employee Benefits Security Administration (EBSA) protects the integrity of pensions, health, and other employee benefits for more than 143 million people. EBSA’s enforcement authority extends to an estimated 681,000 private retirement plans, 2.3 million health plans and a similar number of other employee welfare plans which together hold $8.5 trillion in assets. These plans provide critical benefits to America’s workers, retirees and their families. The FY 2017 budget request for EBSA is $205,761,000 and 965 FTE, which includes programmatic increases totaling $22,175,000. This request includes the following program initiatives and increases:
• $7,590,000 and 7 FTE for enforcement program modernization, which will ensure development and implementation of advanced training programs for field investigators and auditors who conduct complex major cases. These resources also will ensure the development of advanced investigative tools that will enhance health and retirement benefits analysis and targeting..
• $2,882,000 and 9 FTE for enforcement targeting and analysis, which will enhance the development of risk-analytics and detection strategies that better protect plan participants and beneficiaries from abusive practices.
• $2,500,000 for Thrift Savings Plan oversight, which will be used to provide focused oversight on the TSP’s internal control operating environment and perform more in-depth reviews to improve IT security.
• $6,500,000 (two-year funding availability) for a state-based retirement plan demonstration project, which will implement different approaches to increasing retirement plan coverage, such as state-based auto-IRAs programs requiring employers that do not offer workplace plan to automatically enroll their workers in an IRA, state-

32
based 401(k) plans in which workers or employers without workplace plans could opt to participate, or retirement marketplaces connecting small businesses with state-approved investment vehicles.
• $100 million in mandatory funding for demonstrations conducted by nonprofits and States to design, implement, and evaluate new, innovative approaches for providing more portable retirement and other employer-provided benefit coverage. The goal is to develop and test models that are portable across employers and can accommodate intermittent contributions or contributions from multiple employers for an individual worker.
With the requested resources, EBSA will continue to: (1) provide a multi-faceted employee benefits security program that effectively targets the most egregious and persistent violators; (2) implement a strong regulatory framework with an active regulatory agenda; (3) assume significant additional responsibilities and shoulder a heavy workload in response to Congressional action with respect to health benefits; (4) provide innovative outreach and education that assists workers in protecting their pension and health benefits; and (5) conduct a well-integrated research program based on evidence and comprehensive analysis. EBSA is also consolidating its budget into a single comprehensive budget activity to better align with its single, integrated mission of protecting the retirement and health benefits security of America’s workers, retirees and their families. Finally, to better comport with the scheduling of cases through the courts, EBSA requests an appropriations language change that will provide multi-year funding for the management and administration of expert witnesses who consult with and testify on behalf of the Federal Government.

33
PENSION BENEFIT GUARANTY CORPORATION
2015
Enacted 2016
Enacted 2017
Request Pension Insurance 79,526 0 0 Pension Plan Termination and Benefits Administration 170,261 0 0 Operational Support 156,638 0 0
Office of Inspector General - Non-Add 6,157 0 0 Consolidated Administrative Activities 0 423,163 519,506
Office of Inspector General - Non-Add 0 6,377 6,526 Investment Management Fees Program 96,384 103,906 113,484 Single Employer Program Benefit Payments 5,818,000 6,280,000 7,195,000 Multi-Employer Program Financial Assistance 152,000 250,000 315,000
Total Budget Authority 6,472,809 7,057,069 8,142,990 Total FTE 939 942 942
Note: 2015 reflects actual FTE. Note: FY 2015 and FY 2016 reflect sequestration reductions for mandatory accounts pursuant to the Balanced Budget and Emergency Deficit Control Act, as amended. The Pension Benefit Guaranty Corporation (PBGC) is a federal corporation, established under the Employee Retirement Income Security Act of 1974, as amended. It guarantees payment of basic pension benefits earned by more than 40,000,000 American workers in two separate insurance programs. The single-employer program protects about 30,000,000 workers and retirees in over 22,000 pension plans. The multiemployer program protects over 10,000,000 workers and retirees in about 1,400 pension plans. The Corporation receives no funds from general tax revenues. Operations are financed by insurance premiums paid by companies that sponsor defined benefit pension plans, investment income, and assets from terminated plans. PBGC tries, first, to preserve plans and keep pension promises in the hands of the employers who make them. When companies undertake major transactions that might threaten their ability to pay pensions, PBGC negotiates protections for their pension plans. Last year PBGC negotiated with dozens of companies, both in bankruptcy and otherwise, to preserve their plans. PBGC is requesting $519,506,000 in spending authority for administrative purposes in 2017. The changes include:
• An increase of $98,500,000 restricted to costs associated with the acquisition, occupancy and related costs of headquarters space, to remain available for a period of five years.
• An increase of $103,000 to support an Office of Inspector General request for additional Financial Statement Audit funding.
34
• A reduction of $12,865,000 for one-time FY 2016 funding for improvements to IT delivery and security, and correcting long standing IT related material weaknesses.
The Budget also proposes to give the PBGC Board the authority to adjust premiums. The 2016 Budget proposed to raise premiums by $19 billion, with premiums to be split between the multiemployer and single-employer programs based on the size of their deficits. Given the $4 billion in recent premium increases enacted in the Bipartisan Budget Act of 2015 and the single-employer program’s improving financial projections, the Budget directs the Board to raise $15 billion in additional premium revenue within the Budget window only from the multiemployer program. The Administration believes additional increases in single-employer premiums are unwise at this time and would unnecessarily create further disincentives to maintaining defined benefit pension plans. This level of additional multiemployer premium revenue would nearly eliminate the risk of the multiemployer program becoming insolvent within 20 years. The Budget assumes that the Board will raise these revenues by using its premium-setting authority to create a variable-rate premium (VRP) and an exit premium in the multiemployer program. A multiemployer VRP would require plans to pay additional premiums based on their level of underfunding—as is done in the single-employer program. An exit premium assessed on employers that withdraw from a plan would compensate PBGC for the additional risk imposed on it when healthy employers exit.

35
WAGE AND HOUR DIVISION
2015
Enacted 2016
Enacted 2017
Request Wage and Hour Division 227,500 227,500 276,599 Wage Hour H-1B 55,443 58,000 58,000
Total Budget Authority 282,943 285,500 334,599 Total FTE 1,743 1,743 2,061
Note: 2015 reflects actual FTE. The Wage and Hour Division (WHD) was created by the Fair Labor Standards Act (FLSA) of 1938. WHD is responsible for the administration and enforcement of a wide range of laws, which collectively cover virtually all private and state and local government employment - over 135 million workers in more than 7.3 million establishments throughout the United States and its territories. WHD comprises a nationwide staff of investigators, supervisors, technical, and clerical employees responsible for enforcing the FLSA, Walsh-Healy Public Contracts Act, Contract Work Hours and Safety Standards Act, Davis-Bacon Act, Migrant and Seasonal Agricultural Worker Protection Act, McNamara-O’Hara Service Contract Act, Immigration and Nationality Act, Employee Polygraph Protection Act, and Family and Medical Leave Act. For FY 2017, the WHD budget request is $276,599,000 and 1,694 FTE. An additional 367 FTE will be funded by the H-1B L Fraud account. The budget request includes increases totaling $49,099,000 and 318 FTE to continue positive momentum towards building a stronger and more effective enforcement program. The majority of this request is for an increase of $29,419,000 and 300 FTE for additional enforcement staff and support. Additional resources dedicated to active enforcement would allow the agency to develop corporate and enterprise-wide solutions to systemic compliance problems – data show that using resources toward planned enforcement activities achieves better results for low-wage workers who are less likely to complain. Additionally, the budget includes $5,800,000 for a new, integrated case management system to replace the current outdated system, which impedes WHD’s ability to conduct strategic enforcement; $2,200,000 and 6 FTE for Back Wage Collection and Payments, including 4 forensic accountants with the remaining 2 FTE to assist with improvements to the back wage collection process; and $3,000,000 and 12 FTE to build data analytic capabilities for strategic enforcement and the creation of data tools and products to allow WHD to take a data-driven informed approach, leveraging internal and publicly available data sources for enforcement priorities.
Only through the strategic and planned use of resources can the agency begin to change the types of behaviors that drive non-compliance. These additional resources would be dedicated to directed investigations that are strategically selected and executed to solve the most important
36
compliance challenges that include protecting workers in industries that employ business models that are at high risk of wage and hour violations. These resources would also allow WHD to increase and strengthen the analytic capacity to conduct evaluations and other analyses to inform decisions about how best to use the agency’s limited resources, including directing more resources toward evidence-based practices and strategies. A strong directed enforcement program can also help workers move into or stay in the middle class by supporting employers who play by the rules and pay their employees the decent wages they have earned, while undermining employers whose business success depends upon cutting corners on workers’ rights to fair pay. WHD recognizes that to achieve the greatest impact with its resources, it needs to invest in its infrastructure, including new technology that will enable it to meet the increasing public demand for digital government capabilities. In FY 2015, WHD completed 27,915 compliance actions, and obtained agreements to pay over $246 million in back wages for more than 240,000 workers.

37
OFFICE OF FEDERAL CONTRACT COMPLIANCE PROGRAMS
2015
Enacted 2016
Enacted 2017
Request Office of Federal Contract Compliance Programs 106,476 105,476 114,169
Total Budget Authority 106,476 105,476 114,169 Total FTE 620 615 615
Note: 2015 reflects actual FTE. The Office of Federal Contract Compliance Programs (OFCCP) enforces, for the benefit of job seekers and wage earners, the contractual promise of affirmative action and equal employment opportunity required of those who do business with the Federal government. OFCCP administers Executive Order 11246, as amended, which prohibits employment discrimination on the basis of race, religion, color, sex, and/or national origin; Section 503 of the Rehabilitation Act of 1973, as amended, and the Americans with Disabilities Act of 1990 (ADA), as amended, which prohibit employment discrimination against individuals with disabilities; and the Vietnam Era Veterans' Readjustment Assistance Act of 1974, as amended, which prohibits employment discrimination against protected veterans. In support of the agency’s mission, the FY 2017 request is $114,169,000 and 615 FTE, which includes an increase of $1,890,000 for the creation of two Skilled Resource Centers and $3,300,000 for the continued modernization of the agency’s core Case Management System. The implementation of the targeted Skilled Resource Centers will allow the OFCCP to better align its investigative skills trainings for existing and new compliance officers with geographically concentrated business sector industries. This approach will allow the OFCCP to take proactive cost saving steps to reduce its existing foot print of leased office space, support more quality and timely enforcement efforts, and ultimately benefit the countless victims of discrimination. The dedicated funding for the OFCCP Case Management System would strongly support the continued improvement of the agency’s enforcement efforts while assisting in the standardization of the Department of Labor’s Digital Government Integrated Platform which is designed to modernize legacy systems within the department and support enterprise data analytics, mobile data applications, and enhance staff productivity and efficiency.
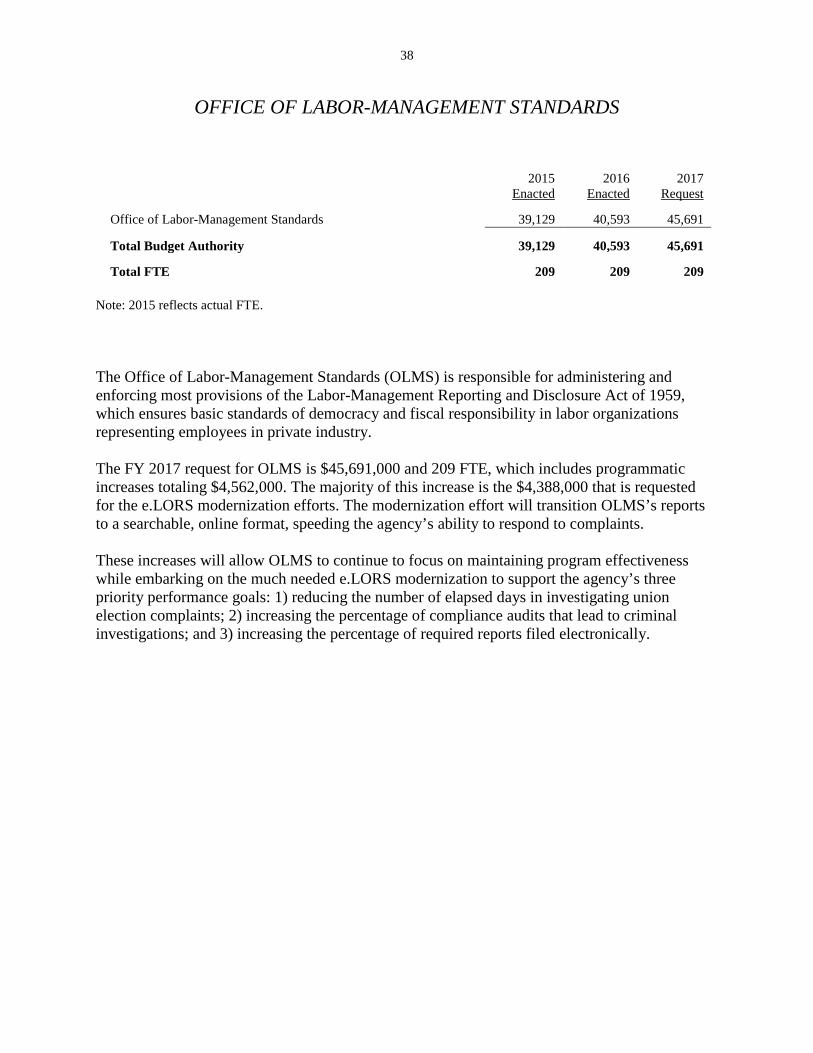
38
OFFICE OF LABOR-MANAGEMENT STANDARDS
2015
Enacted 2016
Enacted 2017
Request Office of Labor-Management Standards 39,129 40,593 45,691
Total Budget Authority 39,129 40,593 45,691 Total FTE 209 209 209
Note: 2015 reflects actual FTE. The Office of Labor-Management Standards (OLMS) is responsible for administering and enforcing most provisions of the Labor-Management Reporting and Disclosure Act of 1959, which ensures basic standards of democracy and fiscal responsibility in labor organizations representing employees in private industry. The FY 2017 request for OLMS is $45,691,000 and 209 FTE, which includes programmatic increases totaling $4,562,000. The majority of this increase is the $4,388,000 that is requested for the e.LORS modernization efforts. The modernization effort will transition OLMS’s reports to a searchable, online format, speeding the agency’s ability to respond to complaints. These increases will allow OLMS to continue to focus on maintaining program effectiveness while embarking on the much needed e.LORS modernization to support the agency’s three priority performance goals: 1) reducing the number of elapsed days in investigating union election complaints; 2) increasing the percentage of compliance audits that lead to criminal investigations; and 3) increasing the percentage of required reports filed electronically.

39
OFFICE OF WORKERS' COMPENSATION PROGRAMS
2015
Enacted 2016
Enacted 2017
Request Division of Federal Employees' Compensation 98,296 100,519 110,408 Division of Longshore and Harbor Workers' Compensation 12,527 12,805 13,574
General Funds 110,823 113,324 123,982 Division of Longshore and Harbor Workers' Compensation 2,177 2,177 2,177 Division of Coal Mine Workers' Compensation 30,889 32,847 38,246
Trust Funds 33,066 35,024 40,423 Total Federal Programs for Workers' Compensation Budget Authority 143,889 148,348 164,405 Total FTE 937 959 1,017
2015
Enacted
2016 Enacted
2017 Request
Special Benefits (FECA) 3,250,314 3,515,170 3,561,975 Energy Employees Occupational Illness Compensation Program 1,129,866 1,087,840 1,091,834 Special Benefits for Disabled Coal Miners 100,878 89,941 80,319 Black Lung Disability Trust Fund (BLDTF) 1,212,861 1,320,302 1,562,571 Special Workers’ Compensation Fund (Longshore) 125,096 132,265 131,071 Total Mandatory Budget Authority¹ 5,819,015
6,145,518
6,427,770
Total OWCP FTE2 1,541 1,575 1,633 ¹Mandatory accounts include both benefits and administrative costs. 2Includes FTE for Federal Programs for Workers’ Compensation Note: FY 2015 and FY 2016 reflect sequestration reductions for mandatory accounts pursuant to the Balanced Budget and Emergency Deficit Control Act, as amended. Note: 2015 reflects actual FTE.
The Office of Workers' Compensation Programs (OWCP) administers four benefit programs for workers who become ill or are injured on the job. These programs ensure income support for these workers when work is impossible or unavailable due to their injury or illness.
40
• The Federal Employees' Compensation Act (FECA) program provides benefits to civilian employees of the Federal Government injured at work and to certain other designated groups.
• The Longshore and Harbor Workers' Compensation Act (LHWCA) program provides benefits to injured private sector workers engaged in certain maritime and related employment, plus certain non-maritime employment covered by extensions such as the Defense Base Act.
• The Black Lung Benefits Act program provides compensation and medical benefits to totally disabled miners suffering from coal mine pneumoconiosis stemming from mine employment, and monetary benefits to their dependent survivors.
• The Energy Employees Occupational Illness Compensation Program Act (EEOICPA) provides compensation and medical benefits to employees or survivors of employees of the Department of Energy (DOE), contractors or subcontractors with DOE, who have cancer, chronic beryllium disease, beryllium sensitivity, or chronic silicosis due to exposure to radiation, beryllium, silica, or toxic substances stemming from work in the DOE nuclear weapons complex.
OWCP’s total resources displayed in the tables include general, trust, and special funds for benefit program compensation and administration. The appropriations managed by OWCP include the following:
• Salaries and Expenses (S&E), Federal Programs for Workers’ Compensation • Special Benefits • Energy Employees Occupational Illness Compensation Program (EEOICP) • Special Benefits for Disabled Coal Miners • Black Lung Disability Trust Fund • Special Workers’ Compensation Fund
OWCP program increases in FY 2017 include:
• $3,100,000 for VoiP/Interactive Voice Recognition (IVR) IT Initiative - The resources would facilitate OWCP’s ability to move onto the DOL adopted standard under the Digital Government Improvement Project (DGIP) initiative and ensure that no functionality is lost in transition. This includes moving all the OWCP phones to the new VoiP standard and then procuring the additional functionality needed to retain the current IVR functionality;
• $5,235,000 and 39 FTE for FECA Disability Management and Return to Work Initiative - The resources would enable the FECA program to enhance claims services to federal employees who suffer work-related injury and illness with resulting disability and time lost from work. The 39 FTE will leverage existing, recently developed, and new procedures and IT projects to provide timely medical treatment, early disability management interventions, vocational rehabilitation, and return-to-work support, all intended to prevent injury and illness from derailing a worker’s efforts to return to gainful employment;
• $1,500,000 and 14 FTE for Coal Miner Health Initiative - This proposal is an aggressive approach to confront an increase in claims, a decrease in qualified physicians, and limits

41
on access imposed by geographical location of the claimant population in proximity to the medical community. The 14 FTE will be utilized to recruit and train highly skilled 413(b) physicians, modernize medical bill authorization, treatment and payment systems and processes, and build and promote web-based communication portals to inform miners and authorized representatives of claimant and beneficiary status;
• $600,000 and 5 FTE for Black Lung Field Operations Support - The additional FTE would facilitate process improvement, enhancing the program’s ability to handle an increase in claims volume and claims processing time, which has increased from 219 days in 2012 to 271 days currently; and
• $1,000,000 for EEOICPA Industrial Hygienists Support - The funding would enable the Energy program to fund contracts with industrial hygienists to review a growing number of claims that require their expertise. Currently, the program has only two staff available to review these claims.
Sequestration of administrative funds for benefits not sequestered themselves has led to administrative shortfalls, and the budget proposes to restore these amounts for the following programs:
• $2,397,000 for resources in DCMWC to restore BLDTF funding sequestered in the FY 2016 Enacted Level;
• $361,000 for resources in SBDCM to restore funding sequestered in the FY 2016 Enacted Level;
• $5,445,000 for resources in EEOICPA Part B to restore funding sequestered in the FY 2016 Enacted Level; and
• $7,012,000 for resources in EEOICPA Part E to restore funding sequestered in the FY 2016 Enacted Level.

42
OCCUPATIONAL SAFETY AND HEALTH ADMINISTRATION
2015
Enacted 2016
Enacted 2017
Request Safety and Health Standards 20,000 20,000 23,173 Federal Enforcement 208,000 208,000 225,972 Whistleblower Programs 17,500 17,500 21,604 State Programs 100,850 100,850 104,337 Technical Support 24,469 24,469 25,404 Compliance Assistance-Federal 68,433 68,433 72,783 Compliance Assistance-State Consultations 57,775 57,775 59,775 Compliance Assistance-Training Grants 10,537 10,537 10,537 Safety and Health Statistics 34,250 34,250 40,095 Executive Direction 10,973 10,973 11,343
Total Budget Authority 552,787 552,787 595,023 Total FTE 2,132 2,173 2,273
Note: 2015 reflects actual FTE. The Occupational Safety and Health Administration (OSHA) ensures safe and healthful workplaces for the nation’s workers through a combination of enforcement, outreach and training, compliance assistance, and grants to states. OSHA, combined with its 28 State Plan partners, has approximately 2,200 inspectors responsible for the health and safety of 130 million workers, employed at 8 million worksites around the nation. Although workplace conditions today are much safer than when OSHA was created in 1971, over 4,400 workers are still killed in the workplace each year, millions are injured and tens of thousands continue to die from occupational illnesses. To reduce workplace injuries, illnesses, and fatalities, OSHA enforces statutory protections, provides technical support and assistance to small businesses, promulgates and enforces safety and health standards, strengthens the accuracy of safety and health statistics, and educates workers about the hazards they face and their rights under the law. The FY 2017 Budget provides $595,023,000 and 2,276 FTE for OSHA, including three FTE paid through reimbursable funding, an increase of $42,236,000 and 100 FTE over the FY 2016 Enacted level. Specifically, the FY 2017 request for OSHA includes the following programmatic increases:
• $5,150,000 and 23 FTE to enable the agency to implement Executive Order (EO) 13650, “Improving Chemical Facility Safety and Security,” and enhance safety and security at chemical facilities and prevent devastating accidents like the one in West, Texas. OSHA would use $2,450,000 to modernize OSHA’s Process Safety Management (PSM)
43
Standard and other chemical-related standards. The remaining $2,700,000 would be used to hire compliance officers to perform PSM inspections of chemical facilities.
• $6,700,000 and 40 FTE to support the implementation of the Rapid Response Investigation protocols to manage the workload resulting from the enhanced reporting requirements in the 2014 revisions to the Recordkeeping Standard, which require employers to report work-related hospitalizations, amputations, and losses of an eye.
• $3,402,000 and 22 FTE to continue strengthening the whistleblower program, including 10 FTE for Whistleblower Investigators to address increased workload in FY 2016; seven FTE for Investigative Assistants to reduce the administrative burden on Whistleblower Investigators and supervisors, and improve case processing efficiency; and five FTE to handle training and program management activities including statistical analysis, IT development, and auditing functions.
• $3,487,000 to give State Plans the resources to enhance enforcement of the 11(c) whistleblower protection statute and to provide State Plan states with the resources to run programs that are as effective as OSHA’s Federal Enforcement.
• $1,500,000 and 10 FTE to restore 10 of the Compliance Assistance Specialists that were cut in the FY 2015 final appropriation and provide essential outreach to both employer and vulnerable worker communities about new and revised standards, key enforcement initiatives, and issues affecting high-hazard industries such as the oil and gas industry.
• $2,000,000 to enable Onsite Consultation Projects to hire and train staff to support OSHA’s Rapid Response Investigations required under its revised occupational injury and illness reporting regulations; to provide staff with process safety management training in support of EO 13650, Improving Chemical Facility Safety and Security; and to meet minimum staffing levels.
• $5,400,000 and five FTE for Information Technology (IT) and analytical enhancements. OSHA would use $3,000,000 to consolidate OSHA’s existing databases within DOL’s consolidated database center and support the replacement of antiquated IT systems and development of new IT applications. An additional $1,500,000 would be used to modernize injury and illness tracking. A request of $900,000 and five FTE would support a new data analytics unit.
OSHA’s FY 2017 budget request also includes a proposed amendment to its appropriation language to allow targeted inspections of small establishments that may have potential for catastrophic incidents (e.g., those with Process Safety Management or the EPA’s Risk Management Program-covered processes). The current appropriations language limits OSHA’s ability to conduct safety and health inspections of small businesses (10 or fewer employees) in industry codes that have lower-than-average workplace injury and illness rates. This language would not apply to farming, harvesting, or processing operations on farms.

44
MINE SAFETY AND HEALTH ADMINISTRATION
2015
Enacted 2016
Enacted 2017
Request Coal Mine Safety and Health 167,859 164,296 171,768 Metal and Nonmetal Mine Safety and Health 91,697 94,697 97,563 Office of Standards, Regulations, and Variances 5,416 5,416 6,197 Office of Assessments and Special Enforcement 6,976 7,089 8,277 Educational Policy and Development 36,320 36,320 40,419 Technical Support 33,791 34,241 35,041 Program Evaluation and Information Resources 17,990 17,990 21,815 Program Administration 15,838 15,838 16,292
Total Budget Authority 375,887 375,887 397,372 Total FTE 2,257 2,271 2,277
Note: 2015 reflects actual FTE. The Mine Safety and Health Administration (MSHA) protects the safety and health of miners in nearly 1,500 coal and 12,200 metal and nonmetal mines by enforcing current regulations, providing technical assistance and training, and developing improved regulations and programs to increase protections. MSHA develops and promulgates mandatory safety and health standards for the mining industry. MSHA assesses civil monetary penalties for violations, and collects and accounts for all penalties paid. MSHA also develops and coordinates mine safety and health education and training activities for the mining industry and provides classroom instruction at the National Mine Health and Safety Academy. The 2017 Budget requests $397,372,000 for MSHA, which includes programmatic increases totaling $16,607,000 and 6 FTE over the FY 2016 Enacted level. This request reflects MSHA’s strong commitment to both targeted enforcement and compliance assistance. The requested resources, summarized below, will strengthen MSHA’s programs and support a continued shift to priority activities such as enhanced enforcement, rulemaking, modernizing training, and improving information technology (IT). The agency’s top priority is completing its mandatory inspections under the Mine Act, which requires four inspections per year in underground mines and two inspections per year in surface mines, as well as enforcing all of its mandatory health and safety standards designed to improve safety and health for the nation’s miners. In support of these priorities, MSHA will strengthen its program efficiency and effectiveness through the requested resources.

45
• For Coal Mine Safety and Health, the request includes an increase of $2,100,000 to support implementation and enforcement of the Final Respirable Dust Rule, and $650,000 to provide additional funds to conduct more impact inspections during off-shift hours to ensure compliance.
• For Metal and Nonmetal Safety and Health, the request includes an increase of $350,000 to support enforcement activities in the U.S. Territories of American Samoa, Guam, and the Commonwealth of Northern Mariana Islands.
• For the Office of Standards, Regulations, and Variances, MSHA requests an increase of $600,000 to support increased regulatory activity.
• For the Office of Assessments and Special Enforcement, the request includes an increase of $1,000,000 and 6 FTE to improve the timeliness of special assessments and continue efforts to improve special investigations and accountability audits.
• For Educational Policy and Development, the request includes an increase of $3,441,000 to strengthen the delivery of training to MSHA and the mining industry. MSHA will expand its distance learning program to include additional online courses developed for use by MSHA’s entry-level and journeyman level inspector classes, as well as new online programs designed for the mining industry.
• For Program Evaluation and Information Resources, the request includes increases of $1,500,000 to provide enforcement application improvements to improve the quality of data analytics across the agency and continue enhancements to MSHA’s information technology systems to better support the enforcement functions. In addition, the request includes $2,000,000 for the replacement of the Inspector’s Portable Application Laptop system used by MSHA’s enforcement personnel.
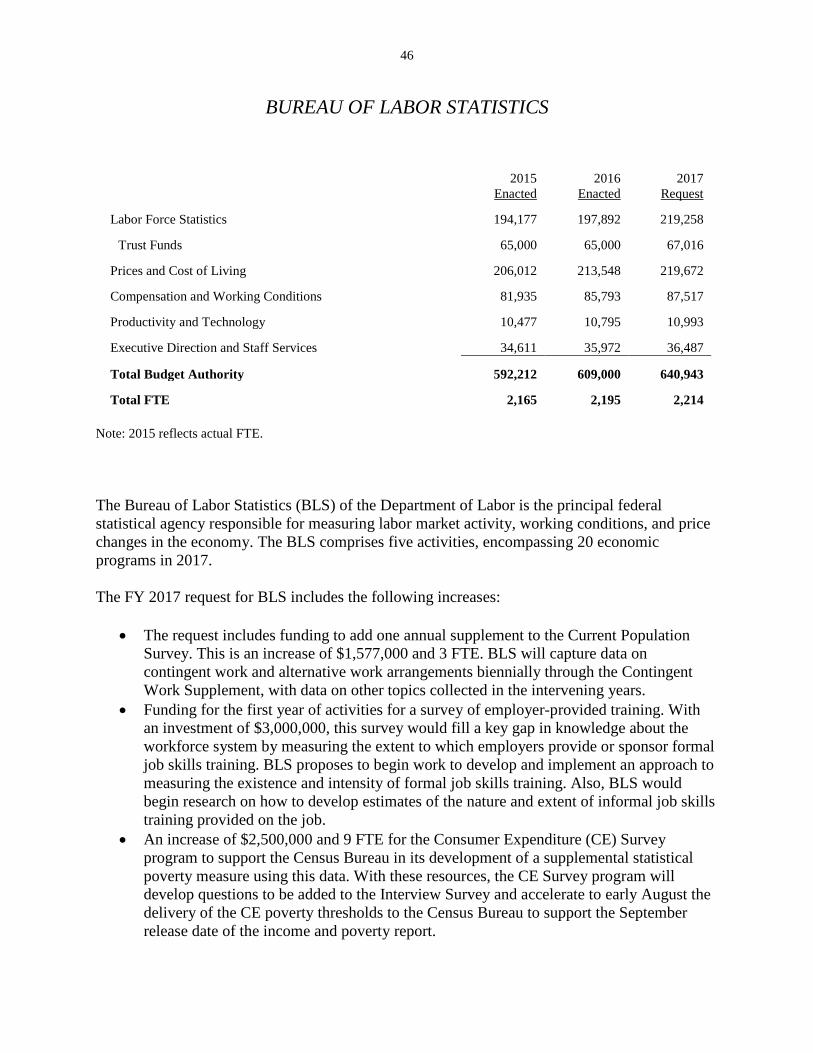
46
BUREAU OF LABOR STATISTICS
2015
Enacted 2016
Enacted 2017
Request Labor Force Statistics 194,177 197,892 219,258
Trust Funds 65,000 65,000 67,016 Prices and Cost of Living 206,012 213,548 219,672 Compensation and Working Conditions 81,935 85,793 87,517 Productivity and Technology 10,477 10,795 10,993 Executive Direction and Staff Services 34,611 35,972 36,487
Total Budget Authority 592,212 609,000 640,943 Total FTE 2,165 2,195 2,214
Note: 2015 reflects actual FTE. The Bureau of Labor Statistics (BLS) of the Department of Labor is the principal federal statistical agency responsible for measuring labor market activity, working conditions, and price changes in the economy. The BLS comprises five activities, encompassing 20 economic programs in 2017. The FY 2017 request for BLS includes the following increases:
• The request includes funding to add one annual supplement to the Current Population Survey. This is an increase of $1,577,000 and 3 FTE. BLS will capture data on contingent work and alternative work arrangements biennially through the Contingent Work Supplement, with data on other topics collected in the intervening years.
• Funding for the first year of activities for a survey of employer-provided training. With an investment of $3,000,000, this survey would fill a key gap in knowledge about the workforce system by measuring the extent to which employers provide or sponsor formal job skills training. BLS proposes to begin work to develop and implement an approach to measuring the existence and intensity of formal job skills training. Also, BLS would begin research on how to develop estimates of the nature and extent of informal job skills training provided on the job.
• An increase of $2,500,000 and 9 FTE for the Consumer Expenditure (CE) Survey program to support the Census Bureau in its development of a supplemental statistical poverty measure using this data. With these resources, the CE Survey program will develop questions to be added to the Interview Survey and accelerate to early August the delivery of the CE poverty thresholds to the Census Bureau to support the September release date of the income and poverty report.
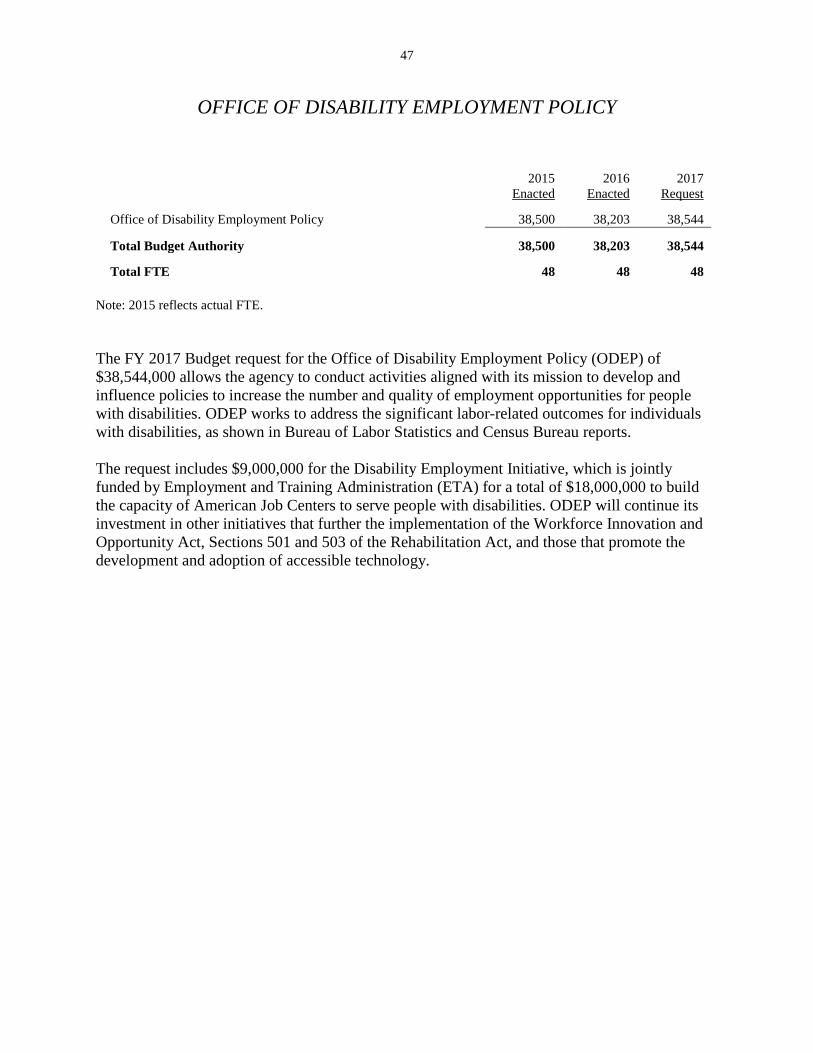
47
OFFICE OF DISABILITY EMPLOYMENT POLICY
2015
Enacted 2016
Enacted 2017
Request Office of Disability Employment Policy 38,500 38,203 38,544
Total Budget Authority 38,500 38,203 38,544 Total FTE 48 48 48
Note: 2015 reflects actual FTE. The FY 2017 Budget request for the Office of Disability Employment Policy (ODEP) of $38,544,000 allows the agency to conduct activities aligned with its mission to develop and influence policies to increase the number and quality of employment opportunities for people with disabilities. ODEP works to address the significant labor-related outcomes for individuals with disabilities, as shown in Bureau of Labor Statistics and Census Bureau reports. The request includes $9,000,000 for the Disability Employment Initiative, which is jointly funded by Employment and Training Administration (ETA) for a total of $18,000,000 to build the capacity of American Job Centers to serve people with disabilities. ODEP will continue its investment in other initiatives that further the implementation of the Workforce Innovation and Opportunity Act, Sections 501 and 503 of the Rehabilitation Act, and those that promote the development and adoption of accessible technology.

48
DEPARTMENTAL MANAGEMENT
2015 Enacted
2016 Enacted
2017 Request
Program Direction and Support 31,010 31,010 37,406 Legal Services 126,136 125,000 140,374
Trust Funds 308 308 310 International Labor Services 91,125 86,125 101,230 Administration and Management 28,413 28,413 36,604 Adjudication 29,420 32,000 36,325 Women's Bureau 11,536 11,536 12,902 Civil Rights 6,880 6,880 8,041 Chief Financial Officer 5,061 5,061 5,233 Departmental Program Evaluation 8,040 8,040 9,500
Subtotal Departmental Management 337,929 334,373 387,925 Departmental Management, Legal Services, BLDTF 7,343 7,504 8,123 Departmental Management, Adjudication, BLDTF 20,841 20,716 22,471
Total Budget Authority 366,113 362,593 418,519 Total FTE 1,345 1,385 1,534
Note: 2015 reflects actual FTE. Note: FY 2015 and FY 2016 reflect sequestration reductions for mandatory accounts pursuant to the Balanced Budget and Emergency Deficit Control Act, as amended.
The Program Direction and Support (PDS) activity encompasses the Office of the Secretary of Labor, Office of the Deputy Secretary of Labor, Office of the Assistant Secretary for Policy (ASP), Office of Congressional and Intergovernmental Affairs, Office of Public Affairs, Center for Faith-Based and Neighborhood Partnerships, and the Office of Public Engagement. ASP includes the funding for the staff that work for the Chief Evaluation Office. The FY 2017 Budget requests $37,406,000 and 161 FTE for PDS.
The FY 2017, the PDS budget activity includes five program increases: • An increase of $160,000 and 1 FTE will create needed additional capacity to conduct
both implementation and impact evaluations of the new Workforce Innovation and Opportunity Act (WIOA). It is critical that we continue to be on the cutting edge of evaluation. An additional staff member in the Chief Evaluation Office will coordinate with ETA to evaluate these changes.
49
• The increase of $659,000 and 5 FTE will fund the technical assistance activities of the proposed joint DOL and Department of Education data team, providing program evaluation for workforce training. This will serve as the central point of contact to resolve and provide technical assistance on issues related to education and wage data standardization, access, collection and data quality, and data use for evaluations and programs.
• An increase of $500,000 and 3 FTE will create additional capacity for ETA and states to implement Training Provider Scorecards in a way that integrates public and private sector labor market data to support better individual decision-making about training.
• An increase of $2,620,000 and 15 FTE will support implementation of the Fair Pay and Safe Workplaces Executive Order. This will facilitate cross-agency sharing of enforcement data and information to improve the targeting of enforcement and compliance assistance efforts.
• The increase of $1,000,000 and 1 FTE will provide resources for the creation of an Idea Lab, modeled after innovation labs across the Federal government and the private sector. This investment will provide the resources for employees to develop new ideas, test them, and implement them at scale.
The Office of the Solicitor (SOL) is the legal enforcement and support arm of the Department of Labor. Its mission is to meet the legal service demands of the entire Department, including providing the legal support necessary to enable the Secretary of Labor to further goals that support the President's strategic vision to improve opportunities and quality of life for the American people. The President's FY 2017 request for SOL is $148,497,000 and 705 FTE. This level of funding includes:
• $10,903,000 and 56 FTE to provide legal support and services to the Department's worker safety and protection efforts. 30 FTE of the increase will provide expert legal services to support the Department's Wage and Hour Division (WHD) investigators in accomplishing the Administration's objective of achieving greater compliance with the Fair Labor Standards Act and other worker protections enforced by WHD.
• $548,000 to restore sequestration in the Black Lung Disability Trust Fund, which will enable SOL to continue to provide a full range of legal services to the Office of Workers' Compensation Programs' (OWCP) Division of Coal Mine Workers' Compensation, including all litigation under the Black Lung Benefits Act.
The Bureau of International Labor Affairs (ILAB) supports the President's international labor agenda and coordinates the international activities for the Department of Labor. ILAB’s work improves workers’ rights and living standards generally and protects vulnerable workers, including women and children. ILAB also promotes compliance with the labor provisions of international trade agreements. In FY 2017, ILAB’s budget request is $101,230,000 and 126 FTE. Included in the request are resources to monitor and enforce labor provisions of free trade agreements, staff labor attachés in
50
high-priority countries, and expand the workers’ right grants portfolio. With these resources, ILAB will have the tools necessary to support and monitor how partner countries implement these labor provisions and to initiate enforcement mechanisms, as necessary, to improve compliance.
The Office of the Assistant Secretary for Administration and Management (OASAM) supports key aspects of Department-wide administration and management. OASAM provides the infrastructure and support that enables DOL to carry out its mission by providing leadership and support for the Department via the following management disciplines: Business Operations, Procurement, Budget and Performance Integration, Information Technology, Human Resources, Civil Rights, Security and Emergency Management, and Strategic Planning. The FY 2017 request for OASAM is $36,604,000 and 140 FTE. The program increases requested in OASAM include:
• $2,020,000 and 11 FTE to provide leadership and oversight for the Department’s continuing IT modernization efforts. The increase works in conjunction with base resources in IT Modernization and in the Working Capital Fund to continue the integration efforts and support the standing up of a unified, 21st Century Departmental IT infrastructure.
• An increase of $640,000 and 4 FTE will support the Department’s efforts in the area of oversight of contractors and grantees, particularly around suspension and debarment. Suspension and debarment are critical tools in that oversight process. Under these processes, the Department can either provisionally or for a set period of time exclude an entity from the procurement process. The Department’s current resources are not adequate to address serious violations by contractors. The Department has identified and implemented management changes to increase the effectiveness of this program, but without additional capacity, will not be able to sustainably address serious violations.
• This request of $2,200,000 and 11 FTE will ensure the effectiveness of the Department’s digital services for the various high-priority programs, ongoing and requested in FY 2017.
Agencies in Adjudication render timely decisions on appeals of claims filed before four different components which include the Office of Administrative Law Judges (OALJ), the Administrative Review Board (ARB), the Benefits Review Board (BRB), and the Employees' Compensation Appeals Board (ECAB). The FY 2017 request of $59,020,000 and 292 FTE for Adjudication includes:
• $2,684,000 and 21 FTE to reduce the projected increase in PERM cases in OALJ. • $1,511,000 to restore sequestration in the Black Lung Disability Trust Fund for both
OALJ and the BRB’s work in this area.
The Women’s Bureau is the only Federal office exclusively concerned with serving and promoting the interests of women in the workforce. The Bureau conducts research, projects,

51
outreach, and evaluations on issues of importance to working women, and provides information about women in the labor force to stakeholders and customers. The FY 2017 Budget request for the Bureau is $12,902,000 and 52 FTE. It includes a $1,000,000 increase to expand the Bureau’s successful Paid Leave Grants Program. The Civil Rights Center (CRC) is responsible for ensuring nondiscrimination and equal opportunity for two primary populations: 1) employees of, and applicants for employment with, the Department; and 2) the more than 40 million individuals served by programs and activities across the nation that are related to labor and the work force and receive federal financial assistance from the Department. For FY 2017, the CRC budget request is $8,041,000 and 41 FTE. This includes $868,000 and 4 FTE for the Office of External Enforcement. Funding at this level will allow CRC to both carry out its core mission to promote justice and equal opportunity (by acting with impartiality and integrity in administering and enforcing various civil rights laws) and enable necessary changes in the infrastructure of OEE, which investigates and adjudicates discrimination complaints. The mission of the Office of the Chief Financial Officer (OCFO) is to foster effective stewardship of public funds, safeguard fiscal integrity through effective internal controls, and provide timely, accurate, and useful financial information to decision makers. The OCFO is responsible for oversight of all financial management activities in the Department. In FY 2017, the budget request for the Office of the Chief Financial Officer (OCFO) is $5,233,000 and 17 FTE. The Departmental Program Evaluation (DPE) activity is responsible for: (1) building evaluation capacity and expertise in the Department; (2) ensuring high standards in evaluations undertaken by, or funded by the Department of Labor; (3) ensuring the independence of the evaluation and research functions; and (4) making sure that evaluation and research findings are available and accessible in a timely and user-friendly way, so they inform policymakers, program managers, and the public.
For FY 2017, the Department requests $9,500,000 to pursue its evaluation agenda, an increase of $1,460,000 above the FY 2015 enacted level. The FY 2017 Budget also includes a request to increase the evaluation set-aside authority included in the General Provisions from 0.75 percent to 1 percent.

52
DOL IT MODERNIZATION
2015
Enacted 2016
Enacted 2017
Request Departmental Support Systems 4,898 4,898 4,898 IT Infrastructure Modernization 10,496 24,880 58,264
Total Budget Authority 15,394 29,778 63,162 The Department’s FY 2017 request includes $63,162,000 in the IT Modernization appropriation to consolidate and modernize the Department’s IT infrastructure, an increase of $33,384,000. These investments are vital to the Department’s efforts to improve data sharing and mobile computing for DOL employees, allowing the Department to provide better, faster, smarter service to the American public and ensure the security of its systems. The $33,384,000 program increase will provide resources for the deployment of Voice over Internet Protocol (VoIP) to provide unified messaging, call management, and other IT solutions to integrate voice and data capabilities throughout the Department. The request also includes funding for video teleconferencing and a wireless infrastructure to support the entire Department. These investments allow for elimination of duplicative costs across individual agency budgets while also improving user productivity and customer service. IT Modernization’s request includes a provision to extend the availability of funds to two years. This will provide helpful flexibility to support the Department in executing its multi-year modernization plan. The General Provisions includes a proposal to provide resources for IT modernization purposes. The proposal will provide set-aside authority for IT investments at 0.5 percent of the limited list of appropriations and provide two-year availability of those funds. This provision is not intended to enable the Department to increase the amount of money spent on IT overall, but rather to transfer resources that would have been spent on IT at the agency level to the OCIO to achieve economies of scale and ensure consistency and interoperability. The authority and extension of availability will also improve oversight of complex IT projects.

53
VETERANS' EMPLOYMENT AND TRAINING SERVICE
2015
Enacted 2016
Enacted 2017
Request State Grants 175,000 175,000 175,000 Transition Assistance Program 14,000 14,100 14,600 Homeless Veterans' Reintegration Program 38,109 38,109 50,000 National Veterans' Employment and Training Service Institute 3,414 3,414 3,414 Federal Administration - USERRA Enforcement 39,458 40,487 42,506
Total Budget Authority 269,981 271,110 285,520 Total FTE 229 230 230
Note: 2015 reflects actual FTE. The Veterans’ Employment and Training Service (VETS) serves America’s veterans and separating servicemembers by preparing them for meaningful careers, providing them with employment resources and expertise, protecting their employment rights, and promoting their employment opportunities. VETS’ mission reflects the nation’s responsibility to meet the employment, training and job security needs of Americans who served in uniform. VETS helps veterans obtain positive employment outcomes primarily through services provided at American Job Centers, where grants are provided to State Workforce Agencies (SWA) to fund staff dedicated to serving those veterans most in need. Specifically, staff perform two vital functions that facilitate veterans’ transition into the civilian workforce: 1) direct services to address veterans’ significant barriers to employment, and 2) outreach to local businesses and employers to advocate for veteran employment. The FY 2017 request addresses the employment needs of veterans, improves employment services for their families, focuses resources on veterans with disabilities or other significant barriers to employment, and provides improved re-employment services that enable individuals newly separated from the military to successfully transition into civilian careers. The Budget includes $14,600,000 to ensure that our Transition Assistance Program (TAP) DOL Employment Workshop meets the estimated demand of our nation’s transitioning servicemembers. The TAP Employment Workshops at military installations facilitate servicemembers’ and their spouses’ initial transition from military service to the civilian workplace. TAP Employment Workshops consist of a comprehensive three-day course at military installations nationwide, and at select military installations overseas. Professionally-trained workshop facilitators are contracted by the Department of Labor to deliver the workshops.
Additionally, in FY 2017, a mobile application of the TAP curriculum will be deployed, which will allow DOL to make more cost effective updates to the DOL Employment Workshops participant material, and result in cost savings over printing, storage, and distribution of printed
54
material. This will provide a modern method of delivering the curricula to transitioning servicemembers and allow them to access specific modules through their transition.
The budget request of $175,000,000 for State Grants maintains the FY 2016 funding level. DOL will continue to emphasize DVOP specialists providing intensive services to veterans with significant barriers to employment. Additionally, Disabled Veterans' Outreach Program (DVOP) specialists will continue to serve additional populations outlined in the FY 2014 appropriation language, including transitioning servicemembers identified as needing intensive services, wounded warriors in military treatment facilities, and their spouses and family caregivers.
Other VETS employment and training activities are below.
• The Homeless Veterans' Reintegration Program (HVRP) is a nationwide Federal program that provides comprehensive services to transition homeless veterans into jobs. The FY 2017 budget requests $50,000,000, an increase of $11,891,000 above the FY 2016 funding level, to bring the program to its full authorized level. With this additional funding, HVRP can increase program enrollment from approximately 17,000 participants to over 22,000 participants, supporting the President's initiative to end homelessness among veterans.
• Τhe National Veterans’ Employment and Training Service Institute (NVTI) was established in 1986. The purpose of NVTI is to ensure high quality services for veterans by providing training and educational resources to service providers. NVTI is currently administered by VETS staff through a contract with the University of Colorado at Denver. The FY 2017 budget requests $3,414,000 for the NVTI and will continue to provide competency-based training to DVOP specialists, Local Veterans' Employment Representative (LVER) staff, other State Workforce Agency staff, and federal staff.
• VETS protects the employment and reemployment rights of veterans and members of the National Guard and Reserve Forces under the provisions of the Uniformed Services Employment and Reemployment Rights Act (USERRA). This law ensures that active duty service does not affect servicemembers’ employment status. VETS also provides outreach and enforcement of the Veterans’ Preference rights of eligible individuals. Funds appropriated under Federal Administration support this work, in addition to conducting oversight and administration of all VETS grant programs.
• The FY 2017 request for Federal Administration is $42,506,000, an increase of $2,019,000 over FY 2016. This increase includes a program increase of $1,000,000 to launch a long-term interagency data warehouse system.

55
OFFICE OF THE INSPECTOR GENERAL
2015
Enacted 2016
Enacted 2017
Request OIG Program Activity 76,000 80,640 88,881
Trust Funds 5,590 5,660 5,660
Subtotal Office of Inspector General 81,590 86,300 94,541 OIG BLDTF 303 305 330
Total Budget Authority 81,893 86,605 94,871 Total FTE 367 373 378
Note: 2015 reflects actual FTE. Note: FY 2015 and FY 2016 figures reflect sequestration reductions to mandatory accounts pursuant to the Balanced Budget and Emergency Deficit Control Act, as amended.
The Office of Inspector General (OIG) is an independent agency within the Department of Labor and was created by the Inspector General Act of 1978. The OIG is responsible for conducting audits and investigations of DOL programs and operations; identifying actual and potential problems or abuses; developing and making recommendations for corrective action; and informing the Secretary and the Congress of problems or concerns. The OIG is also responsible for carrying out a criminal investigations program to eliminate the influence of organized crime and labor racketeering on employee benefit plans, labor-management relations, and internal union affairs.
In FY 2017, the OIG requests $94,868,000 and 378 FTE. At this funding level, the OIG would be able to restore needed audit and investigative oversight, which were reduced as a result of reduced funding levels in previous years. In addition, at this funding level, OIG will increase coverage of important DOL programs and operations. This funding level includes $1,100,000 and 5 FTE to conduct additional audits and investigations involving Job Corps Center safety, outreach, and fraud awareness. This funding also includes $660,000 for the OIG’s Investigative Case Management System.

56
WORKING CAPITAL FUND
2015
Enacted 2016
Enacted 2017
Request Financial and Administrative Services 200,777 194,046 205,255 Field Services 40,838 40,199 40,714 Human Resources 33,000 33,268 33,489 Telecommunications 32,390 32,390 32,390 Non-DOL Reimbursables 9,084 1,500 1,500
Total Budget Authority 316,089 301,403 313,348 Total FTE 696 719 721
Note: 2015 reflects actual FTE. The Working Capital Fund (WCF) provides resources for the Department’s centralized administrative services. The service providers support each of the diverse strategic goals and objectives in the DOL Strategic Plan and enable agencies to focus on their core missions. The FY 2017 Budget request for the Working Capital Fund is $313,348,000 and 721 FTE. The Department requests $10,000,000 for the transition of the Department’s financial management system to the Department of Transportation’s shared service provider. Once completed, the Department will realize cost savings because DOL would then share costs with other agencies serviced by DOT. The request also includes an investment of $560,000 and 2 FTE to address potential risks from insider security threats. The General Provisions include a proposal for the establishment of a non-recurring expenses fund, similar to that at other Departments. This authority will allow the Department to transfer expired discretionary funds before cancellation to a fund which will be used for capital acquisition, including information technology infrastructure.
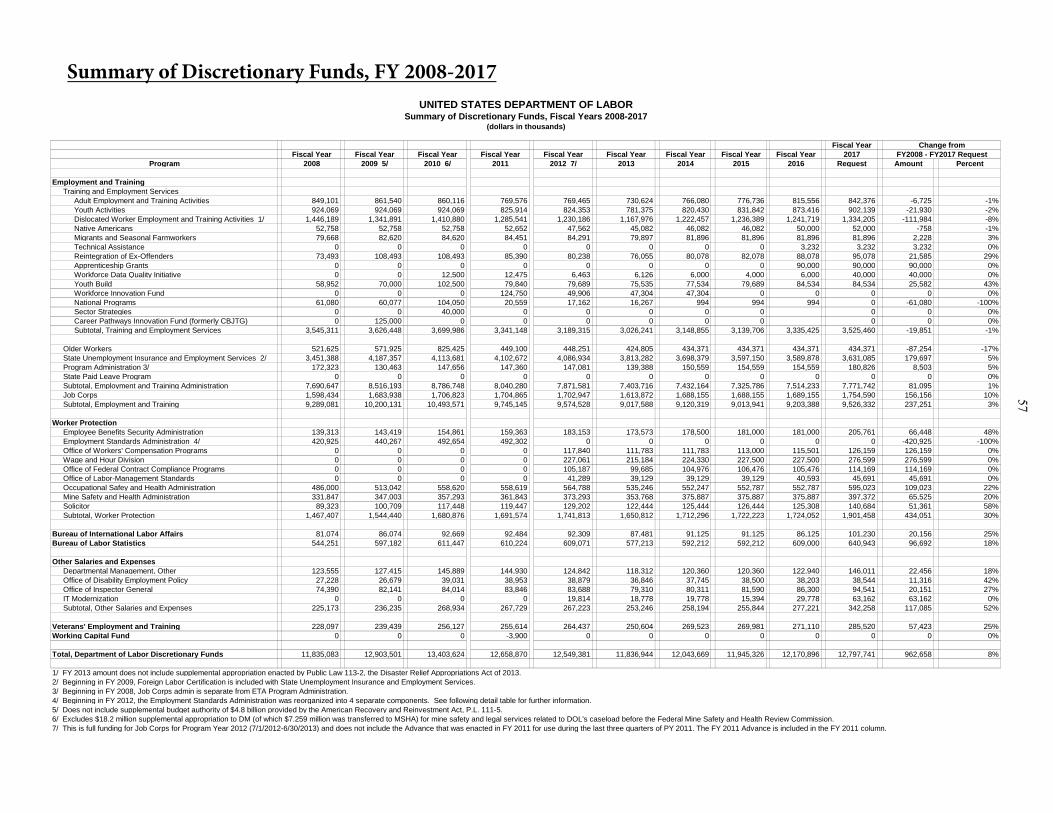
Fiscal YearFiscal Year Fiscal Year Fiscal Year Fiscal Year Fiscal Year Fiscal Year Fiscal Year Fiscal Year Fiscal Year 2017
Program 2008 2009 5/ 2010 6/ 2011 2012 7/ 2013 2014 2015 2016 Request Amount Percent
Employment and TrainingTraining and Employment Services
Adult Employment and Training Activities 849,101 861,540 860,116 769,576 769,465 730,624 766,080 776,736 815,556 842,376 -6,725 -1%Youth Activities 924,069 924,069 924,069 825,914 824,353 781,375 820,430 831,842 873,416 902,139 -21,930 -2%Dislocated Worker Employment and Training Activities 1/ 1,446,189 1,341,891 1,410,880 1,285,541 1,230,186 1,167,976 1,222,457 1,236,389 1,241,719 1,334,205 -111,984 -8%Native Americans 52,758 52,758 52,758 52,652 47,562 45,082 46,082 46,082 50,000 52,000 -758 -1%Migrants and Seasonal Farmworkers 79,668 82,620 84,620 84,451 84,291 79,897 81,896 81,896 81,896 81,896 2,228 3%Technical Assistance 0 0 0 0 0 0 0 0 3,232 3,232 3,232 0%Reintegration of Ex-Offenders 73,493 108,493 108,493 85,390 80,238 76,055 80,078 82,078 88,078 95,078 21,585 29%Apprenticeship Grants 0 0 0 0 0 0 0 0 90,000 90,000 90,000 0%Workforce Data Quality Initiative 0 0 12,500 12,475 6,463 6,126 6,000 4,000 6,000 40,000 40,000 0%Youth Build 58,952 70,000 102,500 79,840 79,689 75,535 77,534 79,689 84,534 84,534 25,582 43%Workforce Innovation Fund 0 0 0 124,750 49,906 47,304 47,304 0 0 0 0 0%National Programs 61,080 60,077 104,050 20,559 17,162 16,267 994 994 994 0 -61,080 -100%Sector Strategies 0 0 40,000 0 0 0 0 0 0 0 0%Career Pathways Innovation Fund (formerly CBJTG) 0 125,000 0 0 0 0 0 0 0 0 0%Subtotal, Training and Employment Services 3,545,311 3,626,448 3,699,986 3,341,148 3,189,315 3,026,241 3,148,855 3,139,706 3,335,425 3,525,460 -19,851 -1%
Older Workers 521,625 571,925 825,425 449,100 448,251 424,805 434,371 434,371 434,371 434,371 -87,254 -17%State Unemployment Insurance and Employment Services 2/ 3,451,388 4,187,357 4,113,681 4,102,672 4,086,934 3,813,282 3,698,379 3,597,150 3,589,878 3,631,085 179,697 5%Program Administration 3/ 172,323 130,463 147,656 147,360 147,081 139,388 150,559 154,559 154,559 180,826 8,503 5%State Paid Leave Program 0 0 0 0 0 0 0 0 0 0 0 0%Subtotal, Employment and Training Administration 7,690,647 8,516,193 8,786,748 8,040,280 7,871,581 7,403,716 7,432,164 7,325,786 7,514,233 7,771,742 81,095 1%Job Corps 1,598,434 1,683,938 1,706,823 1,704,865 1,702,947 1,613,872 1,688,155 1,688,155 1,689,155 1,754,590 156,156 10%Subtotal, Employment and Training 9,289,081 10,200,131 10,493,571 9,745,145 9,574,528 9,017,588 9,120,319 9,013,941 9,203,388 9,526,332 237,251 3%
Worker ProtectionEmployee Benefits Security Administration 139,313 143,419 154,861 159,363 183,153 173,573 178,500 181,000 181,000 205,761 66,448 48%Employment Standards Administration 4/ 420,925 440,267 492,654 492,302 0 0 0 0 0 0 -420,925 -100%Office of Workers' Compensation Programs 0 0 0 0 117,840 111,783 111,783 113,000 115,501 126,159 126,159 0%Wage and Hour Division 0 0 0 0 227,061 215,184 224,330 227,500 227,500 276,599 276,599 0%Office of Federal Contract Compliance Programs 0 0 0 0 105,187 99,685 104,976 106,476 105,476 114,169 114,169 0%Office of Labor-Management Standards 0 0 0 0 41,289 39,129 39,129 39,129 40,593 45,691 45,691 0%Occupational Safey and Health Administration 486,000 513,042 558,620 558,619 564,788 535,246 552,247 552,787 552,787 595,023 109,023 22%Mine Safety and Health Administration 331,847 347,003 357,293 361,843 373,293 353,768 375,887 375,887 375,887 397,372 65,525 20%Solicitor 89,323 100,709 117,448 119,447 129,202 122,444 125,444 126,444 125,308 140,684 51,361 58%Subtotal, Worker Protection 1,467,407 1,544,440 1,680,876 1,691,574 1,741,813 1,650,812 1,712,296 1,722,223 1,724,052 1,901,458 434,051 30%
Bureau of International Labor Affairs 81,074 86,074 92,669 92,484 92,309 87,481 91,125 91,125 86,125 101,230 20,156 25%Bureau of Labor Statistics 544,251 597,182 611,447 610,224 609,071 577,213 592,212 592,212 609,000 640,943 96,692 18%
Other Salaries and ExpensesDepartmental Management, Other 123,555 127,415 145,889 144,930 124,842 118,312 120,360 120,360 122,940 146,011 22,456 18%Office of Disability Employment Policy 27,228 26,679 39,031 38,953 38,879 36,846 37,745 38,500 38,203 38,544 11,316 42%Office of Inspector General 74,390 82,141 84,014 83,846 83,688 79,310 80,311 81,590 86,300 94,541 20,151 27%IT Modernization 0 0 0 0 19,814 18,778 19,778 15,394 29,778 63,162 63,162 0%Subtotal, Other Salaries and Expenses 225,173 236,235 268,934 267,729 267,223 253,246 258,194 255,844 277,221 342,258 117,085 52%
Veterans' Employment and Training 228,097 239,439 256,127 255,614 264,437 250,604 269,523 269,981 271,110 285,520 57,423 25%Working Capital Fund 0 0 0 -3,900 0 0 0 0 0 0 0 0%
Total, Department of Labor Discretionary Funds 11,835,083 12,903,501 13,403,624 12,658,870 12,549,381 11,836,944 12,043,669 11,945,326 12,170,896 12,797,741 962,658 8%
1/ FY 2013 amount does not include supplemental appropriation enacted by Public Law 113-2, the Disaster Relief Appropriations Act of 2013.2/ Beginning in FY 2009, Foreign Labor Certification is included with State Unemployment Insurance and Employment Services.3/ Beginning in FY 2008, Job Corps admin is separate from ETA Program Administration.4/ Beginning in FY 2012, the Employment Standards Administration was reorganized into 4 separate components. See following detail table for further information.5/ Does not include supplemental budget authority of $4.8 billion provided by the American Recovery and Reinvestment Act, P.L. 111-5.6/ Excludes $18.2 million supplemental appropriation to DM (of which $7.259 million was transferred to MSHA) for mine safety and legal services related to DOL's caseload before the Federal Mine Safety and Health Review Commission.7/ This is full funding for Job Corps for Program Year 2012 (7/1/2012-6/30/2013) and does not include the Advance that was enacted in FY 2011 for use during the last three quarters of PY 2011. The FY 2011 Advance is included in the FY 2011 column.
UNITED STATES DEPARTMENT OF LABORSummary of Discretionary Funds, Fiscal Years 2008-2017
(dollars in thousands)
Change fromFY2008 - FY2017 Request
Summary of Discretionary Funds, FY 2008-2017
57

United States Department of LaborFY 2017 President's Budget
(dollars in thousands)
FY 2017President's FY 2017
Category FY 2015 FY 2016 Request ProposedOffice, Account, Program and Activity Code Enacted Enacted Current Law Legislation Amount Percent
EMPLOYMENT AND TRAINING ADMINISTRATION
Training and Employment Services:1. Grants to States:
(a) Adult Employment and Training ActivitiesCurrent year appropriation D 64,736 103,556 130,376 - 26,820 26%Advance for succeeding fiscal year D 712,000 712,000 712,000 - - 0%Subtotal 776,736 815,556 842,376 - 26,820 3%
(b) Youth Employment and Training Activities D 831,842 873,416 902,139 - 28,723 3%
(c) Dislocated Worker Employment and Training ActivitiesCurrent year appropriation D 155,530 160,860 243,346 - 82,486 51%Advance for succeeding fiscal year D 860,000 860,000 860,000 - - 0%Subtotal 1,015,530 1,020,860 1,103,346 - 82,486 8%
Subtotal, Grants to States 2,624,108 2,709,832 2,847,861 - 138,029 5%Current year appropriation 1,052,108 1,137,832 1,275,861 - 138,029 12%Advance for succeeding fiscal year 1,572,000 1,572,000 1,572,000 - - 0%
2. National Programs:(a) Dislocated Worker Assistance National Reserve:
Current year appropriation D 20,859 20,859 30,859 - 10,000 48%Advance for succeeding fiscal year D 200,000 200,000 200,000 - - 0%Subtotal, Dislocated Worker Assistance National Reserve 220,859 220,859 230,859 - 10,000 5%
(b) Native Americans D 46,082 50,000 52,000 - 2,000 4%(c) Migrant and Seasonal Farmworkers D 81,896 81,896 81,896 - - 0%(d) Technical Assistance D - 3,232 3,232 - - 0%(e) Reintegration of Ex-Offenders D 82,078 88,078 95,078 - 7,000 8%(f) Apprenticeship Grants D - 90,000 90,000 - - 0%(g) Workforce Data Quality Initiative D 4,000 6,000 40,000 - 34,000 567%(h) YouthBuild D 79,689 84,534 84,534 - - 0%(i) Women in Apprenticeship D 994 994 - - -994 -100%Subtotal, National Programs 515,598 625,593 677,599 - 52,006 8%Current year appropriation 315,598 425,593 477,599 - 52,006 12%Advance for succeeding fiscal year 200,000 200,000 200,000 - - 0%
3. Skills Training Grants (H-1B Fees) M 175,029 1/ 139,644 2/ 3/ 160,200 - 20,556 15%
Total Appropriation, Training and Employment Services 3,314,735 3,475,069 3,685,660 - 210,591 6%Mandatory 175,029 139,644 160,200 - 20,556 15%Discretionary 3,139,706 3,335,425 3,525,460 - 190,035 6%
Current year appropriation 1,367,706 1,563,425 1,753,460 - 190,035 12%Advance for succeeding fiscal year 1,772,000 1,772,000 1,772,000 - - 0%
1/ FY 2015 amount reflects end-of-year adjustments per sequestration order.2/ FY 2016 amount reflects current adjustments per sequestration order.3/ Reflects transfer from TES Skills Training Grants to SUIESO FLC H-1B Fees of $13,000.
FY 2017 President's Request
FY 2016 EnactedCurrent Law versus
All Purpose Table58

United States Department of LaborFY 2017 President's Budget
(dollars in thousands)
FY 2017President's FY 2017
Category FY 2015 FY 2016 Request ProposedOffice, Account, Program and Activity Code Enacted Enacted Current Law Legislation Amount Percent
FY 2017 President's Request
FY 2016 EnactedCurrent Law versus
EMPLOYMENT AND TRAINING ADMINISTRATION
Job Corps:1. Operations D 1,580,825 1,581,825 1,608,535 - 26,710 2%2. Construction, Rehabilitation, and Acquisition D 75,000 75,000 105,000 - 30,000 40%3. Administration D 32,330 32,330 41,055 - 8,725 27%
Total Appropriation, Job Corps 1,688,155 1,689,155 1,754,590 - 65,435 4%
Community Service Employment for Older Americans:
1. Community Service Employment for Older Americans D 434,371 434,371 434,371 - - 0%
Total Appropriation, Community Service Employment for Older Americans 434,371 434,371 434,371 - - 0%
Federal Unemployment Benefits and Allowances:1. Federal Unemployment Benefits and Allowances M 507,000 1/ 861,000 849,000 -12,000 -1%
Total Appropriation, Federal Unemployment Benefits and Allowances 507,000 861,000 849,000 - -12,000 -1%
State Unemployment Insurance and Employment Service Operations:1. Unemployment Trust Fund (UTF):
(a) UI Benefits M 32,405,000 32,606,000 32,230,000 - -376,000 -1%(b) UI Admin (Trust funds) D 3,868,336 3,854,763 3,895,540 - 40,777 1%(c) RESEA Benefits Savings M - - - -76,000 - 100%(d) UI Integrity M - - - -69,000 - 100%(e) UI Modernization M - - - 2,057,000 - 100%(f) EB Reform M - - - 741,000 - 100%(g) Short time compensation M - - - 177,000 - 100%Total, UTF 36,273,336 36,460,763 36,125,540 2,830,000 -335,223 -1%
2. Unemployment Compensation (UI):(a) State Operations (Trust funds) D 2,687,793 2,630,550 2,582,019 - -48,531 -2%(b) Missclassification (Trust funds) D 10,000 - 10,000 - 10,000 100%(c) Reemployment Services and Eligibility Assessments (Trust funds) D 80,000 115,000 150,900 35,900 31%(d) National Activities (Trust funds) D 12,892 14,547 15,247 - 700 5%(e) RESEA Cap Adjustments (Trust Funds) D - - 35,000 - 35,000 100%Subtotal, Unemployment Compensation 2,790,685 2,760,097 2,793,166 - -1,931 0%
1/ FY 2015 Amount reflects actual benefits used.
All Purpose Table59

United States Department of LaborFY 2017 President's Budget
(dollars in thousands)
FY 2017President's FY 2017
Category FY 2015 FY 2016 Request ProposedOffice, Account, Program and Activity Code Enacted Enacted Current Law Legislation Amount Percent
FY 2017 President's Request
FY 2016 EnactedCurrent Law versus
EMPLOYMENT AND TRAINING ADMINISTRATION
3. Employment Service:(a) Allotments to States
Federal Funds D 21,413 21,413 21,413 - - 0%Trust Funds D 642,771 658,587 658,587 - - 0%
Subtotal, Allotments to States 664,184 680,000 680,000 - - 0%(b) ES National Activities (Trust funds) D 19,818 19,818 19,818 - - 0%Subtotal, Employment Service 684,002 699,818 699,818 - - 0%
4. Foreign Labor Certification:(a) State Grants (Trust funds) D 14,282 14,282 14,282 - - 0%(b) Federal Administration (Trust funds) D 48,028 48,028 48,666 - 638 1%(c) Federal Administration (H-1B Fees) M 17,503 1/ 31,060 2/ 3/ 18,000 - -13,060 -42%(d) Federal Administration (PERM Fees, H-2A & H-2B Fees) M - - - 38,000 Subtotal, Foreign Labor Certification 79,813 93,370 80,948 38,000 -12,422 -13%
5. One-Stop Career Centers / Labor Market Information D 60,153 67,653 75,153 - 7,500 11%
Total Appropriation, State Unemployment Insurance and Employment Service Operations 36,019,653 36,226,938 35,879,085 2,868,000 -347,853 -1%Mandatory 32,422,503 32,637,060 32,248,000 2,868,000 -389,060 -1%Discretionary 3,597,150 3,589,878 3,631,085 - 41,207 1%
Federal Funds 81,566 89,066 96,566 - 7,500 8%Trust Funds 3,515,584 3,500,812 3,534,519 - 33,707 1%
Job Driven Training Proposals1. Job Driven Training Programs
(a) Apprenticeship Training M - - - 2,000,000 - 100%(b) 21st Century Training Compact M - - - 3,000,000 - 100%(c) Career Navigators M - - - 2,000,000 - 100%(d) Opening Doors for Youth M - - - 5,500,000
Total Appropriation, Job Driven Training Proposals - - - 12,500,000 - 100%
Payments to the UI Trust Fund:1. Payments to the Unemployment Insurance Trust Fund M 12,000 - - - - 100%
Total Appropriation, Payments to the UI Trust Fund 12,000 - - - - 100%
Short Time Compensation:1. Short Time Compensation M 28,000 1/ 1,000 - - -1,000 -100%
Total Appropriation, Short Time Compensation 28,000 1,000 - - -1,000 -100%
1/ FY 2015 amount reflects end-of-year adjustments per sequestration order.2/ FY 2016 amount reflects current adjustments per sequestration order.3/ Reflects transfer from TES Skills Training Grants to SUIESO FLC H-1B Fees of $13,000.
All Purpose Table60

United States Department of LaborFY 2017 President's Budget
(dollars in thousands)
FY 2017President's FY 2017
Category FY 2015 FY 2016 Request ProposedOffice, Account, Program and Activity Code Enacted Enacted Current Law Legislation Amount Percent
FY 2017 President's Request
FY 2016 EnactedCurrent Law versus
EMPLOYMENT AND TRAINING ADMINISTRATION
Federal Additional Unemployment Compensation, Recovery:1. Federal Additional Unemployment Compensation M - - - - - 100%
Total Appropriation, Federal Additional Unemployment Comp. Rec. - - - - - 100%
Advances to the UI and Other Trust Funds:1. Advances to the Unemployment Trust Fund (non-add) M 300,000 - - - - 100%
Total Appropriation, Advances to the UI and Other Trust Funds 300,000 - - - - 100%
Program Administration:1. Training and Employment D 60,074 60,074 76,331 - 16,257 27%
Trust Funds D 8,639 8,639 10,615 - 1,976 23%2. Workforce Security D 3,469 3,469 3,640 - 171 5%
Trust Funds D 39,264 39,264 39,821 - 557 1%3. Apprenticeship Training, Employer and Labor Services D 34,000 34,000 40,089 - 6,089 18%4. Executive Direction D 7,034 7,034 8,251 - 1,217 17%
Trust Funds D 2,079 2,079 2,079 - - 0%
Total Appropriation, Program Administration 154,559 154,559 180,826 - 26,267 17%Federal Funds 104,577 104,577 128,311 - 23,734 23%Trust Funds 49,982 49,982 52,515 - 2,533 5%
Workers Compensation:Total Appropriation, Workers Compensation D - - - - - 100%
Paid Leave Partnership Initiative:1. Grants M - - - 2,213,000 - 100%
Total Appropriation, Paid Leave Partnership Initiative - - - 2,213,000 - 100%
Advances to the Employment Security Administration Account of the Unemployment Trust Fund:1. Advances to the ESA Account of the Unemployment Trust Fund M - - - - - 100%
Total Appropriation, Advances to the ESA Account of the UI Trust Fund - - - - - 100%
Total Appropriation, Employment and Training Administration 42,158,473 42,842,092 42,783,532 17,581,000 -57,560 0%Mandatory 33,144,532 33,638,704 33,257,200 17,581,000 -380,504 -1%Discretionary 9,013,941 9,203,388 9,526,332 - 322,944 4%
Federal Funds 5,448,375 5,652,594 5,939,298 - 286,704 5%Current year appropriation 3,676,375 3,880,594 4,167,298 - 286,704 7%Advance for succeeding fiscal year 1,772,000 1,772,000 1,772,000 - - 0%
Trust Funds 3,565,566 3,550,794 3,587,034 - 36,240 1%
All Purpose Table61
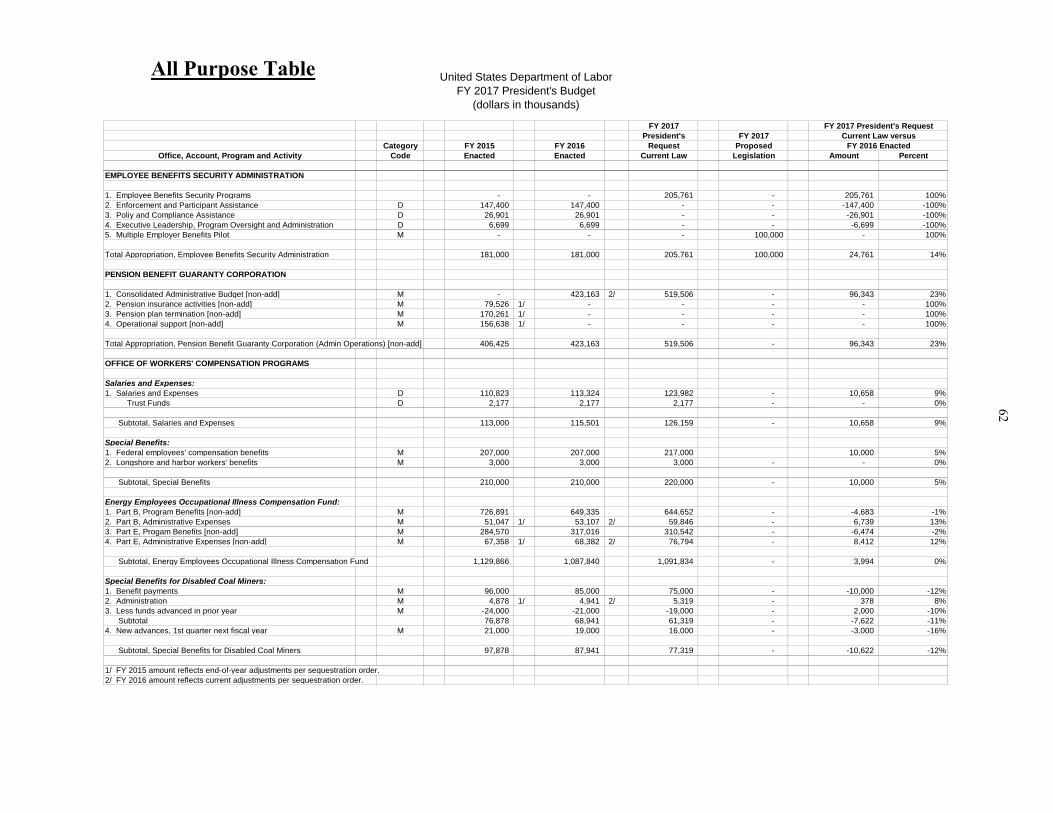
United States Department of LaborFY 2017 President's Budget
(dollars in thousands)
FY 2017President's FY 2017
Category FY 2015 FY 2016 Request ProposedOffice, Account, Program and Activity Code Enacted Enacted Current Law Legislation Amount Percent
FY 2017 President's Request
FY 2016 EnactedCurrent Law versus
EMPLOYEE BENEFITS SECURITY ADMINISTRATION
1. Employee Benefits Security Programs - - 205,761 - 205,761 100%2. Enforcement and Participant Assistance D 147,400 147,400 - - -147,400 -100%3. Poliy and Compliance Assistance D 26,901 26,901 - - -26,901 -100%4. Executive Leadership, Program Oversight and Administration D 6,699 6,699 - - -6,699 -100%5. Multiple Employer Benefits Pilot M - - - 100,000 - 100%
Total Appropriation, Employee Benefits Security Administration 181,000 181,000 205,761 100,000 24,761 14%
PENSION BENEFIT GUARANTY CORPORATION
1. Consolidated Administrative Budget [non-add] M - 423,163 2/ 519,506 - 96,343 23%2. Pension insurance activities [non-add] M 79,526 1/ - - - - 100%3. Pension plan termination [non-add] M 170,261 1/ - - - - 100%4. Operational support [non-add] M 156,638 1/ - - - - 100%
Total Appropriation, Pension Benefit Guaranty Corporation (Admin Operations) [non-add] 406,425 423,163 519,506 - 96,343 23%
OFFICE OF WORKERS' COMPENSATION PROGRAMS
Salaries and Expenses:1. Salaries and Expenses D 110,823 113,324 123,982 - 10,658 9%
Trust Funds D 2,177 2,177 2,177 - - 0%
Subtotal, Salaries and Expenses 113,000 115,501 126,159 - 10,658 9%
Special Benefits:1. Federal employees' compensation benefits M 207,000 207,000 217,000 10,000 5%2. Longshore and harbor workers' benefits M 3,000 3,000 3,000 - - 0%
Subtotal, Special Benefits 210,000 210,000 220,000 - 10,000 5%
Energy Employees Occupational Illness Compensation Fund:1. Part B, Program Benefits [non-add] M 726,891 649,335 644,652 - -4,683 -1%2. Part B, Administrative Expenses M 51,047 1/ 53,107 2/ 59,846 - 6,739 13%3. Part E, Progam Benefits [non-add] M 284,570 317,016 310,542 - -6,474 -2%4. Part E, Administrative Expenses [non-add] M 67,358 1/ 68,382 2/ 76,794 - 8,412 12%
Subtotal, Energy Employees Occupational Illness Compensation Fund 1,129,866 1,087,840 1,091,834 - 3,994 0%
Special Benefits for Disabled Coal Miners:1. Benefit payments M 96,000 85,000 75,000 - -10,000 -12%2. Administration M 4,878 1/ 4,941 2/ 5,319 - 378 8%3. Less funds advanced in prior year M -24,000 -21,000 -19,000 - 2,000 -10% Subtotal 76,878 68,941 61,319 - -7,622 -11%4. New advances, 1st quarter next fiscal year M 21,000 19,000 16,000 - -3,000 -16%
Subtotal, Special Benefits for Disabled Coal Miners 97,878 87,941 77,319 - -10,622 -12%
1/ FY 2015 amount reflects end-of-year adjustments per sequestration order.2/ FY 2016 amount reflects current adjustments per sequestration order.
All Purpose Table62

United States Department of LaborFY 2017 President's Budget
(dollars in thousands)
FY 2017President's FY 2017
Category FY 2015 FY 2016 Request ProposedOffice, Account, Program and Activity Code Enacted Enacted Current Law Legislation Amount Percent
FY 2017 President's Request
FY 2016 EnactedCurrent Law versus
OFFICE OF WORKERS' COMPENSATION PROGRAMS
Panama Canal Commission: M - - - - - 100%
Black Lung Disability Trust Fund:1. Benefit payments and interest on advances M 261,386 277,385 302,115 - 24,730 9%2. Office of Workers' Compensation, Salaries and expenses M 30,889 1/ 32,847 2/ 38,246 - 5,399 16%3. Departmental Management, Legal Services Salaries and expenses M 7,343 1/ 7,504 2/ 8,123 - 619 8%4. Departmental Management, Adjudication Salaries and expenses M 20,841 1/ 20,716 2/ 22,471 - 1,755 8%5. Departmental Management, Inspector General M 303 1/ 305 2/ 330 - 25 8% Subtotal 320,762 338,757 371,285 - 32,528 10%6. Treasury Department, Administrative Costs M 330 1/ 332 2/ 356 - 24 7%
Subtotal Appropriation, Black Lung Disability Trust Fund 321,092 339,089 371,641 - 32,552 10%
Special Workers' Compensation: M 115,448 147,000 147,000 - - 0%
Total Appropriation, Office of Workers' Compensation 1,987,284 1,987,371 2,033,953 - 46,582 2%Mandatory 1,874,284 1,871,870 1,907,794 - 35,924 2%Discretionary 113,000 115,501 126,159 - 10,658 9%
Federal Funds 110,823 113,324 123,982 - 10,658 9%Trust Funds 2,177 2,177 2,177 - - 0%
WAGE AND HOUR DIVISION
1. Salaries and Expenses D 227,500 227,500 276,599 - 49,099 22%2. H-2B M - - - - - 100%3. H-1B M 47,557 1/ 48,000 2/ 48,000 - - 0%
Total Appropriation, Wage and Hour Division 275,057 275,500 324,599 - 49,099 18%Mandatory 47,557 48,000 48,000 - - 0%Discretionary 227,500 227,500 276,599 - 49,099 22%
OFFICE OF FEDERAL CONTRACT COMPLIANCE PROGRAMS
1. Salaries and Expenses D 106,476 105,476 114,169 - 8,693 8%
OFFICE OF LABOR-MANAGEMENT STANDARDS
1. Salaries and Expenses D 39,129 40,593 45,691 - 5,098 13%
1/ FY 2015 amount reflects end-of-year adjustments per sequestration order.2/ FY 2016 amount reflects current adjustments per sequestration order.
All Purpose Table63

United States Department of LaborFY 2017 President's Budget
(dollars in thousands)
FY 2017President's FY 2017
Category FY 2015 FY 2016 Request ProposedOffice, Account, Program and Activity Code Enacted Enacted Current Law Legislation Amount Percent
FY 2017 President's Request
FY 2016 EnactedCurrent Law versus
OCCUPATIONAL SAFETY AND HEALTH ADMINISTRATION
1. Safety and Health Standards D 20,000 20,000 23,173 - 3,173 16%2. Federal Enforcement D 208,000 208,000 225,972 - 17,972 9%3. Whistleblower Protection Programs D 17,500 17,500 21,604 - 4,104 23%4. State Programs D 100,850 100,850 104,337 - 3,487 3%5. Technical Support D 24,469 24,469 25,403 - 934 4%6. Compliance Assistance:
(a) Federal Assistance D 68,433 68,433 72,784 - 4,351 6%(b) State Consultation Grants D 57,775 57,775 59,775 - 2,000 3%(c) Training Grants D 10,537 10,537 10,537 - - 0%Subtotal, Compliance Assistance 136,745 136,745 143,096 - 6,351 5%
7. Safety and Health Statistics D 34,250 34,250 40,095 - 5,845 17%8. Executive Direction and Administration D 10,973 10,973 11,343 - 370 3%
Total Appropriation, Occupational Safety and Health Administration 552,787 552,787 595,023 - 42,236 8%
MINE SAFETY AND HEALTH ADMINISTRATION1. Coal Enforcement D 167,859 164,296 171,768 - 7,472 5%2. Metal / Non-Metal Enforcement D 91,697 94,697 97,563 - 2,866 3%3. Standards Development D 5,416 5,416 6,197 - 781 14%4. Assessments D 6,976 7,089 8,277 - 1,188 17%5. Educational Policy and Development D 36,320 36,320 40,419 - 4,099 11%6. Technical Support D 33,791 34,241 35,041 - 800 2%7. Program evaluation and information resources D 17,990 17,990 21,815 - 3,825 21%8. Program Administration D 15,838 15,838 16,292 - 454 3%
Total Appropriation, Mine Safety and Health Administration 375,887 375,887 397,372 - 21,485 6%
BUREAU OF LABOR STATISTICS1. Labor Force Statistics D 194,177 197,892 219,258 - 21,366 11%2. Labor Market Information (Trust funds) D 65,000 65,000 67,016 - 2,016 3%3. Prices and Cost of Living D 206,012 213,548 219,672 - 6,124 3%4. Compensation and Working Conditions D 81,935 85,793 87,517 - 1,724 2%5. Productivity and Technology D 10,477 10,795 10,993 - 198 2%6. Executive Direction and Staff Services D 34,611 35,972 36,487 - 515 1%
Total Appropriation, Bureau of Labor Statistics 592,212 609,000 640,943 - 31,943 5%Federal Funds 527,212 544,000 573,927 - 29,927 6%Trust Funds 65,000 65,000 67,016 - 2,016 3%
All Purpose Table64

United States Department of LaborFY 2017 President's Budget
(dollars in thousands)
FY 2017President's FY 2017
Category FY 2015 FY 2016 Request ProposedOffice, Account, Program and Activity Code Enacted Enacted Current Law Legislation Amount Percent
FY 2017 President's Request
FY 2016 EnactedCurrent Law versus
DEPARTMENTAL MANAGEMENT
Salaries and Expenses:1. Program Direction and Support D 31,010 31,010 37,406 - 6,396 21%2. Legal Services D 126,136 125,000 140,374 - 15,374 12%
Trust Funds D 308 308 310 - 2 1%3. International Labor Affairs D 91,125 86,125 101,230 - 15,105 18%4. Administration and Management D 28,413 28,413 36,604 - 8,191 29%5. Adjudication D 29,420 32,000 36,325 - 4,325 14%6. Women's Bureau D 11,536 11,536 12,902 - 1,366 12%7. Civil Rights Activities D 6,880 6,880 8,041 - 1,161 17%8. Chief Financial Officer D 5,061 5,061 5,233 - 172 3%9. Departmental Program Evaluation D 8,040 8,040 9,500 - 1,460 18%
Total Appropriation, Salaries and Expenses 337,929 334,373 387,925 - 53,552 16%Federal Funds 337,621 334,065 387,615 - 53,550 16%Trust Funds 308 308 310 - 2 1%
Office of Disability Employment Policy:1. Salaries and expenses D 38,500 38,203 38,544 - 341 1%
Total Appropriation, Office of Disability Employment Policy 38,500 38,203 38,544 - 341 1%
Office of the Inspector General:1. Program Activities D 76,000 80,640 88,881 - 8,241 10%
Trust Funds D 5,590 5,660 5,660 - - 0%
Total Appropriation, Office of the Inspector General 81,590 86,300 94,541 - 8,241 10%Federal Funds 76,000 80,640 88,881 - 8,241 10%Trust Funds 5,590 5,660 5,660 - - 0%
Veterans Employment and Training:1. State Administration, Grants (TF) D 175,000 175,000 175,000 - - 0%2. Transition Assistance Program (TF) D 14,000 14,100 14,600 - 500 4%3. Federal Administration (TF) D 39,458 40,487 42,506 - 2,019 5%4. National Veterans Training Institute (TF) D 3,414 3,414 3,414 - - 0%5. Homeless Veterans Program D 38,109 38,109 50,000 - 11,891 31%
Total Appropriation, Veterans Employment and Training 269,981 271,110 285,520 - 14,410 5%Federal Funds 38,109 38,109 50,000 - 11,891 31%Trust Funds 231,872 233,001 235,520 - 2,519 1%
IT Modernization1. Departmental Support Systems D 4,898 4,898 4,898 - - 0%2. IT Infrastructure Modernizations D 10,496 24,880 58,264 - 33,384 134%3. Digital Government Integrated Platform Initiative D - - - - 100%
Total Appropriation, IT Modernization 15,394 29,778 63,162 - 33,384 112%
All Purpose Table65

United States Department of LaborFY 2017 President's Budget
(dollars in thousands)
FY 2017President's FY 2017
Category FY 2015 FY 2016 Request ProposedOffice, Account, Program and Activity Code Enacted Enacted Current Law Legislation Amount Percent
FY 2017 President's Request
FY 2016 EnactedCurrent Law versus
DEPARTMENTAL MANAGEMENT
Working Capital Fund:1. Working Capital Fund D - - - - - 100%2. Working Capital Fund Balance Cancellation D - - - - - 100%
Mandatory Funds M - - - - - 100%
Total Appropriation, Working Capital Fund - - - - - 100%Mandatory - - - - - 100%Discretionary - - - - - 100%
Total Appropriation, Departmental Management 743,394 759,764 869,692 - 109,928 14%Mandatory - - - - - 100%Discretionary 743,394 759,764 869,692 - 109,928 14%
Federal Funds 505,624 520,795 628,202 - 107,407 21%Trust Funds 237,770 238,969 241,490 - 2,521 1%
RECEIPTS
General Fund Proprietary M -17,000 -28,000 -28,500 -500 2%Undistributed Intragovernmental Payments M - - - - - 100%Deposits by Agencies to FECA, UTF M -775,000 -767,000 -736,500 - 30,500 -4%Payments from General Fund for Extended Unemployment, UTF M - - - - - 100%General Fund Proprietary Interest M -12,000 - 100%Interest and Gains on Public Debt Securities, UTF M -890,000 -1,143,500 -1,341,500 - -198,000 17%Interest on UI Loans to States, UTF M -258,000 -110,500 -36,500 - 74,000 -67%Misc Interest, BLDTF M -1,000 -2,000 -2,000 - - 0%
Total, Receipts / Interfund Transactions -1,953,000 -2,051,000 -2,145,000 -38,000 -94,000 5%
TOTAL APPROPRIATION, DEPARTMENT OF LABOR 45,058,699 45,678,470 45,865,735 17,643,000 147,488 0%Mandatory 33,113,373 33,507,574 33,067,994 17,543,000 -479,357 -1%Discretionary 11,945,326 12,170,896 12,797,741 100,000 626,845 5%
Federal Funds 8,074,813 8,313,956 8,900,024 100,000 586,068 7%Current year appropriation 6,302,813 6,541,956 7,128,024 100,000 586,068 9%Advance for succeeding fiscal year 1,772,000 1,772,000 1,772,000 - - 0%
Trust Funds 3,870,513 3,856,940 3,897,717 - 40,777 1%
All Purpose Table66
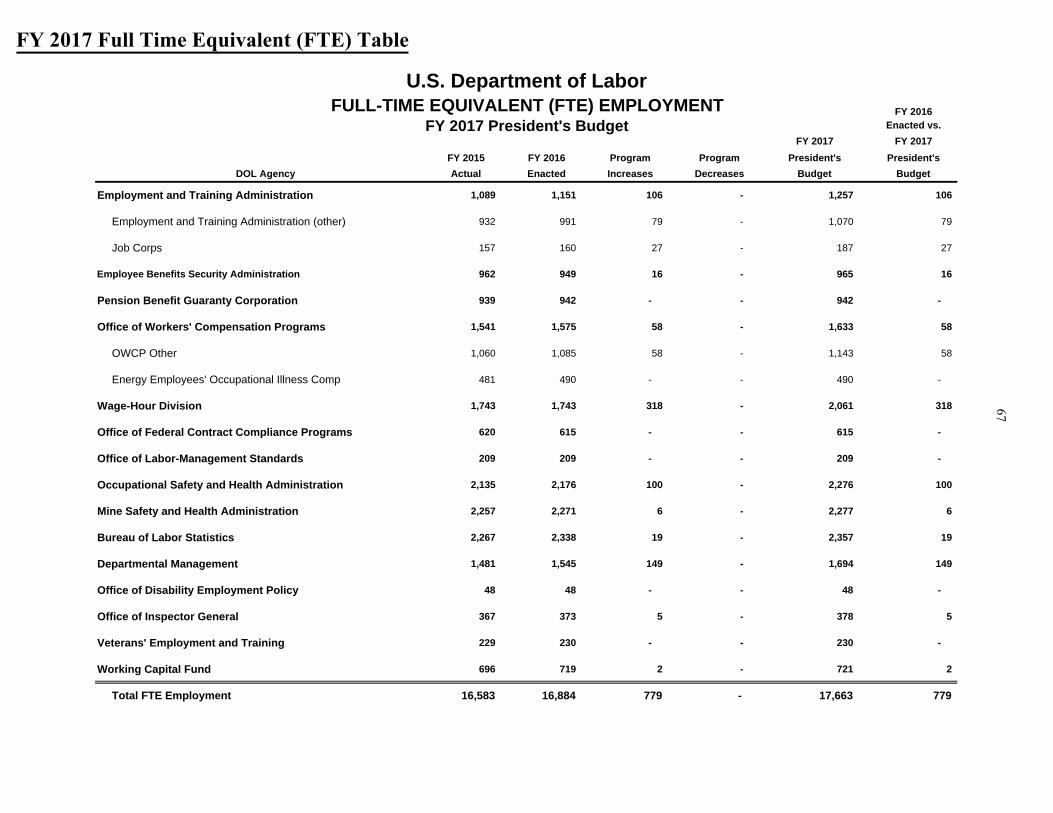
U.S. Department of LaborFULL-TIME EQUIVALENT (FTE) EMPLOYMENT
FY 2017 President's BudgetFY 2016
Enacted vs.FY 2017 FY 2017
FY 2015 FY 2016 Program Program President's President'sDOL Agency Actual Enacted Increases Decreases Budget Budget
Employment and Training Administration 1,089 1,151 106 - 1,257 106
Employment and Training Administration (other) 932 991 79 - 1,070 79
Job Corps 157 160 27 - 187 27
Employee Benefits Security Administration 962 949 16 - 965 16
Pension Benefit Guaranty Corporation 939 942 - - 942 -
Office of Workers' Compensation Programs 1,541 1,575 58 - 1,633 58
OWCP Other 1,060 1,085 58 - 1,143 58
Energy Employees' Occupational Illness Comp 481 490 - - 490 -
Wage-Hour Division 1,743 1,743 318 - 2,061 318
Office of Federal Contract Compliance Programs 620 615 - - 615 -
Office of Labor-Management Standards 209 209 - - 209 -
Occupational Safety and Health Administration 2,135 2,176 100 - 2,276 100
Mine Safety and Health Administration 2,257 2,271 6 - 2,277 6
Bureau of Labor Statistics 2,267 2,338 19 - 2,357 19
Departmental Management 1,481 1,545 149 - 1,694 149
Office of Disability Employment Policy 48 48 - - 48 -
Office of Inspector General 367 373 5 - 378 5
Veterans' Employment and Training 229 230 - - 230 -
Working Capital Fund 696 719 2 - 721 2
Total FTE Employment 16,583 16,884 779 - 17,663 779
FY 2017 Full Time Equivalent (FTE) Table 67