fy 2014-fy2022 budget forecast - pinellas county
TRANSCRIPT

Pinellas County Florida Office of Management amp Budget
Budget Forecast FY2014-2023
TABLE OF CONTENTS
Pinellas County Budget Forecast FY2014-2023
I Introduction A-1 II Executive Summary B-1 III Economic Overview C-1 National Economy C-1 State Economy C-8 Local Economy C-18 IV Key Assumptions D-1 Revenues D-2 Expenditures D-13 V Fund Forecasts E-1 General Fund E-3 Tourist Development Fund E-21 Transportation Trust Fund E-29 Capital Projects Fund E-35 Emergency Medical Services Fund E-41 Fire Districts Fund E-47 Airport Fund E-53 Utilities Water Funds E-61 Utilities Sewer Funds E-65 Utilities Solid Waste Funds E-71 VI Pro-Formas F-1 General Fund F-3 Tourist Development Fund F-7 Transportation Trust Fund F-11 Capital Projects Fund F-15 Emergency Medical Services Fund F-19 Fire Districts Fund F-23 Airport Fund F-27 Utilities Water Funds F-31 Utilities Sewer Funds F-35 Utilities Solid Waste Funds F-39 VII Glossary G-1
Pinellas County Budget Forecast FY2014-2023
INTRODUCTION
Pinellas County Budget Forecast FY2014-2023 A-1
The Introduction portion of the Budget Forecast FY2014-2023 discusses how the Forecast dovetails with the annual budget process how the Forecast is developed and how the Forecast can be used as a planning tool to enhance decision making It includes the following sections
bull Forecasting and the Annual Budget Process bull Developing the Forecast bull The Power of the Forecast bull Using This Document
Forecasting and the Annual Budget Process The first step in the annual budget process is to update the Forecast in order to develop the budget guidelines for the FY2014 budget process
Several of the Countyrsquos key funds are included in the Forecast Each fund is analyzed individually as part of the forecasting process
Development of Budget Guidelines The budget guidelines are developed by County Administration based on the results of the Forecast and policy direction from the Board of County Commissioners If the results of the Forecast for a given fund indicate a shortfall the budget guidelines would most likely include some kind of reduction target If a surplus is expected the guidelines would most likely include proposals for new or enhanced programs The budget guidelines are communicated to the Countys departments and agencies for use during their budget development At this time all instructions and resources for preparing budget requests are also distributed Updating the Forecast After the Forecast is prepared and presented to the Board of County Commissioners in the January timeframe the Forecast is continually updated throughout the rest of the fiscal year in parallel with the budget development process
Forecast (January)
Targets Budget Guidelines (February)
Budget Worksessions (AprilMayJune)
Proposed Budget (July)
1st amp 2nd Public Hearings
(AugustSeptember)
Adopted Budget (October)
Deptrsquol Budget Submissions
(March)
BCCrsquos Policy
Direction
INTRODUCTION
Pinellas County Budget Forecast FY2014-2023 A-2
Developing the Forecast The Forecast is developed by the Office of Management amp Budget (OMB) during November December and January for presentation to the Board of County Commissioners in January or February Developing Projections The Forecast is built upon an individual assessment of ten of the Countyrsquos major funds the General Fund Tourist Development Fund Transportation Trust Fund Capital Projects Fund Emergency Medical Services Fund Fire Districts Fund Airport Fund and Utilities Water Sewer and Solid Waste Funds The process for developing the Forecast includes updating the projections for FY2012 with actual revenue and expenditure information following the closeout of the fiscal year as of September 30 2012 At the same time the current FY2013 expenditures are projected on a preliminary basis by analyzing the actual expenditures to date and projecting the remaining months left in the fiscal year These expenditure projections are further refined later in the process as departments provide their expenditure projections The coming FY2014 budget year is forecasted based on the best information available at this point in time The Forecast has a ten year horizon to help determine the long-term financial position of the Countyrsquos funds as well as the impact of todayrsquos budget decisions The out-years through FY2023 are forecasted using various projection methods such as trend analysis linear regression and moving averages Forecast Assumptions The projections are modeled so that assumptions may vary each year to reflect future impacts of known variables and other anticipated events The model is also designed to allow the key assumptions to be adjusted so that sensitivity analysis can be performed to demonstrate the impact of changing key assumptions Additionally unknown risks that could potentially affect the ten-year forecast have been identified and discussed Forecast Results Major assumptions driving the revenue and expenditure projections are outlined to ensure a clear understanding for the basis of the results Shortfalls and surpluses are cumulative in the sense that any individual yearrsquos surplus or deficit flows into the next yearrsquos fund balance thus carrying a current yearrsquos balance forward In using the information contained in the projection it is important to understand that an indicated surplus or deficit reflects the modelrsquos assumptions and demonstrates a potential need for revenue increases expenditure reductions or a mix of both The Power of the Forecast Developing a multi-year forecast provides decision-makers with at least two key benefits (1) assessing the long-term financial sustain-ability of the Countyrsquos Funds and (2) under-standing the impact of todayrsquos decisions on the future
INTRODUCTION
Pinellas County Budget Forecast FY2014-2023 A-3
Long-Term Fiscal Sustainability One of the key purposes of developing a multi-year fund forecast is to identify potential actions necessary to balance revenues and expenditures over the long-term to ensure fiscal sustainability Forecasting over a ten-year horizon can serve as a window into the future to warn of potential future challenges For example if a major capital project (ie jail expansion) will have a significant impact on the operating budget that impact can be anticipated several years in advance and strategies can be developed and implemented to manage the negative impact to the budget Conversely if debt service on a bond is due to expire in the near future additional funds may become available to increase service levels to certain programs or other uses Enhanced Decision-Making Another benefit of long-term forecasting is the ability to assess the impact that decisions made in the present can have on future fiscal capabilities If the Board is considering funding a new or enhancing an existing program the Forecast can demonstrate the long-term impact to the budget Similarly if the Board is considering a new revenue source the Forecast can show how much revenue could be anticipated over the years Implementing cost-saving initiatives can also be forecasted and evaluated over time In summary the Forecast can be a powerful tool to understand how policy changes have real consequences that last far beyond a one-year budget solution Using This Document The Executive Summary section of this document summarizes the key elements of the forecast as a whole over the ten year time horizon The Economic Overview section features an overview of the national state and local economies This section provides important context for the various forecasts in the document The Key Assumptions section discusses the sources of key revenue and expenditure assumptions that were used to develop each of the fund forecasts This section is followed by the Fund Forecasts section which includes individual forecasts for ten of the Countyrsquos major funds These forecasts are designed to be succinct and help focus the reader on the important elements in the ten-year forecasts for each fund The assumptions pro-formas and a full-size forecast chart for each of the funds can be found in the Pro-Formas section A Glossary has also been included to facilitate understanding of key terms
INTRODUCTION
Pinellas County Budget Forecast FY2014-2023 A-4
EXECUTIVE SUMMARY
Pinellas County Budget Forecast FY2014-2023 B-1
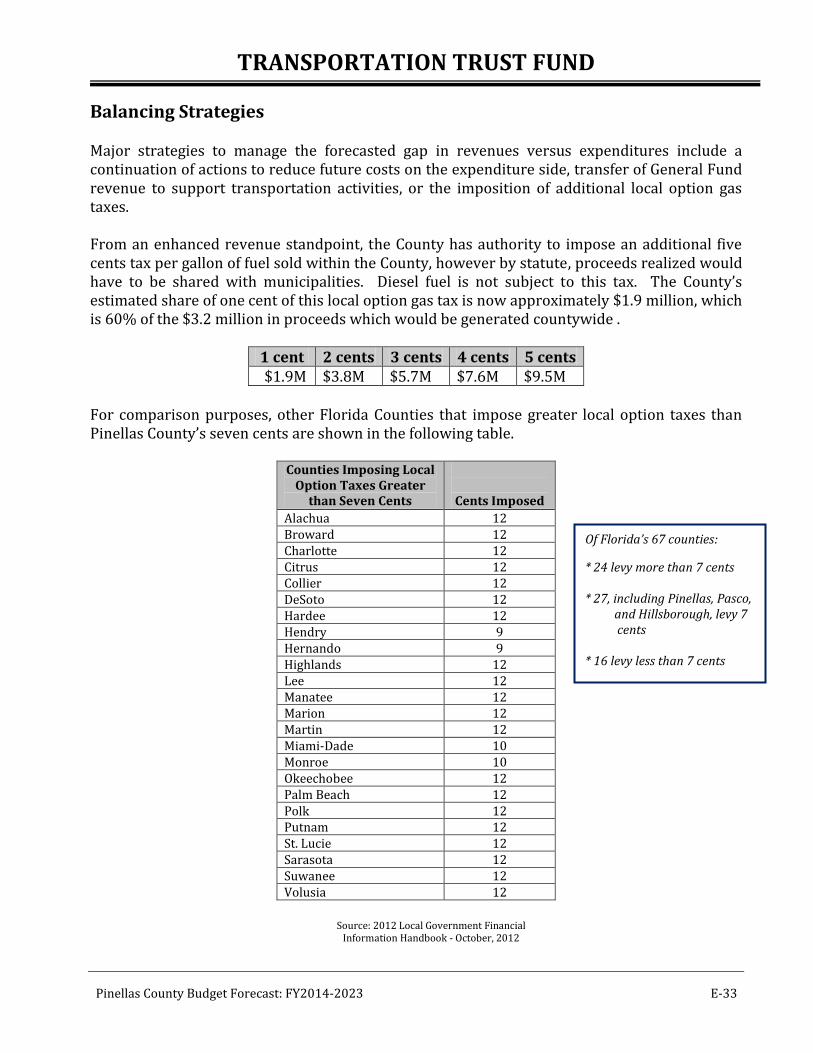
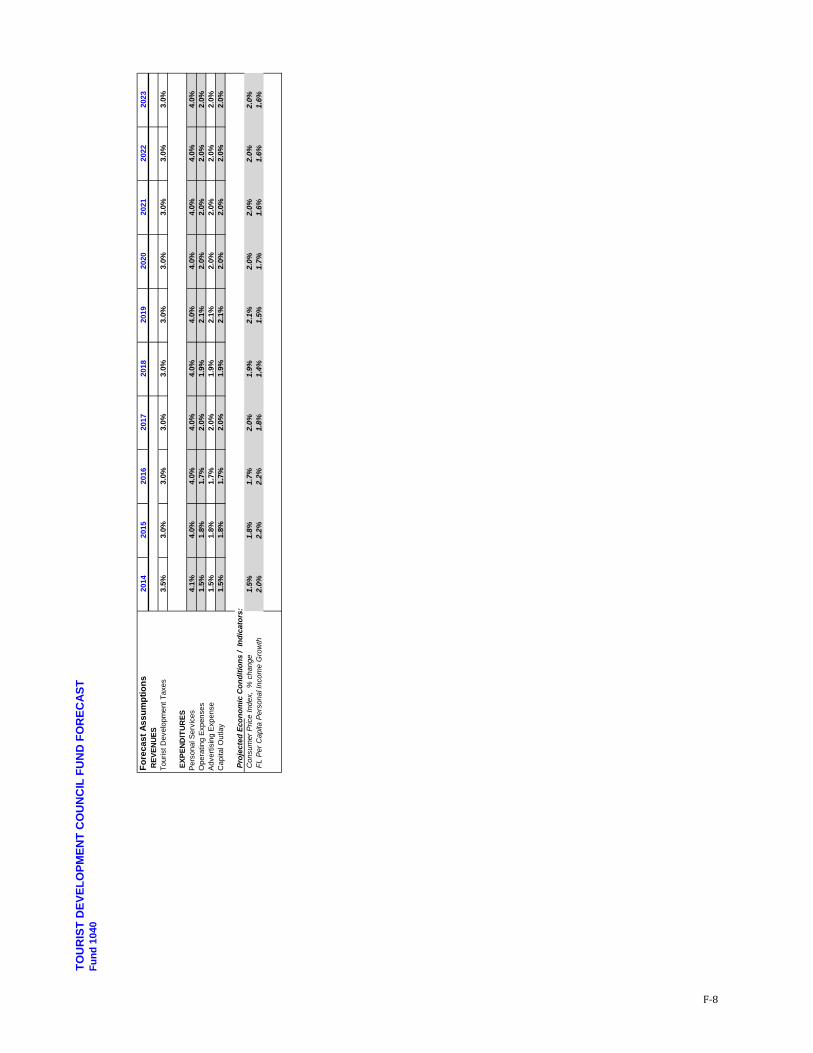
Introduction This is the fourth year that the ten-year Budget Forecast has been formalized into a stand-alone document There are no changes to the format of the document from last year The first step in the annual budget process is to update the Budget Forecast and seek Board policy direction in order to develop the budget guidelines for the FY2014 budget process Developing a multi-year forecast provides decision-makers with at least two key benefits (1) assessing the long-term financial sustainability of the Countyrsquos funds and (2) understanding the impact of todayrsquos decisions on the future Economic Overview The national economy appears to be on track for a sustainable recovery and is anticipated to grow by 2 to 3 annually during the forecast period The Statersquos economy is showing signs of improvement in population growth tourism and the housing market As the national economy continues to improve Pinellas County is poised to recover as well The biggest industry in the County is tourism which has shown signs of a strong recovery For FY2014 the property tax base is expected to show positive growth following five years of decline Risks to the economic forecast include uncertainty on federal deficit reduction actions such as sequestration the ongoing European financial crisis and continued high levels of unemployment General Fund Forecast The forecast projects that beginning in FY2013 recurring expenditures exceed recurring revenues in the General Fund This is primarily due to the aftereffects of the Great Recession with continued slow recovery of the real estate market In addition caps on taxable value increases and total property tax revenue will inhibit future revenue growth Major expenditure drivers that exceed normal inflation include personnel costs such as health insurance and state-required pension contributions and mandated expenses such as Medicaid There is a long-term structural imbalance of approximately $15M increasing to $60M per year over the forecast period absent action to address this problem The balancing strategy for the General Fund is to cover the shortfall in FY2014 by utilizing the Service Level Stabilization Account (SLSA) in accordance with the plan approved by the Board of County Commissioners Expenditure reductions or revenue increases may be required in FY2014 or future years to address the structural imbalance The extent of the changes that are needed will be dependent on the pace of the economic recovery particularly the real estate market Tourist Development Council Fund Forecast The forecast for the Tourist Development Council Fund shows that the fund is balanced through the forecast period based on the assumption that the undesignated budget would be adjusted to reflect any revenue increases or decreases that may occur Beginning in FY2016 the fund is forecast to have additional capacity once the debt service on Tropicana Field and the Dunedin Spring Training Facility is paid off in 2015 The additional capacity in the undesignated budget could be dedicated to new capital outlay as with the Board approved Salvador Dali funding to new debt service or to supplement the promotional activities budget Transportation Trust Fund Forecast The forecast for the Transportation Trust Fund indicates that the fund is not in balance beginning in FY2013 resulting in a depletion of fund balance by FY2018 This imbalance primarily results from inflationary pressures on expenditures coupled with the projected reduction in gas tax collections
EXECUTIVE SUMMARY
Pinellas County Budget Forecast FY2014-2023 B-2
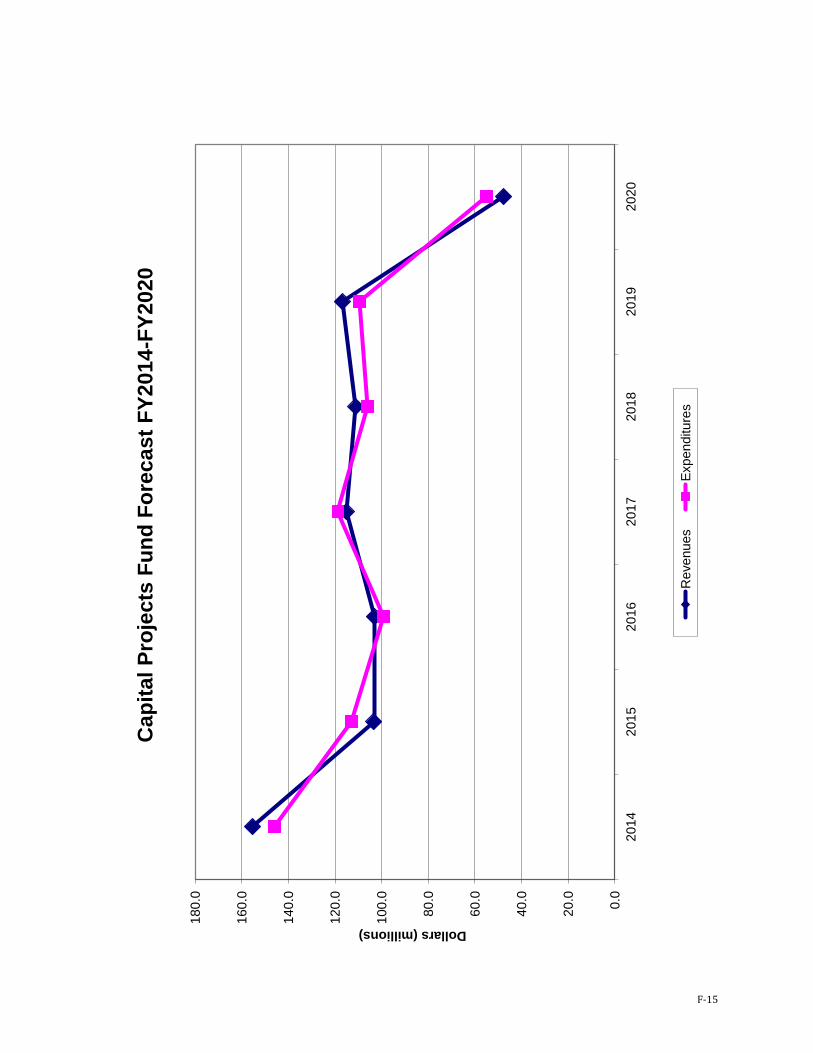
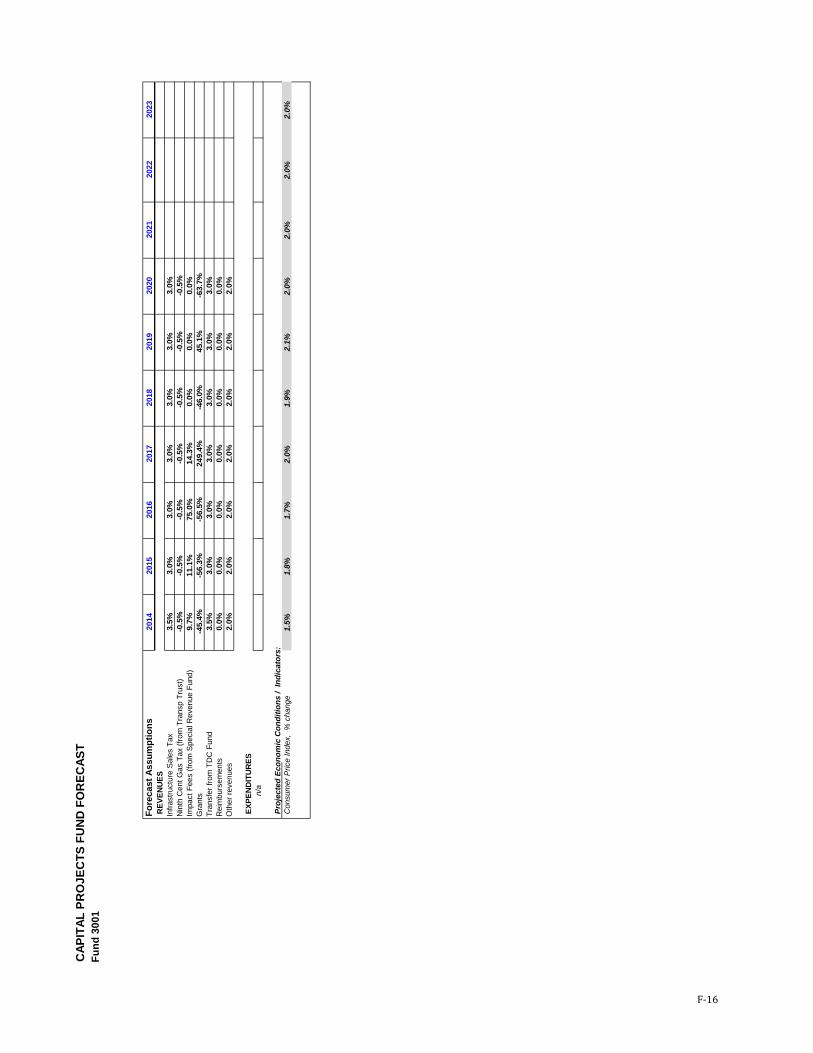
that are based upon the volume of fuel By FY2017 action will need to be taken to manage this future gap such as potential revenue transfers from the General Fund imposition of additional local option gas taxes or reductions in current service levels Another balancing option is the implementation of a storm water strategy that includes a new dedicated funding source If a dedicated funding source was available storm water costs currently funded in the Transportation Trust Fund could be freed up to create additional capacity Capital Projects Fund Forecast The forecast for the Capital Projects Fund shows that the fund is balanced over the forecast period Additional cash flow necessary in the first half of the ten-year period is being addressed through an interfund loan from the Solid Waste Renewal amp Replacement Fund A primary driver of cash flow is $81M of expenditures associated with the Public Safety Complex project that began in FY2012 The forecast includes repayment of the loan from FY2013 to FY2020 The forecast does not include projections of revenues or expenditures beyond the current Penny for Pinellas infrastructure sales surtax authorization which ends in FY2020 Emergency Medical Services Fund Forecast The forecast indicates that the fund is not balanced throughout the forecast period The structural imbalance is driven by slower growth in property tax revenue collections than cost increases in ambulance contractual expenditures and first responder funding requests Balance for FY2013 was achieved through a millage rate increase and use of reserves Without another millage rate increase andor expenditure savings reserves will be exhausted after FY2016 Future balancing strategies will be developed from information gathered in the EMS system operational study Fire Districts Fund Forecast The forecast for the Fire Districts Fund indicates that the fund is not balanced through the forecast period Five of the twelve fire districts increased millage rates in FY2013 Additional increases to millage rates for the individual fire districts will likely be necessary to cover expenditures over the forecast period Potential millage rate increases will need to take into account the individual millage caps in each fire district Airport Fund Forecast The forecast for the Airport Revenue and Operating Fund shows that the fund is balanced through the forecast period based on the assumptions that the capital projects budget would be adjusted to reflect the timing and amounts of any grants revenue and that the airportrsquos operating budget would be adjusted to match revenues Utilities Water Funds Forecast The Water System Funds are balanced through the forecast period based on projected rate increases The multi-year rate increases approved as part of the FY2012 budget process will provide sufficient revenues to maintain reserves and fund capital replacement needs through FY2015 The forecast revenues include an additional 2 per year annual increase in rates from FY2016-FY2023 as recommended in the FY2012 Utilities Rate Study performed by the Countyrsquos independent rate consultant A new comprehensive rate study will be performed in FY2014 to analyze the future rate structure In FY2013 FY2014 FY2017 and FY2018 recurring expenditures will exceed recurring revenues as fund balance is drawn down as major capital projects are completed From FY2015
EXECUTIVE SUMMARY
Pinellas County Budget Forecast FY2014-2023 B-3
through FY2023 excluding FY2017 and FY2018 the Water Funds are structurally balanced Utilities Sewer Funds Forecast The Sewer System Funds are balanced through the forecast period based on projected rate increases The multi-year rate increases approved as part of the FY2012 budget process will provide sufficient revenues to maintain reserves sustain the recommended debt service coverage ratio of 150x and fund capital replacement needs through FY2015 The forecast revenues include an additional 275 per year annual increase in rates from FY2016-FY2023 as recommended in the FY2012 Utilities Rate Study performed by the Countyrsquos independent rate consultant A new comprehensive rate study will be performed in FY2014 to analyze the future rate In FY2013 recurring expenditures will exceed recurring revenues as fund balance is drawn down as major capital projects are completed From FY2014 through FY2023 the Sewer Funds are structurally balanced as recurring expenditures are in line with recurring revenues Utilities Solid Waste Funds Forecast The Solid Waste Funds are balanced through the forecast period Forecasted revenues are sufficient to provide for the forecasted expenditures over the next ten years while still maintaining sufficient reserves The recurring revenues are sufficient to support recurring operations without any increases in tipping fees Reserves increase during the forecast period and reach the level of 84 of revenues in FY2023 The reserves are planned to fund considerable future capital replacement needs in the Solid Waste 25-year plan
EXECUTIVE SUMMARY
Pinellas County Budget Forecast FY2014-2023 B-4
ECONOMIC OVERVIEW
Pinellas County Budget Forecast FY2014-2023 C-1
The Economic Overview amp Budget Background portion of the Budget Forecast FY2014-2023 provides important context for the various forecasts in this document and includes the following sections
The National Economy o Background o National Outlook
The State Economy o Background o Florida Outlook
The Local Economy o Background o Local Outlook
The National Economy BACKGROUND ldquoThe Fiscal Cliffrdquo After briefly stepping off the ldquofiscal cliffrdquo as the nation welcomed 2013 the US Senate passed legislation the ldquoAmerican Taxpayer Relief Act of 2012rdquo in the early morning hours of January 1 that prevented income tax rates from increasing for individuals making up to $400000 extended benefits for the long-term unemployed and delayed the automatic spending cuts known as sequester for two months Many economists believed these spending cuts to be split evenly between defense ($55 billion) and non-defense ($55 billion) programs along with the ending of the Bush-era tax cuts would have stalled the current economic recovery and possibly send the economy back into recession While federal income tax rates were kept at 2012 levels for most people the temporary decrease for social security taxes also known as the payroll tax paid by wage earners ended on Dec 31 2012 For two years workers paid 42 instead of the previous 62 rate The reason for the rate cut was to stimulate the economy by allowing workers to bring home more money with each paycheck The financial impact for those earning $30000 per year will be about $50 less in take-home pay per month While the passage of the Act will temporarily avert and delay various elements of the fiscal cliff there will be another showdown in the coming months over automatic across-the-board spending cuts known as ldquosequestrationrdquo the debt ceiling tax and entitlement reform and a long-term solution to the nationrsquos debt and deficits Debt Ceiling Crisis Under the United States Constitution Congress has the authority to appropriate funds for numerous activities including national defense education and payment of the nationrsquos debt obligations When annual revenues fall short of the level required to pay for these activities the Government must then borrow money through the issuance of debt instruments such as short-term bills and notes and long-term bonds In an effort to provide flexibility while still maintaining some control Congress imposed the first debt ceiling in 1917 limiting the amount of debt the federal government can legally borrow to $115 billion Previously Congress had to sign off each time the Department of the Treasury issued
ECONOMIC OVERVIEW
Pinellas County Budget Forecast FY2014-2023 C-2
debt To meet the growing obligations of the federal government Congress must approve a new debt ceiling level before the accrued debt meets the imposed cap This has been done more than 70 times since 1962 with the current debt limit exceeding $16 trillion Increasing the debt ceiling does not authorize new spending but allows the government to raise the necessary funds to pay for previously incurred obligations
During the Spring and Summer of 2011 President Obama and leaders of both the House and Senate faced the need for another increase in the debt ceiling What is usually a routine vote turned into a policy showdown between congressional Republicans and Democrats over how to reduce federal spending and long-term debt After several months of negotiations the House and Senate passed the
Budget Control Act of 2011 which was signed into law by President Obama on August 2 2011 the day the Treasury Department said the United States would begin to default on their obligations without further action
The actions taken during the summer of 2011 did not raise the debt ceiling long-term According to Treasury Secretary Timothy Geithner the United States reached the statutory debt limit on Dec 31 2012 but due to the undertaking of ldquoextraordinary measuresrdquo at the end of 2012 the Treasury extended the deadline by about two months Without a deal to raise the debt ceiling the United States would begin to default on its obligations including payments to holders of US debt and social security recipients among others The United States government has never defaulted on its financial obligations and doing so would have a significant impact on the global economy
Budget Control Act of 2011 The Act established a procedure for increasing the debt limit by $400 billion initially and an additional $500 billion after September 2011 The Act also mandated at least $21 trillion in spending cuts with immediate caps on domestic and defense spending resulting in over $900 billion deficit reduction over ten years To determine the remaining $12 trillion in cuts the Congressional Joint Select Committee on Deficit Reduction (the ldquoSuper Committeerdquo) was established The Super Committee consisted of 12 members of Congress with six coming from the House and six from the Senate split evenly between Democrats and Republicans The committee was charged with issuing recommendations by November 23 2011 for at least $15 trillion in deficit reductions over ten years which could include both revenue increases and spending cuts Downgrade of Federal Government Credit Rating Despite averting default Standard amp Poorrsquos (SampP) downgraded the governmentrsquos credit rating one notch from AAA (highest) to AA+ Citing ldquopolitical brinksmanshiprdquo SampP determined the US governmentrsquos ability to manage its financial house is ldquoless stable less effective and less predictablerdquo and the Budget Control Act of 2011 ldquofell shortrdquo of what was needed to bring the nationrsquos debt under control over time SampP also did not feel the political leaders would be able to achieve the mandated savings in the future On January 15 2013 Fitch Ratings warned of a possible downgrade of US debt without an ldquoagreed and credible medium-term deficit reduction plan that would be consistent with sustaining the economic recovery and restoring confidence in the long-run sustainability of US public financerdquo
ECONOMIC OVERVIEW
Pinellas County Budget Forecast FY2014-2023 C-3
Without a long-term solution to the budget deficit investors will begin to lose confidence in US debt driving interest rates up leading to increased borrowing cost and additional budget pressures As the months pass and pressure mounts all eyes will be on Washington DC and the work of our elected officials Failure of the Super Committee The most visible result of the previous debt ceiling crisis was the creation of the Congressional Super Committee After several months of hard work and intense deliberations the Super Committee was unable to reach agreement The failure of the Super Committee to forge a deficit reduction deal triggers $12 trillion in automatic across-the-board spending cuts starting in 2013 evenly divided between military and non-military spending While most government programs are subject to the automatic cuts programs that assist low-income Americans will be exempt including Social Security Medicaid veteransrsquo benefits and food stamps As 2012 ended and sequestration was looming the US House of Representatives and United States Senate passed legislation delaying the automatic cuts for two months NATIONAL OUTLOOK Gross Domestic Product (GDP) is the generally accepted measure of the size of the national economy GDP measures the total market value of all final goods and services produced in a country in a given year The major components of national GDP (Third Quarter 2012) are shown in the pie chart below
Components of US GDP ndash 3rd Qtr 2012
Consumer Spending
705
Investments132
Net Exports-33
Government Spending
196
Source US Bureau of Economic Analysis
Consumer Spending At 705 consumer spending easily represents the largest portion of GDP This expectation is based on continued high levels of unemployment modest growth in real disposable (after-tax) personal income financial market volatility government debt ceiling and debt downgrade an increase in
ECONOMIC OVERVIEW
Pinellas County Budget Forecast FY2014-2023 C-4
household savings a restrictive supply of credit increases in food and energy prices and continued gridlock in Washington DC The December 2012 unemployment rate was 78 the lowest level since January 2009 Job growth which showed signs of strength in the first quarter of 2012 suffered a slowdown in the second quarter before regaining energy averaging 160000 jobs per month over the last half of the year Through December 2012 the economy has added an average of 153000 jobs per month
Seasonally Adjusted Unemployment Rate 2007-2012
44
100
78
00
20
40
60
80
100
120
Percent
US Unemployment Rate 2007 - 2012
Source US Bureau of Labor StatisticsFRED
While unemployment has shown improvement since the recession ended in 2009 the number of long-term unemployed people who have been looking for employment for more than 26 consecutive weeks has been much higher than the period following the 2001 recession As the chart below shows the pre-2007 recession level of long-term unemployed never returned to the pre-2001 levels and currently is above 40 of the total unemployed One of the effects of long-term unemployment has been a depletion of savings and the draw-down of retirement accounts to pay monthly bills like the mortgage insurance and food The tight financial situation many families find themselves in including working families means there are fewer non-essential purchases being made
ECONOMIC OVERVIEW
Pinellas County Budget Forecast FY2014-2023 C-5
Source Congressional Budget Office An Update to the Budget and Economic Outlook Fiscal Years 2012 to 2022 August 2012
Year Unemployment
2012 82 (78 YTD) 2013 88 2014 87 2015 77 2016 67 2017 59
2018 55
2019 55
2020 54
2021 54
2022 53 Source Congressional Budget Office An Update to the Budget and Economic Outlook Fiscal Years 2012 to 2022
August 2012
According to the US Department of Commerce retail sales for 2012 increased by 49 from 2011 This rise was in part due to increases in automobiles (86) furniture (77) and building materials (54) Although these increases were driven by discounts and promotions these figures do seem to indicate a positive trend in consumer spending NovemberDecember retail sales were up 37 from the same period in 2011
Category December
2012 December
2011
Growth Retail amp Food Services $4687B $4575B 24 Retail $4230B $4145B 21 Automobiles $749B $717B 45
Gas Stations $422B $421B 02
Clothing $317B $309B 26 Source US Department of Commerce January 15 2013
ECONOMIC OVERVIEW
Pinellas County Budget Forecast FY2014-2023 C-6
Inflation also plays a role impacting the outlook for consumer spending The Consumer Price Index the generally accepted measure of overall inflation rose by 17 in 2012 lower than the 35 rise for all of 2011 with the second half of 2012 rising by 23 Short-term projections for CPI range from 18 to 22 through 2017 In addition the Federal Reserve has continued to maintain record low levels on short-term interest rates and is expected to keep them close to zero at least through 2015 which is about two and a half years longer than originally indicated Government Spending The second largest component of GDP is Government Spending at 196 With looming spending cuts and economic pressures the government sector will likely remain a drag on economic growth The state and local government sector represents approximately 60 of total government spending State government budgets have been challenged over the last several years For FY13 sixteen states and the District of Columbia projected a combined gap of $162 billion down from the high of $1741 billion in FY10 Although some states are forecasting budget gaps over the next two years the number of states and the size of the gaps have continued to decline Local government budgets are very dependent on the housing market from tax revenue from home sales to property taxes based on taxable values As the housing market boomed revenues from these sources rose at exceptional rates When the bubble burst so did the revenues While the housing market in general has seemingly hit bottom property values are still below pre-boom levels in many areas as excess inventory and foreclosures continue to suppress housing prices The National Association of Realtors estimates the inventory of existing homes at approximately 286 million units and estimates the shadow inventory made up of homes in the foreclosure process at an additional 20 million units Areas where the real estate market is showing improvement includes the Northeast the Washington DC region Texas and California A sustainable recovery will not truly occur until the backlog of distressed properties is cleared Until real estate markets recover local government spending will likely lag Overall the state and local government sector is anticipated to decrease slightly or be flat over the next few years The federal government sector represents 40 of total government spending Federal spending is anticipated to decrease over the next few years as the mandated spending reductions take place from the Budget Control Act passed in 2011 The Act specified automatic procedures for reducing spending by as much as $12 trillion if legislation was not approved for reducing spending by that amount These cuts would be spread out over the ten years and contribute to more restrained federal spending than in years past and detract from economic growth However the American Taxpayer Relief Act of 2012 which was signed into law by President Obama on January 2 2013 delayed the implementation of the sequestration from January 1 2013 to March 1 2013 This delay will allow the new Congress additional time to find targeted savings without across the board cuts Despite the delay Federal government spending is anticipated to decrease by 2-3 over the next four years as concerns over the four straight years of $1 billion Federal budget deficit grips Washington DC Investment The third largest component of GDP is Investment at 132 This component is made up of Non-Residential Fixed Investment and Residential Fixed Investment
ECONOMIC OVERVIEW
Pinellas County Budget Forecast FY2014-2023 C-7
According to the Congressional Budget Office business and residential investment are growing strongly Business investment in nonresidential structures equipment and software grew at an annual rate of 64 in the first half of 2012 with the second quarter growing by 102 from the same period in 2011 Inventory investments grew in the first half of 2012 from the second half of 2011 However with inventory levels stabilizing this component is unlikely to grow as businesses reduce their stock levels on-hand as the economic recovery continues Net Exports The definition of net exports is exports minus imports Current net exports make up -33 of GDP A key factor driving net exports is the value of the dollar The value of the dollar has gradually weakened and depreciated through much of 2011 due to the Federal Reserversquos policy of quantitative easing which helped decrease the dollar exchange rate against other currencies A depreciated dollar helps increase exports by making the costs of US goods more competitive in the global marketplace and reduces the negative net exports calculation The weakening of the dollar was interrupted by the European debt crisis but is anticipated to continue for several years The pace of export growth is expected to decrease slightly as a result of the anticipated modest recession in Europe However exports to emerging markets should continue to help domestic global producers Import growth will likely be constrained by the slow pace of consumer spending Summary of National Outlook Most economists agree that the national economy hit bottom in 2009 and that we are on track for a sustainable recovery Normally economic recoveries are marked by real economic growth of around 5 in the first year of recovery due to pent up demand It is anticipated that this recovery will be in the 2 to 3 range due to lingering high levels of unemployment the bottoming out of the housing market the continued decline of the commercial real estate market decreases in both federal and state amp local government spending and uneasiness about Europe
Gross Domestic Product (GDP) GDP
Growth 2006 27
2007 19
2008 -03 2009 -35 2010 30 2011 17 2012 (Est) 22 2013 (Est) 20 2014 (Est) 27
2015 (Est) 29 Source Federal Reserve Bank of Philadelphia
Survey of Professional Forecasters November 9 2012
While the national economy appears to have stabilized the lack of job-growth and continued high unemployment in addition to the on-going financial crisis across much of Europe still poses a significant threat to the recovery both nationally and globally
ECONOMIC OVERVIEW
Pinellas County Budget Forecast FY2014-2023 C-8
The State Economy BACKGROUND The background information below for the Statersquos economy is derived primarily from the January 10 2013 report Florida An Economic Overview by The Florida Legislature Office of Economic and Demographic Research Until a few years ago Florida was one of the nationrsquos fastest growing states With the end of the housing boom and the beginning of the real estate market correction the state slipped to virtually no growth on a year-over-year basis While Florida was not the only state to experience a significant deceleration in economic growth (California Nevada and Arizona showed similar trends) it was one of the first and hardest hit State Gross Domestic Product Gross Domestic Product (GDP) the market value of all final goods and services produced or exchanged within a state is one of the key economic measures for the comparison of states In 2006 Florida returned to the national growth level before dropping below it in 2007 (48 US versus 28 FL) 2008 (33 US versus 03 FL) and 2009 (-13 US versus -17 FL) Floridarsquos total GDP in 2007 was $760 billion but dropped to about $726 billion in 2009 before climbing back up to $754 billion in 2011 (the last full year data is available)
Source Federal Reserve Bank of St Louis
After adjusting for inflation Floridarsquos real growth in GDP ranked it tied for 39th in the nation in 2011 with a gain of 25 By way of comparison Florida was ranked 50th in 2008 and 4th in the nation in 2005 For Arizona Nevada and Florida losses in the construction sector accounted for a significant
ECONOMIC OVERVIEW
Pinellas County Budget Forecast FY2014-2023 C-9
portion of the decline as it subtracted more than one percentage point from real GDP growth in each of these states Personal Income Growth Other factors are frequently used to gauge the health of an individual state The first of these measures is personal income growth primarily related to changes in salaries and wages According to The Florida Legislature Office of Economic and Demographic Research Floridarsquos per capita personal income grew 04 during the 3rd quarter of 2012 compared to 05 nationally ranking the state 35th in growth Job Growth and Unemployment In the years leading up to the recent recession unemployment in Florida started increasing from the very low rates of 33 in early 2006 to 45 in November 2007 As the economic slow-down turned into a recession in December 2007 Floridarsquos unemployment rate rose from 47 to a high of 114 in February 2010 eight months after the official end of the recession Since that time the rate has fallen to 80 in December 2012 This rate places Florida at 41st in the country At 80 approximately 749000 residents are unemployed Since the Statersquos peak in employment more than 672000 jobs have been lost To recover from this loss and to accommodate for the additions made to the work force more than 1000000 jobs will need to be created to return Florida to its peak level
Source US Bureau of Labor Statistics Federal Reserve Bank of St Louis
ECONOMIC OVERVIEW
Pinellas County Budget Forecast FY2014-2023 C-10
Housing Market Vigorous home price appreciation that outstripped gains in income and the use of speculative financing arrangements made Florida particularly vulnerable to the decelerating housing market and interest rate risks In 2006 almost 47 of all mortgages in the state were considered ldquoinnovativerdquo (interest only and pay option ARM) With the ease of gaining access to credit long-term homeownership rates were inflated to historic levels ndash moving Florida from a long-term average of 663 to a high of over 72 Essentially easy cheap and innovative credit arrangements enabled people to buy homes that previously would have been denied At first the end of the housing boom brought lower activity and employment in the construction and financial fields as well as spillover consumption effects in closely related industries landscaping and sales of appliances carpeting and other durable goods used to equip houses This began in the summer of 2005 when the volume of existing home sales started to decline in response to extraordinarily high prices and increasing mortgage rates Closely linked to the housing industry Floridarsquos nonagricultural employment annual growth rate began to retreat from its peak in the fall of 2005 By the summer of 2006 existing home prices began to fall and owners started to experience negative wealth effects from the deceleration and losses in property value Mortgage delinquencies and foreclosures became commonplace as property prices further tanked in 2007 and the unemployment rate began to climb as part of a slow slide into a national recession that began in December 2007 By the fall of 2008 Floridarsquos homegrown problems with the housing market were giving way to several worldwide phenomena a national recession that was spreading globally and a credit crisis that was threatening to bring down the worldrsquos largest financial institutions As the sub-prime mortgage difficulties spread to the larger financial market it became clear that any past projections of a relatively quick adjustment in the housing market were overly optimistic Forecasts were dampened through the end of the fiscal year and then again as the excess inventory of unsold homes was further swollen by foreclosures and slowing population growth arising from the national economic contraction While small improvements were seen in late 2009 and early 2010 on the state and national fronts they seemed to sputter as the recovery struggled to take hold Largely these changes were related to Floridarsquos ongoing housing market woes and the gloomy national and global outlooks that plagued most of the year The growing inventory of unsold houses coupled with the sluggish credit crisis dampened residential construction activity throughout the entire year During FY2010 there were 36000 private housing starts for the year statewide but this was just 133 of the FY2006 level Single family starts managed to post a positive gain but multi-family starts worsened the percentage drop they made in FY2009 over FY2008 In yet another manifestation of the significant housing market adjustment still facing Florida existing single family home sales ended FY2010 nearly 30 below the peak volume of the 2005 banner year During 2011 the volume of sales edged up slightly to a level about 25 lower than the peak volume year
ECONOMIC OVERVIEW
Pinellas County Budget Forecast FY2014-2023 C-11
During 2012 the increase in volume continued but still remains at 82 of the sales level during the high-water year of 2005 Median sales prices however have not seen the same increase as volume As the chart below shows prices began to fall very quickly beginning in the last quarter of 2007 before reaching a bottom range between $130000 and $150000 in early 2009 From peak to trough prices fell 418
Source Florida Legislature Office of Economic and Demographic Research Jan 10 2013
FLORIDA OUTLOOK The background information below for the Statersquos economy is derived primarily from the January 10 2013 report Florida An Economic Overview by The Florida Legislature Office of Economic and Demographic Research
With the national recession almost four years behind us Floridarsquos economy is starting to show sustained improvements Growth rates are beginning to return to levels seen during lsquonormalrsquo periods but it will still take several years to make-up for the years of negative growth
ECONOMIC OVERVIEW
Pinellas County Budget Forecast FY2014-2023 C-12
Source Florida Legislature Office of Economic and Demographic Research
Major Economic Drivers
In addition to global and national economic conditions there are several major drivers that are key to the performance of Floridarsquos economy Those drivers include population growth tourism employment growth and new construction
Population Growth
Population growth continues to be the statersquos primary engine of economic growth fueling both employment and income growth and impacting the amount of new construction activity The national economic contraction significantly slowed Floridarsquos population gains but this was not unexpected Over 80 of the statersquos population growth comes from positive net migration primarily from people moving into Florida from other states From past studies it is clear that people are reluctant to move during recessions ndash first because of the inability to sell their homes and second because of the difficulty in finding new jobs Floridarsquos strong international migration which had been a bulwark was also affected by the global economic slowing Floridarsquos long-term population growth rate between 1970 and 1995 was over 3 The annual growth rate hovered between 20 and 26 from the mid 1990rsquos to 2006 and then began slowing to less than 05 in 2009 and 06 in 2010
ECONOMIC OVERVIEW
Pinellas County Budget Forecast FY2014-2023 C-13
In the near term population growth is forecast to remain relatively flat averaging 12 between 2012 and 2015 However over the forecast horizon population growth will improve ndash averaging 14 between 2015 and 2020 with 85 of the growth coming from net migration While this is still significant growth before the recession Florida was adding a city roughly the size of Miami every year in the future it will be a city more like St Petersburg Despite this lower growth rate Florida is still on track to break the 20 million mark in 2016 becoming the third most populous state sometime before then surpassing New York
Source Florida Legislature Office of Economic and Demographic Research Jan 10 2013
By 2030 Floridarsquos population is expected to grow by almost 5 million people The majority of this gain (559) will come from those 60 and older with those under 18 accounting for 149 of this gain Tourism The tourism industry is another key driver of Florida employment growth and economic strength Like other sectors of the economy tourism was hit hard by the recession as job losses and uncertainty coupled with other stresses caused potential visitors to be more conservative in their spending and cut back on their travel plans The industry also had to deal with the negative publicity that resulted from the 2010 Deepwater Horizon oil spill in the Gulf of Mexico (although actual beach damage in Florida was limited to the Panhandle area) During 2011 the impact of these factors declined Tourism growth now appears to be on a steady upward trajectory
ECONOMIC OVERVIEW
Pinellas County Budget Forecast FY2014-2023 C-14
Employment Growth and the Labor Market Floridarsquos current unemployment numbers represent a loss of more than 672000 jobs from the peak with the statersquos negative over-the-year growth rate actually beginning in March 2007 With a projection of about 2500 new working-age people being added to the Florida market each month it will take the creation of about 1000000 jobs to return to the peak level of employment The job market showed strength throughout the year with 89700 jobs being added in November This growth was lead by the leisure and hospitality (+31200) business and professional services (+27500) trade (+22000) and education and healthcare (+17000) industries which performed strongly Negative job growth in government (-7800) and construction (-4400) continue to slow the growth in Florida
Source Fishkind amp Associates Econocast Weekly Jan 07 2013
For wages and salaries Floridarsquos long-term growth prospects essentially match the national forecast However Floridarsquos average annual wages largely fall below the nation as a whole Projections for unemployment show a gradual reduction over the next eight or nine years for Florida dropping to 55 by 2020 from the current level of 80 New Construction and Housing Floridarsquos housing markets are generally improving Sales volume of existing homes and building permits are both back in positive territory showing year-over-year growth The number of documentary stamp tax collections reflects this trend
ECONOMIC OVERVIEW
Pinellas County Budget Forecast FY2014-2023 C-15
Source Florida Legislature Office of Economic and Demographic Research Dec 5 2012
Recent building permit activity has come in better than expected Building permit activity is growing with a 262 increase year-over-year for the first nine month of 2012 Foreclosures have further swelled Floridarsquos unsold inventory of homes Originally related to mortgage interest rate resets and changes in financing terms that placed owners in default activity was also affected by the continuing high level of unemployment In CY2012 Florida had the highest foreclosure rate in the country displacing Nevada at the top of this dubious list At 858 days Florida has the third longest foreclosure process in the United States These two factors along with the struggling economy suggest that the foreclosure problem will remain with Florida for several more years as the existing inventory and inventory soon to be added slowly makes its way through the process
ECONOMIC OVERVIEW
Pinellas County Budget Forecast FY2014-2023 C-16
Foreclosure Activity December 2012
Top 10 Florida Counties
Source RealtyTraccom
A related problem is the ldquoshadow inventoryrdquo of homes that are not on the market but are at risk of foreclosure About 40 of all residential loans in Florida are for homes that are ldquounderwaterrdquo that is have mortgage debt higher than the value of the house However rising home prices in 2012 helped more than 700000 previously underwater homeowners return to a position of equity in their homes There is also a significant percentage of homeowners who are not current with their mortgage payments
Delinquent
Foreclosed Non-
Current National 70 36 106 Florida 78 121 198
Source Florida Legislature Office of Economic and Demographic Research Jan 10 2013
The credit market impacts both employment growth and new construction Although interest rates continue to remain at record low levels credit conditions for those seeking to buy a home or homeowners seeking to refinance remain tight
ECONOMIC OVERVIEW
Pinellas County Budget Forecast FY2014-2023 C-17
The end result of these factors is that in the residential property market sales volume is expected to increase while prices appear to have begun the recovery from their historic lows
State Budget The State of Floridarsquos budget is highly dependent on sales tax revenue accounting for more than 70 of revenues In times of economic distress consumers tend to cut back on discretionary spending which in a state dependent on sales tax will have an immediate effect on revenue Unlike many other states Florida does not have a state personal income tax which is a more stable source of revenue because wages tend to fall at a slower rate than consumption As a result the recession caused major State budget shortfalls and the effects are still being felt in this yearrsquos budget In recent years the State made heavy use of one-time fixes such as diverting revenue from trust funds ($41 billion over 10 years) and using Federal stimulus funds to avoid larger cuts in education and other programs On the expenditure side the single largest driver in State obligations is Medicaid which is projected to increase at an annual rate of 79 over the next 10 years This does not include the potential impact of Federal Health Care Reform As the 2013 Legislature prepares to return to Tallahassee the projected State FY2014 budget is projecting a $480 million surplus the first surplus in six years Summary of Florida Outlook Floridarsquos economy appears to have turned around The major drivers of economic growth are showing signs of improvement The statersquos primary source of economic growth population growth has improved from the very low rates of 2009 (lt05) and 2010 (06) From 2012 to 2015 population growth is expected to average 12 then increase to 14 through 2020 Tourism which was hit hard by both the global recession and the 2010 BP Deep Horizon oil spill has improved greatly The jobs associated with tourism especially in the leisure and hospitality industry grew more than any other industry in 2012 as visitors returned to the beaches and theme parks around the state As the recovery continues the long-range unemployment rate is projected to fall steadily from the current level of 80 to 55 by 2020 Floridarsquos housing market continues to show signs of improvement Sales volume of existing homes has increased most of 2012 However foreclosures continue to depress sales prices around the state In 2012 Florida had the highest foreclosure rate in the country with 198 of all residential mortgages non-current on their mortgage payments The subsequent turnaround in Florida housing will be led by
Low home prices that begin to attract buyers and clear the inventory Long-run sustainable demand caused by continued population growth and household
formation Floridarsquos unique demographics and the aging of the baby-boom generation (2011 marked the
first wave of boomers hitting retirement age)
ECONOMIC OVERVIEW
Pinellas County Budget Forecast FY2014-2023 C-18
Looking ahead the pace of the economic recovery depends heavily on how quickly the job market recovers from the Great Recession the capacity for personal income growth to move ahead of inflation and a substantial reduction in the supply of unsold residential properties
The Local Economy BACKGROUND The context of this section is from the perspective of background impacting the Pinellas County budget Property Value Increases From FY2002 to FY2007 there were unusually large increases in property values in Pinellas County and throughout the state Across Florida public budget hearings brought out many citizens who were upset about their proposed property taxes as presented on their ldquoTruth in Millagerdquo (TRIM) notices Most of those who expressed their frustration were persons who owned property that was not homesteaded and therefore not protected by the ldquoSave Our Homesrdquo taxable value increase cap such as commercial and rental business owners and owners of second homes In response to the publicrsquos concerns the Board of County Commissioners reduced the FY2007 county-wide millage rate by 0701 mills (over 10) the first millage rate reduction since the 1997 budget year Impact of Save Our Homes Amendment Not all local governments were as responsive to the situation as Pinellas and this dramatic growth in taxable values resulted in a surge in property tax revenues that became the focus of legislative concern In reality the primary problem was the systematic inequity resulting from the ldquoSave Our Homesrdquo amendment to the Florida Constitution which has capped the growth in taxable values for homesteaded properties (permanent residences) since 1996 The amendment was intended to protect homeowners from escalating property tax bills resulting from growth in market value a situation that was perceived to be forcing some people particularly residents on fixed incomes to sell their homes While this objective was achieved there were dramatic and in many cases unforeseen consequences as a result of Save Our Homes Because of the large amount of market or ldquojustrdquo value not taxed due to the Save Our Homes exemption a disproportionate share of any increase in tax revenue had been placed on properties that were not established permanent residences such as businesses rental properties and newly purchased homes The increases in values for fiscal years 2002 through 2007 notwithstanding the historical trend over the previous sixteen years in Pinellas had been an average annual increase of about 5 in values (including new construction) Most observers believed that the market would correct itself and return to more normal patterns To some extent the value growth part of the problem could be expected to correct itself over time Legislative Property Tax Roll-Backs The Florida Legislature perceived property tax reform as one of the two most critical issues (along with property insurance reform) that needed to be addressed in 2007 In June a three-day Special Session of the Legislature produced a mandate that was unlike anything ever seen before in its forced reductions in property taxing capability of local government in Florida The Legislature did not make
ECONOMIC OVERVIEW
Pinellas County Budget Forecast FY2014-2023 C-19
similar reductions to FY2008 school property taxes which they control even though these taxes make up about 40 of most property ownersrsquo tax bills Unfortunately this solution failed to address the real inequities that were the focus of public discontent and instead has the potential for even greater disparities in the future The Legislature adopted two key items impacting property tax reform The first approach involved statutory changes requiring all counties cities and special districts to roll back property tax collections in FY2008 to a point below the FY2007 collections adjusted for new construction (also known as the ldquorolled-back raterdquo) This target ranged from 3 to 9 below the rolled-back rate depending on the Statersquos calculation of how much the taxing authorityrsquos property tax revenue increased from FY2002 to FY2007 Independent Districts and Dependent Districts many of which have the primary purpose of providing Fire or Emergency Medical Services were all targeted at 3 below the rolled-back rate These calculations and the resulting reduction categories did not adequately acknowledge the lower tax profile of Pinellas Pinellas County was required to cut 7 below rolled-back (the second-most-severe level) even though
o The Countyrsquos FY2002ndashFY2007 percentage increase in per capita property tax was below the statersquos average increase for counties
o The Countyrsquos FY2007 per capita property tax was less than Orange Hillsborough (and other counties) that were in the 3 or 5 cutback categories
o A city with the same percentage increase was required to cut only 5 o The Statersquos numbers did not reflect seasonal or tourist population impacts and o The Statersquos numbers did not take into account the additional cost pressures for an urban
coastal county (such as property insurance) Property Tax Revenue Cap The other item adopted by the Legislature with important long-term implications was the implementation of a property tax revenue cap Effective FY2009 property tax revenue increases are limited to new construction plus the statewide percentage increase in per capita personal income This percentage has averaged about 38 from 1991-2008 From 2009-2012 growth in personal income was below average or only 1-3 Even this minor increase is neutralized by the historic decreases in property valuation The cap requires that the maximum millage rate that can be approved by a simple majority vote of the Board of County Commissioners equals the prior yearrsquos maximum rolled-back rate adjusted for the change in per capita Florida personal income A two-thirds vote of the Board may approve up to 110 of this maximum Any higher millage rate requires a unanimous vote of the Board or a referendum Based on information from the Florida Department of Revenue the County has some flexibility for increases above the property tax revenue cap in the short term because the Board has not levied the maximum millage since the baseline was set in FY2008 The long-term impact of this cap is that property tax revenue will be constrained even if taxable values increase beyond the average increase in personal income To date the County has not seen an impact from this cap because values have actually declined since it was passed However due to the
ECONOMIC OVERVIEW
Pinellas County Budget Forecast FY2014-2023 C-20
bursting of the housing bubble and the negative impact of foreclosures the baseline of values has been set artificially low which will keep property tax revenues constrained by a higher than anticipated margin Impact of Amendment One The FY2009 budget situation was unique in several ways This was largely due to the passage of Amendment One placed on the ballot by the Legislature and approved by the voters of Florida on January 29 2008 which reduced property tax revenues Also the economic downturn which began in FY2008 intensified which further reduced property taxes and also reduced revenues from other important sources Amendment One made the following changes which reduced taxable property values and revenues available to local government
o ldquoDoubledrdquo the existing $25000 homestead exemption (except for school taxes)
o Allows for up to $500000 of the Save Our Homes exemption to be applied to another property (portability)
o Imposed a 10 cap on assessments for non-homestead property (school taxes exempt)
o Instituted a new tangible personal property exemption of $25000 Impact of the Recession At the same time that the impact of Amendment One was being felt the real estate ldquobubblerdquo burst and market values for property declined dramatically The result was an unprecedented decrease in the property tax base Since World War II the average annual increase in taxable value is about 5 Since 2009 the County-wide taxable value has decreased 84 114 97 and 45 with another 18 decrease in FY2013 Normally some of this revenue decrease would be offset by the rest of the revenue mix such as sales taxes state revenue sharing and other miscellaneous revenues Unfortunately the general economy deteriorated to the point that virtually the entire mix of non-property tax revenues also declined substantially The end result of all of these changes was a large negative impact to the Countyrsquos revenues which have resulted in significant reductions across all of the Countyrsquos funds Impacts to the Pinellas County Budget Since the recession began the County has been faced with resizing the organization to fit the new fiscal reality stemming from legislative action the bursting of the housing bubble and the recession Since FY2007 total positions have decreased 1618 or 25 Within that number the BCC departments have decreased 985 positions or 35 which yields the lowest position count since FY1985 The Constitutionals and Independents have decreased 633 positions or 17 which yields the lowest position count since FY1995 The total position count is currently the lowest since FY1989 In the General Fund the Countyrsquos largest fund that funds most of its operations property taxes (two-thirds of total revenues) have decreased 35 or $151 million from FY2007 to FY2013
ECONOMIC OVERVIEW
Pinellas County Budget Forecast FY2014-2023 C-21
LOCAL OUTLOOK Pinellas County is the 6th largest county in population (916542) and is the most densely populated in the State Pinellas County is mostly built out and expects limited population growth in the future The County is the most popular tourist destination on the Gulf of Mexico drawing 13 million tourists annually Pinellas County is part of the Tampa-St Petersburg-Clearwater Metropolitan Statistical Area (MSA) comprised of Hernando Hillsborough Pasco and Pinellas counties Below is a chart of Employment by Industry for Pinellas County
Source Florida Labor Market Statistics
Over the last five years several of these areas have seen substantial decreases Natural resources mining and construction decreased 46 Manufacturing decreased 26 Information decreased 22 Financial Activities decreased 14 Trade Transportation amp Utilities decreased 11 Professional amp Business Services decreased 9 Other Services decreased 7 and Leisure and Hospitality decreased 4 The only areas that have shown growth since 2006 is Education amp Health Services which increased 11 and Total Government which increased 4 From Wells Fargorsquos May 2012 Florida Economic Outlook Tamparsquos labor market continues to post strong gains The professional and business services sector remains the top performing sector accounting for more than 50 percent of the jobs added since the Bay arearsquos labor market bottomed despite representing only 17 percent of Tamparsquos overall employment base Part of that improvement reflects strong growth at employment staffing companies The recovery has broadened across many other sectors more recently including leisure and hospitality financial services and trade transportation and utilities Construction remains an obvious impediment however as payrolls continue to contract and are now down nearly 53 percent from their peak in April 2006 Unemployment As with the State of Florida Pinellas Countyrsquos unemployment rate reached historically low levels in early 2006 In April 2006 Pinellas County recorded an unemployment rate of 30 As the chart below shows the Countyrsquos unemployment rate rose to 47 by the time the national recession began
Professional amp Business Services
169
Total Government
138
Leisure amp Hospitality
114
Education amp Health
Services 161
Information 23
Manufacturing 52
Other Services 38
Trade Transporation
amp Utilities 185
Financial Activities 79
Natural Resources Mining amp
Construction 42
ECONOMIC OVERVIEW
Pinellas County Budget Forecast FY2014-2023 C-22
in December 2007 reaching a high of 123 in January 2010 seven month after the official end of the recession Since then the Countyrsquos unemployment rate has fallen to 79 (November 2012)
Source Federal Reserve Bank of St Louis
Tourism Tourism is a key economic driver of the economy in Pinellas County and contributes direct and indirect visitor expenditures of $63 billion annually In FY2012 the County reported more than 5 million overnight visitors and collected $287 million in tourist development tax revenue also known as the lsquobed taxrsquo A positive sign of a recovering economy FY2013 collections are 103 higher through the first two months of the fiscal year than the same period in FY2012 which was a record year for Pinellas County Real Estate The real estate market in Pinellas County is struggling to recover from the bursting of the housing bubble Pinellas like the rest of Florida experienced a dramatic rise in housing values for several years during the housing boom Starting in FY2008 property assessments fell for five straight years (-84 -114 -97 -45 and -18) Residential Real Estate Over the last year home sales in the Tampa Bay area have risen However almost half of all the sales are distressed sales involving foreclosed properties Foreclosures continue to hold down the residential real estate market In 2007 there was an average of 628 foreclosure activities per month As unemployment increased and the economy slipped into recession foreclosure activity almost doubled in FY2008 to 1110 per month Activity remained extremely high through FY2009 and FY2010 before dramatically dropping off to 522 per month in FY2011 This drop-off coincided with the federal investigations of lsquorobo-signingrsquo of foreclosure documents As part of a settlement with federal regulators banks and others involved in the foreclosure process agreed to improve their procedures Since the settlement was signed in April 2011 foreclosure activity has begun to increase averaging 822 per month in FY2012 through September The most recent data from Realty Trac
ECONOMIC OVERVIEW
Pinellas County Budget Forecast FY2014-2023 C-23
shown in the chart below shows that most of the foreclosure activities are in the large population centers within Pinellas County
Foreclosure Activity ndash Pinellas County December 2012
Source RealtyTraccom
Summary of Local Outlook While the national recession has been over for more than three years the effects are still being felt in Pinellas County Unemployment is well above pre-recession levels and foreclosures have remained stubbornly high in the past several months However the biggest industry in Pinellas County tourism has shown signs of a strong recovery FY2012 tourist development tax revenues were 124 higher than FY2011 and each month in FY2013 has been higher than the same month in FY2012 And real property values appear to have begun to climb after five years of decreases As the national economy continues to improve Pinellas County is poised to recover as well However because of the high level of unemployment and the potential inventory of residential properties available on the market the recovery is expected to be slow and long
ECONOMIC OVERVIEW
Pinellas County Budget Forecast FY2014-2023 C-24
KEY ASSUMPTIONS
Pinellas County Budget Forecast FY2014-2023 D-1
The Key Assumptions portion of the Budget Forecast FY2014-2023 includes a discussion of the sources of information used to develop assumptions for revenues and expenditures that drive the ten-year forecasts for ten of the Countyrsquos key funds
Assumptions and Forecasting
Revenue Assumptions
o Overview
o Key Assumptions
o Supporting Information
Expenditure Assumptions
o Overview
o Key Assumptions
o Supporting Information
Assumptions and Forecasting Forecasting is not a precise science This is particularly true for forecasts that involve the economy Statistician Nate Silver in his recent book The Signal and the Noise Why So Many Predictions Fail ndash but Some Donrsquot notes the performance of the highly-respected Survey of Professional Forecasters in predicting the one-year growth or decline in Gross Domestic Product (GDP) Silver cites a study which revealed that the actual change in GDP has fallen outside the range of the grouprsquos predictions almost half the time The most recent example was in 2007 where all of the economists predicted growth in GDP even though the Great Recession was already under way As Silver says ldquoForecasting something as large and complex as the American economy is a very challenging taskrdquo Despite this uncertainty forecasting is a useful tool for identifying potential problems and the need for future action The forecasts in this document are a baseline using past trends current policies and assumptions about future conditions based on reasonable expectations We have not attempted to project significant future events such as recessions oil embargos or natural disasters However in each of the fund reviews we have identified the risks to the forecast that could significantly impact the projections In establishing revenue and expenditure assumptions we reviewed data and forecasts from a variety of economists government agencies industry associations and other sources In particular we referenced the State of Floridarsquos Revenue Estimating Conferences frequently The State utilizes a professional nonpartisan consensus process involving the Legislature the Governors Office and the States Division of Economic and Demographic Research in developing national and state economic forecasts that are used in all state planning and budgeting actions The current Conference projections end at FY2022 The projections are available online at httpedrstateflusContentconferencesindexcfm
KEY ASSUMPTIONS
Pinellas County Budget Forecast FY2014-2023 D-2
We also referenced federal agencies such as the Bureau of Labor Statistics the Census Bureau and several Federal Reserve banks as well as private research firms and educational institutions such as The Conference Board Wells Fargo Conway Pedersen Economics Inc the University of Central Florida and the University of Florida The County is not required to use this data but it provides useful background information for projecting changes in revenues and expenditures
Revenue Assumptions Property Taxes ndash General Fund EMS Fund and Fire Districts Fund
Overview Ad valorem taxes commonly called property taxes are assessed on real property and on tangible personal (business) property The tax rate is expressed in ldquomillsrdquo One mill is one dollar of taxes for each thousand dollars of taxable value For example a tax rate of 59 mills on a taxable value of $100000 yields $590 in taxes The Florida Constitution imposes a cap of 10 mills on the total of all County-wide ad valorem rates (which includes the General Fund countywide levy plus the levies for the Health Department and for Emergency Medical Services) A cap of 10 mills is also imposed on the combined total of all MSTU ad valorem rates (which includes the General Fund MSTU levy plus the levies for other dependent districts) The taxable values as of January 1st are established annually by the Property Appraiser and certified for budget purposes by July 1st Final taxable values following appeals and adjustments are certified following the completion of the Value Adjustment Board (VAB) appeals process which recently has been extending into February of the next calendar year
Millage rates are approved annually by the Board of County Commissioners by resolution as part of the budget process This process must follow the ldquoTruth in Millagerdquo (TRIM) law including timing advertisement and conduct of public hearings
Federal state county and municipal property is exempt from property taxes Besides the Homestead and Save Our Homes Exemptions discussed in the Economic Overview section various other exemptions may be available depending on the type of property
Key Assumptions The assumption in the forecast is that after five years of decline taxable values will begin to recover in FY2014 with a slow but sustained rate of growth thereafter
Change in Taxable Values ndash County-wide 2014 2015 2016 2017 2018 2019 2020 2021 2022 2023
25 25 30 30 30 30 30 30 30 30
KEY ASSUMPTIONS
Pinellas County Budget Forecast FY2014-2023 D-3
The County-wide taxable value is the basis for determining the County-wide revenue in the General Fund For the purposes of this forecast the FY2014 through FY2022 percentage change in taxable value for the Emergency Medical Service Fund and the Fire Districts Fund is assumed to be the same as the County-wide taxable value change The rates of growth in the General Fund MSTU and the Fire Districts Fund are projected to be 05 less than the County-wide growth rates based on past trends and the composition of the tax base in the unincorporated area Supporting Information For FY2014 the overall increase of 25 in countywide taxable values reflects differing anticipated changes in the major components of the tax base Within these categories changes in individual properties may vary significantly due to many factors including location (for example beach vs inland) or use (for example hotel vs retail) In the future the growth in property tax revenues will be restrained by the caps put in place by the Legislature in 2007 The amount of new construction in Pinellas County will not provide the boost that other counties that are not built-out will enjoy For example Orange and Hillsborough counties have large undeveloped areas that are available for major residential commercial and industrial expansions Impact of Foreclosures In determining the values as of January 1 2013 which serve as the basis for FY2014 calculations the Property Appraiser will factor in the impact of mortgage foreclosures Foreclosures do not have a significant impact on current year collections of taxes levied because of the recovery mechanisms for delinquent taxes If taxes are unpaid by June 1st a Tax Certificate is offered for sale by the Tax Collector The certificate is sold to an investor and the County receives the equivalent of the taxes due As a result of the recession recent years have seen a dramatic increase in tax certificate sales However although foreclosures do not affect the percentage of property taxes collected during the fiscal year they tend to depress market values of surrounding properties and this has a negative impact on the tax base Along with the rest of the state Pinellas County foreclosure filings increased significantly beginning in 2007 and were averaging about four times higher than the historical norm through 2009 After a decrease in 2010 due to chain-of-title issues and the delay of proceedings in the courts foreclosures once again increased in 2012 to a level about 50 higher than the pre-recession norm For the time being demand is such that new foreclosure inventory is being absorbed fairly efficiently A ldquoglutrdquo of non-mediated rulings could lead to a surge in inventory putting downward pressure on median sales prices which in turn would negatively impact the tax base The forecast assumes that the foreclosure inventory will not experience this type of surge
KEY ASSUMPTIONS
Pinellas County Budget Forecast FY2014-2023 D-4
Source Clerk of the Court data
Taxable values The taxable values for FY2013 were certified by the Property Appraiser on July 1 2012 The county-wide value decreased by 18 compared to the FY2012 values It was the fifth year in a row that the tax base declined Prior to this the tax base only decreased once since World War II a small -06 dip in FY1993
The growth in homesteaded taxable value is subject to the caps imposed by the Save Our Homes amendment This limits the annual growth in a propertyrsquos taxable value to the growth in the Consumer Price Index (CPI) or 3 whichever is lower If the CPI index is negative the allowable change in taxable values is also negative
KEY ASSUMPTIONS
Pinellas County Budget Forecast FY2014-2023 D-5
Save Our Homes Cap for Fiscal Year Based on Change in Consumer Price Index
2005 2006 2007 2008 2009 2010 2011 2012 2013 2014 19 30 30 25 30 0 1 27 15 30 17 There is a two-year lag in the CPI adjustment For example the fiscal year 2014 factor is the CPI change percentage for calendar year 2012
Sources Florida Department of Revenue and US Bureau of Labor Statistics
The factor used is the annual change in the CPI as of December each year For example the limit for FY2013 is the December 2011 index +30 which was issued by the US Bureau of Labor Statistics on January 19 2012 The limit for FY2014 will be the December 2012 index 17 which was issued by the US Bureau of Labor Statistics on January 16 2013 Property Taxes are normally one of the most reliable revenue sources available to local governments As a result most cities counties school districts etc rely on the stability of property taxes to build their budgets Unfortunately due to the combined result of mandatory legislative roll-backs the passing of Amendment One and a correction in the real estate market taxable values have decreased dramatically resulting in a negative multi-year impact in property tax revenue Property Tax Revenue Caps The revenue caps approved by the Legislature in 2007 require that beginning with FY2009 the maximum millage rate that can be approved by a simple majority vote of the Board of County Commissioners equals the prior yearrsquos maximum rolled-back rate adjusted for the change in per capita Florida personal income A two-thirds vote of the Board may approve up to 110 of this maximum Any higher millage rate requires a unanimous vote of the Board or a referendum The County has some flexibility for increases in the short term because we did not levy the maximum millage in FY2009 FY2010 FY2011 FY2012 or 2013 Another aspect of the declining market values (and the ldquodoublingrdquo of the Homestead Exemption from $25000 to $50000) has been the erosion of the amount of value shielded from taxes due to Save Our Homes Prices are now at the point where in some instances homesteaded residential market values have decreased below the prior yearrsquos taxable value This means that rather than an increase due to the Save Our Homes recapture rule some parcels with declining market values previously covered by Save Our Homes will see decreases in their taxable value for FY2014 Fund Variances Because of differences in the composition of their tax base individual fire districts are expected to vary significantly from the overall change The unincorporated area (MSTU) General Fund and Fire Districts Fund taxable value percentage change is assumed to be slightly less than the County-wide taxable value change Other funds not included in this forecast that are dependent on property taxes are the Palm Harbor and Feather Sound Community Service District Funds the Pinellas Public Library Cooperative Fund and the Health Department Fund With the exception of the Health Department the percentage change in taxable value will differ from the County-wide change depending on the composition of the tax roll in each area
KEY ASSUMPTIONS
Pinellas County Budget Forecast FY2014-2023 D-6
Sales Taxes ndash General Fund and Capital Projects Fund Overview Sales tax revenues are highly elastic increasing and falling with the health of the overall economy In addition to food and medicine certain other purchases are exempted from sales tax by legislation The County receives two types of sales taxes the Half-Cent Sales Tax and the Infrastructure Sales Tax (Penny for Pinellas) Half-Cent Sales Tax This General Fund revenue is a portion of the Statersquos six cent sales tax that is shared with counties and cities First authorized in 1982 the program generates the largest amount of revenue for local governments among the state-shared revenue sources currently authorized by the Legislature Sales tax revenue grew by 49 in FY2012 This was the second year of growth following four years of decline beginning in FY2006 We believe this is indicative of a return to sustained sales tax revenue growth
Infrastructure Sales Tax (Penny for Pinellas) The Penny for Pinellas is a 1 percent sales tax which is dedicated to capital improvement projects in Pinellas County such as facilities storm water improvements preservation land purchases roads bridges public safety parks and community centers The Penny makes capital projects and improvements possible without having to raise property taxes Without this funding it is estimated that property owners would have to pay another 15 mills on their property taxes With a sales tax approximately one-third of the total Penny funds are paid for by tourists and seasonal residents Key Assumptions For the State Shared Half-Cent Sales Tax in FY2014 and later years we anticipate growth approaching historical patterns A 40 growth rate is assumed for FY2014 reflecting the
KEY ASSUMPTIONS
Pinellas County Budget Forecast FY2014-2023 D-7
continuing economic recovery This is followed by a 35 growth rate throughout the FY2015-FY2023 forecast period In the near-term our projection is more conservative than the State General Revenue Estimating Conference which anticipates more robust FY2014 growth of 54 followed by 61 and 56 in FY2015 and FY2016 respectively
Change in Half-Cent Sales Tax Revenue 2014 2015 2016 2017 2018 2019 2020 2021 2022 2023
40 35 35 35 35 35 35 35 35 35
The revenue assumptions for the overall Penny sales tax are consistent with the Half-Cent sales tax However the growth rate in the Capital Projects Fund for the Penny sales tax is less at 30 growth from FY2014 to FY2023 This is because the Courts amp Jail allocation is a fixed amount that does not grow over time resulting in a slightly smaller growth rate for the Countyrsquos overall share of the Penny Supporting Information The statewide number from the State General Revenue Estimating Conference reflects population growth that will not be as significant a factor in Pinellas County as in other less built-out counties However we are confident that a strengthening local economy and stronger tourism will result in slightly better growth in the short term Data on potential future job creation growth (provided by Economic Development) and projected tourism growth (provided by the Convention and Visitorrsquos Bureau) support this view Our forecast essentially reflects about 15 to 25 per year growth over the rate of price inflation As a result we are not anticipating a return to the FY2006 peak level of our Half-Cent Sales Tax revenues until FY2016 Communications Services Tax ndash General Fund
Overview The Communications Services Tax (CST) which is 2 of total General Fund revenues is paid by unincorporated area residents and is dedicated entirely to providing services for them through the MSTU The CST legislation was enacted to restructure taxes on telecommunications cable direct-to-home satellite and related services that existed prior to October 1 2001 Previously a county could impose franchise fees on telephone and cable television within its boundaries Currently for charter counties a local CST may be levied at a rate up to 51 percent plus an add-on of up to 012 percent in lieu of imposing permit fees The County has levied the maximum rate of 522 since January 2003 The Communications Services Tax revenue has declined due to the recession and to technological changes in the industry that have reduced the base of taxable services FY2012 CST revenue (excluding audit adjustments) was 28 lower than in FY2011
KEY ASSUMPTIONS
Pinellas County Budget Forecast FY2014-2023 D-8
Key Assumptions The forecast projection reflects a continuation of the decline in this revenue source
Change in Communications Services Tax Revenue 2014 2015 2016 2017 2018 2019 2020 2021 2022 2023 -05 -05 -05 -05 -05 -05 -05 -05 -05 -05
Supporting Information The CST is levied on communication services that originate and terminate within the state Technological advances have allowed for increased competition from communication service providers (particularly wireless providers) which do not meet this definition and whose services are therefore not subject to the CST The 2012 Legislature approved changes to the CST statutes and a State commission the Communications Services Tax Working Group was appointed to study the CST and recommend further structural changes that may lead to even greater reductions in revenue The Working Group is proposing the complete elimination of the CST placing all communications services under the sales tax and increasing the State Sales Tax from 60 to 634 The intent of the proposal is to be ldquorevenue neutralrdquo to the State and to local governments but detailed calculations have not yet been made The cumulative impact of the 2012 changes and the restructuring if it occurs is undetermined at this time State Revenue Sharing - General Fund Overview State Revenue Sharing is primarily based on the Statersquos sales tax revenue The formula for Revenue Sharing is subject to adjustment by the Legislature Similar to the Half-Cent Sales Tax Revenue Sharing revenue demonstrated a second year of growth increasing 34 in FY2012 Prior to FY2011 this source had declined or remained essentially flat since FY2006 As discussed in the section on Expenditure Assumptions the 2012 Legislature as part of the unfunded Medicaid mandate directed that Revenue Sharing distributions to the counties be reduced in order to cover the alleged ldquobacklogrdquo of Medicaid charges This will result in Pinellas County receiving only about two-thirds of the normal Revenue Sharing allocation in FY2013
KEY ASSUMPTIONS
Pinellas County Budget Forecast FY2014-2023 D-9
Key Assumptions For the underlying sources that support State Revenue Sharing the forecast assumes a return to the pattern of moderate growth in this revenue source that predated the economyrsquos boom and bust cycle resulting in an annual increase of 25 through the forecast period However the actual amount the County receives will be reduced in FY2013 through FY2017 The original FY2013 budget showed this as a reduction in revenue After further review the Clerkrsquos Finance Division is posting revenue at the entire ldquoearnedrdquo amount and posting the backlog holdback amount as an expenditure This has no net effect on the projections
Change in State Revenue Sharing Revenue (before Medicaid mandate reductions)
2014 2015 2016 2017 2018 2019 2020 2021 2022 2023 25 25 25 25 25 25 25 25 25 25
Supporting Information State Revenue Sharing has historically grown at a somewhat lower rate than Half-Cent Sales Taxes In addition to differences in the distribution formulas for these two revenues a portion of Revenue Sharing is derived from Cigarette Taxes which have been a declining revenue source for years These factors combine to reduce the potential for growth in Revenue Sharing Interest Earnings and Other Revenue ndash All Funds Overview The County earns interest on fund balances These funds are invested by the Clerk of the Circuit Court in accordance with the Board of County Commissionersrsquo approved Investment Policy All investment activity is conducted in accordance with Section 218415 Florida Statutes and Section 2-144 of the Pinellas County Code The primary objective of the policy is the safety of County funds The second objective is the provision of sufficient liquidity The third objective
KEY ASSUMPTIONS
Pinellas County Budget Forecast FY2014-2023 D-10
subordinate to safety and liquidity is to maximize the return on the investment portfolio while avoiding unreasonable investment risk Key Assumptions Market conditions including record low interest rates were such that interest earnings in FY2012 were once again minimal The forecast reflects the short term outlook for continued low earnings gradually increasing to earnings of approximately 3 on fund balances in the mid- to long-term
Interest Earnings on Fund Balances 2014 2015 2016 2017 2018 2019 2020 2021 2022 2023 07 10 15 30 30 30 30 30 30 30
In each fund forecast the major revenue sources that comprise most of the available resources are specifically analyzed Depending on the fund the remaining revenues may include licenses and permits charges for services fines and forfeitures rents surplus refunds reimbursements and other miscellaneous revenues For these other revenues the forecast assumes the same flat to moderate growth which reflects the anticipated gradual economic recovery
Change in Other Revenue (non-specific) 2014 2015 2016 2017 2018 2019 2020 2021 2022 2023
20 20 20 20 20 20 20 20 20 20
Key Assumptions for Other Fund-Specific Revenues Tourist Development Tax- TDC Fund Tourism is a key driver of the economy in Pinellas County The County imposes a 5 tourist development tax (ie bed tax) on rents collected for temporary lodgings The revenue highly sensitive to general economic and other conditions is driven by several factors including the number of visitors the length of stay and the Average Daily Rate (ADR) that hotels are able to collect for rentals Tourist Development tax revenues have been steadily improving since Spring 2010 and reached record levels in FY2012 FY2013 revenues are estimated to grow 4 beyond actual receipts for FY201 and are anticipated to continue to increase at 35 in FY2014 Beyond FY2014 projections continue to increase by 30 annually through the forecast period matching anticipated gradual growth as part of the recovery in the broader US economy
Change in Tourist Development Tax Revenue 2014 2015 2016 2017 2018 2019 2020 2021 2022 2023
35 30 30 30 30 30 30 30 30 30
KEY ASSUMPTIONS
Pinellas County Budget Forecast FY2014-2023 D-11
Gas Taxes - Transportation Trust Fund The County receives several types of gas tax including State Shared Gas Taxes and Local Option Gas Taxes These revenues are dedicated for transportation-related expenditures and are deposited in the Transportation Trust Fund The State Transportation Revenue Estimating Conference forecasts annual average revenue growth of 19 but this is based on the forecast of total gallons of motor fuel pumped annually in Florida The Countyrsquos gas taxes are based on gallons consumed and not fuel prices and revenue has declined 03 in FY2011 and 02 in FY2012 Pinellas Countyrsquos built out condition and future mandated vehicle fuel efficiency standards leads us to assume a continuing slow decline in these revenues Although the County has the potential to levy an additional 1 to 5 cents in Local Option Gas taxes there are no tax rate increases built into the forecast
Change in Gas Tax Revenues 2014 2015 2016 2017 2018 2019 2020 2021 2022 2023 -05 -05 -05 -05 -05 -05 -05 -05 -05 -05
Ambulance User Fee Revenue ndash EMS Fund Ambulance user fee revenues are subject to a number of variables Unanticipated changes in transport volume (positive or negative) Unanticipated Medicare audit settlements (positive or negative) Potential reductions to Medicare fee schedules (negative) Decreasing mix of private insurance payments and increasing mix of lower-reimbursement
Medicare and Medicaid payments (negative) Increased Medical Necessity verification requirements (negative) Ambulance user fee revenues are primarily driven by patient demand (transport volume) The average increase in transport volume from FY2010 to FY2012 was 20 The average increase or 10 years was 313 ranging from 05 to 74 Revenues are estimated to increase by 20 during the forecast period
Change in Ambulance User Fee Revenue 2014 2015 2016 2017 2018 2019 2020 2021 2022 2023 20 20 20 20 20 20 20 20 20 20
Flight Operations Revenues ndash Airport Fund AirfieldFlight Line revenue for FY2013 is based on the current level of carriers and passenger numbers For FY2014 through FY2023 an increase of 20 per fiscal year is forecast The forecast assumes no new carriers over the ten year period
Change in Airport Flight Operations Revenues
2014 2015 2016 2017 2018 2019 2020 2021 2022 2023 20 20 20 20 20 20 20 20 20 20
KEY ASSUMPTIONS
Pinellas County Budget Forecast FY2014-2023 D-12
Airport RentLeasesConcessions Revenues ndash Airport Fund RentLeasesConcessions revenue for FY2013 is based on current leasesagreements through the termination of these lease agreements Land leases have a five-year adjustment based on the CPI For FY2014 through FY2023 an increase of 20 is forecasted for each fiscal year The County General Fund leases land for the Jail the Criminal Justice Center and other uses from the Airport They comprise 45 of the long-term industrial (non-aviation) land leases
Change in Airport Rental Revenues 2014 2015 2016 2017 2018 2019 2020 2021 2022 2023 20 20 20 20 20 20 20 20 20 20
Water and Sewer Rates In FY2012 the Board of County Commissioners approved a four-year rate plan for both the Water and Sewer systems to meet projected revenue needs through FY2015 Water Funds Revenue In addition to its retail water customers the County has provided water at wholesale rates to six cities that purchase water in bulk and distribute it to their own retail customers The volume of water purchased declined 30 from FY2008 to FY2012 partially due to several of the cities beginning to develop alternative sources of water The amount of water purchased is also affected by economic conditions housing and commercial vacancies and levels of conservation The Water revenue forecast assumes only a 0 to 027 annual increase in retail water demand over the forecast period due to the expected slow growth in the economy The wholesale water demand reflects a continuing decline through FY2016 due to the projected loss of sales to three cities (Clearwater Tarpon Springs and Oldsmar) as they develop their own water resources Sewer Funds Revenue The volume of waste billed has declined 3 from FY2008 to FY2012 The amount of sewage processed is affected by economic conditions housing and commercial vacancies and levels of water conservation The Sewer revenue forecast assumes no increase from FY2013 to FY2014 and a 007 to 021 annual increase from FY2017 to FY2023 in retail and wholesale sewer demand Solid Waste Funds Revenue Tipping fees for the Solid Waste facility are not anticipated to increase during the forecast period Revenues are expected to grow about 05 annually The contract for electricity sales to Progress Energy contains annual escalations of 6 in revenue The contract expires in 2024
Change in Solid Waste Tipping Fee Revenues 2014 2015 2016 2017 2018 2019 2020 2021 2022 2023 05 05 05 05 05 05 05 05 05 05
KEY ASSUMPTIONS
Pinellas County Budget Forecast FY2014-2023 D-13
Expenditure Assumptions Personal Services ndash Salaries ndash All Funds Overview The cost of Personal Services (salaries and benefits) is generally the single largest category of expense (for example 50 of the General Fund) Prior to FY2009 the range of salary merit adjustments generally varied from 0 to as high as 7 No merit pay increases have been granted to County employees in five years (six years for exempt employees) Beginning on July 1 2012 employees are required to contribute 3 of salary to the Florida Retirement System effectively reducing take home pay A limited non-recurring compensation adjustment was approved for FY2013 Key Assumptions Compensation adjustments are included in the forecast for FY2014 through FY2023 County employees have not received merit pay increases for four years and in some cases five years This cost-saving measure was employed as the organization dealt with significant reductions and dramatic decreases in property tax revenue For FY2013 a one-time cost of living wage disbursement was approved In future years moderate pay for performance merit increases are expected to resume to maintain a compensation structure that can attract and retain quality employees No automatic cost of living increases are anticipated in the forecast
Change in Salaries (Merit Increases ndash Net) 2014 2015 2016 2017 2018 2019 2020 2021 2022 2023
0-3 0-3 0-3 0-3 0-3 0-3 0-3 0-3 0-3 0-3
Supporting Information The annual market survey of salaries and benefits for comparable area organizations is being reviewed at this time We have already seen indications that salaries for current employees are becoming non-competitive Additional funds may be required for potential re-classifications due to the reorganizations and reductions in force which have occurred over the past several years Non-recurring compensation adjustments such as one-time flat-amount payments could also be implemented without negatively impacting the forecast Personal Services ndash Employee Benefits ndash All Funds
Overview
The County is responsible for employer contributions to Social Security (FICA) the Florida Retirement System (FRS) State pension fund and to support various other benefits such as health and life insurance short term disability workers compensation and unemployment compensation The two key drivers for employee benefits are the Countyrsquos share of pensions and health insurance costs
KEY ASSUMPTIONS
Pinellas County Budget Forecast FY2014-2023 D-14
Florida Retirement System (FRS) The County is required to participate in the Florida Retirement System (FRS) a State public pension plan Cities have the option of joining the State system or creating their own pension plans Employees of school districts and state agencies also must enroll in FRS and comprise about two-thirds of the total active membership
Source State Board of Administration Investment Report for State Fiscal Year 2012
From 1998 to 2008 the FRS had been one of the few state systems that had an actuarial surplus This lowered the required contributions set by the Legislature that are based on an employeersquos salary and benefit category (public safety employees and elected officials have higher benefits) As with most other pension systems the financial system crisis in the fall of 2008 had a significant effect on the value of FRS investments As a result beginning in 2009 the FRS system has had an unfunded liability
KEY ASSUMPTIONS
Pinellas County Budget Forecast FY2014-2023 D-15
Source State Board of Administration
Investment Report for State Fiscal Year 2012
The FRS investment portfolio which is managed by the State Board of Administration has now substantially recovered from this setback As of March 31 2011 the net asset value for the FRS pension plan was close to the peak value it had reached in 2007
Source State Board of Administration Investment Report for State Fiscal Year 2012
However the 2011 session of the Legislature determined that significant changes were needed in the FRS system These changes are summarized in the following table
KEY ASSUMPTIONS
Pinellas County Budget Forecast FY2014-2023 D-16
These changes affected the future retirement benefits for County employees on the payroll prior to July 1 2011 as well as those hired after that date when these provisions took effect The major impact on the Countyrsquos expenditures results from changing FRS from a non-contributory to a contributory structure This allowed the Legislature to significantly reduce the employer contribution rates for FRS and not coincidentally balance the State budget The rate reductions also resulted in substantial FY2012 cost savings for the County amounting to $13M in the General Fund alone as compared to earlier projections The 2012 Legislature approved rates for the Statersquos 2013 fiscal year (June 2012 to July 2013) that were essentially the same as the previous year Looking ahead employer rates are scheduled to increase in July 2013 under current legislation and the future direction of legislative action cannot be predicted In addition to this general uncertainty the requirement for employee contributions to FRS had been challenged by a lawsuit filed on behalf of public employees by several labor organizations On January 17 2013 the Florida Supreme Court issued its ruling in this case which upheld the employee contribution requirement This avoided potential increases to employer contributions which could have negatively impacted personnel costs Health Insurance Health insurance costs for the County have followed the national trend and outpaced inflation in recent years These increases have been mitigated by the Countyrsquos aggressive cost containment measures including the renegotiation of pharmacy and health contracts the creation of a medication management program increased wellness programs and incentives for employees and the introduction of a fully insured Medicare Advantage Group plan for Medicare-eligible retirees Key Assumptions As of June 30 2012 the FRS system was still only 869 funded
KEY ASSUMPTIONS
Pinellas County Budget Forecast FY2014-2023 D-17
Source Milliman presentation to FRS Actuarial Assumptions Estimating Conference October 1 2012
Due to the reduced value of the Statersquos pension fund investments we are assuming increases in the FRS contribution requirements The forecast assumes that the State will increase rates to address the unfunded liability over the next four years rather than all at once as contemplated in the 2012 legislation because increases in these rates also have negative impacts on the budgets of State agencies and the school districts After reaching a fully funded level the rates should stabilize but there is a large degree of uncertainty in that the Legislature and Governor have demonstrated that they are willing to make major structural changes to the pension system
Projected FRS Employer Blended Contribution Rates (Regular Class) 2014 2015 2016 2017 2018 2019 2020 2021 2022 2023
566 600 640 681 681 681 681 681 681 681
The growth in the Countyrsquos FRS dollar contributions will be a combination of these rate changes and the growth in the salary base to which the rates are applied
Change in FRS Dollar Contributions 2014 2015 2016 2017 2018 2019 2020 2021 2022 2023 30 85 92 89 25 25 25 25 25 25
From 2018-2023 rates are assumed to stay constant but dollar contributions rise at the same rate as salary growth
The forecast assumes that the Countyrsquos aggressive health insurance cost containment measures will continue but that the near-to-mid-term need to supplement required self-insurance reserves as well as longer-term cost increases and employee retiree mix changes will still result in expenditure growth well in excess of CPI throughout the forecast period
KEY ASSUMPTIONS
Pinellas County Budget Forecast FY2014-2023 D-18
The Affordable Health Care Act (ACA) passed in 2010 on the national level to restructure and contain health insurance costs could have a significant impact The forecast does not assume any changes in the current situation some of the potential implications of the ACA are discussed in the Supporting Information below
Change in Health Insurance Contributions 2014 2015 2016 2017 2018 2019 2020 2021 2022 2023 100 100 100 100 100 100 100 100 100 100
The combined result of the forecast changes in salaries and benefits results in the following overall change to Personal Services costs
Change in Personal Services Expenditures (Net Total Salary and Benefit Changes)
2014 2015 2016 2017 2018 2019 2020 2021 2022 2023 41 40 40 40 40 40 40 40 40 40
Supporting Information Health insurance costs are affected by changes in the workforce As the number of active employees decreases due to budget reductions and the number of retirees in the health plan increases costs are spread over a smaller base In recent years the ratio of active employees to retirees has changed from 3 actives for every retiree to 2 actives for every retiree while costs per position have increased The result is that County employer contributions per active position have increased at a higher rate than cost inflation This trend is expected to continue Because the County is self-insured we are required to maintain the equivalent of 2 months of medical claims as a reserve Higher-than-average claims in recent years have led us to draw on our reserves such that they are below the required level This is exacerbated by the employee retiree mix changes discussed above In the near-term OPEB reserves are available to cover the deficit The details of how the Affordable Care Act (ACA) will be implemented in Florida are still being determined The following graphic illustrates the overall timeline of events that will impact employer group health plans such as the Countyrsquos
KEY ASSUMPTIONS
Pinellas County Budget Forecast FY2014-2023 D-19
Timeline Source Buck Consultants presentation ndash July 2012
Florida will be one of a number of states that will not set up a State-run Health Exchange at least initially Instead implementation will default to a Federal-run Exchange
Source Kaiser Family Foundation - Health Reform website
(data as of January 4 2013)
KEY ASSUMPTIONS
Pinellas County Budget Forecast FY2014-2023 D-20
In the future as the ACA is fully implemented the County may be able to consider new structural options For example the County could eliminate the self-insurance system and provide employees an amount to purchase coverage on the Health Exchange Detailed analysis would be needed before implementing any significant structural changes Note that the actual change in Personal Service costs in a department agency or fund may differ from these overall percentages due to reorganizations changes in the number of positions vacancies and other factors specific to the entity Operating Expenses and Capital Outlay- All Funds Overview The cost of services commodities and equipment (Operating Expenses and Capital Outlay) are driven by inflation Many costs will track closely with the Consumer Price Index (CPI) but items such as fuel chemicals and construction materials often exceed that pace The difference between inflation as measured in the CPI and the cost pressure on local governments is illustrated by the Municipal Cost Index (MCI) developed by American City amp County The MCI draws on the CPI the Producer Price Index (PPI) the Construction Cost Index (CCI) monthly statistical data collected by the US Departments of Commerce and Labor and independently compiled data to project a composite cost picture that more accurately reflects inflationary impacts on counties and cities The higher inflationary pressure on local governments is reflected in the report issued by American City and County for December 2012 Compared to the same period last year the Municipal Cost Index increased 20 versus the 17 increase in the CPI In Pinellas County expenses such as fuel electricity and state-mandated Medicaid charges reflect the MCICPI disparity demonstrating historical and projected growth exceeding CPI growth Fuel Fuel costs are dependent on the amount of fuel purchased as well as the price of fuel The County has reduced the size of the fleet and increased fuel efficiency As a result gallons purchased have declined from 136M in FY2008 to 103M in FY2012 for non-Sheriff units Beginning in late FY2011 the Sheriff began purchasing fuel through the Fleet Management Fund which added 102M gallons in FY2012 This change increased total gallons purchased but the expenditures in the Fleet Management fund were offset by an equivalent amount of revenue from the Sheriffrsquos budget Electricity The Countyrsquos office facilities are generally charged a commercial rate for electricity by Progress Energy Historically these rates have averaged annual increases of 5
KEY ASSUMPTIONS
Pinellas County Budget Forecast FY2014-2023 D-21
Medicaid The County is billed by the State for a portion of Medicaid costs The County pays the State for County resident in-patient hospital care for days 11 through 45 The days do not have to be consecutive Because patient stays of less than 11 days or more than 45 days are not paid by the County there is not a strong correlation between the Countyrsquos Medicaid bill and an increase in unemployment from the recession Key Assumptions The forecast assumes that the cost of services commodities grants and aids and equipment will generally track the CPI increases developed by the State in their consensus Revenue Estimating Conference These projections were reviewed against those from various other sources including the Survey of Professional Forecasters the University of Central Florida and the Federal Reserve While there are variations in the specific percentages all of these sources projected continuing low to moderate cost inflation over the forecast period
Change in Other Non-Personnel Expenditures (CPI) 2014 2015 2016 2017 2018 2019 2020 2021 2022 2023 15 18 17 20 19 21 20 20 20 20
Fuel - All Funds with Fleet Equipment The FY2013 Budget baseline was based on a price of $350gallon The price for the County in January 2013 was about $327gallon an average of diesel and unleaded fuel The forecast assumes price increases slightly higher than the rate of inflation
Change in Fuel Costs 2014 2015 2016 2017 2018 2019 2020 2021 2022 2023 30 30 30 30 30 30 30 30 30 30
Electricity - General Fund and Utilities Funds The Real Estate Management and Utilities departments have both taken steps to decrease annual cost increases by implementing measures to reduce energy consumption The forecast assumes flat electricity costs in FY2014 due to recent Progress Energy rate reductions Percentage increases in later years are based on the historical averages
Change in Electricity Costs - Commercial 2014 2015 2016 2017 2018 2019 2020 2021 2022 2023 0 50 50 50 50 50 50 50 50 50
Medicaid - General Fund The 2012 Legislature changed the Statersquos method of billing the County for Medicaid shifting the burden of proof to demonstrate that a claimant is not a county resident in order to dispute an
KEY ASSUMPTIONS
Pinellas County Budget Forecast FY2014-2023 D-22
amount on a bill The State is also reducing the Countyrsquos Revenue Sharing funds to cover a multi-year backlog in billings Unemployment Compensation ndash General Fund Unemployment Compensation for all County operations other than the Sheriff is billed by the State to the General Fund Historically these expenses were less than $01M annually However costs peaked at $12M in FY2010 due to Reductions in Force (RIFs) and declined over the next two years to $02M in FY2012 Future yearsrsquo costs are expected to be closer to the historical average in the absence of another major RIF Supporting Information Fuel efficiency gains are anticipated as new Federal Corporate Average Fuel Economy (CAFEacute) standards for heavy trucks and equipment take effect due to the composition of the fleet Only 47 of 1726 BCC units are cars (less than 3) the bulk of the fleet (excluding the Sheriffrsquos vehicles) is heavy equipment These units usually achieve only 8 to 10 miles per gallon because of idling time (for power take off units) and the gear ratio needed to haul heavy loads The new standard will increase mpg to 12 in 2014 Previously there had been no federally mandated fuel economy standards for heavy trucks and equipment Some departments will have increased fleet replacement costs as units are replaced that are not currently paying into the Fleet fund due to deferral of purchases and life cycle extensions However where feasible some future purchases of replacement equipment may be deferred to take advantage of the new fuel economy standards Other Post Employment Benefits (OPEB) ndash All Funds Overview Consistent with Government Accounting Standards Board directives the Countyrsquos actuarial consultants computed the unfunded Other Post Employment Benefits (OPEB) liability as of October 1 2011 at $392M for Unified Personnel System (UPS) employees and $315M for Sheriff employees The Countyrsquos net Annual Required Contribution (ARC) for OPEB to fully fund this liability would be $277M for UPS employees and $241M for Sheriffrsquos Office employees The FY2013 Budget includes a transfer of $2M from the General Fund to the Employee Benefits Fund for a partial contribution to the annual OPEB ARC for both UPS and Sheriffrsquos Office employees In previous years the County set aside a cumulative total of $27M for OPEB Other local governments in Florida with an OPEB liability are also partially funding those obligations as budgets allow Key Assumptions The forecast assumes that OPEB funding in the General Fund will continue at the current level of $2M per year throughout the forecast period This will be reviewed following analysis of the
KEY ASSUMPTIONS
Pinellas County Budget Forecast FY2014-2023 D-23
next OPEB actuarial report which will provide valuations as of October 2013 OPEB contributions for Enterprise operations are contained within their respective funds
Projected OPEB Contributions - $ millions 2014 2015 2016 2017 2018 2019 2020 2021 2022 2023 $20 $20 $20 $20 $20 $20 $20 $20 $20 $20
Supporting Information Effective January 1 2011 new hires will not further increase the OPEB liability upon retirement and new retirees covered by Medicare must enroll in the less costly Medicare Advantage plan option These actions will help better quantify the OPEB liability in the next OPEB valuation actuarial study Other Fund-Specific Expenditures Ambulance Contract Expenditures ndash EMS Fund The County contracts with Paramedics Plus for the Countyrsquos SUNSTAR ambulance system Contracts with the Countyrsquos ambulance provider were renegotiated in FY2012 with an annual reduction to base service payments of $2 Million A 6 increase was included in the forecast from FY2014 through FY2022 to account for annual CPI increases and increases to transport volume However once the contract is up for negotiation expenditures may change as the economy rebounds and fuel and labor costs and other factors change
Change in EMS Ambulance Contract Expenditures 2014 2015 2016 2017 2018 2019 2020 2021 2022 2023 60 60 60 60 60 60 60 60 60 60
First Responder Expenditures ndash EMS Fund
The County contracts with the eighteen first responder EMS providers that respond to calls using paramedics and that utilize Advanced Life Support (ALS) or Basic Life Support (BLS) equipment and personnel First responder contractual expenditures increased 51 from FY2012 to FY2013 and are estimated to increase at 5 through the forecast period
Change in EMS First Responder Expenditures 2014 2015 2016 2017 2018 2019 2020 2021 2022 2023 50 50 50 50 50 50 50 50 50 50
Purchase of Water - Utilities Water Funds A major expense to the Water System is the purchase of water from Tampa Bay Water The annual change in the cost of water reflects the combined impact of changes in Tampa Bay Water rates andor changes in consumption including decreases in wholesale customer base The actual cost in dollars will be dependent on the amount of water purchased
KEY ASSUMPTIONS
Pinellas County Budget Forecast FY2014-2023 D-24
Change in Cost of Water Purchased from Tampa Bay Water 2014 2015 2016 2017 2018 2019 2020 2021 2022 2023 10 21 08 17 17 18 17 19 21 21
Chemicals - Utilities Water and Sewer Funds The increase in the cost of chemicals for Water and Sewer operations has been historically around 7 annually The forecast projects this trend to continue
Change in Cost of Chemicals for Utilities 2014 2015 2016 2017 2018 2019 2020 2021 2022 2023 70 70 70 70 70 70 70 70 70 70
Capital Outlay - Utilities Water and Sewer Funds The Water and Sewer capital outlay forecasts reflect the construction and purchase needs as estimated by the Pinellas County Department of Environment and Infrastructure Engineering Division in the CIP ten year work plan Solid Waste Expenditures ndash Utilities Solid Waste Funds Solid Waste operating expenditures are projected to generally follow overall inflationary trends The Solid Waste capital outlay forecast reflects the construction and purchase needs as estimated by the consulting engineering services report by CDMSmith Inc There is a large capital need forecasted from FY2013 through FY2018 to install additional air pollution measures in anticipation of tighter regulatory requirements and additional required improvements Other Forecast Considerations While climate change is generally viewed as a long-term problem recent events show that we may already have begun to see an increase in the frequency and intensity of storms such as hurricanes and unseasonable weather Should this trend continue it may be prudent to consider increasing fund reserves to provide adequate resources to deal with the cost of responding to these events As a coastal community rising sea levels due to climate change may require expenditures to reconstruct or relocate facilities that are in low-lying areas At this time it appears that these costs would not be incurred during the timeframe of the forecast
FUND FORECASTS
Pinellas County Budget Forecast FY2014-2023 E-1
The Fund Forecasts portion of the Budget Forecast FY2014-2023 includes ten-year forecasts for ten of the Countyrsquos major funds
General Fund
Tourist Development Fund
Transportation Trust Fund
Capital Projects Fund
Emergency Medical Services Fund
Fire Districts Fund
Airport Fund
Utilities Water Funds
Utilities Sewer Funds
Utilities Solid Waste Funds
Sections in Each Fund Forecast Each fund forecast includes the following sections
Description Provides information concerning the fund such as fund type legal authority authorized uses of proceeds etc
Summary Provides an at-a-glance summary of the ten-year forecast These results are also summarized in the Executive Summary
Revenues Provides a high level overview of the major revenues in the fund
Expenditures Provides a high level overview of the major expenditures in the fund
Ten Year Forecast Includes key assumptions in the forecast a chart of the ten-year forecast and key results interpreted from the forecast chart
Potential Risks Includes key factors that affect assumptions in the forecast over the forecast horizon
Balancing Strategies Includes potential revenue and expenditure options for balancing the funds
Additional Information The fund forecasts in this section are intended to be high level user-friendly summaries of the results of the ten-year forecast for each fund For more detailed information please see the Key Assumptions and Pro-Formas portion of this document
FUND FORECASTS
Pinellas County Budget Forecast FY2014-2023 E-2
GENERAL FUND
Description The General Fund includes the primary governmental functions of the County that are not completely supported by dedicated resources These activities include but are not limited to Sheriffrsquos law enforcement detention and corrections health and human services emergency management and communications parks and leisure services and the operations of the Property Appraiser Tax Collector and Supervisor of Elections The General Fund includes operations for both county-wide functions and the unincorporated area These segments are tracked separately within the fund The unincorporated area is commonly referred to as the MSTU (Municipal Services Taxing Unit) MSTU expenditures are about 9 of the total (net of reserves)
Summary The General Fund encompasses the principal governmental activities of the County that is those that are not primarily supported by dedicated revenues or by user fees The four main revenue sources for the General Fund are Property Taxes State Shared Half-Cent Sales Taxes State Revenue Sharing and Communications Services Taxes The forecast projects that beginning in FY2013 recurring expenditures exceed recurring revenues in the General Fund This is primarily due to the aftereffects of the Great Recession with continued slow recovery of the real estate market In addition caps on taxable value increases and total property tax revenue will inhibit future revenue growth Major expenditure drivers that exceed normal inflation include personnel costs such as health insurance and state-required pension contributions and mandated expenses such as Medicaid There is a long-term structural imbalance of approximately $15M increasing to $60M per year over the forecast period absent action to address this problem The balancing strategy for the General Fund is to cover the shortfall in FY2014 by utilizing the Service Level Stabilization Account (SLSA) Expenditure reductions or revenue increases may be required in FY2014 or future years to address the structural imbalance The extent of the changes needed will be dependent on the pace of the economic recovery particularly the real estate market
Revenues Property Taxes are the single largest source of General Fund revenues accounting for more than two-thirds of the total The four primary funding sources for the General Fund (Property Taxes State Shared Half-Cent Sales Taxes State Revenue Sharing and Communications Services Taxes) comprise about 81 of the revenue The remaining 19 is derived from a variety of resources including User Fees Grants Interest and Cost Recovery from other County funds
Pinellas County Budget Forecast FY2014-2023 E-3
GENERAL FUND
Source FY2013 Adopted Budget Property Taxes The decline in property tax revenue from FY2008 to FY2012 exceeded the increases that occurred from FY2004 though FY2007 The FY2013 budgeted revenue is comparable to the revenue collected in FY2003 The chart below features a dotted line showing what the historical average of 5 growth in property tax revenue would look like It shows that the above-average amounts collected in FY2004 through FY2008 have been overcome by the large gap between current property tax revenues and where they would have been if the historical 5 growth had taken place
Pinellas County Budget Forecast FY2014-2023 E-4
GENERAL FUND
As discussed in the ldquoAssumptionsrdquo section of the forecast document the Statersquos mandated increase in the Countyrsquos Medicaid costs adversely affected the General Fund In order to stay the course on the established multi-year strategy for achieving financial sustainability the FY2013 budget included an increase of 01997 mills in the county-wide millage rate There was no increase in the MSTU millage rate The combined General Fund property taxes for countywide and MSTU are expected to generate $2866M in FY2013 The total property tax revenue will be comparable to FY2003 and is $147M or 34 less than the FY2007 peak revenue The negative impact from reduced property tax revenue is generally less pronounced for the municipalities in Pinellas County Their General Fund revenue mix usually reflects other revenues such as franchise fees and utility taxes that can help mitigate the impact of a reduction in property tax revenue
Sales Taxes The second largest General Fund revenue source is the State Shared Half-Cent Sales Tax which is 9 of total General Fund revenues Sales Tax collections have begun to recover from the effects of the recession but estimated revenues for FY2013 are still 9 under the peak year of FY2006 This tax is expected to generate $382M in FY2013
State Revenue Sharing The third major General Fund source State Revenue Sharing which is 2 of total General Fund revenues is also primarily based on the Statersquos sales tax revenue It is estimated that from this source the County will recognize $142 million in FY2013 This is 20 less than the FY2006 peak year revenue However the Statersquos implementation of the Medicaid mandate which holds back funds for the ldquobacklogrdquo of Medicaid billings means that the County can only expect to receive $94 million in FY2013 The State also plans to reduce the Countyrsquos Revenue Sharing amounts for FY2014 through FY2017 The original FY2013 budget showed this as a reduction in revenue After further review the Clerkrsquos Finance Division is posting revenue at the entire ldquoearnedrdquo amount and posting the backlog holdback amount as an expenditure Communications Services Taxes The fourth major revenue in the General Fund is the Communications Services Tax (CST) The CST is expected to generate $107M in FY2013 down from a peak of $132M in FY2007 The Countyrsquos CST rate is 522 which is the maximum allowed under current State law Pinellas Countyrsquos revenue reflects the statewide trend for this source which has experienced continued erosion due to heightened competition in the wireless market and reduced consumer spending following the recession Other Revenues Lesser revenue sources include User Fees Sheriffrsquos Law Enforcement Contracts Cost Recovery from other funds Interest Earnings and various other sources including Federal and State grants In general these revenues decreased as a result of the recession but are mostly expected to resume moderate growth in FY2014 and future years
Pinellas County Budget Forecast FY2014-2023 E-5
GENERAL FUND
Expenditures The General Fund includes the primary governmental functions of the County that are not completely supported by dedicated resources These activities include but are not limited to Sheriffrsquos law enforcement detention and corrections support of the Court system including facilities and technology health and human services environmental management emergency management and communications parks and leisure services general administration and the operations of the Property Appraiser Tax Collector and Supervisor of Elections The budgeted expenditures in the General Fund for FY2013 total $4514M (net of reserves and the Service Level Stabilization Account) and can be summarized in four groups the Board of County Commissioners the Sheriff Other Constitutional Officers and Independent Agencies
Source FY2013 Adopted Budget
Board of County Commissioners This grouping of departments includes the departments under the County Administrator as well as the County Attorneyrsquos Office and the Board of County Commissioners (BCC) They are $1832M or 41 of total FY2013 General Fund expenditures (net of reserves and Service Level Stabilization Account) Some of the major BCC programs include social services matching funds for Medicaid building operations and maintenance (including the courts jail and Sheriffrsquos headquarters) parks maintenance environmental protection environmental preserves cultural affairs emergency management animal shelter rabies control economic development consumer services veteranrsquos services the county extension service Florida Botanical Gardens Heritage Village public information the County cable television station planning budget purchasing and State-mandated support of juvenile detention
Pinellas County Budget Forecast FY2014-2023 E-6
GENERAL FUND
Sheriff The Sheriff is an independently elected Constitutional Officer The Sheriffrsquos budget is $2133M or 47 of total FY2013 General Fund expenditures (net of reserves and Service Level Stabilization Account) Detention and Corrections programs comprise 53 of this total The Sheriff also provides support to the Court System and provides Law Enforcement services to both the unincorporated area (MSTU) and by contract to 13 municipalities This includes St Pete Beach for which a contract was approved during FY2013 The Sheriffrsquos adopted budget is often supplemented during the year by grants from Federal and State agencies such as the US Department of Justice and the Florida Department of Law Enforcement Other Constitutional Officers These agencies which are headed by independently elected officials comprise $382M or 8 of total FY2013 General Fund expenditures (net of reserves and Service Level Stabilization Account) In most cases the General Fund only reflects part of the total agency budgets The Tax Collector and Property Appraiserrsquos budgets are determined by statutory formulas and are approved by the State Department of Revenue The General Fund provides about 80 of the Tax Collector and 85 of the Property Appraiser total budgets The remainder is supported by other funds and by revenue sources that are specific to certain functions An example of the latter is the processing of driverrsquos licenses which receives some state support but not enough to cover the Tax Collectorrsquos cost of providing the service The Clerk of the Circuit Court has two separate budgets for activities in support of the Board of County Commissioners and for support of the Court system The latter is fee supported and is not included in the Countyrsquos budget it is funded and approved by the State The Board-related functions comprise about 25 of the Clerkrsquos total budget The budget for the Supervisor of Elections experiences annual fluctuations which result from the varying number and scope of elections in a given year The Supervisor is responsible for preparing and conducting all Federal State County and Municipal elections within the County The Board funds 100 of the Supervisorrsquos budget excluding occasional State or Federal grants Independent Agencies These agencies are $167M or 4 of total FY2013 General Fund expenditures (net of reserves and Service Level Stabilization Account) They include the Countyrsquos support for the Judiciary the State Attorney the Public Defender the Criminal Justice Information System (CJIS) the Medical Examiner the Office of Human Rights and Human Resources Court Support Much of the Countyrsquos court support is driven by statutory mandates and Article V of the State Constitution that require the County to fund certain technology expenses programs and facilities Only about 12 of the Judiciaryrsquos total budget 8 of the Public Defenderrsquos budget and 1 of the State Attorneyrsquos budget are funded by Pinellas County This funding includes some local programs over and above the mandated requirements such as Teen Court Drug Court and the Public Defenderrsquos Jail Diversion efforts The Sixth Judicial Circuit encompasses
Pinellas County Budget Forecast FY2014-2023 E-7
GENERAL FUND
both Pinellas and Pasco counties Pasco County provides funding for similar functions at a lower level due to its relative size The balance of these agency budgets are funded by the State Other Agencies The Medical Examiner also serves the entire Sixth Judicial Circuit and therefore is supported by both Pinellas and Pasco Counties The Medical Examiner is not a government employee but provides forensic investigative and laboratory services to the County by contract Two other agencies receive General Fund support The Office of Human Rights provides County citizens protection from employment and housing discrimination and also acts as the Countyrsquos internal affirmative action agency The Human Resources department manages the Unified Personnel System (UPS) which provides centralized personnel services for the BCC and most of the other County elected officials and independent agencies The major exception is the Sheriff who operates a separate personnel system Types of Expenditures In addition to the breakout of organizational responsibilities another way of looking at General Fund requirements is to consider the types of expenditure required for those organizations to carry out their responsibilities Personal Services Operating Expenses and Capital Outlay in the General Fund are similar to those in other County funds Several of the other expenditure categories merit additional discussion Grants amp Aids Debt Service and Transfers Grants and Aids The Grants and Aids expenditure category includes several types of funding provided by the County to other entities such as financial assistance for low income residents and support of community non-profit social action agencies Grants and Aids also include Tax Increment Financing (TIF) payments to cities for community redevelopment areas (CRAs) Nine cities within the county have established a total of twelve CRAs The County is required by interlocal agreements to contribute funds annually based on formulas that reflect the amount of growth in taxable values compared to a specified base year In FY2013 the County will contribute an estimated total of $63M in TIF payments to the cities Debt Service Unlike many other local governments Pinellas County has no outstanding bond issues which are supported by a pledge of property taxes or other general revenue The only budgeted expenses for Debt Service (principal and interest payments) are for potential short term cash flow or financing needs Transfers Transfers between funds includes ongoing or non-recurring items For example an ongoing transfer to the Employee Health Benefits Fund is budgeted to address unfunded liabilities for Other Post Employment Benefits (OPEB) FY2013 includes the first of five $15M transfers to the Capital Projects Fund to support the Centralized Chiller project which had been advance-funded from other sources
Pinellas County Budget Forecast FY2014-2023 E-8
GENERAL FUND
Non-recurring funds may also be included in the other expenditure categories For example FY2013 Operating Expenses includes $39M in cost allocation charges from BTS to complete funding for the Justice Consolidated Case Management System (CCMS) project At the end of each fiscal year non-recurring funds may be realized as additional fund balance resulting from revenue in excess of expenditures in a given fund The amount of non-recurring or one-time funds can vary significantly from year to year As stated in the Countyrsquos budget policies non-recurring funds should be applied to increase reserves or for one-time purposes only They should not be used to fund ongoing programs Reserves Reserves are not expenditures but they are included in the budgeted total requirements for the fund In order to be expended the BCC must take formal action reappropriating these funds Maintaining adequate reserves is key to the Countyrsquos ability to deal with potential emergencies and unforeseen events such as fuel price increases unanticipated dips in revenues or a natural disaster This is even more important in view of our geographic location on the Florida Gulf Coast We need to have the ability to maintain critical public safety transportation and other services during and after hurricanes and other severe storms We need the resources to provide these services immediately and not rely on Federal funding which is often made available as reimbursements and received months or years after the event Also federal (FEMA) reimbursements typically cover only 75 of the loss Additionally due to conditions in the insurance marketplace our coverages are less than the Countyrsquos total asset base The Countyrsquos property value is estimated at approximately $12 billion (net of the Solid Waste and South Cross facilities) We carry $100M worth of wind damage insurance This means that we have additional exposure depending on the kind of damage we could receive in a storm event or natural disaster Having an adequate reserve also demonstrates stability to the financial markets Although Pinellas has the lowest general revenue debt of any major Florida county this stability enhances our ability to raise capital through bonding at a lower cost if required in the future
The budget policies for General Fund Reserves (Fund Balance) were established by the Board of County Commissioners in accordance with principles issued by the Government Accounting Standards Board (GASB) and are summarized in the following table
Pinellas County Budget Forecast FY2014-2023 E-9
GENERAL FUND
The amount and use of Non-Spendable and Restricted Reserves are defined by the value of inventories and limitations imposed by external entities such as grants that are being carried forward from the previous year The budget policies address the other ldquounrestrictedrdquo categories Prior to FY2011 the General Fund reserve policy was ldquoat a minimum no less than 5 to 15 of operating revenues or no less than one to two months of operating expendituresrdquo Over the last several years the Board of County Commissioners set a conservative General Fund reserve target of 15 of total resources For FY2011 the Board revised its budget policy to incorporate this more conservative approach given that Pinellas County is a high hazard coastal county The revised budget policy states
The General Fund Reserve (Ending Balance) should be budgeted at a level of no less than 15 of total resources
The policy essentially sets a floor of 15 for the reserve level and does not set a cap to limit the reserve The FY2013 General Fund budget includes a projected reserve of $818M which meets the Boardrsquos 15 policy target The components of the estimated FY2013 year-end reserves are Contingency Encumbered Contracts Cash Flow and Disaster Response
Contingency Reserve The Contingency Reserve which is budgeted at $272M in FY2013 is an amount equal to 5 of resources to be used for unanticipated revenue shortfalls or expenditures For example fuel costs and electricity rate increases have been highly volatile and often exceed normal inflation Another example is the need for accrued leave payouts due to layoffs
Pinellas County Budget Forecast FY2014-2023 E-10
GENERAL FUND
Encumbered Contracts Reserve During the year at any given time there are purchase orders and service contracts that have been approved and are subject to payment as work is completed or goods delivered The $76M in the Encumbered Contracts Reserve for FY2013 represents the average amount that was encumbered at monthrsquos end for the 12-month period ending May 2012 Cash Flow Reserve The Cash Flow Reserve is required to meet cash flow needs During the first two months of the fiscal year expenditures exceed revenues because most of the property tax revenue is not received until December Property tax revenue represents about 68 of the total General Fund revenue The FY2013 amount for the Cash Flow reserve $357M is equal to one-twelfth of all General Fund revenue budgeted for the fiscal year Disaster Response Reserve As a high hazard coastal county Pinellas needs to have Disaster Response Reserve funds on hand in case of an emergency such as a hurricane or other man-made or natural disasters In FY2013 $113M is budgeted in this reserve Reimbursement from the Federal Emergency Management Agency (FEMA) and the State usually cover only a portion of the costs is not available at the beginning of a disaster and often is not received for many months or years For example FEMA funds for the three 2004 hurricanes which brushed Pinellas County (Jeanne Charley Frances) were not fully received until 2007 after extensive and protracted appeals through FEMA and the State Approximately $16M of the $93M total cost was not reimbursed for these storm events There are other economic impacts which can result from a major disaster With a substantial portion of the countyrsquos highest taxable value properties located on the shoreline or in lower elevation coastal areas there is the potential for a reduction in the tax base if properties are damaged or destroyed by a storm surge or high winds This would result in a decline in property tax revenue in the following year Sales and other taxes would also decrease due to the negative effects on tourism from the storm Rebuilding would generate additional revenues but it would take time to offset the losses in the aftermath of the disaster As an indication of the size of this problem a seven-county area of Florida impacted by 2004rsquos Hurricane Charley sustained over $66 Billion in losses to residential commercial and industrial properties The County is the primary coordinating agency for disaster response and extraordinary unbudgeted expenses are required to respond to such a situation Resources are needed to pay for extended work hours for Sheriffrsquos deputies and other emergency first response personnel and to operate emergency shelters and the emergency communications center Public works crews and equipment and possibly private contractors are needed to repair storm damage Debris removal funding may be required if solid waste resources are not available Since storms may vary greatly in their impact it is not possible to predict the exact amount which would be required
Pinellas County Budget Forecast FY2014-2023 E-11
GENERAL FUND
Ten-Year Forecast Key Assumptions ndash Revenues For the purposes of the forecast it is assumed that the General Fund millage rates for both countywide and MSTU purposes will remain the same as the rates for FY2013 The FY2013 countywide millage rate is 50105 mills and the MSTU rate is 20857 mills As explained in the Key Forecast Assumptions section of this document the forecast is that taxable values will return to positive growth of 25 in FY2014 and FY2015 In FY2016 and later years the forecast assumes an annual growth rate of 3 which is less than the 5 historical average growth which occurred in the years before the real estate boom For the State Shared Half-Cent Sales Tax we anticipate 40 growth for FY2014 and a 35 annual growth for the FY2015-FY2023 forecast period The underlying sources of State Revenue Sharing are expected to return to a pattern of moderate growth slightly less than the sales tax with an annual increase of 25 through the forecast period However as noted above the implementation of the Medicaid mandate will result in the State reducing the amount of revenue sharing funds the County receives for FY2013 through FY2017 Communications Services Tax revenue is forecast to continue a slow decline throughout the forecast period decreasing 05 per year For other revenues in the General Fund the forecast assumes flat to moderate growth which reflects the anticipated gradual economic recovery Key Assumptions - Expenditures The forecast assumes a continuation of current (FY2013) programs and service levels The basic assumptions for Personal Services and Operating Expenses that are used throughout the forecast apply to the General Fund The forecast does not assume any net additional positions However certain expenses such as electricity fuel and state-mandated Medicaid charges result in the General Fundrsquos Operating Expense growth differing somewhat from the Consumer Price Index (CPI) As discussed previously the County has no outstanding bond debt supported by property taxes or other general revenues No such bond issues are anticipated during the term of the forecast Because of the uncertain nature of non-recurring funds none are anticipated in the forecast with the exception of those estimated to be available in FY2014 and $15M per year for FY2015 through FY2017
Pinellas County Budget Forecast FY2014-2023 E-12
GENERAL FUND
No new programs funded by non-routine grants are included in the forecast The assumption is that any such expenditures will be dedicated for non- recurring purposes or will cease when the grant funds are no longer available In the recent past the Sheriff in particular has been very proactive in seeking Federal and State funding for public safety purposes that supplement but not supplant existing budgets While this is desirable and likely to continue for the purposes of the forecast these unpredictable expenses and their offsetting revenue are not included Several capital improvement projects are expected to impact operating expenditures when completed These projections have been incorporated into the forecast For example several energy conservation projects currently in progress are anticipated to reduce future ongoing utilities costs Conversely completion of the Lake Seminole Alum Injection project will place additional demands on General Fund resources As specific increased needs are identified to the extent possible these new demands will be accommodated within existing budgets Key Results The forecast projects that in FY2014 recurring expenditures will exceed recurring revenues in the General Fund by an estimated $121M The gap for FY2014 can be closed on a one-time basis by using the resources available in the Service Level Stabilization Account in accordance with the plan approved by the Board However a structural gap of approximately $15M increasing to $60M would remain throughout the forecast period without action to address this ongoing problem
Pinellas County Budget Forecast FY2014-2023 E-13
GENERAL FUND
Forecast Budget Gap
Without Corrective Action 2014 2015 2016 2017 2018 2019 2020 2021 2022 2023
($14M) ($177M) ($208M) ($251M) ($282M) ($338M) ($390M) ($432M) ($503M) ($575M)
Potential Risks REVENUE FACTORS Taxable Values There are many factors that can alter the ten-year forecast of the General Fund The primary concern due to this fundrsquos reliance on property taxes for a significant portion of revenue is the performance of the real estate market The timing of the valuation of property for tax purposes is important The FY2014 values to be certified on July 1 2013 will reflect the market conditions through the end of the 2012 calendar year Therefore increases or decreases in value after January 1 2013 will not impact the FY2014 tax base A change of 1 in the FY2013 countywide taxable value would result in a $26M change in revenue at the FY2013 millage rate of 50105 Similarly a change of 01 mills in the rate using the FY2013 taxable value would result in a $52M change in revenue In the following years these impacts would be amplified by the other growth factors Save Our Homes Impact Another variable is the homesteaded taxable value increase cap imposed by the Save Our Homes amendment which is based on the annual change (December to December) in the Consumer Price Index Under ldquonormalrdquo circumstances as homesteaded properties represent about 35 of the total countywide taxable value a change of 1 in the CPI (positive or negative) at the current millage rate would produce a change in revenue of approximately $1M Because of the decline in market values the amount of value that is shielded by Save Our Homes has been greatly reduced As the real estate market returns to a pattern of growth Save Our Homes will limit the amount of the increased value that is subject to property taxes Potential Property Tax Exemptions The major proposed amendments to the State Constitution related to property taxes on the November 2012 general election ballot were defeated but it is conceivable that one or more of them will be revisited in the future Amendment 11 would have authorized the Legislature to allow local governments to increase exemption amounts for low-income seniors who have maintained permanent residency for at least 25 years The Legislative staff estimated that this would have had a negative impact on local government revenues of more than $9M statewide beginning in FY2015
Pinellas County Budget Forecast FY2014-2023 E-14
GENERAL FUND
Amendment 10 would have increased the amount of the tangible personal property exemption from $25000 to $50000 The Legislative staff estimated that this would have had a negative impact on local government revenues of more than $20M statewide beginning in FY2014 Amendment 4 included three proposed expansions of property tax exemptions The first would have reduced the cap on the annual change in taxable values for non-homesteaded property from 10 to 5 The second would have allowed the Legislature to eliminate the ldquorecapture rulerdquo and prevent the assessed value of a property from increasing when its market value declines even if the assessed value is less than the market value The third would have granted an additional initial homestead exemption of 50 of market value to homeowners who had not had a homestead exemption in Florida in the previous 3 years The Legislative staff estimated the cumulative impact of the proposals would have been a revenue loss to local governments of nearly $1 billion statewide by FY2016 The Florida Association of Counties estimated the potential revenue loss for Pinellas County at $37M in FY2014 growing to $127M annually by FY2017 Other new exemptions as well as revenue and expenditure caps have been discussed and their passage in future legislative sessions or referendums would have negative revenue impacts as well Annexations In the unincorporated area the property tax base and revenue in the MSTU would be affected by annexations or by the creation of new municipalities If a significant reduction in the tax base occurs costs could be spread across a much smaller population There are two basic methods of annexation in Florida annexation by referendum and voluntary annexation According to a Pinellas Planning analysis from FY2001 through FY2011 approximately 8000 acres representing $12 billion in taxable value was removed from the MSTU through these processes Annexation activity both referendum and voluntary was significantly lower during fiscal years 2008 through 2011 than in the previous seven years As property values begin to rise again there may also be an increase in proposed annexations A thorough reevaluation of the scope and delivery methodology for MSTU services would be required if these changes reach a tipping point in the economies of scale Economic Conditions The three other major revenue sources ndash Sales Tax Revenue Sharing and Communications Services Tax - are highly sensitive to economic conditions If the economy improves collections could be higher than anticipated as disposable income increases The reverse would be true if the economic recovery stalls or deteriorates into a new recession The Sales Tax is highly sensitive to economic conditions If consumer confidence does not continue to improve consumption will not grow at the moderate pace assumed in the forecast The University of Floridarsquos Consumer Confidence Index was down slightly in November and December 2012 from its post-recession peak of September and October possibly due to media attention on the looming federal ldquofiscal cliffrdquo The 35 to 40 annual growth in the Sales Tax
Pinellas County Budget Forecast FY2014-2023 E-15
GENERAL FUND
forecast for FY2014 generates about $13M to $18M in additional revenue each year which would be impacted by variations from the anticipated economic recovery assumptions The forecast assumes that the sources tied to Revenue Sharing will grow at 25 per year a rate slightly less than the growth in Sales Tax However as mentioned previously the Statersquos implementation of the Medicaid mandate which holds back funds for the ldquobacklogrdquo of Medicaid billings means that the County will receive less than the full amount for the next several fiscal years This illustrates the point that there is no Constitutional prohibition against the State changing the formula to reduce or eliminate this revenue source unless the funds have been committed for debt service (which is restricted to 50 of the prior yearrsquos proceeds) Pinellas has no Revenue Sharing pledged to support debt and the entire allocation is subject to revision by the Legislature State Budget Impacts For the fourth year in a row the State faced a significant budget gap for its FY2013 budget Current projections for the Statersquos FY2014 budget are more positive but upcoming budget cycles will continue to be challenging given the reliance on sales taxes as the Statersquos primary revenue stream In dealing with upcoming State budget gaps the Legislature may continue to reduce the amount of revenue it shares with local governments or cost shift more state responsibilities to the counties and cities The Medicaid mandate is only the most recent example of this tactic Previously for example effective in July 2005 the countiesrsquo share of sales tax and revenue sharing revenues was decreased in response to the implementation of Article V Section 7 court funding reforms These formula changes can have serious impacts on the General Fund A 10 cut in the Sales Tax formula would reduce revenues by over $38M Similarly there has been repeated pressure from the telecommunications industry to reduce the scope of services that are subject to the Communications Services Tax (CST) The 2012 Legislature approved a bill subsequently signed by the Governor which will have a negative statewide impact on local CST revenues of more than $25M A State commission is currently studying the CST to recommend further structural changes that may lead to even greater reductions in revenue The cumulative negative impact of these changes is undetermined at this time Limiting Factors A cautionary note for long-term planning relates to the scarcity of undeveloped land in Pinellas County We will see relatively fewer new residents in the future compared to other counties with more opportunities for expansion Because the distribution formulas for both shared sales taxes and revenue sharing are partially based on population Pinellas will represent a declining percentage of the state total and therefore the percentage of these revenues will decline also For example in the 2000 Census Pinellas represented 58 of the Statersquos 16 million residents By the 2010 Census Pinellasrsquo population remained virtually the same while the State population grew to 188 million As a result Pinellas represented 49 of the Statersquos population
Pinellas County Budget Forecast FY2014-2023 E-16
GENERAL FUND
in 2010 Although the slowing of overall population growth in the State will delay the effect some erosion will result for those grants and other revenues that are allocated by population-driven formulas EXPENDITURE FACTORS Inflation On the expenditure side of the equation the Consumer Price Index is a key element For consistency the CPI changes used in the forecast are those produced by the State of Floridarsquos National Economic Estimating Conference It should be noted that this is a consensus process which involves the Legislature the Governorrsquos Office and the Statersquos Division of Economic and Demographic Research The intent is to produce a professional nonpartisan basis for development of the Statersquos budget that melds a variety of perspectives and therefore does not necessarily reflect any one participantrsquos economic model Historically although inflation was as high as 125 in 1981 in the years from 1989 to 2008 the change in the CPI averaged about 3 The true inflation rate will have a significant effect on future requirements For example an increase of 1 in the CPI if applied to all FY2013 recurring costs would require an additional $5M in expenditures A change of 1 in the salary and benefits assumptions would produce a cost variance of $3M and an increase in the inflation rate of 1 would result in a $2M change in operating expenses in FY2014 and would trigger escalating impacts going forward Operating expenses have been assumed to generally follow the CPI inflation rate but costs such as fuel and electricity are subject to unforeseeable variations and could impact this scenario Florida Retirement System Because salaries and benefits are such a significant part of General Fund expenditures higher than projected FRS contribution rates or health insurance cost increases could have significant negative impacts The FRS bill approved in 2012 tentatively establishes increased rates for the State 2014 fiscal year (July 1 2013 to June 30 2014) to address the systemrsquos unfunded liability These rates are subject to change in next yearrsquos legislative session The forecast assumes that the State will increase rates significantly to address the unfunded liability over the next four years rather than all at once as contemplated in the 2012 legislation because increases in these rates also have negative impacts on the budgets of State agencies and the school districts After reaching a fully funded level the rates should stabilize but there is a large degree of uncertainty in that the Legislature and Governor have demonstrated that they are willing to make major structural changes to the pension system In addition to this general uncertainty the requirement for employee contributions to FRS had been challenged by a lawsuit filed on behalf of public employees by several labor organizations On January 17 2013 the Florida Supreme Court issued its ruling in this case which upheld the employee contribution requirement This avoided potential increases to employer contributions which could have negatively impacted personnel costs
Pinellas County Budget Forecast FY2014-2023 E-17
GENERAL FUND
Health Insurance Health insurance costs are impacted by inflation and also by the package of benefits offered The extent to which the ratio of active employees to retirees changes will also impact the Countyrsquos employer contributions to the health plans An additional unknown is the effect of Federal health insurance reform on costs and services including any related mandates to programs such as Medicaid Unfunded Mandates No new State or Federal mandates have been included in the forecast As the State deals with its budget problems there is likely to be growing pressure to push expenses down to local governments even while imposing more restrictions or rollbacks on local revenues The 2012 Legislaturersquos Medicaid mandate illustrates this point Theoretically Article VII Section 18 of the Florida Constitution has a prohibition against imposing unfunded mandates on counties and cities In practice the Legislature can avoid this prohibition in many ways through exemptions (such as mandates to enforce criminal laws) or exceptions including declaring that the mandate ldquofulfills an important state interestrdquo and is approved by a 23 vote of both the Senate and House According to a report prepared by the Legislative Committee on Intergovernmental Relations in 2009 alone the Legislature enacted 25 laws containing 74 provisions that imposed mandates on counties and municipalities
Balancing Strategies One of the key financial strategies employed over the past three years has been the creation of a Service Level Stabilization Account (SLSA) in the General Fund The SLSA represents non-recurring funds generated by taking reductions in FY2010 2011 and 2012 over and above what was necessary to balance the budget A total of $286M was accumulated in the SLSA for this purpose The SLSA is being used to cover estimated shortfalls in the General Fund in FY2013 and FY2014 The SLSA helps provide flexibility in the budget to avoid making reductions to the point where revenues bottom out and allows us to bridge to a time when the budget has stabilized and begins to improve Because it is a non-recurring funding source it is very important that we carefully monitor the structural balance of the General Fund as the SLSA is spent down Assuming that the balance in the SLSA is drawn down in FY2014 there are several balancing strategies that could be considered to address the ongoing structural gap in revenues and expenditures Expenditure reductions are an option to be considered The efforts to find efficiencies and streamline operations will continue to be pursued Due to reductions over the last five years General Fund costs have been reduced to the point that any further cuts would directly impact the continuation of programs as well as service levels Between FY2007 and FY2011 reductions
Pinellas County Budget Forecast FY2014-2023 E-18
GENERAL FUND
of over $182 million were made in General Fund agencies and budgeted positions decreased by 1618 or 25 An additional $183 million in budget reductions were taken in FY2012 As a result of these and other changes the total FY2013 General Fund budget of $556054060 is comparable to the FY2005 budget of $556059420 Revenue increases are another option The County is currently collecting less than the maximum allowed majority-vote property tax revenue In 2007 the Legislature enacted new limitations on property tax revenue increases for local governments Super-majority votes of the Board are required if proposed property tax revenue exceeds caps based on the average growth in Florida personal income and new construction The caps went into effect beginning in FY2009 using the FY2008 level of property tax revenue as the base As shown in the chart below capacity under the cap has increased as property tax revenues have decreased There is currently a wide spread between the FY2013 millage rate of 50105 and the cap limit of 83285
Another revenue balancing option is the implementation of a storm water strategy that includes a new dedicated funding source If a dedicated funding source was available approximately $31 million of storm water costs currently funded in the Municipal Services Taxing Unit (MSTU) could be freed up to create additional capacity The County does not have a wide range of other revenue options User fees can be increased but need to be considered in the context of the local marketplace and the effect on economic recovery In past budget processes both County employees and the general public identified potential revenue generating ideas In addition to increasing user fees some of these ideas include a local business tax (formerly known as occupational tax) and payments in lieu of taxes or a return on equity from enterprise funds
Pinellas County Budget Forecast FY2014-2023 E-19
GENERAL FUND
Pinellas County Budget Forecast FY2014-2023 E-20
TOURIST DEVELOPMENT COUNCIL FUND
Description The TDC Fund is a special revenue fund that accounts for the 5 tourist development tax (ie bed tax) on rents collected for temporary lodgings Section 1250104 Florida Statutes was enacted by the State in 1977 The Board of County Commissioners enacted an ordinance in 1978 to levy a 2 tax to promote tourism in Pinellas County and was approved at a referendum held on October 5 1978 In 1988 the ordinance was amended to increase the tax by an additional 1 with one-half of this amount earmarked to fund beach re-nourishment projects In January 1996 an additional 1 was levied to provide additional funds for promotional activities beach re-nourishment and to service debt on the Countys obligation to the City of St Petersburgs bonds for Tropicana Field In December 2005 an additional 1 was levied to provide funding for promoting and advertising tourism In November 2010 the Board approved an extension of the 5 tourist development tax to 2021 The forecast continues the 5 tax through FY2023 The fund supports the Tourist Development Council serving as Visit St PeteClearwater through the bed tax The bed tax is used to enhance the Countyrsquos economy by increasing tourism and direct visitor expenditures through marketing and promoting the destination
Summary The Tourist Development Council (TDC) Fund is primarily funded by tourist development taxes that are extremely sensitive to general economic conditions Tourist Development tax revenues have been steadily improving since Spring 2010 and reached record levels in FY2012 FY2013 revenues are estimated to grow 4 beyond actual receipts for FY2012 and are anticipated to continue to increase conservatively at 35 in FY2014 Beyond FY2014 projections continue to increase by 30 annually through the forecast period matching anticipated gradual growth as part of the recovery in the broader US economy The forecast for the Tourist Development Council Fund shows that the fund is balanced through the forecast period Through FY2015 more funds are available for additional advertising based on the assumption that the promotional activities budget will be adjusted to reflect any revenue increases or decreases while maintaining a 15 reserve balance Beginning in FY2016 the fund is forecast to have additional capacity once the debt service on Tropicana Field and the Dunedin Spring Training Facility is paid off in 2015 The additional capacity could be dedicated to new capital outlay as with the Board approved Salvador Dali Museum funding new debt service or to supplement the promotional activities budget In FY2010 the Board revised the Tourist Development Plan to allow funding of capital projects for non-profit museums that are open to the public The Board also approved a review of the Tourist Development Plan every five years
Revenues The TDC Fund consists almost exclusively of one primary funding source tourist development taxes
Pinellas County Budget Forecast FY2014-2023 E-21
TOURIST DEVELOPMENT COUNCIL FUND
Tourist Development Taxes Tourism is a key economic driver of the economy in Pinellas County and contributed direct and indirect visitor expenditures of approximately $73 billion during calendar year 2012 (source Research Data Services Inc) The Tourist Development Tax is projected to generate $299M in FY2013 Tourist Development tax collections are very sensitive to economic conditions due to the close relationship between disposable income and leisure travel The following chart showing a 6-month moving average of collections from October 2007 to October 2012 indicates that collections bottomed out at the beginning of 2010 but have been rapidly increasing again as the economy has begun to rebound Over the past year the rebound in tax revenue has outpaced the overall economy This chart demonstrates how sensitive tourist tax collections are to economic and other conditions and why having reserves to withstand changing conditions is necessary
In addition transient rental occupancy increased at least 2 in each month from January to September of 2012 as compared to the same one-month period in 2011 FY2012 actual revenue totaled $287M which was a 124 increase over FY2011 FY2013 revenues are projected to increase by another 40 and FY2014 by 35 From FY2015 through FY2023 collections are expected to increase 3 annually as the general economic recovery continues While recent trends may suggest a stronger rate of recovery the long-range forecast is conservative due to the sensitivity of this revenue source
Pinellas County Budget Forecast FY2014-2023 E-22
TOURIST DEVELOPMENT COUNCIL FUND
The chart below compares visitor origins tracked by Research Data Services Inc (RDS) with year-to-date figures for November 2011 and November 2012 and it shows a net overall increase of 39 Within this figure the Southeast visitor segment increased 66 and European visitors increased 74 Latin America has been added to the table as a visitor segment to track and it shows strong growth with an increase of 544 between August 2011 and August 2012
Calendar Year-to-Date through Novrsquo11 and Novrsquo12
Visitor Origins 2011 2012 Change
Florida 634689 641863 +11
Southeast 307389 327523 +66
Northeast 1115171 1151945 +33
Midwest 1456771 1481345 +17
Canada 290857 304839 +48
Europe 831904 893188 +74
Other US Markets 130519 131497 +07
Latin America 42800 66100 +544
Total 4810100 4998300 +39
Source November 2012 Visitor Profile Research Data Services Inc Latin American numbers are through August 2011 and 2012
The European visitor segment represents about 18 of total visitors tracked by RDS Although a slight recession is anticipated for the Eurozone the number of European visitors is not anticipated to decrease due to the characteristics of the market segment and increased access to the destination European visitors to Pinellas are a younger wealthier market segment generally insulated from economic cycles In addition the European market will gain increased access from additional air service providing easy access to the destination from cities throughout Europe and Germany For example in May 2012 Edelweiss Air started twice weekly non-stop flights from Tampa to Zurich Switzerland The next chart lists the Annual Average Daily Rate (ADR) that hotels are able to collect and the number of Annual Overnight Visitors since 2000 As a result of hurricanes red tide and the economic downturn ADR stayed flat from 2007 to 2010 and visitor counts declined from a peak of 53M in 2007 Since 2010 ADR and visitor counts have rebounded
Pinellas County Budget Forecast FY2014-2023 E-23
TOURIST DEVELOPMENT COUNCIL FUND
Year
Annual ADR
Annual
Overnight Visitors
2000 $7162 4700140 2001 $7416 4726161 2002 $7316 4714432 2003 $7491 4837998 2004 $7811 5077280 2005 $8432 5212435 2006 $9318 5254255 2007 $10000 5300220 2008 $10438 5193980 2009 $10171 4991410 2010 $10015 5041200 2011 $10483 5235200 2012 $11317 5435000
Source Research Data Services Inc
Expenditures The TDC Fund supports budgeted expenditures and reserves in FY2013 totaling $344M The primary expenditures in the fund are $185M for operations and promotional activities $66M for debt service for three sports facilities $37M for two transfers and $56M in reserves
Pinellas County Budget Forecast FY2014-2023 E-24
TOURIST DEVELOPMENT COUNCIL FUND
Operations and Promotional Activities The discretionary expenditure budget of $185M includes the staff operations and promotional activities that promote the St Petersburg Clearwater destination Promotional activities are primarily comprised of the advertising contract with the balance of the funding supporting such programs as sponsorships publicity and promotion via technology The promotional activities budget was increased in FY2012 due to the higher actual collections as compared to budget Sufficient revenue to support $1M in additional advertising was anticipated and appropriated in the FY13 budget The next chart from the Convention and Visitors Bureau provides allocations in the discretionary operations and promotional budget (without debt payments transfers and reserves)
Convention amp Visitors Bureau Operations amp Promotional Expense
Expenses FY 2013 of Operations
Operating amp Capital Outlay $ 821370 44
Personnel $3211630 173
AdvertisingDirect Sales $13437690 725
Research $ 235000 13
ShippingCommunicationsInquiry $ 370000 20
Travel $ 456200 25
Total $18531890 1000
Source Pinellas County Convention amp Visitors Bureau
Undesignated Over the forecast period there are anticipated available funds above the 15 reserve target that are not currently obligated The ldquoUndesignatedrdquo expenditure line in the forecast identifies the amount projected through FY2023 Capital Outlay In FY2010 the Board revised the Tourist Development Plan to allow funding of capital projects for non-profit museums that are open to the public and the Board approved an agreement that provides payments of $500K annually to the Salvador Dali Museum from FY2015 to FY2019 The Board also approved a review of the Tourist Development Plan every five years Debt Service This fund dedicates the proceeds of the 4th cent of tourist development revenue less Tax Collection expense to the City of St Petersburg to fund debt service on bonds for Tropicana Field (expires 2015) At the City of St Petersburgrsquos request ownership of Tropicana Field was turned over to the County by the City in October 2002 as the County is exempt from paying property taxes on the facility The County leases the property back to the City under terms that provide the City the same rights and responsibilities for the property that it had prior to the transfer of
Pinellas County Budget Forecast FY2014-2023 E-25
TOURIST DEVELOPMENT COUNCIL FUND
ownership This fund also pays fixed debt service in the amount of $588K for the City of Clearwaterrsquos spring training facility (expires 2021) and $298K for the City of Dunedinrsquos spring training facility (expires 2015) Transfers The TDC fund transfers half of the proceeds of the 3rd cent to the Capital Projects Fund for beach nourishment projects to support tourism and maintain property values The transfer is budgeted at $32M for FY2013 which is $05M more than the anticipated collections for this half-cent The additional amount accounts for dedicated revenue received in excess of the previous yearrsquos budget for the transfer This fund transfers $494K to the Tax Collector in FY2013 for administration and collection of the tourist development taxes This cost is approximately 17 of collections and is projected to increase by 3 per year through the forecast period Reserves On a budget basis the reserve level in this fund is currently at 16 which is slightly above the reserve level requested by the Tourist Development Council The fund reserve will serve as a fiscal shock absorber in the event tourist development tax revenues deteriorate in response to changes in economic conditions For example tourist development revenues declined dramatically in FY2002 after the September 11th terrorist attack in FY2005 as a result of multiple hurricane landfalls in Florida in FY2009 as a result of the financial crisis and most recently in FY2010 as a result of the British Petroleum (BP) oil spill In order to maintain liquidity in this fund adequate reserves need to be maintained at a minimum level of 10 This fund has several large expenditures such as debt service that come early in the fiscal year while some occur later in the fiscal year Monthly revenues usually peak during the Spring Break and Easter timeframe Since such seasonality occurs for both revenues and expenditures and the fluctuations do not occur together working capital needs are met by using reserves until the revenues are collected
Ten-Year Forecast Key Assumptions The revenue forecast for tourist development taxes reflects increasing growth in the economy with an increase of 35 in FY2014 and an annual increase of 30 through FY2023 On the expenditure side personal services are projected to increase 4 per year Promotional activities (advertising) estimates have been increased to match the increase in revenue through FY2015 Beginning in FY2016 a substantial amount of debt service will be paid off The forecast does not assume that the additional capacity will be re-authorized to service new debt or allocated to supplement the promotional activities budget It does include the additional capital outlay of $500K approved for the Dali Museum beginning in FY2015 and ending in FY2019
Pinellas County Budget Forecast FY2014-2023 E-26
TOURIST DEVELOPMENT COUNCIL FUND
Note This chart reflects forecasted expenditures without the ldquoUndesignatedrdquo amount
Key Results The forecast for this fund from FY2013 to FY2015 shows that revenues and expenditures are in-line while the fund maintains at least a 15 reserve Beginning in FY2016 revenues exceed expenditures by a wide margin as the debt service for Tropicana Field and the Dunedin Spring Training Facility is paid off Even with the Board approved capital outlay to support the Dali Museum for $25M from FY2015 through FY2019 revenues will continue to exceed expenditures The decision point in FY2016 will be whether to continue to use this portion of the proceeds from the 4th cent of tourist development for debt service on sports facilities or use it for other approved tourism development purposes such as promoting and advertising the St PetersburgClearwater destination
Potential Risks There are many impacts that can alter the ten-year forecast of tourist development tax collections The primary concern is the strength of the national economy due to the sensitivity of collections to economic conditions If the economy improves collections could be higher than anticipated as disposable income increases The reverse would be true if the economy deteriorates Increases in fuel costs are also a factor for visitors driving to Pinellas County In the past an increase in hurricane activity has had a negative effect on tourism as have red tide outbreaks in Tampa Bay The appreciation or depreciation of the US dollar also has an impact on the number of international visitors to Pinellas County
Pinellas County Budget Forecast FY2014-2023 E-27
TOURIST DEVELOPMENT COUNCIL FUND
The possibility of offshore drilling in Floridarsquos Gulf Coast could discourage tourism due to the potential negative ecological effects of that industry
Balancing Strategies The forecast does not show any structural gaps in revenues and expenditures as the fund is balanced through the forecast period The assumption is that the promotional activities budget is increased or decreased to match the tourist development tax revenue stream The additional capacity forecast beginning in FY2016 may be applied to newly approved debt service or to other authorized tourism promotion and development activities
Pinellas County Budget Forecast FY2014-2023 E-28
TRANSPORTATION TRUST FUND
Description
The County Transportation Trust Fund is a special revenue fund required by Florida Statute 336022 to account for revenues and expenditures used for the operation and maintenance of transportation facilities and associated drainage infrastructure Activities include road and right-of-way maintenance (eg patching mowing) bridge maintenance and operation traffic engineering traffic signal operation including Intelligent Transportation Systems traffic control signage and striping sidewalk repair and construction and maintenance of ditches culverts and other drainage facilities Resources to support these activities are provided from gas taxes collected and distributed on a shared basis to all Florida Counties by the State of Florida and local option gas taxes levied by the County There are two local option taxes that have been imposed by the Board of County Commissioners The most recent was a one cent levy (referred to by statute as the ldquoNinth Centrdquo) beginning January 2007 dedicated to the installation operation and maintenance of advanced technological traffic signal and messaging systems (Intelligent Transportation Systems) The other local levy is a six cents per gallon tax that is shared by interlocal agreement between the County and all municipalities within Pinellas County The Countyrsquos share of collections is 60 of total receipts and the municipalities each receive portions of the remaining 40 The interlocal agreement will expire in 2017
Summary
The Transportation Trust Fund is primarily funded by state and local fuel taxes and has been impacted by a downturn in collections due to the recessions effect on the number of miles driven and gallons of fuel sold Because of the built out nature of Pinellas County more efficient cars and fuel conservation efforts as well as State law that does not allow indexing fuel taxes for inflation future revenue is projected to continue its slow decline and not keep pace with inflationary increases for expenditures in this fund The forecast for the Transportation Trust Fund indicates that the fund is not in balance beginning in FY2013 resulting in a depletion of fund balance by FY2018 This imbalance primarily results from inflationary pressures on expenditures coupled with the projected reduction in gas tax collections that are based upon the volume of fuel By FY2017 action will need to be taken to manage this future gap such as potential revenue transfers from the General Fund imposition of additional local option gas taxes or reductions in current service levels
Revenues The Transportation Trust Fund consists mainly of three primary funding sources State shared gas taxes ($92 million) a six cent per gallon local option gas tax ($126 million) and a one cent per gallon gas tax (the ldquoNinth Centrdquo) earmarked for the Advanced Traffic Management System Intelligent Transportation System ($37 million) The remaining revenues of the fund include interest and other miscellaneous revenues such as reimbursements from other governments for the Countyrsquos work on municipal and state traffic signal systems
Pinellas County Budget Forecast FY2014-2023 E-29
TRANSPORTATION TRUST FUND
State Shared Gas Taxes This resource is the equivalent of three cents per gallon on motor fuel collected statewide then redistributed to Florida Counties by a formula related to population geographic area and local collections The amount of revenue is driven by the gallons of fuel used and is therefore sensitive to economic activity such as commuting and tourism trips or increases in the price of oil that might reduce demand for gasoline usage The move toward more fuel efficient cars also has an effect in offsetting any population growth that might result in more vehicle trips As a result state shared gas taxes as well as the other gas taxes are anticipated to continue to slowly decline over the forecast period Six Cent Local Option Gas Tax (LOGT) This resource is a six cent per gallon tax on all motor fuel sold within the County including diesel The proceeds are shared with the municipalities through an interlocal agreement stipulating that the County retains 60 of monthly collections and municipalities sharing the remaining 40 Ninth Cent Gas Tax This resource is a one cent per gallon tax on all motor fuel sold within the County including diesel Unlike the Six Cent Local Option Gas Tax the proceeds are not shared with the municipalities This gas tax funds the creation and maintenance of the Advanced Traffic Management SystemIntelligent Transportation System in the county Transfers A transfer of $15 million per year from the General Fund to the Transportation Trust Fund is budgeted beginning in FY2013 to support ongoing operating costs that were reassigned to this fund based on an analysis of the allocation of Department of Environment and Infrastructure expenditures
Expenditures The Transportation Trust Fund supports expenditures totaling approximately $304 million Transportation Programs These expenditures include staff and operating expenses to maintain and operate the Countyrsquos traffic controls bridges roads and associated drainage systems Key program expenditure areas include mowing County right-of-way and ditch maintenance activities ($67 million) traffic signal and traffic control activities ($74 million) and bridge and concrete structures maintenance ($58 million) Intelligent Transportation Systems As a part of improving traffic signal and traffic control activities the County is actively pursuing technological improvements to improve the flow of traffic in Pinellas County This activity is tied to the Ninth Cent gas tax resource and is being focused on high priority traffic corridors in order to size the program to available resources The current operating expenses for this program are approximately $12 million The balance of the available funds are transferred to the Capital Projects Fund
Pinellas County Budget Forecast FY2014-2023 E-30
TRANSPORTATION TRUST FUND
Capital Improvement Project Impacts Some capital improvement projects have the potential to require increased operating expenditures when completed Beginning in FY2014 the forecast includes estimated operating expenditures to support completed capital improvement projects Transfers Since the inception of the Ninth Cent gas tax a transfer takes place annually from the Transportation Trust Fund to the Capital Projects Fund This transfer pays for the installation of capital structures needed to implement the Intelligent Transportation System such as traffic signal controllers fiber optics cameras and message boards Depending upon available revenues after deductions for operating expenses an average of approximately $25 million is transferred annually to the Capital Projects Fund to match state and federal grants available to implement the system on major County and State road corridors Reserves The budgeted FY2013 reserve level of $122 million in the Transportation Trust Fund is approximately 29 which is higher than the 5-15 reserve level budget policy adopted by the Board This is the result of savings gained through recent budgetary reductions and efficiency initiatives The reserve also includes the fund balance previously carried in the Local Option Gas Tax fund which was merged into the Transportation Trust Fund in accordance with new accounting standards (GASB Statement 54) for FY2012 This reserve level is gradually being reduced as expenditures exceed revenues
Ten-Year Forecast Key Assumptions As discussed the main revenue sources for this fund are state shared gas taxes and local option gas taxes The ten-year forecast assumes that the current six cent local option gas tax levy will be extended beyond its current expiration year of 2017 The ldquoNinth Centrdquo levy is in effect until year 2026 Revenue growth assumptions have been based on the States Revenue Estimating Conferences forecast of gallons of motor fuel pumped annually in Florida The Statersquos annual average growth rate is 19 These taxes are based on gallons pumped and not fuel prices Pinellas Countyrsquos built-out condition and the likelihood of future mandated vehicle fuel efficiency standards leads to this forecast assuming a continuing gradual decline in gas tax revenues Based on the historical and future reduction patterns current gas tax revenues are not predicted to keep up with projected inflationary expenditure demand on transportation operation and expenditure needs
Pinellas County Budget Forecast FY2014-2023 E-31
TRANSPORTATION TRUST FUND
Key Results Beginning in FY2013 Transportation Trust Fund expenditures exceed revenues throughout the forecast period which causes a gradual erosion of fund balance until the fund assumes a negative cash position in FY2018 By FY2017 potential revenue and expenditure options will need to be implemented to keep the fund in balance
Potential Risks Impacts on this forecast include macro-economic conditions such as increases or decreases in the price of oil that could affect demand for motor fuel Changes in the price of commodities such as concrete and asphalt could also affect the expenditure side of this forecast as the Transportation Trust Fund activities utilize large amounts of physical commodities An unanticipated increase in fuel conservation efforts an increase in electric vehicles or mass transit efforts could also affect the outer years of this forecast In addition a decision to not extend the current six cent local option gas tax levy would have a major impact (more than $12 million) on this analysis
Pinellas County Budget Forecast FY2014-2023 E-32
TRANSPORTATION TRUST FUND
Balancing Strategies Major strategies to manage the forecasted gap in revenues versus expenditures include a continuation of actions to reduce future costs on the expenditure side transfer of General Fund revenue to support transportation activities or the imposition of additional local option gas taxes From an enhanced revenue standpoint the County has authority to impose an additional five cents tax per gallon of fuel sold within the County however by statute proceeds realized would have to be shared with municipalities Diesel fuel is not subject to this tax The Countyrsquos estimated share of one cent of this local option gas tax is now approximately $19 million which is 60 of the $32 million in proceeds which would be generated countywide
1 cent 2 cents 3 cents 4 cents 5 cents $19M $38M $57M $76M $95M
For comparison purposes other Florida Counties that impose greater local option taxes than Pinellas Countyrsquos seven cents are shown in the following table
Counties Imposing Local Option Taxes Greater
than Seven Cents
Cents Imposed
Alachua 12 Broward 12 Charlotte 12 Citrus 12 Collier 12 DeSoto 12 Hardee 12 Hendry 9 Hernando 9 Highlands 12 Lee 12 Manatee 12 Marion 12 Martin 12 Miami-Dade 10 Monroe 10 Okeechobee 12 Palm Beach 12 Polk 12 Putnam 12 St Lucie 12 Sarasota 12 Suwanee 12 Volusia 12
Source 2012 Local Government Financial
Information Handbook - October 2012
Of Floridarsquos 67 counties
24 levy more than 7 cents 27 including Pinellas Pasco and Hillsborough levy 7 cents 16 levy less than 7 cents
Pinellas County Budget Forecast FY2014-2023 E-33
TRANSPORTATION TRUST FUND
An additional one to five cents is not likely to have a measurable impact on the sale of fuel as normal price differences and fluctuations routinely exceed this amount For this reason there would be little incentive for consumers to redirect their fuel purchases to Hillsborough or Pasco counties if they maintain their current seven cent fuel tax rates The additional five cents may be used for the construction of new roads the reconstruction or resurfacing of existing paved roads the paving of existing graded roads or other expenditures that are needed to meet immediate local transportation problems or are critical for building comprehensive roadway networks Routine maintenance of roads is not considered an authorized expenditure The additional one to five cents could be levied by a majority plus one vote of the Board or by approval in a countywide referendum Another balancing option is the implementation of a storm water strategy that includes a new dedicated funding source If a dedicated funding source was available storm water costs currently funded in the Transportation Trust Fund could be freed up to create additional capacity
Pinellas County Budget Forecast FY2014-2023 E-34
CAPITAL PROJECTS FUND
Description The Capital Projects Fund is used to account for all the governmental capital projects throughout the County Such projects include roads bridges drainage beach nourishment park development and construction of facilities necessary to provide County services
Summary The Capital Projects Fund is used to account for all governmental capital projects throughout the County This fundrsquos primary revenue source is the ldquoPenny for Pinellasrdquo one cent local option sales tax that is very sensitive to general economic conditions Penny tax revenues declined for several years instead of increasing at the original projected rate due to the recession but are predicted to increase gradually during the forecast period matching general economic growth as part of the recovery in the local state and national economy The forecast for the Capital Projects Fund shows that the fund is balanced over the forecast period During several years of the forecast expenditures exceed revenues due to project schedules Additional cash flow necessary in the first half of the ten-year period is being addressed through an interfund loan from the Solid Waste Replacement amp Renewal Fund The forecast includes repayment of the loan from FY2013 to FY2020
Revenues The major revenue components of the Capital Projects Fund are the Penny for Pinellas Grants and Transfers from Other Funds
Local Option Sales Tax (Penny for Pinellas) Penny for Pinellas revenues are proceeds of an additional one cent Local Government Infrastructure Surtax on Sales pursuant to Section 212055(2) Florida Statutes imposed in Pinellas County The authorized use of these funds is generally restricted to infrastructure projects only and cannot be used for ongoing operation and maintenance costs The Penny became effective February 1 1990 for an initial period of ten years and has been extended by referendums in 1997 and 2007 for two additional ten year periods (until 2020) In accordance with statutory requirements and interlocal agreements with each municipality in Pinellas County the County receives approximately 523 of the total monthly collections generated by this tax following the deduction of a dedicated amount for countywide use in improving Court and Jail facilities The Penny for Pinellas is the primary source of revenue supporting the Countys Capital Improvement Program Sales tax as a revenue source is highly elastic and is very sensitive to local and national economic conditions such as inflation wage growth unemployment and tourism Normally sales taxes increase with economic activity and inflation but reflecting the depth of the recent recession collections declined about 15 from FY2007 to FY2009
Pinellas County Budget Forecast FY2014-2023 E-35
CAPITAL PROJECTS FUND
Collections increased in FY2010 and FY2011 due to the transition to the new revenue distribution formula that began in February 2010 and results in a higher percentage of collections going to the County primarily due to the increase in the Courts amp Jail amount from $80M to $225M over the ten year period The revenue increase to the County is misleading as the underlying Penny revenues actually decreased in FY2010 and FY2011 In FY2013 and FY2014 the Penny is anticipated to increase 35 which is consistent with the general improvement in the economy The chart below shows the fluctuation in annual growth rates experienced since FY2000
Grants The second largest sources of revenue in the Capital Projects fund are grants The FY2013 budget includes $327M in local state and federal grants from agencies like the Southwest Florida Water Management District and the Florida Department of Transportation Grant revenues are highly variable over the forecast period The forecast only includes grants that either have been awarded or are highly anticipated to be awarded
Transfers from Other Funds The Capital Projects Fund also receives several transfers from other funds to cover or contribute to costs for specific capital projects
Pinellas County Budget Forecast FY2014-2023 E-36
CAPITAL PROJECTS FUND
The FY2013 and FY2014 Budgets include a transfer of $175M and $450M respectively from the Solid Waste Renewal and Replacement Fund as part of the interfund loan to the Capital Projects Fund On September 21 2010 the Board approved a resolution authorizing an interfund loan amount of up to $85 million in lieu of a $150M bond issue originally planned to finance key projects in the 2010 to 2020 Capital Project Fund The outstanding principal in FY2013 will be $325 million (including the FY2013 loan amount of $175 million) The annual rate of interest is a variable rate which is currently less than 1 Payments on outstanding loan principal are required to begin no later than FY2016 and the loan shall be paid in full no later than December 31 2019 The benefits of an interfund loan versus bonding include lower borrowing costs no reserve requirements interest accrues to a county entity and more flexibility in the implementation and terms of the loan The loan is being tracked separately for the Centralized Chiller Facility project vs the cash flow needed for capital projects in total The loan amount for capital projects consists of $15 million in FY2010 $100 million in FY2013 and $45 million in FY2014 The principal payments for the $70 million loan for capital projects is budgeted for FY2015 ndash FY2020 The loan amount for the Centralized Chiller Facility project is $75 million in the FY2013 budget The principal payments for the Centralized Chiller project is budgeted for FY2013-FY2017 This project funds the construction of a new centralized chiller facility for the downtown Clearwater campus The County will purchase chilled water at a set rate based on the amount of investment towards the cost of the facility Fully funding this project is estimated to result in $507K of annual savings $38M of cost avoidance and potential revenue opportunities of $300-400K a year The total project cost is estimated at $120M of which $15M of design costs are being paid for by a federal grant from the Department of Energy and $30M was allocated from non-recurring funding in the General Fund in the FY2011 Budget The General Fund transfer in FY2013 for $18 million covers the cost of two items The first item is $300K of recurring capital costs paid for by recurring revenue from the implementation of the new parking fees at Fort De Soto Park and Howard Park Beach amp Causeway These funds will be used annually to maintain and improve the bathhouses at the two parks The second item is $15 million for the principal payment on the Centralized Chiller Facility project The FY2013 transfer of $22M from the Transportation Trust Fund (proceeds of the 9th cent Local Option Gas Tax) contributes to the cost of several Intelligent Transportation System Advanced Transportation Management System projects The FY2013 transfer of $32M from the Tourist Development Council Fund (half of the proceeds of the 3rd cent) funds beach nourishment projects in the Coastal Management area The Transportation Impact Fee Fund is used to account for Transportation Impact Fees collected throughout the County thus assuring that new development bears a proportionate share of the cost of capital expenditures necessary to meet transportation needs of the County The transfer of $16M from the Transportation Impact Fee Fund in FY2013 is to cover or
Pinellas County Budget Forecast FY2014-2023 E-37
CAPITAL PROJECTS FUND
contribute to the current or past costs of authorized transportation projects in the twelve geographic transportation impact fee districts of the county
Expenditures Expenditures in the Capital Projects Fund consist of capital project expenditures and debt service costs Capital Projects The majority of expenditures in the Capital Projects fund are for infrastructure projects in the areas of transportation storm water drainage and water quality parks environmental preservation courts jails public safety and other public facilities Planned expenditures in this fund over the forecast period cover the project allocations from the 2010 to 2020 Penny Program Please see the ldquoCapital Improvement Programrdquo section of the FY2013 Budget Message for expenditure highlights of the One-Year CIP and the Ten-Year CIP Debt Service Debt service costs over the forecast period are associated with the interfund loan from the Solid Waste Renewal and Replacement Fund The loan consists of $70M to help necessary liquidity in the Capital Projects Fund related to the acceleration of projects in the first half of the 2010-2020 Penny Program and $75M for the balance of the remaining cost for the Centralized Chiller Facility This project has already been funded $15M by a Department of Energy grant and $30 by non-recurring funds in the General Fund
Ten-Year Forecast Key Assumptions The revenue assumptions for the overall Penny sales tax are consistent with the Half-Cent sales tax in the General Fund at 40 growth from FY2014 to FY2020 However the growth rate in the Capital Projects Fund for the Penny sales tax is less at 35 growth in FY2014 and 30 growth from FY2015 to FY2020 This is because the Courts amp Jail allocation is a fixed amount that does not grow over time resulting in a slightly smaller growth rate for the Countyrsquos overall share of the Penny The expenditure assumptions for the Capital Projects Fund assume consistency with the 2010 to 2020 Penny Program allocations
Pinellas County Budget Forecast FY2014-2023 E-38
CAPITAL PROJECTS FUND
Key Results The forecast for the Capital Projects Fund shows that the fund is balanced over the forecast period During several years of the forecast expenditures exceed revenues due to project schedules Additional cash flow necessary in the first half of the ten-year period is being addressed through an interfund loan from the Solid Waste Renewal amp Replacement Fund A primary driver of cash flow is $81M of expenditures associated with the Public Safety Complex project that started in FY2012 The forecast includes repayment of the loan from FY2013 to FY2020
Potential Risks There are many impacts that can alter the ten-year forecast of the Penny tax collections The primary concern is the strength of the local economy due to the sensitivity of collections to economic conditions If the economy improves collections could be higher than anticipated as consumer activity increases The reverse would be true if the economy deteriorates There are risks of increases in major commodities used in capital project construction such as steel or concrete such as those the County experienced in 2005-2007 where prices escalated as much as 60-80 for these key materials
Pinellas County Budget Forecast FY2014-2023 E-39
CAPITAL PROJECTS FUND
Balancing Strategies The forecast for the Capital Projects Fund shows that the fund is balanced over the forecast period The assumption is that expenditures will be decreased or increased to match the Penny for Pinellas and other revenue streams that support the CIP
Pinellas County Budget Forecast FY2014-2023 E-40
EMERGENCY MEDICAL SERVICE FUND
Description The EMS Fund is a special revenue fund established by referendum in 1980 which allows up to 15 mills to be levied annually on a county-wide basis to finance the operation of a comprehensive county-wide emergency medical service system This system provides advanced life support emergency medical response and transport services to all citizens of Pinellas County The County maintains EMS contracts with 18 fire service agencies (first responders) and one ambulance provider (Paramedics Plus operating in Pinellas County under the trade name ldquoSunstarrdquo) The EMS System is funded by a combination of property taxes and ambulance user fees The ambulance user fees support the ambulance contractual expenditures and property taxes are intended to support the first responder expenditures The EMS System was established by referendum in 1980 by the Special Act (Chapter 80-585 Laws of Florida) that created the EMS Authority as a Dependent Special District In 1988 Pinellas County Ordinance 88-12 solidified the current EMS system design The Fiscal Policy guidelines within Ordinance 88-12 state that the Board of County Commissioners sitting as the Emergency Medical Services Authority directs the following fiscal policy guidelines that governs the financial operations of the Countyrsquos EMS system (a) to establish sound business controls and long term cost containment incentives throughout the County EMS system (b) to provide adequate funding to upgrade all EMS components to state-of-the-art-levels and to maintain that progress in future years (c) to provide for long term financial stability sufficient to sustain quality EMS operations far into the future (d) to reduce the County EMS systemrsquos excessive dependence upon local tax support by developing a more balanced approach to EMS funding and (e) to provide the Board of County Commissioners with a wider range of EMS financing options than have been available in the past
Summary The Emergency Medical Service (EMS) Fund is sensitive to property values as it is funded by ad valorem (property) tax revenue collected from property owners countywide and ambulance user fee revenues Property tax revenues have declined dramatically in recent years due to a downturn in property values and statewide legislation The forecast for the EMS Fund indicates the fund is not balanced over the forecast period On the revenue side the FY2013 Adopted Budget included an increase of 00652 or 77 in the countywide EMS millage rate from 08506 to 09158 With this increase the EMS budget maintains the status quo with respect to level of service and the delivery system The millage increase is not enough over the forecast period to fund the system and maintain the fundrsquos reserve at 25 pursuant to Board policy adopted by ordinance The forecast estimates the reserve at 252 in the FY2013 ending fund balance The estimated percentage decreases to 203 at the end of FY2014 and 130 by the end of FY2015 if the tax rate is not increased again or expenditures are not significantly reduced Though this level is improved from the last forecast expenditures in the EMS Fund are still projected to exceed revenues by an increasing amount each year from FY2013 through FY2023 In FY2016 the projected reserve drops below 4 This leaves approximately $4M in the fund balance for the projected $12M deficit in FY2017
Pinellas County Budget Forecast FY2014-2023 E-41
EMERGENCY MEDICAL SERVICE FUND
Future expenditure savings will be addressed with the results of an operational study and accounting study that are underway to analyze variations of EMS service under consideration for Pinellas County In late 2011 the Pinellas County Legislative delegation created an EMS Fire Transport Special Committee to select a nationally recognized firm that would operationalize analyze and compare costs for three variations of EMS service 1) the current EMS system 2) the system as proposed in the Integral Performance Solutions Study and 3) the Sanford-Millican proposal for fire based transport The current ambulance service contract is in effect through FY2014 with a one year extension option First responder contracts are currently funded based on actual first responder costs as defined in Board Resolution 09-38 It is expected that a combination of revenue increases and expenditure savings will be needed to make up for deficits in prior years and increase reserves to a sustainable level throughout the forecast period
Revenues The primary funding sources for the EMS Fund are ambulance user fees and property taxes Ambulance User Fees The ambulance service user fees provide funding for the ambulance program which includes the ambulance provider (Paramedics Plus) contractual expenditures ambulance billing costs and ambulance program support costs Ambulance user fees are based on transport volume and transport charges An average retail rate charge is $620 per transport The County bills Medicare Medicaid private insurance and various other payors for transport service Billing for the service is done by Pinellas County The collection rate is currently about 70 (net of MedicareMedicaid non-allowable charges) of billing for the transport service The County handles transports for non-emergencies and mental health transports as well The County utilizes the 9-1-1 System to dispatch calls for the proper response to the call Ambulance user fee revenue is projected to reach $446M in FY2013 and then increase by 2 annually over the forecast period The Board of County Commissioners has the authority to increase ambulance user fees as necessary In addition Board Resolution 89-208 calls for an automatic increase in user fee rates by the percentage increase in the medical consumer price index for the previous year until the prudent reserve level is reached (25) The retail rate increased 33 in FY2012
The County also offers an ambulance user fee membership program that citizens can join to minimize the cost of EMS transports Membership revenue is projected to generate $200K per year through the forecast period
Property Taxes Property taxes are used to fund the first responder program Property tax revenues have decreased significantly since FY2008 due to legislative rollbacks the passage of Amendment One the decline in the real estate market and the recession
Pinellas County Budget Forecast FY2014-2023 E-42
EMERGENCY MEDICAL SERVICE FUND
The EMS millage rate is a county-wide millage rate that remained flat at 05832 from FY2008 through FY2011 During this period ad valorem revenue decreased each year from $426M in FY2008 to $306M in FY2011 The Board of County Commissioners has the authority to increase or decrease the millage rate and in FY2012 the millage rate was increased to 08506 This resulted in Ad Valorem revenues recovering to $422M and finishing FY2012 with a net gain in revenues over expenditures For FY2013 a millage rate of 09158 was approved in order to balance the budget and approach a beginning balancereserve of 25 (level set by County Ordinance approved by the Board on December 20 2011) The millage cap for this revenue is 15000 mills and the rollback rate for FY13 was 08698 With the millage increase tax revenue increased $21M from actual FY2012 to estimated FY2013 but the EMS Fund is still projected to use $09M from the fund balance Without another millage increase or significant expenditure reductions in the next two years the fund balance continues to decrease each year until it is depleted in FY2017
Emergency Medical Service Fund
Ad Valorem Revenue amp Millage History
Fiscal Year Millage Budget $ (000s)
2013 09158 $ 438
2012 08506 $ 416
2011 05832 $ 300
2010 05832 $ 336
2009 05832 $ 383
Note Budget figures are at 95 of revenue
Expenditures The Emergency Medical Service Fund supports budgeted expenditures in FY2013 totaling $906M for its operations The primary expenditures in the fund are $382M for payments to the ambulance contractor $402M for contractual payments to the eighteen first responders $13M for transfers to the Property Appraiser and Tax Collector $107M in program support and billing of ambulance claims and $200K in the Trust Fund Grant The reserve is estimated at $219M for FY2013 which is $5M above the budgeted level due to a combination of FY2012 actual revenues being $3M higher and actual expenditures being $2M lower than budget The reserve is still projected to decline as expenditures exceed revenues through the forecast period Ambulance Contractor Payments The County contracts with Paramedics Plus for the Countyrsquos SUNSTAR ambulance system Contracts with the Countyrsquos ambulance provider were renegotiated in FY2012 with an annual reduction to base service payments of $2 Million A 6 increase is included in the forecast from FY2014 through FY2023 to account for annual CPI increases and increases to transport volume However once the contract is up for negotiation expenditures may change as the economy rebounds and fuel and labor costs and other factors change
Pinellas County Budget Forecast FY2014-2023 E-43
EMERGENCY MEDICAL SERVICE FUND
First Responder Contractual Payments The County contracts with the eighteen first responder EMS providers that respond to calls using paramedics and that utilize Advanced Life Support (ALS) or Basic Life Support (BLS) equipment and personnel During FY2013 budgets submitted by the 18 agencies included an overall increase of 5 This 5 annual growth rate continues through the forecast period to FY2023 In FY2013 the first responder agreements also include an agreement of $356K to Eckerd College for basic life support water rescue EMS Program Support Costs The County incurs program support costs (Personal Services and Operating Expenditures) to support the EMS program These costs are allocated between the ambulance function and the first responder function Costs allocated to both functions include the Office of the Medical Director St Pete College training expenses communication and EKG equipment and maintenance and personnel and operating expenses to administer all contracts within the program The FY2013 Ambulance program support expenditures of $63M pay for those support items listed above and the ambulance billing function that includes a staff of 34 The FY2013 First Responder program support expenditures of $44M include those allocated support items listed above Transfers The Emergency Medical Service fund has transfers to the Property Appraiser and Tax Collector to cover the costs for collection of ad valorem revenues FY2013 costs for this function are $13M The commissions for the Property Appraiser and Tax Collector are pursuant to Florida Statutes Reserves Pinellas County Ordinance 88-12 which was amended with Resolution 89-208 authorizes the establishment of a prudent reserve equal to one-third of the annual budget for this fund On December 20 2011 the Board approved changing the prudent reserve amount to 25 Reasons for such a high reserve level include disasters such as a hurricane where a large amount of equipmentvehicles may need to be replaced quickly to sustain EMS service and enough working capital for a potential transition if contract requirements are not met by the service provider In addition this reserve level will provide cash flow needs in the event of interruptions to ambulance collections due to a disaster or a Medicare andor Medicaid audit With high monthly contractor payments it is critical cash flow needs are met With FY2012 actual revenue coming in $3M higher than budget and actual expenditures at $2M less than budget the year ended with the reserve at 28 On a forecast basis with Ad Valorem revenue at 96 and Ambulance revenues at 100 the estimated reserve level is projected at 252 for the end of FY2013 Without additional increases in the millage rate or substantial decreases in expenditures the reserves are forecasted to decline to 185 in FY2014 and 105 in FY2015
Pinellas County Budget Forecast FY2014-2023 E-44
EMERGENCY MEDICAL SERVICE FUND
The net increase in the FY2012 ending balance pushes the projected depletion of remaining reserves out to FY2017
Ten-Year Forecast Key Assumptions The EMS countywide millage is assumed to remain at the FY2013 approved rate of 09158 mills through the forecast period Taxable values should begin to recover as the economy improves and the housing market rebounds Ad Valorem tax revenue is projected to grow 25 in FY2014 and FY2015 followed by a 3 annual growth factor from FY2016 to FY2023 During the forecast period ambulance revenue user fees are estimated to increase by 20 which aligns with projected increases to transport volume First responder contractual expenditures increased 5 from FY2012 to FY2013 and are estimated to increase at 5 per year through the forecast period Contractual payments to the ambulance contractor are assumed to increase by 6 through the forecast period as contracted expenditures will increase due to increased transport volume and increases in the CPI as stipulated in the contract The County will work with the provider to negotiate the lowest possible contract while still maintaining quality service
Pinellas County Budget Forecast FY2014-2023 E-45
EMERGENCY MEDICAL SERVICE FUND
Key Results In the chart for the total EMS Fund above the forecast shows expenditures exceeding revenues over the forecast period Balance for FY2013 is achieved through the FY2013 millage rate increase and use of reserves Without another millage rate increase andor expenditure savings reserves will be exhausted after FY2016 This assumes no changes to the EMS system design
Potential Risks A major variable impacting future revenues for this fund is ad valorem revenue and taxable values As taxable values begin to rebound the opportunity for higher revenues may increase If market values grow more slowly or decline revenue would be negatively affected Another factor in future revenues will be ambulance user fee revenues The ambulance contract will be up for re-negotiation in FY2014 with potential impacts to expenditures Tourism and inflow into the local area of more visitors and residents will impact the number of users of the EMS system Continued aging of the general population (baby boomers) could result in more transport volume in the ambulance area Results from the operational study may impact future revenues and expenditures for the EMS system particularly if significant changes are made to the system design
Balancing Strategies The forecast shows that the fund is not in balance over the forecast period Future balancing strategies will be developed from information gathered in the EMS system operational study
Pinellas County Budget Forecast FY2014-2023 E-46
FIRE DISTRICTS FUND
Description In 1973 a Special Act of the Florida Legislature (Chapter 73-600 Laws of Florida) created the Pinellas County Fire Protection Authority This special legislation subsequently assumed ordinance status as Article II Chapter 62 of the Pinellas County Code The Board of County Commissioners is designated as the Fire Protection Authority with responsibility to ldquoestablish and implement a permanent plan of fire protection for Pinellas County and each of its municipalitiesrdquo and levy ad valorem taxes to fund fire protection services within these districts At present the Fire Districts Fund consists of twelve separate municipal services taxing units (MSTUs) that provide fire protection services in the unincorporated areas of Belleair Bluffs Largo Clearwater Dunedin Gandy Largo Pinellas Park Safety Harbor Tarpon Springs Seminole High Point Tierra Verde and South Pasadena These districts were formed at differing times after the electors in the affected unincorporated areas approved their creation and the levy of ad valorem taxes to fund fire protection Those Fire Districts that were created under Chapter 73-600 Laws of Florida receive compensation based on the pro rata share of the fire departmentrsquos budget in each fire district The pro rata share is allocated based on the value of real property for the unincorporated area in that district
Summary The Fire Districts Fund provides fire protection service to the unincorporated areas of Pinellas County through twelve separate dependent fire protection districts that are funded entirely by ad valorem taxes collected from property owners within these districts This fund forecast is presented in a high-level consolidated manner Budgetarily each Fire District is balanced separately Property taxes have declined dramatically in recent years due to a downturn in property values and statewide legislation As the housing market is recovering property tax revenues are forecast to increase 20 in FY2014 and FY2015 A 25 growth factor continues through the forecast period The forecast for the Fire District Fund indicates that the fund is not balanced through the forecast period Millage rates increased for five of the twelve fire districts in FY2013 The millage rate for the South Pasadena Fire District decreased substantially with a change in contracted service provider Additional increases to millages for the individual fire districts will likely be necessary to cover expenditures over the forecast period Potential millage rate increases will need to take into account the individual millage caps in each fire district
Revenues The Fire Districts Fund consists of primarily one funding source property taxes (ad valorem revenue)
Pinellas County Budget Forecast FY2014-2023 E-47
FIRE DISTRICTS FUND
Property Taxes Property tax revenues have decreased significantly over the last several years due to legislative rollbacks the passage of Amendment One the decline in the real estate market and the recession These revenues are affected by taxable values for properties in the local economy Overall property taxes are budgeted to generate $148M in FY2013 across all districts Each dependent fire district has a separate ad valorem millage rate that is the sole revenue source for each of the fire districts The next chart illustrates five of the fire districts that required an increase in millage rates in FY2013 to fund fire service provider expenditures The five districts were Clearwater Dunedin Largo Safety Harbor and Tierra Verde The millage rate for the South Pasadena Fire District was reduced from 31257 to 09137 in FY2013 as significantly less revenue was needed to fund a new service contract with the City of St Petersburg In FY2012 Public Safety Services requested provider bids for fire service to the district The lowest bid was from St Petersburg at $75000 for an annual contract over five years beginning in FY2013 This was $175000 less than the bid from the City of South Pasadena which had the annual service contract prior to FY2013
Dependent MSTU Fire Protection Districts
Ad Valorem Millage Rates amp Millage Rate Caps
Millage Rate Caps
FY13 Adopted Millage
FY12 Adopted Millage
Variance FY13FY12 Millages
Belleair BluffsLargo 50000 17320 17320 00000
Clearwater 50000 32092 26591 05501
Dunedin 50000 35525 22576 12949
Gandy 50000 22602 22602 00000
Largo 50000 35609 35133 00476
Pinellas Park 50000 23675 23675 00000
Safety Harbor 50000 27631 26800 00831
Tarpon Springs 50000 23745 23745 00000
Seminole 100000 19581 19581 00000
High Point 100000 41916 41916 00000
Tierra Verde 30000 19118 19087 00031
South Pasadena 50000 09137 31257 -22120
Pinellas County Budget Forecast FY2014-2023 E-48
FIRE DISTRICTS FUND
Each district is subject to a mandated millage cap The millage cap threshold for Belleair Bluffs Clearwater Dunedin Gandy Largo Pinellas Park Safety Harbor Tarpon Springs and South Pasadena are set at 5 mills while Seminole and Highpoint have a 10 mill cap Tierra Verde has the lowest millage cap at 30 mills which was increased by the Board from 15 mills in June 2010 to meet increasing operating expenditures The next chart shows the variation in the taxable values between unincorporated fire districts due to the composition of properties within the districts eg beach properties condominiums etc For nine of the 12 Fire Districts FY2013 taxable values decreased from the prior year due to the continued decline in the real estate market Three districts gained taxable value in FY2013 recovering some of the lost value through FY2012
Unincorporated Fire Districts
Percentage Change in Taxable Values FY20122013
Taxing Authority FY12 Taxable
Values FY13 Taxable
Values Chge
Belleair BluffsLargo 281332094 267962625 -475
Clearwater 888428781 831260703 -643
Dunedin 280773821 279367691 -050
Gandy 46246094 45444402 -173
Largo 534088892 512659658 -401
Pinellas Park 268204137 253431862 -551
Safety Harbor 63339041 64246370 +143
Tarpon Springs 168715814 164963370 -222
Seminole 2203015774 2106822294 -437
Highpoint 675532802 657217037 -271
Tierra Verde 714080020 736173857 +309
South Pasadena 99826357 101553248 +173
Consistent with the assumptions for the Countyrsquos Municipal Services Taxing Unit (MSTU) this forecast projects a 20 increase in Ad Valorem revenue for FY2014 and FY2015 From FY2016 through the forecast period this revenue is projected to increase at 25 each year for the unincorporated dependent fire districts
Expenditures The Fire District Fund supports budgeted expenditures and reserves totaling $23M for all twelve districts in FY2013 The primary expenditures budgeted in the fund are $139M for contractual payments to the municipalities and other independent agencies for fire and rescue services FY2013 budgeted reserves are $83M the FY2013 estimate increases the reserve to $9M to reflect a greater than expected FY2012 ending fund balance
Pinellas County Budget Forecast FY2014-2023 E-49
FIRE DISTRICTS FUND
Contractual Fire Payments The forecast includes an annual 40 increase for the service contracts through the forecast period Fire departments submit their operating and capital budget requests on an annual basis and after County review funding is based on the unincorporated pro-rata share of property values within the district The exception is the new contract with the City of St Petersburg for services to the South Pasadena district which is set at $75K per year for five years Administrative Costs Administrative costs from the County are allocated to each fire district based proportionately on the amount of budgeted ad valorem revenue collected This cost has decreased in recent budget years as reductions have been made to this allocation The FY2013 budget is $2645K Operating Expenses for this account reflect the Countyrsquos administrative expenses such as personal services intergovernmental charges and other operating charges that are allocated out to the twelve fire districts Transfers The Fire District fund has transfers to the Property Appraiser and Tax Collector to cover the costs of appraisals and collection of ad valorem revenues These amounts are set by Florida Statute and fluctuate with ad valorem revenue estimates FY2013 costs are estimated at $458K and the annual cost is estimated at 3 of projected ad valorem tax revenue through the forecast period Reserves The reserve level in the Fire District fund fluctuates as a whole but each fire district is evaluated individually The minimum reserve level that each district maintains is 5 reserve for contingency This is at the low end of the 5-15 reserve level budget policy adopted by the Board Several of the individual fire districts currently maintain a 5 minimum reserve including Clearwater Dunedin Gandy Largo and Tierra Verde Safety Harborrsquos contingency reserve was decreased from 10 to 5 in FY2013 which helped reduce the required millage increase Some of the districts including Belleair BluffsLargo Pinellas Park Tarpon Springs and Seminole Fire Districts maintain a 10 reserve level that serves as a buffer to shield the district from economic downturn in their area In FY2013 High Point was able to increase its contingency reserve from 5 to 8 with no increase in millage from FY2012 and South Pasadena increased from 5 to 10 In addition some fire districts set aside funds in Reserve for Future Years for long-term capital projects such as a new fire truck purchase or improvements to a fire station Districts can request these funds with the County sharing its portion of requests based on the unincorporated value of the district
Ten-Year Forecast Key Assumptions The fire district millages are assumed to remain at the approved FY2013 rates through the remainder of the forecast period for each of the districts Property tax revenue is forecasted to
Pinellas County Budget Forecast FY2014-2023 E-50
FIRE DISTRICTS FUND
increase by 20 in FY2014 and FY2015 Annual growth of 25 is projected through the rest of the forecast period as the housing market begins to rebound On the expenditure side the contractual payments to the cities are assumed to increase by 40 through the forecast period which outpaces the property tax revenues for the complete forecast period
Key Results The fire district fund is presented in a consolidated manner for all of the individual unincorporated twelve districts The chart above shows that total fund expenditures are projected to exceed revenues from FY2018 through FY2023 Specific fire districts will vary in how much operating and capital funds are requested how reserves are maintained and how fund balance is utilized So each individual district must be analyzed separately for its specific situation with revenue expenditures and reserves While overall the fund appears to be balanced until FY2018 revenues are outpaced by expenditures sooner in some of the individual fire districts Several of the districts will utilize fund balance during the forecast period to pay for long-term capital projects and current operating expenditures And as the main source of revenue in this fund is property taxes some of the unincorporated fire districts may have to increase millage rates in each budget year to keep up with expenditures
Pinellas County Budget Forecast FY2014-2023 E-51
FIRE DISTRICTS FUND
Potential Risks The major variable impacting future revenues for this fund is ad valorem revenue and taxable values As taxable values begin to rebound the opportunity for higher revenues will increase This is the main driver for increased revenues in the forecast If the districts continue to increase their operating requests at 4 per year and tax revenue grows at an estimated 25 in future years the pressure on increasing millage rates for the fire districts will continue each budget year Another potential impact is annexation of the unincorporated fire district areas As cities increasingly annex more of the available unincorporated properties area there are fewer unincorporated properties to share the burden of service costs The funding formula in most fire districts allows for the remaining unincorporated payment to decrease proportionately The exception to this practice is those Highpoint properties annexed by the City of St Petersburg Another impact to fire service costs would be increased costs of Emergency Medical Service If EMS funding is reduced by the County there is a high probability these same providers may shift those costs to their fire district budget
Balancing Strategies The forecast shows that this combined fund is not balanced through the forecast period This fund cannot be taken as a whole but each district must be looked at individually Unless the ad valorem revenue projection improves further out into the forecast the individual districts will feel pressure to increase their millage rates On the expenditure side the contractual costs from the fire service providersrsquo requests are being reviewed for continued efficiency opportunities Some of the individual districts can continue to use fund balance as long as it is available to them and as long as the minimum reserve of 5 is prudently maintained to continue funding their district personnel and operating expenditures
Pinellas County Budget Forecast FY2014-2023 E-52
AIRPORT FUND
Description In March 1941 construction started for the airport at its present site After Pearl Harbor the airport known as Pinellas Army Airfield was used as a military flight-training base After WWII many army airfields were declared surplus and turned over to cities counties and state sponsors to manage The Pinellas Army Airfield property was granted to Pinellas County by the US Government to operate as a commercial airport It was originally called the Pinellas International Airport and given the airport call letters PIE The Airport Revenue and Operating Fund is used to account for the self-supporting operations of St Petersburg - Clearwater International Airport and its surrounding land uses on the airportrsquos 2000 acres Approximately half of this property is dedicated to the airfield and supporting terminal and other facilities The remaining acreage includes the 129 acre planned development site (former golf course) a 200 acre Airport Business Center and leased industrial commercial and governmental operations All of the entire Airport property is a designated Foreign Trade Zone All activities necessary for Airport operations (eg administration operating and maintenance expense) are included in this fund Also included are airport facility capital improvements which receive federal and state grant funding of up to 95 of costs depending on the type of project with some projects funded 100 when Passenger Facility Charges are included In recognition of the quality of operations and innovative and efficient management the Florida Department of Transportation recognized St Petersburg ndash Clearwater International Airport as the 2010 Commercial Service Airport of the Year In 2011 Allegiant Airlines recognized the Airportrsquos terminal renovation project as their systemrsquos airport construction project of the year
Summary The Airport Operating and Revenue Fund is an enterprise fund that accounts for revenues and expenditures at St Petersburg ndash Clearwater International Airport This includes management of airport properties in addition to airfield operations The airport is self-supporting and no property tax dollars are used to support the operation of the airport Airport revenues have remained stable in recent years due to the rentallease terms and Allegiant Airlinesrsquo popularity Revenues are forecast to increase gradually during the forecast period matching anticipated gradual growth as part of the recovery in the broader US economy The ability to forecast the availability of capital contributions and other grant funding after FY2018 is limited Therefore intergovernmental revenues in FY2019 through FY2023 are forecast at a conservative lower level The forecast for the Airport Revenue and Operating Fund shows that the fund is balanced through the forecast period based on the assumptions that the capital projects budget would be adjusted to reflect the timing and amounts of any grants revenue and that the airportrsquos operating budget would be adjusted to match revenues
Pinellas County Budget Forecast FY2014-2023 E-53
AIRPORT FUND
Revenues Excluding capital contributions and grants the two major funding sources supporting the Airport Revenue and Operating Fund during the forecast period are RentalsLeasesConcession income and AirfieldFlight Line Fees
RentalsLeasesConcessions St Petersburg-Clearwater International Airport which is classified as small-hub airport by the FAA provides commercial and private aviation services for the community The Airport also has a significant amount of land which is leased under long-term leases providing a stable source of revenues Pinellas County Criminal and Juvenile Courts Cracker Barrel Restaurant Dynamet Inc and GE Aviation Systems are just a few examples of long term leases at the airport Forty-five percent (45) of the long-term industrial (non-aviation) land leases are with Pinellas County Also included in this revenue source are concessions operating at airport terminal such as the paid parking car rentals gift shop and restaurant These revenue sources are expected to increase by 2 over the 10 year forecast Long-term leases have a five year adjustment based on the CPI AirfieldFlight Line Airfield fees are charges for the use of the runways and taxiways Flight Line leases are for aircraft parking areas and maintenance hangars These revenue sources are expected to increase by 2 over the 10 year forecast
$00
$20
$40
$60
$80
$100
$120
$140
2013 2014 2015 2016 2017 2018 2019 2020 2021 2022 2023
Mill
ion
s
Airport Revenue amp Operating Fund Major Non-Capital Revenue Sources
Forecasted FY2013-FY2023
AirfieldFlight Lines RentsLeasesConcessions New Property Development
Pinellas County Budget Forecast FY2014-2023 E-54
AIRPORT FUND
The following chart for passenger traffic in 2012 shows that Allegiant Airlines represents 908 of the passengers served on commercial carriers from St Petersburg-Clearwater International Airport Revenues from Terminal concession leases along with airline landing fees and fuel flowage fees are dependent on passenger airline service
Capital Contributions and Grants Capital Contributions funding is in the form of grants from the Federal Aviation Administration (FAA) the Florida Department of Transportation (FDOT) along with Passenger Facility Charges (PFCs) These are the revenue sources typically used for the Airportrsquos capital project funding There are also occasions when Airport Reserves are used to assist with funding of CIP Projects Other Revenues AIRCO Golf Course which had been operating on airport property closed in FY2011 due to significant annual operating losses at the course In FY2010 the course lost $216000 and in FY2011 it lost $139000 As a result of closing the course the Airportrsquos profitability has increased Revenue from new development on this property is not expected to be produced until FY2018
Expenditures The Airport Revenue and Operating Fund supports budgeted expenditures and reserves in FY2013 totaling $329M of which $124M is allocated for capital projects and $114M is reserves
Pinellas County Budget Forecast FY2014-2023 E-55
AIRPORT FUND
Airport Programs Of the remaining $91M in operating expenditures 80 supports the Aviation Services program and 20 the Airport Real Estate program Starting in FY2013 two primary programs were identified for reporting purposes Aviation Services and Airport Real Estate The Aviation Services program consists of all facets of day-to-day aviation activities The Airport Real Estate program oversees and negotiates leases with tenants and future development of the Airport to ensure compliance with Federal Aviation Administration lease requirements Personal Services Personal Services expenses are for the salaries and benefits of the 64 positions needed to operate both programs at the Airport Budgeted Personal Services expenditures in FY2013 total $43M Capital Projects The FY2013 estimate for Capital Projects is $124M These projects receive funding in the form of grants from the Federal Aviation Administration and the Florida Department of Transportation These projects will only commence when the appropriate grants funding is made available The following chart shows the relationship between the scheduling of the revenues and the expenditures of capital projects When additional funds are needed Reserves could be used FY2018 shows preliminary planned improvements such as new T-hangars and expanded cargo ramp
Reserves The total reserve level in the Airport Revenue and Operating fund is budgeted at $114M (40) in FY2013 This reserve level is the result of the Airport building reserves over the past several
$00
$50
$100
$150
$200
2013 2014 2015 2016 2017 2018 2019 2020 2021 2022 2023
Mil
lio
ns
Airport Grant Revenue amp Capital Projects Expenditures
Forecast FY2013 - FY2023
Total Grants Capital Projects
Pinellas County Budget Forecast FY2014-2023 E-56
AIRPORT FUND
years The reserves are then available in the event of unanticipated revenue shortfalls and as well as support future capital funding needs When expenditures in a given year are shown as exceeding revenues the difference is supported by drawing down accumulated reserves including Passenger Facility Charges which must be used for capital projects (See the Reserves chart below) Airport Reserves also include the projected cost of Other Post Employment Benefits (OPEB) as proprietary funds are required by GASB 45 to record the entire annual required contribution (ARC) accrual on the financial statements
Ten-Year Forecast Key Assumptions The revenue forecasts of funding total resources are conservative due to the current economic conditions AirfieldFlight Line revenue for FY2013 is based on the current level of carriers and passenger numbers For FY2014 through FY2023 an increase of 2 per fiscal year is forecast The forecast is conservative as no new carriers have been included RentLeasesConcessions revenue for FY2013 is based on current leasesagreements through the termination of these lease agreements For FY2014 through FY2023 an increase of 2 is forecasted for each fiscal year No new revenue from commercial or industrial development on the former golf course acreage is projected in the forecast until FY2018 However new property development will depend on factors such as site restrictions and future economic conditions The chart below shows that the net of recurring revenues and recurring expenditures is positive through the forecast period
$00
$50
$100
$150
$200
2013 2014 2015 2016 2017 2018 2019 2020 2021 2022 2023
Mill
ion
s
Airport Fund Reserves Forecast FY2013-FY2023
Pinellas County Budget Forecast FY2014-2023 E-57
AIRPORT FUND
With the addition of the Capital expenditures and revenues the chart below tracks the estimated revenues and expenditures in the fund through the forecast period
$00
$20
$40
$60
$80
$100
$120
$140
2013 2014 2015 2016 2017 2018 2019 2020 2021 2022 2023
Mill
ion
s
Airport Fund Forecast FY2014 - FY2023 Excluding Non-Recurring Revenues and Expenditures
Revenues Expenditures
$00
$50
$100
$150
$200
$250
$300
2013 2014 2015 2016 2017 2018 2019 2020 2021 2022 2023
Mill
ion
s
Airport Fund Forecast FY2014 -FY2023 Including Capital Improvement Program
Revenues Expenses
Pinellas County Budget Forecast FY2014-2023 E-58
AIRPORT FUND
Key Results The forecast for the Airport Fund is balanced over the forecast period The fluctuation in total revenues and expenditures is caused by the timing of capital projects Capital project impact to both revenues and expenditures is fund neutral since the projects are dependent on the availability of grants If the grants are not forthcoming the projects are not started
Potential Risks Several items can alter the ten-year forecast of Airport revenue collections A primary concern is the strength of the airline industry and the continued success of Allegiant Airlines Revenues could increase if the airport can attract new passengers and other carrier services Increases in rentalleases income would result when current leases and agreements are renewed and rate formula escalations occur The former AIRCO Golf Course has been rezoned for future aviation and commercial development The potential lease income value of this parcel is approximately $15M annually when all land is fully leased In addition other vacant land parcels could add another $100K to $300K in annual lease income if fully leased Also this forecast does not add any new passenger service An increase of 250000 new airline passengers could provide over $1M in additional income without a significant increase in operating expenses
Balancing Strategies The forecast does not show any structural gaps in revenues and expenditures as the fund is balanced through the forecast period assuming that the operating and capital budget would be adjusted in step with revenues
Pinellas County Budget Forecast FY2014-2023 E-59
AIRPORT FUND
Pinellas County Budget Forecast FY2014-2023 E-60
WATER FUNDS
Description The Pinellas County Water System is responsible for providing quality cost effective potable water service to County retail and wholesale customers The Water System must adhere to State and Federal laws rules and regulations while operating and maintaining this delivery system The Water System is continually being upgraded to provide customers with a safe and sufficient water supply for domestic needs as well as an ample supply for fire protection The Water System also continues to educate its customers on important water conservation issues The Water Funds are enterprise funds and are committed solely to support Water System functions The Pinellas County Water System utilizes four funds Revenue and Operating Renewal and Replacement (capital) Water Certificate and Impact Fees This forecast covers all four funds
Summary The forecast for the Water System Funds shows that the multi-year rate increases approved as part of the FY2012 budget process will provide sufficient revenues to maintain reserves and fund capital replacement needs through FY2015 The forecast revenues include an additional 2 per year annual increase in rates from FY2016 through FY2023 as recommended in the FY2012 Utilities Rates Study performed by Burton amp Associates the Countyrsquos independent utility rates consultant The Department of Environment and Infrastructure will again perform a comprehensive rate study in FY2014 to analyze the future rate structure In FY2013 FY2014 FY2017 and FY2018 recurring expenditures will exceed recurring revenues as fund balance is drawn down as major capital projects are completed From FY2015 through FY2023 excluding FY2017 and FY2018 the Water Funds are structurally balanced
Revenues The Water Funds generate revenues budgeted in FY2013 totaling $814 million The Water Funds have two primary funding sources retail water sales of $621 million and wholesale water sales of $151 million
Retail Water Sales The Water System charges $435 per month base rate an increase of $100 from FY2012 and $478 per 1000 gallons for retail water service In FY2014 and FY2015 additional base rate increases of $100 will go into effect The customer base for retail water sales are both commercial and residential properties in the Pinellas County Water service area The volume of water purchased has declined 9 from FY2008 to FY2012 The amount of water purchased can be affected by economic conditions housing and commercial vacancies and levels of conservation
Pinellas County Budget Forecast FY2014-2023 E-61
WATER FUNDS
Wholesale Water Sales The Water System charged $35648 per 1000 gallons for wholesale water service In FY2014 and FY2015 rates are scheduled to increase by 4 resulting in revised rates of $37074 and $38557 respectively Wholesale Water Sales provide water to the cities of Clearwater Tarpon Springs Safety Harbor Belleair and Pinellas Park The volume of water purchased has declined 30 from FY2008 to FY2012 which can be attributed to the same economic and conservation pressures seen in retail water sales The graph below shows the recent history of the volume of Water sales by the Water System
5380
50015103
47634619
45
50
55
60
2009 actual 2010 actual 2011 actual 2012 actual 2013 estimate
Millio
ns o
f G
allo
ns p
er D
ay (M
GD
)
Fiscal Year
Pinellas County Water Sales MGD
Source Pinellas County Department of Environment and Infrastructure
Expenditures The Water Funds support budgeted expenditures and reserves in FY2013 totaling $1214 million The primary expenditures in the fund are $454 million for the purchase of water $140 million for personal services $150 million for operating expenses (excluding the purchase of water) and $185 million for capital outlay Purchase of Water Under Section 3731963 of the Florida Statutes the Water System is required to purchase water from Tampa Bay Water the regional water supply authority In 1997 an Interlocal Agreement and the Master Water Supply Contract was signed under which Tampa Bay Water provides water to their members Pinellas County Hillsborough County Pasco County City of St Petersburg City of Tampa and City of New Port Richey Tampa Bay Water sets their rates according to the adopted budget and collects those rates from all members according to the Master Water Supply Contract Capital Outlay The Water System must maintain its equipment facilities pipelines and plants in good working order utilizing revenues generated within its proprietary funds Capital outlay reflects the construction and purchase needs as estimated by Pinellas County Department of Environment and Infrastructure Engineering Division in the CIP ten-year work plan and beyond
Pinellas County Budget Forecast FY2014-2023 E-62
WATER FUNDS
Personal Services The Water System employs 202 full-time employees in FY2013 The Personal Services expenses of $127 million are for the salaries and benefits of those positions needed to operate the Water System Water System benefits include the $13 million cost of Other Post Employment Benefits (OPEB) as proprietary funds are required by GASB 45 to record the entire annual required contribution (ARC) accrual Operating Expenses The Water System incurs annual recurring costs for repair and maintenance supplies fuel and communications The Water System also pays for electrical power to run its facilities and for chemicals to treat the water Reserves The reserve level in the Water System is 23 which is above the 5-15 reserve level budget policy adopted by the Board The Water System maintains these reserves for cash flow and future capital needs
Ten-Year Forecast Key Assumptions Due to expected slow growth in the economy the forecast assumes a 0 annual increase from FY2013 to FY2016 a 009 annual increase in FY2017 a 018 annual increase in FY2018 and a 027 annual increase from FY2019 to FY2023 in retail water demand and no growth in wholesale water demand for the forecast period The wholesale water demand reflects a decline in revenues from FY2015 through FY2016 due to the projected loss of sales of three cities (Clearwater Tarpon Springs and Oldsmar) as they develop their own water sources For expenditures Personal Services and Operating Expenses reflect the forecast trends described in the Key Assumptions section of this document Electricity and chemicals costs are projected to increase by 0 and 7 respectively for 2014 both are projected to increase 5 and 7 respectively per year through the remaining forecast period The capital outlay forecast reflects the construction and purchase needs as estimated by the Pinellas County Department of Environment and Infrastructure Engineering Division An increase to $203 million in FY2017 is anticipated to support capital outlay water line projects with Florida Department of Transportation (FDOT) as well as other major capital outlay improvement projects To balance revenues with projected expenditures future rate increases will be necessary for both retail and wholesale rates Burton amp Associates DEI Finance and Economics Independent Consultants computed that rate increases for FY2016 through FY2023 are needed at 2 per year based on a blend of growth and consumption assumptions inflationary cost increases and capital needs at the projected water demand levels
Pinellas County Budget Forecast FY2014-2023 E-63
WATER FUNDS
Source Pinellas County Department of Environment and Infrastructure
Key Results The forecast for the Water System Funds shows that the approved rate increases and rate increases starting in FY2016 as recommended in the FY2012 Utilities Rate Study by Burton amp Associates will provide sufficient revenues to maintain reserves and fund capital replacement needs In FY2013 FY2014 FY2017 and FY2018 recurring expenditures will exceed recurring revenues as fund balance is drawn down as major capital projects are completed From FY2015 through FY2023 excluding FY2017 and FY2018 the Water Funds are structurally balanced
Potential Risks There are some impacts that can alter the ten-year forecast of the Water System Any future economic decline would reduce water demand which would impact revenue more than expenses Operating costs (including the purchase of water from Tampa Bay Water) could increase more than projected The Water System could experience a need for more maintenance than anticipated causing increased operating and capital costs Regulatory pressures could cause an increase of expenditures to maintain the system
Balancing Strategies With the multi-year rate increases approved during the FY2012 budget process and future rate increases as recommended by Burton amp Associates Water System revenues will be sufficient to cover projected expenditures and maintain sufficient reserves over the forecast period
Pinellas County Budget Forecast FY2014-2023 E-64
SEWER FUNDS
Description The Pinellas County Sewer System is responsible for quality cost effective sewer service to the citizens and business owners within the County sewer service areas The Sewer System must adhere to State and Federal laws rules and regulations while operating and maintaining this system The System provides an environmentally safe and sanitary means of collecting and transmitting discharged domestic waste from residential commercial and industrial users The Sewer System provides for the treatment and disposal of objectionable materials and organisms from the waste in order to protect public health property and environment The Sewer Funds are enterprise funds and are committed solely to support Sewer System functions The Pinellas County Sewer System utilizes four funds Revenue and Operating Renewal and Replacement (capital) Interest and Sinking (Debt Service) and Sewer Construction The Sewer System is required to maintain a debt service coverage ratio of 125x per the bond covenants however the fund is maintained at a debt service coverage ratio of 150x to sustain the current bond ratings
Summary The Pinellas County Sewer Funds are proprietary funds dedicated solely to supporting the Pinellas County Sewer System (Sewer System) The forecast for the Sewer System Funds shows that the multi-year rate increases approved in FY2012 will provide sufficient revenues to maintain reserves sustain the recommended debt service coverage ratio of 150x and fund capital replacement needs through FY2015 The forecast revenues include an additional 275 per year annual increase in rates from FY2016 through FY2023 as recommended in the FY2012 Utilities Rates Study performed by Burton amp Associates the Countyrsquos independent utility rates consultant The Department of Environment and Infrastructure will perform a comprehensive rate study in FY2014 to analyze the future rate structure In FY2013 recurring expenditures will exceed recurring revenues as fund balance is drawn down as major capital projects are completed From FY2014 through FY2023 the Sewer Funds are structurally balanced as recurring expenditures are in line with recurring revenues
Revenues The Sewer Funds generate revenues budgeted in FY2013 totaling $600 million The Sewer Funds have four primary funding sources retail sewer charges of $484 million wholesale sewer charges of $67 million retail reclaimed water charges of $39 million and wholesale reclaimed water charges of $03 million
Retail Sewer Charges The Sewer System charges $1180 per month base rate and $431 per 1000 gallons for retail sewer service in FY2013 The FY2014 increase of 6 for retail customers (adopted in 2012) will result in a base rate of $1251 per month and $457 per 1000 gallons The customer base
Pinellas County Budget Forecast FY2014-2023 E-65
SEWER FUNDS
for retail sewer service is both commercial and residential properties in the Pinellas County Sewer service area Total billed retail demand has declined 3 from FY2008 to FY2012 The amount of sewage processed is affected by economic conditions housing and commercial vacancies and levels of water conservation Prior to this approved rate increase there was a 6 increase in 2012 a 15 increase in FY2011 a 35 increase in FY2010 and no rate increases from FY2004 thru FY2009
Wholesale Sewer Sales The Sewer System charges $32264 per 1000 gallons for wholesale sewer service The adopted FY2013 increase of 9 for wholesale customers (adopted in 2012) will equate to $35168 per 1000 gallons Wholesale customers are four cities within Pinellas County that purchase sewer service from the Sewer System in bulk after collecting it from their retail sewer customers The cities of North Redington Beach Redington Shores Indian Rocks Beach and Pinellas Park are the wholesale customers of the Sewer System Similar to retail sewer sales the total billed wholesale demand has declined 12 from FY2008 to FY2012 The amount of waste processed is affected by economic conditions housing and commercial vacancies and levels of water conservation The graph below shows the recent history of the volume of waste billed by the Sewer System
Source Pinellas County Department of Environment and Infrastructure
Retail Reclaimed Water Charges The Reclaimed Water System charges $1700 per month rate for unfunded un-metered service (systems without existing distribution lines) and a $700 per month availability charge and $080 per 1000 gallons for retail reclaimed water service for metered service unfunded systems (systems without existing distribution lines) and $1600 per month base rate for funded un-metered service (systems with pre-existing distribution lines) and $080 per 1000 gallons for metered funded systems (systems with pre-existing distribution lines) Rates for unfunded systems are higher as the Sewer System must recover the cost of constructing the reclaimed water distribution lines Only those accounts that have metered service pay the volumetric rate with most paying only the flat monthly rate The FY2013 budget includes approved rate increases of $100 per year for un-metered service and a user fee per 1000 gallon increase of $08 per year for metered service
27002680
2591
24892551
240
245
250
255
260
265
270
275
280
285
2008 2009 2010 2011 2012
Mil
lio
ns o
f G
all
on
s p
er
Day (
MG
D)
Fiscal Years
Pinellas County Sewer MGD Billed FY2008-FY2012
Sewer MGD
Pinellas County Budget Forecast FY2014-2023 E-66
SEWER FUNDS
Wholesale Reclaimed Water Charges
The Reclaimed Water System charged volumetric rates by contract for wholesale reclaimed water service No increase for wholesale rates was proposed for FY2013 Wholesale customers are four cities within Pinellas County that purchase reclaimed water service from the Reclaimed Water System in bulk and distribute it to their retail customers The cities of St Petersburg Beach South Pasadena Belleair and Pinellas Park are the wholesale customers of the Reclaimed Water System
Expenditures The Sewer Funds support budgeted expenditures and reserves in FY2013 totaling $1076 million The primary expenditures in the funds are $163 million for personal services costs $240 million for operating expenses $148 million for debt service $245 million for capital outlay and $289 million in reserves Personal Services The Sewer System employs 222 full-time employees in FY2013 The Personal Services expenses of $149 million are for the salaries and benefits of those positions needed to operate the Sewer System Sewer System benefits include the $14 million cost of Other Post Employment Benefits (OPEB) as proprietary funds are required by GASB 45 to record the entire annual required contribution (ARC) accrual This cost is included in the calculation of the debt service coverage ratio Debt Service The Sewer System had $1843 million of bond principal outstanding as of September 30 2012 The bonds were issued to fund various sewer system capital projects and require annual principal and interest payments to the holders of those bonds From FY2014 through FY2028 the debt service requirement is between $145 million and $148 million From FY2029 through FY2032 debt service payments fall to between $50 million and $55 million The bonds mature between 2017 and 2032 Operating Expenses The Sewer System incurs annual recurring costs for repair and maintenance supplies fuel and communications In addition utilities to run the facilities and chemicals to treat the waste are major components of the Sewer Systemrsquos operating expenses Capital Outlay The Sewer System must maintain its equipment facilities pipelines and plants in good working order using revenues generated within their proprietary funds Capital outlay reflects the construction and purchase needs as estimated by the Department of Environment and Infrastructure Engineering Division in the CIP ten-year work plan and beyond Reserves
Pinellas County Budget Forecast FY2014-2023 E-67
SEWER FUNDS
The reserve level in the Sewer System is 27 which is higher than the 5-15 reserve level budget policy adopted by the Board The Sewer System maintains $92 million of reserves for cash flow and $197 million to fund future capital needs In addition the 2008 bond issue requires a debt service reserve of $197 million to maintain the recommended debt service ratio of 150x
Source Pinellas County Department of Environment and Infrastructure
Ten-Year Forecast Key Assumptions Due to expected slow growth in the economy the forecast assumes 0 increase from FY2013 to FY2016 a 007 annual increase in FY2017 a 014 in FY2018 and a 021 from FY2019 to FY2023 in retail and wholesale sewer demand For expenditures Personal Services and Operating Expenses reflect the forecast trends described in the Key Assumptions section of this document Electricity and chemical costs are projected to increase by 0 and 7 respectively for 2014 both are projected to increase 5 and 7 respectively per year through the remaining forecast period The capital outlay forecast reflects the construction and purchase needs as estimated by the Department of Environment and Infrastructure Engineering Division To balance revenues with projected expenditures multi-year rate increases were approved during the FY2012 budget process for both retail and wholesale rates Burton and Associates DEI Finance and Economics Independent Consultants have computed that the following sewer rate increases were necessary to meet the projected expenses and reserve needs at the projected sewer demand levels 6 each year FY2012ndashFY2015 for retail sewer and 9 each year FY2012ndashFY2015 for wholesale sewer Reclaimed waterretail customers $100 to the monthly charge each year FY2012ndashFY2015 for unmetered service and an increase of $008 to the user fee per 1000 gallons each year FY2012 to FY2015 These multi-year rates were approved by the Board of County Commissioners in September 2011 Rate increases for FY2016 through FY2023 as recommended in the FY2012 Utilities Rate Study by Burton amp Associates are assumed at 275 based on a blend of growth and consumption assumptions inflationary cost increases capital needs and minimum amount of reserves necessary to meet required debt service ratios
Pinellas County Budget Forecast FY2014-2023 E-68
SEWER FUNDS
Key Results The forecast for the Sewer System Funds shows that the multi-year rate increases approved in FY2012 and future rate increases starting in FY2016 as recommended by Burton amp Associates will provide sufficient revenues to maintain reserves sustain the recommended debt service coverage ratio of 150x and fund capital replacement needs over the forecast period In FY2013 recurring expenditures will exceed recurring revenues as fund balance is drawn down as major capital projects are completed From FY2014 through FY2023 the Sewer Funds are structurally balanced as recurring expenditures are in line with recurring revenues
Potential Risks There are some impacts that can alter the ten-year forecast of the Sewer System Any future economic decline would reduce water demand which reduces sewer revenue that is based on volume Operating costs could increase more than projected The Sewer System could experience a need for more maintenance than anticipated causing increased capital costs
Balancing Strategies With the rate increases approved during the FY2012 budget process and anticipated future rate increases Sewer System revenues will be sufficient to cover projected expenditures maintain sufficient reserves and sustain the recommended debt service coverage ratio of 150x
Pinellas County Budget Forecast FY2014-2023 E-69
SEWER FUNDS
Pinellas County Budget Forecast FY2014-2023 E-70
SOLID WASTE FUNDS
Description Pinellas County Solid Waste provides safe and environmentally sound integrated solid waste services to all citizens of Pinellas County These services emphasize public awareness and communication to enable the citizens to make educated choices concerning proper management of their solid waste and to help maintain the quality of life in Pinellas County In support of that mission Solid Waste operates the landfill the waste-to-energy plant hazardous waste collection recycling programs and litter-reduction program The Solid Waste Funds are enterprise funds and are committed solely to support Solid Waste functions Solid Waste utilizes two funds Revenue and Operating and Renewal and Replacement (capital)
Summary The Pinellas County Solid Waste Funds are enterprise funds dedicated solely to supporting the Solid Waste functions The forecast for the Solid Waste Funds shows that the fund is balanced through the forecast period Solid Waste tipping fees and electricity sales revenues have declined with the slower economy but will remain sufficient to fund operations and maintain sufficient reserves during the forecast period Reserves are being accumulated for future capital replacement needs consistent with their 25 year capital plan
Revenues The Solid Waste Funds generate revenues budgeted in FY2013 totaling $850 million The Solid Waste Funds consist almost exclusively of two primary funding sources tipping fees of $337 million and electricity sales of $486 million
Tipping Fees Solid Waste charges $3750 per ton for all waste brought to the Solid Waste Facility That rate has not changed since 1988 The volume of waste brought to the Solid Waste Facility is expected to increase slightly in FY2014 The amount of waste brought to the facility is affected by economic conditions and levels of recycling
Electricity Sales Solid Waste receives revenue from the electrical capacity contract with Progress Energy for power produced by the waste-to-energy plant The revenue from this contract is defined by rates specified in the contract which expires in 2024 Solid Waste also receives revenue for electricity sales in excess of the capacity contract with Progress Energy This revenue stream is affected by the amount of waste received by the plant and the operating capacity of the plant Due to slow growth in the economy and no planned increases in plant capacity for the next ten years this revenue is forecast to increase by 05 per year from FY2014 through FY2023
Pinellas County Budget Forecast FY2014-2023 E-71
SOLID WASTE FUNDS
The graph below shows the tons of waste delivered to the Solid Waste Facility
Source Pinellas Co Solid Waste Mgmt Tonnage Activity Reports
Interfund Loan Repayment Debt service revenues over the forecast period are associated with an interfund loan from the Solid Waste Renewal and Replacement Fund to the Capital Improvement Fund On September 21 2010 the Board authorized the first interfund loan up to $85 million to assist with cash flow in the Capital Projects Fund through FY2019 The original 2010 to 2020 Penny Program was anticipated to be financed with a $150 million bond issue in order to accelerate several key projects The benefits of an interfund loan versus bonding include lower borrowing costs no reserve requirements interest accrues to a county entity and more flexibility in the implementation and terms of the loan Interest will be collected in FY2011 through FY2020 and loan repayment in FY2015 through FY2020 The interfund loan is available for use through FY2015 An additional loan to the Capital Projects Fund will be necessary to cover the remaining $75 million of costs to fully fund the Centralized Chiller Facility project This project funds the construction of a new centralized chiller facility for the downtown Clearwater campus The County will purchase chilled water at a set rate based on the amount of investment towards the cost of the facility Repayment of the loan will take place from FY2013 to FY2017 at $15 million annually The loan will be repaid from the General Fund but because it is a capital project the expenditures and repayment are taking place from the Capital Projects Fund Based on the forecast it is anticipated that only $70 million of the authorized $85 million will ultimately need to be transferred to the Capital Projects Fund
Expenditures The Solid Waste Funds support budgeted expenditures and reserves in FY2013 totaling $1996 million The primary expenditures in the fund are $313 million for the Waste-to-Energy service contract $113 million for the landfill service contract and $401 million for capital investment Budgeted reserves are $872 million
Pinellas County Budget Forecast FY2014-2023 E-72
SOLID WASTE FUNDS
Waste-to-Energy Service Contract Solid Waste is under contract with Green Conversion Systems LLC (GCS) to operate the Waste-to-Energy (WTE) plant This contract expires in 2024 and has 10 one-year extensions The stock of the parent company for the original contractor Veolia ES Pinellas Inc was purchased by GCS IN 2012 Landfill Service Contract Solid Waste is under contract with Advanced Disposal Inc to operate the landfill This contract expires in 2015 and has a 3-year extension The contract was assigned by the original contractor Veolia when the stock of the parent company was sold Capital Outlay Solid Waste maintains its equipment facilities and plants in good working order utilizing revenues generated within their enterprise fund Project decisions for equipmenttechnology improvements and construction projects are based on condition assessments permit or regulatory requirements and recommendations from consultants The new Industrial Water Treatment Plant (IWTP) at Solid Waste was the result of an analysis of the entire water balance at Bridgeway Acres A comprehensive water management study was completed in 2006 to assess the interrelated issues associated with our management of water including water use at the Waste-to-Energy facility particularly in the cooling towers permit issues associated with maintaining the inward gradient and water quality in the main water retention area The new IWTP was one of several projects that has been completed or is under construction The new facility will enable treatment to the main water retention area to maximize its use at the WTE facility including meeting contractual guarantees with respect to the water quality delivered It reduces reliance on reclaimed water increases capacity to the main water retention area minimizes any discharges required and assures a water supply in the dry spring months Personal Services The Solid Waste System employs 90 full-time employees in FY2013 The Personal Services expenses are for the salaries and benefits of those positions needed to operate the Solid Waste System Solid Waste System benefits include the cost of Other Post Employment Benefits (OPEB) as proprietary funds are required by GASB 45 to record the entire annual required contribution (ARC) accrual Interfund Loan to Capital Projects Fund The forecast includes transfers of $100 million in FY2013 and $450 million in FY2014 from the Solid Waste Renewal and Replacement Fund as part of the interfund loans to the Capital Projects Fund The estimate for FY2013 also includes the transfer of $75 million for the Centralized Chiller Facility project which will be repaid from the General Fund Reserves The budgeted FY2013 reserve level in the Solid Waste System is 44 which is above the 15 reserve level budget policy adopted by the Board Solid Waste maintains the following reserves
Pinellas County Budget Forecast FY2014-2023 E-73
SOLID WASTE FUNDS
$75 million required reserves per the contract with GCS $11 million for insurance deductibles $139 million for three months of operating expenses and the remainder of $548 million is for future needs consistent with their 25 year capital plan The estimated FY2013 reserves are higher than budgeted due to the timing of the loan from Solid Waste to the Capital Projects Fund $45 million of the loan was delayed from FY2012 to FY2014
Ten-Year Forecast Key Assumptions The revenue forecast assumes only a 05 increase in tipping fees and electricity sales throughout the forecast horizon due to the anticipated slow growth in the economy increased recycling and no planned capacity increases to the WTE plant The revenue forecast does not include any increases in tipping fee rates The economy does affect the tons of waste brought to the solid waste facility because less consumption means less waste For expenditures Personal Services and Operating Expense reflect the forecast trends described in the Key Assumptions section of this document The capital outlay forecast reflects the construction and purchase needs based on condition assessments permit or regulatory requirements and recommendations from consultants There are large capital needs forecasted from FY2013 through FY2018 in anticipation of tighter regulatory requirements and additional required improvements
Pinellas County Budget Forecast FY2014-2023 E-74
SOLID WASTE FUNDS
Key Results The forecast for the Solid Waste Funds shows that the forecasted revenues are sufficient to provide for the forecasted expenditures over the next ten years while still maintaining sufficient reserves (The forecast chart does not include the loans to the Capital Projects Fund or the future repayments from that fund) Solid waste revenues exceed expenditures from FY2015 through FY2023 In FY2014 expenditures reflect non-recurring costs associated with additional capital outlay improvements The recurring revenues are sufficient to support recurring operations without any increases in tipping fees Reserves increase during the forecast period and reach the level of 84 of revenues in FY2023 The reserves are planned to fund considerable future capital replacement needs in the Solid Waste 25-year plan
Potential Risks There are some impacts that can alter the ten-year forecast of the Solid Waste Funds Any continued economic decline would reduce incoming waste which would reduce revenue from both the tipping fees and electricity sales The WTE plant could experience more maintenance downtime than anticipated reducing electricity sales and causing increased capital costs
Balancing Strategies Excluding FY2014 with anticipated capital outlay improvements the forecast does not show any structural gaps in revenues and expenditures as the fund is balanced through the forecast period
Pinellas County Budget Forecast FY2014-2023 E-75
SOLID WASTE FUNDS
Pinellas County Budget Forecast FY2014-2023 E-76
PRO-FORMAS
Pinellas County Budget Forecast FY2014-2023
The Pro-Formas portion of the Budget Forecast FY2014-2023 includes the detailed assumptions behind the ten-year fund pro-formas as well as full-size forecast charts for ten of the Countyrsquos major funds
General Fund
Tourist Development Fund
Transportation Trust Fund
Capital Projects Fund
Emergency Medical Services Fund
Fire Districts Fund
Airport Fund
Utilities Water Funds
Utilities Sewer Funds
Utilities Solid Waste Funds
Sections for Each Fund Each fund has the following information
Forecast Chart Provides a forecast of revenues (net of fund balance) and expenditures (net of reserves) for each fund over a ten-year period
Assumptions Provides the key assumptions for each year in the forecast horizon that feed the pro-formas for each fund
Pro-Formas Provides the detailed revenue and expenditure projections over ten years for each fund based on key assumptions
Additional Information The information in this section provides the detail behind the forecast summaries prepared in the Fund Forecasts portion of this document The fund forecasts are intended to be high level user-friendly summaries of the results of the ten-year forecast for each fund The information in this section is much more granular and was used by the Office of Management amp Budget as well as other contributing departments to produce the forecasts
F-1
PRO-FORMAS
Pinellas County Budget Forecast FY2014-2023
F-2
4000
4500
5000
5500
6000
6500
2013
2014
2015
2016
2017
2018
2019
2020
2021
2022
2023
Dollars (millions)
Gen
era
l F
un
d F
ore
ca
st
FY
2014 -
FY
2023
U
sin
g S
erv
ice L
evel
Sta
biliz
ati
on
Acc
ou
nt
in F
Y201
3 -
FY
2014
Revenue
Expenditure
s
F-3
GE
NE
RA
L F
UN
D F
OR
EC
AS
TF
un
d 0
001
Fo
recast
Assu
mp
tio
ns
20
14
20
15
20
16
20
17
20
18
20
19
20
20
20
21
20
22
20
23
RE
VE
NU
ES
Pro
pe
rty T
axe
s -
Co
un
tyw
ide
2
5
25
3
0
30
3
0
30
3
0
30
3
0
30
Pro
pe
rty T
axe
s -
MS
TU
2
0
20
2
5
25
2
5
25
2
5
25
2
5
25
Half C
en
t S
ale
s T
ax
40
3
5
35
3
5
35
3
5
35
3
5
35
3
5
Reve
nu
e S
ha
rin
g2
5
25
2
5
25
2
5
25
2
5
25
2
5
25
Com
mu
nic
atio
ns S
vc T
ax
-05
-0
5
-05
-0
5
-05
-0
5
-05
-0
5
-05
-0
5
Cha
rge
s f
or
Se
rvic
es
15
1
8
17
2
0
19
2
1
20
2
0
20
2
0
Tra
nsfe
rs f
rom
Oth
er
Fu
nd
s0
0
00
0
0
00
0
0
00
0
0
00
0
0
00
Oth
er
reve
nu
es
20
2
0
20
2
0
20
2
0
20
2
0
20
2
0
EX
PE
ND
ITU
RE
S
Pe
rso
na
l S
erv
ice
s4
1
40
4
0
40
4
0
40
4
0
40
4
0
40
Op
era
tin
g E
xp
en
se
s-0
5
26
2
6
29
0
3
29
3
0
31
3
0
31
Cap
ita
l O
utla
y1
5
18
1
7
20
1
9
21
2
0
20
2
0
20
Gra
nts
amp A
ids
15
1
8
17
2
0
19
2
1
20
2
0
20
2
0
Pro
jec
ted
Ec
on
om
ic C
on
dit
ion
s
In
dic
ato
rs
Con
su
me
r P
rice
In
de
x
c
ha
ng
e1
5
18
1
7
20
1
9
21
2
0
20
2
0
20
FL
Pe
r C
ap
ita
Pe
rso
na
l In
co
me
Gro
wth
20
2
2
22
1
8
14
1
5
17
1
6
16
1
6
Estim
ate
d N
ew
Con
str
uctio
n
of
tax b
ase
05
0
5
10
1
0
10
1
0
10
1
0
10
1
0
P
rop
ert
y T
ax
pe
ren
tag
es
are
ch
an
ge
s i
n T
ax
ab
le V
alu
e
F-4
GE
NE
RA
L F
UN
D F
OR
EC
AS
TF
un
d 0
001
OR
IGIN
AL
(in
$ m
illi
on
s)
Ac
tua
lB
UD
GE
TE
sti
ma
ted
Es
tim
ate
dE
sti
ma
ted
Es
tim
ate
dE
sti
ma
ted
Es
tim
ate
dE
sti
ma
ted
Es
tim
ate
dE
sti
ma
ted
Es
tim
ate
dE
sti
ma
ted
20
12
20
13
20
13
20
14
20
15
20
16
20
17
20
18
20
19
20
20
20
21
20
22
20
23
BE
GIN
NIN
G F
UN
D B
AL
AN
CE
12
68
1
15
3
13
05
1
08
9
95
3
7
61
53
8
2
72
(10
)
(3
48
)
(73
8)
(1
17
0)
(16
73
)
RE
VE
NU
ES
Pro
pe
rty T
axe
s -
Cou
nty
wid
e2
58
4
25
90
2
59
0
26
55
2
72
1
28
03
2
88
7
29
74
3
06
3
31
55
3
25
0
33
48
3
44
8
Pro
pe
rty T
axe
s -
MS
TU
29
0
2
76
27
6
2
82
28
8
2
95
30
2
3
10
31
8
3
26
33
4
3
42
35
1
Half C
en
t S
ale
s T
ax
37
0
3
82
38
2
3
97
41
1
4
25
44
0
4
55
47
1
4
87
50
4
5
22
54
0
Reve
nu
e S
ha
rin
g1
43
14
3
1
43
14
7
1
51
15
5
1
59
16
3
1
67
17
1
1
75
17
9
1
83
MA
ND
AT
E M
ed
ica
id (
Rev S
hrg
cu
t)-
(5
1)
no
w s
ho
wn
as O
pe
rati
ng
Exp
en
dit
ure
in
ste
ad
of
rev
en
ue
re
du
cti
on
-
-
-
-
-
Com
mu
nic
atio
ns S
vc T
ax
10
8
1
07
10
7
1
06
10
5
1
04
10
3
1
02
10
1
1
00
10
0
1
00
10
0
Bu
ild
ing
Pe
rmits
-
-
-
-
-
-
-
-
-
-
-
-
-
Gra
nts
(fe
ds
tate
lo
ca
l)1
35
59
5
9
60
6
1
62
6
3
64
6
5
66
6
7
68
6
9
Inte
rest
08
1
0
10
0
8
10
1
5
16
0
8
-
-
-
-
-
Cha
rge
s f
or
Se
rvic
es
68
5
6
35
63
5
6
55
66
5
6
74
68
7
7
03
72
0
7
37
75
5
7
69
78
9
Oth
er
reve
nu
es
13
4
1
21
12
1
1
23
12
5
1
28
13
1
1
34
13
7
1
40
14
3
1
46
14
9
Ad
just
Pro
pe
rty T
axe
s
to 9
6
-
-
30
3
1
32
3
3
34
3
5
36
3
7
38
3
9
40
Ad
just
Ma
jor
Re
ve
nu
e t
o 9
8
-
-
-
21
2
1
22
2
2
23
2
3
24
2
5
25
2
6
Ad
just
Oth
er
Re
ve
nu
e t
o 9
7
-
-
-
18
2
1
25
2
8
31
3
6
40
4
1
45
4
8
TO
TA
L R
EV
EN
UE
S4
45
7
42
72
4
35
3
45
03
4
61
1
47
41
4
87
2
50
02
5
13
7
52
83
5
43
2
55
83
5
74
3
v
s p
rio
r ye
ar
20
-2
3
2
3
3
3
3
3
3
3
3
TO
TA
L R
ES
OU
RC
ES
57
25
5
42
5
56
58
5
59
2
55
64
5
50
2
54
10
5
27
4
51
27
4
93
5
46
94
4
41
3
40
70
EX
PE
ND
ITU
RE
S
Pe
rso
na
l S
erv
ice
s6
37
65
4
6
54
68
1
7
08
73
6
7
65
79
6
8
28
86
1
8
95
93
1
9
68
Op
era
tin
g E
xp
en
se
s9
59
10
23
1
07
4
10
76
1
10
5
11
34
1
16
7
11
75
1
21
0
12
47
1
28
6
13
24
1
36
5
Cap
ita
l O
utla
y1
5
09
0
9
09
0
9
09
0
9
09
0
9
09
0
9
09
0
9
Gra
nts
amp A
ids
15
9
1
91
19
1
1
93
19
8
2
02
20
7
2
12
21
7
2
22
22
7
2
32
23
7
Tra
nsfe
rs2
58
4
25
76
2
57
6
26
84
2
78
4
28
84
2
99
2
31
08
3
22
8
33
52
3
48
2
36
27
3
77
7
Deb
t S
erv
ice
-
03
-
-
-
-
-
-
-
-
-
-
-
Se
rvic
e L
eve
l S
tab
iliz
ati
on
Ac
ct
-
94
-
-
-
-
-
-
-
-
-
-
-
No
n-r
ec
urr
ing
ex
pe
nd
itu
res
16
-
2
6
-
-
-
-
-
-
-
-
-
-
Exp
en
ditu
re L
ap
se
1
-
(1
9)
(19
)
(2
0)
(20
)
(2
1)
(21
)
(2
2)
(23
)
(2
3)
(24
)
(2
5)
Po
ten
tia
l Is
su
es
No
n-r
ec
urr
ing
Tra
ns
fers
to
CIP
06
1
5
15
1
5
15
1
5
15
-
-
-
-
-
-
BT
S n
on
-re
cu
rrin
g p
roje
ct
co
sts
37
4
3
43
-
-
-
-
-
-
-
-
-
-
Ho
me
les
s In
itia
tive
s (
Gamp
A)
07
-
-
-
-
-
-
-
-
-
-
-
-
CIP
Op
era
tin
g Im
pa
cts
(c
um
ula
tive
)-
-
-
-
0
4
04
0
4
05
0
5
05
(1
2)
(13
)
(1
3)
TO
TA
L E
XP
EN
DIT
UR
ES
44
20
4
60
8
45
69
4
63
9
48
03
4
96
4
51
38
5
28
4
54
75
5
67
3
58
64
6
08
6
63
18
v
s p
rio
r ye
ar
31
7
3
2
4
3
4
3
4
4
3
4
4
EN
DIN
G F
UN
D B
AL
AN
CE
13
05
8
17
10
89
9
53
76
1
5
38
27
2
(1
0)
(34
8)
(7
38
)
(11
70
)
(1
67
3)
(22
48
)
AS
SU
MIN
G N
O A
CT
ION
TA
KE
N T
O
RE
SO
LV
E S
HO
RT
FA
LL
S
En
din
g b
ala
nce
as
of
Re
so
urc
es
23
1
6
19
1
7
14
1
0
5
0
-7
-15
-2
5
-38
-5
5
TO
TA
L R
EQ
UIR
EM
EN
TS
57
25
5
42
5
56
58
5
59
2
55
64
5
50
2
54
10
5
27
4
51
27
4
93
5
46
94
4
41
3
40
70
RE
VE
NU
E m
inu
s E
XP
EN
DIT
UR
ES
37
(3
36
)
(21
6)
(1
36
)
(19
2)
(2
23
)
(26
6)
(2
82
)
(33
8)
(3
90
)
(43
2)
(5
03
)
(57
5)
(NO
T c
um
ula
tive
)
no
te
no
n-r
ec
urr
ing
ex
pe
nd
itu
res
66
1
52
84
1
5
15
1
5
15
-
-
-
-
-
-
net
recu
rrin
g r
ev-
exp
103
(184
)
(132
)
(1
21
)
(177
)
(208
)
(251
)
(282
)
(338
)
(390
)
(4
32
)
(503
)
(575
)
E
xp
en
ditu
re la
pse
is c
alc
ula
ted
on
Pe
rso
na
l S
erv
ice
s
Op
era
tin
g E
xp
en
se
s
Cap
ita
l O
utla
y
an
d G
ran
ts amp
Aid
s o
nly
FY
12
ad
va
lore
m a
nd
oth
er
reve
nu
e a
dju
ste
d f
or
de
linqu
en
t ta
xe
s a
nd
ta
x r
ed
em
ptio
ns
FO
RE
CA
ST
F-5
F-6
160
180
200
220
240
260
280
300
320
340
360
380
400
420
440
2014
2015
2016
2017
2018
2019
2020
2021
2022
2023
Dollars (mllions)
To
uri
st
De
ve
lop
me
nt
Co
un
cil
Fu
nd
Fo
rec
as
t F
Y2
01
4 -
FY
20
23
Ex
clu
din
g U
nd
es
ign
ate
d E
xp
en
dit
ure
s
RE
VE
NU
ES
E
XP
EN
DIT
UR
ES
F-7
TO
UR
IST
DE
VE
LO
PM
EN
T C
OU
NC
IL F
UN
D F
OR
EC
AS
TF
un
d 1
04
0
Fo
rec
as
t A
ss
um
pti
on
s2014
2015
2016
2017
2018
2019
2020
2021
2022
2023
RE
VE
NU
ES
Tourist D
evelo
pm
ent T
axes
35
30
30
30
30
30
30
30
30
30
EX
PE
ND
ITU
RE
S
Pers
onal S
erv
ices
41
40
40
40
40
40
40
40
40
40
Opera
ting E
xpenses
15
18
17
20
19
21
20
20
20
20
Advert
isin
g E
xpense
15
18
17
20
19
21
20
20
20
20
Capital O
utlay
15
18
17
20
19
21
20
20
20
20
Pro
jecte
d E
co
no
mic
Co
nd
itio
ns In
dic
ato
rs
Consum
er
Price Index
change
15
18
17
20
19
21
20
20
20
20
FL P
er
Capita P
ers
onal I
ncom
e G
row
th20
22
22
18
14
15
17
16
16
16
F-8
TO
UR
IST
DE
VE
LO
PM
EN
T C
OU
NC
IL F
UN
D F
OR
EC
AS
TF
un
d 1
04
0
(in
$ t
ho
usan
ds)
Actu
al
Bu
dg
et
Esti
mate
dE
sti
mate
dE
sti
mate
dE
sti
mate
dE
sti
mate
dE
sti
mate
dE
sti
mate
dE
sti
mate
dE
sti
mate
dE
sti
mate
dE
sti
mate
d
2012
2013
2013
2014
2015
2016
2017
2018
2019
2020
2021
2022
2023
BE
GIN
NIN
G F
UN
D B
AL
AN
CE
64
290
72
818
80
012
57
874
56
165
56
680
59
561
61
182
62
242
64
540
66
428
69
046
70
450
RE
VE
NU
ES T
ourist D
evelo
pm
ent T
axes
95
287
461
270
972
284
011
293
952
302
770
311
854
321
209
330
845
340
771
350
994
361
524
372
369
383
541
Inte
rest
290
277
400
405
562
1134
1787
1835
1867
1936
1993
2071
2114
Cty
Off F
ees (
TC
)-
-
-
-
-
-
-
-
-
-
-
-
-
Oth
er
revenues (
Int -
TC
)44
66
66
67
68
70
71
72
74
75
77
78
80
Adju
st T
ax R
evenues to 1
00
-
-
14
948
15
471
15
935
16
413
16
906
17
413
17
935
18
473
19
028
19
598
20
186
Adju
st oth
er
Revenues to 1
00
-
-
25
25
25
26
27
27
28
28
29
29
30
RE
VE
NU
ES
287
795
271
315
299
450
309
920
319
361
329
496
339
999
350
193
360
675
371
507
382
650
394
147
405
950
v
s p
rior
year
116
-5
7
40
35
30
32
32
30
30
30
30
30
30
TO
TA
L R
ES
OU
RC
ES
352
085
344
133
379
462
367
794
375
526
386
176
399
560
411
375
422
917
436
047
449
078
463
192
476
400
EX
PE
ND
ITU
RE
S
Pers
onal S
erv
ices
27
276
32
116
32
116
33
433
34
770
36
161
37
607
39
112
40
676
42
303
43
995
45
755
47
585
Opera
ting E
xpenses
62
229
66
646
66
646
67
646
68
863
70
034
71
435
72
792
74
321
75
807
77
323
78
870
80
447
Advert
isin
g E
xpense
75
623
86
514
86
514
87
812
89
392
90
912
92
730
94
492
96
476
98
406
100
374
102
382
104
429
A
ddtl A
dvert
Exp -
one-t
ime
RN
C6000
-
-
-
-
-
-
-
-
-
-
-
-
Un
desig
nate
d-
-
33
000
20
000
15
000
82
000
88
000
93
000
96
000
106
000
110
000
122
000
126
000
Capital O
utlay
-
43
43
44
44
45
46
47
48
49
50
51
52
Capital O
utlay -
Dali
Museum
-
-
-
-
5000
5000
5000
5000
5000
-
-
-
-
Tra
nsfe
r -
Tax C
olle
cto
r4485
4942
4942
5090
5243
5400
5562
5729
5901
6078
6260
6448
6642
Tra
nsfe
r -
Beach R
enourishm
ent
26
513
32
424
32
424
29
395
30
277
31
185
32
121
33
085
34
077
35
099
36
152
37
237
38
354
Debt S
erv
ice
69
947
65
903
65
903
68
210
70
256
5877
5877
5877
5877
5877
5877
-
-
EX
PE
ND
ITU
RE
S272
073
288
588
321
588
311
629
318
846
326
615
338
378
349
133
358
376
369
619
380
032
392
742
403
509
v
s p
rior
year
17
6
18
-3
2
2
4
3
3
3
3
3
3
EN
DIN
G F
UN
D B
AL
AN
CE
80
012
55
545
57
874
56
165
56
680
59
561
61
182
62
242
64
540
66
428
69
046
70
450
72
891
Endin
g b
ala
nce a
s
of R
esourc
es
23
16
15
15
15
15
15
15
15
15
15
15
15
TO
TA
L R
EQ
UIR
EM
EN
TS
352
085
344
133
379
462
367
794
375
526
386
176
399
560
411
375
422
917
436
047
449
078
463
192
476
400
RE
VE
NU
E m
inu
s E
XP
EN
DIT
UR
ES
15
722
(17
273
)
(22
138
)
(1709
)
515
2881
1621
1060
2299
1888
2618
1405
2441
(NO
T c
um
ula
tive)
no
te
no
n-r
ec
urr
ing
exp
en
dit
ure
s-
-
-
-
-
-
-
-
-
-
-
-
-
ne
t re
cu
rrin
g r
ev-
ex
p1
57
22
(17
27
3)
(22
13
8)
(17
09
)
51
5
28
81
16
21
10
60
22
99
18
88
26
18
14
05
24
41
One-t
ime O
pera
ting E
xpenditure
s w
ere
availa
ble
due to a
ctu
al F
Y12 B
egin
nin
g F
und B
ala
nce b
ein
g h
igher
than b
udgete
d
1)
The T
ransfe
r fo
r B
each R
enourishm
ent in
FY
2013 r
eflects
an a
dditio
nal am
ount due b
ased o
n r
econcile
d a
ctu
al ta
x c
olle
ctions v
ers
us b
udget in
prior
years
T
he F
Y2014 a
mount re
turn
s to the b
ase a
nnual tr
ansfe
r of 12
of one c
ent fr
om
the e
stim
ate
d c
olle
ctions
2)
The s
ignific
ant re
duction in D
ebt S
erv
ice in F
Y2016 r
eflects
the e
nd o
f T
ropic
ana F
ield
and D
unedin
Spring T
rain
ing F
acili
ty p
aym
ents
in F
Y2015
3)
The r
eduction in D
ebt S
erv
ice in F
Y2022 r
eflects
the e
nd o
f C
learw
ate
r S
pring T
rain
ing F
acili
ty p
aym
ents
in F
Y2021
4)
Annual paym
ents
of $500k to the D
ali
Musuem
are
schedule
d to e
nd in F
Y2020
5)
The T
ransfe
r fo
r T
ax C
olle
cto
r serv
ices in F
Y13 r
eflects
a r
ecovery
form
ula
based o
n a
ctu
al annual cost It incre
ases 3
p
er
year
in the fore
cast fo
r anticip
ate
d incre
ases in futu
re p
ers
onal serv
ices a
nd o
pera
ting e
xpenses
6)
The
Undesig
nate
d
line u
nder
Expenditure
s s
how
s a
pote
ntial am
ount of fu
nds that could
be a
llocate
d a
bove the targ
et 15
reserv
e based o
n a
ll aoth
er
assum
ptions in the fore
cast
FO
RE
CA
ST
(
100
Reven
ue)
F-9
F-10
$200
$230
$260
$290
$320
$350
$380
$410
$440
2013
2014
2015
2016
2017
2018
2019
2020
2021
2022
2023
Dollars (millions)
Tra
nsp
ort
ati
on
Tru
st
Fu
nd
Fo
reca
st
FY
2014 -
FY
2023
RE
VE
NU
ES
E
XP
EN
DIT
UR
ES
F-11
TR
AN
SP
OR
TA
TIO
N T
RU
ST
FU
ND
FO
RE
CA
ST
Fu
nd
1001
Fo
recast
Assu
mp
tio
ns
20
14
20
15
20
16
20
17
20
18
20
19
20
20
20
21
20
22
20
23
RE
VE
NU
ES
Nin
th C
en
t G
as T
ax
-05
-0
5
-05
-0
5
-05
-0
5
-05
-0
5
-05
-0
5
Sta
te S
ha
red
Ga
s T
axe
s-0
5
-05
-0
5
-05
-0
5
-05
-0
5
-05
-0
5
-05
Lo
ca
l O
ptio
n G
as T
axe
s-0
5
-05
-0
5
-05
-0
5
-05
-0
5
-05
-0
5
-05
Oth
er
reve
nu
es
20
2
0
20
2
0
20
2
0
20
2
0
20
2
0
EX
PE
ND
ITU
RE
S
Pe
rso
na
l S
erv
ice
s4
1
40
4
0
40
4
0
40
4
0
40
4
0
40
Op
era
tin
g E
xp
en
se
s1
5
18
1
7
20
1
9
21
2
0
20
2
0
20
Cap
ita
l O
utla
y1
5
18
1
7
20
1
9
21
2
0
20
2
0
20
Gra
nts
amp A
ids
15
1
8
17
2
0
19
2
1
20
2
0
20
2
0
Tra
nsfe
rs1
60
0
0
00
0
0
00
0
0
00
0
0
00
0
0
Pro
jec
ted
Ec
on
om
ic C
on
dit
ion
s
In
dic
ato
rs
Con
su
me
r P
rice
In
de
x
c
ha
ng
e1
5
18
1
7
20
1
9
21
2
0
20
2
0
20
FL
Pe
r C
ap
ita
Pe
rso
na
l In
co
me
Gro
wth
20
2
2
22
1
8
14
1
5
17
1
6
16
1
6
F-12
TR
AN
SP
OR
TA
TIO
N T
RU
ST
FU
ND
FO
RE
CA
ST
Fu
nd
1001
(in
$ t
ho
us
an
ds
)A
ctu
al
Bu
dg
et
Es
tim
ate
dE
sti
ma
ted
Es
tim
ate
dE
sti
ma
ted
Es
tim
ate
dE
sti
ma
ted
Es
tim
ate
dE
sti
ma
ted
Es
tim
ate
dE
sti
ma
ted
Es
tim
ate
d
20
12
20
13
20
13
20
14
20
15
20
16
20
17
20
18
20
19
20
20
20
21
20
22
20
23
BE
GIN
NIN
G F
UN
D B
AL
AN
CE
14
77
22
13
96
30
17
70
77
16
28
75
13
71
37
10
32
10
60
58
3
74
37
(5
78
00
)
(13
42
92
)
(2
21
99
8)
(32
12
54
)
(4
32
41
2)
RE
VE
NU
ES
Nin
th C
en
t G
as T
ax
37
49
3
37
57
7
37
57
7
37
38
9
37
20
2
37
01
6
36
83
1
36
64
7
36
46
4
36
28
1
36
10
0
35
91
9
35
74
0
Sta
te S
ha
red
Ga
s T
axe
s9
31
90
9
24
20
9
24
20
9
24
20
9
19
58
9
14
98
9
10
41
9
05
85
9
01
32
8
96
82
8
92
33
8
87
87
8
83
43
Lo
ca
l O
ptio
n G
as T
ax
12
49
70
12
59
65
12
59
65
12
53
35
12
47
08
12
40
85
12
34
65
12
28
47
12
22
33
12
16
22
12
10
14
12
04
09
11
98
07
Inte
rest
42
2
5
00
50
0
5
00
13
71
2
06
4
18
18
2
23
-
-
-
-
-
Oth
er
reve
nu
es
23
99
0
15
05
4
15
05
4
15
35
5
15
66
2
15
97
5
16
29
5
16
62
1
16
95
3
17
29
2
17
63
8
17
99
1
18
35
1
Tra
nsfe
r fr
om
oth
er
Fu
nd
s-
1
50
00
1
50
00
1
50
00
1
50
00
1
50
00
1
50
00
1
50
00
1
50
00
1
50
00
1
50
00
1
50
00
1
50
00
Ad
just
Oth
er
Re
ve
nu
e t
o 9
8
49
1
5
01
53
8
5
70
57
2
5
32
53
5
5
46
55
7
5
68
57
9
TO
TA
L R
EV
EN
UE
S2
80
06
5
2
86
51
6
2
87
00
7
2
86
50
0
2
86
44
0
2
86
20
9
2
85
02
1
2
82
45
5
2
81
31
8
2
80
42
3
2
79
54
2
2
78
67
4
2
77
82
0
v
s p
rio
r ye
ar
2
2
0
0
0
0
-1
0
0
0
0
0
TO
TA
L R
ES
OU
RC
ES
42
77
87
42
61
46
46
40
84
44
93
75
42
35
77
38
94
18
34
56
04
28
98
92
22
35
18
14
61
31
57
54
5
(42
58
0)
(1
54
59
2)
EX
PE
ND
ITU
RE
S
Pe
rso
na
l S
erv
ice
s1
10
79
6
1
37
37
9
1
37
37
9
1
43
01
2
1
48
73
2
1
54
68
1
1
60
86
9
1
67
30
3
1
73
99
5
1
80
95
5
1
88
19
3
1
95
72
1
2
03
55
0
Op
era
tin
g E
xp
en
se
s
90
24
6
12
38
33
12
38
33
12
56
90
12
79
53
13
01
28
13
27
31
13
52
53
13
80
93
14
08
55
14
36
72
14
65
45
14
94
76
Cap
ita
l O
utla
y6
89
15
70
1
57
0
15
94
1
62
2
16
50
1
68
3
17
15
1
75
1
17
86
1
82
2
18
58
1
89
5
Gra
nts
amp A
ids
14
5
2
67
26
7
2
71
27
6
2
81
28
6
2
92
29
8
3
04
31
0
3
16
32
2
Fu
ll C
ost
Allo
ca
tio
n1
88
34
1
92
31
1
92
31
1
93
66
1
95
59
1
99
50
2
05
49
2
11
65
2
18
00
2
24
54
2
31
28
2
38
22
2
45
37
Tra
nsfe
rs t
o o
the
r F
un
ds
30
00
0
21
56
0
21
56
0
25
00
0
25
00
0
25
00
0
25
00
0
25
00
0
25
00
0
25
00
0
25
00
0
25
00
0
25
00
0
Exp
en
ditu
re L
ap
se
1
(26
30
)
(2
70
6)
(27
86
)
(2
86
7)
(29
56
)
(3
04
6)
(31
41
)
(3
23
9)
(33
40
)
(3
44
4)
(35
52
)
Po
ten
tia
l Is
su
es
a)
CIP
Op
era
tin
g I
mp
acts
(cu
mu
lative
)1
1
11
1
2
06
1
0
14
1
4
14
1
4
14
TO
TA
L E
XP
EN
DIT
UR
ES
25
07
10
30
38
40
30
12
10
31
22
38
32
03
67
32
88
35
33
81
68
34
76
92
35
78
10
36
81
29
37
87
99
38
98
32
40
12
42
v
s p
rio
r ye
ar
18
1
7
4
3
3
3
3
3
3
3
3
3
EN
DIN
G F
UN
D B
AL
AN
CE
17
70
77
12
23
06
16
28
75
13
71
37
10
32
10
60
58
3
74
37
(5
78
00
)
(13
42
92
)
(2
21
99
8)
(32
12
54
)
(4
32
41
2)
(55
58
33
)
AS
SU
MIN
G N
O A
CT
ION
TA
KE
N T
O
RE
SO
LV
E S
HO
RT
FA
LL
S
En
din
g b
ala
nce
as
of
Reso
urc
es
29
3
5
31
2
4
16
2
-2
0
-60
-1
52
-5
58
1
01
6
36
0
TO
TA
L R
EQ
UIR
EM
EN
TS
42
77
87
42
61
46
46
40
84
44
93
75
42
35
77
38
94
18
34
56
04
28
98
92
22
35
18
14
61
31
57
54
5
(42
58
0)
(1
54
59
2)
RE
VE
NU
E m
inu
s E
XP
EN
DIT
UR
ES
29
35
5
(17
32
4)
(1
42
02
)
(25
73
7)
(3
39
27
)
(42
62
6)
(5
31
47
)
(65
23
7)
(7
64
92
)
(87
70
5)
(9
92
56
)
(11
11
57
)
(1
23
42
2)
(NO
T c
um
ula
tive
)
no
te
no
n-r
ec
urr
ing
ex
pe
nd
itu
res
-
-
-
-
-
-
-
-
-
-
-
-
-
net
recu
rrin
g r
ev-
exp
29
355
(17
324
)
(14
202
)
(25
737
)
(33
927
)
(42
626
)
(53
147
)
(65
237
)
(76
492
)
(87
705
)
(99
256
)
(111
157
)
(123
422
)
O
pe
ratin
g E
xp
en
se
s n
et
of
Fu
ll C
ost
Allo
ca
tio
n
Exp
en
ditu
re la
pse
is c
alc
ula
ted
on
Pe
rso
na
l S
erv
ice
s
Op
era
tin
g E
xp
en
se
s
Cap
ita
l O
utla
y
an
d G
ran
ts amp
Aid
s o
nly
FO
RE
CA
ST
F-13
F-14
00
200
400
600
800
1000
1200
1400
1600
1800
2014
2015
2016
2017
2018
2019
2020
Dollars (millions)
Cap
ital
Pro
jects
Fu
nd
Fo
reca
st
FY
2014
-FY
2020
Revenues
Expenditure
s
F-15
CA
PIT
AL
PR
OJ
EC
TS
FU
ND
FO
RE
CA
ST
Fu
nd
3001
Fo
rec
as
t A
ss
um
pti
on
s2014
2015
2016
2017
2018
2019
2020
2021
2022
2023
RE
VE
NU
ES
Infr
astr
uctu
re S
ale
s T
ax
35
30
30
30
30
30
30
Nin
th C
ent
Gas T
ax (
from
Tra
nsp T
rust)
-05
-0
5
-05
-0
5
-05
-0
5
-05
Impact
Fees (
from
Specia
l R
evenue F
und)
97
111
750
143
00
00
00
Gra
nts
-454
-5
63
-5
65
2494
-4
60
451
-6
37
Tra
nsfe
r fr
om
TD
C F
und
35
30
30
30
30
30
30
Reim
burs
em
ents
00
00
00
00
00
00
00
Oth
er
revenues
20
20
20
20
20
20
20
EX
PE
ND
ITU
RE
S
na
Pro
jecte
d E
co
no
mic
Co
nd
itio
ns
Ind
icato
rs
Consum
er
Price I
ndex
c
hange
15
18
17
20
19
21
20
20
20
20
F-16
CA
PIT
AL
PR
OJ
EC
TS
FU
ND
FO
RE
CA
ST
Fu
nd
3001
(in
$ t
ho
usan
ds
)A
ctu
al
Bu
dg
et
Esti
mate
dE
sti
mate
dE
sti
mate
dE
sti
mate
dE
sti
mate
dE
sti
mate
dE
sti
mate
dE
sti
mate
dE
sti
mate
dE
sti
mate
dE
sti
mate
d
2012
2013
2013
2014
2015
2016
2017
2018
2019
2020
2021
2022
2023
BE
GIN
NIN
G F
UN
D B
AL
AN
CE
513
090
1183
981
811
543
229
618
323
598
225
659
266
472
231
680
279
197
353
804
-
RE
VE
NU
ES
Infr
astr
uctu
re S
ale
s T
ax
(Penny f
or
Pin
ella
s)
777
592
758
824
804
810
832
978
857
968
883
707
910
218
937
524
965
650
328
225
-
Gra
nts
105
006
326
930
326
930
178
459
77
908
33
921
118
510
63
975
92
825
33
715
Reim
burs
em
ents
-
-
-
Nin
th C
ent
Gas T
ax (
Tra
nsfe
r fr
om
Tra
nsport
ation T
rust
Fund)
30
000
21
560
21
560
25
000
25
000
25
000
25
000
25
000
25
000
25
000
Tra
nsport
ation I
mpact
Fees (
from
Specia
l R
evenue F
und)
10
547
16
407
16
407
18
000
20
000
35
000
40
000
40
000
40
000
40
000
Tra
nsfe
r fr
om
Genera
l F
und
8478
18
000
18
000
18
000
18
000
18
000
18
000
3000
3000
3000
Tra
nsfe
r fr
om
TD
C F
und
26
513
32
424
32
424
29
395
30
277
31
185
32
121
33
085
34
077
35
099
Tra
nsfe
r fr
om
Fire D
istr
icts
Suth
erland B
ayou M
arina M
itig
P
ymnt
297
Sale
-Surp
lus C
ounty
Land
366
Inte
rest
2563
2138
2138
1607
3
3236
0
4513
2
7994
2
6950
4
8375
9
10
614
1
Oth
er
revenues
1199
1200
1224
1248
1273
1299
1325
1351
1378
Reappro
priation o
f R
evenue-R
esta
tem
ent
-
-
-
-
-
-
-
-
-
-
Inte
rfund L
oan-S
olid
Waste
-Chill
er
-
75
000
Inte
rfund L
oan-S
olid
Waste
-
100
000
100
000
450
000
-
-
-
-
-
-
-
-
-
TO
TA
L R
EV
EN
UE
S962
561
1276
283
1398
469
1554
664
1033
637
1032
600
1153
142
1110
859
1170
280
477
031
-
-
-
v
s p
rior
year
TO
TA
L R
ES
OU
RC
ES
1475
651
2460
264
2210
012
1784
282
1357
235
1258
259
1419
614
1342
539
1449
477
830
835
-
-
-
EX
PE
ND
ITU
RE
S
Capital P
roje
cts
663
790
1962
594
1962
594
1442
884
1063
776
924
487
1121
434
861
842
894
473
401
483
Debt
Serv
ice o
n I
nte
rfund L
oan
318
2800
2800
2800
2800
2300
1500
1500
1200
500
Paym
ent
on S
W L
oan-C
hill
er
15
000
15
000
15
000
15
000
15
000
15
000
Paym
ent
on S
W L
oan
50
000
50
000
50
000
200
000
200
000
150
000
TO
TA
L E
XP
EN
DIT
UR
ES
664
108
1980
394
1980
394
1460
684
1131
576
991
787
1187
934
1063
342
1095
673
551
983
-
-
-
EN
DIN
G F
UN
D B
AL
AN
CE
811
543
479
870
229
618
323
598
225
659
266
472
231
680
279
197
353
804
278
852
-
-
-
TO
TA
L R
EQ
UIR
EM
EN
TS
1475
651
2460
264
2210
012
1784
282
1357
235
1258
259
1419
614
1342
539
1449
477
830
835
-
-
-
RE
VE
NU
E m
inu
s E
XP
EN
DIT
UR
ES
298
453
(704
111
)
(5
81
925
)
93
980
(9
7939
)
40
813
(3
4792
)
47
517
74
607
(7
4952
)
-
-
-
(NO
T c
um
ula
tive)
ne
t re
cu
rrin
g r
ev-
ex
p2
98
45
3
(70
41
11
)
(5
81
92
5)
93
98
0
(9
79
39
)
40
81
3
(3
47
92
)
47
51
7
7
46
07
(74
95
2)
-
-
-
Note
F
Y2021 a
nd F
Y2022 n
ot
inclu
ded a
s P
enny f
or
Pin
ella
s is a
uth
orized o
nly
thro
ugh a
port
ion o
f F
Y2020
FO
RE
CA
ST
F-17
F-18
600
700
800
900
1000
1100
1200
1300
1400
1500
2014
2015
2016
2017
2018
2019
2020
2021
2022
2023
Dollars (millions) E
me
rge
nc
y M
ed
ica
l S
erv
ice
s F
un
d F
ore
ca
st
FY
20
14
- F
Y2
02
3
RE
VE
NU
ES
E
XP
EN
DIT
UR
ES
F-19
EM
ER
GE
NC
Y M
ED
ICA
L S
ER
VIC
ES
FU
ND
FO
RE
CA
ST
Fu
nd
10
06
Fo
rec
as
t A
ss
um
pti
on
s2014
2015
2016
2017
2018
2019
2020
2021
2022
2023
RE
VE
NU
ES
Ad V
alo
rem
Revenue (
95
)25
25
30
30
30
30
30
30
30
30
Am
bula
nce S
vc C
ontr
act F
ees
20
20
20
20
20
20
20
20
20
20
Am
bula
nce A
nnual M
em
bers
Fees
00
00
00
00
00
00
00
00
00
00
Gra
nt R
evenue (
EM
S T
rust F
und)
20
20
20
20
20
20
20
20
20
20
Oth
er
revenues (
ref of prior
yrs
exp)
00
00
00
00
00
00
00
00
00
00
EX
PE
ND
ITU
RE
S
Pers
onal S
erv
ices
41
40
40
40
40
40
40
40
40
40
Opera
ting E
xpenses
15
18
17
20
19
21
20
20
20
20
Opera
ting E
xpenses-F
irst R
esp M
ed S
upplie
s30
30
30
30
30
30
30
30
30
30
Capital O
utlay
15
18
17
20
19
21
20
20
20
20
Am
bula
nce C
ontr
act
60
60
60
60
60
60
60
60
60
60
EM
S T
rust F
und G
rant E
xpenditure
s20
20
20
20
20
20
20
20
20
20
Gra
nts
amp A
ids (
First R
esponder
Agm
ts)
50
50
50
50
50
50
50
50
50
50
Pro
jecte
d E
co
no
mic
Co
nd
itio
ns In
dic
ato
rs
Consum
er
Price Index
change
15
18
17
20
19
21
20
20
20
20
FL P
er
Capita P
ers
onal I
ncom
e G
row
th20
22
22
18
14
15
17
16
16
16
Estim
ate
d N
ew
Constr
uctio
n
of ta
x b
ase
05
05
10
10
10
10
10
10
10
10
F-20
EM
ER
GE
NC
Y M
ED
ICA
L S
ER
VIC
ES
FU
ND
FO
RE
CA
ST
Fu
nd
10
06
(in
$ t
ho
usan
ds)
Actu
al
Bu
dg
et
Esti
mate
dE
sti
mate
dE
sti
mate
dE
sti
mate
dE
sti
mate
dE
sti
mate
dE
sti
mate
dE
sti
mate
dE
sti
mate
dE
sti
mate
dE
sti
mate
d
2012
2013
2013
2014
2015
2016
2017
2018
2019
2020
2021
2022
2023
BE
GIN
NIN
G F
UN
D B
AL
AN
CE
213
713
212
463
236
861
228
126
193
023
130
444
40
697
(80
635
)
(235
598
)
(425
541
)
(652
971
)
(920
627
)
(1231
417
)
RE
VE
NU
ES
Ad V
alo
rem
Revenue
95
422
112
438
521
438
521
449
484
460
721
474
543
488
779
503
442
518
546
534
102
550
125
566
629
583
628
Am
bula
nce S
vc C
ontr
act F
ees
95
439
968
415
266
423
571
432
043
440
684
449
497
458
487
467
657
477
010
486
550
496
281
506
207
516
331
Am
bula
nce A
nnual M
em
bers
Fees
2225
1995
1995
1995
1995
1995
1995
1995
1995
1995
1995
1995
1995
Gra
nt R
evenue (
EM
S T
rust F
und)
159
2000
2000
2040
2081
2122
2165
2208
2252
2297
2343
2390
2438
Cty
Off F
ees (
TC
amp P
A)
2918
2676
2676
2703
2730
2757
2785
2813
2841
2869
2898
2927
2956
Inte
rest
1348
1360
1360
1370
1930
2609
1221
-
-
-
-
-
-
Oth
er
revenues (
refu
nd o
f prior
yrs
exp)
588
256
256
256
256
256
256
256
256
256
256
256
256
A
dju
st T
ax R
evenues to 9
6
-
4616
4731
4850
4995
5145
5299
5458
5622
5791
5965
6143
A
dju
st A
mbula
nce R
evenues to 1
00
-
22
398
22
846
23
303
23
769
24
245
24
729
25
224
25
729
26
243
26
768
27
303
TO
TA
L R
EV
EN
UE
S869
318
862
074
897
394
917
468
938
549
962
544
985
077
1008
400
1033
582
1059
420
1085
932
1113
136
1141
051
v
s p
rior
yea
r16
-1
3
2
2
3
2
2
2
2
3
3
3
TO
TA
L R
ES
OU
RC
ES
1083
031
1074
537
1134
255
1145
593
1131
573
1092
988
1025
775
927
765
797
984
633
879
432
961
192
510
(90
366
)
EX
PE
ND
ITU
RE
S
Pers
onal S
erv
ices
27
036
28
849
28
849
30
032
31
233
32
482
33
782
35
133
36
538
38
000
39
520
41
101
42
745
Opera
ting E
xpenses
43
723
58
678
58
678
59
558
60
630
61
661
62
894
64
089
65
435
66
744
68
079
69
440
70
829
O
pera
ting E
xpenses -
First R
esponder
Medic
al S
upplie
s
10
885
12
360
12
360
12
731
13
113
13
506
13
911
14
329
14
758
15
201
15
657
16
127
16
611
Capital O
utlay
4699
7900
7900
8019
8163
8302
8468
8629
8810
8986
9166
9349
9536
Am
bula
nce C
ontr
act
366
575
382
000
382
000
404
920
429
215
454
968
482
266
511
202
541
874
574
387
608
850
645
381
684
104
EM
S T
rust F
und G
rant E
xpenditure
s159
2000
2000
2040
2081
2122
2165
2208
2252
2297
2343
2390
2438
Gra
nts
amp A
ids (
First R
esponder
Agm
ts)
381
984
401
566
401
566
421
644
442
727
464
863
488
106
512
511
538
137
565
044
593
296
622
961
654
109
Trf
rs to P
A amp
TC
11
109
12
776
12
776
13
626
13
967
14
386
14
818
15
262
15
720
16
192
16
677
17
178
17
693
Expenditure
Lapse 1
A
mt
Inclu
de
s E
cke
rd C
on
tra
ct
TO
TA
L E
XP
EN
DIT
UR
ES
846
170
906
129
906
129
952
570
1001
128
1052
291
1106
410
1163
363
1223
525
1286
850
1353
588
1423
926
1498
064
v
s p
rior
yea
r1
7
7
5
5
5
5
5
5
5
5
5
5
EN
DIN
G F
UN
D B
AL
AN
CE
236
861
168
408
228
126
193
023
130
444
40
697
(80
635
)
(235
598
)
(425
541
)
(652
971
)
(920
627
)
(1231
417
)
(1588
430
)
Endin
g b
ala
nce a
s
of E
xpenditure
s280
186
252
203
130
39
-7
3
-203
-3
48
-5
07
-6
80
-8
65
-1
060
TO
TA
L R
EQ
UIR
EM
EN
TS
1083
031
1074
537
1134
255
1145
593
1131
573
1092
988
1025
775
927
765
797
984
633
879
432
961
192
510
(90
366
)
RE
VE
NU
E m
inu
s E
XP
EN
DIT
UR
ES
23
148
(44
055
)
(8735
)
(35
102
)
(62
579
)
(89
747
)
(121
332
)
(154
963
)
(189
943
)
(227
430
)
(267
656
)
(310
790
)
(357
013
)
(NO
T c
um
ula
tive)
no
te
no
n-r
ec
urr
ing
exp
en
dit
ure
s-
-
-
-
-
-
-
-
-
-
-
-
-
ne
t re
cu
rrin
g r
ev-
ex
p2
31
48
(44
05
5)
(87
35
)
(35
10
2)
(62
57
9)
(89
74
7)
(12
13
32
)
(15
49
63
)
(18
99
43
)
(22
74
30
)
(26
76
56
)
(31
07
90
)
(35
70
13
)
1)
FY
2013 r
eflects
the n
ew
ord
inance p
assed b
y B
oard
action o
n D
ecem
ber
20th
2011 to
main
tain
as c
lose a
s p
ossib
le a 2
5
Begin
nin
g F
und B
ala
nce P
erc
enta
ge o
f re
serv
e b
ala
nce d
eclin
es g
oin
g into
FY
2014 a
nd is d
eple
ted in F
Y2017
2)
EM
S M
illage incre
ased fro
m 0
5832 in F
Y11 to 0
8506 in F
Y12 is
then incre
ased to 0
9158 in F
Y13 and then a
ssum
ed to r
em
ain
fla
t th
roughout th
e r
em
ain
der
of th
e fore
cast period M
axim
um
annual E
MS
levy is 1
5000 m
ills
3)
Assum
es e
stim
ate
d A
d V
alo
rem
revenue is a
t 96
except th
e F
Y13 A
dopte
d B
udget w
hic
h r
em
ain
s a
t 95
per
sta
tute
4)
Assum
es e
stim
ate
d a
mbula
nce r
evenue is a
t 100
except th
e F
Y13 A
dopte
d B
udget w
hic
h r
em
ain
s a
t 95
per
sta
tute
5)
The F
irst R
esponder
Agre
em
ents
reflect a 5
incre
ase in F
Y2013 a
nd the r
em
ain
ing fore
cast years
T
his
does n
ot re
flect any c
hanges in s
erv
ice
6)
The E
xpenditure
lapse is n
ot calc
ula
ted o
n this
fund a
s the m
ajo
rity
of th
e e
xpenditure
s w
ithin
this
fund a
re c
ontr
actu
al and a
re fully
expended e
ach y
ear
FO
RE
CA
ST
(
96
Ad
Valo
rem
Reven
ue a
nd
100
Am
bu
lan
ce R
even
ue)
F-21
F-22
100
120
140
160
180
200
220
240
2014
2015
2016
2017
2018
2019
2020
2021
2022
2023
Dollars (millions)
Fir
e D
istr
icts
Fu
nd
Fo
rec
as
t F
Y2
01
4 -
FY
20
23
RE
VE
NU
ES
E
XP
EN
DIT
UR
ES
F-23
FIR
E D
IST
RIC
TS
FU
ND
FO
RE
CA
ST
Fu
nd
10
50
Fo
rec
as
t A
ss
um
pti
on
s2014
2015
2016
2017
2018
2019
2020
2021
2022
2023
RE
VE
NU
ES
Ad V
alo
rem
Tax R
evenue
20
20
25
25
25
25
25
25
25
25
EX
PE
ND
ITU
RE
S
Pers
onal S
erv
ices
41
40
40
40
40
40
40
40
40
40
Opera
ting E
xpenses
15
18
17
20
19
21
20
20
20
20
Capital O
utlay
15
18
17
20
19
21
20
20
20
20
Debt S
erv
ice
00
00
00
00
00
00
00
00
00
00
Gra
nts
amp A
ids (
Cty
Pym
ts)
40
40
40
40
40
40
40
40
40
40
Pro
jecte
d E
co
no
mic
Co
nd
itio
ns In
dic
ato
rs
Consum
er
Price Index
change
15
18
17
20
19
21
20
20
20
20
FL P
er
Capita P
ers
onal I
ncom
e G
row
th20
22
22
18
14
15
17
16
16
16
Estim
ate
d N
ew
Constr
uctio
n
of ta
x b
ase
05
05
10
10
10
10
10
10
10
10
F-24
FIR
E D
IST
RIC
TS
FU
ND
FO
RE
CA
ST
Fu
nd
10
50
(in
$ t
ho
usan
ds)
Actu
al
Bu
dg
et
Esti
mate
dE
sti
mate
dE
sti
mate
dE
sti
mate
dE
sti
mate
dE
sti
mate
dE
sti
mate
dE
sti
mate
dE
sti
mate
dE
sti
mate
dE
sti
mate
d
2012
2013
2013
2014
2015
2016
2017
2018
2019
2020
2021
2022
2023
BE
GIN
NIN
G F
UN
D B
AL
AN
CE
84
213
79
934
85
039
89
924
92
274
92
046
90
481
87
379
81
567
72
793
60
793
45
284
25
967
RE
VE
NU
ES
Ad V
alo
rem
Revenue
95
150
180
148
220
148
220
151
184
154
208
158
063
162
015
166
065
170
217
174
472
178
834
183
305
187
888
Cty
Off F
ees (
TC
amp P
A)
1079
949
949
968
987
1007
1027
1048
1069
1090
1112
1134
1157
Oth
er
Rev (
Inte
rest G
ain
Loss Inv)
535
538
538
629
923
1841
2714
2621
2447
2184
1824
1359
779
Inte
rest -
Tax C
olle
cto
r01
01
01
01
01
01
01
01
01
01
01
01
01
Adju
st P
ropert
y T
axes to
96
1560
1591
1623
1664
1705
1748
1792
1837
1882
1930
1978
Adju
st O
ther
Revenue to 1
00
78
84
101
150
197
193
185
172
155
131
102
TO
TA
L R
EV
EN
UE
S151
795
149
708
151
347
154
458
157
843
162
726
167
660
171
677
175
711
179
756
183
808
187
860
191
904
v
s p
rior
yea
r4
-1
0
2
2
3
3
2
2
2
2
2
2
TO
TA
L R
ES
OU
RC
ES
236
008
229
642
236
386
244
382
250
117
254
773
258
142
259
056
257
278
252
549
244
601
233
144
217
872
EX
PE
ND
ITU
RE
S
Pers
onal S
erv
ices
800
1301
1301
1354
1409
1465
1523
1584
1648
1714
1782
1854
1928
Opera
ting E
xpenditure
s1722
1344
1344
1364
1389
1412
1441
1468
1499
1529
1559
1591
1622
C
urr
Chgs amp
Oblig
(C
ty F
ire A
dm
in C
hgs)
2448
2645
2645
2685
2733
2779
2835
2889
2950
3009
3069
3130
3193
Debt S
erv
ice
-
05
05
05
05
05
05
05
05
05
05
05
05
Gra
nts
amp A
ids (
City P
aym
ents
)144
037
139
232
139
232
144
801
150
593
156
617
162
882
169
397
176
173
183
220
190
549
198
171
206
097
Trf
rs to P
A amp
TC
4410
4580
4580
4583
4675
4792
4912
5034
5160
5289
5421
5557
5696
Pro
-Rate
Cle
aring (
County
Fire A
dm
in C
hgs)
(2448
)
(2645
)
(2645
)
(2685
)
(2733
)
(2779
)
(2835
)
(2889
)
(2950
)
(3009
)
(3069
)
(3130
)
(3193
)
Expenditure
Lapse 1
TO
TA
L E
XP
EN
DIT
UR
ES
150
969
146
462
146
462
152
108
158
071
164
291
170
762
177
489
184
485
191
756
199
317
207
177
215
348
v
s p
rior
yea
r1
-3
-3
4
4
4
4
4
4
4
4
4
4
EN
DIN
G F
UN
D B
AL
AN
CE
85
039
83
180
89
924
92
274
92
046
90
481
87
379
81
567
72
793
60
793
45
284
25
967
2523
Endin
g b
ala
nce a
s
of R
esourc
es
360
362
380
378
368
355
338
315
283
241
185
111
12
TO
TA
L R
EQ
UIR
EM
EN
TS
236
008
229
642
236
386
244
382
250
117
254
773
258
142
259
056
257
278
252
549
244
601
233
144
217
872
RE
VE
NU
E m
inu
s E
XP
EN
DIT
UR
ES
826
3246
4885
2350
(227
)
(1565
)
(3102
)
(5812
)
(8774
)
(12
000
)
(15
509
)
(19
317
)
(23
444
)
(NO
T c
um
ula
tive)
no
te
no
n-r
ecu
rrin
g e
xp
en
dit
ure
s-
-
-
-
-
-
-
-
-
-
-
-
-
ne
t re
cu
rrin
g r
ev-
ex
p8
26
32
46
48
85
23
50
(22
7)
(15
65
)
(31
02
)
(58
12
)
(87
74
)
(12
00
0)
(15
50
9)
(19
31
7)
(23
44
4)
E
xpenditure
lapse is
not calc
ula
ted o
n this
fund a
s the m
ajo
rity
of th
e e
xpenditure
s w
ithin
this
fund a
re c
ontr
actu
al a
nd a
re fully
expended e
ach y
ear
1)
Assum
es e
stim
ate
d A
d V
alo
rem
revenue is a
t 96
except th
e F
Y13 A
dopte
d B
udget w
hic
h r
em
ain
s a
t 95
per
sta
tute
FO
RE
CA
ST
(
96
Ad
Valo
rem
Reven
ue a
nd
100
Oth
er
Reven
ue)
F-25
F-26
$0
0
$2
0
$4
0
$6
0
$8
0
$1
00
$1
20
$1
40
20
13
2
01
4
20
15
2
01
6
20
17
2
01
8
20
19
2
02
0
20
21
2
02
2
20
23
Millions A
irp
ort
Fu
nd
Fo
reca
st
FY2
01
3 -
FY
20
23
Ex
clu
din
g N
on
-Re
curr
ing
Rev
en
ue
s an
d E
xpe
nd
itu
res
Rev
enu
es
Exp
end
itu
res
F-27
AIR
PO
RT
FU
ND
FO
RE
CA
ST
Fu
nd
40
01
Fo
recast
Assu
mp
tio
ns
2014
2015
2016
2017
2018
2019
2020
2021
2022
2023
RE
VE
NU
ES
Airfield
Flig
ht
Lin
es
20
20
20
20
20
20
20
20
20
20
Golf C
ours
e00
00
00
00
00
00
00
00
00
00
Rents
LeasesC
oncessio
ns
20
20
20
20
20
20
20
20
20
20
Capital C
ontr
ibutions
-370
-1
41
391
-3
0
1291
-8
24
00
00
00
00
Oth
er
revenues
20
20
20
20
20
20
20
20
20
20
EX
PE
ND
ITU
RE
S
Pers
onal S
erv
ices
41
40
40
40
40
40
40
40
40
40
Opera
ting E
xpenses
15
18
17
20
19
21
20
20
20
20
Capital O
utlay
15
18
17
20
19
21
20
20
20
20
Gra
nts
amp A
ids
15
18
17
20
19
21
20
20
20
20
Pro
jecte
d E
co
no
mic
Co
nd
itio
ns
Ind
icato
rs
Consum
er
Price I
ndex
c
hange
15
18
17
20
19
21
20
20
20
20
FL P
er
Capita P
ers
onal In
com
e G
row
th20
22
22
18
14
15
17
16
16
16
F-28
AIR
PO
RT
FU
ND
FO
RE
CA
ST
Fu
nd
40
01
(in
$ t
ho
usan
ds
)A
ctu
al
Bu
dg
et
Esti
mate
dE
sti
mate
dE
sti
mate
dE
sti
mate
dE
sti
mate
dE
sti
mate
dE
sti
mate
dE
sti
mate
dE
sti
mate
dE
sti
mate
dE
sti
mate
d
2012
2013
2013
2014
2015
2016
2017
2018
2019
2020
2021
2022
2023
BE
GIN
NIN
G F
UN
D B
AL
AN
CE
146
350
136
909
157
937
141
502
146
618
141
557
139
653
119
666
117
424
124
073
129
864
134
705
138
499
RE
VE
NU
ES
Airfield
Flig
ht
Lin
es
25
776
25
452
26
792
27
328
27
874
28
432
29
001
29
581
30
172
30
776
31
391
32
019
32
659
Golf C
ours
e-
-
-
-
-
-
-
-
-
-
-
-
-
Rents
LeasesC
oncessio
ns
71
425
61
530
64
768
66
063
67
385
68
732
70
107
71
509
72
939
74
398
75
886
77
404
78
952
New
Pro
pert
y D
evelo
pm
ent
-
-
-
-
-
-
-
3300
3366
3433
3502
3572
3643
Gra
nts
2754
2650
2650
2703
2757
2812
2868
2926
2984
3044
3105
3167
3230
Capital C
ontr
ibutions
88
893
101
642
101
642
64
050
55
000
76
500
74
200
170
000
30
000
30
000
30
000
30
000
30
000
Inte
rest
743
889
889
991
1466
2831
4190
3590
3523
3722
3896
4041
4155
Oth
er
revenues
288
18
18
18
19
19
19
20
20
21
21
22
22
TO
TA
L R
EV
EN
UE
S189
879
192
181
196
759
161
153
154
501
179
327
180
385
280
925
143
005
145
394
147
801
150
224
152
662
44
4
-18
-4
16
1
56
-49
2
2
2
2
TO
TA
L R
ES
OU
RC
ES
336
229
329
090
354
695
302
655
301
119
320
883
320
038
400
591
260
428
269
467
277
665
284
929
291
161
EX
PE
ND
ITU
RE
S
Pers
onal S
erv
ices
41
940
43
250
43
250
45
023
46
824
48
697
50
645
52
671
54
778
56
969
59
248
61
617
64
082
Opera
ting E
xpenses
34
541
42
394
42
394
43
030
43
804
44
549
45
440
46
303
47
276
48
221
49
186
50
170
51
173
Golf C
ours
e O
pera
tions
main
tenance
-
-
-
-
-
-
-
-
-
-
-
-
-
Capital O
utlay
2665
1451
1451
1473
1499
1525
1555
1585
1618
1650
1683
1717
1751
Full
Cost
Allo
cation
4552
5111
5111
5147
5198
5302
5461
5625
5794
5968
6147
6331
6521
No
n-r
ecu
rrin
g C
IP e
xp
en
dit
ure
s94
594
123
600
123
600
64
050
65
000
84
000
100
200
180
000
30
000
30
000
30
000
30
000
30
000
Expenditure
Lapse 3
-
(2
613
)
(2
686
)
(2
764
)
(2
843
)
(2
929
)
(3
017
)
(3
110
)
(3
205
)
(3
304
)
(3
405
)
(3
510
)
TO
TA
L E
XP
EN
DIT
UR
ES
178
292
215
806
213
193
156
037
159
562
181
230
200
372
283
167
136
355
139
603
142
960
146
430
150
017
48
20
-27
2
14
11
41
-52
2
2
2
2
EN
DIN
G F
UN
D B
AL
AN
CE
157
937
113
284
141
502
146
618
141
557
139
653
119
666
117
424
124
073
129
864
134
705
138
499
141
144
AS
SU
MIN
G N
O A
CT
ION
TA
KE
N T
O
RE
SO
LV
E S
HO
RT
FA
LL
S
Endin
g b
ala
nce a
s
of
Resourc
es
47
34
40
48
47
44
37
29
48
48
49
49
48
TO
TA
L R
EQ
UIR
EM
EN
TS
336
229
329
090
354
695
302
655
301
119
320
883
320
038
400
591
260
428
269
467
277
665
284
929
291
161
RE
VE
NU
E m
inu
s E
XP
EN
DIT
UR
ES
11
587
(2
3625
)
(16
434
)
5116
(5
061
)
(1
903
)
(1
9987
)
(2242
)
6649
5791
4841
3794
2645
no
te
no
n-r
ecu
rrin
g C
IP e
xp
en
dit
ure
s94
594
123
600
123
600
64
050
65
000
84
000
100
200
180
000
30
000
30
000
30
000
30
000
30
000
no
n-r
ecu
rrin
g r
ev(c
ap
ital
co
ntr
ib)
(88
893
)
(101
642
)
(1
01
642
)
(6
4050
)
(55
000
)
(76
500
)
(74
200
)
(170
000
)
(3
0000
)
(30
000
)
(30
000
)
(30
000
)
(30
000
)
net
recu
rrin
g r
ev-
exp
17
288
(1
667
)
5524
5116
4939
5597
6013
7758
6649
5791
4841
3794
2645
O
pera
ting E
xpenses n
et
of
Full
Cost
Allo
cation
Expenditure
la
pse is c
alc
ula
ted o
n P
ers
onal S
erv
ices
Opera
ting E
xpenses
Capital O
utla
y
and G
rants
amp A
ids o
nly
FY
11 la
pse is u
sed t
o a
dju
st
for
update
d info
rmation
FO
RE
CA
ST
F-29
F-30
700
800
900
1000
1100
2014
2015
2016
2017
2018
2019
2020
2021
2022
2023
Dollars (millions)
Wa
ter
Sys
tem
Fu
nd
s F
ore
ca
st
FY
20
14
- F
Y2
02
3
wit
h R
ate
In
cre
as
es
Re
ve
nu
es
Exp
en
ditu
res
F-31
WA
TE
R F
UN
DS
FO
RE
CA
ST
Fu
nd
40
31
4
03
3
40
34
amp 4
03
6
Fo
rec
as
t A
ss
um
pti
on
s2014
2015
2016
2017
2018
2019
2020
2021
2022
2023
RE
VE
NU
ES
~W
ate
r S
ale
s-R
eta
il
20
20
20
21
22
23
23
23
23
23
Wate
r S
ale
s-W
hole
sale
-9
3
-49
-3
73
20
20
20
20
20
20
20
Oth
er
revenues
-29
-2
1
-11
-2
7
-09
20
20
20
20
20
~E
XP
EN
DIT
UR
ES
Pers
onal S
erv
ices
41
40
40
40
40
40
40
40
40
40
Opera
ting E
xpenses
20
23
18
17
17
18
17
19
21
21
Purc
hase o
f W
ate
r
10
21
08
16
10
25
25
25
25
25
Pow
er
00
50
50
50
50
50
50
50
50
50
Chem
icals
70
70
70
70
70
70
70
70
70
70
Pro
jecte
d E
co
no
mic
Co
nd
itio
ns In
dic
ato
rs
Consum
er
Price Index
change
15
18
17
20
19
21
20
20
20
20
FL P
er
Capita P
ers
onal I
ncom
e G
row
th20
22
22
18
14
15
17
16
16
16
R
evenue p
erc
enta
ges r
eflect th
e c
om
bin
ed im
pact of changes in r
ate
s a
ndo
r le
vels
of consum
ption
P
urc
hase o
f w
ate
r perc
enta
ges r
eflect th
e c
om
bin
ed im
pact of changes in T
am
pa B
ay W
ate
r ra
tes a
ndo
r changes in c
onsum
ption inclu
din
g d
ecre
ases in w
hole
sale
custo
mer
base
]
F-32
WA
TE
R F
UN
DS
FO
RE
CA
ST
Fu
nd
40
31
4
03
3
40
34
amp 4
03
6
(in
$ t
ho
usan
ds)
Actu
al
Bu
dg
et
Esti
mate
dE
sti
mate
dE
sti
mate
dE
sti
mate
dE
sti
mate
dE
sti
mate
dE
sti
mate
dE
sti
mate
dE
sti
mate
dE
sti
mate
dE
sti
mate
d
2012
2013
2013
2014
2015
2016
2017
2018
2019
2020
2021
2022
2023
BE
GIN
NIN
G F
UN
D B
AL
AN
CE
468
844
399
838
470
872
377
252
233
322
262
562
305
749
226
890
211
312
231
236
246
972
258
488
266
057
RE
VE
NU
ES
Wate
r S
ale
s -
Reta
il614
408
620
787
653
460
666
831
680
201
693
805
708
315
723
775
740
230
757
054
774
255
791
840
810
053
Wate
r S
ale
s -
Whole
sale
171
563
150
556
158
480
143
667
136
663
85
730
87
445
89
194
90
977
92
797
94
653
96
546
98
477
Inte
r est
2022
1791
1886
2641
2333
5251
9172
6807
6339
6937
7409
7755
7982
Oth
er
Revenues
60
514
40
925
43
079
41
845
40
954
40
495
39
420
39
060
39
069
39
079
39
088
39
098
39
098
TO
TA
L R
EV
EN
UE
S848
507
814
059
856
904
854
983
860
151
825
281
844
353
858
836
876
616
895
867
915
405
935
239
955
609
v
s p
rior
year
1
0
1
-4
2
2
2
2
2
2
2
TO
TA
L R
ES
OU
RC
ES
1317
351
1213
897
1327
776
1232
235
1093
473
1087
843
1150
102
1085
725
1087
929
1127
103
1162
377
1193
727
1221
666
EX
PE
ND
ITU
RE
S
Pers
onal S
erv
ices
123
054
126
772
126
772
131
970
137
248
142
738
148
448
154
386
160
561
166
984
173
663
180
609
187
834
OP
EB
11
862
13
333
13
333
13
880
14
435
15
012
15
613
16
237
16
887
17
562
18
264
18
995
19
755
Opera
ting E
xpenses
43
056
66
557
66
557
67
888
69
449
70
700
71
901
73
124
74
440
75
705
77
144
78
764
80
418
Purc
hase o
f W
ate
r472
008
454
472
454
472
420
906
423
097
383
991
388
292
390
406
401
079
412
042
423
303
434
870
445
741
Pow
er
17
439
18
628
18
628
18
628
19
560
20
538
21
565
22
643
23
775
24
964
26
212
27
523
28
899
Chem
icals
6777
7745
7745
8287
8867
9488
10
152
10
863
11
623
12
437
13
307
14
239
15
236
Gra
nts
amp A
ids
9782
9388
9388
9593
9198
9704
10
218
10
782
11
397
12
308
12
937
13
767
14
593
Cost A
llocation
86
548
57
117
57
117
58
259
59
599
60
672
61
703
62
752
63
882
64
968
66
202
67
593
69
012
Expenditure
Lapse
-
(7540
)
(7294
)
(7415
)
(7128
)
(7279
)
(7412
)
(7636
)
(7870
)
(8110
)
(8364
)
(8615
)
Debt S
erv
ice
81
100
100
-
-
-
-
-
-
-
-
-
-
Capital O
utlay
75
872
185
097
203
952
276
797
96
871
76
380
202
599
140
633
100
685
101
030
100
966
99
674
99
769
TO
TA
L E
XP
EN
DIT
UR
ES
846
479
939
209
950
524
998
914
830
910
782
094
923
212
874
413
856
693
880
131
903
889
927
670
952
642
v
s p
rior
year
-4
14
5
-17
-6
18
-5
-2
3
3
3
3
TO
TA
L E
ND
ING
FU
ND
BA
LA
NC
E470
872
274
688
377
252
233
322
262
562
305
749
226
890
211
312
231
236
246
972
258
488
266
057
269
024
Endin
g b
ala
nce a
s
of R
esourc
es
36
23
28
19
24
28
20
19
21
22
22
22
22
TO
TA
L R
EQ
UIR
EM
EN
TS
1317
351
1213
897
1327
776
1232
235
1093
473
1087
843
1150
102
1085
725
1087
929
1127
103
1162
377
1193
727
1221
666
RE
VE
NU
E m
inu
s E
XP
EN
DIT
UR
ES
2028
(125
150
)
(93
619
)
(143
931
)
29
241
43
187
(78
859
)
(15
578
)
19
924
15
736
11
516
7569
2967
(NO
T c
um
ula
tive)
E
xpenditure
lapse o
f 1
is c
alc
ula
ted o
n a
ll expenses e
xclu
din
g D
ebt S
erv
ice a
nd C
aptia
l Outa
y
Reven
ues r
efl
ect
the c
om
bin
ed
im
pact
of
ch
an
ges in
rate
s a
nd
or
levels
of
co
nsu
mp
tio
n
Estim
ate
d r
evenues fore
caste
d a
t 100
FO
RE
CA
ST
(
100
)
]
F-33
F-34
550
600
650
700
750
800
850
900
950
2014
2015
2016
2017
2018
2019
2020
2021
2022
2023
Dollars (millions)
Se
we
r S
ys
tem
Fo
rec
as
t F
Y2
01
4-F
Y2
02
3 w
ith
Ra
te I
nc
rea
se
s
Revenue
s
Expend
iture
s
F-35
SE
WE
R F
UN
DS
FO
RE
CA
ST
Fu
nd
4051
4052
4053
amp 4
055
Fo
recast
Assu
mp
tio
ns
20
14
20
15
20
16
20
17
20
18
20
19
20
20
20
21
20
22
20
23
RE
VE
NU
ES
Se
we
r C
ha
rge
s -
Re
tail
60
6
0
28
2
8
29
2
9
29
2
9
29
2
9
Se
we
r C
ha
rge
s -
Wh
ole
sa
le
90
9
0
28
2
8
29
3
0
30
3
0
30
3
0
Recla
ime
d -
Re
tail
59
5
6
27
2
8
27
2
8
27
2
8
27
2
7
Recla
ime
d -
Wh
ole
sa
le
20
2
0
20
2
0
20
2
0
20
2
0
20
2
0
Oth
er
reve
nu
es
00
0
0
00
0
0
00
0
0
00
0
0
00
0
0
EX
PE
ND
ITU
RE
S
Pe
rso
na
l S
erv
ice
s4
1
40
4
0
40
4
0
40
4
0
40
4
0
40
Op
era
tin
g E
xp
en
se
s2
0
23
1
8
17
1
7
18
1
7
19
2
1
21
Po
we
r0
0
50
5
0
50
5
0
50
5
0
50
5
0
50
Che
mic
als
70
7
0
70
7
0
70
7
0
70
7
0
70
7
0
Pro
jec
ted
Ec
on
om
ic C
on
dit
ion
s
In
dic
ato
rs
Con
su
me
r P
rice
In
de
x
c
ha
ng
e1
5
18
1
7
20
1
9
21
2
0
20
2
0
20
FL
Pe
r C
ap
ita
Pe
rso
na
l In
co
me
Gro
wth
20
2
2
22
1
8
14
1
5
17
1
6
16
1
6
R
eve
nu
e p
erc
en
tag
es r
efle
ct
the
co
mb
ine
d im
pa
ct
of
ch
an
ge
s in
ra
tes a
nd
or
leve
ls o
f co
nsu
mp
tio
n
F-36
SE
WE
R F
UN
DS
FO
RE
CA
ST
Fu
nd
4051
4052
4053
amp 4
055
(in
$ t
ho
us
an
ds
)A
ctu
al
Bu
dg
et
Es
tim
ate
dE
sti
ma
ted
Es
tim
ate
dE
sti
ma
ted
Es
tim
ate
dE
sti
ma
ted
Es
tim
ate
dE
sti
ma
ted
Es
tim
ate
dE
sti
ma
ted
Es
tim
ate
d
20
12
20
13
20
13
20
14
20
15
20
16
20
17
20
18
20
19
20
20
20
21
20
22
20
23
BE
GIN
NIN
G F
UN
D B
AL
AN
CE
53
19
65
47
58
45
49
87
60
37
52
76
37
98
17
43
50
12
48
44
76
53
16
74
57
54
45
63
35
13
69
87
40
77
08
03
84
94
28
RE
VE
NU
ES
Se
we
r C
ha
rge
s -
Re
tail
49
04
23
48
38
97
50
93
65
53
99
28
57
23
23
58
80
62
60
45
87
62
19
39
64
01
61
65
89
14
67
82
15
69
80
80
71
83
24
Se
we
r C
ha
rge
s -
Wh
ole
sa
le6
73
06
6
73
96
7
09
44
7
73
28
8
42
88
8
66
06
8
90
50
9
16
29
9
43
48
9
71
48
1
00
03
0
1
02
99
8
1
06
08
8
Recla
ime
d -
Re
tail
38
50
5
39
25
5
41
32
1
43
75
2
46
18
3
47
45
3
48
75
8
50
09
8
51
47
6
52
89
2
54
34
6
55
84
1
57
34
8
Recla
ime
d -
Wh
ole
sa
le3
17
1
31
60
3
32
7
33
27
3
32
7
33
27
3
32
7
33
27
3
32
7
33
27
3
32
7
33
27
3
32
7
Inte
rest
23
34
1
80
0
18
95
2
62
7
37
98
8
70
0
14
53
4
15
95
0
17
26
3
19
00
5
20
96
2
23
12
4
25
48
3
Oth
er
Re
ve
nu
es
1
36
84
4
73
7
49
86
4
98
6
49
86
4
98
6
49
86
4
98
6
49
86
4
98
6
49
86
4
98
6
49
86
TO
TA
L R
EV
EN
UE
S6
15
42
2
6
00
24
5
6
31
83
7
6
71
94
7
7
14
90
4
7
39
13
3
7
65
24
1
7
87
92
8
8
11
56
1
8
36
27
1
8
61
86
6
8
88
35
4
9
15
55
5
v
s p
rio
r ye
ar
7
11
6
6
3
4
3
3
3
3
3
3
TO
TA
L R
ES
OU
RC
ES
11
47
38
8
10
76
09
1
11
30
59
7
10
47
22
3
10
94
72
1
11
74
14
5
12
49
71
7
13
19
60
2
13
87
00
6
14
69
78
5
15
60
60
6
16
59
15
7
17
64
98
3
EX
PE
ND
ITU
RE
S
Pe
rso
na
l S
erv
ice
s1
29
23
3
1
49
25
7
1
49
25
7
1
55
37
6
1
61
59
1
1
68
05
5
1
74
77
7
1
81
76
8
1
89
03
9
1
96
60
1
2
04
46
5
2
12
64
3
2
21
14
9
OP
EB
12
99
2
13
52
4
13
52
4
14
07
9
14
64
2
15
22
8
15
83
7
16
47
0
17
12
9
17
81
4
18
52
7
19
26
8
20
03
9
Op
era
tin
g E
xp
en
se
s8
03
15
1
02
14
3
1
02
14
3
1
04
18
6
1
06
58
2
1
08
50
1
1
10
34
5
1
12
22
1
1
14
24
1
1
16
18
3
1
18
39
1
1
20
87
7
1
23
41
5
Po
we
r4
78
19
5
71
26
5
71
26
5
71
26
5
99
83
6
29
82
6
61
31
6
94
37
7
29
09
7
65
55
8
03
83
8
44
02
8
86
22
Che
mic
als
29
78
4
38
04
9
38
04
9
40
71
2
43
56
2
46
61
1
49
87
4
53
36
5
57
10
1
61
09
8
65
37
5
69
95
1
74
84
8
Cost
Allo
ca
tio
n5
59
70
4
30
31
4
30
31
4
38
91
4
49
01
4
57
09
4
64
86
4
72
76
4
81
27
4
89
45
4
98
75
5
09
23
5
19
92
Exp
en
ditu
re L
ap
se
-
-
(40
31
)
(4
15
4)
(43
13
)
(4
47
1)
(46
35
)
(4
80
5)
(49
85
)
(5
17
2)
(53
70
)
(5
58
1)
(58
01
)
Tra
nsfe
r fr
om
Wa
ter
-
(9
38
8)
(93
88
)
(9
59
3)
(91
98
)
(9
70
4)
(10
21
8)
(1
07
82
)
(11
39
7)
(1
23
08
)
(12
93
7)
(1
37
67
)
(14
59
3)
Deb
t S
erv
ice
14
93
99
14
79
88
14
38
71
14
38
61
14
39
48
14
37
47
14
36
75
14
63
45
14
64
38
14
63
07
14
61
55
14
60
64
14
60
08
-
Ca
pita
l O
utla
y1
43
11
6
2
45
34
8
2
21
74
0
1
21
92
0
9
80
10
1
13
01
2
1
25
77
0
1
32
86
0
1
24
89
0
1
25
02
2
1
24
94
0
1
24
95
0
1
24
85
0
TO
TA
L E
XP
EN
DIT
UR
ES
64
86
27
78
70
77
75
53
21
66
74
06
65
97
09
68
96
70
71
80
43
74
41
57
75
34
93
77
10
45
78
98
03
80
97
30
83
05
29
v
s p
rio
r ye
ar
0
30
-1
2
-1
5
4
4
1
2
2
3
3
TO
TA
L E
ND
ING
FU
ND
BA
LA
NC
E4
98
76
0
2
89
01
3
3
75
27
6
3
79
81
7
4
35
01
2
4
84
47
6
5
31
67
4
5
75
44
5
6
33
51
3
6
98
74
0
7
70
80
3
8
49
42
8
9
34
45
4
En
din
g b
ala
nce
as
of
Reso
urc
es
43
2
7
33
3
6
40
4
1
43
4
4
46
4
8
49
5
1
53
TO
TA
L R
EQ
UIR
EM
EN
TS
11
47
38
8
10
76
09
1
11
30
59
7
10
47
22
3
10
94
72
1
11
74
14
5
12
49
71
7
13
19
60
2
13
87
00
6
14
69
78
5
15
60
60
6
16
59
15
7
17
64
98
3
Deb
t S
erv
ice
Co
ve
rag
e1
74
16
81
88
20
62
13
22
02
21
22
52
30
23
52
39
24
4
RE
VE
NU
E m
inu
s E
XP
EN
DIT
UR
ES
(33
20
5)
(1
86
83
2)
(12
34
84
)
4
54
1
55
19
5
49
46
3
47
19
8
43
77
2
58
06
8
65
22
6
72
06
3
78
62
5
85
02
6
(NO
T c
um
ula
tive
)
O
pe
ratin
g E
xp
en
se
s n
et
of
Cost
Allo
ca
tio
n
Exp
en
ditu
re la
pse
of
1
is c
alc
ula
ted
on
all
exp
en
se
s e
xclu
din
g D
eb
t S
erv
ice
an
d C
ap
ita
l O
utla
y
Rev
en
ue
s r
efl
ec
t th
e c
om
bin
ed
im
pa
ct
of
ch
an
ge
s i
n r
ate
s a
nd
or
lev
els
of
co
ns
um
pti
on
FO
RE
CA
ST
(
10
0
)
F-37
F-38
500
600
700
800
900
1000
1100
1200
1300
1400
1500
2014
2015
2016
2017
2018
2019
2020
2021
2022
2023
Dollars (millions)
So
lid
Wa
ste
Fu
nd
s F
ore
ca
st
FY
20
14
- F
Y2
02
3
Reven
ue
s
Exp
en
dit
ure
s
No
te
Do
es n
ot
incl
ud
e C
ap
ita
l Pro
ject
s Fu
nd
loa
n a
ctiv
ity
F-39
SO
LID
WA
ST
E F
UN
DS
FO
RE
CA
ST
Fu
nd
4021 amp
4023
Fo
recast
Assu
mp
tio
ns
20
14
20
15
20
16
20
17
20
18
20
19
20
20
20
21
20
22
20
23
RE
VE
NU
ES
Tip
pin
g F
ee
s0
5
05
0
5
05
0
5
05
0
5
05
0
5
05
Ele
ctr
icity S
ale
s0
5
05
0
5
05
0
5
05
0
5
05
0
5
05
Ele
ctr
ica
l C
ap
acity
64
6
4
64
6
4
64
6
4
64
6
4
64
6
4
Recyclin
g R
eve
nu
e0
0
00
0
0
00
0
0
00
0
0
00
0
0
00
Oth
er
reve
nu
es
20
2
0
20
2
0
20
2
0
20
2
0
20
2
0
EX
PE
ND
ITU
RE
S
Pe
rso
na
l S
erv
ice
s4
1
40
4
0
40
4
0
40
4
0
40
4
0
40
Op
era
tin
g E
xp
en
se
s2
0
23
1
8
17
1
7
18
1
7
19
2
1
21
WT
E S
erv
ice
Fe
e1
9
19
1
9
20
2
0
19
1
9
20
2
0
20
La
nd
fill S
erv
ice
Fe
e1
9
19
1
9
20
2
0
19
1
9
20
2
0
20
HE
C3 C
osts
20
2
3
18
1
7
17
1
8
17
1
9
21
2
1
Gra
nts
amp A
ids
00
0
0
00
0
0
00
0
0
00
0
0
00
0
0
Cost
Allo
ca
tio
n1
9
19
1
9
20
2
0
19
1
9
20
2
0
20
Pro
jec
ted
Ec
on
om
ic C
on
dit
ion
s
In
dic
ato
rs
Con
su
me
r P
rice
In
de
x
c
ha
ng
e1
5
18
1
7
20
1
9
21
2
0
20
2
0
20
FL
Pe
r C
ap
ita
Pe
rso
na
l In
co
me
Gro
wth
20
2
2
22
1
8
14
1
5
17
1
6
16
1
6
F-40
SO
LID
WA
ST
E F
UN
DS
FO
RE
CA
ST
Fu
nd
4021 amp
4023
(in
$ t
ho
us
an
ds
)A
ctu
al
Bu
dg
et
Es
tim
ate
dE
sti
ma
ted
Es
tim
ate
dE
sti
ma
ted
Es
tim
ate
dE
sti
ma
ted
Es
tim
ate
dE
sti
ma
ted
Es
tim
ate
dE
sti
ma
ted
Es
tim
ate
d
20
12
20
13
20
13
20
14
20
15
20
16
20
17
20
18
20
19
20
20
20
21
20
22
20
23
BE
GIN
NIN
G F
UN
D B
AL
AN
CE
16
62
93
71
14
67
68
18
86
75
61
67
89
39
11
24
25
01
23
17
21
13
77
67
31
53
64
28
18
91
29
02
42
47
58
29
38
75
13
34
89
82
38
29
88
1
RE
VE
NU
ES
Tip
pin
g F
ee
s3
34
89
93
37
29
23
55
04
43
56
81
93
58
60
33
60
39
63
62
19
83
64
00
93
65
82
93
67
65
83
69
49
73
71
34
43
73
20
1
Ele
ctr
icity S
ale
s9
78
17
11
29
43
11
88
87
11
94
82
12
00
79
12
06
80
12
12
83
12
18
89
12
24
99
12
31
11
12
37
27
12
43
46
12
49
67
Ele
ctr
ica
l C
ap
acity
36
89
71
37
28
18
39
24
40
41
73
80
44
39
00
47
21
20
50
21
90
53
41
20
56
81
40
60
43
30
64
27
80
68
37
20
72
72
80
Recyclin
g R
eve
nu
e4
65
05
76
86
07
16
07
16
07
16
07
16
07
16
07
16
07
16
07
16
07
16
07
16
07
1
Inte
rest
74
78
18
86
19
85
11
75
31
12
42
24
63
44
13
30
46
09
35
67
39
72
74
38
81
63
10
04
69
11
48
96
Oth
er
reve
nu
es
31
33
11
07
21
12
81
15
01
17
31
19
71
22
11
24
51
27
01
29
61
32
21
34
81
37
5
Deb
t S
erv
ice
on
Lo
an
fro
m C
ap
ita
l F
un
d3
18
28
71
30
22
28
00
28
00
23
00
15
00
15
00
12
00
50
00
00
00
0
Lo
an
re
pa
ym
en
t fr
om
Ca
pita
l F
un
d (
Chille
r)0
01
50
00
15
78
91
50
00
15
00
01
50
00
15
00
00
00
00
00
00
00
0
Lo
an
re
pa
ym
en
t fr
om
Ca
pita
l F
un
d0
00
00
00
05
00
00
50
00
05
00
00
20
00
00
20
00
00
15
00
00
00
00
00
TO
TA
L R
EV
EN
UE
S8
45
46
48
49
64
98
94
36
79
30
45
51
00
88
70
10
52
39
91
10
07
94
12
74
92
81
32
17
48
13
25
71
01
23
15
59
12
87
29
91
34
77
91
v
s p
rio
r ye
ar
-1
5
4
8
4
5
16
4
0
-7
5
5
TO
TA
L R
ES
OU
RC
ES
25
08
40
11
99
64
17
27
81
12
32
60
93
95
21
33
11
92
28
41
19
24
78
46
72
81
13
56
32
13
03
93
75
04
68
41
70
31
04
63
62
81
51
77
67
2
EX
PE
ND
ITU
RE
S
Pe
rso
na
l S
erv
ice
s4
91
07
58
67
85
86
78
61
08
46
35
27
66
06
86
87
11
71
46
07
43
18
77
29
18
03
82
83
59
88
69
41
OP
EB
48
96
50
96
50
96
53
05
55
17
57
38
59
68
62
06
64
55
67
13
69
81
72
60
75
51
Op
era
tin
g E
xp
en
se
s
40
74
67
86
11
78
61
17
97
90
81
22
68
26
07
84
25
98
58
60
87
66
38
94
17
91
20
59
30
29
94
89
0
WT
E S
erv
ice
Fe
e2
23
49
13
12
93
53
12
93
53
18
88
13
24
93
93
31
11
33
37
73
63
44
49
03
51
03
63
57
70
53
64
85
93
72
15
63
79
60
0
La
nd
fill S
erv
ice
Fe
e8
89
03
11
29
71
11
29
71
11
51
18
11
73
05
11
95
34
12
19
24
12
43
63
12
67
26
12
91
34
13
17
16
13
43
51
13
70
38
HE
C3 C
osts
13
41
81
76
42
17
64
21
79
95
18
40
91
87
40
19
05
81
93
82
19
73
12
00
67
20
44
82
08
77
21
31
6
Gra
nts
amp A
ids
49
87
50
00
50
00
50
00
50
00
50
00
50
00
50
00
50
00
50
00
50
00
50
00
50
00
Cost
Allo
ca
tio
ns
29
02
23
27
77
32
77
73
32
69
33
86
73
44
43
35
13
23
58
00
36
55
13
72
82
38
02
83
87
89
39
56
4
Cap
ita
l O
utla
y1
67
07
64
00
89
43
09
71
04
05
06
92
58
10
52
49
83
52
71
02
82
34
43
08
78
75
96
33
59
00
94
58
89
05
77
70
Inte
rfu
nd
Lo
an
to
Ca
pita
l F
un
d0
01
00
00
01
75
00
04
50
00
00
00
00
00
00
00
00
00
00
0
Exp
en
ditu
re L
ap
se
0
0(6
23
7)
(63
64
)(6
49
8)
(66
32
)(6
77
8)
(69
26
)(7
07
5)
(72
26
)(7
38
6)
(75
51
)(7
71
9)
TO
TA
L E
XP
EN
DIT
UR
ES
62
16
45
11
24
60
41
10
21
83
14
85
14
59
01
39
99
06
44
69
42
03
99
20
06
67
88
28
08
11
71
78
21
32
88
06
40
08
21
95
1
v
s p
rio
r ye
ar
-3
72
3
5
-39
1
4
-2
-1
4
3
1
-2
2
EN
DIN
G F
UN
D B
AL
AN
CE
18
86
75
68
71
81
31
67
89
39
11
24
25
01
23
17
21
13
77
67
31
53
64
28
18
91
29
02
42
47
58
29
38
75
13
34
89
82
38
29
88
14
35
57
22
En
din
g b
ala
nce
as
of
Reso
urc
es
75
4
4
60
4
3
58
6
0
62
6
7
75
7
8
80
8
3
84
TO
TA
L R
EQ
UIR
EM
EN
TS
25
08
40
11
99
64
17
27
81
12
32
60
93
95
21
33
11
92
28
41
19
24
78
46
72
81
13
56
32
13
03
93
75
04
68
41
70
31
04
63
62
81
51
77
67
2
RE
VE
NU
E m
inu
s E
XP
EN
DIT
UR
ES
22
38
19
(27
49
55
)(2
07
81
6)
(55
46
90
)1
07
47
11
45
95
21
58
75
53
54
86
25
33
46
85
13
99
34
10
23
14
80
89
95
25
84
0
(NO
T c
um
ula
tive
)
no
te
no
n-r
ec
urr
ing
ex
p amp
re
v (
loa
n)
(31
8)
82
12
91
56
18
94
32
20
0(6
78
00
)(6
73
00
)(6
65
00
)(2
01
50
0)
(20
12
00
)(1
50
50
0)
00
00
00
net
recu
rrin
g r
ev-
exp
223
501
(192
826
)(5
1628
)(1
22
490
)39
671
78
652
92
255
153
362
332
268
363
493
410
231
480
899
525
840
O
pe
ratin
g E
xp
en
se
s n
et
of
Inte
rgo
ve
rnm
en
tal C
ha
rge
s
Exp
en
ditu
re la
pse
of
1
is c
alc
ula
ted
on
Pe
rso
na
l S
erv
ice
s
Op
era
tin
g E
xp
en
se
s
Cost
Allo
ca
tio
n a
nd
Gra
nts
amp A
ids
Exclu
de
s in
terf
un
d lo
an
s
Estim
ate
d r
eve
nu
es f
ore
ca
ste
d a
t 1
00
FO
RE
CA
ST
(
10
0
)
F-41
F-42
GLOSSARY
Pinellas County Budget Forecast FY2014-2023 G-1
AD VALOREM TAX - A tax levied in proportion to the value of the property against which it is levied ADOPTED BUDGET - The financial plan for the fiscal year beginning October 1 It is required by law to be approved by the Board of County Commissioners at the second of two public hearings AMENDMENT ONE ndash Approved by the voters of Florida on January 29 2008 and made the following changes which reduced taxable property values and revenues available to local government o ldquoDoubledrdquo the existing $25000 homestead exemption (except for school taxes)
o Allows for up to $500000 of the Save Our Homes exemption to be applied to another property (portability)
o Imposed a 10 cap on assessments for non-homestead property (school taxes exempt)
o Instituted a new tangible personal property exemption of $25000 AMERICAN RECOVERY amp REINVESTMENT ACT OF 2009 - In February 2009 Congress passed the American Recovery and Reinvestment Act (ARRA) of 2009 at the urging of President Obama who signed it into law on February 17th A direct response to the economic crisis the Recovery Act has three immediate goals (1) Create new jobs as well as save existing ones (2) Spur economic activity and invest in long-term economic growth and (3) Foster unprecedented levels of accountability and transparency in government spending
AMT - Alternative Minimum Tax An income tax imposed by the United States federal government on individuals corporations estates and trusts AMT is imposed at a nearly flat rate on an adjusted amount of taxable income above a certain threshold (exemption)
APPROPRIATION - The legal authorization granted by a legislative body to make expenditures and to incur obligations for specific purposes An appropriation is usually limited in the amount and as to the time when it may be expended It is the act of appropriation that funds the budget ARM - Adjustablendashrate mortgage ASSESSED VALUE - A valuation set upon real estate or other property by a government as basis for levying taxes Taxable valuation is calculated from an assessed valuation The assessed value is set by the Property Appraiser BEGINNING FUND BALANCE - The Ending Fund Balance of the previous period (See Ending Fund Balance definition) BOARD OF COUNTY COMMISSIONERS (BCC) - The Board of County Commissioners is the seven (7) member legislative and governing body for Pinellas County BOND - Written evidence of the issuers obligation to repay a specified principal amount on a certain date (maturity date) together with interest at a stated rate or according to a formula for determining that rate
GLOSSARY
Pinellas County Budget Forecast FY2014-2023 G-2
BUDGET - A financial plan containing an estimate of proposed revenues and expenditures for a given period (typically a fiscal year) CAPITAL BUDGET - The financial plan of capital project expenditures for the fiscal year beginning October 1 It incorporates anticipated revenues and appropriations included in the first year of the six year Capital Improvements Program (CIP) and any anticipated unspent appropriation balances from the previous fiscal year The Capital Budget is adopted by the Board of County Commissioners as a part of the annual County Budget CAPITAL IMPROVEMENT PROGRAM (CIP) - A proposed plan covering each year of a fixed period of years for financing long-term work projects that lead to the physical development of the County CAPITAL OUTLAY OR CAPITAL EQUIPMENT - Items such as office furniture fleet equipment data processing equipment and other operating equipment with a unit cost of $1000 or more CAPITAL PROJECT - An improvement or acquisition of major facilities roads bridges buildings or land with a useful life of at least five years CHARGE FOR SERVICES - Charges for a specific governmental service which covers the cost of providing that service to the user (eg building permits animal licenses park fees) CONSTITUTIONAL OFFICERS - They are elected to administer a specific function of County government and are directly accountable to the public for its proper operation Constitutional Officers include the Clerk of the Circuit Court the Property Appraiser the Sheriff the Supervisor of Elections and the Tax Collector COST CENTER - A budgeting entity which encompasses object level accounts (appropriations) that are used to monitor organization or program level expenditures DEBT SERVICE - The dollars required to repay funds borrowed by means of an issuance of bonds or a bank loan The components of the debt service payment typically include an amount to retire a portion of the principal amount borrowed (ie amortization) as well as interest on the remaining outstanding unpaid principal balance DEBT SERVICE FUND - An account into which the issuer makes periodic deposits to assure the timely availability of sufficient monies for the payment of debt service requirements (ie principal and interest) The revenues to be deposited into the debt service fund and payments from there are determined by terms of the bond covenants DEBT SERVICE COVERAGE RATIO ndash A ratio indicating the amount of cash available to meet annual principal and interest payments on debt The general calculation is net operating income divided by the total debt service amount DEPENDENT SPECIAL DISTRICT - A special district whose governing body or whose budget is established by the governing body of the County or municipality to which it is dependent
GLOSSARY
Pinellas County Budget Forecast FY2014-2023 G-3
DESIGNATED FUNDS ndash Funds that are set apart for a specific purpose to fund on-going or one-time expenditure Examples are bond proceeds reserves for fund balance reserve for contingencies (ldquoRainy Day Fundrdquo) and ldquopay as you gordquo reserves for future facility renewal amp replacement found mostly in the Enterprise Funds ELECTED OFFICIALS - Elected Officials include the Board of County Commissioners the Judiciary the State Attorney the Public Defender and five Constitutional Officers the Clerk of the Circuit Court the Property Appraiser the Sheriff the Supervisor of Elections and the Tax Collector ENDING FUND BALANCE - Funds carried over at the end of the fiscal year Within the fund the revenue on hand at the beginning of the fiscal year plus revenues received during the year less expenses equals ending fund balance The Ending Fund Balance becomes the Beginning Fund balance in the next fiscal year ENTERPRISE FUND - A fund used to account for operations that are financed and operated in a manner similar to private business enterprises--where the intent of the governing body is that the costs (expenses including depreciation) of providing goods or services to the general public on a continuing basis be financed or recovered primarily through user charges FANNIE MAE ndashFederal National Mortgage Association (FNMA) ndash A government-sponsored enterprise (GSE) that was created in 1938 to expand the flow of mortgage money by creating a secondary mortgage market Fannie Mae is a publicly traded company which operates under a congressional charter that directs Fannie Mae to channel its efforts into increasing the availability and affordability of homeownership for low- moderate- and middle-income Americans Fannie Mae purchases and guarantees mortgages that meet its funding criteria Through this process it secures mortgages to form mortgage-backed securities (MBS) The market for Fannie Maes MBS is extremely large and liquid FIRE PROTECTION DISTRICT - A designated area in the County where ad valorem revenues are collected from property owners and distributed to local cities and other agencies to finance fire suppression services to the area FISCAL YEAR - A twelve-month period of time to which the annual budget applies At the end of this time a governmental unit determines its financial position and the results of its operations The Pinellas County fiscal year begins on October 1 and ends on September 30 of the subsequent calendar year FORECLOSURE - A legal process by which a mortgagees right to redeem a mortgage is taken away usually because of failing to make payments FREDDIE MAC ndash Federal Home Loan Mortgage Corp (FHLMC) - A stockholder-owned government-sponsored enterprise (GSE) chartered by Congress in 1970 to keep money flowing to mortgage lenders in support of homeownership and rental housing for middle income Americans The FHLMC purchases guarantees and securitizes mortgages to form mortgage-backed securities The mortgage-backed securities that it issues tend to be very liquid and carry a credit rating close to that of US Treasuries
GLOSSARY
Pinellas County Budget Forecast FY2014-2023 G-4
FUND - An accounting entity with a complete set of self balancing accounts established to account for finances of a specific function or activity The resources and uses are segregated from other resources and uses for the purpose of carrying on specific activities or attaining specific objectives in accordance with special regulations restrictions or limitations FUND ACCOUNTING ndash Accounting method generally used by governmental agencies Usually consists of eleven classifications into which all individual funds can be categorized Governmental fund types include the general fund special revenue funds debt service funds capital projects funds and permanent funds Proprietary fund types include enterprise funds and internal service funds Fiduciary fund types include pension (and other employee benefit) trust funds investment trust funds private-purpose trust funds and agency funds FUNDING SOURCES - The type or origination of funds to finance ongoing or one-time expenditures Examples are ad valorem taxes user fees licenses permits and grants GENERAL FUND - This fund accounts for all financial transactions except those required to be accounted for in other funds The funds resources ad valorem taxes and other revenues provide services or benefits to all residents of Pinellas County GROSS DOMESTIC PRODUCT - Gross Domestic Product (GDP) is the generally accepted measure of the size of the national economy GDP measures the total market value of all final goods and services produced in a country in a given year GROSS METRO PRODUCT - Similar to Gross Domestic Product Gross Metropolitan Product (GMP) is defined as the market value of all final goods and services produced within a metropolitan area in a given period of time INDEPENDENT AGENCIES - A variety of agencies councils and other organizational entities responsible for administering public policy functions independently of the Constitutional Officers and County Administrator These entities are subject to Board of County Commissioner appropriation but operate under the purview of a legislativepolicy making body other than the Board of County Commissioners INFRASTRUCTURE - Infrastructure is a permanent installation-such as a building road or water transmission system - that provides public services INTERGOVERNMENTAL REVENUE - Revenue collected by one government and distributed (usually through some predetermined formula) to another level of government INTERNAL SERVICE FUND - A fund established to finance and account for services and commodities furnished by one department to other departments on a cost reimbursement basis MANDATE - A requirement imposed by a legal act of the federal state or local government
GLOSSARY
Pinellas County Budget Forecast FY2014-2023 G-5
METROPOLITAN STATISTICAL AREA (MSA) ndash MSA is a formal definition of a metropolitan area established by the United States Office of Management and Budget division MSArsquos are used to group counties and cities into specific geographic areas for the purposes of a population census and the compilation of related statistical data
MILLAGE RATE - A rate applied to a propertys taxable value to determine property tax due As used with ad valorem (property) taxes the rate expresses the dollars of tax per one thousand dollars of taxable value (ie a 5 mill tax on $1000 equals $500) MISSION STATEMENT - A broad statement of purpose which is derived from organization andor community values and goals MORTGAGE BACKED SECURITIES (MBS) - A type of security whose cash flows come from debt such as mortgages home-equity loans and subprime mortgages This is a type of security that typically focuses on residential instead of commercial debt MBS are sold and purchased in the open market Holders of a MBS receive interest and principal payments that come from the holders of the debt MUNICIPAL SERVICES TAXING UNIT (MSTU) - A special district authorized by the State Constitution Article VII and Florida Statutes 12501 The MSTU is the legal and financial mechanism for providing specific services andor improvements to a defined geographical area An MSTU may levy ad valorem taxes without a referendum An MSTU may also use assessments service charges or other revenue to provide its sources of income In Pinellas County the MSTU is all the unincorporated areas of the County NET EXPORTS - Exports minus imports OPERATING BUDGET - The operating budget includes appropriations for recurring and certain one-time expenditures that will be consumed in a fixed period of time to provide for day-to-day operations (eg salaries and related benefits operating supplies contractual and maintenance services professional services and software) PERSONAL SERVICES - Expenses for salaries wages and related employee benefits provided for all persons whether full-time part-time temporary or seasonal PREDATORY LENDING - The practice of unscrupulous lenders to enter into unsafe or unsound secured loans for inappropriate purposes PRO-RATE - A budgetary convention (used in Community Development and Fire Administration) that allows for centralized departmental services to be budgeted for in one cost center with the actual costs being allocated to the specific users of the service in other cost centers This is technically accomplished by appropriating a negative amount for the total central departmental service An allocation of the central services total appropriation is then budgeted in each of the user cost centers thereby reflecting the total cost to that particular function
RECESSION - A significant decline in activity across the economy lasting longer than a few months that is visible in industrial production employment real income and wholesale-retail trade The
GLOSSARY
Pinellas County Budget Forecast FY2014-2023 G-6
technical indicator of a recession is two consecutive quarters of negative economic growth as measured by a countrys gross domestic product (GDP)
RESERVES - Included in this category are funds required to meet both anticipated and unanticipated needs the balance of anticipated earmarked revenues not required for operation in the budget year those required to be set aside by bond covenants and accumulated funds set aside to finance capital construction on a pay-as-you-go basis REVENUE - The amount estimated to be received from taxes fees permits or other sources during a fiscal year REVISED BUDGET - The current year adopted budget adjusted to reflect all budget amendments approved by the Board of County Commissioners through January 31 ROLLED-BACK RATE - The millage rate which when applied to the total amount of taxable value of property (excluding new construction) produces the same amount of tax dollars as the previous year Calculation of the ldquorolled-back raterdquo is governed by Florida Statutes SAVE OUR HOMES AMENDMENT - The amendment was intended to protect homeowners from escalating property tax bills resulting from growth in market value a situation that was perceived to be forcing some people particularly residents on fixed incomes to sell their homes SHADOW BANKING SYSTEM - All financial intermediaries involved in facilitating the creation of credit across the global financial system but whose members are not subject to regulatory oversight Shadow Banking System also refers to unregulated activities by regulated institutions Examples of intermediaries not subject to regulation include hedge funds unlisted derivatives and other unlisted instruments SPECIAL ASSESSMENT FUND - A fund used to account for the financing of public improvements or services deemed to benefit the properties against which special assessments are levied SPECIAL REVENUE FUND - A fund used to account for the proceeds of specific revenue sources (other than expendable trusts or major capital projects) that are legally restricted to expenditures for specified purposes STATUTE - A written law enacted by a duly organized and constituted legislative body SUPPORT FUNDING - Support funding is provided by the Board of County Commissioners for those activities for which costs do not apply solely to any specific county departments function but are either applicable to the operation of county government as a whole or are provided for the public good TAXABLE VALUE - The assessed value of property minus any authorized exemptions (ie agricultural homestead exemption) This value is used to determine the amount of property (ad valorem) tax to be levied
GLOSSARY
Pinellas County Budget Forecast FY2014-2023 G-7
TAXES - Compulsory charges levied by a government for the purpose of financing services performed for the common benefit TOXIC ASSETS ndashThe term toxic asset was coined in the financial crisis of 200809 in regards to mortgage-backed securities collateralized debt obligations and credit default swaps all of which could not be sold after they exposed their holders to massive losses A toxic asset is one that becomes illiquid when its secondary market disappears Toxic assets cannot be sold as they are often guaranteed to lose money Many hedge funds banks and financial institutions invested heavily in mortgage-backed securities and collateralized debt obligations often using borrowed money and thus increasing their exposure This strategy proved profitable during the housing boom but resulted in enormous losses when house prices began to decline and mortgages began to default These ldquotoxic assetsrdquo were purchased by banks around the world contributing to a general sense of panic as mortgage defaults rose and liquidity fell TRANSFERS - Because of legal or other restrictions monies collected in one fund may need to be expended in other funds This is accomplished through Transfer-In (a source of funds) for the recipient fund and an equal Transfer-Out (a use of funds) for the donor fund When this movement occurs between different funds it is known as the Interfund Transfer UNINCORPORATED AREA - That portion of the County which is not within the boundaries of any municipality
GLOSSARY
Pinellas County Budget Forecast FY2014-2023 G-8
GLOSSARY
Pinellas County Budget Forecast FY2014-2023 G-1
AD VALOREM TAX - A tax levied in proportion to the value of the property against which it is levied ADOPTED BUDGET - The financial plan for the fiscal year beginning October 1 It is required by law to be approved by the Board of County Commissioners at the second of two public hearings AMENDMENT ONE ndash Approved by the voters of Florida on January 29 2008 and made the following changes which reduced taxable property values and revenues available to local government o ldquoDoubledrdquo the existing $25000 homestead exemption (except for school taxes)
o Allows for up to $500000 of the Save Our Homes exemption to be applied to another property (portability)
o Imposed a 10 cap on assessments for non-homestead property (school taxes exempt)
o Instituted a new tangible personal property exemption of $25000 AMERICAN RECOVERY amp REINVESTMENT ACT OF 2009 - In February 2009 Congress passed the American Recovery and Reinvestment Act (ARRA) of 2009 at the urging of President Obama who signed it into law on February 17th A direct response to the economic crisis the Recovery Act has three immediate goals (1) Create new jobs as well as save existing ones (2) Spur economic activity and invest in long-term economic growth and (3) Foster unprecedented levels of accountability and transparency in government spending
AMT - Alternative Minimum Tax An income tax imposed by the United States federal government on individuals corporations estates and trusts AMT is imposed at a nearly flat rate on an adjusted amount of taxable income above a certain threshold (exemption)
APPROPRIATION - The legal authorization granted by a legislative body to make expenditures and to incur obligations for specific purposes An appropriation is usually limited in the amount and as to the time when it may be expended It is the act of appropriation that funds the budget ARM - Adjustablendashrate mortgage ASSESSED VALUE - A valuation set upon real estate or other property by a government as basis for levying taxes Taxable valuation is calculated from an assessed valuation The assessed value is set by the Property Appraiser BEGINNING FUND BALANCE - The Ending Fund Balance of the previous period (See Ending Fund Balance definition) BOARD OF COUNTY COMMISSIONERS (BCC) - The Board of County Commissioners is the seven (7) member legislative and governing body for Pinellas County BOND - Written evidence of the issuers obligation to repay a specified principal amount on a certain date (maturity date) together with interest at a stated rate or according to a formula for determining that rate
GLOSSARY
Pinellas County Budget Forecast FY2014-2023 G-2
BUDGET - A financial plan containing an estimate of proposed revenues and expenditures for a given period (typically a fiscal year) CAPITAL BUDGET - The financial plan of capital project expenditures for the fiscal year beginning October 1 It incorporates anticipated revenues and appropriations included in the first year of the six year Capital Improvements Program (CIP) and any anticipated unspent appropriation balances from the previous fiscal year The Capital Budget is adopted by the Board of County Commissioners as a part of the annual County Budget CAPITAL IMPROVEMENT PROGRAM (CIP) - A proposed plan covering each year of a fixed period of years for financing long-term work projects that lead to the physical development of the County CAPITAL OUTLAY OR CAPITAL EQUIPMENT - Items such as office furniture fleet equipment data processing equipment and other operating equipment with a unit cost of $1000 or more CAPITAL PROJECT - An improvement or acquisition of major facilities roads bridges buildings or land with a useful life of at least five years CHARGE FOR SERVICES - Charges for a specific governmental service which covers the cost of providing that service to the user (eg building permits animal licenses park fees) CONSTITUTIONAL OFFICERS - They are elected to administer a specific function of County government and are directly accountable to the public for its proper operation Constitutional Officers include the Clerk of the Circuit Court the Property Appraiser the Sheriff the Supervisor of Elections and the Tax Collector COST CENTER - A budgeting entity which encompasses object level accounts (appropriations) that are used to monitor organization or program level expenditures DEBT SERVICE - The dollars required to repay funds borrowed by means of an issuance of bonds or a bank loan The components of the debt service payment typically include an amount to retire a portion of the principal amount borrowed (ie amortization) as well as interest on the remaining outstanding unpaid principal balance DEBT SERVICE FUND - An account into which the issuer makes periodic deposits to assure the timely availability of sufficient monies for the payment of debt service requirements (ie principal and interest) The revenues to be deposited into the debt service fund and payments from there are determined by terms of the bond covenants DEBT SERVICE COVERAGE RATIO ndash A ratio indicating the amount of cash available to meet annual principal and interest payments on debt The general calculation is net operating income divided by the total debt service amount DEPENDENT SPECIAL DISTRICT - A special district whose governing body or whose budget is established by the governing body of the County or municipality to which it is dependent
GLOSSARY
Pinellas County Budget Forecast FY2014-2023 G-3
DESIGNATED FUNDS ndash Funds that are set apart for a specific purpose to fund on-going or one-time expenditure Examples are bond proceeds reserves for fund balance reserve for contingencies (ldquoRainy Day Fundrdquo) and ldquopay as you gordquo reserves for future facility renewal amp replacement found mostly in the Enterprise Funds ELECTED OFFICIALS - Elected Officials include the Board of County Commissioners the Judiciary the State Attorney the Public Defender and five Constitutional Officers the Clerk of the Circuit Court the Property Appraiser the Sheriff the Supervisor of Elections and the Tax Collector ENDING FUND BALANCE - Funds carried over at the end of the fiscal year Within the fund the revenue on hand at the beginning of the fiscal year plus revenues received during the year less expenses equals ending fund balance The Ending Fund Balance becomes the Beginning Fund balance in the next fiscal year ENTERPRISE FUND - A fund used to account for operations that are financed and operated in a manner similar to private business enterprises--where the intent of the governing body is that the costs (expenses including depreciation) of providing goods or services to the general public on a continuing basis be financed or recovered primarily through user charges FANNIE MAE ndashFederal National Mortgage Association (FNMA) ndash A government-sponsored enterprise (GSE) that was created in 1938 to expand the flow of mortgage money by creating a secondary mortgage market Fannie Mae is a publicly traded company which operates under a congressional charter that directs Fannie Mae to channel its efforts into increasing the availability and affordability of homeownership for low- moderate- and middle-income Americans Fannie Mae purchases and guarantees mortgages that meet its funding criteria Through this process it secures mortgages to form mortgage-backed securities (MBS) The market for Fannie Maes MBS is extremely large and liquid FIRE PROTECTION DISTRICT - A designated area in the County where ad valorem revenues are collected from property owners and distributed to local cities and other agencies to finance fire suppression services to the area FISCAL YEAR - A twelve-month period of time to which the annual budget applies At the end of this time a governmental unit determines its financial position and the results of its operations The Pinellas County fiscal year begins on October 1 and ends on September 30 of the subsequent calendar year FORECLOSURE - A legal process by which a mortgagees right to redeem a mortgage is taken away usually because of failing to make payments FREDDIE MAC ndash Federal Home Loan Mortgage Corp (FHLMC) - A stockholder-owned government-sponsored enterprise (GSE) chartered by Congress in 1970 to keep money flowing to mortgage lenders in support of homeownership and rental housing for middle income Americans The FHLMC purchases guarantees and securitizes mortgages to form mortgage-backed securities The mortgage-backed securities that it issues tend to be very liquid and carry a credit rating close to that of US Treasuries
GLOSSARY
Pinellas County Budget Forecast FY2014-2023 G-4
FUND - An accounting entity with a complete set of self balancing accounts established to account for finances of a specific function or activity The resources and uses are segregated from other resources and uses for the purpose of carrying on specific activities or attaining specific objectives in accordance with special regulations restrictions or limitations FUND ACCOUNTING ndash Accounting method generally used by governmental agencies Usually consists of eleven classifications into which all individual funds can be categorized Governmental fund types include the general fund special revenue funds debt service funds capital projects funds and permanent funds Proprietary fund types include enterprise funds and internal service funds Fiduciary fund types include pension (and other employee benefit) trust funds investment trust funds private-purpose trust funds and agency funds FUNDING SOURCES - The type or origination of funds to finance ongoing or one-time expenditures Examples are ad valorem taxes user fees licenses permits and grants GENERAL FUND - This fund accounts for all financial transactions except those required to be accounted for in other funds The funds resources ad valorem taxes and other revenues provide services or benefits to all residents of Pinellas County GROSS DOMESTIC PRODUCT - Gross Domestic Product (GDP) is the generally accepted measure of the size of the national economy GDP measures the total market value of all final goods and services produced in a country in a given year GROSS METRO PRODUCT - Similar to Gross Domestic Product Gross Metropolitan Product (GMP) is defined as the market value of all final goods and services produced within a metropolitan area in a given period of time INDEPENDENT AGENCIES - A variety of agencies councils and other organizational entities responsible for administering public policy functions independently of the Constitutional Officers and County Administrator These entities are subject to Board of County Commissioner appropriation but operate under the purview of a legislativepolicy making body other than the Board of County Commissioners INFRASTRUCTURE - Infrastructure is a permanent installation-such as a building road or water transmission system - that provides public services INTERGOVERNMENTAL REVENUE - Revenue collected by one government and distributed (usually through some predetermined formula) to another level of government INTERNAL SERVICE FUND - A fund established to finance and account for services and commodities furnished by one department to other departments on a cost reimbursement basis MANDATE - A requirement imposed by a legal act of the federal state or local government
GLOSSARY
Pinellas County Budget Forecast FY2014-2023 G-5
METROPOLITAN STATISTICAL AREA (MSA) ndash MSA is a formal definition of a metropolitan area established by the United States Office of Management and Budget division MSArsquos are used to group counties and cities into specific geographic areas for the purposes of a population census and the compilation of related statistical data
MILLAGE RATE - A rate applied to a propertys taxable value to determine property tax due As used with ad valorem (property) taxes the rate expresses the dollars of tax per one thousand dollars of taxable value (ie a 5 mill tax on $1000 equals $500) MISSION STATEMENT - A broad statement of purpose which is derived from organization andor community values and goals MORTGAGE BACKED SECURITIES (MBS) - A type of security whose cash flows come from debt such as mortgages home-equity loans and subprime mortgages This is a type of security that typically focuses on residential instead of commercial debt MBS are sold and purchased in the open market Holders of a MBS receive interest and principal payments that come from the holders of the debt MUNICIPAL SERVICES TAXING UNIT (MSTU) - A special district authorized by the State Constitution Article VII and Florida Statutes 12501 The MSTU is the legal and financial mechanism for providing specific services andor improvements to a defined geographical area An MSTU may levy ad valorem taxes without a referendum An MSTU may also use assessments service charges or other revenue to provide its sources of income In Pinellas County the MSTU is all the unincorporated areas of the County NET EXPORTS - Exports minus imports OPERATING BUDGET - The operating budget includes appropriations for recurring and certain one-time expenditures that will be consumed in a fixed period of time to provide for day-to-day operations (eg salaries and related benefits operating supplies contractual and maintenance services professional services and software) PERSONAL SERVICES - Expenses for salaries wages and related employee benefits provided for all persons whether full-time part-time temporary or seasonal PREDATORY LENDING - The practice of unscrupulous lenders to enter into unsafe or unsound secured loans for inappropriate purposes PRO-RATE - A budgetary convention (used in Community Development and Fire Administration) that allows for centralized departmental services to be budgeted for in one cost center with the actual costs being allocated to the specific users of the service in other cost centers This is technically accomplished by appropriating a negative amount for the total central departmental service An allocation of the central services total appropriation is then budgeted in each of the user cost centers thereby reflecting the total cost to that particular function
RECESSION - A significant decline in activity across the economy lasting longer than a few months that is visible in industrial production employment real income and wholesale-retail trade The
GLOSSARY
Pinellas County Budget Forecast FY2014-2023 G-6
technical indicator of a recession is two consecutive quarters of negative economic growth as measured by a countrys gross domestic product (GDP)
RESERVES - Included in this category are funds required to meet both anticipated and unanticipated needs the balance of anticipated earmarked revenues not required for operation in the budget year those required to be set aside by bond covenants and accumulated funds set aside to finance capital construction on a pay-as-you-go basis REVENUE - The amount estimated to be received from taxes fees permits or other sources during a fiscal year REVISED BUDGET - The current year adopted budget adjusted to reflect all budget amendments approved by the Board of County Commissioners through January 31 ROLLED-BACK RATE - The millage rate which when applied to the total amount of taxable value of property (excluding new construction) produces the same amount of tax dollars as the previous year Calculation of the ldquorolled-back raterdquo is governed by Florida Statutes SAVE OUR HOMES AMENDMENT - The amendment was intended to protect homeowners from escalating property tax bills resulting from growth in market value a situation that was perceived to be forcing some people particularly residents on fixed incomes to sell their homes SHADOW BANKING SYSTEM - All financial intermediaries involved in facilitating the creation of credit across the global financial system but whose members are not subject to regulatory oversight Shadow Banking System also refers to unregulated activities by regulated institutions Examples of intermediaries not subject to regulation include hedge funds unlisted derivatives and other unlisted instruments SPECIAL ASSESSMENT FUND - A fund used to account for the financing of public improvements or services deemed to benefit the properties against which special assessments are levied SPECIAL REVENUE FUND - A fund used to account for the proceeds of specific revenue sources (other than expendable trusts or major capital projects) that are legally restricted to expenditures for specified purposes STATUTE - A written law enacted by a duly organized and constituted legislative body SUPPORT FUNDING - Support funding is provided by the Board of County Commissioners for those activities for which costs do not apply solely to any specific county departments function but are either applicable to the operation of county government as a whole or are provided for the public good TAXABLE VALUE - The assessed value of property minus any authorized exemptions (ie agricultural homestead exemption) This value is used to determine the amount of property (ad valorem) tax to be levied
GLOSSARY
Pinellas County Budget Forecast FY2014-2023 G-7
TAXES - Compulsory charges levied by a government for the purpose of financing services performed for the common benefit TOXIC ASSETS ndashThe term toxic asset was coined in the financial crisis of 200809 in regards to mortgage-backed securities collateralized debt obligations and credit default swaps all of which could not be sold after they exposed their holders to massive losses A toxic asset is one that becomes illiquid when its secondary market disappears Toxic assets cannot be sold as they are often guaranteed to lose money Many hedge funds banks and financial institutions invested heavily in mortgage-backed securities and collateralized debt obligations often using borrowed money and thus increasing their exposure This strategy proved profitable during the housing boom but resulted in enormous losses when house prices began to decline and mortgages began to default These ldquotoxic assetsrdquo were purchased by banks around the world contributing to a general sense of panic as mortgage defaults rose and liquidity fell TRANSFERS - Because of legal or other restrictions monies collected in one fund may need to be expended in other funds This is accomplished through Transfer-In (a source of funds) for the recipient fund and an equal Transfer-Out (a use of funds) for the donor fund When this movement occurs between different funds it is known as the Interfund Transfer UNINCORPORATED AREA - That portion of the County which is not within the boundaries of any municipality
GLOSSARY
Pinellas County Budget Forecast FY2014-2023 G-8
- FY14 Forecast Document
-
- Fund Forecasts Section FY14 Forecastpdf
-
- 01 General Fund FY14 Forecast
- 12_Tourist Dev Fund FY14 Forecast
- 13_Transportation Trust Fund FY14 Forecast
- 14_Capital Projects Fund FY14 Forecast
- 15 Emergency Medical Services Fund FY14 Forecast
- 16 Fire Districts Fund FY14 Forecast
- 17 Airport Fund FY14 Forecast
- 18_Water Funds FY14 Forecast
- 19_Sewer Funds FY14 Forecast
- 20_Solid Waste Funds FY14 Forecast
-
- Pro Formas Section FY14 Forecastpdf
-
- combined pro formas
-
- 01 General Fund FY14 pro forma
- 13 Transportation Trust Fund FY14 pro forma
- 04 Capital Projects Fund FY14 pro forma
- 05 EMS Fund FY14 pro forma
- 06 Fire Districts Fund FY14 pro forma
- 20 Solid Waste Funds FY14 pro forma
-
- 07 Airport Fund FY14 pro forma
- Water_Funds_FY14_pro forma
- Sewer_Funds_FY14_pro forma
- 02 TDC Fund FY14 pro forma
-

TABLE OF CONTENTS
Pinellas County Budget Forecast FY2014-2023
I Introduction A-1 II Executive Summary B-1 III Economic Overview C-1 National Economy C-1 State Economy C-8 Local Economy C-18 IV Key Assumptions D-1 Revenues D-2 Expenditures D-13 V Fund Forecasts E-1 General Fund E-3 Tourist Development Fund E-21 Transportation Trust Fund E-29 Capital Projects Fund E-35 Emergency Medical Services Fund E-41 Fire Districts Fund E-47 Airport Fund E-53 Utilities Water Funds E-61 Utilities Sewer Funds E-65 Utilities Solid Waste Funds E-71 VI Pro-Formas F-1 General Fund F-3 Tourist Development Fund F-7 Transportation Trust Fund F-11 Capital Projects Fund F-15 Emergency Medical Services Fund F-19 Fire Districts Fund F-23 Airport Fund F-27 Utilities Water Funds F-31 Utilities Sewer Funds F-35 Utilities Solid Waste Funds F-39 VII Glossary G-1
Pinellas County Budget Forecast FY2014-2023
INTRODUCTION
Pinellas County Budget Forecast FY2014-2023 A-1
The Introduction portion of the Budget Forecast FY2014-2023 discusses how the Forecast dovetails with the annual budget process how the Forecast is developed and how the Forecast can be used as a planning tool to enhance decision making It includes the following sections
bull Forecasting and the Annual Budget Process bull Developing the Forecast bull The Power of the Forecast bull Using This Document
Forecasting and the Annual Budget Process The first step in the annual budget process is to update the Forecast in order to develop the budget guidelines for the FY2014 budget process
Several of the Countyrsquos key funds are included in the Forecast Each fund is analyzed individually as part of the forecasting process
Development of Budget Guidelines The budget guidelines are developed by County Administration based on the results of the Forecast and policy direction from the Board of County Commissioners If the results of the Forecast for a given fund indicate a shortfall the budget guidelines would most likely include some kind of reduction target If a surplus is expected the guidelines would most likely include proposals for new or enhanced programs The budget guidelines are communicated to the Countys departments and agencies for use during their budget development At this time all instructions and resources for preparing budget requests are also distributed Updating the Forecast After the Forecast is prepared and presented to the Board of County Commissioners in the January timeframe the Forecast is continually updated throughout the rest of the fiscal year in parallel with the budget development process
Forecast (January)
Targets Budget Guidelines (February)
Budget Worksessions (AprilMayJune)
Proposed Budget (July)
1st amp 2nd Public Hearings
(AugustSeptember)
Adopted Budget (October)
Deptrsquol Budget Submissions
(March)
BCCrsquos Policy
Direction
INTRODUCTION
Pinellas County Budget Forecast FY2014-2023 A-2
Developing the Forecast The Forecast is developed by the Office of Management amp Budget (OMB) during November December and January for presentation to the Board of County Commissioners in January or February Developing Projections The Forecast is built upon an individual assessment of ten of the Countyrsquos major funds the General Fund Tourist Development Fund Transportation Trust Fund Capital Projects Fund Emergency Medical Services Fund Fire Districts Fund Airport Fund and Utilities Water Sewer and Solid Waste Funds The process for developing the Forecast includes updating the projections for FY2012 with actual revenue and expenditure information following the closeout of the fiscal year as of September 30 2012 At the same time the current FY2013 expenditures are projected on a preliminary basis by analyzing the actual expenditures to date and projecting the remaining months left in the fiscal year These expenditure projections are further refined later in the process as departments provide their expenditure projections The coming FY2014 budget year is forecasted based on the best information available at this point in time The Forecast has a ten year horizon to help determine the long-term financial position of the Countyrsquos funds as well as the impact of todayrsquos budget decisions The out-years through FY2023 are forecasted using various projection methods such as trend analysis linear regression and moving averages Forecast Assumptions The projections are modeled so that assumptions may vary each year to reflect future impacts of known variables and other anticipated events The model is also designed to allow the key assumptions to be adjusted so that sensitivity analysis can be performed to demonstrate the impact of changing key assumptions Additionally unknown risks that could potentially affect the ten-year forecast have been identified and discussed Forecast Results Major assumptions driving the revenue and expenditure projections are outlined to ensure a clear understanding for the basis of the results Shortfalls and surpluses are cumulative in the sense that any individual yearrsquos surplus or deficit flows into the next yearrsquos fund balance thus carrying a current yearrsquos balance forward In using the information contained in the projection it is important to understand that an indicated surplus or deficit reflects the modelrsquos assumptions and demonstrates a potential need for revenue increases expenditure reductions or a mix of both The Power of the Forecast Developing a multi-year forecast provides decision-makers with at least two key benefits (1) assessing the long-term financial sustain-ability of the Countyrsquos Funds and (2) under-standing the impact of todayrsquos decisions on the future
INTRODUCTION
Pinellas County Budget Forecast FY2014-2023 A-3
Long-Term Fiscal Sustainability One of the key purposes of developing a multi-year fund forecast is to identify potential actions necessary to balance revenues and expenditures over the long-term to ensure fiscal sustainability Forecasting over a ten-year horizon can serve as a window into the future to warn of potential future challenges For example if a major capital project (ie jail expansion) will have a significant impact on the operating budget that impact can be anticipated several years in advance and strategies can be developed and implemented to manage the negative impact to the budget Conversely if debt service on a bond is due to expire in the near future additional funds may become available to increase service levels to certain programs or other uses Enhanced Decision-Making Another benefit of long-term forecasting is the ability to assess the impact that decisions made in the present can have on future fiscal capabilities If the Board is considering funding a new or enhancing an existing program the Forecast can demonstrate the long-term impact to the budget Similarly if the Board is considering a new revenue source the Forecast can show how much revenue could be anticipated over the years Implementing cost-saving initiatives can also be forecasted and evaluated over time In summary the Forecast can be a powerful tool to understand how policy changes have real consequences that last far beyond a one-year budget solution Using This Document The Executive Summary section of this document summarizes the key elements of the forecast as a whole over the ten year time horizon The Economic Overview section features an overview of the national state and local economies This section provides important context for the various forecasts in the document The Key Assumptions section discusses the sources of key revenue and expenditure assumptions that were used to develop each of the fund forecasts This section is followed by the Fund Forecasts section which includes individual forecasts for ten of the Countyrsquos major funds These forecasts are designed to be succinct and help focus the reader on the important elements in the ten-year forecasts for each fund The assumptions pro-formas and a full-size forecast chart for each of the funds can be found in the Pro-Formas section A Glossary has also been included to facilitate understanding of key terms
INTRODUCTION
Pinellas County Budget Forecast FY2014-2023 A-4
EXECUTIVE SUMMARY
Pinellas County Budget Forecast FY2014-2023 B-1
Introduction This is the fourth year that the ten-year Budget Forecast has been formalized into a stand-alone document There are no changes to the format of the document from last year The first step in the annual budget process is to update the Budget Forecast and seek Board policy direction in order to develop the budget guidelines for the FY2014 budget process Developing a multi-year forecast provides decision-makers with at least two key benefits (1) assessing the long-term financial sustainability of the Countyrsquos funds and (2) understanding the impact of todayrsquos decisions on the future Economic Overview The national economy appears to be on track for a sustainable recovery and is anticipated to grow by 2 to 3 annually during the forecast period The Statersquos economy is showing signs of improvement in population growth tourism and the housing market As the national economy continues to improve Pinellas County is poised to recover as well The biggest industry in the County is tourism which has shown signs of a strong recovery For FY2014 the property tax base is expected to show positive growth following five years of decline Risks to the economic forecast include uncertainty on federal deficit reduction actions such as sequestration the ongoing European financial crisis and continued high levels of unemployment General Fund Forecast The forecast projects that beginning in FY2013 recurring expenditures exceed recurring revenues in the General Fund This is primarily due to the aftereffects of the Great Recession with continued slow recovery of the real estate market In addition caps on taxable value increases and total property tax revenue will inhibit future revenue growth Major expenditure drivers that exceed normal inflation include personnel costs such as health insurance and state-required pension contributions and mandated expenses such as Medicaid There is a long-term structural imbalance of approximately $15M increasing to $60M per year over the forecast period absent action to address this problem The balancing strategy for the General Fund is to cover the shortfall in FY2014 by utilizing the Service Level Stabilization Account (SLSA) in accordance with the plan approved by the Board of County Commissioners Expenditure reductions or revenue increases may be required in FY2014 or future years to address the structural imbalance The extent of the changes that are needed will be dependent on the pace of the economic recovery particularly the real estate market Tourist Development Council Fund Forecast The forecast for the Tourist Development Council Fund shows that the fund is balanced through the forecast period based on the assumption that the undesignated budget would be adjusted to reflect any revenue increases or decreases that may occur Beginning in FY2016 the fund is forecast to have additional capacity once the debt service on Tropicana Field and the Dunedin Spring Training Facility is paid off in 2015 The additional capacity in the undesignated budget could be dedicated to new capital outlay as with the Board approved Salvador Dali funding to new debt service or to supplement the promotional activities budget Transportation Trust Fund Forecast The forecast for the Transportation Trust Fund indicates that the fund is not in balance beginning in FY2013 resulting in a depletion of fund balance by FY2018 This imbalance primarily results from inflationary pressures on expenditures coupled with the projected reduction in gas tax collections
EXECUTIVE SUMMARY
Pinellas County Budget Forecast FY2014-2023 B-2
that are based upon the volume of fuel By FY2017 action will need to be taken to manage this future gap such as potential revenue transfers from the General Fund imposition of additional local option gas taxes or reductions in current service levels Another balancing option is the implementation of a storm water strategy that includes a new dedicated funding source If a dedicated funding source was available storm water costs currently funded in the Transportation Trust Fund could be freed up to create additional capacity Capital Projects Fund Forecast The forecast for the Capital Projects Fund shows that the fund is balanced over the forecast period Additional cash flow necessary in the first half of the ten-year period is being addressed through an interfund loan from the Solid Waste Renewal amp Replacement Fund A primary driver of cash flow is $81M of expenditures associated with the Public Safety Complex project that began in FY2012 The forecast includes repayment of the loan from FY2013 to FY2020 The forecast does not include projections of revenues or expenditures beyond the current Penny for Pinellas infrastructure sales surtax authorization which ends in FY2020 Emergency Medical Services Fund Forecast The forecast indicates that the fund is not balanced throughout the forecast period The structural imbalance is driven by slower growth in property tax revenue collections than cost increases in ambulance contractual expenditures and first responder funding requests Balance for FY2013 was achieved through a millage rate increase and use of reserves Without another millage rate increase andor expenditure savings reserves will be exhausted after FY2016 Future balancing strategies will be developed from information gathered in the EMS system operational study Fire Districts Fund Forecast The forecast for the Fire Districts Fund indicates that the fund is not balanced through the forecast period Five of the twelve fire districts increased millage rates in FY2013 Additional increases to millage rates for the individual fire districts will likely be necessary to cover expenditures over the forecast period Potential millage rate increases will need to take into account the individual millage caps in each fire district Airport Fund Forecast The forecast for the Airport Revenue and Operating Fund shows that the fund is balanced through the forecast period based on the assumptions that the capital projects budget would be adjusted to reflect the timing and amounts of any grants revenue and that the airportrsquos operating budget would be adjusted to match revenues Utilities Water Funds Forecast The Water System Funds are balanced through the forecast period based on projected rate increases The multi-year rate increases approved as part of the FY2012 budget process will provide sufficient revenues to maintain reserves and fund capital replacement needs through FY2015 The forecast revenues include an additional 2 per year annual increase in rates from FY2016-FY2023 as recommended in the FY2012 Utilities Rate Study performed by the Countyrsquos independent rate consultant A new comprehensive rate study will be performed in FY2014 to analyze the future rate structure In FY2013 FY2014 FY2017 and FY2018 recurring expenditures will exceed recurring revenues as fund balance is drawn down as major capital projects are completed From FY2015
EXECUTIVE SUMMARY
Pinellas County Budget Forecast FY2014-2023 B-3
through FY2023 excluding FY2017 and FY2018 the Water Funds are structurally balanced Utilities Sewer Funds Forecast The Sewer System Funds are balanced through the forecast period based on projected rate increases The multi-year rate increases approved as part of the FY2012 budget process will provide sufficient revenues to maintain reserves sustain the recommended debt service coverage ratio of 150x and fund capital replacement needs through FY2015 The forecast revenues include an additional 275 per year annual increase in rates from FY2016-FY2023 as recommended in the FY2012 Utilities Rate Study performed by the Countyrsquos independent rate consultant A new comprehensive rate study will be performed in FY2014 to analyze the future rate In FY2013 recurring expenditures will exceed recurring revenues as fund balance is drawn down as major capital projects are completed From FY2014 through FY2023 the Sewer Funds are structurally balanced as recurring expenditures are in line with recurring revenues Utilities Solid Waste Funds Forecast The Solid Waste Funds are balanced through the forecast period Forecasted revenues are sufficient to provide for the forecasted expenditures over the next ten years while still maintaining sufficient reserves The recurring revenues are sufficient to support recurring operations without any increases in tipping fees Reserves increase during the forecast period and reach the level of 84 of revenues in FY2023 The reserves are planned to fund considerable future capital replacement needs in the Solid Waste 25-year plan
EXECUTIVE SUMMARY
Pinellas County Budget Forecast FY2014-2023 B-4
ECONOMIC OVERVIEW
Pinellas County Budget Forecast FY2014-2023 C-1
The Economic Overview amp Budget Background portion of the Budget Forecast FY2014-2023 provides important context for the various forecasts in this document and includes the following sections
The National Economy o Background o National Outlook
The State Economy o Background o Florida Outlook
The Local Economy o Background o Local Outlook
The National Economy BACKGROUND ldquoThe Fiscal Cliffrdquo After briefly stepping off the ldquofiscal cliffrdquo as the nation welcomed 2013 the US Senate passed legislation the ldquoAmerican Taxpayer Relief Act of 2012rdquo in the early morning hours of January 1 that prevented income tax rates from increasing for individuals making up to $400000 extended benefits for the long-term unemployed and delayed the automatic spending cuts known as sequester for two months Many economists believed these spending cuts to be split evenly between defense ($55 billion) and non-defense ($55 billion) programs along with the ending of the Bush-era tax cuts would have stalled the current economic recovery and possibly send the economy back into recession While federal income tax rates were kept at 2012 levels for most people the temporary decrease for social security taxes also known as the payroll tax paid by wage earners ended on Dec 31 2012 For two years workers paid 42 instead of the previous 62 rate The reason for the rate cut was to stimulate the economy by allowing workers to bring home more money with each paycheck The financial impact for those earning $30000 per year will be about $50 less in take-home pay per month While the passage of the Act will temporarily avert and delay various elements of the fiscal cliff there will be another showdown in the coming months over automatic across-the-board spending cuts known as ldquosequestrationrdquo the debt ceiling tax and entitlement reform and a long-term solution to the nationrsquos debt and deficits Debt Ceiling Crisis Under the United States Constitution Congress has the authority to appropriate funds for numerous activities including national defense education and payment of the nationrsquos debt obligations When annual revenues fall short of the level required to pay for these activities the Government must then borrow money through the issuance of debt instruments such as short-term bills and notes and long-term bonds In an effort to provide flexibility while still maintaining some control Congress imposed the first debt ceiling in 1917 limiting the amount of debt the federal government can legally borrow to $115 billion Previously Congress had to sign off each time the Department of the Treasury issued
ECONOMIC OVERVIEW
Pinellas County Budget Forecast FY2014-2023 C-2
debt To meet the growing obligations of the federal government Congress must approve a new debt ceiling level before the accrued debt meets the imposed cap This has been done more than 70 times since 1962 with the current debt limit exceeding $16 trillion Increasing the debt ceiling does not authorize new spending but allows the government to raise the necessary funds to pay for previously incurred obligations
During the Spring and Summer of 2011 President Obama and leaders of both the House and Senate faced the need for another increase in the debt ceiling What is usually a routine vote turned into a policy showdown between congressional Republicans and Democrats over how to reduce federal spending and long-term debt After several months of negotiations the House and Senate passed the
Budget Control Act of 2011 which was signed into law by President Obama on August 2 2011 the day the Treasury Department said the United States would begin to default on their obligations without further action
The actions taken during the summer of 2011 did not raise the debt ceiling long-term According to Treasury Secretary Timothy Geithner the United States reached the statutory debt limit on Dec 31 2012 but due to the undertaking of ldquoextraordinary measuresrdquo at the end of 2012 the Treasury extended the deadline by about two months Without a deal to raise the debt ceiling the United States would begin to default on its obligations including payments to holders of US debt and social security recipients among others The United States government has never defaulted on its financial obligations and doing so would have a significant impact on the global economy
Budget Control Act of 2011 The Act established a procedure for increasing the debt limit by $400 billion initially and an additional $500 billion after September 2011 The Act also mandated at least $21 trillion in spending cuts with immediate caps on domestic and defense spending resulting in over $900 billion deficit reduction over ten years To determine the remaining $12 trillion in cuts the Congressional Joint Select Committee on Deficit Reduction (the ldquoSuper Committeerdquo) was established The Super Committee consisted of 12 members of Congress with six coming from the House and six from the Senate split evenly between Democrats and Republicans The committee was charged with issuing recommendations by November 23 2011 for at least $15 trillion in deficit reductions over ten years which could include both revenue increases and spending cuts Downgrade of Federal Government Credit Rating Despite averting default Standard amp Poorrsquos (SampP) downgraded the governmentrsquos credit rating one notch from AAA (highest) to AA+ Citing ldquopolitical brinksmanshiprdquo SampP determined the US governmentrsquos ability to manage its financial house is ldquoless stable less effective and less predictablerdquo and the Budget Control Act of 2011 ldquofell shortrdquo of what was needed to bring the nationrsquos debt under control over time SampP also did not feel the political leaders would be able to achieve the mandated savings in the future On January 15 2013 Fitch Ratings warned of a possible downgrade of US debt without an ldquoagreed and credible medium-term deficit reduction plan that would be consistent with sustaining the economic recovery and restoring confidence in the long-run sustainability of US public financerdquo
ECONOMIC OVERVIEW
Pinellas County Budget Forecast FY2014-2023 C-3
Without a long-term solution to the budget deficit investors will begin to lose confidence in US debt driving interest rates up leading to increased borrowing cost and additional budget pressures As the months pass and pressure mounts all eyes will be on Washington DC and the work of our elected officials Failure of the Super Committee The most visible result of the previous debt ceiling crisis was the creation of the Congressional Super Committee After several months of hard work and intense deliberations the Super Committee was unable to reach agreement The failure of the Super Committee to forge a deficit reduction deal triggers $12 trillion in automatic across-the-board spending cuts starting in 2013 evenly divided between military and non-military spending While most government programs are subject to the automatic cuts programs that assist low-income Americans will be exempt including Social Security Medicaid veteransrsquo benefits and food stamps As 2012 ended and sequestration was looming the US House of Representatives and United States Senate passed legislation delaying the automatic cuts for two months NATIONAL OUTLOOK Gross Domestic Product (GDP) is the generally accepted measure of the size of the national economy GDP measures the total market value of all final goods and services produced in a country in a given year The major components of national GDP (Third Quarter 2012) are shown in the pie chart below
Components of US GDP ndash 3rd Qtr 2012
Consumer Spending
705
Investments132
Net Exports-33
Government Spending
196
Source US Bureau of Economic Analysis
Consumer Spending At 705 consumer spending easily represents the largest portion of GDP This expectation is based on continued high levels of unemployment modest growth in real disposable (after-tax) personal income financial market volatility government debt ceiling and debt downgrade an increase in
ECONOMIC OVERVIEW
Pinellas County Budget Forecast FY2014-2023 C-4
household savings a restrictive supply of credit increases in food and energy prices and continued gridlock in Washington DC The December 2012 unemployment rate was 78 the lowest level since January 2009 Job growth which showed signs of strength in the first quarter of 2012 suffered a slowdown in the second quarter before regaining energy averaging 160000 jobs per month over the last half of the year Through December 2012 the economy has added an average of 153000 jobs per month
Seasonally Adjusted Unemployment Rate 2007-2012
44
100
78
00
20
40
60
80
100
120
Percent
US Unemployment Rate 2007 - 2012
Source US Bureau of Labor StatisticsFRED
While unemployment has shown improvement since the recession ended in 2009 the number of long-term unemployed people who have been looking for employment for more than 26 consecutive weeks has been much higher than the period following the 2001 recession As the chart below shows the pre-2007 recession level of long-term unemployed never returned to the pre-2001 levels and currently is above 40 of the total unemployed One of the effects of long-term unemployment has been a depletion of savings and the draw-down of retirement accounts to pay monthly bills like the mortgage insurance and food The tight financial situation many families find themselves in including working families means there are fewer non-essential purchases being made
ECONOMIC OVERVIEW
Pinellas County Budget Forecast FY2014-2023 C-5
Source Congressional Budget Office An Update to the Budget and Economic Outlook Fiscal Years 2012 to 2022 August 2012
Year Unemployment
2012 82 (78 YTD) 2013 88 2014 87 2015 77 2016 67 2017 59
2018 55
2019 55
2020 54
2021 54
2022 53 Source Congressional Budget Office An Update to the Budget and Economic Outlook Fiscal Years 2012 to 2022
August 2012
According to the US Department of Commerce retail sales for 2012 increased by 49 from 2011 This rise was in part due to increases in automobiles (86) furniture (77) and building materials (54) Although these increases were driven by discounts and promotions these figures do seem to indicate a positive trend in consumer spending NovemberDecember retail sales were up 37 from the same period in 2011
Category December
2012 December
2011
Growth Retail amp Food Services $4687B $4575B 24 Retail $4230B $4145B 21 Automobiles $749B $717B 45
Gas Stations $422B $421B 02
Clothing $317B $309B 26 Source US Department of Commerce January 15 2013
ECONOMIC OVERVIEW
Pinellas County Budget Forecast FY2014-2023 C-6
Inflation also plays a role impacting the outlook for consumer spending The Consumer Price Index the generally accepted measure of overall inflation rose by 17 in 2012 lower than the 35 rise for all of 2011 with the second half of 2012 rising by 23 Short-term projections for CPI range from 18 to 22 through 2017 In addition the Federal Reserve has continued to maintain record low levels on short-term interest rates and is expected to keep them close to zero at least through 2015 which is about two and a half years longer than originally indicated Government Spending The second largest component of GDP is Government Spending at 196 With looming spending cuts and economic pressures the government sector will likely remain a drag on economic growth The state and local government sector represents approximately 60 of total government spending State government budgets have been challenged over the last several years For FY13 sixteen states and the District of Columbia projected a combined gap of $162 billion down from the high of $1741 billion in FY10 Although some states are forecasting budget gaps over the next two years the number of states and the size of the gaps have continued to decline Local government budgets are very dependent on the housing market from tax revenue from home sales to property taxes based on taxable values As the housing market boomed revenues from these sources rose at exceptional rates When the bubble burst so did the revenues While the housing market in general has seemingly hit bottom property values are still below pre-boom levels in many areas as excess inventory and foreclosures continue to suppress housing prices The National Association of Realtors estimates the inventory of existing homes at approximately 286 million units and estimates the shadow inventory made up of homes in the foreclosure process at an additional 20 million units Areas where the real estate market is showing improvement includes the Northeast the Washington DC region Texas and California A sustainable recovery will not truly occur until the backlog of distressed properties is cleared Until real estate markets recover local government spending will likely lag Overall the state and local government sector is anticipated to decrease slightly or be flat over the next few years The federal government sector represents 40 of total government spending Federal spending is anticipated to decrease over the next few years as the mandated spending reductions take place from the Budget Control Act passed in 2011 The Act specified automatic procedures for reducing spending by as much as $12 trillion if legislation was not approved for reducing spending by that amount These cuts would be spread out over the ten years and contribute to more restrained federal spending than in years past and detract from economic growth However the American Taxpayer Relief Act of 2012 which was signed into law by President Obama on January 2 2013 delayed the implementation of the sequestration from January 1 2013 to March 1 2013 This delay will allow the new Congress additional time to find targeted savings without across the board cuts Despite the delay Federal government spending is anticipated to decrease by 2-3 over the next four years as concerns over the four straight years of $1 billion Federal budget deficit grips Washington DC Investment The third largest component of GDP is Investment at 132 This component is made up of Non-Residential Fixed Investment and Residential Fixed Investment
ECONOMIC OVERVIEW
Pinellas County Budget Forecast FY2014-2023 C-7
According to the Congressional Budget Office business and residential investment are growing strongly Business investment in nonresidential structures equipment and software grew at an annual rate of 64 in the first half of 2012 with the second quarter growing by 102 from the same period in 2011 Inventory investments grew in the first half of 2012 from the second half of 2011 However with inventory levels stabilizing this component is unlikely to grow as businesses reduce their stock levels on-hand as the economic recovery continues Net Exports The definition of net exports is exports minus imports Current net exports make up -33 of GDP A key factor driving net exports is the value of the dollar The value of the dollar has gradually weakened and depreciated through much of 2011 due to the Federal Reserversquos policy of quantitative easing which helped decrease the dollar exchange rate against other currencies A depreciated dollar helps increase exports by making the costs of US goods more competitive in the global marketplace and reduces the negative net exports calculation The weakening of the dollar was interrupted by the European debt crisis but is anticipated to continue for several years The pace of export growth is expected to decrease slightly as a result of the anticipated modest recession in Europe However exports to emerging markets should continue to help domestic global producers Import growth will likely be constrained by the slow pace of consumer spending Summary of National Outlook Most economists agree that the national economy hit bottom in 2009 and that we are on track for a sustainable recovery Normally economic recoveries are marked by real economic growth of around 5 in the first year of recovery due to pent up demand It is anticipated that this recovery will be in the 2 to 3 range due to lingering high levels of unemployment the bottoming out of the housing market the continued decline of the commercial real estate market decreases in both federal and state amp local government spending and uneasiness about Europe
Gross Domestic Product (GDP) GDP
Growth 2006 27
2007 19
2008 -03 2009 -35 2010 30 2011 17 2012 (Est) 22 2013 (Est) 20 2014 (Est) 27
2015 (Est) 29 Source Federal Reserve Bank of Philadelphia
Survey of Professional Forecasters November 9 2012
While the national economy appears to have stabilized the lack of job-growth and continued high unemployment in addition to the on-going financial crisis across much of Europe still poses a significant threat to the recovery both nationally and globally
ECONOMIC OVERVIEW
Pinellas County Budget Forecast FY2014-2023 C-8
The State Economy BACKGROUND The background information below for the Statersquos economy is derived primarily from the January 10 2013 report Florida An Economic Overview by The Florida Legislature Office of Economic and Demographic Research Until a few years ago Florida was one of the nationrsquos fastest growing states With the end of the housing boom and the beginning of the real estate market correction the state slipped to virtually no growth on a year-over-year basis While Florida was not the only state to experience a significant deceleration in economic growth (California Nevada and Arizona showed similar trends) it was one of the first and hardest hit State Gross Domestic Product Gross Domestic Product (GDP) the market value of all final goods and services produced or exchanged within a state is one of the key economic measures for the comparison of states In 2006 Florida returned to the national growth level before dropping below it in 2007 (48 US versus 28 FL) 2008 (33 US versus 03 FL) and 2009 (-13 US versus -17 FL) Floridarsquos total GDP in 2007 was $760 billion but dropped to about $726 billion in 2009 before climbing back up to $754 billion in 2011 (the last full year data is available)
Source Federal Reserve Bank of St Louis
After adjusting for inflation Floridarsquos real growth in GDP ranked it tied for 39th in the nation in 2011 with a gain of 25 By way of comparison Florida was ranked 50th in 2008 and 4th in the nation in 2005 For Arizona Nevada and Florida losses in the construction sector accounted for a significant
ECONOMIC OVERVIEW
Pinellas County Budget Forecast FY2014-2023 C-9
portion of the decline as it subtracted more than one percentage point from real GDP growth in each of these states Personal Income Growth Other factors are frequently used to gauge the health of an individual state The first of these measures is personal income growth primarily related to changes in salaries and wages According to The Florida Legislature Office of Economic and Demographic Research Floridarsquos per capita personal income grew 04 during the 3rd quarter of 2012 compared to 05 nationally ranking the state 35th in growth Job Growth and Unemployment In the years leading up to the recent recession unemployment in Florida started increasing from the very low rates of 33 in early 2006 to 45 in November 2007 As the economic slow-down turned into a recession in December 2007 Floridarsquos unemployment rate rose from 47 to a high of 114 in February 2010 eight months after the official end of the recession Since that time the rate has fallen to 80 in December 2012 This rate places Florida at 41st in the country At 80 approximately 749000 residents are unemployed Since the Statersquos peak in employment more than 672000 jobs have been lost To recover from this loss and to accommodate for the additions made to the work force more than 1000000 jobs will need to be created to return Florida to its peak level
Source US Bureau of Labor Statistics Federal Reserve Bank of St Louis
ECONOMIC OVERVIEW
Pinellas County Budget Forecast FY2014-2023 C-10
Housing Market Vigorous home price appreciation that outstripped gains in income and the use of speculative financing arrangements made Florida particularly vulnerable to the decelerating housing market and interest rate risks In 2006 almost 47 of all mortgages in the state were considered ldquoinnovativerdquo (interest only and pay option ARM) With the ease of gaining access to credit long-term homeownership rates were inflated to historic levels ndash moving Florida from a long-term average of 663 to a high of over 72 Essentially easy cheap and innovative credit arrangements enabled people to buy homes that previously would have been denied At first the end of the housing boom brought lower activity and employment in the construction and financial fields as well as spillover consumption effects in closely related industries landscaping and sales of appliances carpeting and other durable goods used to equip houses This began in the summer of 2005 when the volume of existing home sales started to decline in response to extraordinarily high prices and increasing mortgage rates Closely linked to the housing industry Floridarsquos nonagricultural employment annual growth rate began to retreat from its peak in the fall of 2005 By the summer of 2006 existing home prices began to fall and owners started to experience negative wealth effects from the deceleration and losses in property value Mortgage delinquencies and foreclosures became commonplace as property prices further tanked in 2007 and the unemployment rate began to climb as part of a slow slide into a national recession that began in December 2007 By the fall of 2008 Floridarsquos homegrown problems with the housing market were giving way to several worldwide phenomena a national recession that was spreading globally and a credit crisis that was threatening to bring down the worldrsquos largest financial institutions As the sub-prime mortgage difficulties spread to the larger financial market it became clear that any past projections of a relatively quick adjustment in the housing market were overly optimistic Forecasts were dampened through the end of the fiscal year and then again as the excess inventory of unsold homes was further swollen by foreclosures and slowing population growth arising from the national economic contraction While small improvements were seen in late 2009 and early 2010 on the state and national fronts they seemed to sputter as the recovery struggled to take hold Largely these changes were related to Floridarsquos ongoing housing market woes and the gloomy national and global outlooks that plagued most of the year The growing inventory of unsold houses coupled with the sluggish credit crisis dampened residential construction activity throughout the entire year During FY2010 there were 36000 private housing starts for the year statewide but this was just 133 of the FY2006 level Single family starts managed to post a positive gain but multi-family starts worsened the percentage drop they made in FY2009 over FY2008 In yet another manifestation of the significant housing market adjustment still facing Florida existing single family home sales ended FY2010 nearly 30 below the peak volume of the 2005 banner year During 2011 the volume of sales edged up slightly to a level about 25 lower than the peak volume year
ECONOMIC OVERVIEW
Pinellas County Budget Forecast FY2014-2023 C-11
During 2012 the increase in volume continued but still remains at 82 of the sales level during the high-water year of 2005 Median sales prices however have not seen the same increase as volume As the chart below shows prices began to fall very quickly beginning in the last quarter of 2007 before reaching a bottom range between $130000 and $150000 in early 2009 From peak to trough prices fell 418
Source Florida Legislature Office of Economic and Demographic Research Jan 10 2013
FLORIDA OUTLOOK The background information below for the Statersquos economy is derived primarily from the January 10 2013 report Florida An Economic Overview by The Florida Legislature Office of Economic and Demographic Research
With the national recession almost four years behind us Floridarsquos economy is starting to show sustained improvements Growth rates are beginning to return to levels seen during lsquonormalrsquo periods but it will still take several years to make-up for the years of negative growth
ECONOMIC OVERVIEW
Pinellas County Budget Forecast FY2014-2023 C-12
Source Florida Legislature Office of Economic and Demographic Research
Major Economic Drivers
In addition to global and national economic conditions there are several major drivers that are key to the performance of Floridarsquos economy Those drivers include population growth tourism employment growth and new construction
Population Growth
Population growth continues to be the statersquos primary engine of economic growth fueling both employment and income growth and impacting the amount of new construction activity The national economic contraction significantly slowed Floridarsquos population gains but this was not unexpected Over 80 of the statersquos population growth comes from positive net migration primarily from people moving into Florida from other states From past studies it is clear that people are reluctant to move during recessions ndash first because of the inability to sell their homes and second because of the difficulty in finding new jobs Floridarsquos strong international migration which had been a bulwark was also affected by the global economic slowing Floridarsquos long-term population growth rate between 1970 and 1995 was over 3 The annual growth rate hovered between 20 and 26 from the mid 1990rsquos to 2006 and then began slowing to less than 05 in 2009 and 06 in 2010
ECONOMIC OVERVIEW
Pinellas County Budget Forecast FY2014-2023 C-13
In the near term population growth is forecast to remain relatively flat averaging 12 between 2012 and 2015 However over the forecast horizon population growth will improve ndash averaging 14 between 2015 and 2020 with 85 of the growth coming from net migration While this is still significant growth before the recession Florida was adding a city roughly the size of Miami every year in the future it will be a city more like St Petersburg Despite this lower growth rate Florida is still on track to break the 20 million mark in 2016 becoming the third most populous state sometime before then surpassing New York
Source Florida Legislature Office of Economic and Demographic Research Jan 10 2013
By 2030 Floridarsquos population is expected to grow by almost 5 million people The majority of this gain (559) will come from those 60 and older with those under 18 accounting for 149 of this gain Tourism The tourism industry is another key driver of Florida employment growth and economic strength Like other sectors of the economy tourism was hit hard by the recession as job losses and uncertainty coupled with other stresses caused potential visitors to be more conservative in their spending and cut back on their travel plans The industry also had to deal with the negative publicity that resulted from the 2010 Deepwater Horizon oil spill in the Gulf of Mexico (although actual beach damage in Florida was limited to the Panhandle area) During 2011 the impact of these factors declined Tourism growth now appears to be on a steady upward trajectory
ECONOMIC OVERVIEW
Pinellas County Budget Forecast FY2014-2023 C-14
Employment Growth and the Labor Market Floridarsquos current unemployment numbers represent a loss of more than 672000 jobs from the peak with the statersquos negative over-the-year growth rate actually beginning in March 2007 With a projection of about 2500 new working-age people being added to the Florida market each month it will take the creation of about 1000000 jobs to return to the peak level of employment The job market showed strength throughout the year with 89700 jobs being added in November This growth was lead by the leisure and hospitality (+31200) business and professional services (+27500) trade (+22000) and education and healthcare (+17000) industries which performed strongly Negative job growth in government (-7800) and construction (-4400) continue to slow the growth in Florida
Source Fishkind amp Associates Econocast Weekly Jan 07 2013
For wages and salaries Floridarsquos long-term growth prospects essentially match the national forecast However Floridarsquos average annual wages largely fall below the nation as a whole Projections for unemployment show a gradual reduction over the next eight or nine years for Florida dropping to 55 by 2020 from the current level of 80 New Construction and Housing Floridarsquos housing markets are generally improving Sales volume of existing homes and building permits are both back in positive territory showing year-over-year growth The number of documentary stamp tax collections reflects this trend
ECONOMIC OVERVIEW
Pinellas County Budget Forecast FY2014-2023 C-15
Source Florida Legislature Office of Economic and Demographic Research Dec 5 2012
Recent building permit activity has come in better than expected Building permit activity is growing with a 262 increase year-over-year for the first nine month of 2012 Foreclosures have further swelled Floridarsquos unsold inventory of homes Originally related to mortgage interest rate resets and changes in financing terms that placed owners in default activity was also affected by the continuing high level of unemployment In CY2012 Florida had the highest foreclosure rate in the country displacing Nevada at the top of this dubious list At 858 days Florida has the third longest foreclosure process in the United States These two factors along with the struggling economy suggest that the foreclosure problem will remain with Florida for several more years as the existing inventory and inventory soon to be added slowly makes its way through the process
ECONOMIC OVERVIEW
Pinellas County Budget Forecast FY2014-2023 C-16
Foreclosure Activity December 2012
Top 10 Florida Counties
Source RealtyTraccom
A related problem is the ldquoshadow inventoryrdquo of homes that are not on the market but are at risk of foreclosure About 40 of all residential loans in Florida are for homes that are ldquounderwaterrdquo that is have mortgage debt higher than the value of the house However rising home prices in 2012 helped more than 700000 previously underwater homeowners return to a position of equity in their homes There is also a significant percentage of homeowners who are not current with their mortgage payments
Delinquent
Foreclosed Non-
Current National 70 36 106 Florida 78 121 198
Source Florida Legislature Office of Economic and Demographic Research Jan 10 2013
The credit market impacts both employment growth and new construction Although interest rates continue to remain at record low levels credit conditions for those seeking to buy a home or homeowners seeking to refinance remain tight
ECONOMIC OVERVIEW
Pinellas County Budget Forecast FY2014-2023 C-17
The end result of these factors is that in the residential property market sales volume is expected to increase while prices appear to have begun the recovery from their historic lows
State Budget The State of Floridarsquos budget is highly dependent on sales tax revenue accounting for more than 70 of revenues In times of economic distress consumers tend to cut back on discretionary spending which in a state dependent on sales tax will have an immediate effect on revenue Unlike many other states Florida does not have a state personal income tax which is a more stable source of revenue because wages tend to fall at a slower rate than consumption As a result the recession caused major State budget shortfalls and the effects are still being felt in this yearrsquos budget In recent years the State made heavy use of one-time fixes such as diverting revenue from trust funds ($41 billion over 10 years) and using Federal stimulus funds to avoid larger cuts in education and other programs On the expenditure side the single largest driver in State obligations is Medicaid which is projected to increase at an annual rate of 79 over the next 10 years This does not include the potential impact of Federal Health Care Reform As the 2013 Legislature prepares to return to Tallahassee the projected State FY2014 budget is projecting a $480 million surplus the first surplus in six years Summary of Florida Outlook Floridarsquos economy appears to have turned around The major drivers of economic growth are showing signs of improvement The statersquos primary source of economic growth population growth has improved from the very low rates of 2009 (lt05) and 2010 (06) From 2012 to 2015 population growth is expected to average 12 then increase to 14 through 2020 Tourism which was hit hard by both the global recession and the 2010 BP Deep Horizon oil spill has improved greatly The jobs associated with tourism especially in the leisure and hospitality industry grew more than any other industry in 2012 as visitors returned to the beaches and theme parks around the state As the recovery continues the long-range unemployment rate is projected to fall steadily from the current level of 80 to 55 by 2020 Floridarsquos housing market continues to show signs of improvement Sales volume of existing homes has increased most of 2012 However foreclosures continue to depress sales prices around the state In 2012 Florida had the highest foreclosure rate in the country with 198 of all residential mortgages non-current on their mortgage payments The subsequent turnaround in Florida housing will be led by
Low home prices that begin to attract buyers and clear the inventory Long-run sustainable demand caused by continued population growth and household
formation Floridarsquos unique demographics and the aging of the baby-boom generation (2011 marked the
first wave of boomers hitting retirement age)
ECONOMIC OVERVIEW
Pinellas County Budget Forecast FY2014-2023 C-18
Looking ahead the pace of the economic recovery depends heavily on how quickly the job market recovers from the Great Recession the capacity for personal income growth to move ahead of inflation and a substantial reduction in the supply of unsold residential properties
The Local Economy BACKGROUND The context of this section is from the perspective of background impacting the Pinellas County budget Property Value Increases From FY2002 to FY2007 there were unusually large increases in property values in Pinellas County and throughout the state Across Florida public budget hearings brought out many citizens who were upset about their proposed property taxes as presented on their ldquoTruth in Millagerdquo (TRIM) notices Most of those who expressed their frustration were persons who owned property that was not homesteaded and therefore not protected by the ldquoSave Our Homesrdquo taxable value increase cap such as commercial and rental business owners and owners of second homes In response to the publicrsquos concerns the Board of County Commissioners reduced the FY2007 county-wide millage rate by 0701 mills (over 10) the first millage rate reduction since the 1997 budget year Impact of Save Our Homes Amendment Not all local governments were as responsive to the situation as Pinellas and this dramatic growth in taxable values resulted in a surge in property tax revenues that became the focus of legislative concern In reality the primary problem was the systematic inequity resulting from the ldquoSave Our Homesrdquo amendment to the Florida Constitution which has capped the growth in taxable values for homesteaded properties (permanent residences) since 1996 The amendment was intended to protect homeowners from escalating property tax bills resulting from growth in market value a situation that was perceived to be forcing some people particularly residents on fixed incomes to sell their homes While this objective was achieved there were dramatic and in many cases unforeseen consequences as a result of Save Our Homes Because of the large amount of market or ldquojustrdquo value not taxed due to the Save Our Homes exemption a disproportionate share of any increase in tax revenue had been placed on properties that were not established permanent residences such as businesses rental properties and newly purchased homes The increases in values for fiscal years 2002 through 2007 notwithstanding the historical trend over the previous sixteen years in Pinellas had been an average annual increase of about 5 in values (including new construction) Most observers believed that the market would correct itself and return to more normal patterns To some extent the value growth part of the problem could be expected to correct itself over time Legislative Property Tax Roll-Backs The Florida Legislature perceived property tax reform as one of the two most critical issues (along with property insurance reform) that needed to be addressed in 2007 In June a three-day Special Session of the Legislature produced a mandate that was unlike anything ever seen before in its forced reductions in property taxing capability of local government in Florida The Legislature did not make
ECONOMIC OVERVIEW
Pinellas County Budget Forecast FY2014-2023 C-19
similar reductions to FY2008 school property taxes which they control even though these taxes make up about 40 of most property ownersrsquo tax bills Unfortunately this solution failed to address the real inequities that were the focus of public discontent and instead has the potential for even greater disparities in the future The Legislature adopted two key items impacting property tax reform The first approach involved statutory changes requiring all counties cities and special districts to roll back property tax collections in FY2008 to a point below the FY2007 collections adjusted for new construction (also known as the ldquorolled-back raterdquo) This target ranged from 3 to 9 below the rolled-back rate depending on the Statersquos calculation of how much the taxing authorityrsquos property tax revenue increased from FY2002 to FY2007 Independent Districts and Dependent Districts many of which have the primary purpose of providing Fire or Emergency Medical Services were all targeted at 3 below the rolled-back rate These calculations and the resulting reduction categories did not adequately acknowledge the lower tax profile of Pinellas Pinellas County was required to cut 7 below rolled-back (the second-most-severe level) even though
o The Countyrsquos FY2002ndashFY2007 percentage increase in per capita property tax was below the statersquos average increase for counties
o The Countyrsquos FY2007 per capita property tax was less than Orange Hillsborough (and other counties) that were in the 3 or 5 cutback categories
o A city with the same percentage increase was required to cut only 5 o The Statersquos numbers did not reflect seasonal or tourist population impacts and o The Statersquos numbers did not take into account the additional cost pressures for an urban
coastal county (such as property insurance) Property Tax Revenue Cap The other item adopted by the Legislature with important long-term implications was the implementation of a property tax revenue cap Effective FY2009 property tax revenue increases are limited to new construction plus the statewide percentage increase in per capita personal income This percentage has averaged about 38 from 1991-2008 From 2009-2012 growth in personal income was below average or only 1-3 Even this minor increase is neutralized by the historic decreases in property valuation The cap requires that the maximum millage rate that can be approved by a simple majority vote of the Board of County Commissioners equals the prior yearrsquos maximum rolled-back rate adjusted for the change in per capita Florida personal income A two-thirds vote of the Board may approve up to 110 of this maximum Any higher millage rate requires a unanimous vote of the Board or a referendum Based on information from the Florida Department of Revenue the County has some flexibility for increases above the property tax revenue cap in the short term because the Board has not levied the maximum millage since the baseline was set in FY2008 The long-term impact of this cap is that property tax revenue will be constrained even if taxable values increase beyond the average increase in personal income To date the County has not seen an impact from this cap because values have actually declined since it was passed However due to the
ECONOMIC OVERVIEW
Pinellas County Budget Forecast FY2014-2023 C-20
bursting of the housing bubble and the negative impact of foreclosures the baseline of values has been set artificially low which will keep property tax revenues constrained by a higher than anticipated margin Impact of Amendment One The FY2009 budget situation was unique in several ways This was largely due to the passage of Amendment One placed on the ballot by the Legislature and approved by the voters of Florida on January 29 2008 which reduced property tax revenues Also the economic downturn which began in FY2008 intensified which further reduced property taxes and also reduced revenues from other important sources Amendment One made the following changes which reduced taxable property values and revenues available to local government
o ldquoDoubledrdquo the existing $25000 homestead exemption (except for school taxes)
o Allows for up to $500000 of the Save Our Homes exemption to be applied to another property (portability)
o Imposed a 10 cap on assessments for non-homestead property (school taxes exempt)
o Instituted a new tangible personal property exemption of $25000 Impact of the Recession At the same time that the impact of Amendment One was being felt the real estate ldquobubblerdquo burst and market values for property declined dramatically The result was an unprecedented decrease in the property tax base Since World War II the average annual increase in taxable value is about 5 Since 2009 the County-wide taxable value has decreased 84 114 97 and 45 with another 18 decrease in FY2013 Normally some of this revenue decrease would be offset by the rest of the revenue mix such as sales taxes state revenue sharing and other miscellaneous revenues Unfortunately the general economy deteriorated to the point that virtually the entire mix of non-property tax revenues also declined substantially The end result of all of these changes was a large negative impact to the Countyrsquos revenues which have resulted in significant reductions across all of the Countyrsquos funds Impacts to the Pinellas County Budget Since the recession began the County has been faced with resizing the organization to fit the new fiscal reality stemming from legislative action the bursting of the housing bubble and the recession Since FY2007 total positions have decreased 1618 or 25 Within that number the BCC departments have decreased 985 positions or 35 which yields the lowest position count since FY1985 The Constitutionals and Independents have decreased 633 positions or 17 which yields the lowest position count since FY1995 The total position count is currently the lowest since FY1989 In the General Fund the Countyrsquos largest fund that funds most of its operations property taxes (two-thirds of total revenues) have decreased 35 or $151 million from FY2007 to FY2013
ECONOMIC OVERVIEW
Pinellas County Budget Forecast FY2014-2023 C-21
LOCAL OUTLOOK Pinellas County is the 6th largest county in population (916542) and is the most densely populated in the State Pinellas County is mostly built out and expects limited population growth in the future The County is the most popular tourist destination on the Gulf of Mexico drawing 13 million tourists annually Pinellas County is part of the Tampa-St Petersburg-Clearwater Metropolitan Statistical Area (MSA) comprised of Hernando Hillsborough Pasco and Pinellas counties Below is a chart of Employment by Industry for Pinellas County
Source Florida Labor Market Statistics
Over the last five years several of these areas have seen substantial decreases Natural resources mining and construction decreased 46 Manufacturing decreased 26 Information decreased 22 Financial Activities decreased 14 Trade Transportation amp Utilities decreased 11 Professional amp Business Services decreased 9 Other Services decreased 7 and Leisure and Hospitality decreased 4 The only areas that have shown growth since 2006 is Education amp Health Services which increased 11 and Total Government which increased 4 From Wells Fargorsquos May 2012 Florida Economic Outlook Tamparsquos labor market continues to post strong gains The professional and business services sector remains the top performing sector accounting for more than 50 percent of the jobs added since the Bay arearsquos labor market bottomed despite representing only 17 percent of Tamparsquos overall employment base Part of that improvement reflects strong growth at employment staffing companies The recovery has broadened across many other sectors more recently including leisure and hospitality financial services and trade transportation and utilities Construction remains an obvious impediment however as payrolls continue to contract and are now down nearly 53 percent from their peak in April 2006 Unemployment As with the State of Florida Pinellas Countyrsquos unemployment rate reached historically low levels in early 2006 In April 2006 Pinellas County recorded an unemployment rate of 30 As the chart below shows the Countyrsquos unemployment rate rose to 47 by the time the national recession began
Professional amp Business Services
169
Total Government
138
Leisure amp Hospitality
114
Education amp Health
Services 161
Information 23
Manufacturing 52
Other Services 38
Trade Transporation
amp Utilities 185
Financial Activities 79
Natural Resources Mining amp
Construction 42
ECONOMIC OVERVIEW
Pinellas County Budget Forecast FY2014-2023 C-22
in December 2007 reaching a high of 123 in January 2010 seven month after the official end of the recession Since then the Countyrsquos unemployment rate has fallen to 79 (November 2012)
Source Federal Reserve Bank of St Louis
Tourism Tourism is a key economic driver of the economy in Pinellas County and contributes direct and indirect visitor expenditures of $63 billion annually In FY2012 the County reported more than 5 million overnight visitors and collected $287 million in tourist development tax revenue also known as the lsquobed taxrsquo A positive sign of a recovering economy FY2013 collections are 103 higher through the first two months of the fiscal year than the same period in FY2012 which was a record year for Pinellas County Real Estate The real estate market in Pinellas County is struggling to recover from the bursting of the housing bubble Pinellas like the rest of Florida experienced a dramatic rise in housing values for several years during the housing boom Starting in FY2008 property assessments fell for five straight years (-84 -114 -97 -45 and -18) Residential Real Estate Over the last year home sales in the Tampa Bay area have risen However almost half of all the sales are distressed sales involving foreclosed properties Foreclosures continue to hold down the residential real estate market In 2007 there was an average of 628 foreclosure activities per month As unemployment increased and the economy slipped into recession foreclosure activity almost doubled in FY2008 to 1110 per month Activity remained extremely high through FY2009 and FY2010 before dramatically dropping off to 522 per month in FY2011 This drop-off coincided with the federal investigations of lsquorobo-signingrsquo of foreclosure documents As part of a settlement with federal regulators banks and others involved in the foreclosure process agreed to improve their procedures Since the settlement was signed in April 2011 foreclosure activity has begun to increase averaging 822 per month in FY2012 through September The most recent data from Realty Trac
ECONOMIC OVERVIEW
Pinellas County Budget Forecast FY2014-2023 C-23
shown in the chart below shows that most of the foreclosure activities are in the large population centers within Pinellas County
Foreclosure Activity ndash Pinellas County December 2012
Source RealtyTraccom
Summary of Local Outlook While the national recession has been over for more than three years the effects are still being felt in Pinellas County Unemployment is well above pre-recession levels and foreclosures have remained stubbornly high in the past several months However the biggest industry in Pinellas County tourism has shown signs of a strong recovery FY2012 tourist development tax revenues were 124 higher than FY2011 and each month in FY2013 has been higher than the same month in FY2012 And real property values appear to have begun to climb after five years of decreases As the national economy continues to improve Pinellas County is poised to recover as well However because of the high level of unemployment and the potential inventory of residential properties available on the market the recovery is expected to be slow and long
ECONOMIC OVERVIEW
Pinellas County Budget Forecast FY2014-2023 C-24
KEY ASSUMPTIONS
Pinellas County Budget Forecast FY2014-2023 D-1
The Key Assumptions portion of the Budget Forecast FY2014-2023 includes a discussion of the sources of information used to develop assumptions for revenues and expenditures that drive the ten-year forecasts for ten of the Countyrsquos key funds
Assumptions and Forecasting
Revenue Assumptions
o Overview
o Key Assumptions
o Supporting Information
Expenditure Assumptions
o Overview
o Key Assumptions
o Supporting Information
Assumptions and Forecasting Forecasting is not a precise science This is particularly true for forecasts that involve the economy Statistician Nate Silver in his recent book The Signal and the Noise Why So Many Predictions Fail ndash but Some Donrsquot notes the performance of the highly-respected Survey of Professional Forecasters in predicting the one-year growth or decline in Gross Domestic Product (GDP) Silver cites a study which revealed that the actual change in GDP has fallen outside the range of the grouprsquos predictions almost half the time The most recent example was in 2007 where all of the economists predicted growth in GDP even though the Great Recession was already under way As Silver says ldquoForecasting something as large and complex as the American economy is a very challenging taskrdquo Despite this uncertainty forecasting is a useful tool for identifying potential problems and the need for future action The forecasts in this document are a baseline using past trends current policies and assumptions about future conditions based on reasonable expectations We have not attempted to project significant future events such as recessions oil embargos or natural disasters However in each of the fund reviews we have identified the risks to the forecast that could significantly impact the projections In establishing revenue and expenditure assumptions we reviewed data and forecasts from a variety of economists government agencies industry associations and other sources In particular we referenced the State of Floridarsquos Revenue Estimating Conferences frequently The State utilizes a professional nonpartisan consensus process involving the Legislature the Governors Office and the States Division of Economic and Demographic Research in developing national and state economic forecasts that are used in all state planning and budgeting actions The current Conference projections end at FY2022 The projections are available online at httpedrstateflusContentconferencesindexcfm
KEY ASSUMPTIONS
Pinellas County Budget Forecast FY2014-2023 D-2
We also referenced federal agencies such as the Bureau of Labor Statistics the Census Bureau and several Federal Reserve banks as well as private research firms and educational institutions such as The Conference Board Wells Fargo Conway Pedersen Economics Inc the University of Central Florida and the University of Florida The County is not required to use this data but it provides useful background information for projecting changes in revenues and expenditures
Revenue Assumptions Property Taxes ndash General Fund EMS Fund and Fire Districts Fund
Overview Ad valorem taxes commonly called property taxes are assessed on real property and on tangible personal (business) property The tax rate is expressed in ldquomillsrdquo One mill is one dollar of taxes for each thousand dollars of taxable value For example a tax rate of 59 mills on a taxable value of $100000 yields $590 in taxes The Florida Constitution imposes a cap of 10 mills on the total of all County-wide ad valorem rates (which includes the General Fund countywide levy plus the levies for the Health Department and for Emergency Medical Services) A cap of 10 mills is also imposed on the combined total of all MSTU ad valorem rates (which includes the General Fund MSTU levy plus the levies for other dependent districts) The taxable values as of January 1st are established annually by the Property Appraiser and certified for budget purposes by July 1st Final taxable values following appeals and adjustments are certified following the completion of the Value Adjustment Board (VAB) appeals process which recently has been extending into February of the next calendar year
Millage rates are approved annually by the Board of County Commissioners by resolution as part of the budget process This process must follow the ldquoTruth in Millagerdquo (TRIM) law including timing advertisement and conduct of public hearings
Federal state county and municipal property is exempt from property taxes Besides the Homestead and Save Our Homes Exemptions discussed in the Economic Overview section various other exemptions may be available depending on the type of property
Key Assumptions The assumption in the forecast is that after five years of decline taxable values will begin to recover in FY2014 with a slow but sustained rate of growth thereafter
Change in Taxable Values ndash County-wide 2014 2015 2016 2017 2018 2019 2020 2021 2022 2023
25 25 30 30 30 30 30 30 30 30
KEY ASSUMPTIONS
Pinellas County Budget Forecast FY2014-2023 D-3
The County-wide taxable value is the basis for determining the County-wide revenue in the General Fund For the purposes of this forecast the FY2014 through FY2022 percentage change in taxable value for the Emergency Medical Service Fund and the Fire Districts Fund is assumed to be the same as the County-wide taxable value change The rates of growth in the General Fund MSTU and the Fire Districts Fund are projected to be 05 less than the County-wide growth rates based on past trends and the composition of the tax base in the unincorporated area Supporting Information For FY2014 the overall increase of 25 in countywide taxable values reflects differing anticipated changes in the major components of the tax base Within these categories changes in individual properties may vary significantly due to many factors including location (for example beach vs inland) or use (for example hotel vs retail) In the future the growth in property tax revenues will be restrained by the caps put in place by the Legislature in 2007 The amount of new construction in Pinellas County will not provide the boost that other counties that are not built-out will enjoy For example Orange and Hillsborough counties have large undeveloped areas that are available for major residential commercial and industrial expansions Impact of Foreclosures In determining the values as of January 1 2013 which serve as the basis for FY2014 calculations the Property Appraiser will factor in the impact of mortgage foreclosures Foreclosures do not have a significant impact on current year collections of taxes levied because of the recovery mechanisms for delinquent taxes If taxes are unpaid by June 1st a Tax Certificate is offered for sale by the Tax Collector The certificate is sold to an investor and the County receives the equivalent of the taxes due As a result of the recession recent years have seen a dramatic increase in tax certificate sales However although foreclosures do not affect the percentage of property taxes collected during the fiscal year they tend to depress market values of surrounding properties and this has a negative impact on the tax base Along with the rest of the state Pinellas County foreclosure filings increased significantly beginning in 2007 and were averaging about four times higher than the historical norm through 2009 After a decrease in 2010 due to chain-of-title issues and the delay of proceedings in the courts foreclosures once again increased in 2012 to a level about 50 higher than the pre-recession norm For the time being demand is such that new foreclosure inventory is being absorbed fairly efficiently A ldquoglutrdquo of non-mediated rulings could lead to a surge in inventory putting downward pressure on median sales prices which in turn would negatively impact the tax base The forecast assumes that the foreclosure inventory will not experience this type of surge
KEY ASSUMPTIONS
Pinellas County Budget Forecast FY2014-2023 D-4
Source Clerk of the Court data
Taxable values The taxable values for FY2013 were certified by the Property Appraiser on July 1 2012 The county-wide value decreased by 18 compared to the FY2012 values It was the fifth year in a row that the tax base declined Prior to this the tax base only decreased once since World War II a small -06 dip in FY1993
The growth in homesteaded taxable value is subject to the caps imposed by the Save Our Homes amendment This limits the annual growth in a propertyrsquos taxable value to the growth in the Consumer Price Index (CPI) or 3 whichever is lower If the CPI index is negative the allowable change in taxable values is also negative
KEY ASSUMPTIONS
Pinellas County Budget Forecast FY2014-2023 D-5
Save Our Homes Cap for Fiscal Year Based on Change in Consumer Price Index
2005 2006 2007 2008 2009 2010 2011 2012 2013 2014 19 30 30 25 30 0 1 27 15 30 17 There is a two-year lag in the CPI adjustment For example the fiscal year 2014 factor is the CPI change percentage for calendar year 2012
Sources Florida Department of Revenue and US Bureau of Labor Statistics
The factor used is the annual change in the CPI as of December each year For example the limit for FY2013 is the December 2011 index +30 which was issued by the US Bureau of Labor Statistics on January 19 2012 The limit for FY2014 will be the December 2012 index 17 which was issued by the US Bureau of Labor Statistics on January 16 2013 Property Taxes are normally one of the most reliable revenue sources available to local governments As a result most cities counties school districts etc rely on the stability of property taxes to build their budgets Unfortunately due to the combined result of mandatory legislative roll-backs the passing of Amendment One and a correction in the real estate market taxable values have decreased dramatically resulting in a negative multi-year impact in property tax revenue Property Tax Revenue Caps The revenue caps approved by the Legislature in 2007 require that beginning with FY2009 the maximum millage rate that can be approved by a simple majority vote of the Board of County Commissioners equals the prior yearrsquos maximum rolled-back rate adjusted for the change in per capita Florida personal income A two-thirds vote of the Board may approve up to 110 of this maximum Any higher millage rate requires a unanimous vote of the Board or a referendum The County has some flexibility for increases in the short term because we did not levy the maximum millage in FY2009 FY2010 FY2011 FY2012 or 2013 Another aspect of the declining market values (and the ldquodoublingrdquo of the Homestead Exemption from $25000 to $50000) has been the erosion of the amount of value shielded from taxes due to Save Our Homes Prices are now at the point where in some instances homesteaded residential market values have decreased below the prior yearrsquos taxable value This means that rather than an increase due to the Save Our Homes recapture rule some parcels with declining market values previously covered by Save Our Homes will see decreases in their taxable value for FY2014 Fund Variances Because of differences in the composition of their tax base individual fire districts are expected to vary significantly from the overall change The unincorporated area (MSTU) General Fund and Fire Districts Fund taxable value percentage change is assumed to be slightly less than the County-wide taxable value change Other funds not included in this forecast that are dependent on property taxes are the Palm Harbor and Feather Sound Community Service District Funds the Pinellas Public Library Cooperative Fund and the Health Department Fund With the exception of the Health Department the percentage change in taxable value will differ from the County-wide change depending on the composition of the tax roll in each area
KEY ASSUMPTIONS
Pinellas County Budget Forecast FY2014-2023 D-6
Sales Taxes ndash General Fund and Capital Projects Fund Overview Sales tax revenues are highly elastic increasing and falling with the health of the overall economy In addition to food and medicine certain other purchases are exempted from sales tax by legislation The County receives two types of sales taxes the Half-Cent Sales Tax and the Infrastructure Sales Tax (Penny for Pinellas) Half-Cent Sales Tax This General Fund revenue is a portion of the Statersquos six cent sales tax that is shared with counties and cities First authorized in 1982 the program generates the largest amount of revenue for local governments among the state-shared revenue sources currently authorized by the Legislature Sales tax revenue grew by 49 in FY2012 This was the second year of growth following four years of decline beginning in FY2006 We believe this is indicative of a return to sustained sales tax revenue growth
Infrastructure Sales Tax (Penny for Pinellas) The Penny for Pinellas is a 1 percent sales tax which is dedicated to capital improvement projects in Pinellas County such as facilities storm water improvements preservation land purchases roads bridges public safety parks and community centers The Penny makes capital projects and improvements possible without having to raise property taxes Without this funding it is estimated that property owners would have to pay another 15 mills on their property taxes With a sales tax approximately one-third of the total Penny funds are paid for by tourists and seasonal residents Key Assumptions For the State Shared Half-Cent Sales Tax in FY2014 and later years we anticipate growth approaching historical patterns A 40 growth rate is assumed for FY2014 reflecting the
KEY ASSUMPTIONS
Pinellas County Budget Forecast FY2014-2023 D-7
continuing economic recovery This is followed by a 35 growth rate throughout the FY2015-FY2023 forecast period In the near-term our projection is more conservative than the State General Revenue Estimating Conference which anticipates more robust FY2014 growth of 54 followed by 61 and 56 in FY2015 and FY2016 respectively
Change in Half-Cent Sales Tax Revenue 2014 2015 2016 2017 2018 2019 2020 2021 2022 2023
40 35 35 35 35 35 35 35 35 35
The revenue assumptions for the overall Penny sales tax are consistent with the Half-Cent sales tax However the growth rate in the Capital Projects Fund for the Penny sales tax is less at 30 growth from FY2014 to FY2023 This is because the Courts amp Jail allocation is a fixed amount that does not grow over time resulting in a slightly smaller growth rate for the Countyrsquos overall share of the Penny Supporting Information The statewide number from the State General Revenue Estimating Conference reflects population growth that will not be as significant a factor in Pinellas County as in other less built-out counties However we are confident that a strengthening local economy and stronger tourism will result in slightly better growth in the short term Data on potential future job creation growth (provided by Economic Development) and projected tourism growth (provided by the Convention and Visitorrsquos Bureau) support this view Our forecast essentially reflects about 15 to 25 per year growth over the rate of price inflation As a result we are not anticipating a return to the FY2006 peak level of our Half-Cent Sales Tax revenues until FY2016 Communications Services Tax ndash General Fund
Overview The Communications Services Tax (CST) which is 2 of total General Fund revenues is paid by unincorporated area residents and is dedicated entirely to providing services for them through the MSTU The CST legislation was enacted to restructure taxes on telecommunications cable direct-to-home satellite and related services that existed prior to October 1 2001 Previously a county could impose franchise fees on telephone and cable television within its boundaries Currently for charter counties a local CST may be levied at a rate up to 51 percent plus an add-on of up to 012 percent in lieu of imposing permit fees The County has levied the maximum rate of 522 since January 2003 The Communications Services Tax revenue has declined due to the recession and to technological changes in the industry that have reduced the base of taxable services FY2012 CST revenue (excluding audit adjustments) was 28 lower than in FY2011
KEY ASSUMPTIONS
Pinellas County Budget Forecast FY2014-2023 D-8
Key Assumptions The forecast projection reflects a continuation of the decline in this revenue source
Change in Communications Services Tax Revenue 2014 2015 2016 2017 2018 2019 2020 2021 2022 2023 -05 -05 -05 -05 -05 -05 -05 -05 -05 -05
Supporting Information The CST is levied on communication services that originate and terminate within the state Technological advances have allowed for increased competition from communication service providers (particularly wireless providers) which do not meet this definition and whose services are therefore not subject to the CST The 2012 Legislature approved changes to the CST statutes and a State commission the Communications Services Tax Working Group was appointed to study the CST and recommend further structural changes that may lead to even greater reductions in revenue The Working Group is proposing the complete elimination of the CST placing all communications services under the sales tax and increasing the State Sales Tax from 60 to 634 The intent of the proposal is to be ldquorevenue neutralrdquo to the State and to local governments but detailed calculations have not yet been made The cumulative impact of the 2012 changes and the restructuring if it occurs is undetermined at this time State Revenue Sharing - General Fund Overview State Revenue Sharing is primarily based on the Statersquos sales tax revenue The formula for Revenue Sharing is subject to adjustment by the Legislature Similar to the Half-Cent Sales Tax Revenue Sharing revenue demonstrated a second year of growth increasing 34 in FY2012 Prior to FY2011 this source had declined or remained essentially flat since FY2006 As discussed in the section on Expenditure Assumptions the 2012 Legislature as part of the unfunded Medicaid mandate directed that Revenue Sharing distributions to the counties be reduced in order to cover the alleged ldquobacklogrdquo of Medicaid charges This will result in Pinellas County receiving only about two-thirds of the normal Revenue Sharing allocation in FY2013
KEY ASSUMPTIONS
Pinellas County Budget Forecast FY2014-2023 D-9
Key Assumptions For the underlying sources that support State Revenue Sharing the forecast assumes a return to the pattern of moderate growth in this revenue source that predated the economyrsquos boom and bust cycle resulting in an annual increase of 25 through the forecast period However the actual amount the County receives will be reduced in FY2013 through FY2017 The original FY2013 budget showed this as a reduction in revenue After further review the Clerkrsquos Finance Division is posting revenue at the entire ldquoearnedrdquo amount and posting the backlog holdback amount as an expenditure This has no net effect on the projections
Change in State Revenue Sharing Revenue (before Medicaid mandate reductions)
2014 2015 2016 2017 2018 2019 2020 2021 2022 2023 25 25 25 25 25 25 25 25 25 25
Supporting Information State Revenue Sharing has historically grown at a somewhat lower rate than Half-Cent Sales Taxes In addition to differences in the distribution formulas for these two revenues a portion of Revenue Sharing is derived from Cigarette Taxes which have been a declining revenue source for years These factors combine to reduce the potential for growth in Revenue Sharing Interest Earnings and Other Revenue ndash All Funds Overview The County earns interest on fund balances These funds are invested by the Clerk of the Circuit Court in accordance with the Board of County Commissionersrsquo approved Investment Policy All investment activity is conducted in accordance with Section 218415 Florida Statutes and Section 2-144 of the Pinellas County Code The primary objective of the policy is the safety of County funds The second objective is the provision of sufficient liquidity The third objective
KEY ASSUMPTIONS
Pinellas County Budget Forecast FY2014-2023 D-10
subordinate to safety and liquidity is to maximize the return on the investment portfolio while avoiding unreasonable investment risk Key Assumptions Market conditions including record low interest rates were such that interest earnings in FY2012 were once again minimal The forecast reflects the short term outlook for continued low earnings gradually increasing to earnings of approximately 3 on fund balances in the mid- to long-term
Interest Earnings on Fund Balances 2014 2015 2016 2017 2018 2019 2020 2021 2022 2023 07 10 15 30 30 30 30 30 30 30
In each fund forecast the major revenue sources that comprise most of the available resources are specifically analyzed Depending on the fund the remaining revenues may include licenses and permits charges for services fines and forfeitures rents surplus refunds reimbursements and other miscellaneous revenues For these other revenues the forecast assumes the same flat to moderate growth which reflects the anticipated gradual economic recovery
Change in Other Revenue (non-specific) 2014 2015 2016 2017 2018 2019 2020 2021 2022 2023
20 20 20 20 20 20 20 20 20 20
Key Assumptions for Other Fund-Specific Revenues Tourist Development Tax- TDC Fund Tourism is a key driver of the economy in Pinellas County The County imposes a 5 tourist development tax (ie bed tax) on rents collected for temporary lodgings The revenue highly sensitive to general economic and other conditions is driven by several factors including the number of visitors the length of stay and the Average Daily Rate (ADR) that hotels are able to collect for rentals Tourist Development tax revenues have been steadily improving since Spring 2010 and reached record levels in FY2012 FY2013 revenues are estimated to grow 4 beyond actual receipts for FY201 and are anticipated to continue to increase at 35 in FY2014 Beyond FY2014 projections continue to increase by 30 annually through the forecast period matching anticipated gradual growth as part of the recovery in the broader US economy
Change in Tourist Development Tax Revenue 2014 2015 2016 2017 2018 2019 2020 2021 2022 2023
35 30 30 30 30 30 30 30 30 30
KEY ASSUMPTIONS
Pinellas County Budget Forecast FY2014-2023 D-11
Gas Taxes - Transportation Trust Fund The County receives several types of gas tax including State Shared Gas Taxes and Local Option Gas Taxes These revenues are dedicated for transportation-related expenditures and are deposited in the Transportation Trust Fund The State Transportation Revenue Estimating Conference forecasts annual average revenue growth of 19 but this is based on the forecast of total gallons of motor fuel pumped annually in Florida The Countyrsquos gas taxes are based on gallons consumed and not fuel prices and revenue has declined 03 in FY2011 and 02 in FY2012 Pinellas Countyrsquos built out condition and future mandated vehicle fuel efficiency standards leads us to assume a continuing slow decline in these revenues Although the County has the potential to levy an additional 1 to 5 cents in Local Option Gas taxes there are no tax rate increases built into the forecast
Change in Gas Tax Revenues 2014 2015 2016 2017 2018 2019 2020 2021 2022 2023 -05 -05 -05 -05 -05 -05 -05 -05 -05 -05
Ambulance User Fee Revenue ndash EMS Fund Ambulance user fee revenues are subject to a number of variables Unanticipated changes in transport volume (positive or negative) Unanticipated Medicare audit settlements (positive or negative) Potential reductions to Medicare fee schedules (negative) Decreasing mix of private insurance payments and increasing mix of lower-reimbursement
Medicare and Medicaid payments (negative) Increased Medical Necessity verification requirements (negative) Ambulance user fee revenues are primarily driven by patient demand (transport volume) The average increase in transport volume from FY2010 to FY2012 was 20 The average increase or 10 years was 313 ranging from 05 to 74 Revenues are estimated to increase by 20 during the forecast period
Change in Ambulance User Fee Revenue 2014 2015 2016 2017 2018 2019 2020 2021 2022 2023 20 20 20 20 20 20 20 20 20 20
Flight Operations Revenues ndash Airport Fund AirfieldFlight Line revenue for FY2013 is based on the current level of carriers and passenger numbers For FY2014 through FY2023 an increase of 20 per fiscal year is forecast The forecast assumes no new carriers over the ten year period
Change in Airport Flight Operations Revenues
2014 2015 2016 2017 2018 2019 2020 2021 2022 2023 20 20 20 20 20 20 20 20 20 20
KEY ASSUMPTIONS
Pinellas County Budget Forecast FY2014-2023 D-12
Airport RentLeasesConcessions Revenues ndash Airport Fund RentLeasesConcessions revenue for FY2013 is based on current leasesagreements through the termination of these lease agreements Land leases have a five-year adjustment based on the CPI For FY2014 through FY2023 an increase of 20 is forecasted for each fiscal year The County General Fund leases land for the Jail the Criminal Justice Center and other uses from the Airport They comprise 45 of the long-term industrial (non-aviation) land leases
Change in Airport Rental Revenues 2014 2015 2016 2017 2018 2019 2020 2021 2022 2023 20 20 20 20 20 20 20 20 20 20
Water and Sewer Rates In FY2012 the Board of County Commissioners approved a four-year rate plan for both the Water and Sewer systems to meet projected revenue needs through FY2015 Water Funds Revenue In addition to its retail water customers the County has provided water at wholesale rates to six cities that purchase water in bulk and distribute it to their own retail customers The volume of water purchased declined 30 from FY2008 to FY2012 partially due to several of the cities beginning to develop alternative sources of water The amount of water purchased is also affected by economic conditions housing and commercial vacancies and levels of conservation The Water revenue forecast assumes only a 0 to 027 annual increase in retail water demand over the forecast period due to the expected slow growth in the economy The wholesale water demand reflects a continuing decline through FY2016 due to the projected loss of sales to three cities (Clearwater Tarpon Springs and Oldsmar) as they develop their own water resources Sewer Funds Revenue The volume of waste billed has declined 3 from FY2008 to FY2012 The amount of sewage processed is affected by economic conditions housing and commercial vacancies and levels of water conservation The Sewer revenue forecast assumes no increase from FY2013 to FY2014 and a 007 to 021 annual increase from FY2017 to FY2023 in retail and wholesale sewer demand Solid Waste Funds Revenue Tipping fees for the Solid Waste facility are not anticipated to increase during the forecast period Revenues are expected to grow about 05 annually The contract for electricity sales to Progress Energy contains annual escalations of 6 in revenue The contract expires in 2024
Change in Solid Waste Tipping Fee Revenues 2014 2015 2016 2017 2018 2019 2020 2021 2022 2023 05 05 05 05 05 05 05 05 05 05
KEY ASSUMPTIONS
Pinellas County Budget Forecast FY2014-2023 D-13
Expenditure Assumptions Personal Services ndash Salaries ndash All Funds Overview The cost of Personal Services (salaries and benefits) is generally the single largest category of expense (for example 50 of the General Fund) Prior to FY2009 the range of salary merit adjustments generally varied from 0 to as high as 7 No merit pay increases have been granted to County employees in five years (six years for exempt employees) Beginning on July 1 2012 employees are required to contribute 3 of salary to the Florida Retirement System effectively reducing take home pay A limited non-recurring compensation adjustment was approved for FY2013 Key Assumptions Compensation adjustments are included in the forecast for FY2014 through FY2023 County employees have not received merit pay increases for four years and in some cases five years This cost-saving measure was employed as the organization dealt with significant reductions and dramatic decreases in property tax revenue For FY2013 a one-time cost of living wage disbursement was approved In future years moderate pay for performance merit increases are expected to resume to maintain a compensation structure that can attract and retain quality employees No automatic cost of living increases are anticipated in the forecast
Change in Salaries (Merit Increases ndash Net) 2014 2015 2016 2017 2018 2019 2020 2021 2022 2023
0-3 0-3 0-3 0-3 0-3 0-3 0-3 0-3 0-3 0-3
Supporting Information The annual market survey of salaries and benefits for comparable area organizations is being reviewed at this time We have already seen indications that salaries for current employees are becoming non-competitive Additional funds may be required for potential re-classifications due to the reorganizations and reductions in force which have occurred over the past several years Non-recurring compensation adjustments such as one-time flat-amount payments could also be implemented without negatively impacting the forecast Personal Services ndash Employee Benefits ndash All Funds
Overview
The County is responsible for employer contributions to Social Security (FICA) the Florida Retirement System (FRS) State pension fund and to support various other benefits such as health and life insurance short term disability workers compensation and unemployment compensation The two key drivers for employee benefits are the Countyrsquos share of pensions and health insurance costs
KEY ASSUMPTIONS
Pinellas County Budget Forecast FY2014-2023 D-14
Florida Retirement System (FRS) The County is required to participate in the Florida Retirement System (FRS) a State public pension plan Cities have the option of joining the State system or creating their own pension plans Employees of school districts and state agencies also must enroll in FRS and comprise about two-thirds of the total active membership
Source State Board of Administration Investment Report for State Fiscal Year 2012
From 1998 to 2008 the FRS had been one of the few state systems that had an actuarial surplus This lowered the required contributions set by the Legislature that are based on an employeersquos salary and benefit category (public safety employees and elected officials have higher benefits) As with most other pension systems the financial system crisis in the fall of 2008 had a significant effect on the value of FRS investments As a result beginning in 2009 the FRS system has had an unfunded liability
KEY ASSUMPTIONS
Pinellas County Budget Forecast FY2014-2023 D-15
Source State Board of Administration
Investment Report for State Fiscal Year 2012
The FRS investment portfolio which is managed by the State Board of Administration has now substantially recovered from this setback As of March 31 2011 the net asset value for the FRS pension plan was close to the peak value it had reached in 2007
Source State Board of Administration Investment Report for State Fiscal Year 2012
However the 2011 session of the Legislature determined that significant changes were needed in the FRS system These changes are summarized in the following table
KEY ASSUMPTIONS
Pinellas County Budget Forecast FY2014-2023 D-16
These changes affected the future retirement benefits for County employees on the payroll prior to July 1 2011 as well as those hired after that date when these provisions took effect The major impact on the Countyrsquos expenditures results from changing FRS from a non-contributory to a contributory structure This allowed the Legislature to significantly reduce the employer contribution rates for FRS and not coincidentally balance the State budget The rate reductions also resulted in substantial FY2012 cost savings for the County amounting to $13M in the General Fund alone as compared to earlier projections The 2012 Legislature approved rates for the Statersquos 2013 fiscal year (June 2012 to July 2013) that were essentially the same as the previous year Looking ahead employer rates are scheduled to increase in July 2013 under current legislation and the future direction of legislative action cannot be predicted In addition to this general uncertainty the requirement for employee contributions to FRS had been challenged by a lawsuit filed on behalf of public employees by several labor organizations On January 17 2013 the Florida Supreme Court issued its ruling in this case which upheld the employee contribution requirement This avoided potential increases to employer contributions which could have negatively impacted personnel costs Health Insurance Health insurance costs for the County have followed the national trend and outpaced inflation in recent years These increases have been mitigated by the Countyrsquos aggressive cost containment measures including the renegotiation of pharmacy and health contracts the creation of a medication management program increased wellness programs and incentives for employees and the introduction of a fully insured Medicare Advantage Group plan for Medicare-eligible retirees Key Assumptions As of June 30 2012 the FRS system was still only 869 funded
KEY ASSUMPTIONS
Pinellas County Budget Forecast FY2014-2023 D-17
Source Milliman presentation to FRS Actuarial Assumptions Estimating Conference October 1 2012
Due to the reduced value of the Statersquos pension fund investments we are assuming increases in the FRS contribution requirements The forecast assumes that the State will increase rates to address the unfunded liability over the next four years rather than all at once as contemplated in the 2012 legislation because increases in these rates also have negative impacts on the budgets of State agencies and the school districts After reaching a fully funded level the rates should stabilize but there is a large degree of uncertainty in that the Legislature and Governor have demonstrated that they are willing to make major structural changes to the pension system
Projected FRS Employer Blended Contribution Rates (Regular Class) 2014 2015 2016 2017 2018 2019 2020 2021 2022 2023
566 600 640 681 681 681 681 681 681 681
The growth in the Countyrsquos FRS dollar contributions will be a combination of these rate changes and the growth in the salary base to which the rates are applied
Change in FRS Dollar Contributions 2014 2015 2016 2017 2018 2019 2020 2021 2022 2023 30 85 92 89 25 25 25 25 25 25
From 2018-2023 rates are assumed to stay constant but dollar contributions rise at the same rate as salary growth
The forecast assumes that the Countyrsquos aggressive health insurance cost containment measures will continue but that the near-to-mid-term need to supplement required self-insurance reserves as well as longer-term cost increases and employee retiree mix changes will still result in expenditure growth well in excess of CPI throughout the forecast period
KEY ASSUMPTIONS
Pinellas County Budget Forecast FY2014-2023 D-18
The Affordable Health Care Act (ACA) passed in 2010 on the national level to restructure and contain health insurance costs could have a significant impact The forecast does not assume any changes in the current situation some of the potential implications of the ACA are discussed in the Supporting Information below
Change in Health Insurance Contributions 2014 2015 2016 2017 2018 2019 2020 2021 2022 2023 100 100 100 100 100 100 100 100 100 100
The combined result of the forecast changes in salaries and benefits results in the following overall change to Personal Services costs
Change in Personal Services Expenditures (Net Total Salary and Benefit Changes)
2014 2015 2016 2017 2018 2019 2020 2021 2022 2023 41 40 40 40 40 40 40 40 40 40
Supporting Information Health insurance costs are affected by changes in the workforce As the number of active employees decreases due to budget reductions and the number of retirees in the health plan increases costs are spread over a smaller base In recent years the ratio of active employees to retirees has changed from 3 actives for every retiree to 2 actives for every retiree while costs per position have increased The result is that County employer contributions per active position have increased at a higher rate than cost inflation This trend is expected to continue Because the County is self-insured we are required to maintain the equivalent of 2 months of medical claims as a reserve Higher-than-average claims in recent years have led us to draw on our reserves such that they are below the required level This is exacerbated by the employee retiree mix changes discussed above In the near-term OPEB reserves are available to cover the deficit The details of how the Affordable Care Act (ACA) will be implemented in Florida are still being determined The following graphic illustrates the overall timeline of events that will impact employer group health plans such as the Countyrsquos
KEY ASSUMPTIONS
Pinellas County Budget Forecast FY2014-2023 D-19
Timeline Source Buck Consultants presentation ndash July 2012
Florida will be one of a number of states that will not set up a State-run Health Exchange at least initially Instead implementation will default to a Federal-run Exchange
Source Kaiser Family Foundation - Health Reform website
(data as of January 4 2013)
KEY ASSUMPTIONS
Pinellas County Budget Forecast FY2014-2023 D-20
In the future as the ACA is fully implemented the County may be able to consider new structural options For example the County could eliminate the self-insurance system and provide employees an amount to purchase coverage on the Health Exchange Detailed analysis would be needed before implementing any significant structural changes Note that the actual change in Personal Service costs in a department agency or fund may differ from these overall percentages due to reorganizations changes in the number of positions vacancies and other factors specific to the entity Operating Expenses and Capital Outlay- All Funds Overview The cost of services commodities and equipment (Operating Expenses and Capital Outlay) are driven by inflation Many costs will track closely with the Consumer Price Index (CPI) but items such as fuel chemicals and construction materials often exceed that pace The difference between inflation as measured in the CPI and the cost pressure on local governments is illustrated by the Municipal Cost Index (MCI) developed by American City amp County The MCI draws on the CPI the Producer Price Index (PPI) the Construction Cost Index (CCI) monthly statistical data collected by the US Departments of Commerce and Labor and independently compiled data to project a composite cost picture that more accurately reflects inflationary impacts on counties and cities The higher inflationary pressure on local governments is reflected in the report issued by American City and County for December 2012 Compared to the same period last year the Municipal Cost Index increased 20 versus the 17 increase in the CPI In Pinellas County expenses such as fuel electricity and state-mandated Medicaid charges reflect the MCICPI disparity demonstrating historical and projected growth exceeding CPI growth Fuel Fuel costs are dependent on the amount of fuel purchased as well as the price of fuel The County has reduced the size of the fleet and increased fuel efficiency As a result gallons purchased have declined from 136M in FY2008 to 103M in FY2012 for non-Sheriff units Beginning in late FY2011 the Sheriff began purchasing fuel through the Fleet Management Fund which added 102M gallons in FY2012 This change increased total gallons purchased but the expenditures in the Fleet Management fund were offset by an equivalent amount of revenue from the Sheriffrsquos budget Electricity The Countyrsquos office facilities are generally charged a commercial rate for electricity by Progress Energy Historically these rates have averaged annual increases of 5
KEY ASSUMPTIONS
Pinellas County Budget Forecast FY2014-2023 D-21
Medicaid The County is billed by the State for a portion of Medicaid costs The County pays the State for County resident in-patient hospital care for days 11 through 45 The days do not have to be consecutive Because patient stays of less than 11 days or more than 45 days are not paid by the County there is not a strong correlation between the Countyrsquos Medicaid bill and an increase in unemployment from the recession Key Assumptions The forecast assumes that the cost of services commodities grants and aids and equipment will generally track the CPI increases developed by the State in their consensus Revenue Estimating Conference These projections were reviewed against those from various other sources including the Survey of Professional Forecasters the University of Central Florida and the Federal Reserve While there are variations in the specific percentages all of these sources projected continuing low to moderate cost inflation over the forecast period
Change in Other Non-Personnel Expenditures (CPI) 2014 2015 2016 2017 2018 2019 2020 2021 2022 2023 15 18 17 20 19 21 20 20 20 20
Fuel - All Funds with Fleet Equipment The FY2013 Budget baseline was based on a price of $350gallon The price for the County in January 2013 was about $327gallon an average of diesel and unleaded fuel The forecast assumes price increases slightly higher than the rate of inflation
Change in Fuel Costs 2014 2015 2016 2017 2018 2019 2020 2021 2022 2023 30 30 30 30 30 30 30 30 30 30
Electricity - General Fund and Utilities Funds The Real Estate Management and Utilities departments have both taken steps to decrease annual cost increases by implementing measures to reduce energy consumption The forecast assumes flat electricity costs in FY2014 due to recent Progress Energy rate reductions Percentage increases in later years are based on the historical averages
Change in Electricity Costs - Commercial 2014 2015 2016 2017 2018 2019 2020 2021 2022 2023 0 50 50 50 50 50 50 50 50 50
Medicaid - General Fund The 2012 Legislature changed the Statersquos method of billing the County for Medicaid shifting the burden of proof to demonstrate that a claimant is not a county resident in order to dispute an
KEY ASSUMPTIONS
Pinellas County Budget Forecast FY2014-2023 D-22
amount on a bill The State is also reducing the Countyrsquos Revenue Sharing funds to cover a multi-year backlog in billings Unemployment Compensation ndash General Fund Unemployment Compensation for all County operations other than the Sheriff is billed by the State to the General Fund Historically these expenses were less than $01M annually However costs peaked at $12M in FY2010 due to Reductions in Force (RIFs) and declined over the next two years to $02M in FY2012 Future yearsrsquo costs are expected to be closer to the historical average in the absence of another major RIF Supporting Information Fuel efficiency gains are anticipated as new Federal Corporate Average Fuel Economy (CAFEacute) standards for heavy trucks and equipment take effect due to the composition of the fleet Only 47 of 1726 BCC units are cars (less than 3) the bulk of the fleet (excluding the Sheriffrsquos vehicles) is heavy equipment These units usually achieve only 8 to 10 miles per gallon because of idling time (for power take off units) and the gear ratio needed to haul heavy loads The new standard will increase mpg to 12 in 2014 Previously there had been no federally mandated fuel economy standards for heavy trucks and equipment Some departments will have increased fleet replacement costs as units are replaced that are not currently paying into the Fleet fund due to deferral of purchases and life cycle extensions However where feasible some future purchases of replacement equipment may be deferred to take advantage of the new fuel economy standards Other Post Employment Benefits (OPEB) ndash All Funds Overview Consistent with Government Accounting Standards Board directives the Countyrsquos actuarial consultants computed the unfunded Other Post Employment Benefits (OPEB) liability as of October 1 2011 at $392M for Unified Personnel System (UPS) employees and $315M for Sheriff employees The Countyrsquos net Annual Required Contribution (ARC) for OPEB to fully fund this liability would be $277M for UPS employees and $241M for Sheriffrsquos Office employees The FY2013 Budget includes a transfer of $2M from the General Fund to the Employee Benefits Fund for a partial contribution to the annual OPEB ARC for both UPS and Sheriffrsquos Office employees In previous years the County set aside a cumulative total of $27M for OPEB Other local governments in Florida with an OPEB liability are also partially funding those obligations as budgets allow Key Assumptions The forecast assumes that OPEB funding in the General Fund will continue at the current level of $2M per year throughout the forecast period This will be reviewed following analysis of the
KEY ASSUMPTIONS
Pinellas County Budget Forecast FY2014-2023 D-23
next OPEB actuarial report which will provide valuations as of October 2013 OPEB contributions for Enterprise operations are contained within their respective funds
Projected OPEB Contributions - $ millions 2014 2015 2016 2017 2018 2019 2020 2021 2022 2023 $20 $20 $20 $20 $20 $20 $20 $20 $20 $20
Supporting Information Effective January 1 2011 new hires will not further increase the OPEB liability upon retirement and new retirees covered by Medicare must enroll in the less costly Medicare Advantage plan option These actions will help better quantify the OPEB liability in the next OPEB valuation actuarial study Other Fund-Specific Expenditures Ambulance Contract Expenditures ndash EMS Fund The County contracts with Paramedics Plus for the Countyrsquos SUNSTAR ambulance system Contracts with the Countyrsquos ambulance provider were renegotiated in FY2012 with an annual reduction to base service payments of $2 Million A 6 increase was included in the forecast from FY2014 through FY2022 to account for annual CPI increases and increases to transport volume However once the contract is up for negotiation expenditures may change as the economy rebounds and fuel and labor costs and other factors change
Change in EMS Ambulance Contract Expenditures 2014 2015 2016 2017 2018 2019 2020 2021 2022 2023 60 60 60 60 60 60 60 60 60 60
First Responder Expenditures ndash EMS Fund
The County contracts with the eighteen first responder EMS providers that respond to calls using paramedics and that utilize Advanced Life Support (ALS) or Basic Life Support (BLS) equipment and personnel First responder contractual expenditures increased 51 from FY2012 to FY2013 and are estimated to increase at 5 through the forecast period
Change in EMS First Responder Expenditures 2014 2015 2016 2017 2018 2019 2020 2021 2022 2023 50 50 50 50 50 50 50 50 50 50
Purchase of Water - Utilities Water Funds A major expense to the Water System is the purchase of water from Tampa Bay Water The annual change in the cost of water reflects the combined impact of changes in Tampa Bay Water rates andor changes in consumption including decreases in wholesale customer base The actual cost in dollars will be dependent on the amount of water purchased
KEY ASSUMPTIONS
Pinellas County Budget Forecast FY2014-2023 D-24
Change in Cost of Water Purchased from Tampa Bay Water 2014 2015 2016 2017 2018 2019 2020 2021 2022 2023 10 21 08 17 17 18 17 19 21 21
Chemicals - Utilities Water and Sewer Funds The increase in the cost of chemicals for Water and Sewer operations has been historically around 7 annually The forecast projects this trend to continue
Change in Cost of Chemicals for Utilities 2014 2015 2016 2017 2018 2019 2020 2021 2022 2023 70 70 70 70 70 70 70 70 70 70
Capital Outlay - Utilities Water and Sewer Funds The Water and Sewer capital outlay forecasts reflect the construction and purchase needs as estimated by the Pinellas County Department of Environment and Infrastructure Engineering Division in the CIP ten year work plan Solid Waste Expenditures ndash Utilities Solid Waste Funds Solid Waste operating expenditures are projected to generally follow overall inflationary trends The Solid Waste capital outlay forecast reflects the construction and purchase needs as estimated by the consulting engineering services report by CDMSmith Inc There is a large capital need forecasted from FY2013 through FY2018 to install additional air pollution measures in anticipation of tighter regulatory requirements and additional required improvements Other Forecast Considerations While climate change is generally viewed as a long-term problem recent events show that we may already have begun to see an increase in the frequency and intensity of storms such as hurricanes and unseasonable weather Should this trend continue it may be prudent to consider increasing fund reserves to provide adequate resources to deal with the cost of responding to these events As a coastal community rising sea levels due to climate change may require expenditures to reconstruct or relocate facilities that are in low-lying areas At this time it appears that these costs would not be incurred during the timeframe of the forecast
FUND FORECASTS
Pinellas County Budget Forecast FY2014-2023 E-1
The Fund Forecasts portion of the Budget Forecast FY2014-2023 includes ten-year forecasts for ten of the Countyrsquos major funds
General Fund
Tourist Development Fund
Transportation Trust Fund
Capital Projects Fund
Emergency Medical Services Fund
Fire Districts Fund
Airport Fund
Utilities Water Funds
Utilities Sewer Funds
Utilities Solid Waste Funds
Sections in Each Fund Forecast Each fund forecast includes the following sections
Description Provides information concerning the fund such as fund type legal authority authorized uses of proceeds etc
Summary Provides an at-a-glance summary of the ten-year forecast These results are also summarized in the Executive Summary
Revenues Provides a high level overview of the major revenues in the fund
Expenditures Provides a high level overview of the major expenditures in the fund
Ten Year Forecast Includes key assumptions in the forecast a chart of the ten-year forecast and key results interpreted from the forecast chart
Potential Risks Includes key factors that affect assumptions in the forecast over the forecast horizon
Balancing Strategies Includes potential revenue and expenditure options for balancing the funds
Additional Information The fund forecasts in this section are intended to be high level user-friendly summaries of the results of the ten-year forecast for each fund For more detailed information please see the Key Assumptions and Pro-Formas portion of this document
FUND FORECASTS
Pinellas County Budget Forecast FY2014-2023 E-2
GENERAL FUND
Description The General Fund includes the primary governmental functions of the County that are not completely supported by dedicated resources These activities include but are not limited to Sheriffrsquos law enforcement detention and corrections health and human services emergency management and communications parks and leisure services and the operations of the Property Appraiser Tax Collector and Supervisor of Elections The General Fund includes operations for both county-wide functions and the unincorporated area These segments are tracked separately within the fund The unincorporated area is commonly referred to as the MSTU (Municipal Services Taxing Unit) MSTU expenditures are about 9 of the total (net of reserves)
Summary The General Fund encompasses the principal governmental activities of the County that is those that are not primarily supported by dedicated revenues or by user fees The four main revenue sources for the General Fund are Property Taxes State Shared Half-Cent Sales Taxes State Revenue Sharing and Communications Services Taxes The forecast projects that beginning in FY2013 recurring expenditures exceed recurring revenues in the General Fund This is primarily due to the aftereffects of the Great Recession with continued slow recovery of the real estate market In addition caps on taxable value increases and total property tax revenue will inhibit future revenue growth Major expenditure drivers that exceed normal inflation include personnel costs such as health insurance and state-required pension contributions and mandated expenses such as Medicaid There is a long-term structural imbalance of approximately $15M increasing to $60M per year over the forecast period absent action to address this problem The balancing strategy for the General Fund is to cover the shortfall in FY2014 by utilizing the Service Level Stabilization Account (SLSA) Expenditure reductions or revenue increases may be required in FY2014 or future years to address the structural imbalance The extent of the changes needed will be dependent on the pace of the economic recovery particularly the real estate market
Revenues Property Taxes are the single largest source of General Fund revenues accounting for more than two-thirds of the total The four primary funding sources for the General Fund (Property Taxes State Shared Half-Cent Sales Taxes State Revenue Sharing and Communications Services Taxes) comprise about 81 of the revenue The remaining 19 is derived from a variety of resources including User Fees Grants Interest and Cost Recovery from other County funds
Pinellas County Budget Forecast FY2014-2023 E-3
GENERAL FUND
Source FY2013 Adopted Budget Property Taxes The decline in property tax revenue from FY2008 to FY2012 exceeded the increases that occurred from FY2004 though FY2007 The FY2013 budgeted revenue is comparable to the revenue collected in FY2003 The chart below features a dotted line showing what the historical average of 5 growth in property tax revenue would look like It shows that the above-average amounts collected in FY2004 through FY2008 have been overcome by the large gap between current property tax revenues and where they would have been if the historical 5 growth had taken place
Pinellas County Budget Forecast FY2014-2023 E-4
GENERAL FUND
As discussed in the ldquoAssumptionsrdquo section of the forecast document the Statersquos mandated increase in the Countyrsquos Medicaid costs adversely affected the General Fund In order to stay the course on the established multi-year strategy for achieving financial sustainability the FY2013 budget included an increase of 01997 mills in the county-wide millage rate There was no increase in the MSTU millage rate The combined General Fund property taxes for countywide and MSTU are expected to generate $2866M in FY2013 The total property tax revenue will be comparable to FY2003 and is $147M or 34 less than the FY2007 peak revenue The negative impact from reduced property tax revenue is generally less pronounced for the municipalities in Pinellas County Their General Fund revenue mix usually reflects other revenues such as franchise fees and utility taxes that can help mitigate the impact of a reduction in property tax revenue
Sales Taxes The second largest General Fund revenue source is the State Shared Half-Cent Sales Tax which is 9 of total General Fund revenues Sales Tax collections have begun to recover from the effects of the recession but estimated revenues for FY2013 are still 9 under the peak year of FY2006 This tax is expected to generate $382M in FY2013
State Revenue Sharing The third major General Fund source State Revenue Sharing which is 2 of total General Fund revenues is also primarily based on the Statersquos sales tax revenue It is estimated that from this source the County will recognize $142 million in FY2013 This is 20 less than the FY2006 peak year revenue However the Statersquos implementation of the Medicaid mandate which holds back funds for the ldquobacklogrdquo of Medicaid billings means that the County can only expect to receive $94 million in FY2013 The State also plans to reduce the Countyrsquos Revenue Sharing amounts for FY2014 through FY2017 The original FY2013 budget showed this as a reduction in revenue After further review the Clerkrsquos Finance Division is posting revenue at the entire ldquoearnedrdquo amount and posting the backlog holdback amount as an expenditure Communications Services Taxes The fourth major revenue in the General Fund is the Communications Services Tax (CST) The CST is expected to generate $107M in FY2013 down from a peak of $132M in FY2007 The Countyrsquos CST rate is 522 which is the maximum allowed under current State law Pinellas Countyrsquos revenue reflects the statewide trend for this source which has experienced continued erosion due to heightened competition in the wireless market and reduced consumer spending following the recession Other Revenues Lesser revenue sources include User Fees Sheriffrsquos Law Enforcement Contracts Cost Recovery from other funds Interest Earnings and various other sources including Federal and State grants In general these revenues decreased as a result of the recession but are mostly expected to resume moderate growth in FY2014 and future years
Pinellas County Budget Forecast FY2014-2023 E-5
GENERAL FUND
Expenditures The General Fund includes the primary governmental functions of the County that are not completely supported by dedicated resources These activities include but are not limited to Sheriffrsquos law enforcement detention and corrections support of the Court system including facilities and technology health and human services environmental management emergency management and communications parks and leisure services general administration and the operations of the Property Appraiser Tax Collector and Supervisor of Elections The budgeted expenditures in the General Fund for FY2013 total $4514M (net of reserves and the Service Level Stabilization Account) and can be summarized in four groups the Board of County Commissioners the Sheriff Other Constitutional Officers and Independent Agencies
Source FY2013 Adopted Budget
Board of County Commissioners This grouping of departments includes the departments under the County Administrator as well as the County Attorneyrsquos Office and the Board of County Commissioners (BCC) They are $1832M or 41 of total FY2013 General Fund expenditures (net of reserves and Service Level Stabilization Account) Some of the major BCC programs include social services matching funds for Medicaid building operations and maintenance (including the courts jail and Sheriffrsquos headquarters) parks maintenance environmental protection environmental preserves cultural affairs emergency management animal shelter rabies control economic development consumer services veteranrsquos services the county extension service Florida Botanical Gardens Heritage Village public information the County cable television station planning budget purchasing and State-mandated support of juvenile detention
Pinellas County Budget Forecast FY2014-2023 E-6
GENERAL FUND
Sheriff The Sheriff is an independently elected Constitutional Officer The Sheriffrsquos budget is $2133M or 47 of total FY2013 General Fund expenditures (net of reserves and Service Level Stabilization Account) Detention and Corrections programs comprise 53 of this total The Sheriff also provides support to the Court System and provides Law Enforcement services to both the unincorporated area (MSTU) and by contract to 13 municipalities This includes St Pete Beach for which a contract was approved during FY2013 The Sheriffrsquos adopted budget is often supplemented during the year by grants from Federal and State agencies such as the US Department of Justice and the Florida Department of Law Enforcement Other Constitutional Officers These agencies which are headed by independently elected officials comprise $382M or 8 of total FY2013 General Fund expenditures (net of reserves and Service Level Stabilization Account) In most cases the General Fund only reflects part of the total agency budgets The Tax Collector and Property Appraiserrsquos budgets are determined by statutory formulas and are approved by the State Department of Revenue The General Fund provides about 80 of the Tax Collector and 85 of the Property Appraiser total budgets The remainder is supported by other funds and by revenue sources that are specific to certain functions An example of the latter is the processing of driverrsquos licenses which receives some state support but not enough to cover the Tax Collectorrsquos cost of providing the service The Clerk of the Circuit Court has two separate budgets for activities in support of the Board of County Commissioners and for support of the Court system The latter is fee supported and is not included in the Countyrsquos budget it is funded and approved by the State The Board-related functions comprise about 25 of the Clerkrsquos total budget The budget for the Supervisor of Elections experiences annual fluctuations which result from the varying number and scope of elections in a given year The Supervisor is responsible for preparing and conducting all Federal State County and Municipal elections within the County The Board funds 100 of the Supervisorrsquos budget excluding occasional State or Federal grants Independent Agencies These agencies are $167M or 4 of total FY2013 General Fund expenditures (net of reserves and Service Level Stabilization Account) They include the Countyrsquos support for the Judiciary the State Attorney the Public Defender the Criminal Justice Information System (CJIS) the Medical Examiner the Office of Human Rights and Human Resources Court Support Much of the Countyrsquos court support is driven by statutory mandates and Article V of the State Constitution that require the County to fund certain technology expenses programs and facilities Only about 12 of the Judiciaryrsquos total budget 8 of the Public Defenderrsquos budget and 1 of the State Attorneyrsquos budget are funded by Pinellas County This funding includes some local programs over and above the mandated requirements such as Teen Court Drug Court and the Public Defenderrsquos Jail Diversion efforts The Sixth Judicial Circuit encompasses
Pinellas County Budget Forecast FY2014-2023 E-7
GENERAL FUND
both Pinellas and Pasco counties Pasco County provides funding for similar functions at a lower level due to its relative size The balance of these agency budgets are funded by the State Other Agencies The Medical Examiner also serves the entire Sixth Judicial Circuit and therefore is supported by both Pinellas and Pasco Counties The Medical Examiner is not a government employee but provides forensic investigative and laboratory services to the County by contract Two other agencies receive General Fund support The Office of Human Rights provides County citizens protection from employment and housing discrimination and also acts as the Countyrsquos internal affirmative action agency The Human Resources department manages the Unified Personnel System (UPS) which provides centralized personnel services for the BCC and most of the other County elected officials and independent agencies The major exception is the Sheriff who operates a separate personnel system Types of Expenditures In addition to the breakout of organizational responsibilities another way of looking at General Fund requirements is to consider the types of expenditure required for those organizations to carry out their responsibilities Personal Services Operating Expenses and Capital Outlay in the General Fund are similar to those in other County funds Several of the other expenditure categories merit additional discussion Grants amp Aids Debt Service and Transfers Grants and Aids The Grants and Aids expenditure category includes several types of funding provided by the County to other entities such as financial assistance for low income residents and support of community non-profit social action agencies Grants and Aids also include Tax Increment Financing (TIF) payments to cities for community redevelopment areas (CRAs) Nine cities within the county have established a total of twelve CRAs The County is required by interlocal agreements to contribute funds annually based on formulas that reflect the amount of growth in taxable values compared to a specified base year In FY2013 the County will contribute an estimated total of $63M in TIF payments to the cities Debt Service Unlike many other local governments Pinellas County has no outstanding bond issues which are supported by a pledge of property taxes or other general revenue The only budgeted expenses for Debt Service (principal and interest payments) are for potential short term cash flow or financing needs Transfers Transfers between funds includes ongoing or non-recurring items For example an ongoing transfer to the Employee Health Benefits Fund is budgeted to address unfunded liabilities for Other Post Employment Benefits (OPEB) FY2013 includes the first of five $15M transfers to the Capital Projects Fund to support the Centralized Chiller project which had been advance-funded from other sources
Pinellas County Budget Forecast FY2014-2023 E-8
GENERAL FUND
Non-recurring funds may also be included in the other expenditure categories For example FY2013 Operating Expenses includes $39M in cost allocation charges from BTS to complete funding for the Justice Consolidated Case Management System (CCMS) project At the end of each fiscal year non-recurring funds may be realized as additional fund balance resulting from revenue in excess of expenditures in a given fund The amount of non-recurring or one-time funds can vary significantly from year to year As stated in the Countyrsquos budget policies non-recurring funds should be applied to increase reserves or for one-time purposes only They should not be used to fund ongoing programs Reserves Reserves are not expenditures but they are included in the budgeted total requirements for the fund In order to be expended the BCC must take formal action reappropriating these funds Maintaining adequate reserves is key to the Countyrsquos ability to deal with potential emergencies and unforeseen events such as fuel price increases unanticipated dips in revenues or a natural disaster This is even more important in view of our geographic location on the Florida Gulf Coast We need to have the ability to maintain critical public safety transportation and other services during and after hurricanes and other severe storms We need the resources to provide these services immediately and not rely on Federal funding which is often made available as reimbursements and received months or years after the event Also federal (FEMA) reimbursements typically cover only 75 of the loss Additionally due to conditions in the insurance marketplace our coverages are less than the Countyrsquos total asset base The Countyrsquos property value is estimated at approximately $12 billion (net of the Solid Waste and South Cross facilities) We carry $100M worth of wind damage insurance This means that we have additional exposure depending on the kind of damage we could receive in a storm event or natural disaster Having an adequate reserve also demonstrates stability to the financial markets Although Pinellas has the lowest general revenue debt of any major Florida county this stability enhances our ability to raise capital through bonding at a lower cost if required in the future
The budget policies for General Fund Reserves (Fund Balance) were established by the Board of County Commissioners in accordance with principles issued by the Government Accounting Standards Board (GASB) and are summarized in the following table
Pinellas County Budget Forecast FY2014-2023 E-9
GENERAL FUND
The amount and use of Non-Spendable and Restricted Reserves are defined by the value of inventories and limitations imposed by external entities such as grants that are being carried forward from the previous year The budget policies address the other ldquounrestrictedrdquo categories Prior to FY2011 the General Fund reserve policy was ldquoat a minimum no less than 5 to 15 of operating revenues or no less than one to two months of operating expendituresrdquo Over the last several years the Board of County Commissioners set a conservative General Fund reserve target of 15 of total resources For FY2011 the Board revised its budget policy to incorporate this more conservative approach given that Pinellas County is a high hazard coastal county The revised budget policy states
The General Fund Reserve (Ending Balance) should be budgeted at a level of no less than 15 of total resources
The policy essentially sets a floor of 15 for the reserve level and does not set a cap to limit the reserve The FY2013 General Fund budget includes a projected reserve of $818M which meets the Boardrsquos 15 policy target The components of the estimated FY2013 year-end reserves are Contingency Encumbered Contracts Cash Flow and Disaster Response
Contingency Reserve The Contingency Reserve which is budgeted at $272M in FY2013 is an amount equal to 5 of resources to be used for unanticipated revenue shortfalls or expenditures For example fuel costs and electricity rate increases have been highly volatile and often exceed normal inflation Another example is the need for accrued leave payouts due to layoffs
Pinellas County Budget Forecast FY2014-2023 E-10
GENERAL FUND
Encumbered Contracts Reserve During the year at any given time there are purchase orders and service contracts that have been approved and are subject to payment as work is completed or goods delivered The $76M in the Encumbered Contracts Reserve for FY2013 represents the average amount that was encumbered at monthrsquos end for the 12-month period ending May 2012 Cash Flow Reserve The Cash Flow Reserve is required to meet cash flow needs During the first two months of the fiscal year expenditures exceed revenues because most of the property tax revenue is not received until December Property tax revenue represents about 68 of the total General Fund revenue The FY2013 amount for the Cash Flow reserve $357M is equal to one-twelfth of all General Fund revenue budgeted for the fiscal year Disaster Response Reserve As a high hazard coastal county Pinellas needs to have Disaster Response Reserve funds on hand in case of an emergency such as a hurricane or other man-made or natural disasters In FY2013 $113M is budgeted in this reserve Reimbursement from the Federal Emergency Management Agency (FEMA) and the State usually cover only a portion of the costs is not available at the beginning of a disaster and often is not received for many months or years For example FEMA funds for the three 2004 hurricanes which brushed Pinellas County (Jeanne Charley Frances) were not fully received until 2007 after extensive and protracted appeals through FEMA and the State Approximately $16M of the $93M total cost was not reimbursed for these storm events There are other economic impacts which can result from a major disaster With a substantial portion of the countyrsquos highest taxable value properties located on the shoreline or in lower elevation coastal areas there is the potential for a reduction in the tax base if properties are damaged or destroyed by a storm surge or high winds This would result in a decline in property tax revenue in the following year Sales and other taxes would also decrease due to the negative effects on tourism from the storm Rebuilding would generate additional revenues but it would take time to offset the losses in the aftermath of the disaster As an indication of the size of this problem a seven-county area of Florida impacted by 2004rsquos Hurricane Charley sustained over $66 Billion in losses to residential commercial and industrial properties The County is the primary coordinating agency for disaster response and extraordinary unbudgeted expenses are required to respond to such a situation Resources are needed to pay for extended work hours for Sheriffrsquos deputies and other emergency first response personnel and to operate emergency shelters and the emergency communications center Public works crews and equipment and possibly private contractors are needed to repair storm damage Debris removal funding may be required if solid waste resources are not available Since storms may vary greatly in their impact it is not possible to predict the exact amount which would be required
Pinellas County Budget Forecast FY2014-2023 E-11
GENERAL FUND
Ten-Year Forecast Key Assumptions ndash Revenues For the purposes of the forecast it is assumed that the General Fund millage rates for both countywide and MSTU purposes will remain the same as the rates for FY2013 The FY2013 countywide millage rate is 50105 mills and the MSTU rate is 20857 mills As explained in the Key Forecast Assumptions section of this document the forecast is that taxable values will return to positive growth of 25 in FY2014 and FY2015 In FY2016 and later years the forecast assumes an annual growth rate of 3 which is less than the 5 historical average growth which occurred in the years before the real estate boom For the State Shared Half-Cent Sales Tax we anticipate 40 growth for FY2014 and a 35 annual growth for the FY2015-FY2023 forecast period The underlying sources of State Revenue Sharing are expected to return to a pattern of moderate growth slightly less than the sales tax with an annual increase of 25 through the forecast period However as noted above the implementation of the Medicaid mandate will result in the State reducing the amount of revenue sharing funds the County receives for FY2013 through FY2017 Communications Services Tax revenue is forecast to continue a slow decline throughout the forecast period decreasing 05 per year For other revenues in the General Fund the forecast assumes flat to moderate growth which reflects the anticipated gradual economic recovery Key Assumptions - Expenditures The forecast assumes a continuation of current (FY2013) programs and service levels The basic assumptions for Personal Services and Operating Expenses that are used throughout the forecast apply to the General Fund The forecast does not assume any net additional positions However certain expenses such as electricity fuel and state-mandated Medicaid charges result in the General Fundrsquos Operating Expense growth differing somewhat from the Consumer Price Index (CPI) As discussed previously the County has no outstanding bond debt supported by property taxes or other general revenues No such bond issues are anticipated during the term of the forecast Because of the uncertain nature of non-recurring funds none are anticipated in the forecast with the exception of those estimated to be available in FY2014 and $15M per year for FY2015 through FY2017
Pinellas County Budget Forecast FY2014-2023 E-12
GENERAL FUND
No new programs funded by non-routine grants are included in the forecast The assumption is that any such expenditures will be dedicated for non- recurring purposes or will cease when the grant funds are no longer available In the recent past the Sheriff in particular has been very proactive in seeking Federal and State funding for public safety purposes that supplement but not supplant existing budgets While this is desirable and likely to continue for the purposes of the forecast these unpredictable expenses and their offsetting revenue are not included Several capital improvement projects are expected to impact operating expenditures when completed These projections have been incorporated into the forecast For example several energy conservation projects currently in progress are anticipated to reduce future ongoing utilities costs Conversely completion of the Lake Seminole Alum Injection project will place additional demands on General Fund resources As specific increased needs are identified to the extent possible these new demands will be accommodated within existing budgets Key Results The forecast projects that in FY2014 recurring expenditures will exceed recurring revenues in the General Fund by an estimated $121M The gap for FY2014 can be closed on a one-time basis by using the resources available in the Service Level Stabilization Account in accordance with the plan approved by the Board However a structural gap of approximately $15M increasing to $60M would remain throughout the forecast period without action to address this ongoing problem
Pinellas County Budget Forecast FY2014-2023 E-13
GENERAL FUND
Forecast Budget Gap
Without Corrective Action 2014 2015 2016 2017 2018 2019 2020 2021 2022 2023
($14M) ($177M) ($208M) ($251M) ($282M) ($338M) ($390M) ($432M) ($503M) ($575M)
Potential Risks REVENUE FACTORS Taxable Values There are many factors that can alter the ten-year forecast of the General Fund The primary concern due to this fundrsquos reliance on property taxes for a significant portion of revenue is the performance of the real estate market The timing of the valuation of property for tax purposes is important The FY2014 values to be certified on July 1 2013 will reflect the market conditions through the end of the 2012 calendar year Therefore increases or decreases in value after January 1 2013 will not impact the FY2014 tax base A change of 1 in the FY2013 countywide taxable value would result in a $26M change in revenue at the FY2013 millage rate of 50105 Similarly a change of 01 mills in the rate using the FY2013 taxable value would result in a $52M change in revenue In the following years these impacts would be amplified by the other growth factors Save Our Homes Impact Another variable is the homesteaded taxable value increase cap imposed by the Save Our Homes amendment which is based on the annual change (December to December) in the Consumer Price Index Under ldquonormalrdquo circumstances as homesteaded properties represent about 35 of the total countywide taxable value a change of 1 in the CPI (positive or negative) at the current millage rate would produce a change in revenue of approximately $1M Because of the decline in market values the amount of value that is shielded by Save Our Homes has been greatly reduced As the real estate market returns to a pattern of growth Save Our Homes will limit the amount of the increased value that is subject to property taxes Potential Property Tax Exemptions The major proposed amendments to the State Constitution related to property taxes on the November 2012 general election ballot were defeated but it is conceivable that one or more of them will be revisited in the future Amendment 11 would have authorized the Legislature to allow local governments to increase exemption amounts for low-income seniors who have maintained permanent residency for at least 25 years The Legislative staff estimated that this would have had a negative impact on local government revenues of more than $9M statewide beginning in FY2015
Pinellas County Budget Forecast FY2014-2023 E-14
GENERAL FUND
Amendment 10 would have increased the amount of the tangible personal property exemption from $25000 to $50000 The Legislative staff estimated that this would have had a negative impact on local government revenues of more than $20M statewide beginning in FY2014 Amendment 4 included three proposed expansions of property tax exemptions The first would have reduced the cap on the annual change in taxable values for non-homesteaded property from 10 to 5 The second would have allowed the Legislature to eliminate the ldquorecapture rulerdquo and prevent the assessed value of a property from increasing when its market value declines even if the assessed value is less than the market value The third would have granted an additional initial homestead exemption of 50 of market value to homeowners who had not had a homestead exemption in Florida in the previous 3 years The Legislative staff estimated the cumulative impact of the proposals would have been a revenue loss to local governments of nearly $1 billion statewide by FY2016 The Florida Association of Counties estimated the potential revenue loss for Pinellas County at $37M in FY2014 growing to $127M annually by FY2017 Other new exemptions as well as revenue and expenditure caps have been discussed and their passage in future legislative sessions or referendums would have negative revenue impacts as well Annexations In the unincorporated area the property tax base and revenue in the MSTU would be affected by annexations or by the creation of new municipalities If a significant reduction in the tax base occurs costs could be spread across a much smaller population There are two basic methods of annexation in Florida annexation by referendum and voluntary annexation According to a Pinellas Planning analysis from FY2001 through FY2011 approximately 8000 acres representing $12 billion in taxable value was removed from the MSTU through these processes Annexation activity both referendum and voluntary was significantly lower during fiscal years 2008 through 2011 than in the previous seven years As property values begin to rise again there may also be an increase in proposed annexations A thorough reevaluation of the scope and delivery methodology for MSTU services would be required if these changes reach a tipping point in the economies of scale Economic Conditions The three other major revenue sources ndash Sales Tax Revenue Sharing and Communications Services Tax - are highly sensitive to economic conditions If the economy improves collections could be higher than anticipated as disposable income increases The reverse would be true if the economic recovery stalls or deteriorates into a new recession The Sales Tax is highly sensitive to economic conditions If consumer confidence does not continue to improve consumption will not grow at the moderate pace assumed in the forecast The University of Floridarsquos Consumer Confidence Index was down slightly in November and December 2012 from its post-recession peak of September and October possibly due to media attention on the looming federal ldquofiscal cliffrdquo The 35 to 40 annual growth in the Sales Tax
Pinellas County Budget Forecast FY2014-2023 E-15
GENERAL FUND
forecast for FY2014 generates about $13M to $18M in additional revenue each year which would be impacted by variations from the anticipated economic recovery assumptions The forecast assumes that the sources tied to Revenue Sharing will grow at 25 per year a rate slightly less than the growth in Sales Tax However as mentioned previously the Statersquos implementation of the Medicaid mandate which holds back funds for the ldquobacklogrdquo of Medicaid billings means that the County will receive less than the full amount for the next several fiscal years This illustrates the point that there is no Constitutional prohibition against the State changing the formula to reduce or eliminate this revenue source unless the funds have been committed for debt service (which is restricted to 50 of the prior yearrsquos proceeds) Pinellas has no Revenue Sharing pledged to support debt and the entire allocation is subject to revision by the Legislature State Budget Impacts For the fourth year in a row the State faced a significant budget gap for its FY2013 budget Current projections for the Statersquos FY2014 budget are more positive but upcoming budget cycles will continue to be challenging given the reliance on sales taxes as the Statersquos primary revenue stream In dealing with upcoming State budget gaps the Legislature may continue to reduce the amount of revenue it shares with local governments or cost shift more state responsibilities to the counties and cities The Medicaid mandate is only the most recent example of this tactic Previously for example effective in July 2005 the countiesrsquo share of sales tax and revenue sharing revenues was decreased in response to the implementation of Article V Section 7 court funding reforms These formula changes can have serious impacts on the General Fund A 10 cut in the Sales Tax formula would reduce revenues by over $38M Similarly there has been repeated pressure from the telecommunications industry to reduce the scope of services that are subject to the Communications Services Tax (CST) The 2012 Legislature approved a bill subsequently signed by the Governor which will have a negative statewide impact on local CST revenues of more than $25M A State commission is currently studying the CST to recommend further structural changes that may lead to even greater reductions in revenue The cumulative negative impact of these changes is undetermined at this time Limiting Factors A cautionary note for long-term planning relates to the scarcity of undeveloped land in Pinellas County We will see relatively fewer new residents in the future compared to other counties with more opportunities for expansion Because the distribution formulas for both shared sales taxes and revenue sharing are partially based on population Pinellas will represent a declining percentage of the state total and therefore the percentage of these revenues will decline also For example in the 2000 Census Pinellas represented 58 of the Statersquos 16 million residents By the 2010 Census Pinellasrsquo population remained virtually the same while the State population grew to 188 million As a result Pinellas represented 49 of the Statersquos population
Pinellas County Budget Forecast FY2014-2023 E-16
GENERAL FUND
in 2010 Although the slowing of overall population growth in the State will delay the effect some erosion will result for those grants and other revenues that are allocated by population-driven formulas EXPENDITURE FACTORS Inflation On the expenditure side of the equation the Consumer Price Index is a key element For consistency the CPI changes used in the forecast are those produced by the State of Floridarsquos National Economic Estimating Conference It should be noted that this is a consensus process which involves the Legislature the Governorrsquos Office and the Statersquos Division of Economic and Demographic Research The intent is to produce a professional nonpartisan basis for development of the Statersquos budget that melds a variety of perspectives and therefore does not necessarily reflect any one participantrsquos economic model Historically although inflation was as high as 125 in 1981 in the years from 1989 to 2008 the change in the CPI averaged about 3 The true inflation rate will have a significant effect on future requirements For example an increase of 1 in the CPI if applied to all FY2013 recurring costs would require an additional $5M in expenditures A change of 1 in the salary and benefits assumptions would produce a cost variance of $3M and an increase in the inflation rate of 1 would result in a $2M change in operating expenses in FY2014 and would trigger escalating impacts going forward Operating expenses have been assumed to generally follow the CPI inflation rate but costs such as fuel and electricity are subject to unforeseeable variations and could impact this scenario Florida Retirement System Because salaries and benefits are such a significant part of General Fund expenditures higher than projected FRS contribution rates or health insurance cost increases could have significant negative impacts The FRS bill approved in 2012 tentatively establishes increased rates for the State 2014 fiscal year (July 1 2013 to June 30 2014) to address the systemrsquos unfunded liability These rates are subject to change in next yearrsquos legislative session The forecast assumes that the State will increase rates significantly to address the unfunded liability over the next four years rather than all at once as contemplated in the 2012 legislation because increases in these rates also have negative impacts on the budgets of State agencies and the school districts After reaching a fully funded level the rates should stabilize but there is a large degree of uncertainty in that the Legislature and Governor have demonstrated that they are willing to make major structural changes to the pension system In addition to this general uncertainty the requirement for employee contributions to FRS had been challenged by a lawsuit filed on behalf of public employees by several labor organizations On January 17 2013 the Florida Supreme Court issued its ruling in this case which upheld the employee contribution requirement This avoided potential increases to employer contributions which could have negatively impacted personnel costs
Pinellas County Budget Forecast FY2014-2023 E-17
GENERAL FUND
Health Insurance Health insurance costs are impacted by inflation and also by the package of benefits offered The extent to which the ratio of active employees to retirees changes will also impact the Countyrsquos employer contributions to the health plans An additional unknown is the effect of Federal health insurance reform on costs and services including any related mandates to programs such as Medicaid Unfunded Mandates No new State or Federal mandates have been included in the forecast As the State deals with its budget problems there is likely to be growing pressure to push expenses down to local governments even while imposing more restrictions or rollbacks on local revenues The 2012 Legislaturersquos Medicaid mandate illustrates this point Theoretically Article VII Section 18 of the Florida Constitution has a prohibition against imposing unfunded mandates on counties and cities In practice the Legislature can avoid this prohibition in many ways through exemptions (such as mandates to enforce criminal laws) or exceptions including declaring that the mandate ldquofulfills an important state interestrdquo and is approved by a 23 vote of both the Senate and House According to a report prepared by the Legislative Committee on Intergovernmental Relations in 2009 alone the Legislature enacted 25 laws containing 74 provisions that imposed mandates on counties and municipalities
Balancing Strategies One of the key financial strategies employed over the past three years has been the creation of a Service Level Stabilization Account (SLSA) in the General Fund The SLSA represents non-recurring funds generated by taking reductions in FY2010 2011 and 2012 over and above what was necessary to balance the budget A total of $286M was accumulated in the SLSA for this purpose The SLSA is being used to cover estimated shortfalls in the General Fund in FY2013 and FY2014 The SLSA helps provide flexibility in the budget to avoid making reductions to the point where revenues bottom out and allows us to bridge to a time when the budget has stabilized and begins to improve Because it is a non-recurring funding source it is very important that we carefully monitor the structural balance of the General Fund as the SLSA is spent down Assuming that the balance in the SLSA is drawn down in FY2014 there are several balancing strategies that could be considered to address the ongoing structural gap in revenues and expenditures Expenditure reductions are an option to be considered The efforts to find efficiencies and streamline operations will continue to be pursued Due to reductions over the last five years General Fund costs have been reduced to the point that any further cuts would directly impact the continuation of programs as well as service levels Between FY2007 and FY2011 reductions
Pinellas County Budget Forecast FY2014-2023 E-18
GENERAL FUND
of over $182 million were made in General Fund agencies and budgeted positions decreased by 1618 or 25 An additional $183 million in budget reductions were taken in FY2012 As a result of these and other changes the total FY2013 General Fund budget of $556054060 is comparable to the FY2005 budget of $556059420 Revenue increases are another option The County is currently collecting less than the maximum allowed majority-vote property tax revenue In 2007 the Legislature enacted new limitations on property tax revenue increases for local governments Super-majority votes of the Board are required if proposed property tax revenue exceeds caps based on the average growth in Florida personal income and new construction The caps went into effect beginning in FY2009 using the FY2008 level of property tax revenue as the base As shown in the chart below capacity under the cap has increased as property tax revenues have decreased There is currently a wide spread between the FY2013 millage rate of 50105 and the cap limit of 83285
Another revenue balancing option is the implementation of a storm water strategy that includes a new dedicated funding source If a dedicated funding source was available approximately $31 million of storm water costs currently funded in the Municipal Services Taxing Unit (MSTU) could be freed up to create additional capacity The County does not have a wide range of other revenue options User fees can be increased but need to be considered in the context of the local marketplace and the effect on economic recovery In past budget processes both County employees and the general public identified potential revenue generating ideas In addition to increasing user fees some of these ideas include a local business tax (formerly known as occupational tax) and payments in lieu of taxes or a return on equity from enterprise funds
Pinellas County Budget Forecast FY2014-2023 E-19
GENERAL FUND
Pinellas County Budget Forecast FY2014-2023 E-20
TOURIST DEVELOPMENT COUNCIL FUND
Description The TDC Fund is a special revenue fund that accounts for the 5 tourist development tax (ie bed tax) on rents collected for temporary lodgings Section 1250104 Florida Statutes was enacted by the State in 1977 The Board of County Commissioners enacted an ordinance in 1978 to levy a 2 tax to promote tourism in Pinellas County and was approved at a referendum held on October 5 1978 In 1988 the ordinance was amended to increase the tax by an additional 1 with one-half of this amount earmarked to fund beach re-nourishment projects In January 1996 an additional 1 was levied to provide additional funds for promotional activities beach re-nourishment and to service debt on the Countys obligation to the City of St Petersburgs bonds for Tropicana Field In December 2005 an additional 1 was levied to provide funding for promoting and advertising tourism In November 2010 the Board approved an extension of the 5 tourist development tax to 2021 The forecast continues the 5 tax through FY2023 The fund supports the Tourist Development Council serving as Visit St PeteClearwater through the bed tax The bed tax is used to enhance the Countyrsquos economy by increasing tourism and direct visitor expenditures through marketing and promoting the destination
Summary The Tourist Development Council (TDC) Fund is primarily funded by tourist development taxes that are extremely sensitive to general economic conditions Tourist Development tax revenues have been steadily improving since Spring 2010 and reached record levels in FY2012 FY2013 revenues are estimated to grow 4 beyond actual receipts for FY2012 and are anticipated to continue to increase conservatively at 35 in FY2014 Beyond FY2014 projections continue to increase by 30 annually through the forecast period matching anticipated gradual growth as part of the recovery in the broader US economy The forecast for the Tourist Development Council Fund shows that the fund is balanced through the forecast period Through FY2015 more funds are available for additional advertising based on the assumption that the promotional activities budget will be adjusted to reflect any revenue increases or decreases while maintaining a 15 reserve balance Beginning in FY2016 the fund is forecast to have additional capacity once the debt service on Tropicana Field and the Dunedin Spring Training Facility is paid off in 2015 The additional capacity could be dedicated to new capital outlay as with the Board approved Salvador Dali Museum funding new debt service or to supplement the promotional activities budget In FY2010 the Board revised the Tourist Development Plan to allow funding of capital projects for non-profit museums that are open to the public The Board also approved a review of the Tourist Development Plan every five years
Revenues The TDC Fund consists almost exclusively of one primary funding source tourist development taxes
Pinellas County Budget Forecast FY2014-2023 E-21
TOURIST DEVELOPMENT COUNCIL FUND
Tourist Development Taxes Tourism is a key economic driver of the economy in Pinellas County and contributed direct and indirect visitor expenditures of approximately $73 billion during calendar year 2012 (source Research Data Services Inc) The Tourist Development Tax is projected to generate $299M in FY2013 Tourist Development tax collections are very sensitive to economic conditions due to the close relationship between disposable income and leisure travel The following chart showing a 6-month moving average of collections from October 2007 to October 2012 indicates that collections bottomed out at the beginning of 2010 but have been rapidly increasing again as the economy has begun to rebound Over the past year the rebound in tax revenue has outpaced the overall economy This chart demonstrates how sensitive tourist tax collections are to economic and other conditions and why having reserves to withstand changing conditions is necessary
In addition transient rental occupancy increased at least 2 in each month from January to September of 2012 as compared to the same one-month period in 2011 FY2012 actual revenue totaled $287M which was a 124 increase over FY2011 FY2013 revenues are projected to increase by another 40 and FY2014 by 35 From FY2015 through FY2023 collections are expected to increase 3 annually as the general economic recovery continues While recent trends may suggest a stronger rate of recovery the long-range forecast is conservative due to the sensitivity of this revenue source
Pinellas County Budget Forecast FY2014-2023 E-22
TOURIST DEVELOPMENT COUNCIL FUND
The chart below compares visitor origins tracked by Research Data Services Inc (RDS) with year-to-date figures for November 2011 and November 2012 and it shows a net overall increase of 39 Within this figure the Southeast visitor segment increased 66 and European visitors increased 74 Latin America has been added to the table as a visitor segment to track and it shows strong growth with an increase of 544 between August 2011 and August 2012
Calendar Year-to-Date through Novrsquo11 and Novrsquo12
Visitor Origins 2011 2012 Change
Florida 634689 641863 +11
Southeast 307389 327523 +66
Northeast 1115171 1151945 +33
Midwest 1456771 1481345 +17
Canada 290857 304839 +48
Europe 831904 893188 +74
Other US Markets 130519 131497 +07
Latin America 42800 66100 +544
Total 4810100 4998300 +39
Source November 2012 Visitor Profile Research Data Services Inc Latin American numbers are through August 2011 and 2012
The European visitor segment represents about 18 of total visitors tracked by RDS Although a slight recession is anticipated for the Eurozone the number of European visitors is not anticipated to decrease due to the characteristics of the market segment and increased access to the destination European visitors to Pinellas are a younger wealthier market segment generally insulated from economic cycles In addition the European market will gain increased access from additional air service providing easy access to the destination from cities throughout Europe and Germany For example in May 2012 Edelweiss Air started twice weekly non-stop flights from Tampa to Zurich Switzerland The next chart lists the Annual Average Daily Rate (ADR) that hotels are able to collect and the number of Annual Overnight Visitors since 2000 As a result of hurricanes red tide and the economic downturn ADR stayed flat from 2007 to 2010 and visitor counts declined from a peak of 53M in 2007 Since 2010 ADR and visitor counts have rebounded
Pinellas County Budget Forecast FY2014-2023 E-23
TOURIST DEVELOPMENT COUNCIL FUND
Year
Annual ADR
Annual
Overnight Visitors
2000 $7162 4700140 2001 $7416 4726161 2002 $7316 4714432 2003 $7491 4837998 2004 $7811 5077280 2005 $8432 5212435 2006 $9318 5254255 2007 $10000 5300220 2008 $10438 5193980 2009 $10171 4991410 2010 $10015 5041200 2011 $10483 5235200 2012 $11317 5435000
Source Research Data Services Inc
Expenditures The TDC Fund supports budgeted expenditures and reserves in FY2013 totaling $344M The primary expenditures in the fund are $185M for operations and promotional activities $66M for debt service for three sports facilities $37M for two transfers and $56M in reserves
Pinellas County Budget Forecast FY2014-2023 E-24
TOURIST DEVELOPMENT COUNCIL FUND
Operations and Promotional Activities The discretionary expenditure budget of $185M includes the staff operations and promotional activities that promote the St Petersburg Clearwater destination Promotional activities are primarily comprised of the advertising contract with the balance of the funding supporting such programs as sponsorships publicity and promotion via technology The promotional activities budget was increased in FY2012 due to the higher actual collections as compared to budget Sufficient revenue to support $1M in additional advertising was anticipated and appropriated in the FY13 budget The next chart from the Convention and Visitors Bureau provides allocations in the discretionary operations and promotional budget (without debt payments transfers and reserves)
Convention amp Visitors Bureau Operations amp Promotional Expense
Expenses FY 2013 of Operations
Operating amp Capital Outlay $ 821370 44
Personnel $3211630 173
AdvertisingDirect Sales $13437690 725
Research $ 235000 13
ShippingCommunicationsInquiry $ 370000 20
Travel $ 456200 25
Total $18531890 1000
Source Pinellas County Convention amp Visitors Bureau
Undesignated Over the forecast period there are anticipated available funds above the 15 reserve target that are not currently obligated The ldquoUndesignatedrdquo expenditure line in the forecast identifies the amount projected through FY2023 Capital Outlay In FY2010 the Board revised the Tourist Development Plan to allow funding of capital projects for non-profit museums that are open to the public and the Board approved an agreement that provides payments of $500K annually to the Salvador Dali Museum from FY2015 to FY2019 The Board also approved a review of the Tourist Development Plan every five years Debt Service This fund dedicates the proceeds of the 4th cent of tourist development revenue less Tax Collection expense to the City of St Petersburg to fund debt service on bonds for Tropicana Field (expires 2015) At the City of St Petersburgrsquos request ownership of Tropicana Field was turned over to the County by the City in October 2002 as the County is exempt from paying property taxes on the facility The County leases the property back to the City under terms that provide the City the same rights and responsibilities for the property that it had prior to the transfer of
Pinellas County Budget Forecast FY2014-2023 E-25
TOURIST DEVELOPMENT COUNCIL FUND
ownership This fund also pays fixed debt service in the amount of $588K for the City of Clearwaterrsquos spring training facility (expires 2021) and $298K for the City of Dunedinrsquos spring training facility (expires 2015) Transfers The TDC fund transfers half of the proceeds of the 3rd cent to the Capital Projects Fund for beach nourishment projects to support tourism and maintain property values The transfer is budgeted at $32M for FY2013 which is $05M more than the anticipated collections for this half-cent The additional amount accounts for dedicated revenue received in excess of the previous yearrsquos budget for the transfer This fund transfers $494K to the Tax Collector in FY2013 for administration and collection of the tourist development taxes This cost is approximately 17 of collections and is projected to increase by 3 per year through the forecast period Reserves On a budget basis the reserve level in this fund is currently at 16 which is slightly above the reserve level requested by the Tourist Development Council The fund reserve will serve as a fiscal shock absorber in the event tourist development tax revenues deteriorate in response to changes in economic conditions For example tourist development revenues declined dramatically in FY2002 after the September 11th terrorist attack in FY2005 as a result of multiple hurricane landfalls in Florida in FY2009 as a result of the financial crisis and most recently in FY2010 as a result of the British Petroleum (BP) oil spill In order to maintain liquidity in this fund adequate reserves need to be maintained at a minimum level of 10 This fund has several large expenditures such as debt service that come early in the fiscal year while some occur later in the fiscal year Monthly revenues usually peak during the Spring Break and Easter timeframe Since such seasonality occurs for both revenues and expenditures and the fluctuations do not occur together working capital needs are met by using reserves until the revenues are collected
Ten-Year Forecast Key Assumptions The revenue forecast for tourist development taxes reflects increasing growth in the economy with an increase of 35 in FY2014 and an annual increase of 30 through FY2023 On the expenditure side personal services are projected to increase 4 per year Promotional activities (advertising) estimates have been increased to match the increase in revenue through FY2015 Beginning in FY2016 a substantial amount of debt service will be paid off The forecast does not assume that the additional capacity will be re-authorized to service new debt or allocated to supplement the promotional activities budget It does include the additional capital outlay of $500K approved for the Dali Museum beginning in FY2015 and ending in FY2019
Pinellas County Budget Forecast FY2014-2023 E-26
TOURIST DEVELOPMENT COUNCIL FUND
Note This chart reflects forecasted expenditures without the ldquoUndesignatedrdquo amount
Key Results The forecast for this fund from FY2013 to FY2015 shows that revenues and expenditures are in-line while the fund maintains at least a 15 reserve Beginning in FY2016 revenues exceed expenditures by a wide margin as the debt service for Tropicana Field and the Dunedin Spring Training Facility is paid off Even with the Board approved capital outlay to support the Dali Museum for $25M from FY2015 through FY2019 revenues will continue to exceed expenditures The decision point in FY2016 will be whether to continue to use this portion of the proceeds from the 4th cent of tourist development for debt service on sports facilities or use it for other approved tourism development purposes such as promoting and advertising the St PetersburgClearwater destination
Potential Risks There are many impacts that can alter the ten-year forecast of tourist development tax collections The primary concern is the strength of the national economy due to the sensitivity of collections to economic conditions If the economy improves collections could be higher than anticipated as disposable income increases The reverse would be true if the economy deteriorates Increases in fuel costs are also a factor for visitors driving to Pinellas County In the past an increase in hurricane activity has had a negative effect on tourism as have red tide outbreaks in Tampa Bay The appreciation or depreciation of the US dollar also has an impact on the number of international visitors to Pinellas County
Pinellas County Budget Forecast FY2014-2023 E-27
TOURIST DEVELOPMENT COUNCIL FUND
The possibility of offshore drilling in Floridarsquos Gulf Coast could discourage tourism due to the potential negative ecological effects of that industry
Balancing Strategies The forecast does not show any structural gaps in revenues and expenditures as the fund is balanced through the forecast period The assumption is that the promotional activities budget is increased or decreased to match the tourist development tax revenue stream The additional capacity forecast beginning in FY2016 may be applied to newly approved debt service or to other authorized tourism promotion and development activities
Pinellas County Budget Forecast FY2014-2023 E-28
TRANSPORTATION TRUST FUND
Description
The County Transportation Trust Fund is a special revenue fund required by Florida Statute 336022 to account for revenues and expenditures used for the operation and maintenance of transportation facilities and associated drainage infrastructure Activities include road and right-of-way maintenance (eg patching mowing) bridge maintenance and operation traffic engineering traffic signal operation including Intelligent Transportation Systems traffic control signage and striping sidewalk repair and construction and maintenance of ditches culverts and other drainage facilities Resources to support these activities are provided from gas taxes collected and distributed on a shared basis to all Florida Counties by the State of Florida and local option gas taxes levied by the County There are two local option taxes that have been imposed by the Board of County Commissioners The most recent was a one cent levy (referred to by statute as the ldquoNinth Centrdquo) beginning January 2007 dedicated to the installation operation and maintenance of advanced technological traffic signal and messaging systems (Intelligent Transportation Systems) The other local levy is a six cents per gallon tax that is shared by interlocal agreement between the County and all municipalities within Pinellas County The Countyrsquos share of collections is 60 of total receipts and the municipalities each receive portions of the remaining 40 The interlocal agreement will expire in 2017
Summary
The Transportation Trust Fund is primarily funded by state and local fuel taxes and has been impacted by a downturn in collections due to the recessions effect on the number of miles driven and gallons of fuel sold Because of the built out nature of Pinellas County more efficient cars and fuel conservation efforts as well as State law that does not allow indexing fuel taxes for inflation future revenue is projected to continue its slow decline and not keep pace with inflationary increases for expenditures in this fund The forecast for the Transportation Trust Fund indicates that the fund is not in balance beginning in FY2013 resulting in a depletion of fund balance by FY2018 This imbalance primarily results from inflationary pressures on expenditures coupled with the projected reduction in gas tax collections that are based upon the volume of fuel By FY2017 action will need to be taken to manage this future gap such as potential revenue transfers from the General Fund imposition of additional local option gas taxes or reductions in current service levels
Revenues The Transportation Trust Fund consists mainly of three primary funding sources State shared gas taxes ($92 million) a six cent per gallon local option gas tax ($126 million) and a one cent per gallon gas tax (the ldquoNinth Centrdquo) earmarked for the Advanced Traffic Management System Intelligent Transportation System ($37 million) The remaining revenues of the fund include interest and other miscellaneous revenues such as reimbursements from other governments for the Countyrsquos work on municipal and state traffic signal systems
Pinellas County Budget Forecast FY2014-2023 E-29
TRANSPORTATION TRUST FUND
State Shared Gas Taxes This resource is the equivalent of three cents per gallon on motor fuel collected statewide then redistributed to Florida Counties by a formula related to population geographic area and local collections The amount of revenue is driven by the gallons of fuel used and is therefore sensitive to economic activity such as commuting and tourism trips or increases in the price of oil that might reduce demand for gasoline usage The move toward more fuel efficient cars also has an effect in offsetting any population growth that might result in more vehicle trips As a result state shared gas taxes as well as the other gas taxes are anticipated to continue to slowly decline over the forecast period Six Cent Local Option Gas Tax (LOGT) This resource is a six cent per gallon tax on all motor fuel sold within the County including diesel The proceeds are shared with the municipalities through an interlocal agreement stipulating that the County retains 60 of monthly collections and municipalities sharing the remaining 40 Ninth Cent Gas Tax This resource is a one cent per gallon tax on all motor fuel sold within the County including diesel Unlike the Six Cent Local Option Gas Tax the proceeds are not shared with the municipalities This gas tax funds the creation and maintenance of the Advanced Traffic Management SystemIntelligent Transportation System in the county Transfers A transfer of $15 million per year from the General Fund to the Transportation Trust Fund is budgeted beginning in FY2013 to support ongoing operating costs that were reassigned to this fund based on an analysis of the allocation of Department of Environment and Infrastructure expenditures
Expenditures The Transportation Trust Fund supports expenditures totaling approximately $304 million Transportation Programs These expenditures include staff and operating expenses to maintain and operate the Countyrsquos traffic controls bridges roads and associated drainage systems Key program expenditure areas include mowing County right-of-way and ditch maintenance activities ($67 million) traffic signal and traffic control activities ($74 million) and bridge and concrete structures maintenance ($58 million) Intelligent Transportation Systems As a part of improving traffic signal and traffic control activities the County is actively pursuing technological improvements to improve the flow of traffic in Pinellas County This activity is tied to the Ninth Cent gas tax resource and is being focused on high priority traffic corridors in order to size the program to available resources The current operating expenses for this program are approximately $12 million The balance of the available funds are transferred to the Capital Projects Fund
Pinellas County Budget Forecast FY2014-2023 E-30
TRANSPORTATION TRUST FUND
Capital Improvement Project Impacts Some capital improvement projects have the potential to require increased operating expenditures when completed Beginning in FY2014 the forecast includes estimated operating expenditures to support completed capital improvement projects Transfers Since the inception of the Ninth Cent gas tax a transfer takes place annually from the Transportation Trust Fund to the Capital Projects Fund This transfer pays for the installation of capital structures needed to implement the Intelligent Transportation System such as traffic signal controllers fiber optics cameras and message boards Depending upon available revenues after deductions for operating expenses an average of approximately $25 million is transferred annually to the Capital Projects Fund to match state and federal grants available to implement the system on major County and State road corridors Reserves The budgeted FY2013 reserve level of $122 million in the Transportation Trust Fund is approximately 29 which is higher than the 5-15 reserve level budget policy adopted by the Board This is the result of savings gained through recent budgetary reductions and efficiency initiatives The reserve also includes the fund balance previously carried in the Local Option Gas Tax fund which was merged into the Transportation Trust Fund in accordance with new accounting standards (GASB Statement 54) for FY2012 This reserve level is gradually being reduced as expenditures exceed revenues
Ten-Year Forecast Key Assumptions As discussed the main revenue sources for this fund are state shared gas taxes and local option gas taxes The ten-year forecast assumes that the current six cent local option gas tax levy will be extended beyond its current expiration year of 2017 The ldquoNinth Centrdquo levy is in effect until year 2026 Revenue growth assumptions have been based on the States Revenue Estimating Conferences forecast of gallons of motor fuel pumped annually in Florida The Statersquos annual average growth rate is 19 These taxes are based on gallons pumped and not fuel prices Pinellas Countyrsquos built-out condition and the likelihood of future mandated vehicle fuel efficiency standards leads to this forecast assuming a continuing gradual decline in gas tax revenues Based on the historical and future reduction patterns current gas tax revenues are not predicted to keep up with projected inflationary expenditure demand on transportation operation and expenditure needs
Pinellas County Budget Forecast FY2014-2023 E-31
TRANSPORTATION TRUST FUND
Key Results Beginning in FY2013 Transportation Trust Fund expenditures exceed revenues throughout the forecast period which causes a gradual erosion of fund balance until the fund assumes a negative cash position in FY2018 By FY2017 potential revenue and expenditure options will need to be implemented to keep the fund in balance
Potential Risks Impacts on this forecast include macro-economic conditions such as increases or decreases in the price of oil that could affect demand for motor fuel Changes in the price of commodities such as concrete and asphalt could also affect the expenditure side of this forecast as the Transportation Trust Fund activities utilize large amounts of physical commodities An unanticipated increase in fuel conservation efforts an increase in electric vehicles or mass transit efforts could also affect the outer years of this forecast In addition a decision to not extend the current six cent local option gas tax levy would have a major impact (more than $12 million) on this analysis
Pinellas County Budget Forecast FY2014-2023 E-32
TRANSPORTATION TRUST FUND
Balancing Strategies Major strategies to manage the forecasted gap in revenues versus expenditures include a continuation of actions to reduce future costs on the expenditure side transfer of General Fund revenue to support transportation activities or the imposition of additional local option gas taxes From an enhanced revenue standpoint the County has authority to impose an additional five cents tax per gallon of fuel sold within the County however by statute proceeds realized would have to be shared with municipalities Diesel fuel is not subject to this tax The Countyrsquos estimated share of one cent of this local option gas tax is now approximately $19 million which is 60 of the $32 million in proceeds which would be generated countywide
1 cent 2 cents 3 cents 4 cents 5 cents $19M $38M $57M $76M $95M
For comparison purposes other Florida Counties that impose greater local option taxes than Pinellas Countyrsquos seven cents are shown in the following table
Counties Imposing Local Option Taxes Greater
than Seven Cents
Cents Imposed
Alachua 12 Broward 12 Charlotte 12 Citrus 12 Collier 12 DeSoto 12 Hardee 12 Hendry 9 Hernando 9 Highlands 12 Lee 12 Manatee 12 Marion 12 Martin 12 Miami-Dade 10 Monroe 10 Okeechobee 12 Palm Beach 12 Polk 12 Putnam 12 St Lucie 12 Sarasota 12 Suwanee 12 Volusia 12
Source 2012 Local Government Financial
Information Handbook - October 2012
Of Floridarsquos 67 counties
24 levy more than 7 cents 27 including Pinellas Pasco and Hillsborough levy 7 cents 16 levy less than 7 cents
Pinellas County Budget Forecast FY2014-2023 E-33
TRANSPORTATION TRUST FUND
An additional one to five cents is not likely to have a measurable impact on the sale of fuel as normal price differences and fluctuations routinely exceed this amount For this reason there would be little incentive for consumers to redirect their fuel purchases to Hillsborough or Pasco counties if they maintain their current seven cent fuel tax rates The additional five cents may be used for the construction of new roads the reconstruction or resurfacing of existing paved roads the paving of existing graded roads or other expenditures that are needed to meet immediate local transportation problems or are critical for building comprehensive roadway networks Routine maintenance of roads is not considered an authorized expenditure The additional one to five cents could be levied by a majority plus one vote of the Board or by approval in a countywide referendum Another balancing option is the implementation of a storm water strategy that includes a new dedicated funding source If a dedicated funding source was available storm water costs currently funded in the Transportation Trust Fund could be freed up to create additional capacity
Pinellas County Budget Forecast FY2014-2023 E-34
CAPITAL PROJECTS FUND
Description The Capital Projects Fund is used to account for all the governmental capital projects throughout the County Such projects include roads bridges drainage beach nourishment park development and construction of facilities necessary to provide County services
Summary The Capital Projects Fund is used to account for all governmental capital projects throughout the County This fundrsquos primary revenue source is the ldquoPenny for Pinellasrdquo one cent local option sales tax that is very sensitive to general economic conditions Penny tax revenues declined for several years instead of increasing at the original projected rate due to the recession but are predicted to increase gradually during the forecast period matching general economic growth as part of the recovery in the local state and national economy The forecast for the Capital Projects Fund shows that the fund is balanced over the forecast period During several years of the forecast expenditures exceed revenues due to project schedules Additional cash flow necessary in the first half of the ten-year period is being addressed through an interfund loan from the Solid Waste Replacement amp Renewal Fund The forecast includes repayment of the loan from FY2013 to FY2020
Revenues The major revenue components of the Capital Projects Fund are the Penny for Pinellas Grants and Transfers from Other Funds
Local Option Sales Tax (Penny for Pinellas) Penny for Pinellas revenues are proceeds of an additional one cent Local Government Infrastructure Surtax on Sales pursuant to Section 212055(2) Florida Statutes imposed in Pinellas County The authorized use of these funds is generally restricted to infrastructure projects only and cannot be used for ongoing operation and maintenance costs The Penny became effective February 1 1990 for an initial period of ten years and has been extended by referendums in 1997 and 2007 for two additional ten year periods (until 2020) In accordance with statutory requirements and interlocal agreements with each municipality in Pinellas County the County receives approximately 523 of the total monthly collections generated by this tax following the deduction of a dedicated amount for countywide use in improving Court and Jail facilities The Penny for Pinellas is the primary source of revenue supporting the Countys Capital Improvement Program Sales tax as a revenue source is highly elastic and is very sensitive to local and national economic conditions such as inflation wage growth unemployment and tourism Normally sales taxes increase with economic activity and inflation but reflecting the depth of the recent recession collections declined about 15 from FY2007 to FY2009
Pinellas County Budget Forecast FY2014-2023 E-35
CAPITAL PROJECTS FUND
Collections increased in FY2010 and FY2011 due to the transition to the new revenue distribution formula that began in February 2010 and results in a higher percentage of collections going to the County primarily due to the increase in the Courts amp Jail amount from $80M to $225M over the ten year period The revenue increase to the County is misleading as the underlying Penny revenues actually decreased in FY2010 and FY2011 In FY2013 and FY2014 the Penny is anticipated to increase 35 which is consistent with the general improvement in the economy The chart below shows the fluctuation in annual growth rates experienced since FY2000
Grants The second largest sources of revenue in the Capital Projects fund are grants The FY2013 budget includes $327M in local state and federal grants from agencies like the Southwest Florida Water Management District and the Florida Department of Transportation Grant revenues are highly variable over the forecast period The forecast only includes grants that either have been awarded or are highly anticipated to be awarded
Transfers from Other Funds The Capital Projects Fund also receives several transfers from other funds to cover or contribute to costs for specific capital projects
Pinellas County Budget Forecast FY2014-2023 E-36
CAPITAL PROJECTS FUND
The FY2013 and FY2014 Budgets include a transfer of $175M and $450M respectively from the Solid Waste Renewal and Replacement Fund as part of the interfund loan to the Capital Projects Fund On September 21 2010 the Board approved a resolution authorizing an interfund loan amount of up to $85 million in lieu of a $150M bond issue originally planned to finance key projects in the 2010 to 2020 Capital Project Fund The outstanding principal in FY2013 will be $325 million (including the FY2013 loan amount of $175 million) The annual rate of interest is a variable rate which is currently less than 1 Payments on outstanding loan principal are required to begin no later than FY2016 and the loan shall be paid in full no later than December 31 2019 The benefits of an interfund loan versus bonding include lower borrowing costs no reserve requirements interest accrues to a county entity and more flexibility in the implementation and terms of the loan The loan is being tracked separately for the Centralized Chiller Facility project vs the cash flow needed for capital projects in total The loan amount for capital projects consists of $15 million in FY2010 $100 million in FY2013 and $45 million in FY2014 The principal payments for the $70 million loan for capital projects is budgeted for FY2015 ndash FY2020 The loan amount for the Centralized Chiller Facility project is $75 million in the FY2013 budget The principal payments for the Centralized Chiller project is budgeted for FY2013-FY2017 This project funds the construction of a new centralized chiller facility for the downtown Clearwater campus The County will purchase chilled water at a set rate based on the amount of investment towards the cost of the facility Fully funding this project is estimated to result in $507K of annual savings $38M of cost avoidance and potential revenue opportunities of $300-400K a year The total project cost is estimated at $120M of which $15M of design costs are being paid for by a federal grant from the Department of Energy and $30M was allocated from non-recurring funding in the General Fund in the FY2011 Budget The General Fund transfer in FY2013 for $18 million covers the cost of two items The first item is $300K of recurring capital costs paid for by recurring revenue from the implementation of the new parking fees at Fort De Soto Park and Howard Park Beach amp Causeway These funds will be used annually to maintain and improve the bathhouses at the two parks The second item is $15 million for the principal payment on the Centralized Chiller Facility project The FY2013 transfer of $22M from the Transportation Trust Fund (proceeds of the 9th cent Local Option Gas Tax) contributes to the cost of several Intelligent Transportation System Advanced Transportation Management System projects The FY2013 transfer of $32M from the Tourist Development Council Fund (half of the proceeds of the 3rd cent) funds beach nourishment projects in the Coastal Management area The Transportation Impact Fee Fund is used to account for Transportation Impact Fees collected throughout the County thus assuring that new development bears a proportionate share of the cost of capital expenditures necessary to meet transportation needs of the County The transfer of $16M from the Transportation Impact Fee Fund in FY2013 is to cover or
Pinellas County Budget Forecast FY2014-2023 E-37
CAPITAL PROJECTS FUND
contribute to the current or past costs of authorized transportation projects in the twelve geographic transportation impact fee districts of the county
Expenditures Expenditures in the Capital Projects Fund consist of capital project expenditures and debt service costs Capital Projects The majority of expenditures in the Capital Projects fund are for infrastructure projects in the areas of transportation storm water drainage and water quality parks environmental preservation courts jails public safety and other public facilities Planned expenditures in this fund over the forecast period cover the project allocations from the 2010 to 2020 Penny Program Please see the ldquoCapital Improvement Programrdquo section of the FY2013 Budget Message for expenditure highlights of the One-Year CIP and the Ten-Year CIP Debt Service Debt service costs over the forecast period are associated with the interfund loan from the Solid Waste Renewal and Replacement Fund The loan consists of $70M to help necessary liquidity in the Capital Projects Fund related to the acceleration of projects in the first half of the 2010-2020 Penny Program and $75M for the balance of the remaining cost for the Centralized Chiller Facility This project has already been funded $15M by a Department of Energy grant and $30 by non-recurring funds in the General Fund
Ten-Year Forecast Key Assumptions The revenue assumptions for the overall Penny sales tax are consistent with the Half-Cent sales tax in the General Fund at 40 growth from FY2014 to FY2020 However the growth rate in the Capital Projects Fund for the Penny sales tax is less at 35 growth in FY2014 and 30 growth from FY2015 to FY2020 This is because the Courts amp Jail allocation is a fixed amount that does not grow over time resulting in a slightly smaller growth rate for the Countyrsquos overall share of the Penny The expenditure assumptions for the Capital Projects Fund assume consistency with the 2010 to 2020 Penny Program allocations
Pinellas County Budget Forecast FY2014-2023 E-38
CAPITAL PROJECTS FUND
Key Results The forecast for the Capital Projects Fund shows that the fund is balanced over the forecast period During several years of the forecast expenditures exceed revenues due to project schedules Additional cash flow necessary in the first half of the ten-year period is being addressed through an interfund loan from the Solid Waste Renewal amp Replacement Fund A primary driver of cash flow is $81M of expenditures associated with the Public Safety Complex project that started in FY2012 The forecast includes repayment of the loan from FY2013 to FY2020
Potential Risks There are many impacts that can alter the ten-year forecast of the Penny tax collections The primary concern is the strength of the local economy due to the sensitivity of collections to economic conditions If the economy improves collections could be higher than anticipated as consumer activity increases The reverse would be true if the economy deteriorates There are risks of increases in major commodities used in capital project construction such as steel or concrete such as those the County experienced in 2005-2007 where prices escalated as much as 60-80 for these key materials
Pinellas County Budget Forecast FY2014-2023 E-39
CAPITAL PROJECTS FUND
Balancing Strategies The forecast for the Capital Projects Fund shows that the fund is balanced over the forecast period The assumption is that expenditures will be decreased or increased to match the Penny for Pinellas and other revenue streams that support the CIP
Pinellas County Budget Forecast FY2014-2023 E-40
EMERGENCY MEDICAL SERVICE FUND
Description The EMS Fund is a special revenue fund established by referendum in 1980 which allows up to 15 mills to be levied annually on a county-wide basis to finance the operation of a comprehensive county-wide emergency medical service system This system provides advanced life support emergency medical response and transport services to all citizens of Pinellas County The County maintains EMS contracts with 18 fire service agencies (first responders) and one ambulance provider (Paramedics Plus operating in Pinellas County under the trade name ldquoSunstarrdquo) The EMS System is funded by a combination of property taxes and ambulance user fees The ambulance user fees support the ambulance contractual expenditures and property taxes are intended to support the first responder expenditures The EMS System was established by referendum in 1980 by the Special Act (Chapter 80-585 Laws of Florida) that created the EMS Authority as a Dependent Special District In 1988 Pinellas County Ordinance 88-12 solidified the current EMS system design The Fiscal Policy guidelines within Ordinance 88-12 state that the Board of County Commissioners sitting as the Emergency Medical Services Authority directs the following fiscal policy guidelines that governs the financial operations of the Countyrsquos EMS system (a) to establish sound business controls and long term cost containment incentives throughout the County EMS system (b) to provide adequate funding to upgrade all EMS components to state-of-the-art-levels and to maintain that progress in future years (c) to provide for long term financial stability sufficient to sustain quality EMS operations far into the future (d) to reduce the County EMS systemrsquos excessive dependence upon local tax support by developing a more balanced approach to EMS funding and (e) to provide the Board of County Commissioners with a wider range of EMS financing options than have been available in the past
Summary The Emergency Medical Service (EMS) Fund is sensitive to property values as it is funded by ad valorem (property) tax revenue collected from property owners countywide and ambulance user fee revenues Property tax revenues have declined dramatically in recent years due to a downturn in property values and statewide legislation The forecast for the EMS Fund indicates the fund is not balanced over the forecast period On the revenue side the FY2013 Adopted Budget included an increase of 00652 or 77 in the countywide EMS millage rate from 08506 to 09158 With this increase the EMS budget maintains the status quo with respect to level of service and the delivery system The millage increase is not enough over the forecast period to fund the system and maintain the fundrsquos reserve at 25 pursuant to Board policy adopted by ordinance The forecast estimates the reserve at 252 in the FY2013 ending fund balance The estimated percentage decreases to 203 at the end of FY2014 and 130 by the end of FY2015 if the tax rate is not increased again or expenditures are not significantly reduced Though this level is improved from the last forecast expenditures in the EMS Fund are still projected to exceed revenues by an increasing amount each year from FY2013 through FY2023 In FY2016 the projected reserve drops below 4 This leaves approximately $4M in the fund balance for the projected $12M deficit in FY2017
Pinellas County Budget Forecast FY2014-2023 E-41
EMERGENCY MEDICAL SERVICE FUND
Future expenditure savings will be addressed with the results of an operational study and accounting study that are underway to analyze variations of EMS service under consideration for Pinellas County In late 2011 the Pinellas County Legislative delegation created an EMS Fire Transport Special Committee to select a nationally recognized firm that would operationalize analyze and compare costs for three variations of EMS service 1) the current EMS system 2) the system as proposed in the Integral Performance Solutions Study and 3) the Sanford-Millican proposal for fire based transport The current ambulance service contract is in effect through FY2014 with a one year extension option First responder contracts are currently funded based on actual first responder costs as defined in Board Resolution 09-38 It is expected that a combination of revenue increases and expenditure savings will be needed to make up for deficits in prior years and increase reserves to a sustainable level throughout the forecast period
Revenues The primary funding sources for the EMS Fund are ambulance user fees and property taxes Ambulance User Fees The ambulance service user fees provide funding for the ambulance program which includes the ambulance provider (Paramedics Plus) contractual expenditures ambulance billing costs and ambulance program support costs Ambulance user fees are based on transport volume and transport charges An average retail rate charge is $620 per transport The County bills Medicare Medicaid private insurance and various other payors for transport service Billing for the service is done by Pinellas County The collection rate is currently about 70 (net of MedicareMedicaid non-allowable charges) of billing for the transport service The County handles transports for non-emergencies and mental health transports as well The County utilizes the 9-1-1 System to dispatch calls for the proper response to the call Ambulance user fee revenue is projected to reach $446M in FY2013 and then increase by 2 annually over the forecast period The Board of County Commissioners has the authority to increase ambulance user fees as necessary In addition Board Resolution 89-208 calls for an automatic increase in user fee rates by the percentage increase in the medical consumer price index for the previous year until the prudent reserve level is reached (25) The retail rate increased 33 in FY2012
The County also offers an ambulance user fee membership program that citizens can join to minimize the cost of EMS transports Membership revenue is projected to generate $200K per year through the forecast period
Property Taxes Property taxes are used to fund the first responder program Property tax revenues have decreased significantly since FY2008 due to legislative rollbacks the passage of Amendment One the decline in the real estate market and the recession
Pinellas County Budget Forecast FY2014-2023 E-42
EMERGENCY MEDICAL SERVICE FUND
The EMS millage rate is a county-wide millage rate that remained flat at 05832 from FY2008 through FY2011 During this period ad valorem revenue decreased each year from $426M in FY2008 to $306M in FY2011 The Board of County Commissioners has the authority to increase or decrease the millage rate and in FY2012 the millage rate was increased to 08506 This resulted in Ad Valorem revenues recovering to $422M and finishing FY2012 with a net gain in revenues over expenditures For FY2013 a millage rate of 09158 was approved in order to balance the budget and approach a beginning balancereserve of 25 (level set by County Ordinance approved by the Board on December 20 2011) The millage cap for this revenue is 15000 mills and the rollback rate for FY13 was 08698 With the millage increase tax revenue increased $21M from actual FY2012 to estimated FY2013 but the EMS Fund is still projected to use $09M from the fund balance Without another millage increase or significant expenditure reductions in the next two years the fund balance continues to decrease each year until it is depleted in FY2017
Emergency Medical Service Fund
Ad Valorem Revenue amp Millage History
Fiscal Year Millage Budget $ (000s)
2013 09158 $ 438
2012 08506 $ 416
2011 05832 $ 300
2010 05832 $ 336
2009 05832 $ 383
Note Budget figures are at 95 of revenue
Expenditures The Emergency Medical Service Fund supports budgeted expenditures in FY2013 totaling $906M for its operations The primary expenditures in the fund are $382M for payments to the ambulance contractor $402M for contractual payments to the eighteen first responders $13M for transfers to the Property Appraiser and Tax Collector $107M in program support and billing of ambulance claims and $200K in the Trust Fund Grant The reserve is estimated at $219M for FY2013 which is $5M above the budgeted level due to a combination of FY2012 actual revenues being $3M higher and actual expenditures being $2M lower than budget The reserve is still projected to decline as expenditures exceed revenues through the forecast period Ambulance Contractor Payments The County contracts with Paramedics Plus for the Countyrsquos SUNSTAR ambulance system Contracts with the Countyrsquos ambulance provider were renegotiated in FY2012 with an annual reduction to base service payments of $2 Million A 6 increase is included in the forecast from FY2014 through FY2023 to account for annual CPI increases and increases to transport volume However once the contract is up for negotiation expenditures may change as the economy rebounds and fuel and labor costs and other factors change
Pinellas County Budget Forecast FY2014-2023 E-43
EMERGENCY MEDICAL SERVICE FUND
First Responder Contractual Payments The County contracts with the eighteen first responder EMS providers that respond to calls using paramedics and that utilize Advanced Life Support (ALS) or Basic Life Support (BLS) equipment and personnel During FY2013 budgets submitted by the 18 agencies included an overall increase of 5 This 5 annual growth rate continues through the forecast period to FY2023 In FY2013 the first responder agreements also include an agreement of $356K to Eckerd College for basic life support water rescue EMS Program Support Costs The County incurs program support costs (Personal Services and Operating Expenditures) to support the EMS program These costs are allocated between the ambulance function and the first responder function Costs allocated to both functions include the Office of the Medical Director St Pete College training expenses communication and EKG equipment and maintenance and personnel and operating expenses to administer all contracts within the program The FY2013 Ambulance program support expenditures of $63M pay for those support items listed above and the ambulance billing function that includes a staff of 34 The FY2013 First Responder program support expenditures of $44M include those allocated support items listed above Transfers The Emergency Medical Service fund has transfers to the Property Appraiser and Tax Collector to cover the costs for collection of ad valorem revenues FY2013 costs for this function are $13M The commissions for the Property Appraiser and Tax Collector are pursuant to Florida Statutes Reserves Pinellas County Ordinance 88-12 which was amended with Resolution 89-208 authorizes the establishment of a prudent reserve equal to one-third of the annual budget for this fund On December 20 2011 the Board approved changing the prudent reserve amount to 25 Reasons for such a high reserve level include disasters such as a hurricane where a large amount of equipmentvehicles may need to be replaced quickly to sustain EMS service and enough working capital for a potential transition if contract requirements are not met by the service provider In addition this reserve level will provide cash flow needs in the event of interruptions to ambulance collections due to a disaster or a Medicare andor Medicaid audit With high monthly contractor payments it is critical cash flow needs are met With FY2012 actual revenue coming in $3M higher than budget and actual expenditures at $2M less than budget the year ended with the reserve at 28 On a forecast basis with Ad Valorem revenue at 96 and Ambulance revenues at 100 the estimated reserve level is projected at 252 for the end of FY2013 Without additional increases in the millage rate or substantial decreases in expenditures the reserves are forecasted to decline to 185 in FY2014 and 105 in FY2015
Pinellas County Budget Forecast FY2014-2023 E-44
EMERGENCY MEDICAL SERVICE FUND
The net increase in the FY2012 ending balance pushes the projected depletion of remaining reserves out to FY2017
Ten-Year Forecast Key Assumptions The EMS countywide millage is assumed to remain at the FY2013 approved rate of 09158 mills through the forecast period Taxable values should begin to recover as the economy improves and the housing market rebounds Ad Valorem tax revenue is projected to grow 25 in FY2014 and FY2015 followed by a 3 annual growth factor from FY2016 to FY2023 During the forecast period ambulance revenue user fees are estimated to increase by 20 which aligns with projected increases to transport volume First responder contractual expenditures increased 5 from FY2012 to FY2013 and are estimated to increase at 5 per year through the forecast period Contractual payments to the ambulance contractor are assumed to increase by 6 through the forecast period as contracted expenditures will increase due to increased transport volume and increases in the CPI as stipulated in the contract The County will work with the provider to negotiate the lowest possible contract while still maintaining quality service
Pinellas County Budget Forecast FY2014-2023 E-45
EMERGENCY MEDICAL SERVICE FUND
Key Results In the chart for the total EMS Fund above the forecast shows expenditures exceeding revenues over the forecast period Balance for FY2013 is achieved through the FY2013 millage rate increase and use of reserves Without another millage rate increase andor expenditure savings reserves will be exhausted after FY2016 This assumes no changes to the EMS system design
Potential Risks A major variable impacting future revenues for this fund is ad valorem revenue and taxable values As taxable values begin to rebound the opportunity for higher revenues may increase If market values grow more slowly or decline revenue would be negatively affected Another factor in future revenues will be ambulance user fee revenues The ambulance contract will be up for re-negotiation in FY2014 with potential impacts to expenditures Tourism and inflow into the local area of more visitors and residents will impact the number of users of the EMS system Continued aging of the general population (baby boomers) could result in more transport volume in the ambulance area Results from the operational study may impact future revenues and expenditures for the EMS system particularly if significant changes are made to the system design
Balancing Strategies The forecast shows that the fund is not in balance over the forecast period Future balancing strategies will be developed from information gathered in the EMS system operational study
Pinellas County Budget Forecast FY2014-2023 E-46
FIRE DISTRICTS FUND
Description In 1973 a Special Act of the Florida Legislature (Chapter 73-600 Laws of Florida) created the Pinellas County Fire Protection Authority This special legislation subsequently assumed ordinance status as Article II Chapter 62 of the Pinellas County Code The Board of County Commissioners is designated as the Fire Protection Authority with responsibility to ldquoestablish and implement a permanent plan of fire protection for Pinellas County and each of its municipalitiesrdquo and levy ad valorem taxes to fund fire protection services within these districts At present the Fire Districts Fund consists of twelve separate municipal services taxing units (MSTUs) that provide fire protection services in the unincorporated areas of Belleair Bluffs Largo Clearwater Dunedin Gandy Largo Pinellas Park Safety Harbor Tarpon Springs Seminole High Point Tierra Verde and South Pasadena These districts were formed at differing times after the electors in the affected unincorporated areas approved their creation and the levy of ad valorem taxes to fund fire protection Those Fire Districts that were created under Chapter 73-600 Laws of Florida receive compensation based on the pro rata share of the fire departmentrsquos budget in each fire district The pro rata share is allocated based on the value of real property for the unincorporated area in that district
Summary The Fire Districts Fund provides fire protection service to the unincorporated areas of Pinellas County through twelve separate dependent fire protection districts that are funded entirely by ad valorem taxes collected from property owners within these districts This fund forecast is presented in a high-level consolidated manner Budgetarily each Fire District is balanced separately Property taxes have declined dramatically in recent years due to a downturn in property values and statewide legislation As the housing market is recovering property tax revenues are forecast to increase 20 in FY2014 and FY2015 A 25 growth factor continues through the forecast period The forecast for the Fire District Fund indicates that the fund is not balanced through the forecast period Millage rates increased for five of the twelve fire districts in FY2013 The millage rate for the South Pasadena Fire District decreased substantially with a change in contracted service provider Additional increases to millages for the individual fire districts will likely be necessary to cover expenditures over the forecast period Potential millage rate increases will need to take into account the individual millage caps in each fire district
Revenues The Fire Districts Fund consists of primarily one funding source property taxes (ad valorem revenue)
Pinellas County Budget Forecast FY2014-2023 E-47
FIRE DISTRICTS FUND
Property Taxes Property tax revenues have decreased significantly over the last several years due to legislative rollbacks the passage of Amendment One the decline in the real estate market and the recession These revenues are affected by taxable values for properties in the local economy Overall property taxes are budgeted to generate $148M in FY2013 across all districts Each dependent fire district has a separate ad valorem millage rate that is the sole revenue source for each of the fire districts The next chart illustrates five of the fire districts that required an increase in millage rates in FY2013 to fund fire service provider expenditures The five districts were Clearwater Dunedin Largo Safety Harbor and Tierra Verde The millage rate for the South Pasadena Fire District was reduced from 31257 to 09137 in FY2013 as significantly less revenue was needed to fund a new service contract with the City of St Petersburg In FY2012 Public Safety Services requested provider bids for fire service to the district The lowest bid was from St Petersburg at $75000 for an annual contract over five years beginning in FY2013 This was $175000 less than the bid from the City of South Pasadena which had the annual service contract prior to FY2013
Dependent MSTU Fire Protection Districts
Ad Valorem Millage Rates amp Millage Rate Caps
Millage Rate Caps
FY13 Adopted Millage
FY12 Adopted Millage
Variance FY13FY12 Millages
Belleair BluffsLargo 50000 17320 17320 00000
Clearwater 50000 32092 26591 05501
Dunedin 50000 35525 22576 12949
Gandy 50000 22602 22602 00000
Largo 50000 35609 35133 00476
Pinellas Park 50000 23675 23675 00000
Safety Harbor 50000 27631 26800 00831
Tarpon Springs 50000 23745 23745 00000
Seminole 100000 19581 19581 00000
High Point 100000 41916 41916 00000
Tierra Verde 30000 19118 19087 00031
South Pasadena 50000 09137 31257 -22120
Pinellas County Budget Forecast FY2014-2023 E-48
FIRE DISTRICTS FUND
Each district is subject to a mandated millage cap The millage cap threshold for Belleair Bluffs Clearwater Dunedin Gandy Largo Pinellas Park Safety Harbor Tarpon Springs and South Pasadena are set at 5 mills while Seminole and Highpoint have a 10 mill cap Tierra Verde has the lowest millage cap at 30 mills which was increased by the Board from 15 mills in June 2010 to meet increasing operating expenditures The next chart shows the variation in the taxable values between unincorporated fire districts due to the composition of properties within the districts eg beach properties condominiums etc For nine of the 12 Fire Districts FY2013 taxable values decreased from the prior year due to the continued decline in the real estate market Three districts gained taxable value in FY2013 recovering some of the lost value through FY2012
Unincorporated Fire Districts
Percentage Change in Taxable Values FY20122013
Taxing Authority FY12 Taxable
Values FY13 Taxable
Values Chge
Belleair BluffsLargo 281332094 267962625 -475
Clearwater 888428781 831260703 -643
Dunedin 280773821 279367691 -050
Gandy 46246094 45444402 -173
Largo 534088892 512659658 -401
Pinellas Park 268204137 253431862 -551
Safety Harbor 63339041 64246370 +143
Tarpon Springs 168715814 164963370 -222
Seminole 2203015774 2106822294 -437
Highpoint 675532802 657217037 -271
Tierra Verde 714080020 736173857 +309
South Pasadena 99826357 101553248 +173
Consistent with the assumptions for the Countyrsquos Municipal Services Taxing Unit (MSTU) this forecast projects a 20 increase in Ad Valorem revenue for FY2014 and FY2015 From FY2016 through the forecast period this revenue is projected to increase at 25 each year for the unincorporated dependent fire districts
Expenditures The Fire District Fund supports budgeted expenditures and reserves totaling $23M for all twelve districts in FY2013 The primary expenditures budgeted in the fund are $139M for contractual payments to the municipalities and other independent agencies for fire and rescue services FY2013 budgeted reserves are $83M the FY2013 estimate increases the reserve to $9M to reflect a greater than expected FY2012 ending fund balance
Pinellas County Budget Forecast FY2014-2023 E-49
FIRE DISTRICTS FUND
Contractual Fire Payments The forecast includes an annual 40 increase for the service contracts through the forecast period Fire departments submit their operating and capital budget requests on an annual basis and after County review funding is based on the unincorporated pro-rata share of property values within the district The exception is the new contract with the City of St Petersburg for services to the South Pasadena district which is set at $75K per year for five years Administrative Costs Administrative costs from the County are allocated to each fire district based proportionately on the amount of budgeted ad valorem revenue collected This cost has decreased in recent budget years as reductions have been made to this allocation The FY2013 budget is $2645K Operating Expenses for this account reflect the Countyrsquos administrative expenses such as personal services intergovernmental charges and other operating charges that are allocated out to the twelve fire districts Transfers The Fire District fund has transfers to the Property Appraiser and Tax Collector to cover the costs of appraisals and collection of ad valorem revenues These amounts are set by Florida Statute and fluctuate with ad valorem revenue estimates FY2013 costs are estimated at $458K and the annual cost is estimated at 3 of projected ad valorem tax revenue through the forecast period Reserves The reserve level in the Fire District fund fluctuates as a whole but each fire district is evaluated individually The minimum reserve level that each district maintains is 5 reserve for contingency This is at the low end of the 5-15 reserve level budget policy adopted by the Board Several of the individual fire districts currently maintain a 5 minimum reserve including Clearwater Dunedin Gandy Largo and Tierra Verde Safety Harborrsquos contingency reserve was decreased from 10 to 5 in FY2013 which helped reduce the required millage increase Some of the districts including Belleair BluffsLargo Pinellas Park Tarpon Springs and Seminole Fire Districts maintain a 10 reserve level that serves as a buffer to shield the district from economic downturn in their area In FY2013 High Point was able to increase its contingency reserve from 5 to 8 with no increase in millage from FY2012 and South Pasadena increased from 5 to 10 In addition some fire districts set aside funds in Reserve for Future Years for long-term capital projects such as a new fire truck purchase or improvements to a fire station Districts can request these funds with the County sharing its portion of requests based on the unincorporated value of the district
Ten-Year Forecast Key Assumptions The fire district millages are assumed to remain at the approved FY2013 rates through the remainder of the forecast period for each of the districts Property tax revenue is forecasted to
Pinellas County Budget Forecast FY2014-2023 E-50
FIRE DISTRICTS FUND
increase by 20 in FY2014 and FY2015 Annual growth of 25 is projected through the rest of the forecast period as the housing market begins to rebound On the expenditure side the contractual payments to the cities are assumed to increase by 40 through the forecast period which outpaces the property tax revenues for the complete forecast period
Key Results The fire district fund is presented in a consolidated manner for all of the individual unincorporated twelve districts The chart above shows that total fund expenditures are projected to exceed revenues from FY2018 through FY2023 Specific fire districts will vary in how much operating and capital funds are requested how reserves are maintained and how fund balance is utilized So each individual district must be analyzed separately for its specific situation with revenue expenditures and reserves While overall the fund appears to be balanced until FY2018 revenues are outpaced by expenditures sooner in some of the individual fire districts Several of the districts will utilize fund balance during the forecast period to pay for long-term capital projects and current operating expenditures And as the main source of revenue in this fund is property taxes some of the unincorporated fire districts may have to increase millage rates in each budget year to keep up with expenditures
Pinellas County Budget Forecast FY2014-2023 E-51
FIRE DISTRICTS FUND
Potential Risks The major variable impacting future revenues for this fund is ad valorem revenue and taxable values As taxable values begin to rebound the opportunity for higher revenues will increase This is the main driver for increased revenues in the forecast If the districts continue to increase their operating requests at 4 per year and tax revenue grows at an estimated 25 in future years the pressure on increasing millage rates for the fire districts will continue each budget year Another potential impact is annexation of the unincorporated fire district areas As cities increasingly annex more of the available unincorporated properties area there are fewer unincorporated properties to share the burden of service costs The funding formula in most fire districts allows for the remaining unincorporated payment to decrease proportionately The exception to this practice is those Highpoint properties annexed by the City of St Petersburg Another impact to fire service costs would be increased costs of Emergency Medical Service If EMS funding is reduced by the County there is a high probability these same providers may shift those costs to their fire district budget
Balancing Strategies The forecast shows that this combined fund is not balanced through the forecast period This fund cannot be taken as a whole but each district must be looked at individually Unless the ad valorem revenue projection improves further out into the forecast the individual districts will feel pressure to increase their millage rates On the expenditure side the contractual costs from the fire service providersrsquo requests are being reviewed for continued efficiency opportunities Some of the individual districts can continue to use fund balance as long as it is available to them and as long as the minimum reserve of 5 is prudently maintained to continue funding their district personnel and operating expenditures
Pinellas County Budget Forecast FY2014-2023 E-52
AIRPORT FUND
Description In March 1941 construction started for the airport at its present site After Pearl Harbor the airport known as Pinellas Army Airfield was used as a military flight-training base After WWII many army airfields were declared surplus and turned over to cities counties and state sponsors to manage The Pinellas Army Airfield property was granted to Pinellas County by the US Government to operate as a commercial airport It was originally called the Pinellas International Airport and given the airport call letters PIE The Airport Revenue and Operating Fund is used to account for the self-supporting operations of St Petersburg - Clearwater International Airport and its surrounding land uses on the airportrsquos 2000 acres Approximately half of this property is dedicated to the airfield and supporting terminal and other facilities The remaining acreage includes the 129 acre planned development site (former golf course) a 200 acre Airport Business Center and leased industrial commercial and governmental operations All of the entire Airport property is a designated Foreign Trade Zone All activities necessary for Airport operations (eg administration operating and maintenance expense) are included in this fund Also included are airport facility capital improvements which receive federal and state grant funding of up to 95 of costs depending on the type of project with some projects funded 100 when Passenger Facility Charges are included In recognition of the quality of operations and innovative and efficient management the Florida Department of Transportation recognized St Petersburg ndash Clearwater International Airport as the 2010 Commercial Service Airport of the Year In 2011 Allegiant Airlines recognized the Airportrsquos terminal renovation project as their systemrsquos airport construction project of the year
Summary The Airport Operating and Revenue Fund is an enterprise fund that accounts for revenues and expenditures at St Petersburg ndash Clearwater International Airport This includes management of airport properties in addition to airfield operations The airport is self-supporting and no property tax dollars are used to support the operation of the airport Airport revenues have remained stable in recent years due to the rentallease terms and Allegiant Airlinesrsquo popularity Revenues are forecast to increase gradually during the forecast period matching anticipated gradual growth as part of the recovery in the broader US economy The ability to forecast the availability of capital contributions and other grant funding after FY2018 is limited Therefore intergovernmental revenues in FY2019 through FY2023 are forecast at a conservative lower level The forecast for the Airport Revenue and Operating Fund shows that the fund is balanced through the forecast period based on the assumptions that the capital projects budget would be adjusted to reflect the timing and amounts of any grants revenue and that the airportrsquos operating budget would be adjusted to match revenues
Pinellas County Budget Forecast FY2014-2023 E-53
AIRPORT FUND
Revenues Excluding capital contributions and grants the two major funding sources supporting the Airport Revenue and Operating Fund during the forecast period are RentalsLeasesConcession income and AirfieldFlight Line Fees
RentalsLeasesConcessions St Petersburg-Clearwater International Airport which is classified as small-hub airport by the FAA provides commercial and private aviation services for the community The Airport also has a significant amount of land which is leased under long-term leases providing a stable source of revenues Pinellas County Criminal and Juvenile Courts Cracker Barrel Restaurant Dynamet Inc and GE Aviation Systems are just a few examples of long term leases at the airport Forty-five percent (45) of the long-term industrial (non-aviation) land leases are with Pinellas County Also included in this revenue source are concessions operating at airport terminal such as the paid parking car rentals gift shop and restaurant These revenue sources are expected to increase by 2 over the 10 year forecast Long-term leases have a five year adjustment based on the CPI AirfieldFlight Line Airfield fees are charges for the use of the runways and taxiways Flight Line leases are for aircraft parking areas and maintenance hangars These revenue sources are expected to increase by 2 over the 10 year forecast
$00
$20
$40
$60
$80
$100
$120
$140
2013 2014 2015 2016 2017 2018 2019 2020 2021 2022 2023
Mill
ion
s
Airport Revenue amp Operating Fund Major Non-Capital Revenue Sources
Forecasted FY2013-FY2023
AirfieldFlight Lines RentsLeasesConcessions New Property Development
Pinellas County Budget Forecast FY2014-2023 E-54
AIRPORT FUND
The following chart for passenger traffic in 2012 shows that Allegiant Airlines represents 908 of the passengers served on commercial carriers from St Petersburg-Clearwater International Airport Revenues from Terminal concession leases along with airline landing fees and fuel flowage fees are dependent on passenger airline service
Capital Contributions and Grants Capital Contributions funding is in the form of grants from the Federal Aviation Administration (FAA) the Florida Department of Transportation (FDOT) along with Passenger Facility Charges (PFCs) These are the revenue sources typically used for the Airportrsquos capital project funding There are also occasions when Airport Reserves are used to assist with funding of CIP Projects Other Revenues AIRCO Golf Course which had been operating on airport property closed in FY2011 due to significant annual operating losses at the course In FY2010 the course lost $216000 and in FY2011 it lost $139000 As a result of closing the course the Airportrsquos profitability has increased Revenue from new development on this property is not expected to be produced until FY2018
Expenditures The Airport Revenue and Operating Fund supports budgeted expenditures and reserves in FY2013 totaling $329M of which $124M is allocated for capital projects and $114M is reserves
Pinellas County Budget Forecast FY2014-2023 E-55
AIRPORT FUND
Airport Programs Of the remaining $91M in operating expenditures 80 supports the Aviation Services program and 20 the Airport Real Estate program Starting in FY2013 two primary programs were identified for reporting purposes Aviation Services and Airport Real Estate The Aviation Services program consists of all facets of day-to-day aviation activities The Airport Real Estate program oversees and negotiates leases with tenants and future development of the Airport to ensure compliance with Federal Aviation Administration lease requirements Personal Services Personal Services expenses are for the salaries and benefits of the 64 positions needed to operate both programs at the Airport Budgeted Personal Services expenditures in FY2013 total $43M Capital Projects The FY2013 estimate for Capital Projects is $124M These projects receive funding in the form of grants from the Federal Aviation Administration and the Florida Department of Transportation These projects will only commence when the appropriate grants funding is made available The following chart shows the relationship between the scheduling of the revenues and the expenditures of capital projects When additional funds are needed Reserves could be used FY2018 shows preliminary planned improvements such as new T-hangars and expanded cargo ramp
Reserves The total reserve level in the Airport Revenue and Operating fund is budgeted at $114M (40) in FY2013 This reserve level is the result of the Airport building reserves over the past several
$00
$50
$100
$150
$200
2013 2014 2015 2016 2017 2018 2019 2020 2021 2022 2023
Mil
lio
ns
Airport Grant Revenue amp Capital Projects Expenditures
Forecast FY2013 - FY2023
Total Grants Capital Projects
Pinellas County Budget Forecast FY2014-2023 E-56
AIRPORT FUND
years The reserves are then available in the event of unanticipated revenue shortfalls and as well as support future capital funding needs When expenditures in a given year are shown as exceeding revenues the difference is supported by drawing down accumulated reserves including Passenger Facility Charges which must be used for capital projects (See the Reserves chart below) Airport Reserves also include the projected cost of Other Post Employment Benefits (OPEB) as proprietary funds are required by GASB 45 to record the entire annual required contribution (ARC) accrual on the financial statements
Ten-Year Forecast Key Assumptions The revenue forecasts of funding total resources are conservative due to the current economic conditions AirfieldFlight Line revenue for FY2013 is based on the current level of carriers and passenger numbers For FY2014 through FY2023 an increase of 2 per fiscal year is forecast The forecast is conservative as no new carriers have been included RentLeasesConcessions revenue for FY2013 is based on current leasesagreements through the termination of these lease agreements For FY2014 through FY2023 an increase of 2 is forecasted for each fiscal year No new revenue from commercial or industrial development on the former golf course acreage is projected in the forecast until FY2018 However new property development will depend on factors such as site restrictions and future economic conditions The chart below shows that the net of recurring revenues and recurring expenditures is positive through the forecast period
$00
$50
$100
$150
$200
2013 2014 2015 2016 2017 2018 2019 2020 2021 2022 2023
Mill
ion
s
Airport Fund Reserves Forecast FY2013-FY2023
Pinellas County Budget Forecast FY2014-2023 E-57
AIRPORT FUND
With the addition of the Capital expenditures and revenues the chart below tracks the estimated revenues and expenditures in the fund through the forecast period
$00
$20
$40
$60
$80
$100
$120
$140
2013 2014 2015 2016 2017 2018 2019 2020 2021 2022 2023
Mill
ion
s
Airport Fund Forecast FY2014 - FY2023 Excluding Non-Recurring Revenues and Expenditures
Revenues Expenditures
$00
$50
$100
$150
$200
$250
$300
2013 2014 2015 2016 2017 2018 2019 2020 2021 2022 2023
Mill
ion
s
Airport Fund Forecast FY2014 -FY2023 Including Capital Improvement Program
Revenues Expenses
Pinellas County Budget Forecast FY2014-2023 E-58
AIRPORT FUND
Key Results The forecast for the Airport Fund is balanced over the forecast period The fluctuation in total revenues and expenditures is caused by the timing of capital projects Capital project impact to both revenues and expenditures is fund neutral since the projects are dependent on the availability of grants If the grants are not forthcoming the projects are not started
Potential Risks Several items can alter the ten-year forecast of Airport revenue collections A primary concern is the strength of the airline industry and the continued success of Allegiant Airlines Revenues could increase if the airport can attract new passengers and other carrier services Increases in rentalleases income would result when current leases and agreements are renewed and rate formula escalations occur The former AIRCO Golf Course has been rezoned for future aviation and commercial development The potential lease income value of this parcel is approximately $15M annually when all land is fully leased In addition other vacant land parcels could add another $100K to $300K in annual lease income if fully leased Also this forecast does not add any new passenger service An increase of 250000 new airline passengers could provide over $1M in additional income without a significant increase in operating expenses
Balancing Strategies The forecast does not show any structural gaps in revenues and expenditures as the fund is balanced through the forecast period assuming that the operating and capital budget would be adjusted in step with revenues
Pinellas County Budget Forecast FY2014-2023 E-59
AIRPORT FUND
Pinellas County Budget Forecast FY2014-2023 E-60
WATER FUNDS
Description The Pinellas County Water System is responsible for providing quality cost effective potable water service to County retail and wholesale customers The Water System must adhere to State and Federal laws rules and regulations while operating and maintaining this delivery system The Water System is continually being upgraded to provide customers with a safe and sufficient water supply for domestic needs as well as an ample supply for fire protection The Water System also continues to educate its customers on important water conservation issues The Water Funds are enterprise funds and are committed solely to support Water System functions The Pinellas County Water System utilizes four funds Revenue and Operating Renewal and Replacement (capital) Water Certificate and Impact Fees This forecast covers all four funds
Summary The forecast for the Water System Funds shows that the multi-year rate increases approved as part of the FY2012 budget process will provide sufficient revenues to maintain reserves and fund capital replacement needs through FY2015 The forecast revenues include an additional 2 per year annual increase in rates from FY2016 through FY2023 as recommended in the FY2012 Utilities Rates Study performed by Burton amp Associates the Countyrsquos independent utility rates consultant The Department of Environment and Infrastructure will again perform a comprehensive rate study in FY2014 to analyze the future rate structure In FY2013 FY2014 FY2017 and FY2018 recurring expenditures will exceed recurring revenues as fund balance is drawn down as major capital projects are completed From FY2015 through FY2023 excluding FY2017 and FY2018 the Water Funds are structurally balanced
Revenues The Water Funds generate revenues budgeted in FY2013 totaling $814 million The Water Funds have two primary funding sources retail water sales of $621 million and wholesale water sales of $151 million
Retail Water Sales The Water System charges $435 per month base rate an increase of $100 from FY2012 and $478 per 1000 gallons for retail water service In FY2014 and FY2015 additional base rate increases of $100 will go into effect The customer base for retail water sales are both commercial and residential properties in the Pinellas County Water service area The volume of water purchased has declined 9 from FY2008 to FY2012 The amount of water purchased can be affected by economic conditions housing and commercial vacancies and levels of conservation
Pinellas County Budget Forecast FY2014-2023 E-61
WATER FUNDS
Wholesale Water Sales The Water System charged $35648 per 1000 gallons for wholesale water service In FY2014 and FY2015 rates are scheduled to increase by 4 resulting in revised rates of $37074 and $38557 respectively Wholesale Water Sales provide water to the cities of Clearwater Tarpon Springs Safety Harbor Belleair and Pinellas Park The volume of water purchased has declined 30 from FY2008 to FY2012 which can be attributed to the same economic and conservation pressures seen in retail water sales The graph below shows the recent history of the volume of Water sales by the Water System
5380
50015103
47634619
45
50
55
60
2009 actual 2010 actual 2011 actual 2012 actual 2013 estimate
Millio
ns o
f G
allo
ns p
er D
ay (M
GD
)
Fiscal Year
Pinellas County Water Sales MGD
Source Pinellas County Department of Environment and Infrastructure
Expenditures The Water Funds support budgeted expenditures and reserves in FY2013 totaling $1214 million The primary expenditures in the fund are $454 million for the purchase of water $140 million for personal services $150 million for operating expenses (excluding the purchase of water) and $185 million for capital outlay Purchase of Water Under Section 3731963 of the Florida Statutes the Water System is required to purchase water from Tampa Bay Water the regional water supply authority In 1997 an Interlocal Agreement and the Master Water Supply Contract was signed under which Tampa Bay Water provides water to their members Pinellas County Hillsborough County Pasco County City of St Petersburg City of Tampa and City of New Port Richey Tampa Bay Water sets their rates according to the adopted budget and collects those rates from all members according to the Master Water Supply Contract Capital Outlay The Water System must maintain its equipment facilities pipelines and plants in good working order utilizing revenues generated within its proprietary funds Capital outlay reflects the construction and purchase needs as estimated by Pinellas County Department of Environment and Infrastructure Engineering Division in the CIP ten-year work plan and beyond
Pinellas County Budget Forecast FY2014-2023 E-62
WATER FUNDS
Personal Services The Water System employs 202 full-time employees in FY2013 The Personal Services expenses of $127 million are for the salaries and benefits of those positions needed to operate the Water System Water System benefits include the $13 million cost of Other Post Employment Benefits (OPEB) as proprietary funds are required by GASB 45 to record the entire annual required contribution (ARC) accrual Operating Expenses The Water System incurs annual recurring costs for repair and maintenance supplies fuel and communications The Water System also pays for electrical power to run its facilities and for chemicals to treat the water Reserves The reserve level in the Water System is 23 which is above the 5-15 reserve level budget policy adopted by the Board The Water System maintains these reserves for cash flow and future capital needs
Ten-Year Forecast Key Assumptions Due to expected slow growth in the economy the forecast assumes a 0 annual increase from FY2013 to FY2016 a 009 annual increase in FY2017 a 018 annual increase in FY2018 and a 027 annual increase from FY2019 to FY2023 in retail water demand and no growth in wholesale water demand for the forecast period The wholesale water demand reflects a decline in revenues from FY2015 through FY2016 due to the projected loss of sales of three cities (Clearwater Tarpon Springs and Oldsmar) as they develop their own water sources For expenditures Personal Services and Operating Expenses reflect the forecast trends described in the Key Assumptions section of this document Electricity and chemicals costs are projected to increase by 0 and 7 respectively for 2014 both are projected to increase 5 and 7 respectively per year through the remaining forecast period The capital outlay forecast reflects the construction and purchase needs as estimated by the Pinellas County Department of Environment and Infrastructure Engineering Division An increase to $203 million in FY2017 is anticipated to support capital outlay water line projects with Florida Department of Transportation (FDOT) as well as other major capital outlay improvement projects To balance revenues with projected expenditures future rate increases will be necessary for both retail and wholesale rates Burton amp Associates DEI Finance and Economics Independent Consultants computed that rate increases for FY2016 through FY2023 are needed at 2 per year based on a blend of growth and consumption assumptions inflationary cost increases and capital needs at the projected water demand levels
Pinellas County Budget Forecast FY2014-2023 E-63
WATER FUNDS
Source Pinellas County Department of Environment and Infrastructure
Key Results The forecast for the Water System Funds shows that the approved rate increases and rate increases starting in FY2016 as recommended in the FY2012 Utilities Rate Study by Burton amp Associates will provide sufficient revenues to maintain reserves and fund capital replacement needs In FY2013 FY2014 FY2017 and FY2018 recurring expenditures will exceed recurring revenues as fund balance is drawn down as major capital projects are completed From FY2015 through FY2023 excluding FY2017 and FY2018 the Water Funds are structurally balanced
Potential Risks There are some impacts that can alter the ten-year forecast of the Water System Any future economic decline would reduce water demand which would impact revenue more than expenses Operating costs (including the purchase of water from Tampa Bay Water) could increase more than projected The Water System could experience a need for more maintenance than anticipated causing increased operating and capital costs Regulatory pressures could cause an increase of expenditures to maintain the system
Balancing Strategies With the multi-year rate increases approved during the FY2012 budget process and future rate increases as recommended by Burton amp Associates Water System revenues will be sufficient to cover projected expenditures and maintain sufficient reserves over the forecast period
Pinellas County Budget Forecast FY2014-2023 E-64
SEWER FUNDS
Description The Pinellas County Sewer System is responsible for quality cost effective sewer service to the citizens and business owners within the County sewer service areas The Sewer System must adhere to State and Federal laws rules and regulations while operating and maintaining this system The System provides an environmentally safe and sanitary means of collecting and transmitting discharged domestic waste from residential commercial and industrial users The Sewer System provides for the treatment and disposal of objectionable materials and organisms from the waste in order to protect public health property and environment The Sewer Funds are enterprise funds and are committed solely to support Sewer System functions The Pinellas County Sewer System utilizes four funds Revenue and Operating Renewal and Replacement (capital) Interest and Sinking (Debt Service) and Sewer Construction The Sewer System is required to maintain a debt service coverage ratio of 125x per the bond covenants however the fund is maintained at a debt service coverage ratio of 150x to sustain the current bond ratings
Summary The Pinellas County Sewer Funds are proprietary funds dedicated solely to supporting the Pinellas County Sewer System (Sewer System) The forecast for the Sewer System Funds shows that the multi-year rate increases approved in FY2012 will provide sufficient revenues to maintain reserves sustain the recommended debt service coverage ratio of 150x and fund capital replacement needs through FY2015 The forecast revenues include an additional 275 per year annual increase in rates from FY2016 through FY2023 as recommended in the FY2012 Utilities Rates Study performed by Burton amp Associates the Countyrsquos independent utility rates consultant The Department of Environment and Infrastructure will perform a comprehensive rate study in FY2014 to analyze the future rate structure In FY2013 recurring expenditures will exceed recurring revenues as fund balance is drawn down as major capital projects are completed From FY2014 through FY2023 the Sewer Funds are structurally balanced as recurring expenditures are in line with recurring revenues
Revenues The Sewer Funds generate revenues budgeted in FY2013 totaling $600 million The Sewer Funds have four primary funding sources retail sewer charges of $484 million wholesale sewer charges of $67 million retail reclaimed water charges of $39 million and wholesale reclaimed water charges of $03 million
Retail Sewer Charges The Sewer System charges $1180 per month base rate and $431 per 1000 gallons for retail sewer service in FY2013 The FY2014 increase of 6 for retail customers (adopted in 2012) will result in a base rate of $1251 per month and $457 per 1000 gallons The customer base
Pinellas County Budget Forecast FY2014-2023 E-65
SEWER FUNDS
for retail sewer service is both commercial and residential properties in the Pinellas County Sewer service area Total billed retail demand has declined 3 from FY2008 to FY2012 The amount of sewage processed is affected by economic conditions housing and commercial vacancies and levels of water conservation Prior to this approved rate increase there was a 6 increase in 2012 a 15 increase in FY2011 a 35 increase in FY2010 and no rate increases from FY2004 thru FY2009
Wholesale Sewer Sales The Sewer System charges $32264 per 1000 gallons for wholesale sewer service The adopted FY2013 increase of 9 for wholesale customers (adopted in 2012) will equate to $35168 per 1000 gallons Wholesale customers are four cities within Pinellas County that purchase sewer service from the Sewer System in bulk after collecting it from their retail sewer customers The cities of North Redington Beach Redington Shores Indian Rocks Beach and Pinellas Park are the wholesale customers of the Sewer System Similar to retail sewer sales the total billed wholesale demand has declined 12 from FY2008 to FY2012 The amount of waste processed is affected by economic conditions housing and commercial vacancies and levels of water conservation The graph below shows the recent history of the volume of waste billed by the Sewer System
Source Pinellas County Department of Environment and Infrastructure
Retail Reclaimed Water Charges The Reclaimed Water System charges $1700 per month rate for unfunded un-metered service (systems without existing distribution lines) and a $700 per month availability charge and $080 per 1000 gallons for retail reclaimed water service for metered service unfunded systems (systems without existing distribution lines) and $1600 per month base rate for funded un-metered service (systems with pre-existing distribution lines) and $080 per 1000 gallons for metered funded systems (systems with pre-existing distribution lines) Rates for unfunded systems are higher as the Sewer System must recover the cost of constructing the reclaimed water distribution lines Only those accounts that have metered service pay the volumetric rate with most paying only the flat monthly rate The FY2013 budget includes approved rate increases of $100 per year for un-metered service and a user fee per 1000 gallon increase of $08 per year for metered service
27002680
2591
24892551
240
245
250
255
260
265
270
275
280
285
2008 2009 2010 2011 2012
Mil
lio
ns o
f G
all
on
s p
er
Day (
MG
D)
Fiscal Years
Pinellas County Sewer MGD Billed FY2008-FY2012
Sewer MGD
Pinellas County Budget Forecast FY2014-2023 E-66
SEWER FUNDS
Wholesale Reclaimed Water Charges
The Reclaimed Water System charged volumetric rates by contract for wholesale reclaimed water service No increase for wholesale rates was proposed for FY2013 Wholesale customers are four cities within Pinellas County that purchase reclaimed water service from the Reclaimed Water System in bulk and distribute it to their retail customers The cities of St Petersburg Beach South Pasadena Belleair and Pinellas Park are the wholesale customers of the Reclaimed Water System
Expenditures The Sewer Funds support budgeted expenditures and reserves in FY2013 totaling $1076 million The primary expenditures in the funds are $163 million for personal services costs $240 million for operating expenses $148 million for debt service $245 million for capital outlay and $289 million in reserves Personal Services The Sewer System employs 222 full-time employees in FY2013 The Personal Services expenses of $149 million are for the salaries and benefits of those positions needed to operate the Sewer System Sewer System benefits include the $14 million cost of Other Post Employment Benefits (OPEB) as proprietary funds are required by GASB 45 to record the entire annual required contribution (ARC) accrual This cost is included in the calculation of the debt service coverage ratio Debt Service The Sewer System had $1843 million of bond principal outstanding as of September 30 2012 The bonds were issued to fund various sewer system capital projects and require annual principal and interest payments to the holders of those bonds From FY2014 through FY2028 the debt service requirement is between $145 million and $148 million From FY2029 through FY2032 debt service payments fall to between $50 million and $55 million The bonds mature between 2017 and 2032 Operating Expenses The Sewer System incurs annual recurring costs for repair and maintenance supplies fuel and communications In addition utilities to run the facilities and chemicals to treat the waste are major components of the Sewer Systemrsquos operating expenses Capital Outlay The Sewer System must maintain its equipment facilities pipelines and plants in good working order using revenues generated within their proprietary funds Capital outlay reflects the construction and purchase needs as estimated by the Department of Environment and Infrastructure Engineering Division in the CIP ten-year work plan and beyond Reserves
Pinellas County Budget Forecast FY2014-2023 E-67
SEWER FUNDS
The reserve level in the Sewer System is 27 which is higher than the 5-15 reserve level budget policy adopted by the Board The Sewer System maintains $92 million of reserves for cash flow and $197 million to fund future capital needs In addition the 2008 bond issue requires a debt service reserve of $197 million to maintain the recommended debt service ratio of 150x
Source Pinellas County Department of Environment and Infrastructure
Ten-Year Forecast Key Assumptions Due to expected slow growth in the economy the forecast assumes 0 increase from FY2013 to FY2016 a 007 annual increase in FY2017 a 014 in FY2018 and a 021 from FY2019 to FY2023 in retail and wholesale sewer demand For expenditures Personal Services and Operating Expenses reflect the forecast trends described in the Key Assumptions section of this document Electricity and chemical costs are projected to increase by 0 and 7 respectively for 2014 both are projected to increase 5 and 7 respectively per year through the remaining forecast period The capital outlay forecast reflects the construction and purchase needs as estimated by the Department of Environment and Infrastructure Engineering Division To balance revenues with projected expenditures multi-year rate increases were approved during the FY2012 budget process for both retail and wholesale rates Burton and Associates DEI Finance and Economics Independent Consultants have computed that the following sewer rate increases were necessary to meet the projected expenses and reserve needs at the projected sewer demand levels 6 each year FY2012ndashFY2015 for retail sewer and 9 each year FY2012ndashFY2015 for wholesale sewer Reclaimed waterretail customers $100 to the monthly charge each year FY2012ndashFY2015 for unmetered service and an increase of $008 to the user fee per 1000 gallons each year FY2012 to FY2015 These multi-year rates were approved by the Board of County Commissioners in September 2011 Rate increases for FY2016 through FY2023 as recommended in the FY2012 Utilities Rate Study by Burton amp Associates are assumed at 275 based on a blend of growth and consumption assumptions inflationary cost increases capital needs and minimum amount of reserves necessary to meet required debt service ratios
Pinellas County Budget Forecast FY2014-2023 E-68
SEWER FUNDS
Key Results The forecast for the Sewer System Funds shows that the multi-year rate increases approved in FY2012 and future rate increases starting in FY2016 as recommended by Burton amp Associates will provide sufficient revenues to maintain reserves sustain the recommended debt service coverage ratio of 150x and fund capital replacement needs over the forecast period In FY2013 recurring expenditures will exceed recurring revenues as fund balance is drawn down as major capital projects are completed From FY2014 through FY2023 the Sewer Funds are structurally balanced as recurring expenditures are in line with recurring revenues
Potential Risks There are some impacts that can alter the ten-year forecast of the Sewer System Any future economic decline would reduce water demand which reduces sewer revenue that is based on volume Operating costs could increase more than projected The Sewer System could experience a need for more maintenance than anticipated causing increased capital costs
Balancing Strategies With the rate increases approved during the FY2012 budget process and anticipated future rate increases Sewer System revenues will be sufficient to cover projected expenditures maintain sufficient reserves and sustain the recommended debt service coverage ratio of 150x
Pinellas County Budget Forecast FY2014-2023 E-69
SEWER FUNDS
Pinellas County Budget Forecast FY2014-2023 E-70
SOLID WASTE FUNDS
Description Pinellas County Solid Waste provides safe and environmentally sound integrated solid waste services to all citizens of Pinellas County These services emphasize public awareness and communication to enable the citizens to make educated choices concerning proper management of their solid waste and to help maintain the quality of life in Pinellas County In support of that mission Solid Waste operates the landfill the waste-to-energy plant hazardous waste collection recycling programs and litter-reduction program The Solid Waste Funds are enterprise funds and are committed solely to support Solid Waste functions Solid Waste utilizes two funds Revenue and Operating and Renewal and Replacement (capital)
Summary The Pinellas County Solid Waste Funds are enterprise funds dedicated solely to supporting the Solid Waste functions The forecast for the Solid Waste Funds shows that the fund is balanced through the forecast period Solid Waste tipping fees and electricity sales revenues have declined with the slower economy but will remain sufficient to fund operations and maintain sufficient reserves during the forecast period Reserves are being accumulated for future capital replacement needs consistent with their 25 year capital plan
Revenues The Solid Waste Funds generate revenues budgeted in FY2013 totaling $850 million The Solid Waste Funds consist almost exclusively of two primary funding sources tipping fees of $337 million and electricity sales of $486 million
Tipping Fees Solid Waste charges $3750 per ton for all waste brought to the Solid Waste Facility That rate has not changed since 1988 The volume of waste brought to the Solid Waste Facility is expected to increase slightly in FY2014 The amount of waste brought to the facility is affected by economic conditions and levels of recycling
Electricity Sales Solid Waste receives revenue from the electrical capacity contract with Progress Energy for power produced by the waste-to-energy plant The revenue from this contract is defined by rates specified in the contract which expires in 2024 Solid Waste also receives revenue for electricity sales in excess of the capacity contract with Progress Energy This revenue stream is affected by the amount of waste received by the plant and the operating capacity of the plant Due to slow growth in the economy and no planned increases in plant capacity for the next ten years this revenue is forecast to increase by 05 per year from FY2014 through FY2023
Pinellas County Budget Forecast FY2014-2023 E-71
SOLID WASTE FUNDS
The graph below shows the tons of waste delivered to the Solid Waste Facility
Source Pinellas Co Solid Waste Mgmt Tonnage Activity Reports
Interfund Loan Repayment Debt service revenues over the forecast period are associated with an interfund loan from the Solid Waste Renewal and Replacement Fund to the Capital Improvement Fund On September 21 2010 the Board authorized the first interfund loan up to $85 million to assist with cash flow in the Capital Projects Fund through FY2019 The original 2010 to 2020 Penny Program was anticipated to be financed with a $150 million bond issue in order to accelerate several key projects The benefits of an interfund loan versus bonding include lower borrowing costs no reserve requirements interest accrues to a county entity and more flexibility in the implementation and terms of the loan Interest will be collected in FY2011 through FY2020 and loan repayment in FY2015 through FY2020 The interfund loan is available for use through FY2015 An additional loan to the Capital Projects Fund will be necessary to cover the remaining $75 million of costs to fully fund the Centralized Chiller Facility project This project funds the construction of a new centralized chiller facility for the downtown Clearwater campus The County will purchase chilled water at a set rate based on the amount of investment towards the cost of the facility Repayment of the loan will take place from FY2013 to FY2017 at $15 million annually The loan will be repaid from the General Fund but because it is a capital project the expenditures and repayment are taking place from the Capital Projects Fund Based on the forecast it is anticipated that only $70 million of the authorized $85 million will ultimately need to be transferred to the Capital Projects Fund
Expenditures The Solid Waste Funds support budgeted expenditures and reserves in FY2013 totaling $1996 million The primary expenditures in the fund are $313 million for the Waste-to-Energy service contract $113 million for the landfill service contract and $401 million for capital investment Budgeted reserves are $872 million
Pinellas County Budget Forecast FY2014-2023 E-72
SOLID WASTE FUNDS
Waste-to-Energy Service Contract Solid Waste is under contract with Green Conversion Systems LLC (GCS) to operate the Waste-to-Energy (WTE) plant This contract expires in 2024 and has 10 one-year extensions The stock of the parent company for the original contractor Veolia ES Pinellas Inc was purchased by GCS IN 2012 Landfill Service Contract Solid Waste is under contract with Advanced Disposal Inc to operate the landfill This contract expires in 2015 and has a 3-year extension The contract was assigned by the original contractor Veolia when the stock of the parent company was sold Capital Outlay Solid Waste maintains its equipment facilities and plants in good working order utilizing revenues generated within their enterprise fund Project decisions for equipmenttechnology improvements and construction projects are based on condition assessments permit or regulatory requirements and recommendations from consultants The new Industrial Water Treatment Plant (IWTP) at Solid Waste was the result of an analysis of the entire water balance at Bridgeway Acres A comprehensive water management study was completed in 2006 to assess the interrelated issues associated with our management of water including water use at the Waste-to-Energy facility particularly in the cooling towers permit issues associated with maintaining the inward gradient and water quality in the main water retention area The new IWTP was one of several projects that has been completed or is under construction The new facility will enable treatment to the main water retention area to maximize its use at the WTE facility including meeting contractual guarantees with respect to the water quality delivered It reduces reliance on reclaimed water increases capacity to the main water retention area minimizes any discharges required and assures a water supply in the dry spring months Personal Services The Solid Waste System employs 90 full-time employees in FY2013 The Personal Services expenses are for the salaries and benefits of those positions needed to operate the Solid Waste System Solid Waste System benefits include the cost of Other Post Employment Benefits (OPEB) as proprietary funds are required by GASB 45 to record the entire annual required contribution (ARC) accrual Interfund Loan to Capital Projects Fund The forecast includes transfers of $100 million in FY2013 and $450 million in FY2014 from the Solid Waste Renewal and Replacement Fund as part of the interfund loans to the Capital Projects Fund The estimate for FY2013 also includes the transfer of $75 million for the Centralized Chiller Facility project which will be repaid from the General Fund Reserves The budgeted FY2013 reserve level in the Solid Waste System is 44 which is above the 15 reserve level budget policy adopted by the Board Solid Waste maintains the following reserves
Pinellas County Budget Forecast FY2014-2023 E-73
SOLID WASTE FUNDS
$75 million required reserves per the contract with GCS $11 million for insurance deductibles $139 million for three months of operating expenses and the remainder of $548 million is for future needs consistent with their 25 year capital plan The estimated FY2013 reserves are higher than budgeted due to the timing of the loan from Solid Waste to the Capital Projects Fund $45 million of the loan was delayed from FY2012 to FY2014
Ten-Year Forecast Key Assumptions The revenue forecast assumes only a 05 increase in tipping fees and electricity sales throughout the forecast horizon due to the anticipated slow growth in the economy increased recycling and no planned capacity increases to the WTE plant The revenue forecast does not include any increases in tipping fee rates The economy does affect the tons of waste brought to the solid waste facility because less consumption means less waste For expenditures Personal Services and Operating Expense reflect the forecast trends described in the Key Assumptions section of this document The capital outlay forecast reflects the construction and purchase needs based on condition assessments permit or regulatory requirements and recommendations from consultants There are large capital needs forecasted from FY2013 through FY2018 in anticipation of tighter regulatory requirements and additional required improvements
Pinellas County Budget Forecast FY2014-2023 E-74
SOLID WASTE FUNDS
Key Results The forecast for the Solid Waste Funds shows that the forecasted revenues are sufficient to provide for the forecasted expenditures over the next ten years while still maintaining sufficient reserves (The forecast chart does not include the loans to the Capital Projects Fund or the future repayments from that fund) Solid waste revenues exceed expenditures from FY2015 through FY2023 In FY2014 expenditures reflect non-recurring costs associated with additional capital outlay improvements The recurring revenues are sufficient to support recurring operations without any increases in tipping fees Reserves increase during the forecast period and reach the level of 84 of revenues in FY2023 The reserves are planned to fund considerable future capital replacement needs in the Solid Waste 25-year plan
Potential Risks There are some impacts that can alter the ten-year forecast of the Solid Waste Funds Any continued economic decline would reduce incoming waste which would reduce revenue from both the tipping fees and electricity sales The WTE plant could experience more maintenance downtime than anticipated reducing electricity sales and causing increased capital costs
Balancing Strategies Excluding FY2014 with anticipated capital outlay improvements the forecast does not show any structural gaps in revenues and expenditures as the fund is balanced through the forecast period
Pinellas County Budget Forecast FY2014-2023 E-75
SOLID WASTE FUNDS
Pinellas County Budget Forecast FY2014-2023 E-76
PRO-FORMAS
Pinellas County Budget Forecast FY2014-2023
The Pro-Formas portion of the Budget Forecast FY2014-2023 includes the detailed assumptions behind the ten-year fund pro-formas as well as full-size forecast charts for ten of the Countyrsquos major funds
General Fund
Tourist Development Fund
Transportation Trust Fund
Capital Projects Fund
Emergency Medical Services Fund
Fire Districts Fund
Airport Fund
Utilities Water Funds
Utilities Sewer Funds
Utilities Solid Waste Funds
Sections for Each Fund Each fund has the following information
Forecast Chart Provides a forecast of revenues (net of fund balance) and expenditures (net of reserves) for each fund over a ten-year period
Assumptions Provides the key assumptions for each year in the forecast horizon that feed the pro-formas for each fund
Pro-Formas Provides the detailed revenue and expenditure projections over ten years for each fund based on key assumptions
Additional Information The information in this section provides the detail behind the forecast summaries prepared in the Fund Forecasts portion of this document The fund forecasts are intended to be high level user-friendly summaries of the results of the ten-year forecast for each fund The information in this section is much more granular and was used by the Office of Management amp Budget as well as other contributing departments to produce the forecasts
F-1
PRO-FORMAS
Pinellas County Budget Forecast FY2014-2023
F-2
4000
4500
5000
5500
6000
6500
2013
2014
2015
2016
2017
2018
2019
2020
2021
2022
2023
Dollars (millions)
Gen
era
l F
un
d F
ore
ca
st
FY
2014 -
FY
2023
U
sin
g S
erv
ice L
evel
Sta
biliz
ati
on
Acc
ou
nt
in F
Y201
3 -
FY
2014
Revenue
Expenditure
s
F-3
GE
NE
RA
L F
UN
D F
OR
EC
AS
TF
un
d 0
001
Fo
recast
Assu
mp
tio
ns
20
14
20
15
20
16
20
17
20
18
20
19
20
20
20
21
20
22
20
23
RE
VE
NU
ES
Pro
pe
rty T
axe
s -
Co
un
tyw
ide
2
5
25
3
0
30
3
0
30
3
0
30
3
0
30
Pro
pe
rty T
axe
s -
MS
TU
2
0
20
2
5
25
2
5
25
2
5
25
2
5
25
Half C
en
t S
ale
s T
ax
40
3
5
35
3
5
35
3
5
35
3
5
35
3
5
Reve
nu
e S
ha
rin
g2
5
25
2
5
25
2
5
25
2
5
25
2
5
25
Com
mu
nic
atio
ns S
vc T
ax
-05
-0
5
-05
-0
5
-05
-0
5
-05
-0
5
-05
-0
5
Cha
rge
s f
or
Se
rvic
es
15
1
8
17
2
0
19
2
1
20
2
0
20
2
0
Tra
nsfe
rs f
rom
Oth
er
Fu
nd
s0
0
00
0
0
00
0
0
00
0
0
00
0
0
00
Oth
er
reve
nu
es
20
2
0
20
2
0
20
2
0
20
2
0
20
2
0
EX
PE
ND
ITU
RE
S
Pe
rso
na
l S
erv
ice
s4
1
40
4
0
40
4
0
40
4
0
40
4
0
40
Op
era
tin
g E
xp
en
se
s-0
5
26
2
6
29
0
3
29
3
0
31
3
0
31
Cap
ita
l O
utla
y1
5
18
1
7
20
1
9
21
2
0
20
2
0
20
Gra
nts
amp A
ids
15
1
8
17
2
0
19
2
1
20
2
0
20
2
0
Pro
jec
ted
Ec
on
om
ic C
on
dit
ion
s
In
dic
ato
rs
Con
su
me
r P
rice
In
de
x
c
ha
ng
e1
5
18
1
7
20
1
9
21
2
0
20
2
0
20
FL
Pe
r C
ap
ita
Pe
rso
na
l In
co
me
Gro
wth
20
2
2
22
1
8
14
1
5
17
1
6
16
1
6
Estim
ate
d N
ew
Con
str
uctio
n
of
tax b
ase
05
0
5
10
1
0
10
1
0
10
1
0
10
1
0
P
rop
ert
y T
ax
pe
ren
tag
es
are
ch
an
ge
s i
n T
ax
ab
le V
alu
e
F-4
GE
NE
RA
L F
UN
D F
OR
EC
AS
TF
un
d 0
001
OR
IGIN
AL
(in
$ m
illi
on
s)
Ac
tua
lB
UD
GE
TE
sti
ma
ted
Es
tim
ate
dE
sti
ma
ted
Es
tim
ate
dE
sti
ma
ted
Es
tim
ate
dE
sti
ma
ted
Es
tim
ate
dE
sti
ma
ted
Es
tim
ate
dE
sti
ma
ted
20
12
20
13
20
13
20
14
20
15
20
16
20
17
20
18
20
19
20
20
20
21
20
22
20
23
BE
GIN
NIN
G F
UN
D B
AL
AN
CE
12
68
1
15
3
13
05
1
08
9
95
3
7
61
53
8
2
72
(10
)
(3
48
)
(73
8)
(1
17
0)
(16
73
)
RE
VE
NU
ES
Pro
pe
rty T
axe
s -
Cou
nty
wid
e2
58
4
25
90
2
59
0
26
55
2
72
1
28
03
2
88
7
29
74
3
06
3
31
55
3
25
0
33
48
3
44
8
Pro
pe
rty T
axe
s -
MS
TU
29
0
2
76
27
6
2
82
28
8
2
95
30
2
3
10
31
8
3
26
33
4
3
42
35
1
Half C
en
t S
ale
s T
ax
37
0
3
82
38
2
3
97
41
1
4
25
44
0
4
55
47
1
4
87
50
4
5
22
54
0
Reve
nu
e S
ha
rin
g1
43
14
3
1
43
14
7
1
51
15
5
1
59
16
3
1
67
17
1
1
75
17
9
1
83
MA
ND
AT
E M
ed
ica
id (
Rev S
hrg
cu
t)-
(5
1)
no
w s
ho
wn
as O
pe
rati
ng
Exp
en
dit
ure
in
ste
ad
of
rev
en
ue
re
du
cti
on
-
-
-
-
-
Com
mu
nic
atio
ns S
vc T
ax
10
8
1
07
10
7
1
06
10
5
1
04
10
3
1
02
10
1
1
00
10
0
1
00
10
0
Bu
ild
ing
Pe
rmits
-
-
-
-
-
-
-
-
-
-
-
-
-
Gra
nts
(fe
ds
tate
lo
ca
l)1
35
59
5
9
60
6
1
62
6
3
64
6
5
66
6
7
68
6
9
Inte
rest
08
1
0
10
0
8
10
1
5
16
0
8
-
-
-
-
-
Cha
rge
s f
or
Se
rvic
es
68
5
6
35
63
5
6
55
66
5
6
74
68
7
7
03
72
0
7
37
75
5
7
69
78
9
Oth
er
reve
nu
es
13
4
1
21
12
1
1
23
12
5
1
28
13
1
1
34
13
7
1
40
14
3
1
46
14
9
Ad
just
Pro
pe
rty T
axe
s
to 9
6
-
-
30
3
1
32
3
3
34
3
5
36
3
7
38
3
9
40
Ad
just
Ma
jor
Re
ve
nu
e t
o 9
8
-
-
-
21
2
1
22
2
2
23
2
3
24
2
5
25
2
6
Ad
just
Oth
er
Re
ve
nu
e t
o 9
7
-
-
-
18
2
1
25
2
8
31
3
6
40
4
1
45
4
8
TO
TA
L R
EV
EN
UE
S4
45
7
42
72
4
35
3
45
03
4
61
1
47
41
4
87
2
50
02
5
13
7
52
83
5
43
2
55
83
5
74
3
v
s p
rio
r ye
ar
20
-2
3
2
3
3
3
3
3
3
3
3
TO
TA
L R
ES
OU
RC
ES
57
25
5
42
5
56
58
5
59
2
55
64
5
50
2
54
10
5
27
4
51
27
4
93
5
46
94
4
41
3
40
70
EX
PE
ND
ITU
RE
S
Pe
rso
na
l S
erv
ice
s6
37
65
4
6
54
68
1
7
08
73
6
7
65
79
6
8
28
86
1
8
95
93
1
9
68
Op
era
tin
g E
xp
en
se
s9
59
10
23
1
07
4
10
76
1
10
5
11
34
1
16
7
11
75
1
21
0
12
47
1
28
6
13
24
1
36
5
Cap
ita
l O
utla
y1
5
09
0
9
09
0
9
09
0
9
09
0
9
09
0
9
09
0
9
Gra
nts
amp A
ids
15
9
1
91
19
1
1
93
19
8
2
02
20
7
2
12
21
7
2
22
22
7
2
32
23
7
Tra
nsfe
rs2
58
4
25
76
2
57
6
26
84
2
78
4
28
84
2
99
2
31
08
3
22
8
33
52
3
48
2
36
27
3
77
7
Deb
t S
erv
ice
-
03
-
-
-
-
-
-
-
-
-
-
-
Se
rvic
e L
eve
l S
tab
iliz
ati
on
Ac
ct
-
94
-
-
-
-
-
-
-
-
-
-
-
No
n-r
ec
urr
ing
ex
pe
nd
itu
res
16
-
2
6
-
-
-
-
-
-
-
-
-
-
Exp
en
ditu
re L
ap
se
1
-
(1
9)
(19
)
(2
0)
(20
)
(2
1)
(21
)
(2
2)
(23
)
(2
3)
(24
)
(2
5)
Po
ten
tia
l Is
su
es
No
n-r
ec
urr
ing
Tra
ns
fers
to
CIP
06
1
5
15
1
5
15
1
5
15
-
-
-
-
-
-
BT
S n
on
-re
cu
rrin
g p
roje
ct
co
sts
37
4
3
43
-
-
-
-
-
-
-
-
-
-
Ho
me
les
s In
itia
tive
s (
Gamp
A)
07
-
-
-
-
-
-
-
-
-
-
-
-
CIP
Op
era
tin
g Im
pa
cts
(c
um
ula
tive
)-
-
-
-
0
4
04
0
4
05
0
5
05
(1
2)
(13
)
(1
3)
TO
TA
L E
XP
EN
DIT
UR
ES
44
20
4
60
8
45
69
4
63
9
48
03
4
96
4
51
38
5
28
4
54
75
5
67
3
58
64
6
08
6
63
18
v
s p
rio
r ye
ar
31
7
3
2
4
3
4
3
4
4
3
4
4
EN
DIN
G F
UN
D B
AL
AN
CE
13
05
8
17
10
89
9
53
76
1
5
38
27
2
(1
0)
(34
8)
(7
38
)
(11
70
)
(1
67
3)
(22
48
)
AS
SU
MIN
G N
O A
CT
ION
TA
KE
N T
O
RE
SO
LV
E S
HO
RT
FA
LL
S
En
din
g b
ala
nce
as
of
Re
so
urc
es
23
1
6
19
1
7
14
1
0
5
0
-7
-15
-2
5
-38
-5
5
TO
TA
L R
EQ
UIR
EM
EN
TS
57
25
5
42
5
56
58
5
59
2
55
64
5
50
2
54
10
5
27
4
51
27
4
93
5
46
94
4
41
3
40
70
RE
VE
NU
E m
inu
s E
XP
EN
DIT
UR
ES
37
(3
36
)
(21
6)
(1
36
)
(19
2)
(2
23
)
(26
6)
(2
82
)
(33
8)
(3
90
)
(43
2)
(5
03
)
(57
5)
(NO
T c
um
ula
tive
)
no
te
no
n-r
ec
urr
ing
ex
pe
nd
itu
res
66
1
52
84
1
5
15
1
5
15
-
-
-
-
-
-
net
recu
rrin
g r
ev-
exp
103
(184
)
(132
)
(1
21
)
(177
)
(208
)
(251
)
(282
)
(338
)
(390
)
(4
32
)
(503
)
(575
)
E
xp
en
ditu
re la
pse
is c
alc
ula
ted
on
Pe
rso
na
l S
erv
ice
s
Op
era
tin
g E
xp
en
se
s
Cap
ita
l O
utla
y
an
d G
ran
ts amp
Aid
s o
nly
FY
12
ad
va
lore
m a
nd
oth
er
reve
nu
e a
dju
ste
d f
or
de
linqu
en
t ta
xe
s a
nd
ta
x r
ed
em
ptio
ns
FO
RE
CA
ST
F-5
F-6
160
180
200
220
240
260
280
300
320
340
360
380
400
420
440
2014
2015
2016
2017
2018
2019
2020
2021
2022
2023
Dollars (mllions)
To
uri
st
De
ve
lop
me
nt
Co
un
cil
Fu
nd
Fo
rec
as
t F
Y2
01
4 -
FY
20
23
Ex
clu
din
g U
nd
es
ign
ate
d E
xp
en
dit
ure
s
RE
VE
NU
ES
E
XP
EN
DIT
UR
ES
F-7
TO
UR
IST
DE
VE
LO
PM
EN
T C
OU
NC
IL F
UN
D F
OR
EC
AS
TF
un
d 1
04
0
Fo
rec
as
t A
ss
um
pti
on
s2014
2015
2016
2017
2018
2019
2020
2021
2022
2023
RE
VE
NU
ES
Tourist D
evelo
pm
ent T
axes
35
30
30
30
30
30
30
30
30
30
EX
PE
ND
ITU
RE
S
Pers
onal S
erv
ices
41
40
40
40
40
40
40
40
40
40
Opera
ting E
xpenses
15
18
17
20
19
21
20
20
20
20
Advert
isin
g E
xpense
15
18
17
20
19
21
20
20
20
20
Capital O
utlay
15
18
17
20
19
21
20
20
20
20
Pro
jecte
d E
co
no
mic
Co
nd
itio
ns In
dic
ato
rs
Consum
er
Price Index
change
15
18
17
20
19
21
20
20
20
20
FL P
er
Capita P
ers
onal I
ncom
e G
row
th20
22
22
18
14
15
17
16
16
16
F-8
TO
UR
IST
DE
VE
LO
PM
EN
T C
OU
NC
IL F
UN
D F
OR
EC
AS
TF
un
d 1
04
0
(in
$ t
ho
usan
ds)
Actu
al
Bu
dg
et
Esti
mate
dE
sti
mate
dE
sti
mate
dE
sti
mate
dE
sti
mate
dE
sti
mate
dE
sti
mate
dE
sti
mate
dE
sti
mate
dE
sti
mate
dE
sti
mate
d
2012
2013
2013
2014
2015
2016
2017
2018
2019
2020
2021
2022
2023
BE
GIN
NIN
G F
UN
D B
AL
AN
CE
64
290
72
818
80
012
57
874
56
165
56
680
59
561
61
182
62
242
64
540
66
428
69
046
70
450
RE
VE
NU
ES T
ourist D
evelo
pm
ent T
axes
95
287
461
270
972
284
011
293
952
302
770
311
854
321
209
330
845
340
771
350
994
361
524
372
369
383
541
Inte
rest
290
277
400
405
562
1134
1787
1835
1867
1936
1993
2071
2114
Cty
Off F
ees (
TC
)-
-
-
-
-
-
-
-
-
-
-
-
-
Oth
er
revenues (
Int -
TC
)44
66
66
67
68
70
71
72
74
75
77
78
80
Adju
st T
ax R
evenues to 1
00
-
-
14
948
15
471
15
935
16
413
16
906
17
413
17
935
18
473
19
028
19
598
20
186
Adju
st oth
er
Revenues to 1
00
-
-
25
25
25
26
27
27
28
28
29
29
30
RE
VE
NU
ES
287
795
271
315
299
450
309
920
319
361
329
496
339
999
350
193
360
675
371
507
382
650
394
147
405
950
v
s p
rior
year
116
-5
7
40
35
30
32
32
30
30
30
30
30
30
TO
TA
L R
ES
OU
RC
ES
352
085
344
133
379
462
367
794
375
526
386
176
399
560
411
375
422
917
436
047
449
078
463
192
476
400
EX
PE
ND
ITU
RE
S
Pers
onal S
erv
ices
27
276
32
116
32
116
33
433
34
770
36
161
37
607
39
112
40
676
42
303
43
995
45
755
47
585
Opera
ting E
xpenses
62
229
66
646
66
646
67
646
68
863
70
034
71
435
72
792
74
321
75
807
77
323
78
870
80
447
Advert
isin
g E
xpense
75
623
86
514
86
514
87
812
89
392
90
912
92
730
94
492
96
476
98
406
100
374
102
382
104
429
A
ddtl A
dvert
Exp -
one-t
ime
RN
C6000
-
-
-
-
-
-
-
-
-
-
-
-
Un
desig
nate
d-
-
33
000
20
000
15
000
82
000
88
000
93
000
96
000
106
000
110
000
122
000
126
000
Capital O
utlay
-
43
43
44
44
45
46
47
48
49
50
51
52
Capital O
utlay -
Dali
Museum
-
-
-
-
5000
5000
5000
5000
5000
-
-
-
-
Tra
nsfe
r -
Tax C
olle
cto
r4485
4942
4942
5090
5243
5400
5562
5729
5901
6078
6260
6448
6642
Tra
nsfe
r -
Beach R
enourishm
ent
26
513
32
424
32
424
29
395
30
277
31
185
32
121
33
085
34
077
35
099
36
152
37
237
38
354
Debt S
erv
ice
69
947
65
903
65
903
68
210
70
256
5877
5877
5877
5877
5877
5877
-
-
EX
PE
ND
ITU
RE
S272
073
288
588
321
588
311
629
318
846
326
615
338
378
349
133
358
376
369
619
380
032
392
742
403
509
v
s p
rior
year
17
6
18
-3
2
2
4
3
3
3
3
3
3
EN
DIN
G F
UN
D B
AL
AN
CE
80
012
55
545
57
874
56
165
56
680
59
561
61
182
62
242
64
540
66
428
69
046
70
450
72
891
Endin
g b
ala
nce a
s
of R
esourc
es
23
16
15
15
15
15
15
15
15
15
15
15
15
TO
TA
L R
EQ
UIR
EM
EN
TS
352
085
344
133
379
462
367
794
375
526
386
176
399
560
411
375
422
917
436
047
449
078
463
192
476
400
RE
VE
NU
E m
inu
s E
XP
EN
DIT
UR
ES
15
722
(17
273
)
(22
138
)
(1709
)
515
2881
1621
1060
2299
1888
2618
1405
2441
(NO
T c
um
ula
tive)
no
te
no
n-r
ec
urr
ing
exp
en
dit
ure
s-
-
-
-
-
-
-
-
-
-
-
-
-
ne
t re
cu
rrin
g r
ev-
ex
p1
57
22
(17
27
3)
(22
13
8)
(17
09
)
51
5
28
81
16
21
10
60
22
99
18
88
26
18
14
05
24
41
One-t
ime O
pera
ting E
xpenditure
s w
ere
availa
ble
due to a
ctu
al F
Y12 B
egin
nin
g F
und B
ala
nce b
ein
g h
igher
than b
udgete
d
1)
The T
ransfe
r fo
r B
each R
enourishm
ent in
FY
2013 r
eflects
an a
dditio
nal am
ount due b
ased o
n r
econcile
d a
ctu
al ta
x c
olle
ctions v
ers
us b
udget in
prior
years
T
he F
Y2014 a
mount re
turn
s to the b
ase a
nnual tr
ansfe
r of 12
of one c
ent fr
om
the e
stim
ate
d c
olle
ctions
2)
The s
ignific
ant re
duction in D
ebt S
erv
ice in F
Y2016 r
eflects
the e
nd o
f T
ropic
ana F
ield
and D
unedin
Spring T
rain
ing F
acili
ty p
aym
ents
in F
Y2015
3)
The r
eduction in D
ebt S
erv
ice in F
Y2022 r
eflects
the e
nd o
f C
learw
ate
r S
pring T
rain
ing F
acili
ty p
aym
ents
in F
Y2021
4)
Annual paym
ents
of $500k to the D
ali
Musuem
are
schedule
d to e
nd in F
Y2020
5)
The T
ransfe
r fo
r T
ax C
olle
cto
r serv
ices in F
Y13 r
eflects
a r
ecovery
form
ula
based o
n a
ctu
al annual cost It incre
ases 3
p
er
year
in the fore
cast fo
r anticip
ate
d incre
ases in futu
re p
ers
onal serv
ices a
nd o
pera
ting e
xpenses
6)
The
Undesig
nate
d
line u
nder
Expenditure
s s
how
s a
pote
ntial am
ount of fu
nds that could
be a
llocate
d a
bove the targ
et 15
reserv
e based o
n a
ll aoth
er
assum
ptions in the fore
cast
FO
RE
CA
ST
(
100
Reven
ue)
F-9
F-10
$200
$230
$260
$290
$320
$350
$380
$410
$440
2013
2014
2015
2016
2017
2018
2019
2020
2021
2022
2023
Dollars (millions)
Tra
nsp
ort
ati
on
Tru
st
Fu
nd
Fo
reca
st
FY
2014 -
FY
2023
RE
VE
NU
ES
E
XP
EN
DIT
UR
ES
F-11
TR
AN
SP
OR
TA
TIO
N T
RU
ST
FU
ND
FO
RE
CA
ST
Fu
nd
1001
Fo
recast
Assu
mp
tio
ns
20
14
20
15
20
16
20
17
20
18
20
19
20
20
20
21
20
22
20
23
RE
VE
NU
ES
Nin
th C
en
t G
as T
ax
-05
-0
5
-05
-0
5
-05
-0
5
-05
-0
5
-05
-0
5
Sta
te S
ha
red
Ga
s T
axe
s-0
5
-05
-0
5
-05
-0
5
-05
-0
5
-05
-0
5
-05
Lo
ca
l O
ptio
n G
as T
axe
s-0
5
-05
-0
5
-05
-0
5
-05
-0
5
-05
-0
5
-05
Oth
er
reve
nu
es
20
2
0
20
2
0
20
2
0
20
2
0
20
2
0
EX
PE
ND
ITU
RE
S
Pe
rso
na
l S
erv
ice
s4
1
40
4
0
40
4
0
40
4
0
40
4
0
40
Op
era
tin
g E
xp
en
se
s1
5
18
1
7
20
1
9
21
2
0
20
2
0
20
Cap
ita
l O
utla
y1
5
18
1
7
20
1
9
21
2
0
20
2
0
20
Gra
nts
amp A
ids
15
1
8
17
2
0
19
2
1
20
2
0
20
2
0
Tra
nsfe
rs1
60
0
0
00
0
0
00
0
0
00
0
0
00
0
0
Pro
jec
ted
Ec
on
om
ic C
on
dit
ion
s
In
dic
ato
rs
Con
su
me
r P
rice
In
de
x
c
ha
ng
e1
5
18
1
7
20
1
9
21
2
0
20
2
0
20
FL
Pe
r C
ap
ita
Pe
rso
na
l In
co
me
Gro
wth
20
2
2
22
1
8
14
1
5
17
1
6
16
1
6
F-12
TR
AN
SP
OR
TA
TIO
N T
RU
ST
FU
ND
FO
RE
CA
ST
Fu
nd
1001
(in
$ t
ho
us
an
ds
)A
ctu
al
Bu
dg
et
Es
tim
ate
dE
sti
ma
ted
Es
tim
ate
dE
sti
ma
ted
Es
tim
ate
dE
sti
ma
ted
Es
tim
ate
dE
sti
ma
ted
Es
tim
ate
dE
sti
ma
ted
Es
tim
ate
d
20
12
20
13
20
13
20
14
20
15
20
16
20
17
20
18
20
19
20
20
20
21
20
22
20
23
BE
GIN
NIN
G F
UN
D B
AL
AN
CE
14
77
22
13
96
30
17
70
77
16
28
75
13
71
37
10
32
10
60
58
3
74
37
(5
78
00
)
(13
42
92
)
(2
21
99
8)
(32
12
54
)
(4
32
41
2)
RE
VE
NU
ES
Nin
th C
en
t G
as T
ax
37
49
3
37
57
7
37
57
7
37
38
9
37
20
2
37
01
6
36
83
1
36
64
7
36
46
4
36
28
1
36
10
0
35
91
9
35
74
0
Sta
te S
ha
red
Ga
s T
axe
s9
31
90
9
24
20
9
24
20
9
24
20
9
19
58
9
14
98
9
10
41
9
05
85
9
01
32
8
96
82
8
92
33
8
87
87
8
83
43
Lo
ca
l O
ptio
n G
as T
ax
12
49
70
12
59
65
12
59
65
12
53
35
12
47
08
12
40
85
12
34
65
12
28
47
12
22
33
12
16
22
12
10
14
12
04
09
11
98
07
Inte
rest
42
2
5
00
50
0
5
00
13
71
2
06
4
18
18
2
23
-
-
-
-
-
Oth
er
reve
nu
es
23
99
0
15
05
4
15
05
4
15
35
5
15
66
2
15
97
5
16
29
5
16
62
1
16
95
3
17
29
2
17
63
8
17
99
1
18
35
1
Tra
nsfe
r fr
om
oth
er
Fu
nd
s-
1
50
00
1
50
00
1
50
00
1
50
00
1
50
00
1
50
00
1
50
00
1
50
00
1
50
00
1
50
00
1
50
00
1
50
00
Ad
just
Oth
er
Re
ve
nu
e t
o 9
8
49
1
5
01
53
8
5
70
57
2
5
32
53
5
5
46
55
7
5
68
57
9
TO
TA
L R
EV
EN
UE
S2
80
06
5
2
86
51
6
2
87
00
7
2
86
50
0
2
86
44
0
2
86
20
9
2
85
02
1
2
82
45
5
2
81
31
8
2
80
42
3
2
79
54
2
2
78
67
4
2
77
82
0
v
s p
rio
r ye
ar
2
2
0
0
0
0
-1
0
0
0
0
0
TO
TA
L R
ES
OU
RC
ES
42
77
87
42
61
46
46
40
84
44
93
75
42
35
77
38
94
18
34
56
04
28
98
92
22
35
18
14
61
31
57
54
5
(42
58
0)
(1
54
59
2)
EX
PE
ND
ITU
RE
S
Pe
rso
na
l S
erv
ice
s1
10
79
6
1
37
37
9
1
37
37
9
1
43
01
2
1
48
73
2
1
54
68
1
1
60
86
9
1
67
30
3
1
73
99
5
1
80
95
5
1
88
19
3
1
95
72
1
2
03
55
0
Op
era
tin
g E
xp
en
se
s
90
24
6
12
38
33
12
38
33
12
56
90
12
79
53
13
01
28
13
27
31
13
52
53
13
80
93
14
08
55
14
36
72
14
65
45
14
94
76
Cap
ita
l O
utla
y6
89
15
70
1
57
0
15
94
1
62
2
16
50
1
68
3
17
15
1
75
1
17
86
1
82
2
18
58
1
89
5
Gra
nts
amp A
ids
14
5
2
67
26
7
2
71
27
6
2
81
28
6
2
92
29
8
3
04
31
0
3
16
32
2
Fu
ll C
ost
Allo
ca
tio
n1
88
34
1
92
31
1
92
31
1
93
66
1
95
59
1
99
50
2
05
49
2
11
65
2
18
00
2
24
54
2
31
28
2
38
22
2
45
37
Tra
nsfe
rs t
o o
the
r F
un
ds
30
00
0
21
56
0
21
56
0
25
00
0
25
00
0
25
00
0
25
00
0
25
00
0
25
00
0
25
00
0
25
00
0
25
00
0
25
00
0
Exp
en
ditu
re L
ap
se
1
(26
30
)
(2
70
6)
(27
86
)
(2
86
7)
(29
56
)
(3
04
6)
(31
41
)
(3
23
9)
(33
40
)
(3
44
4)
(35
52
)
Po
ten
tia
l Is
su
es
a)
CIP
Op
era
tin
g I
mp
acts
(cu
mu
lative
)1
1
11
1
2
06
1
0
14
1
4
14
1
4
14
TO
TA
L E
XP
EN
DIT
UR
ES
25
07
10
30
38
40
30
12
10
31
22
38
32
03
67
32
88
35
33
81
68
34
76
92
35
78
10
36
81
29
37
87
99
38
98
32
40
12
42
v
s p
rio
r ye
ar
18
1
7
4
3
3
3
3
3
3
3
3
3
EN
DIN
G F
UN
D B
AL
AN
CE
17
70
77
12
23
06
16
28
75
13
71
37
10
32
10
60
58
3
74
37
(5
78
00
)
(13
42
92
)
(2
21
99
8)
(32
12
54
)
(4
32
41
2)
(55
58
33
)
AS
SU
MIN
G N
O A
CT
ION
TA
KE
N T
O
RE
SO
LV
E S
HO
RT
FA
LL
S
En
din
g b
ala
nce
as
of
Reso
urc
es
29
3
5
31
2
4
16
2
-2
0
-60
-1
52
-5
58
1
01
6
36
0
TO
TA
L R
EQ
UIR
EM
EN
TS
42
77
87
42
61
46
46
40
84
44
93
75
42
35
77
38
94
18
34
56
04
28
98
92
22
35
18
14
61
31
57
54
5
(42
58
0)
(1
54
59
2)
RE
VE
NU
E m
inu
s E
XP
EN
DIT
UR
ES
29
35
5
(17
32
4)
(1
42
02
)
(25
73
7)
(3
39
27
)
(42
62
6)
(5
31
47
)
(65
23
7)
(7
64
92
)
(87
70
5)
(9
92
56
)
(11
11
57
)
(1
23
42
2)
(NO
T c
um
ula
tive
)
no
te
no
n-r
ec
urr
ing
ex
pe
nd
itu
res
-
-
-
-
-
-
-
-
-
-
-
-
-
net
recu
rrin
g r
ev-
exp
29
355
(17
324
)
(14
202
)
(25
737
)
(33
927
)
(42
626
)
(53
147
)
(65
237
)
(76
492
)
(87
705
)
(99
256
)
(111
157
)
(123
422
)
O
pe
ratin
g E
xp
en
se
s n
et
of
Fu
ll C
ost
Allo
ca
tio
n
Exp
en
ditu
re la
pse
is c
alc
ula
ted
on
Pe
rso
na
l S
erv
ice
s
Op
era
tin
g E
xp
en
se
s
Cap
ita
l O
utla
y
an
d G
ran
ts amp
Aid
s o
nly
FO
RE
CA
ST
F-13
F-14
00
200
400
600
800
1000
1200
1400
1600
1800
2014
2015
2016
2017
2018
2019
2020
Dollars (millions)
Cap
ital
Pro
jects
Fu
nd
Fo
reca
st
FY
2014
-FY
2020
Revenues
Expenditure
s
F-15
CA
PIT
AL
PR
OJ
EC
TS
FU
ND
FO
RE
CA
ST
Fu
nd
3001
Fo
rec
as
t A
ss
um
pti
on
s2014
2015
2016
2017
2018
2019
2020
2021
2022
2023
RE
VE
NU
ES
Infr
astr
uctu
re S
ale
s T
ax
35
30
30
30
30
30
30
Nin
th C
ent
Gas T
ax (
from
Tra
nsp T
rust)
-05
-0
5
-05
-0
5
-05
-0
5
-05
Impact
Fees (
from
Specia
l R
evenue F
und)
97
111
750
143
00
00
00
Gra
nts
-454
-5
63
-5
65
2494
-4
60
451
-6
37
Tra
nsfe
r fr
om
TD
C F
und
35
30
30
30
30
30
30
Reim
burs
em
ents
00
00
00
00
00
00
00
Oth
er
revenues
20
20
20
20
20
20
20
EX
PE
ND
ITU
RE
S
na
Pro
jecte
d E
co
no
mic
Co
nd
itio
ns
Ind
icato
rs
Consum
er
Price I
ndex
c
hange
15
18
17
20
19
21
20
20
20
20
F-16
CA
PIT
AL
PR
OJ
EC
TS
FU
ND
FO
RE
CA
ST
Fu
nd
3001
(in
$ t
ho
usan
ds
)A
ctu
al
Bu
dg
et
Esti
mate
dE
sti
mate
dE
sti
mate
dE
sti
mate
dE
sti
mate
dE
sti
mate
dE
sti
mate
dE
sti
mate
dE
sti
mate
dE
sti
mate
dE
sti
mate
d
2012
2013
2013
2014
2015
2016
2017
2018
2019
2020
2021
2022
2023
BE
GIN
NIN
G F
UN
D B
AL
AN
CE
513
090
1183
981
811
543
229
618
323
598
225
659
266
472
231
680
279
197
353
804
-
RE
VE
NU
ES
Infr
astr
uctu
re S
ale
s T
ax
(Penny f
or
Pin
ella
s)
777
592
758
824
804
810
832
978
857
968
883
707
910
218
937
524
965
650
328
225
-
Gra
nts
105
006
326
930
326
930
178
459
77
908
33
921
118
510
63
975
92
825
33
715
Reim
burs
em
ents
-
-
-
Nin
th C
ent
Gas T
ax (
Tra
nsfe
r fr
om
Tra
nsport
ation T
rust
Fund)
30
000
21
560
21
560
25
000
25
000
25
000
25
000
25
000
25
000
25
000
Tra
nsport
ation I
mpact
Fees (
from
Specia
l R
evenue F
und)
10
547
16
407
16
407
18
000
20
000
35
000
40
000
40
000
40
000
40
000
Tra
nsfe
r fr
om
Genera
l F
und
8478
18
000
18
000
18
000
18
000
18
000
18
000
3000
3000
3000
Tra
nsfe
r fr
om
TD
C F
und
26
513
32
424
32
424
29
395
30
277
31
185
32
121
33
085
34
077
35
099
Tra
nsfe
r fr
om
Fire D
istr
icts
Suth
erland B
ayou M
arina M
itig
P
ymnt
297
Sale
-Surp
lus C
ounty
Land
366
Inte
rest
2563
2138
2138
1607
3
3236
0
4513
2
7994
2
6950
4
8375
9
10
614
1
Oth
er
revenues
1199
1200
1224
1248
1273
1299
1325
1351
1378
Reappro
priation o
f R
evenue-R
esta
tem
ent
-
-
-
-
-
-
-
-
-
-
Inte
rfund L
oan-S
olid
Waste
-Chill
er
-
75
000
Inte
rfund L
oan-S
olid
Waste
-
100
000
100
000
450
000
-
-
-
-
-
-
-
-
-
TO
TA
L R
EV
EN
UE
S962
561
1276
283
1398
469
1554
664
1033
637
1032
600
1153
142
1110
859
1170
280
477
031
-
-
-
v
s p
rior
year
TO
TA
L R
ES
OU
RC
ES
1475
651
2460
264
2210
012
1784
282
1357
235
1258
259
1419
614
1342
539
1449
477
830
835
-
-
-
EX
PE
ND
ITU
RE
S
Capital P
roje
cts
663
790
1962
594
1962
594
1442
884
1063
776
924
487
1121
434
861
842
894
473
401
483
Debt
Serv
ice o
n I
nte
rfund L
oan
318
2800
2800
2800
2800
2300
1500
1500
1200
500
Paym
ent
on S
W L
oan-C
hill
er
15
000
15
000
15
000
15
000
15
000
15
000
Paym
ent
on S
W L
oan
50
000
50
000
50
000
200
000
200
000
150
000
TO
TA
L E
XP
EN
DIT
UR
ES
664
108
1980
394
1980
394
1460
684
1131
576
991
787
1187
934
1063
342
1095
673
551
983
-
-
-
EN
DIN
G F
UN
D B
AL
AN
CE
811
543
479
870
229
618
323
598
225
659
266
472
231
680
279
197
353
804
278
852
-
-
-
TO
TA
L R
EQ
UIR
EM
EN
TS
1475
651
2460
264
2210
012
1784
282
1357
235
1258
259
1419
614
1342
539
1449
477
830
835
-
-
-
RE
VE
NU
E m
inu
s E
XP
EN
DIT
UR
ES
298
453
(704
111
)
(5
81
925
)
93
980
(9
7939
)
40
813
(3
4792
)
47
517
74
607
(7
4952
)
-
-
-
(NO
T c
um
ula
tive)
ne
t re
cu
rrin
g r
ev-
ex
p2
98
45
3
(70
41
11
)
(5
81
92
5)
93
98
0
(9
79
39
)
40
81
3
(3
47
92
)
47
51
7
7
46
07
(74
95
2)
-
-
-
Note
F
Y2021 a
nd F
Y2022 n
ot
inclu
ded a
s P
enny f
or
Pin
ella
s is a
uth
orized o
nly
thro
ugh a
port
ion o
f F
Y2020
FO
RE
CA
ST
F-17
F-18
600
700
800
900
1000
1100
1200
1300
1400
1500
2014
2015
2016
2017
2018
2019
2020
2021
2022
2023
Dollars (millions) E
me
rge
nc
y M
ed
ica
l S
erv
ice
s F
un
d F
ore
ca
st
FY
20
14
- F
Y2
02
3
RE
VE
NU
ES
E
XP
EN
DIT
UR
ES
F-19
EM
ER
GE
NC
Y M
ED
ICA
L S
ER
VIC
ES
FU
ND
FO
RE
CA
ST
Fu
nd
10
06
Fo
rec
as
t A
ss
um
pti
on
s2014
2015
2016
2017
2018
2019
2020
2021
2022
2023
RE
VE
NU
ES
Ad V
alo
rem
Revenue (
95
)25
25
30
30
30
30
30
30
30
30
Am
bula
nce S
vc C
ontr
act F
ees
20
20
20
20
20
20
20
20
20
20
Am
bula
nce A
nnual M
em
bers
Fees
00
00
00
00
00
00
00
00
00
00
Gra
nt R
evenue (
EM
S T
rust F
und)
20
20
20
20
20
20
20
20
20
20
Oth
er
revenues (
ref of prior
yrs
exp)
00
00
00
00
00
00
00
00
00
00
EX
PE
ND
ITU
RE
S
Pers
onal S
erv
ices
41
40
40
40
40
40
40
40
40
40
Opera
ting E
xpenses
15
18
17
20
19
21
20
20
20
20
Opera
ting E
xpenses-F
irst R
esp M
ed S
upplie
s30
30
30
30
30
30
30
30
30
30
Capital O
utlay
15
18
17
20
19
21
20
20
20
20
Am
bula
nce C
ontr
act
60
60
60
60
60
60
60
60
60
60
EM
S T
rust F
und G
rant E
xpenditure
s20
20
20
20
20
20
20
20
20
20
Gra
nts
amp A
ids (
First R
esponder
Agm
ts)
50
50
50
50
50
50
50
50
50
50
Pro
jecte
d E
co
no
mic
Co
nd
itio
ns In
dic
ato
rs
Consum
er
Price Index
change
15
18
17
20
19
21
20
20
20
20
FL P
er
Capita P
ers
onal I
ncom
e G
row
th20
22
22
18
14
15
17
16
16
16
Estim
ate
d N
ew
Constr
uctio
n
of ta
x b
ase
05
05
10
10
10
10
10
10
10
10
F-20
EM
ER
GE
NC
Y M
ED
ICA
L S
ER
VIC
ES
FU
ND
FO
RE
CA
ST
Fu
nd
10
06
(in
$ t
ho
usan
ds)
Actu
al
Bu
dg
et
Esti
mate
dE
sti
mate
dE
sti
mate
dE
sti
mate
dE
sti
mate
dE
sti
mate
dE
sti
mate
dE
sti
mate
dE
sti
mate
dE
sti
mate
dE
sti
mate
d
2012
2013
2013
2014
2015
2016
2017
2018
2019
2020
2021
2022
2023
BE
GIN
NIN
G F
UN
D B
AL
AN
CE
213
713
212
463
236
861
228
126
193
023
130
444
40
697
(80
635
)
(235
598
)
(425
541
)
(652
971
)
(920
627
)
(1231
417
)
RE
VE
NU
ES
Ad V
alo
rem
Revenue
95
422
112
438
521
438
521
449
484
460
721
474
543
488
779
503
442
518
546
534
102
550
125
566
629
583
628
Am
bula
nce S
vc C
ontr
act F
ees
95
439
968
415
266
423
571
432
043
440
684
449
497
458
487
467
657
477
010
486
550
496
281
506
207
516
331
Am
bula
nce A
nnual M
em
bers
Fees
2225
1995
1995
1995
1995
1995
1995
1995
1995
1995
1995
1995
1995
Gra
nt R
evenue (
EM
S T
rust F
und)
159
2000
2000
2040
2081
2122
2165
2208
2252
2297
2343
2390
2438
Cty
Off F
ees (
TC
amp P
A)
2918
2676
2676
2703
2730
2757
2785
2813
2841
2869
2898
2927
2956
Inte
rest
1348
1360
1360
1370
1930
2609
1221
-
-
-
-
-
-
Oth
er
revenues (
refu
nd o
f prior
yrs
exp)
588
256
256
256
256
256
256
256
256
256
256
256
256
A
dju
st T
ax R
evenues to 9
6
-
4616
4731
4850
4995
5145
5299
5458
5622
5791
5965
6143
A
dju
st A
mbula
nce R
evenues to 1
00
-
22
398
22
846
23
303
23
769
24
245
24
729
25
224
25
729
26
243
26
768
27
303
TO
TA
L R
EV
EN
UE
S869
318
862
074
897
394
917
468
938
549
962
544
985
077
1008
400
1033
582
1059
420
1085
932
1113
136
1141
051
v
s p
rior
yea
r16
-1
3
2
2
3
2
2
2
2
3
3
3
TO
TA
L R
ES
OU
RC
ES
1083
031
1074
537
1134
255
1145
593
1131
573
1092
988
1025
775
927
765
797
984
633
879
432
961
192
510
(90
366
)
EX
PE
ND
ITU
RE
S
Pers
onal S
erv
ices
27
036
28
849
28
849
30
032
31
233
32
482
33
782
35
133
36
538
38
000
39
520
41
101
42
745
Opera
ting E
xpenses
43
723
58
678
58
678
59
558
60
630
61
661
62
894
64
089
65
435
66
744
68
079
69
440
70
829
O
pera
ting E
xpenses -
First R
esponder
Medic
al S
upplie
s
10
885
12
360
12
360
12
731
13
113
13
506
13
911
14
329
14
758
15
201
15
657
16
127
16
611
Capital O
utlay
4699
7900
7900
8019
8163
8302
8468
8629
8810
8986
9166
9349
9536
Am
bula
nce C
ontr
act
366
575
382
000
382
000
404
920
429
215
454
968
482
266
511
202
541
874
574
387
608
850
645
381
684
104
EM
S T
rust F
und G
rant E
xpenditure
s159
2000
2000
2040
2081
2122
2165
2208
2252
2297
2343
2390
2438
Gra
nts
amp A
ids (
First R
esponder
Agm
ts)
381
984
401
566
401
566
421
644
442
727
464
863
488
106
512
511
538
137
565
044
593
296
622
961
654
109
Trf
rs to P
A amp
TC
11
109
12
776
12
776
13
626
13
967
14
386
14
818
15
262
15
720
16
192
16
677
17
178
17
693
Expenditure
Lapse 1
A
mt
Inclu
de
s E
cke
rd C
on
tra
ct
TO
TA
L E
XP
EN
DIT
UR
ES
846
170
906
129
906
129
952
570
1001
128
1052
291
1106
410
1163
363
1223
525
1286
850
1353
588
1423
926
1498
064
v
s p
rior
yea
r1
7
7
5
5
5
5
5
5
5
5
5
5
EN
DIN
G F
UN
D B
AL
AN
CE
236
861
168
408
228
126
193
023
130
444
40
697
(80
635
)
(235
598
)
(425
541
)
(652
971
)
(920
627
)
(1231
417
)
(1588
430
)
Endin
g b
ala
nce a
s
of E
xpenditure
s280
186
252
203
130
39
-7
3
-203
-3
48
-5
07
-6
80
-8
65
-1
060
TO
TA
L R
EQ
UIR
EM
EN
TS
1083
031
1074
537
1134
255
1145
593
1131
573
1092
988
1025
775
927
765
797
984
633
879
432
961
192
510
(90
366
)
RE
VE
NU
E m
inu
s E
XP
EN
DIT
UR
ES
23
148
(44
055
)
(8735
)
(35
102
)
(62
579
)
(89
747
)
(121
332
)
(154
963
)
(189
943
)
(227
430
)
(267
656
)
(310
790
)
(357
013
)
(NO
T c
um
ula
tive)
no
te
no
n-r
ec
urr
ing
exp
en
dit
ure
s-
-
-
-
-
-
-
-
-
-
-
-
-
ne
t re
cu
rrin
g r
ev-
ex
p2
31
48
(44
05
5)
(87
35
)
(35
10
2)
(62
57
9)
(89
74
7)
(12
13
32
)
(15
49
63
)
(18
99
43
)
(22
74
30
)
(26
76
56
)
(31
07
90
)
(35
70
13
)
1)
FY
2013 r
eflects
the n
ew
ord
inance p
assed b
y B
oard
action o
n D
ecem
ber
20th
2011 to
main
tain
as c
lose a
s p
ossib
le a 2
5
Begin
nin
g F
und B
ala
nce P
erc
enta
ge o
f re
serv
e b
ala
nce d
eclin
es g
oin
g into
FY
2014 a
nd is d
eple
ted in F
Y2017
2)
EM
S M
illage incre
ased fro
m 0
5832 in F
Y11 to 0
8506 in F
Y12 is
then incre
ased to 0
9158 in F
Y13 and then a
ssum
ed to r
em
ain
fla
t th
roughout th
e r
em
ain
der
of th
e fore
cast period M
axim
um
annual E
MS
levy is 1
5000 m
ills
3)
Assum
es e
stim
ate
d A
d V
alo
rem
revenue is a
t 96
except th
e F
Y13 A
dopte
d B
udget w
hic
h r
em
ain
s a
t 95
per
sta
tute
4)
Assum
es e
stim
ate
d a
mbula
nce r
evenue is a
t 100
except th
e F
Y13 A
dopte
d B
udget w
hic
h r
em
ain
s a
t 95
per
sta
tute
5)
The F
irst R
esponder
Agre
em
ents
reflect a 5
incre
ase in F
Y2013 a
nd the r
em
ain
ing fore
cast years
T
his
does n
ot re
flect any c
hanges in s
erv
ice
6)
The E
xpenditure
lapse is n
ot calc
ula
ted o
n this
fund a
s the m
ajo
rity
of th
e e
xpenditure
s w
ithin
this
fund a
re c
ontr
actu
al and a
re fully
expended e
ach y
ear
FO
RE
CA
ST
(
96
Ad
Valo
rem
Reven
ue a
nd
100
Am
bu
lan
ce R
even
ue)
F-21
F-22
100
120
140
160
180
200
220
240
2014
2015
2016
2017
2018
2019
2020
2021
2022
2023
Dollars (millions)
Fir
e D
istr
icts
Fu
nd
Fo
rec
as
t F
Y2
01
4 -
FY
20
23
RE
VE
NU
ES
E
XP
EN
DIT
UR
ES
F-23
FIR
E D
IST
RIC
TS
FU
ND
FO
RE
CA
ST
Fu
nd
10
50
Fo
rec
as
t A
ss
um
pti
on
s2014
2015
2016
2017
2018
2019
2020
2021
2022
2023
RE
VE
NU
ES
Ad V
alo
rem
Tax R
evenue
20
20
25
25
25
25
25
25
25
25
EX
PE
ND
ITU
RE
S
Pers
onal S
erv
ices
41
40
40
40
40
40
40
40
40
40
Opera
ting E
xpenses
15
18
17
20
19
21
20
20
20
20
Capital O
utlay
15
18
17
20
19
21
20
20
20
20
Debt S
erv
ice
00
00
00
00
00
00
00
00
00
00
Gra
nts
amp A
ids (
Cty
Pym
ts)
40
40
40
40
40
40
40
40
40
40
Pro
jecte
d E
co
no
mic
Co
nd
itio
ns In
dic
ato
rs
Consum
er
Price Index
change
15
18
17
20
19
21
20
20
20
20
FL P
er
Capita P
ers
onal I
ncom
e G
row
th20
22
22
18
14
15
17
16
16
16
Estim
ate
d N
ew
Constr
uctio
n
of ta
x b
ase
05
05
10
10
10
10
10
10
10
10
F-24
FIR
E D
IST
RIC
TS
FU
ND
FO
RE
CA
ST
Fu
nd
10
50
(in
$ t
ho
usan
ds)
Actu
al
Bu
dg
et
Esti
mate
dE
sti
mate
dE
sti
mate
dE
sti
mate
dE
sti
mate
dE
sti
mate
dE
sti
mate
dE
sti
mate
dE
sti
mate
dE
sti
mate
dE
sti
mate
d
2012
2013
2013
2014
2015
2016
2017
2018
2019
2020
2021
2022
2023
BE
GIN
NIN
G F
UN
D B
AL
AN
CE
84
213
79
934
85
039
89
924
92
274
92
046
90
481
87
379
81
567
72
793
60
793
45
284
25
967
RE
VE
NU
ES
Ad V
alo
rem
Revenue
95
150
180
148
220
148
220
151
184
154
208
158
063
162
015
166
065
170
217
174
472
178
834
183
305
187
888
Cty
Off F
ees (
TC
amp P
A)
1079
949
949
968
987
1007
1027
1048
1069
1090
1112
1134
1157
Oth
er
Rev (
Inte
rest G
ain
Loss Inv)
535
538
538
629
923
1841
2714
2621
2447
2184
1824
1359
779
Inte
rest -
Tax C
olle
cto
r01
01
01
01
01
01
01
01
01
01
01
01
01
Adju
st P
ropert
y T
axes to
96
1560
1591
1623
1664
1705
1748
1792
1837
1882
1930
1978
Adju
st O
ther
Revenue to 1
00
78
84
101
150
197
193
185
172
155
131
102
TO
TA
L R
EV
EN
UE
S151
795
149
708
151
347
154
458
157
843
162
726
167
660
171
677
175
711
179
756
183
808
187
860
191
904
v
s p
rior
yea
r4
-1
0
2
2
3
3
2
2
2
2
2
2
TO
TA
L R
ES
OU
RC
ES
236
008
229
642
236
386
244
382
250
117
254
773
258
142
259
056
257
278
252
549
244
601
233
144
217
872
EX
PE
ND
ITU
RE
S
Pers
onal S
erv
ices
800
1301
1301
1354
1409
1465
1523
1584
1648
1714
1782
1854
1928
Opera
ting E
xpenditure
s1722
1344
1344
1364
1389
1412
1441
1468
1499
1529
1559
1591
1622
C
urr
Chgs amp
Oblig
(C
ty F
ire A
dm
in C
hgs)
2448
2645
2645
2685
2733
2779
2835
2889
2950
3009
3069
3130
3193
Debt S
erv
ice
-
05
05
05
05
05
05
05
05
05
05
05
05
Gra
nts
amp A
ids (
City P
aym
ents
)144
037
139
232
139
232
144
801
150
593
156
617
162
882
169
397
176
173
183
220
190
549
198
171
206
097
Trf
rs to P
A amp
TC
4410
4580
4580
4583
4675
4792
4912
5034
5160
5289
5421
5557
5696
Pro
-Rate
Cle
aring (
County
Fire A
dm
in C
hgs)
(2448
)
(2645
)
(2645
)
(2685
)
(2733
)
(2779
)
(2835
)
(2889
)
(2950
)
(3009
)
(3069
)
(3130
)
(3193
)
Expenditure
Lapse 1
TO
TA
L E
XP
EN
DIT
UR
ES
150
969
146
462
146
462
152
108
158
071
164
291
170
762
177
489
184
485
191
756
199
317
207
177
215
348
v
s p
rior
yea
r1
-3
-3
4
4
4
4
4
4
4
4
4
4
EN
DIN
G F
UN
D B
AL
AN
CE
85
039
83
180
89
924
92
274
92
046
90
481
87
379
81
567
72
793
60
793
45
284
25
967
2523
Endin
g b
ala
nce a
s
of R
esourc
es
360
362
380
378
368
355
338
315
283
241
185
111
12
TO
TA
L R
EQ
UIR
EM
EN
TS
236
008
229
642
236
386
244
382
250
117
254
773
258
142
259
056
257
278
252
549
244
601
233
144
217
872
RE
VE
NU
E m
inu
s E
XP
EN
DIT
UR
ES
826
3246
4885
2350
(227
)
(1565
)
(3102
)
(5812
)
(8774
)
(12
000
)
(15
509
)
(19
317
)
(23
444
)
(NO
T c
um
ula
tive)
no
te
no
n-r
ecu
rrin
g e
xp
en
dit
ure
s-
-
-
-
-
-
-
-
-
-
-
-
-
ne
t re
cu
rrin
g r
ev-
ex
p8
26
32
46
48
85
23
50
(22
7)
(15
65
)
(31
02
)
(58
12
)
(87
74
)
(12
00
0)
(15
50
9)
(19
31
7)
(23
44
4)
E
xpenditure
lapse is
not calc
ula
ted o
n this
fund a
s the m
ajo
rity
of th
e e
xpenditure
s w
ithin
this
fund a
re c
ontr
actu
al a
nd a
re fully
expended e
ach y
ear
1)
Assum
es e
stim
ate
d A
d V
alo
rem
revenue is a
t 96
except th
e F
Y13 A
dopte
d B
udget w
hic
h r
em
ain
s a
t 95
per
sta
tute
FO
RE
CA
ST
(
96
Ad
Valo
rem
Reven
ue a
nd
100
Oth
er
Reven
ue)
F-25
F-26
$0
0
$2
0
$4
0
$6
0
$8
0
$1
00
$1
20
$1
40
20
13
2
01
4
20
15
2
01
6
20
17
2
01
8
20
19
2
02
0
20
21
2
02
2
20
23
Millions A
irp
ort
Fu
nd
Fo
reca
st
FY2
01
3 -
FY
20
23
Ex
clu
din
g N
on
-Re
curr
ing
Rev
en
ue
s an
d E
xpe
nd
itu
res
Rev
enu
es
Exp
end
itu
res
F-27
AIR
PO
RT
FU
ND
FO
RE
CA
ST
Fu
nd
40
01
Fo
recast
Assu
mp
tio
ns
2014
2015
2016
2017
2018
2019
2020
2021
2022
2023
RE
VE
NU
ES
Airfield
Flig
ht
Lin
es
20
20
20
20
20
20
20
20
20
20
Golf C
ours
e00
00
00
00
00
00
00
00
00
00
Rents
LeasesC
oncessio
ns
20
20
20
20
20
20
20
20
20
20
Capital C
ontr
ibutions
-370
-1
41
391
-3
0
1291
-8
24
00
00
00
00
Oth
er
revenues
20
20
20
20
20
20
20
20
20
20
EX
PE
ND
ITU
RE
S
Pers
onal S
erv
ices
41
40
40
40
40
40
40
40
40
40
Opera
ting E
xpenses
15
18
17
20
19
21
20
20
20
20
Capital O
utlay
15
18
17
20
19
21
20
20
20
20
Gra
nts
amp A
ids
15
18
17
20
19
21
20
20
20
20
Pro
jecte
d E
co
no
mic
Co
nd
itio
ns
Ind
icato
rs
Consum
er
Price I
ndex
c
hange
15
18
17
20
19
21
20
20
20
20
FL P
er
Capita P
ers
onal In
com
e G
row
th20
22
22
18
14
15
17
16
16
16
F-28
AIR
PO
RT
FU
ND
FO
RE
CA
ST
Fu
nd
40
01
(in
$ t
ho
usan
ds
)A
ctu
al
Bu
dg
et
Esti
mate
dE
sti
mate
dE
sti
mate
dE
sti
mate
dE
sti
mate
dE
sti
mate
dE
sti
mate
dE
sti
mate
dE
sti
mate
dE
sti
mate
dE
sti
mate
d
2012
2013
2013
2014
2015
2016
2017
2018
2019
2020
2021
2022
2023
BE
GIN
NIN
G F
UN
D B
AL
AN
CE
146
350
136
909
157
937
141
502
146
618
141
557
139
653
119
666
117
424
124
073
129
864
134
705
138
499
RE
VE
NU
ES
Airfield
Flig
ht
Lin
es
25
776
25
452
26
792
27
328
27
874
28
432
29
001
29
581
30
172
30
776
31
391
32
019
32
659
Golf C
ours
e-
-
-
-
-
-
-
-
-
-
-
-
-
Rents
LeasesC
oncessio
ns
71
425
61
530
64
768
66
063
67
385
68
732
70
107
71
509
72
939
74
398
75
886
77
404
78
952
New
Pro
pert
y D
evelo
pm
ent
-
-
-
-
-
-
-
3300
3366
3433
3502
3572
3643
Gra
nts
2754
2650
2650
2703
2757
2812
2868
2926
2984
3044
3105
3167
3230
Capital C
ontr
ibutions
88
893
101
642
101
642
64
050
55
000
76
500
74
200
170
000
30
000
30
000
30
000
30
000
30
000
Inte
rest
743
889
889
991
1466
2831
4190
3590
3523
3722
3896
4041
4155
Oth
er
revenues
288
18
18
18
19
19
19
20
20
21
21
22
22
TO
TA
L R
EV
EN
UE
S189
879
192
181
196
759
161
153
154
501
179
327
180
385
280
925
143
005
145
394
147
801
150
224
152
662
44
4
-18
-4
16
1
56
-49
2
2
2
2
TO
TA
L R
ES
OU
RC
ES
336
229
329
090
354
695
302
655
301
119
320
883
320
038
400
591
260
428
269
467
277
665
284
929
291
161
EX
PE
ND
ITU
RE
S
Pers
onal S
erv
ices
41
940
43
250
43
250
45
023
46
824
48
697
50
645
52
671
54
778
56
969
59
248
61
617
64
082
Opera
ting E
xpenses
34
541
42
394
42
394
43
030
43
804
44
549
45
440
46
303
47
276
48
221
49
186
50
170
51
173
Golf C
ours
e O
pera
tions
main
tenance
-
-
-
-
-
-
-
-
-
-
-
-
-
Capital O
utlay
2665
1451
1451
1473
1499
1525
1555
1585
1618
1650
1683
1717
1751
Full
Cost
Allo
cation
4552
5111
5111
5147
5198
5302
5461
5625
5794
5968
6147
6331
6521
No
n-r
ecu
rrin
g C
IP e
xp
en
dit
ure
s94
594
123
600
123
600
64
050
65
000
84
000
100
200
180
000
30
000
30
000
30
000
30
000
30
000
Expenditure
Lapse 3
-
(2
613
)
(2
686
)
(2
764
)
(2
843
)
(2
929
)
(3
017
)
(3
110
)
(3
205
)
(3
304
)
(3
405
)
(3
510
)
TO
TA
L E
XP
EN
DIT
UR
ES
178
292
215
806
213
193
156
037
159
562
181
230
200
372
283
167
136
355
139
603
142
960
146
430
150
017
48
20
-27
2
14
11
41
-52
2
2
2
2
EN
DIN
G F
UN
D B
AL
AN
CE
157
937
113
284
141
502
146
618
141
557
139
653
119
666
117
424
124
073
129
864
134
705
138
499
141
144
AS
SU
MIN
G N
O A
CT
ION
TA
KE
N T
O
RE
SO
LV
E S
HO
RT
FA
LL
S
Endin
g b
ala
nce a
s
of
Resourc
es
47
34
40
48
47
44
37
29
48
48
49
49
48
TO
TA
L R
EQ
UIR
EM
EN
TS
336
229
329
090
354
695
302
655
301
119
320
883
320
038
400
591
260
428
269
467
277
665
284
929
291
161
RE
VE
NU
E m
inu
s E
XP
EN
DIT
UR
ES
11
587
(2
3625
)
(16
434
)
5116
(5
061
)
(1
903
)
(1
9987
)
(2242
)
6649
5791
4841
3794
2645
no
te
no
n-r
ecu
rrin
g C
IP e
xp
en
dit
ure
s94
594
123
600
123
600
64
050
65
000
84
000
100
200
180
000
30
000
30
000
30
000
30
000
30
000
no
n-r
ecu
rrin
g r
ev(c
ap
ital
co
ntr
ib)
(88
893
)
(101
642
)
(1
01
642
)
(6
4050
)
(55
000
)
(76
500
)
(74
200
)
(170
000
)
(3
0000
)
(30
000
)
(30
000
)
(30
000
)
(30
000
)
net
recu
rrin
g r
ev-
exp
17
288
(1
667
)
5524
5116
4939
5597
6013
7758
6649
5791
4841
3794
2645
O
pera
ting E
xpenses n
et
of
Full
Cost
Allo
cation
Expenditure
la
pse is c
alc
ula
ted o
n P
ers
onal S
erv
ices
Opera
ting E
xpenses
Capital O
utla
y
and G
rants
amp A
ids o
nly
FY
11 la
pse is u
sed t
o a
dju
st
for
update
d info
rmation
FO
RE
CA
ST
F-29
F-30
700
800
900
1000
1100
2014
2015
2016
2017
2018
2019
2020
2021
2022
2023
Dollars (millions)
Wa
ter
Sys
tem
Fu
nd
s F
ore
ca
st
FY
20
14
- F
Y2
02
3
wit
h R
ate
In
cre
as
es
Re
ve
nu
es
Exp
en
ditu
res
F-31
WA
TE
R F
UN
DS
FO
RE
CA
ST
Fu
nd
40
31
4
03
3
40
34
amp 4
03
6
Fo
rec
as
t A
ss
um
pti
on
s2014
2015
2016
2017
2018
2019
2020
2021
2022
2023
RE
VE
NU
ES
~W
ate
r S
ale
s-R
eta
il
20
20
20
21
22
23
23
23
23
23
Wate
r S
ale
s-W
hole
sale
-9
3
-49
-3
73
20
20
20
20
20
20
20
Oth
er
revenues
-29
-2
1
-11
-2
7
-09
20
20
20
20
20
~E
XP
EN
DIT
UR
ES
Pers
onal S
erv
ices
41
40
40
40
40
40
40
40
40
40
Opera
ting E
xpenses
20
23
18
17
17
18
17
19
21
21
Purc
hase o
f W
ate
r
10
21
08
16
10
25
25
25
25
25
Pow
er
00
50
50
50
50
50
50
50
50
50
Chem
icals
70
70
70
70
70
70
70
70
70
70
Pro
jecte
d E
co
no
mic
Co
nd
itio
ns In
dic
ato
rs
Consum
er
Price Index
change
15
18
17
20
19
21
20
20
20
20
FL P
er
Capita P
ers
onal I
ncom
e G
row
th20
22
22
18
14
15
17
16
16
16
R
evenue p
erc
enta
ges r
eflect th
e c
om
bin
ed im
pact of changes in r
ate
s a
ndo
r le
vels
of consum
ption
P
urc
hase o
f w
ate
r perc
enta
ges r
eflect th
e c
om
bin
ed im
pact of changes in T
am
pa B
ay W
ate
r ra
tes a
ndo
r changes in c
onsum
ption inclu
din
g d
ecre
ases in w
hole
sale
custo
mer
base
]
F-32
WA
TE
R F
UN
DS
FO
RE
CA
ST
Fu
nd
40
31
4
03
3
40
34
amp 4
03
6
(in
$ t
ho
usan
ds)
Actu
al
Bu
dg
et
Esti
mate
dE
sti
mate
dE
sti
mate
dE
sti
mate
dE
sti
mate
dE
sti
mate
dE
sti
mate
dE
sti
mate
dE
sti
mate
dE
sti
mate
dE
sti
mate
d
2012
2013
2013
2014
2015
2016
2017
2018
2019
2020
2021
2022
2023
BE
GIN
NIN
G F
UN
D B
AL
AN
CE
468
844
399
838
470
872
377
252
233
322
262
562
305
749
226
890
211
312
231
236
246
972
258
488
266
057
RE
VE
NU
ES
Wate
r S
ale
s -
Reta
il614
408
620
787
653
460
666
831
680
201
693
805
708
315
723
775
740
230
757
054
774
255
791
840
810
053
Wate
r S
ale
s -
Whole
sale
171
563
150
556
158
480
143
667
136
663
85
730
87
445
89
194
90
977
92
797
94
653
96
546
98
477
Inte
r est
2022
1791
1886
2641
2333
5251
9172
6807
6339
6937
7409
7755
7982
Oth
er
Revenues
60
514
40
925
43
079
41
845
40
954
40
495
39
420
39
060
39
069
39
079
39
088
39
098
39
098
TO
TA
L R
EV
EN
UE
S848
507
814
059
856
904
854
983
860
151
825
281
844
353
858
836
876
616
895
867
915
405
935
239
955
609
v
s p
rior
year
1
0
1
-4
2
2
2
2
2
2
2
TO
TA
L R
ES
OU
RC
ES
1317
351
1213
897
1327
776
1232
235
1093
473
1087
843
1150
102
1085
725
1087
929
1127
103
1162
377
1193
727
1221
666
EX
PE
ND
ITU
RE
S
Pers
onal S
erv
ices
123
054
126
772
126
772
131
970
137
248
142
738
148
448
154
386
160
561
166
984
173
663
180
609
187
834
OP
EB
11
862
13
333
13
333
13
880
14
435
15
012
15
613
16
237
16
887
17
562
18
264
18
995
19
755
Opera
ting E
xpenses
43
056
66
557
66
557
67
888
69
449
70
700
71
901
73
124
74
440
75
705
77
144
78
764
80
418
Purc
hase o
f W
ate
r472
008
454
472
454
472
420
906
423
097
383
991
388
292
390
406
401
079
412
042
423
303
434
870
445
741
Pow
er
17
439
18
628
18
628
18
628
19
560
20
538
21
565
22
643
23
775
24
964
26
212
27
523
28
899
Chem
icals
6777
7745
7745
8287
8867
9488
10
152
10
863
11
623
12
437
13
307
14
239
15
236
Gra
nts
amp A
ids
9782
9388
9388
9593
9198
9704
10
218
10
782
11
397
12
308
12
937
13
767
14
593
Cost A
llocation
86
548
57
117
57
117
58
259
59
599
60
672
61
703
62
752
63
882
64
968
66
202
67
593
69
012
Expenditure
Lapse
-
(7540
)
(7294
)
(7415
)
(7128
)
(7279
)
(7412
)
(7636
)
(7870
)
(8110
)
(8364
)
(8615
)
Debt S
erv
ice
81
100
100
-
-
-
-
-
-
-
-
-
-
Capital O
utlay
75
872
185
097
203
952
276
797
96
871
76
380
202
599
140
633
100
685
101
030
100
966
99
674
99
769
TO
TA
L E
XP
EN
DIT
UR
ES
846
479
939
209
950
524
998
914
830
910
782
094
923
212
874
413
856
693
880
131
903
889
927
670
952
642
v
s p
rior
year
-4
14
5
-17
-6
18
-5
-2
3
3
3
3
TO
TA
L E
ND
ING
FU
ND
BA
LA
NC
E470
872
274
688
377
252
233
322
262
562
305
749
226
890
211
312
231
236
246
972
258
488
266
057
269
024
Endin
g b
ala
nce a
s
of R
esourc
es
36
23
28
19
24
28
20
19
21
22
22
22
22
TO
TA
L R
EQ
UIR
EM
EN
TS
1317
351
1213
897
1327
776
1232
235
1093
473
1087
843
1150
102
1085
725
1087
929
1127
103
1162
377
1193
727
1221
666
RE
VE
NU
E m
inu
s E
XP
EN
DIT
UR
ES
2028
(125
150
)
(93
619
)
(143
931
)
29
241
43
187
(78
859
)
(15
578
)
19
924
15
736
11
516
7569
2967
(NO
T c
um
ula
tive)
E
xpenditure
lapse o
f 1
is c
alc
ula
ted o
n a
ll expenses e
xclu
din
g D
ebt S
erv
ice a
nd C
aptia
l Outa
y
Reven
ues r
efl
ect
the c
om
bin
ed
im
pact
of
ch
an
ges in
rate
s a
nd
or
levels
of
co
nsu
mp
tio
n
Estim
ate
d r
evenues fore
caste
d a
t 100
FO
RE
CA
ST
(
100
)
]
F-33
F-34
550
600
650
700
750
800
850
900
950
2014
2015
2016
2017
2018
2019
2020
2021
2022
2023
Dollars (millions)
Se
we
r S
ys
tem
Fo
rec
as
t F
Y2
01
4-F
Y2
02
3 w
ith
Ra
te I
nc
rea
se
s
Revenue
s
Expend
iture
s
F-35
SE
WE
R F
UN
DS
FO
RE
CA
ST
Fu
nd
4051
4052
4053
amp 4
055
Fo
recast
Assu
mp
tio
ns
20
14
20
15
20
16
20
17
20
18
20
19
20
20
20
21
20
22
20
23
RE
VE
NU
ES
Se
we
r C
ha
rge
s -
Re
tail
60
6
0
28
2
8
29
2
9
29
2
9
29
2
9
Se
we
r C
ha
rge
s -
Wh
ole
sa
le
90
9
0
28
2
8
29
3
0
30
3
0
30
3
0
Recla
ime
d -
Re
tail
59
5
6
27
2
8
27
2
8
27
2
8
27
2
7
Recla
ime
d -
Wh
ole
sa
le
20
2
0
20
2
0
20
2
0
20
2
0
20
2
0
Oth
er
reve
nu
es
00
0
0
00
0
0
00
0
0
00
0
0
00
0
0
EX
PE
ND
ITU
RE
S
Pe
rso
na
l S
erv
ice
s4
1
40
4
0
40
4
0
40
4
0
40
4
0
40
Op
era
tin
g E
xp
en
se
s2
0
23
1
8
17
1
7
18
1
7
19
2
1
21
Po
we
r0
0
50
5
0
50
5
0
50
5
0
50
5
0
50
Che
mic
als
70
7
0
70
7
0
70
7
0
70
7
0
70
7
0
Pro
jec
ted
Ec
on
om
ic C
on
dit
ion
s
In
dic
ato
rs
Con
su
me
r P
rice
In
de
x
c
ha
ng
e1
5
18
1
7
20
1
9
21
2
0
20
2
0
20
FL
Pe
r C
ap
ita
Pe
rso
na
l In
co
me
Gro
wth
20
2
2
22
1
8
14
1
5
17
1
6
16
1
6
R
eve
nu
e p
erc
en
tag
es r
efle
ct
the
co
mb
ine
d im
pa
ct
of
ch
an
ge
s in
ra
tes a
nd
or
leve
ls o
f co
nsu
mp
tio
n
F-36
SE
WE
R F
UN
DS
FO
RE
CA
ST
Fu
nd
4051
4052
4053
amp 4
055
(in
$ t
ho
us
an
ds
)A
ctu
al
Bu
dg
et
Es
tim
ate
dE
sti
ma
ted
Es
tim
ate
dE
sti
ma
ted
Es
tim
ate
dE
sti
ma
ted
Es
tim
ate
dE
sti
ma
ted
Es
tim
ate
dE
sti
ma
ted
Es
tim
ate
d
20
12
20
13
20
13
20
14
20
15
20
16
20
17
20
18
20
19
20
20
20
21
20
22
20
23
BE
GIN
NIN
G F
UN
D B
AL
AN
CE
53
19
65
47
58
45
49
87
60
37
52
76
37
98
17
43
50
12
48
44
76
53
16
74
57
54
45
63
35
13
69
87
40
77
08
03
84
94
28
RE
VE
NU
ES
Se
we
r C
ha
rge
s -
Re
tail
49
04
23
48
38
97
50
93
65
53
99
28
57
23
23
58
80
62
60
45
87
62
19
39
64
01
61
65
89
14
67
82
15
69
80
80
71
83
24
Se
we
r C
ha
rge
s -
Wh
ole
sa
le6
73
06
6
73
96
7
09
44
7
73
28
8
42
88
8
66
06
8
90
50
9
16
29
9
43
48
9
71
48
1
00
03
0
1
02
99
8
1
06
08
8
Recla
ime
d -
Re
tail
38
50
5
39
25
5
41
32
1
43
75
2
46
18
3
47
45
3
48
75
8
50
09
8
51
47
6
52
89
2
54
34
6
55
84
1
57
34
8
Recla
ime
d -
Wh
ole
sa
le3
17
1
31
60
3
32
7
33
27
3
32
7
33
27
3
32
7
33
27
3
32
7
33
27
3
32
7
33
27
3
32
7
Inte
rest
23
34
1
80
0
18
95
2
62
7
37
98
8
70
0
14
53
4
15
95
0
17
26
3
19
00
5
20
96
2
23
12
4
25
48
3
Oth
er
Re
ve
nu
es
1
36
84
4
73
7
49
86
4
98
6
49
86
4
98
6
49
86
4
98
6
49
86
4
98
6
49
86
4
98
6
49
86
TO
TA
L R
EV
EN
UE
S6
15
42
2
6
00
24
5
6
31
83
7
6
71
94
7
7
14
90
4
7
39
13
3
7
65
24
1
7
87
92
8
8
11
56
1
8
36
27
1
8
61
86
6
8
88
35
4
9
15
55
5
v
s p
rio
r ye
ar
7
11
6
6
3
4
3
3
3
3
3
3
TO
TA
L R
ES
OU
RC
ES
11
47
38
8
10
76
09
1
11
30
59
7
10
47
22
3
10
94
72
1
11
74
14
5
12
49
71
7
13
19
60
2
13
87
00
6
14
69
78
5
15
60
60
6
16
59
15
7
17
64
98
3
EX
PE
ND
ITU
RE
S
Pe
rso
na
l S
erv
ice
s1
29
23
3
1
49
25
7
1
49
25
7
1
55
37
6
1
61
59
1
1
68
05
5
1
74
77
7
1
81
76
8
1
89
03
9
1
96
60
1
2
04
46
5
2
12
64
3
2
21
14
9
OP
EB
12
99
2
13
52
4
13
52
4
14
07
9
14
64
2
15
22
8
15
83
7
16
47
0
17
12
9
17
81
4
18
52
7
19
26
8
20
03
9
Op
era
tin
g E
xp
en
se
s8
03
15
1
02
14
3
1
02
14
3
1
04
18
6
1
06
58
2
1
08
50
1
1
10
34
5
1
12
22
1
1
14
24
1
1
16
18
3
1
18
39
1
1
20
87
7
1
23
41
5
Po
we
r4
78
19
5
71
26
5
71
26
5
71
26
5
99
83
6
29
82
6
61
31
6
94
37
7
29
09
7
65
55
8
03
83
8
44
02
8
86
22
Che
mic
als
29
78
4
38
04
9
38
04
9
40
71
2
43
56
2
46
61
1
49
87
4
53
36
5
57
10
1
61
09
8
65
37
5
69
95
1
74
84
8
Cost
Allo
ca
tio
n5
59
70
4
30
31
4
30
31
4
38
91
4
49
01
4
57
09
4
64
86
4
72
76
4
81
27
4
89
45
4
98
75
5
09
23
5
19
92
Exp
en
ditu
re L
ap
se
-
-
(40
31
)
(4
15
4)
(43
13
)
(4
47
1)
(46
35
)
(4
80
5)
(49
85
)
(5
17
2)
(53
70
)
(5
58
1)
(58
01
)
Tra
nsfe
r fr
om
Wa
ter
-
(9
38
8)
(93
88
)
(9
59
3)
(91
98
)
(9
70
4)
(10
21
8)
(1
07
82
)
(11
39
7)
(1
23
08
)
(12
93
7)
(1
37
67
)
(14
59
3)
Deb
t S
erv
ice
14
93
99
14
79
88
14
38
71
14
38
61
14
39
48
14
37
47
14
36
75
14
63
45
14
64
38
14
63
07
14
61
55
14
60
64
14
60
08
-
Ca
pita
l O
utla
y1
43
11
6
2
45
34
8
2
21
74
0
1
21
92
0
9
80
10
1
13
01
2
1
25
77
0
1
32
86
0
1
24
89
0
1
25
02
2
1
24
94
0
1
24
95
0
1
24
85
0
TO
TA
L E
XP
EN
DIT
UR
ES
64
86
27
78
70
77
75
53
21
66
74
06
65
97
09
68
96
70
71
80
43
74
41
57
75
34
93
77
10
45
78
98
03
80
97
30
83
05
29
v
s p
rio
r ye
ar
0
30
-1
2
-1
5
4
4
1
2
2
3
3
TO
TA
L E
ND
ING
FU
ND
BA
LA
NC
E4
98
76
0
2
89
01
3
3
75
27
6
3
79
81
7
4
35
01
2
4
84
47
6
5
31
67
4
5
75
44
5
6
33
51
3
6
98
74
0
7
70
80
3
8
49
42
8
9
34
45
4
En
din
g b
ala
nce
as
of
Reso
urc
es
43
2
7
33
3
6
40
4
1
43
4
4
46
4
8
49
5
1
53
TO
TA
L R
EQ
UIR
EM
EN
TS
11
47
38
8
10
76
09
1
11
30
59
7
10
47
22
3
10
94
72
1
11
74
14
5
12
49
71
7
13
19
60
2
13
87
00
6
14
69
78
5
15
60
60
6
16
59
15
7
17
64
98
3
Deb
t S
erv
ice
Co
ve
rag
e1
74
16
81
88
20
62
13
22
02
21
22
52
30
23
52
39
24
4
RE
VE
NU
E m
inu
s E
XP
EN
DIT
UR
ES
(33
20
5)
(1
86
83
2)
(12
34
84
)
4
54
1
55
19
5
49
46
3
47
19
8
43
77
2
58
06
8
65
22
6
72
06
3
78
62
5
85
02
6
(NO
T c
um
ula
tive
)
O
pe
ratin
g E
xp
en
se
s n
et
of
Cost
Allo
ca
tio
n
Exp
en
ditu
re la
pse
of
1
is c
alc
ula
ted
on
all
exp
en
se
s e
xclu
din
g D
eb
t S
erv
ice
an
d C
ap
ita
l O
utla
y
Rev
en
ue
s r
efl
ec
t th
e c
om
bin
ed
im
pa
ct
of
ch
an
ge
s i
n r
ate
s a
nd
or
lev
els
of
co
ns
um
pti
on
FO
RE
CA
ST
(
10
0
)
F-37
F-38
500
600
700
800
900
1000
1100
1200
1300
1400
1500
2014
2015
2016
2017
2018
2019
2020
2021
2022
2023
Dollars (millions)
So
lid
Wa
ste
Fu
nd
s F
ore
ca
st
FY
20
14
- F
Y2
02
3
Reven
ue
s
Exp
en
dit
ure
s
No
te
Do
es n
ot
incl
ud
e C
ap
ita
l Pro
ject
s Fu
nd
loa
n a
ctiv
ity
F-39
SO
LID
WA
ST
E F
UN
DS
FO
RE
CA
ST
Fu
nd
4021 amp
4023
Fo
recast
Assu
mp
tio
ns
20
14
20
15
20
16
20
17
20
18
20
19
20
20
20
21
20
22
20
23
RE
VE
NU
ES
Tip
pin
g F
ee
s0
5
05
0
5
05
0
5
05
0
5
05
0
5
05
Ele
ctr
icity S
ale
s0
5
05
0
5
05
0
5
05
0
5
05
0
5
05
Ele
ctr
ica
l C
ap
acity
64
6
4
64
6
4
64
6
4
64
6
4
64
6
4
Recyclin
g R
eve
nu
e0
0
00
0
0
00
0
0
00
0
0
00
0
0
00
Oth
er
reve
nu
es
20
2
0
20
2
0
20
2
0
20
2
0
20
2
0
EX
PE
ND
ITU
RE
S
Pe
rso
na
l S
erv
ice
s4
1
40
4
0
40
4
0
40
4
0
40
4
0
40
Op
era
tin
g E
xp
en
se
s2
0
23
1
8
17
1
7
18
1
7
19
2
1
21
WT
E S
erv
ice
Fe
e1
9
19
1
9
20
2
0
19
1
9
20
2
0
20
La
nd
fill S
erv
ice
Fe
e1
9
19
1
9
20
2
0
19
1
9
20
2
0
20
HE
C3 C
osts
20
2
3
18
1
7
17
1
8
17
1
9
21
2
1
Gra
nts
amp A
ids
00
0
0
00
0
0
00
0
0
00
0
0
00
0
0
Cost
Allo
ca
tio
n1
9
19
1
9
20
2
0
19
1
9
20
2
0
20
Pro
jec
ted
Ec
on
om
ic C
on
dit
ion
s
In
dic
ato
rs
Con
su
me
r P
rice
In
de
x
c
ha
ng
e1
5
18
1
7
20
1
9
21
2
0
20
2
0
20
FL
Pe
r C
ap
ita
Pe
rso
na
l In
co
me
Gro
wth
20
2
2
22
1
8
14
1
5
17
1
6
16
1
6
F-40
SO
LID
WA
ST
E F
UN
DS
FO
RE
CA
ST
Fu
nd
4021 amp
4023
(in
$ t
ho
us
an
ds
)A
ctu
al
Bu
dg
et
Es
tim
ate
dE
sti
ma
ted
Es
tim
ate
dE
sti
ma
ted
Es
tim
ate
dE
sti
ma
ted
Es
tim
ate
dE
sti
ma
ted
Es
tim
ate
dE
sti
ma
ted
Es
tim
ate
d
20
12
20
13
20
13
20
14
20
15
20
16
20
17
20
18
20
19
20
20
20
21
20
22
20
23
BE
GIN
NIN
G F
UN
D B
AL
AN
CE
16
62
93
71
14
67
68
18
86
75
61
67
89
39
11
24
25
01
23
17
21
13
77
67
31
53
64
28
18
91
29
02
42
47
58
29
38
75
13
34
89
82
38
29
88
1
RE
VE
NU
ES
Tip
pin
g F
ee
s3
34
89
93
37
29
23
55
04
43
56
81
93
58
60
33
60
39
63
62
19
83
64
00
93
65
82
93
67
65
83
69
49
73
71
34
43
73
20
1
Ele
ctr
icity S
ale
s9
78
17
11
29
43
11
88
87
11
94
82
12
00
79
12
06
80
12
12
83
12
18
89
12
24
99
12
31
11
12
37
27
12
43
46
12
49
67
Ele
ctr
ica
l C
ap
acity
36
89
71
37
28
18
39
24
40
41
73
80
44
39
00
47
21
20
50
21
90
53
41
20
56
81
40
60
43
30
64
27
80
68
37
20
72
72
80
Recyclin
g R
eve
nu
e4
65
05
76
86
07
16
07
16
07
16
07
16
07
16
07
16
07
16
07
16
07
16
07
16
07
1
Inte
rest
74
78
18
86
19
85
11
75
31
12
42
24
63
44
13
30
46
09
35
67
39
72
74
38
81
63
10
04
69
11
48
96
Oth
er
reve
nu
es
31
33
11
07
21
12
81
15
01
17
31
19
71
22
11
24
51
27
01
29
61
32
21
34
81
37
5
Deb
t S
erv
ice
on
Lo
an
fro
m C
ap
ita
l F
un
d3
18
28
71
30
22
28
00
28
00
23
00
15
00
15
00
12
00
50
00
00
00
0
Lo
an
re
pa
ym
en
t fr
om
Ca
pita
l F
un
d (
Chille
r)0
01
50
00
15
78
91
50
00
15
00
01
50
00
15
00
00
00
00
00
00
00
0
Lo
an
re
pa
ym
en
t fr
om
Ca
pita
l F
un
d0
00
00
00
05
00
00
50
00
05
00
00
20
00
00
20
00
00
15
00
00
00
00
00
TO
TA
L R
EV
EN
UE
S8
45
46
48
49
64
98
94
36
79
30
45
51
00
88
70
10
52
39
91
10
07
94
12
74
92
81
32
17
48
13
25
71
01
23
15
59
12
87
29
91
34
77
91
v
s p
rio
r ye
ar
-1
5
4
8
4
5
16
4
0
-7
5
5
TO
TA
L R
ES
OU
RC
ES
25
08
40
11
99
64
17
27
81
12
32
60
93
95
21
33
11
92
28
41
19
24
78
46
72
81
13
56
32
13
03
93
75
04
68
41
70
31
04
63
62
81
51
77
67
2
EX
PE
ND
ITU
RE
S
Pe
rso
na
l S
erv
ice
s4
91
07
58
67
85
86
78
61
08
46
35
27
66
06
86
87
11
71
46
07
43
18
77
29
18
03
82
83
59
88
69
41
OP
EB
48
96
50
96
50
96
53
05
55
17
57
38
59
68
62
06
64
55
67
13
69
81
72
60
75
51
Op
era
tin
g E
xp
en
se
s
40
74
67
86
11
78
61
17
97
90
81
22
68
26
07
84
25
98
58
60
87
66
38
94
17
91
20
59
30
29
94
89
0
WT
E S
erv
ice
Fe
e2
23
49
13
12
93
53
12
93
53
18
88
13
24
93
93
31
11
33
37
73
63
44
49
03
51
03
63
57
70
53
64
85
93
72
15
63
79
60
0
La
nd
fill S
erv
ice
Fe
e8
89
03
11
29
71
11
29
71
11
51
18
11
73
05
11
95
34
12
19
24
12
43
63
12
67
26
12
91
34
13
17
16
13
43
51
13
70
38
HE
C3 C
osts
13
41
81
76
42
17
64
21
79
95
18
40
91
87
40
19
05
81
93
82
19
73
12
00
67
20
44
82
08
77
21
31
6
Gra
nts
amp A
ids
49
87
50
00
50
00
50
00
50
00
50
00
50
00
50
00
50
00
50
00
50
00
50
00
50
00
Cost
Allo
ca
tio
ns
29
02
23
27
77
32
77
73
32
69
33
86
73
44
43
35
13
23
58
00
36
55
13
72
82
38
02
83
87
89
39
56
4
Cap
ita
l O
utla
y1
67
07
64
00
89
43
09
71
04
05
06
92
58
10
52
49
83
52
71
02
82
34
43
08
78
75
96
33
59
00
94
58
89
05
77
70
Inte
rfu
nd
Lo
an
to
Ca
pita
l F
un
d0
01
00
00
01
75
00
04
50
00
00
00
00
00
00
00
00
00
00
0
Exp
en
ditu
re L
ap
se
0
0(6
23
7)
(63
64
)(6
49
8)
(66
32
)(6
77
8)
(69
26
)(7
07
5)
(72
26
)(7
38
6)
(75
51
)(7
71
9)
TO
TA
L E
XP
EN
DIT
UR
ES
62
16
45
11
24
60
41
10
21
83
14
85
14
59
01
39
99
06
44
69
42
03
99
20
06
67
88
28
08
11
71
78
21
32
88
06
40
08
21
95
1
v
s p
rio
r ye
ar
-3
72
3
5
-39
1
4
-2
-1
4
3
1
-2
2
EN
DIN
G F
UN
D B
AL
AN
CE
18
86
75
68
71
81
31
67
89
39
11
24
25
01
23
17
21
13
77
67
31
53
64
28
18
91
29
02
42
47
58
29
38
75
13
34
89
82
38
29
88
14
35
57
22
En
din
g b
ala
nce
as
of
Reso
urc
es
75
4
4
60
4
3
58
6
0
62
6
7
75
7
8
80
8
3
84
TO
TA
L R
EQ
UIR
EM
EN
TS
25
08
40
11
99
64
17
27
81
12
32
60
93
95
21
33
11
92
28
41
19
24
78
46
72
81
13
56
32
13
03
93
75
04
68
41
70
31
04
63
62
81
51
77
67
2
RE
VE
NU
E m
inu
s E
XP
EN
DIT
UR
ES
22
38
19
(27
49
55
)(2
07
81
6)
(55
46
90
)1
07
47
11
45
95
21
58
75
53
54
86
25
33
46
85
13
99
34
10
23
14
80
89
95
25
84
0
(NO
T c
um
ula
tive
)
no
te
no
n-r
ec
urr
ing
ex
p amp
re
v (
loa
n)
(31
8)
82
12
91
56
18
94
32
20
0(6
78
00
)(6
73
00
)(6
65
00
)(2
01
50
0)
(20
12
00
)(1
50
50
0)
00
00
00
net
recu
rrin
g r
ev-
exp
223
501
(192
826
)(5
1628
)(1
22
490
)39
671
78
652
92
255
153
362
332
268
363
493
410
231
480
899
525
840
O
pe
ratin
g E
xp
en
se
s n
et
of
Inte
rgo
ve
rnm
en
tal C
ha
rge
s
Exp
en
ditu
re la
pse
of
1
is c
alc
ula
ted
on
Pe
rso
na
l S
erv
ice
s
Op
era
tin
g E
xp
en
se
s
Cost
Allo
ca
tio
n a
nd
Gra
nts
amp A
ids
Exclu
de
s in
terf
un
d lo
an
s
Estim
ate
d r
eve
nu
es f
ore
ca
ste
d a
t 1
00
FO
RE
CA
ST
(
10
0
)
F-41
F-42
GLOSSARY
Pinellas County Budget Forecast FY2014-2023 G-1
AD VALOREM TAX - A tax levied in proportion to the value of the property against which it is levied ADOPTED BUDGET - The financial plan for the fiscal year beginning October 1 It is required by law to be approved by the Board of County Commissioners at the second of two public hearings AMENDMENT ONE ndash Approved by the voters of Florida on January 29 2008 and made the following changes which reduced taxable property values and revenues available to local government o ldquoDoubledrdquo the existing $25000 homestead exemption (except for school taxes)
o Allows for up to $500000 of the Save Our Homes exemption to be applied to another property (portability)
o Imposed a 10 cap on assessments for non-homestead property (school taxes exempt)
o Instituted a new tangible personal property exemption of $25000 AMERICAN RECOVERY amp REINVESTMENT ACT OF 2009 - In February 2009 Congress passed the American Recovery and Reinvestment Act (ARRA) of 2009 at the urging of President Obama who signed it into law on February 17th A direct response to the economic crisis the Recovery Act has three immediate goals (1) Create new jobs as well as save existing ones (2) Spur economic activity and invest in long-term economic growth and (3) Foster unprecedented levels of accountability and transparency in government spending
AMT - Alternative Minimum Tax An income tax imposed by the United States federal government on individuals corporations estates and trusts AMT is imposed at a nearly flat rate on an adjusted amount of taxable income above a certain threshold (exemption)
APPROPRIATION - The legal authorization granted by a legislative body to make expenditures and to incur obligations for specific purposes An appropriation is usually limited in the amount and as to the time when it may be expended It is the act of appropriation that funds the budget ARM - Adjustablendashrate mortgage ASSESSED VALUE - A valuation set upon real estate or other property by a government as basis for levying taxes Taxable valuation is calculated from an assessed valuation The assessed value is set by the Property Appraiser BEGINNING FUND BALANCE - The Ending Fund Balance of the previous period (See Ending Fund Balance definition) BOARD OF COUNTY COMMISSIONERS (BCC) - The Board of County Commissioners is the seven (7) member legislative and governing body for Pinellas County BOND - Written evidence of the issuers obligation to repay a specified principal amount on a certain date (maturity date) together with interest at a stated rate or according to a formula for determining that rate
GLOSSARY
Pinellas County Budget Forecast FY2014-2023 G-2
BUDGET - A financial plan containing an estimate of proposed revenues and expenditures for a given period (typically a fiscal year) CAPITAL BUDGET - The financial plan of capital project expenditures for the fiscal year beginning October 1 It incorporates anticipated revenues and appropriations included in the first year of the six year Capital Improvements Program (CIP) and any anticipated unspent appropriation balances from the previous fiscal year The Capital Budget is adopted by the Board of County Commissioners as a part of the annual County Budget CAPITAL IMPROVEMENT PROGRAM (CIP) - A proposed plan covering each year of a fixed period of years for financing long-term work projects that lead to the physical development of the County CAPITAL OUTLAY OR CAPITAL EQUIPMENT - Items such as office furniture fleet equipment data processing equipment and other operating equipment with a unit cost of $1000 or more CAPITAL PROJECT - An improvement or acquisition of major facilities roads bridges buildings or land with a useful life of at least five years CHARGE FOR SERVICES - Charges for a specific governmental service which covers the cost of providing that service to the user (eg building permits animal licenses park fees) CONSTITUTIONAL OFFICERS - They are elected to administer a specific function of County government and are directly accountable to the public for its proper operation Constitutional Officers include the Clerk of the Circuit Court the Property Appraiser the Sheriff the Supervisor of Elections and the Tax Collector COST CENTER - A budgeting entity which encompasses object level accounts (appropriations) that are used to monitor organization or program level expenditures DEBT SERVICE - The dollars required to repay funds borrowed by means of an issuance of bonds or a bank loan The components of the debt service payment typically include an amount to retire a portion of the principal amount borrowed (ie amortization) as well as interest on the remaining outstanding unpaid principal balance DEBT SERVICE FUND - An account into which the issuer makes periodic deposits to assure the timely availability of sufficient monies for the payment of debt service requirements (ie principal and interest) The revenues to be deposited into the debt service fund and payments from there are determined by terms of the bond covenants DEBT SERVICE COVERAGE RATIO ndash A ratio indicating the amount of cash available to meet annual principal and interest payments on debt The general calculation is net operating income divided by the total debt service amount DEPENDENT SPECIAL DISTRICT - A special district whose governing body or whose budget is established by the governing body of the County or municipality to which it is dependent
GLOSSARY
Pinellas County Budget Forecast FY2014-2023 G-3
DESIGNATED FUNDS ndash Funds that are set apart for a specific purpose to fund on-going or one-time expenditure Examples are bond proceeds reserves for fund balance reserve for contingencies (ldquoRainy Day Fundrdquo) and ldquopay as you gordquo reserves for future facility renewal amp replacement found mostly in the Enterprise Funds ELECTED OFFICIALS - Elected Officials include the Board of County Commissioners the Judiciary the State Attorney the Public Defender and five Constitutional Officers the Clerk of the Circuit Court the Property Appraiser the Sheriff the Supervisor of Elections and the Tax Collector ENDING FUND BALANCE - Funds carried over at the end of the fiscal year Within the fund the revenue on hand at the beginning of the fiscal year plus revenues received during the year less expenses equals ending fund balance The Ending Fund Balance becomes the Beginning Fund balance in the next fiscal year ENTERPRISE FUND - A fund used to account for operations that are financed and operated in a manner similar to private business enterprises--where the intent of the governing body is that the costs (expenses including depreciation) of providing goods or services to the general public on a continuing basis be financed or recovered primarily through user charges FANNIE MAE ndashFederal National Mortgage Association (FNMA) ndash A government-sponsored enterprise (GSE) that was created in 1938 to expand the flow of mortgage money by creating a secondary mortgage market Fannie Mae is a publicly traded company which operates under a congressional charter that directs Fannie Mae to channel its efforts into increasing the availability and affordability of homeownership for low- moderate- and middle-income Americans Fannie Mae purchases and guarantees mortgages that meet its funding criteria Through this process it secures mortgages to form mortgage-backed securities (MBS) The market for Fannie Maes MBS is extremely large and liquid FIRE PROTECTION DISTRICT - A designated area in the County where ad valorem revenues are collected from property owners and distributed to local cities and other agencies to finance fire suppression services to the area FISCAL YEAR - A twelve-month period of time to which the annual budget applies At the end of this time a governmental unit determines its financial position and the results of its operations The Pinellas County fiscal year begins on October 1 and ends on September 30 of the subsequent calendar year FORECLOSURE - A legal process by which a mortgagees right to redeem a mortgage is taken away usually because of failing to make payments FREDDIE MAC ndash Federal Home Loan Mortgage Corp (FHLMC) - A stockholder-owned government-sponsored enterprise (GSE) chartered by Congress in 1970 to keep money flowing to mortgage lenders in support of homeownership and rental housing for middle income Americans The FHLMC purchases guarantees and securitizes mortgages to form mortgage-backed securities The mortgage-backed securities that it issues tend to be very liquid and carry a credit rating close to that of US Treasuries
GLOSSARY
Pinellas County Budget Forecast FY2014-2023 G-4
FUND - An accounting entity with a complete set of self balancing accounts established to account for finances of a specific function or activity The resources and uses are segregated from other resources and uses for the purpose of carrying on specific activities or attaining specific objectives in accordance with special regulations restrictions or limitations FUND ACCOUNTING ndash Accounting method generally used by governmental agencies Usually consists of eleven classifications into which all individual funds can be categorized Governmental fund types include the general fund special revenue funds debt service funds capital projects funds and permanent funds Proprietary fund types include enterprise funds and internal service funds Fiduciary fund types include pension (and other employee benefit) trust funds investment trust funds private-purpose trust funds and agency funds FUNDING SOURCES - The type or origination of funds to finance ongoing or one-time expenditures Examples are ad valorem taxes user fees licenses permits and grants GENERAL FUND - This fund accounts for all financial transactions except those required to be accounted for in other funds The funds resources ad valorem taxes and other revenues provide services or benefits to all residents of Pinellas County GROSS DOMESTIC PRODUCT - Gross Domestic Product (GDP) is the generally accepted measure of the size of the national economy GDP measures the total market value of all final goods and services produced in a country in a given year GROSS METRO PRODUCT - Similar to Gross Domestic Product Gross Metropolitan Product (GMP) is defined as the market value of all final goods and services produced within a metropolitan area in a given period of time INDEPENDENT AGENCIES - A variety of agencies councils and other organizational entities responsible for administering public policy functions independently of the Constitutional Officers and County Administrator These entities are subject to Board of County Commissioner appropriation but operate under the purview of a legislativepolicy making body other than the Board of County Commissioners INFRASTRUCTURE - Infrastructure is a permanent installation-such as a building road or water transmission system - that provides public services INTERGOVERNMENTAL REVENUE - Revenue collected by one government and distributed (usually through some predetermined formula) to another level of government INTERNAL SERVICE FUND - A fund established to finance and account for services and commodities furnished by one department to other departments on a cost reimbursement basis MANDATE - A requirement imposed by a legal act of the federal state or local government
GLOSSARY
Pinellas County Budget Forecast FY2014-2023 G-5
METROPOLITAN STATISTICAL AREA (MSA) ndash MSA is a formal definition of a metropolitan area established by the United States Office of Management and Budget division MSArsquos are used to group counties and cities into specific geographic areas for the purposes of a population census and the compilation of related statistical data
MILLAGE RATE - A rate applied to a propertys taxable value to determine property tax due As used with ad valorem (property) taxes the rate expresses the dollars of tax per one thousand dollars of taxable value (ie a 5 mill tax on $1000 equals $500) MISSION STATEMENT - A broad statement of purpose which is derived from organization andor community values and goals MORTGAGE BACKED SECURITIES (MBS) - A type of security whose cash flows come from debt such as mortgages home-equity loans and subprime mortgages This is a type of security that typically focuses on residential instead of commercial debt MBS are sold and purchased in the open market Holders of a MBS receive interest and principal payments that come from the holders of the debt MUNICIPAL SERVICES TAXING UNIT (MSTU) - A special district authorized by the State Constitution Article VII and Florida Statutes 12501 The MSTU is the legal and financial mechanism for providing specific services andor improvements to a defined geographical area An MSTU may levy ad valorem taxes without a referendum An MSTU may also use assessments service charges or other revenue to provide its sources of income In Pinellas County the MSTU is all the unincorporated areas of the County NET EXPORTS - Exports minus imports OPERATING BUDGET - The operating budget includes appropriations for recurring and certain one-time expenditures that will be consumed in a fixed period of time to provide for day-to-day operations (eg salaries and related benefits operating supplies contractual and maintenance services professional services and software) PERSONAL SERVICES - Expenses for salaries wages and related employee benefits provided for all persons whether full-time part-time temporary or seasonal PREDATORY LENDING - The practice of unscrupulous lenders to enter into unsafe or unsound secured loans for inappropriate purposes PRO-RATE - A budgetary convention (used in Community Development and Fire Administration) that allows for centralized departmental services to be budgeted for in one cost center with the actual costs being allocated to the specific users of the service in other cost centers This is technically accomplished by appropriating a negative amount for the total central departmental service An allocation of the central services total appropriation is then budgeted in each of the user cost centers thereby reflecting the total cost to that particular function
RECESSION - A significant decline in activity across the economy lasting longer than a few months that is visible in industrial production employment real income and wholesale-retail trade The
GLOSSARY
Pinellas County Budget Forecast FY2014-2023 G-6
technical indicator of a recession is two consecutive quarters of negative economic growth as measured by a countrys gross domestic product (GDP)
RESERVES - Included in this category are funds required to meet both anticipated and unanticipated needs the balance of anticipated earmarked revenues not required for operation in the budget year those required to be set aside by bond covenants and accumulated funds set aside to finance capital construction on a pay-as-you-go basis REVENUE - The amount estimated to be received from taxes fees permits or other sources during a fiscal year REVISED BUDGET - The current year adopted budget adjusted to reflect all budget amendments approved by the Board of County Commissioners through January 31 ROLLED-BACK RATE - The millage rate which when applied to the total amount of taxable value of property (excluding new construction) produces the same amount of tax dollars as the previous year Calculation of the ldquorolled-back raterdquo is governed by Florida Statutes SAVE OUR HOMES AMENDMENT - The amendment was intended to protect homeowners from escalating property tax bills resulting from growth in market value a situation that was perceived to be forcing some people particularly residents on fixed incomes to sell their homes SHADOW BANKING SYSTEM - All financial intermediaries involved in facilitating the creation of credit across the global financial system but whose members are not subject to regulatory oversight Shadow Banking System also refers to unregulated activities by regulated institutions Examples of intermediaries not subject to regulation include hedge funds unlisted derivatives and other unlisted instruments SPECIAL ASSESSMENT FUND - A fund used to account for the financing of public improvements or services deemed to benefit the properties against which special assessments are levied SPECIAL REVENUE FUND - A fund used to account for the proceeds of specific revenue sources (other than expendable trusts or major capital projects) that are legally restricted to expenditures for specified purposes STATUTE - A written law enacted by a duly organized and constituted legislative body SUPPORT FUNDING - Support funding is provided by the Board of County Commissioners for those activities for which costs do not apply solely to any specific county departments function but are either applicable to the operation of county government as a whole or are provided for the public good TAXABLE VALUE - The assessed value of property minus any authorized exemptions (ie agricultural homestead exemption) This value is used to determine the amount of property (ad valorem) tax to be levied
GLOSSARY
Pinellas County Budget Forecast FY2014-2023 G-7
TAXES - Compulsory charges levied by a government for the purpose of financing services performed for the common benefit TOXIC ASSETS ndashThe term toxic asset was coined in the financial crisis of 200809 in regards to mortgage-backed securities collateralized debt obligations and credit default swaps all of which could not be sold after they exposed their holders to massive losses A toxic asset is one that becomes illiquid when its secondary market disappears Toxic assets cannot be sold as they are often guaranteed to lose money Many hedge funds banks and financial institutions invested heavily in mortgage-backed securities and collateralized debt obligations often using borrowed money and thus increasing their exposure This strategy proved profitable during the housing boom but resulted in enormous losses when house prices began to decline and mortgages began to default These ldquotoxic assetsrdquo were purchased by banks around the world contributing to a general sense of panic as mortgage defaults rose and liquidity fell TRANSFERS - Because of legal or other restrictions monies collected in one fund may need to be expended in other funds This is accomplished through Transfer-In (a source of funds) for the recipient fund and an equal Transfer-Out (a use of funds) for the donor fund When this movement occurs between different funds it is known as the Interfund Transfer UNINCORPORATED AREA - That portion of the County which is not within the boundaries of any municipality
GLOSSARY
Pinellas County Budget Forecast FY2014-2023 G-8
GLOSSARY
Pinellas County Budget Forecast FY2014-2023 G-1
AD VALOREM TAX - A tax levied in proportion to the value of the property against which it is levied ADOPTED BUDGET - The financial plan for the fiscal year beginning October 1 It is required by law to be approved by the Board of County Commissioners at the second of two public hearings AMENDMENT ONE ndash Approved by the voters of Florida on January 29 2008 and made the following changes which reduced taxable property values and revenues available to local government o ldquoDoubledrdquo the existing $25000 homestead exemption (except for school taxes)
o Allows for up to $500000 of the Save Our Homes exemption to be applied to another property (portability)
o Imposed a 10 cap on assessments for non-homestead property (school taxes exempt)
o Instituted a new tangible personal property exemption of $25000 AMERICAN RECOVERY amp REINVESTMENT ACT OF 2009 - In February 2009 Congress passed the American Recovery and Reinvestment Act (ARRA) of 2009 at the urging of President Obama who signed it into law on February 17th A direct response to the economic crisis the Recovery Act has three immediate goals (1) Create new jobs as well as save existing ones (2) Spur economic activity and invest in long-term economic growth and (3) Foster unprecedented levels of accountability and transparency in government spending
AMT - Alternative Minimum Tax An income tax imposed by the United States federal government on individuals corporations estates and trusts AMT is imposed at a nearly flat rate on an adjusted amount of taxable income above a certain threshold (exemption)
APPROPRIATION - The legal authorization granted by a legislative body to make expenditures and to incur obligations for specific purposes An appropriation is usually limited in the amount and as to the time when it may be expended It is the act of appropriation that funds the budget ARM - Adjustablendashrate mortgage ASSESSED VALUE - A valuation set upon real estate or other property by a government as basis for levying taxes Taxable valuation is calculated from an assessed valuation The assessed value is set by the Property Appraiser BEGINNING FUND BALANCE - The Ending Fund Balance of the previous period (See Ending Fund Balance definition) BOARD OF COUNTY COMMISSIONERS (BCC) - The Board of County Commissioners is the seven (7) member legislative and governing body for Pinellas County BOND - Written evidence of the issuers obligation to repay a specified principal amount on a certain date (maturity date) together with interest at a stated rate or according to a formula for determining that rate
GLOSSARY
Pinellas County Budget Forecast FY2014-2023 G-2
BUDGET - A financial plan containing an estimate of proposed revenues and expenditures for a given period (typically a fiscal year) CAPITAL BUDGET - The financial plan of capital project expenditures for the fiscal year beginning October 1 It incorporates anticipated revenues and appropriations included in the first year of the six year Capital Improvements Program (CIP) and any anticipated unspent appropriation balances from the previous fiscal year The Capital Budget is adopted by the Board of County Commissioners as a part of the annual County Budget CAPITAL IMPROVEMENT PROGRAM (CIP) - A proposed plan covering each year of a fixed period of years for financing long-term work projects that lead to the physical development of the County CAPITAL OUTLAY OR CAPITAL EQUIPMENT - Items such as office furniture fleet equipment data processing equipment and other operating equipment with a unit cost of $1000 or more CAPITAL PROJECT - An improvement or acquisition of major facilities roads bridges buildings or land with a useful life of at least five years CHARGE FOR SERVICES - Charges for a specific governmental service which covers the cost of providing that service to the user (eg building permits animal licenses park fees) CONSTITUTIONAL OFFICERS - They are elected to administer a specific function of County government and are directly accountable to the public for its proper operation Constitutional Officers include the Clerk of the Circuit Court the Property Appraiser the Sheriff the Supervisor of Elections and the Tax Collector COST CENTER - A budgeting entity which encompasses object level accounts (appropriations) that are used to monitor organization or program level expenditures DEBT SERVICE - The dollars required to repay funds borrowed by means of an issuance of bonds or a bank loan The components of the debt service payment typically include an amount to retire a portion of the principal amount borrowed (ie amortization) as well as interest on the remaining outstanding unpaid principal balance DEBT SERVICE FUND - An account into which the issuer makes periodic deposits to assure the timely availability of sufficient monies for the payment of debt service requirements (ie principal and interest) The revenues to be deposited into the debt service fund and payments from there are determined by terms of the bond covenants DEBT SERVICE COVERAGE RATIO ndash A ratio indicating the amount of cash available to meet annual principal and interest payments on debt The general calculation is net operating income divided by the total debt service amount DEPENDENT SPECIAL DISTRICT - A special district whose governing body or whose budget is established by the governing body of the County or municipality to which it is dependent
GLOSSARY
Pinellas County Budget Forecast FY2014-2023 G-3
DESIGNATED FUNDS ndash Funds that are set apart for a specific purpose to fund on-going or one-time expenditure Examples are bond proceeds reserves for fund balance reserve for contingencies (ldquoRainy Day Fundrdquo) and ldquopay as you gordquo reserves for future facility renewal amp replacement found mostly in the Enterprise Funds ELECTED OFFICIALS - Elected Officials include the Board of County Commissioners the Judiciary the State Attorney the Public Defender and five Constitutional Officers the Clerk of the Circuit Court the Property Appraiser the Sheriff the Supervisor of Elections and the Tax Collector ENDING FUND BALANCE - Funds carried over at the end of the fiscal year Within the fund the revenue on hand at the beginning of the fiscal year plus revenues received during the year less expenses equals ending fund balance The Ending Fund Balance becomes the Beginning Fund balance in the next fiscal year ENTERPRISE FUND - A fund used to account for operations that are financed and operated in a manner similar to private business enterprises--where the intent of the governing body is that the costs (expenses including depreciation) of providing goods or services to the general public on a continuing basis be financed or recovered primarily through user charges FANNIE MAE ndashFederal National Mortgage Association (FNMA) ndash A government-sponsored enterprise (GSE) that was created in 1938 to expand the flow of mortgage money by creating a secondary mortgage market Fannie Mae is a publicly traded company which operates under a congressional charter that directs Fannie Mae to channel its efforts into increasing the availability and affordability of homeownership for low- moderate- and middle-income Americans Fannie Mae purchases and guarantees mortgages that meet its funding criteria Through this process it secures mortgages to form mortgage-backed securities (MBS) The market for Fannie Maes MBS is extremely large and liquid FIRE PROTECTION DISTRICT - A designated area in the County where ad valorem revenues are collected from property owners and distributed to local cities and other agencies to finance fire suppression services to the area FISCAL YEAR - A twelve-month period of time to which the annual budget applies At the end of this time a governmental unit determines its financial position and the results of its operations The Pinellas County fiscal year begins on October 1 and ends on September 30 of the subsequent calendar year FORECLOSURE - A legal process by which a mortgagees right to redeem a mortgage is taken away usually because of failing to make payments FREDDIE MAC ndash Federal Home Loan Mortgage Corp (FHLMC) - A stockholder-owned government-sponsored enterprise (GSE) chartered by Congress in 1970 to keep money flowing to mortgage lenders in support of homeownership and rental housing for middle income Americans The FHLMC purchases guarantees and securitizes mortgages to form mortgage-backed securities The mortgage-backed securities that it issues tend to be very liquid and carry a credit rating close to that of US Treasuries
GLOSSARY
Pinellas County Budget Forecast FY2014-2023 G-4
FUND - An accounting entity with a complete set of self balancing accounts established to account for finances of a specific function or activity The resources and uses are segregated from other resources and uses for the purpose of carrying on specific activities or attaining specific objectives in accordance with special regulations restrictions or limitations FUND ACCOUNTING ndash Accounting method generally used by governmental agencies Usually consists of eleven classifications into which all individual funds can be categorized Governmental fund types include the general fund special revenue funds debt service funds capital projects funds and permanent funds Proprietary fund types include enterprise funds and internal service funds Fiduciary fund types include pension (and other employee benefit) trust funds investment trust funds private-purpose trust funds and agency funds FUNDING SOURCES - The type or origination of funds to finance ongoing or one-time expenditures Examples are ad valorem taxes user fees licenses permits and grants GENERAL FUND - This fund accounts for all financial transactions except those required to be accounted for in other funds The funds resources ad valorem taxes and other revenues provide services or benefits to all residents of Pinellas County GROSS DOMESTIC PRODUCT - Gross Domestic Product (GDP) is the generally accepted measure of the size of the national economy GDP measures the total market value of all final goods and services produced in a country in a given year GROSS METRO PRODUCT - Similar to Gross Domestic Product Gross Metropolitan Product (GMP) is defined as the market value of all final goods and services produced within a metropolitan area in a given period of time INDEPENDENT AGENCIES - A variety of agencies councils and other organizational entities responsible for administering public policy functions independently of the Constitutional Officers and County Administrator These entities are subject to Board of County Commissioner appropriation but operate under the purview of a legislativepolicy making body other than the Board of County Commissioners INFRASTRUCTURE - Infrastructure is a permanent installation-such as a building road or water transmission system - that provides public services INTERGOVERNMENTAL REVENUE - Revenue collected by one government and distributed (usually through some predetermined formula) to another level of government INTERNAL SERVICE FUND - A fund established to finance and account for services and commodities furnished by one department to other departments on a cost reimbursement basis MANDATE - A requirement imposed by a legal act of the federal state or local government
GLOSSARY
Pinellas County Budget Forecast FY2014-2023 G-5
METROPOLITAN STATISTICAL AREA (MSA) ndash MSA is a formal definition of a metropolitan area established by the United States Office of Management and Budget division MSArsquos are used to group counties and cities into specific geographic areas for the purposes of a population census and the compilation of related statistical data
MILLAGE RATE - A rate applied to a propertys taxable value to determine property tax due As used with ad valorem (property) taxes the rate expresses the dollars of tax per one thousand dollars of taxable value (ie a 5 mill tax on $1000 equals $500) MISSION STATEMENT - A broad statement of purpose which is derived from organization andor community values and goals MORTGAGE BACKED SECURITIES (MBS) - A type of security whose cash flows come from debt such as mortgages home-equity loans and subprime mortgages This is a type of security that typically focuses on residential instead of commercial debt MBS are sold and purchased in the open market Holders of a MBS receive interest and principal payments that come from the holders of the debt MUNICIPAL SERVICES TAXING UNIT (MSTU) - A special district authorized by the State Constitution Article VII and Florida Statutes 12501 The MSTU is the legal and financial mechanism for providing specific services andor improvements to a defined geographical area An MSTU may levy ad valorem taxes without a referendum An MSTU may also use assessments service charges or other revenue to provide its sources of income In Pinellas County the MSTU is all the unincorporated areas of the County NET EXPORTS - Exports minus imports OPERATING BUDGET - The operating budget includes appropriations for recurring and certain one-time expenditures that will be consumed in a fixed period of time to provide for day-to-day operations (eg salaries and related benefits operating supplies contractual and maintenance services professional services and software) PERSONAL SERVICES - Expenses for salaries wages and related employee benefits provided for all persons whether full-time part-time temporary or seasonal PREDATORY LENDING - The practice of unscrupulous lenders to enter into unsafe or unsound secured loans for inappropriate purposes PRO-RATE - A budgetary convention (used in Community Development and Fire Administration) that allows for centralized departmental services to be budgeted for in one cost center with the actual costs being allocated to the specific users of the service in other cost centers This is technically accomplished by appropriating a negative amount for the total central departmental service An allocation of the central services total appropriation is then budgeted in each of the user cost centers thereby reflecting the total cost to that particular function
RECESSION - A significant decline in activity across the economy lasting longer than a few months that is visible in industrial production employment real income and wholesale-retail trade The
GLOSSARY
Pinellas County Budget Forecast FY2014-2023 G-6
technical indicator of a recession is two consecutive quarters of negative economic growth as measured by a countrys gross domestic product (GDP)
RESERVES - Included in this category are funds required to meet both anticipated and unanticipated needs the balance of anticipated earmarked revenues not required for operation in the budget year those required to be set aside by bond covenants and accumulated funds set aside to finance capital construction on a pay-as-you-go basis REVENUE - The amount estimated to be received from taxes fees permits or other sources during a fiscal year REVISED BUDGET - The current year adopted budget adjusted to reflect all budget amendments approved by the Board of County Commissioners through January 31 ROLLED-BACK RATE - The millage rate which when applied to the total amount of taxable value of property (excluding new construction) produces the same amount of tax dollars as the previous year Calculation of the ldquorolled-back raterdquo is governed by Florida Statutes SAVE OUR HOMES AMENDMENT - The amendment was intended to protect homeowners from escalating property tax bills resulting from growth in market value a situation that was perceived to be forcing some people particularly residents on fixed incomes to sell their homes SHADOW BANKING SYSTEM - All financial intermediaries involved in facilitating the creation of credit across the global financial system but whose members are not subject to regulatory oversight Shadow Banking System also refers to unregulated activities by regulated institutions Examples of intermediaries not subject to regulation include hedge funds unlisted derivatives and other unlisted instruments SPECIAL ASSESSMENT FUND - A fund used to account for the financing of public improvements or services deemed to benefit the properties against which special assessments are levied SPECIAL REVENUE FUND - A fund used to account for the proceeds of specific revenue sources (other than expendable trusts or major capital projects) that are legally restricted to expenditures for specified purposes STATUTE - A written law enacted by a duly organized and constituted legislative body SUPPORT FUNDING - Support funding is provided by the Board of County Commissioners for those activities for which costs do not apply solely to any specific county departments function but are either applicable to the operation of county government as a whole or are provided for the public good TAXABLE VALUE - The assessed value of property minus any authorized exemptions (ie agricultural homestead exemption) This value is used to determine the amount of property (ad valorem) tax to be levied
GLOSSARY
Pinellas County Budget Forecast FY2014-2023 G-7
TAXES - Compulsory charges levied by a government for the purpose of financing services performed for the common benefit TOXIC ASSETS ndashThe term toxic asset was coined in the financial crisis of 200809 in regards to mortgage-backed securities collateralized debt obligations and credit default swaps all of which could not be sold after they exposed their holders to massive losses A toxic asset is one that becomes illiquid when its secondary market disappears Toxic assets cannot be sold as they are often guaranteed to lose money Many hedge funds banks and financial institutions invested heavily in mortgage-backed securities and collateralized debt obligations often using borrowed money and thus increasing their exposure This strategy proved profitable during the housing boom but resulted in enormous losses when house prices began to decline and mortgages began to default These ldquotoxic assetsrdquo were purchased by banks around the world contributing to a general sense of panic as mortgage defaults rose and liquidity fell TRANSFERS - Because of legal or other restrictions monies collected in one fund may need to be expended in other funds This is accomplished through Transfer-In (a source of funds) for the recipient fund and an equal Transfer-Out (a use of funds) for the donor fund When this movement occurs between different funds it is known as the Interfund Transfer UNINCORPORATED AREA - That portion of the County which is not within the boundaries of any municipality
GLOSSARY
Pinellas County Budget Forecast FY2014-2023 G-8
- FY14 Forecast Document
-
- Fund Forecasts Section FY14 Forecastpdf
-
- 01 General Fund FY14 Forecast
- 12_Tourist Dev Fund FY14 Forecast
- 13_Transportation Trust Fund FY14 Forecast
- 14_Capital Projects Fund FY14 Forecast
- 15 Emergency Medical Services Fund FY14 Forecast
- 16 Fire Districts Fund FY14 Forecast
- 17 Airport Fund FY14 Forecast
- 18_Water Funds FY14 Forecast
- 19_Sewer Funds FY14 Forecast
- 20_Solid Waste Funds FY14 Forecast
-
- Pro Formas Section FY14 Forecastpdf
-
- combined pro formas
-
- 01 General Fund FY14 pro forma
- 13 Transportation Trust Fund FY14 pro forma
- 04 Capital Projects Fund FY14 pro forma
- 05 EMS Fund FY14 pro forma
- 06 Fire Districts Fund FY14 pro forma
- 20 Solid Waste Funds FY14 pro forma
-
- 07 Airport Fund FY14 pro forma
- Water_Funds_FY14_pro forma
- Sewer_Funds_FY14_pro forma
- 02 TDC Fund FY14 pro forma
-

Pinellas County Budget Forecast FY2014-2023
INTRODUCTION
Pinellas County Budget Forecast FY2014-2023 A-1
The Introduction portion of the Budget Forecast FY2014-2023 discusses how the Forecast dovetails with the annual budget process how the Forecast is developed and how the Forecast can be used as a planning tool to enhance decision making It includes the following sections
bull Forecasting and the Annual Budget Process bull Developing the Forecast bull The Power of the Forecast bull Using This Document
Forecasting and the Annual Budget Process The first step in the annual budget process is to update the Forecast in order to develop the budget guidelines for the FY2014 budget process
Several of the Countyrsquos key funds are included in the Forecast Each fund is analyzed individually as part of the forecasting process
Development of Budget Guidelines The budget guidelines are developed by County Administration based on the results of the Forecast and policy direction from the Board of County Commissioners If the results of the Forecast for a given fund indicate a shortfall the budget guidelines would most likely include some kind of reduction target If a surplus is expected the guidelines would most likely include proposals for new or enhanced programs The budget guidelines are communicated to the Countys departments and agencies for use during their budget development At this time all instructions and resources for preparing budget requests are also distributed Updating the Forecast After the Forecast is prepared and presented to the Board of County Commissioners in the January timeframe the Forecast is continually updated throughout the rest of the fiscal year in parallel with the budget development process
Forecast (January)
Targets Budget Guidelines (February)
Budget Worksessions (AprilMayJune)
Proposed Budget (July)
1st amp 2nd Public Hearings
(AugustSeptember)
Adopted Budget (October)
Deptrsquol Budget Submissions
(March)
BCCrsquos Policy
Direction
INTRODUCTION
Pinellas County Budget Forecast FY2014-2023 A-2
Developing the Forecast The Forecast is developed by the Office of Management amp Budget (OMB) during November December and January for presentation to the Board of County Commissioners in January or February Developing Projections The Forecast is built upon an individual assessment of ten of the Countyrsquos major funds the General Fund Tourist Development Fund Transportation Trust Fund Capital Projects Fund Emergency Medical Services Fund Fire Districts Fund Airport Fund and Utilities Water Sewer and Solid Waste Funds The process for developing the Forecast includes updating the projections for FY2012 with actual revenue and expenditure information following the closeout of the fiscal year as of September 30 2012 At the same time the current FY2013 expenditures are projected on a preliminary basis by analyzing the actual expenditures to date and projecting the remaining months left in the fiscal year These expenditure projections are further refined later in the process as departments provide their expenditure projections The coming FY2014 budget year is forecasted based on the best information available at this point in time The Forecast has a ten year horizon to help determine the long-term financial position of the Countyrsquos funds as well as the impact of todayrsquos budget decisions The out-years through FY2023 are forecasted using various projection methods such as trend analysis linear regression and moving averages Forecast Assumptions The projections are modeled so that assumptions may vary each year to reflect future impacts of known variables and other anticipated events The model is also designed to allow the key assumptions to be adjusted so that sensitivity analysis can be performed to demonstrate the impact of changing key assumptions Additionally unknown risks that could potentially affect the ten-year forecast have been identified and discussed Forecast Results Major assumptions driving the revenue and expenditure projections are outlined to ensure a clear understanding for the basis of the results Shortfalls and surpluses are cumulative in the sense that any individual yearrsquos surplus or deficit flows into the next yearrsquos fund balance thus carrying a current yearrsquos balance forward In using the information contained in the projection it is important to understand that an indicated surplus or deficit reflects the modelrsquos assumptions and demonstrates a potential need for revenue increases expenditure reductions or a mix of both The Power of the Forecast Developing a multi-year forecast provides decision-makers with at least two key benefits (1) assessing the long-term financial sustain-ability of the Countyrsquos Funds and (2) under-standing the impact of todayrsquos decisions on the future
INTRODUCTION
Pinellas County Budget Forecast FY2014-2023 A-3
Long-Term Fiscal Sustainability One of the key purposes of developing a multi-year fund forecast is to identify potential actions necessary to balance revenues and expenditures over the long-term to ensure fiscal sustainability Forecasting over a ten-year horizon can serve as a window into the future to warn of potential future challenges For example if a major capital project (ie jail expansion) will have a significant impact on the operating budget that impact can be anticipated several years in advance and strategies can be developed and implemented to manage the negative impact to the budget Conversely if debt service on a bond is due to expire in the near future additional funds may become available to increase service levels to certain programs or other uses Enhanced Decision-Making Another benefit of long-term forecasting is the ability to assess the impact that decisions made in the present can have on future fiscal capabilities If the Board is considering funding a new or enhancing an existing program the Forecast can demonstrate the long-term impact to the budget Similarly if the Board is considering a new revenue source the Forecast can show how much revenue could be anticipated over the years Implementing cost-saving initiatives can also be forecasted and evaluated over time In summary the Forecast can be a powerful tool to understand how policy changes have real consequences that last far beyond a one-year budget solution Using This Document The Executive Summary section of this document summarizes the key elements of the forecast as a whole over the ten year time horizon The Economic Overview section features an overview of the national state and local economies This section provides important context for the various forecasts in the document The Key Assumptions section discusses the sources of key revenue and expenditure assumptions that were used to develop each of the fund forecasts This section is followed by the Fund Forecasts section which includes individual forecasts for ten of the Countyrsquos major funds These forecasts are designed to be succinct and help focus the reader on the important elements in the ten-year forecasts for each fund The assumptions pro-formas and a full-size forecast chart for each of the funds can be found in the Pro-Formas section A Glossary has also been included to facilitate understanding of key terms
INTRODUCTION
Pinellas County Budget Forecast FY2014-2023 A-4
EXECUTIVE SUMMARY
Pinellas County Budget Forecast FY2014-2023 B-1
Introduction This is the fourth year that the ten-year Budget Forecast has been formalized into a stand-alone document There are no changes to the format of the document from last year The first step in the annual budget process is to update the Budget Forecast and seek Board policy direction in order to develop the budget guidelines for the FY2014 budget process Developing a multi-year forecast provides decision-makers with at least two key benefits (1) assessing the long-term financial sustainability of the Countyrsquos funds and (2) understanding the impact of todayrsquos decisions on the future Economic Overview The national economy appears to be on track for a sustainable recovery and is anticipated to grow by 2 to 3 annually during the forecast period The Statersquos economy is showing signs of improvement in population growth tourism and the housing market As the national economy continues to improve Pinellas County is poised to recover as well The biggest industry in the County is tourism which has shown signs of a strong recovery For FY2014 the property tax base is expected to show positive growth following five years of decline Risks to the economic forecast include uncertainty on federal deficit reduction actions such as sequestration the ongoing European financial crisis and continued high levels of unemployment General Fund Forecast The forecast projects that beginning in FY2013 recurring expenditures exceed recurring revenues in the General Fund This is primarily due to the aftereffects of the Great Recession with continued slow recovery of the real estate market In addition caps on taxable value increases and total property tax revenue will inhibit future revenue growth Major expenditure drivers that exceed normal inflation include personnel costs such as health insurance and state-required pension contributions and mandated expenses such as Medicaid There is a long-term structural imbalance of approximately $15M increasing to $60M per year over the forecast period absent action to address this problem The balancing strategy for the General Fund is to cover the shortfall in FY2014 by utilizing the Service Level Stabilization Account (SLSA) in accordance with the plan approved by the Board of County Commissioners Expenditure reductions or revenue increases may be required in FY2014 or future years to address the structural imbalance The extent of the changes that are needed will be dependent on the pace of the economic recovery particularly the real estate market Tourist Development Council Fund Forecast The forecast for the Tourist Development Council Fund shows that the fund is balanced through the forecast period based on the assumption that the undesignated budget would be adjusted to reflect any revenue increases or decreases that may occur Beginning in FY2016 the fund is forecast to have additional capacity once the debt service on Tropicana Field and the Dunedin Spring Training Facility is paid off in 2015 The additional capacity in the undesignated budget could be dedicated to new capital outlay as with the Board approved Salvador Dali funding to new debt service or to supplement the promotional activities budget Transportation Trust Fund Forecast The forecast for the Transportation Trust Fund indicates that the fund is not in balance beginning in FY2013 resulting in a depletion of fund balance by FY2018 This imbalance primarily results from inflationary pressures on expenditures coupled with the projected reduction in gas tax collections
EXECUTIVE SUMMARY
Pinellas County Budget Forecast FY2014-2023 B-2
that are based upon the volume of fuel By FY2017 action will need to be taken to manage this future gap such as potential revenue transfers from the General Fund imposition of additional local option gas taxes or reductions in current service levels Another balancing option is the implementation of a storm water strategy that includes a new dedicated funding source If a dedicated funding source was available storm water costs currently funded in the Transportation Trust Fund could be freed up to create additional capacity Capital Projects Fund Forecast The forecast for the Capital Projects Fund shows that the fund is balanced over the forecast period Additional cash flow necessary in the first half of the ten-year period is being addressed through an interfund loan from the Solid Waste Renewal amp Replacement Fund A primary driver of cash flow is $81M of expenditures associated with the Public Safety Complex project that began in FY2012 The forecast includes repayment of the loan from FY2013 to FY2020 The forecast does not include projections of revenues or expenditures beyond the current Penny for Pinellas infrastructure sales surtax authorization which ends in FY2020 Emergency Medical Services Fund Forecast The forecast indicates that the fund is not balanced throughout the forecast period The structural imbalance is driven by slower growth in property tax revenue collections than cost increases in ambulance contractual expenditures and first responder funding requests Balance for FY2013 was achieved through a millage rate increase and use of reserves Without another millage rate increase andor expenditure savings reserves will be exhausted after FY2016 Future balancing strategies will be developed from information gathered in the EMS system operational study Fire Districts Fund Forecast The forecast for the Fire Districts Fund indicates that the fund is not balanced through the forecast period Five of the twelve fire districts increased millage rates in FY2013 Additional increases to millage rates for the individual fire districts will likely be necessary to cover expenditures over the forecast period Potential millage rate increases will need to take into account the individual millage caps in each fire district Airport Fund Forecast The forecast for the Airport Revenue and Operating Fund shows that the fund is balanced through the forecast period based on the assumptions that the capital projects budget would be adjusted to reflect the timing and amounts of any grants revenue and that the airportrsquos operating budget would be adjusted to match revenues Utilities Water Funds Forecast The Water System Funds are balanced through the forecast period based on projected rate increases The multi-year rate increases approved as part of the FY2012 budget process will provide sufficient revenues to maintain reserves and fund capital replacement needs through FY2015 The forecast revenues include an additional 2 per year annual increase in rates from FY2016-FY2023 as recommended in the FY2012 Utilities Rate Study performed by the Countyrsquos independent rate consultant A new comprehensive rate study will be performed in FY2014 to analyze the future rate structure In FY2013 FY2014 FY2017 and FY2018 recurring expenditures will exceed recurring revenues as fund balance is drawn down as major capital projects are completed From FY2015
EXECUTIVE SUMMARY
Pinellas County Budget Forecast FY2014-2023 B-3
through FY2023 excluding FY2017 and FY2018 the Water Funds are structurally balanced Utilities Sewer Funds Forecast The Sewer System Funds are balanced through the forecast period based on projected rate increases The multi-year rate increases approved as part of the FY2012 budget process will provide sufficient revenues to maintain reserves sustain the recommended debt service coverage ratio of 150x and fund capital replacement needs through FY2015 The forecast revenues include an additional 275 per year annual increase in rates from FY2016-FY2023 as recommended in the FY2012 Utilities Rate Study performed by the Countyrsquos independent rate consultant A new comprehensive rate study will be performed in FY2014 to analyze the future rate In FY2013 recurring expenditures will exceed recurring revenues as fund balance is drawn down as major capital projects are completed From FY2014 through FY2023 the Sewer Funds are structurally balanced as recurring expenditures are in line with recurring revenues Utilities Solid Waste Funds Forecast The Solid Waste Funds are balanced through the forecast period Forecasted revenues are sufficient to provide for the forecasted expenditures over the next ten years while still maintaining sufficient reserves The recurring revenues are sufficient to support recurring operations without any increases in tipping fees Reserves increase during the forecast period and reach the level of 84 of revenues in FY2023 The reserves are planned to fund considerable future capital replacement needs in the Solid Waste 25-year plan
EXECUTIVE SUMMARY
Pinellas County Budget Forecast FY2014-2023 B-4
ECONOMIC OVERVIEW
Pinellas County Budget Forecast FY2014-2023 C-1
The Economic Overview amp Budget Background portion of the Budget Forecast FY2014-2023 provides important context for the various forecasts in this document and includes the following sections
The National Economy o Background o National Outlook
The State Economy o Background o Florida Outlook
The Local Economy o Background o Local Outlook
The National Economy BACKGROUND ldquoThe Fiscal Cliffrdquo After briefly stepping off the ldquofiscal cliffrdquo as the nation welcomed 2013 the US Senate passed legislation the ldquoAmerican Taxpayer Relief Act of 2012rdquo in the early morning hours of January 1 that prevented income tax rates from increasing for individuals making up to $400000 extended benefits for the long-term unemployed and delayed the automatic spending cuts known as sequester for two months Many economists believed these spending cuts to be split evenly between defense ($55 billion) and non-defense ($55 billion) programs along with the ending of the Bush-era tax cuts would have stalled the current economic recovery and possibly send the economy back into recession While federal income tax rates were kept at 2012 levels for most people the temporary decrease for social security taxes also known as the payroll tax paid by wage earners ended on Dec 31 2012 For two years workers paid 42 instead of the previous 62 rate The reason for the rate cut was to stimulate the economy by allowing workers to bring home more money with each paycheck The financial impact for those earning $30000 per year will be about $50 less in take-home pay per month While the passage of the Act will temporarily avert and delay various elements of the fiscal cliff there will be another showdown in the coming months over automatic across-the-board spending cuts known as ldquosequestrationrdquo the debt ceiling tax and entitlement reform and a long-term solution to the nationrsquos debt and deficits Debt Ceiling Crisis Under the United States Constitution Congress has the authority to appropriate funds for numerous activities including national defense education and payment of the nationrsquos debt obligations When annual revenues fall short of the level required to pay for these activities the Government must then borrow money through the issuance of debt instruments such as short-term bills and notes and long-term bonds In an effort to provide flexibility while still maintaining some control Congress imposed the first debt ceiling in 1917 limiting the amount of debt the federal government can legally borrow to $115 billion Previously Congress had to sign off each time the Department of the Treasury issued
ECONOMIC OVERVIEW
Pinellas County Budget Forecast FY2014-2023 C-2
debt To meet the growing obligations of the federal government Congress must approve a new debt ceiling level before the accrued debt meets the imposed cap This has been done more than 70 times since 1962 with the current debt limit exceeding $16 trillion Increasing the debt ceiling does not authorize new spending but allows the government to raise the necessary funds to pay for previously incurred obligations
During the Spring and Summer of 2011 President Obama and leaders of both the House and Senate faced the need for another increase in the debt ceiling What is usually a routine vote turned into a policy showdown between congressional Republicans and Democrats over how to reduce federal spending and long-term debt After several months of negotiations the House and Senate passed the
Budget Control Act of 2011 which was signed into law by President Obama on August 2 2011 the day the Treasury Department said the United States would begin to default on their obligations without further action
The actions taken during the summer of 2011 did not raise the debt ceiling long-term According to Treasury Secretary Timothy Geithner the United States reached the statutory debt limit on Dec 31 2012 but due to the undertaking of ldquoextraordinary measuresrdquo at the end of 2012 the Treasury extended the deadline by about two months Without a deal to raise the debt ceiling the United States would begin to default on its obligations including payments to holders of US debt and social security recipients among others The United States government has never defaulted on its financial obligations and doing so would have a significant impact on the global economy
Budget Control Act of 2011 The Act established a procedure for increasing the debt limit by $400 billion initially and an additional $500 billion after September 2011 The Act also mandated at least $21 trillion in spending cuts with immediate caps on domestic and defense spending resulting in over $900 billion deficit reduction over ten years To determine the remaining $12 trillion in cuts the Congressional Joint Select Committee on Deficit Reduction (the ldquoSuper Committeerdquo) was established The Super Committee consisted of 12 members of Congress with six coming from the House and six from the Senate split evenly between Democrats and Republicans The committee was charged with issuing recommendations by November 23 2011 for at least $15 trillion in deficit reductions over ten years which could include both revenue increases and spending cuts Downgrade of Federal Government Credit Rating Despite averting default Standard amp Poorrsquos (SampP) downgraded the governmentrsquos credit rating one notch from AAA (highest) to AA+ Citing ldquopolitical brinksmanshiprdquo SampP determined the US governmentrsquos ability to manage its financial house is ldquoless stable less effective and less predictablerdquo and the Budget Control Act of 2011 ldquofell shortrdquo of what was needed to bring the nationrsquos debt under control over time SampP also did not feel the political leaders would be able to achieve the mandated savings in the future On January 15 2013 Fitch Ratings warned of a possible downgrade of US debt without an ldquoagreed and credible medium-term deficit reduction plan that would be consistent with sustaining the economic recovery and restoring confidence in the long-run sustainability of US public financerdquo
ECONOMIC OVERVIEW
Pinellas County Budget Forecast FY2014-2023 C-3
Without a long-term solution to the budget deficit investors will begin to lose confidence in US debt driving interest rates up leading to increased borrowing cost and additional budget pressures As the months pass and pressure mounts all eyes will be on Washington DC and the work of our elected officials Failure of the Super Committee The most visible result of the previous debt ceiling crisis was the creation of the Congressional Super Committee After several months of hard work and intense deliberations the Super Committee was unable to reach agreement The failure of the Super Committee to forge a deficit reduction deal triggers $12 trillion in automatic across-the-board spending cuts starting in 2013 evenly divided between military and non-military spending While most government programs are subject to the automatic cuts programs that assist low-income Americans will be exempt including Social Security Medicaid veteransrsquo benefits and food stamps As 2012 ended and sequestration was looming the US House of Representatives and United States Senate passed legislation delaying the automatic cuts for two months NATIONAL OUTLOOK Gross Domestic Product (GDP) is the generally accepted measure of the size of the national economy GDP measures the total market value of all final goods and services produced in a country in a given year The major components of national GDP (Third Quarter 2012) are shown in the pie chart below
Components of US GDP ndash 3rd Qtr 2012
Consumer Spending
705
Investments132
Net Exports-33
Government Spending
196
Source US Bureau of Economic Analysis
Consumer Spending At 705 consumer spending easily represents the largest portion of GDP This expectation is based on continued high levels of unemployment modest growth in real disposable (after-tax) personal income financial market volatility government debt ceiling and debt downgrade an increase in
ECONOMIC OVERVIEW
Pinellas County Budget Forecast FY2014-2023 C-4
household savings a restrictive supply of credit increases in food and energy prices and continued gridlock in Washington DC The December 2012 unemployment rate was 78 the lowest level since January 2009 Job growth which showed signs of strength in the first quarter of 2012 suffered a slowdown in the second quarter before regaining energy averaging 160000 jobs per month over the last half of the year Through December 2012 the economy has added an average of 153000 jobs per month
Seasonally Adjusted Unemployment Rate 2007-2012
44
100
78
00
20
40
60
80
100
120
Percent
US Unemployment Rate 2007 - 2012
Source US Bureau of Labor StatisticsFRED
While unemployment has shown improvement since the recession ended in 2009 the number of long-term unemployed people who have been looking for employment for more than 26 consecutive weeks has been much higher than the period following the 2001 recession As the chart below shows the pre-2007 recession level of long-term unemployed never returned to the pre-2001 levels and currently is above 40 of the total unemployed One of the effects of long-term unemployment has been a depletion of savings and the draw-down of retirement accounts to pay monthly bills like the mortgage insurance and food The tight financial situation many families find themselves in including working families means there are fewer non-essential purchases being made
ECONOMIC OVERVIEW
Pinellas County Budget Forecast FY2014-2023 C-5
Source Congressional Budget Office An Update to the Budget and Economic Outlook Fiscal Years 2012 to 2022 August 2012
Year Unemployment
2012 82 (78 YTD) 2013 88 2014 87 2015 77 2016 67 2017 59
2018 55
2019 55
2020 54
2021 54
2022 53 Source Congressional Budget Office An Update to the Budget and Economic Outlook Fiscal Years 2012 to 2022
August 2012
According to the US Department of Commerce retail sales for 2012 increased by 49 from 2011 This rise was in part due to increases in automobiles (86) furniture (77) and building materials (54) Although these increases were driven by discounts and promotions these figures do seem to indicate a positive trend in consumer spending NovemberDecember retail sales were up 37 from the same period in 2011
Category December
2012 December
2011
Growth Retail amp Food Services $4687B $4575B 24 Retail $4230B $4145B 21 Automobiles $749B $717B 45
Gas Stations $422B $421B 02
Clothing $317B $309B 26 Source US Department of Commerce January 15 2013
ECONOMIC OVERVIEW
Pinellas County Budget Forecast FY2014-2023 C-6
Inflation also plays a role impacting the outlook for consumer spending The Consumer Price Index the generally accepted measure of overall inflation rose by 17 in 2012 lower than the 35 rise for all of 2011 with the second half of 2012 rising by 23 Short-term projections for CPI range from 18 to 22 through 2017 In addition the Federal Reserve has continued to maintain record low levels on short-term interest rates and is expected to keep them close to zero at least through 2015 which is about two and a half years longer than originally indicated Government Spending The second largest component of GDP is Government Spending at 196 With looming spending cuts and economic pressures the government sector will likely remain a drag on economic growth The state and local government sector represents approximately 60 of total government spending State government budgets have been challenged over the last several years For FY13 sixteen states and the District of Columbia projected a combined gap of $162 billion down from the high of $1741 billion in FY10 Although some states are forecasting budget gaps over the next two years the number of states and the size of the gaps have continued to decline Local government budgets are very dependent on the housing market from tax revenue from home sales to property taxes based on taxable values As the housing market boomed revenues from these sources rose at exceptional rates When the bubble burst so did the revenues While the housing market in general has seemingly hit bottom property values are still below pre-boom levels in many areas as excess inventory and foreclosures continue to suppress housing prices The National Association of Realtors estimates the inventory of existing homes at approximately 286 million units and estimates the shadow inventory made up of homes in the foreclosure process at an additional 20 million units Areas where the real estate market is showing improvement includes the Northeast the Washington DC region Texas and California A sustainable recovery will not truly occur until the backlog of distressed properties is cleared Until real estate markets recover local government spending will likely lag Overall the state and local government sector is anticipated to decrease slightly or be flat over the next few years The federal government sector represents 40 of total government spending Federal spending is anticipated to decrease over the next few years as the mandated spending reductions take place from the Budget Control Act passed in 2011 The Act specified automatic procedures for reducing spending by as much as $12 trillion if legislation was not approved for reducing spending by that amount These cuts would be spread out over the ten years and contribute to more restrained federal spending than in years past and detract from economic growth However the American Taxpayer Relief Act of 2012 which was signed into law by President Obama on January 2 2013 delayed the implementation of the sequestration from January 1 2013 to March 1 2013 This delay will allow the new Congress additional time to find targeted savings without across the board cuts Despite the delay Federal government spending is anticipated to decrease by 2-3 over the next four years as concerns over the four straight years of $1 billion Federal budget deficit grips Washington DC Investment The third largest component of GDP is Investment at 132 This component is made up of Non-Residential Fixed Investment and Residential Fixed Investment
ECONOMIC OVERVIEW
Pinellas County Budget Forecast FY2014-2023 C-7
According to the Congressional Budget Office business and residential investment are growing strongly Business investment in nonresidential structures equipment and software grew at an annual rate of 64 in the first half of 2012 with the second quarter growing by 102 from the same period in 2011 Inventory investments grew in the first half of 2012 from the second half of 2011 However with inventory levels stabilizing this component is unlikely to grow as businesses reduce their stock levels on-hand as the economic recovery continues Net Exports The definition of net exports is exports minus imports Current net exports make up -33 of GDP A key factor driving net exports is the value of the dollar The value of the dollar has gradually weakened and depreciated through much of 2011 due to the Federal Reserversquos policy of quantitative easing which helped decrease the dollar exchange rate against other currencies A depreciated dollar helps increase exports by making the costs of US goods more competitive in the global marketplace and reduces the negative net exports calculation The weakening of the dollar was interrupted by the European debt crisis but is anticipated to continue for several years The pace of export growth is expected to decrease slightly as a result of the anticipated modest recession in Europe However exports to emerging markets should continue to help domestic global producers Import growth will likely be constrained by the slow pace of consumer spending Summary of National Outlook Most economists agree that the national economy hit bottom in 2009 and that we are on track for a sustainable recovery Normally economic recoveries are marked by real economic growth of around 5 in the first year of recovery due to pent up demand It is anticipated that this recovery will be in the 2 to 3 range due to lingering high levels of unemployment the bottoming out of the housing market the continued decline of the commercial real estate market decreases in both federal and state amp local government spending and uneasiness about Europe
Gross Domestic Product (GDP) GDP
Growth 2006 27
2007 19
2008 -03 2009 -35 2010 30 2011 17 2012 (Est) 22 2013 (Est) 20 2014 (Est) 27
2015 (Est) 29 Source Federal Reserve Bank of Philadelphia
Survey of Professional Forecasters November 9 2012
While the national economy appears to have stabilized the lack of job-growth and continued high unemployment in addition to the on-going financial crisis across much of Europe still poses a significant threat to the recovery both nationally and globally
ECONOMIC OVERVIEW
Pinellas County Budget Forecast FY2014-2023 C-8
The State Economy BACKGROUND The background information below for the Statersquos economy is derived primarily from the January 10 2013 report Florida An Economic Overview by The Florida Legislature Office of Economic and Demographic Research Until a few years ago Florida was one of the nationrsquos fastest growing states With the end of the housing boom and the beginning of the real estate market correction the state slipped to virtually no growth on a year-over-year basis While Florida was not the only state to experience a significant deceleration in economic growth (California Nevada and Arizona showed similar trends) it was one of the first and hardest hit State Gross Domestic Product Gross Domestic Product (GDP) the market value of all final goods and services produced or exchanged within a state is one of the key economic measures for the comparison of states In 2006 Florida returned to the national growth level before dropping below it in 2007 (48 US versus 28 FL) 2008 (33 US versus 03 FL) and 2009 (-13 US versus -17 FL) Floridarsquos total GDP in 2007 was $760 billion but dropped to about $726 billion in 2009 before climbing back up to $754 billion in 2011 (the last full year data is available)
Source Federal Reserve Bank of St Louis
After adjusting for inflation Floridarsquos real growth in GDP ranked it tied for 39th in the nation in 2011 with a gain of 25 By way of comparison Florida was ranked 50th in 2008 and 4th in the nation in 2005 For Arizona Nevada and Florida losses in the construction sector accounted for a significant
ECONOMIC OVERVIEW
Pinellas County Budget Forecast FY2014-2023 C-9
portion of the decline as it subtracted more than one percentage point from real GDP growth in each of these states Personal Income Growth Other factors are frequently used to gauge the health of an individual state The first of these measures is personal income growth primarily related to changes in salaries and wages According to The Florida Legislature Office of Economic and Demographic Research Floridarsquos per capita personal income grew 04 during the 3rd quarter of 2012 compared to 05 nationally ranking the state 35th in growth Job Growth and Unemployment In the years leading up to the recent recession unemployment in Florida started increasing from the very low rates of 33 in early 2006 to 45 in November 2007 As the economic slow-down turned into a recession in December 2007 Floridarsquos unemployment rate rose from 47 to a high of 114 in February 2010 eight months after the official end of the recession Since that time the rate has fallen to 80 in December 2012 This rate places Florida at 41st in the country At 80 approximately 749000 residents are unemployed Since the Statersquos peak in employment more than 672000 jobs have been lost To recover from this loss and to accommodate for the additions made to the work force more than 1000000 jobs will need to be created to return Florida to its peak level
Source US Bureau of Labor Statistics Federal Reserve Bank of St Louis
ECONOMIC OVERVIEW
Pinellas County Budget Forecast FY2014-2023 C-10
Housing Market Vigorous home price appreciation that outstripped gains in income and the use of speculative financing arrangements made Florida particularly vulnerable to the decelerating housing market and interest rate risks In 2006 almost 47 of all mortgages in the state were considered ldquoinnovativerdquo (interest only and pay option ARM) With the ease of gaining access to credit long-term homeownership rates were inflated to historic levels ndash moving Florida from a long-term average of 663 to a high of over 72 Essentially easy cheap and innovative credit arrangements enabled people to buy homes that previously would have been denied At first the end of the housing boom brought lower activity and employment in the construction and financial fields as well as spillover consumption effects in closely related industries landscaping and sales of appliances carpeting and other durable goods used to equip houses This began in the summer of 2005 when the volume of existing home sales started to decline in response to extraordinarily high prices and increasing mortgage rates Closely linked to the housing industry Floridarsquos nonagricultural employment annual growth rate began to retreat from its peak in the fall of 2005 By the summer of 2006 existing home prices began to fall and owners started to experience negative wealth effects from the deceleration and losses in property value Mortgage delinquencies and foreclosures became commonplace as property prices further tanked in 2007 and the unemployment rate began to climb as part of a slow slide into a national recession that began in December 2007 By the fall of 2008 Floridarsquos homegrown problems with the housing market were giving way to several worldwide phenomena a national recession that was spreading globally and a credit crisis that was threatening to bring down the worldrsquos largest financial institutions As the sub-prime mortgage difficulties spread to the larger financial market it became clear that any past projections of a relatively quick adjustment in the housing market were overly optimistic Forecasts were dampened through the end of the fiscal year and then again as the excess inventory of unsold homes was further swollen by foreclosures and slowing population growth arising from the national economic contraction While small improvements were seen in late 2009 and early 2010 on the state and national fronts they seemed to sputter as the recovery struggled to take hold Largely these changes were related to Floridarsquos ongoing housing market woes and the gloomy national and global outlooks that plagued most of the year The growing inventory of unsold houses coupled with the sluggish credit crisis dampened residential construction activity throughout the entire year During FY2010 there were 36000 private housing starts for the year statewide but this was just 133 of the FY2006 level Single family starts managed to post a positive gain but multi-family starts worsened the percentage drop they made in FY2009 over FY2008 In yet another manifestation of the significant housing market adjustment still facing Florida existing single family home sales ended FY2010 nearly 30 below the peak volume of the 2005 banner year During 2011 the volume of sales edged up slightly to a level about 25 lower than the peak volume year
ECONOMIC OVERVIEW
Pinellas County Budget Forecast FY2014-2023 C-11
During 2012 the increase in volume continued but still remains at 82 of the sales level during the high-water year of 2005 Median sales prices however have not seen the same increase as volume As the chart below shows prices began to fall very quickly beginning in the last quarter of 2007 before reaching a bottom range between $130000 and $150000 in early 2009 From peak to trough prices fell 418
Source Florida Legislature Office of Economic and Demographic Research Jan 10 2013
FLORIDA OUTLOOK The background information below for the Statersquos economy is derived primarily from the January 10 2013 report Florida An Economic Overview by The Florida Legislature Office of Economic and Demographic Research
With the national recession almost four years behind us Floridarsquos economy is starting to show sustained improvements Growth rates are beginning to return to levels seen during lsquonormalrsquo periods but it will still take several years to make-up for the years of negative growth
ECONOMIC OVERVIEW
Pinellas County Budget Forecast FY2014-2023 C-12
Source Florida Legislature Office of Economic and Demographic Research
Major Economic Drivers
In addition to global and national economic conditions there are several major drivers that are key to the performance of Floridarsquos economy Those drivers include population growth tourism employment growth and new construction
Population Growth
Population growth continues to be the statersquos primary engine of economic growth fueling both employment and income growth and impacting the amount of new construction activity The national economic contraction significantly slowed Floridarsquos population gains but this was not unexpected Over 80 of the statersquos population growth comes from positive net migration primarily from people moving into Florida from other states From past studies it is clear that people are reluctant to move during recessions ndash first because of the inability to sell their homes and second because of the difficulty in finding new jobs Floridarsquos strong international migration which had been a bulwark was also affected by the global economic slowing Floridarsquos long-term population growth rate between 1970 and 1995 was over 3 The annual growth rate hovered between 20 and 26 from the mid 1990rsquos to 2006 and then began slowing to less than 05 in 2009 and 06 in 2010
ECONOMIC OVERVIEW
Pinellas County Budget Forecast FY2014-2023 C-13
In the near term population growth is forecast to remain relatively flat averaging 12 between 2012 and 2015 However over the forecast horizon population growth will improve ndash averaging 14 between 2015 and 2020 with 85 of the growth coming from net migration While this is still significant growth before the recession Florida was adding a city roughly the size of Miami every year in the future it will be a city more like St Petersburg Despite this lower growth rate Florida is still on track to break the 20 million mark in 2016 becoming the third most populous state sometime before then surpassing New York
Source Florida Legislature Office of Economic and Demographic Research Jan 10 2013
By 2030 Floridarsquos population is expected to grow by almost 5 million people The majority of this gain (559) will come from those 60 and older with those under 18 accounting for 149 of this gain Tourism The tourism industry is another key driver of Florida employment growth and economic strength Like other sectors of the economy tourism was hit hard by the recession as job losses and uncertainty coupled with other stresses caused potential visitors to be more conservative in their spending and cut back on their travel plans The industry also had to deal with the negative publicity that resulted from the 2010 Deepwater Horizon oil spill in the Gulf of Mexico (although actual beach damage in Florida was limited to the Panhandle area) During 2011 the impact of these factors declined Tourism growth now appears to be on a steady upward trajectory
ECONOMIC OVERVIEW
Pinellas County Budget Forecast FY2014-2023 C-14
Employment Growth and the Labor Market Floridarsquos current unemployment numbers represent a loss of more than 672000 jobs from the peak with the statersquos negative over-the-year growth rate actually beginning in March 2007 With a projection of about 2500 new working-age people being added to the Florida market each month it will take the creation of about 1000000 jobs to return to the peak level of employment The job market showed strength throughout the year with 89700 jobs being added in November This growth was lead by the leisure and hospitality (+31200) business and professional services (+27500) trade (+22000) and education and healthcare (+17000) industries which performed strongly Negative job growth in government (-7800) and construction (-4400) continue to slow the growth in Florida
Source Fishkind amp Associates Econocast Weekly Jan 07 2013
For wages and salaries Floridarsquos long-term growth prospects essentially match the national forecast However Floridarsquos average annual wages largely fall below the nation as a whole Projections for unemployment show a gradual reduction over the next eight or nine years for Florida dropping to 55 by 2020 from the current level of 80 New Construction and Housing Floridarsquos housing markets are generally improving Sales volume of existing homes and building permits are both back in positive territory showing year-over-year growth The number of documentary stamp tax collections reflects this trend
ECONOMIC OVERVIEW
Pinellas County Budget Forecast FY2014-2023 C-15
Source Florida Legislature Office of Economic and Demographic Research Dec 5 2012
Recent building permit activity has come in better than expected Building permit activity is growing with a 262 increase year-over-year for the first nine month of 2012 Foreclosures have further swelled Floridarsquos unsold inventory of homes Originally related to mortgage interest rate resets and changes in financing terms that placed owners in default activity was also affected by the continuing high level of unemployment In CY2012 Florida had the highest foreclosure rate in the country displacing Nevada at the top of this dubious list At 858 days Florida has the third longest foreclosure process in the United States These two factors along with the struggling economy suggest that the foreclosure problem will remain with Florida for several more years as the existing inventory and inventory soon to be added slowly makes its way through the process
ECONOMIC OVERVIEW
Pinellas County Budget Forecast FY2014-2023 C-16
Foreclosure Activity December 2012
Top 10 Florida Counties
Source RealtyTraccom
A related problem is the ldquoshadow inventoryrdquo of homes that are not on the market but are at risk of foreclosure About 40 of all residential loans in Florida are for homes that are ldquounderwaterrdquo that is have mortgage debt higher than the value of the house However rising home prices in 2012 helped more than 700000 previously underwater homeowners return to a position of equity in their homes There is also a significant percentage of homeowners who are not current with their mortgage payments
Delinquent
Foreclosed Non-
Current National 70 36 106 Florida 78 121 198
Source Florida Legislature Office of Economic and Demographic Research Jan 10 2013
The credit market impacts both employment growth and new construction Although interest rates continue to remain at record low levels credit conditions for those seeking to buy a home or homeowners seeking to refinance remain tight
ECONOMIC OVERVIEW
Pinellas County Budget Forecast FY2014-2023 C-17
The end result of these factors is that in the residential property market sales volume is expected to increase while prices appear to have begun the recovery from their historic lows
State Budget The State of Floridarsquos budget is highly dependent on sales tax revenue accounting for more than 70 of revenues In times of economic distress consumers tend to cut back on discretionary spending which in a state dependent on sales tax will have an immediate effect on revenue Unlike many other states Florida does not have a state personal income tax which is a more stable source of revenue because wages tend to fall at a slower rate than consumption As a result the recession caused major State budget shortfalls and the effects are still being felt in this yearrsquos budget In recent years the State made heavy use of one-time fixes such as diverting revenue from trust funds ($41 billion over 10 years) and using Federal stimulus funds to avoid larger cuts in education and other programs On the expenditure side the single largest driver in State obligations is Medicaid which is projected to increase at an annual rate of 79 over the next 10 years This does not include the potential impact of Federal Health Care Reform As the 2013 Legislature prepares to return to Tallahassee the projected State FY2014 budget is projecting a $480 million surplus the first surplus in six years Summary of Florida Outlook Floridarsquos economy appears to have turned around The major drivers of economic growth are showing signs of improvement The statersquos primary source of economic growth population growth has improved from the very low rates of 2009 (lt05) and 2010 (06) From 2012 to 2015 population growth is expected to average 12 then increase to 14 through 2020 Tourism which was hit hard by both the global recession and the 2010 BP Deep Horizon oil spill has improved greatly The jobs associated with tourism especially in the leisure and hospitality industry grew more than any other industry in 2012 as visitors returned to the beaches and theme parks around the state As the recovery continues the long-range unemployment rate is projected to fall steadily from the current level of 80 to 55 by 2020 Floridarsquos housing market continues to show signs of improvement Sales volume of existing homes has increased most of 2012 However foreclosures continue to depress sales prices around the state In 2012 Florida had the highest foreclosure rate in the country with 198 of all residential mortgages non-current on their mortgage payments The subsequent turnaround in Florida housing will be led by
Low home prices that begin to attract buyers and clear the inventory Long-run sustainable demand caused by continued population growth and household
formation Floridarsquos unique demographics and the aging of the baby-boom generation (2011 marked the
first wave of boomers hitting retirement age)
ECONOMIC OVERVIEW
Pinellas County Budget Forecast FY2014-2023 C-18
Looking ahead the pace of the economic recovery depends heavily on how quickly the job market recovers from the Great Recession the capacity for personal income growth to move ahead of inflation and a substantial reduction in the supply of unsold residential properties
The Local Economy BACKGROUND The context of this section is from the perspective of background impacting the Pinellas County budget Property Value Increases From FY2002 to FY2007 there were unusually large increases in property values in Pinellas County and throughout the state Across Florida public budget hearings brought out many citizens who were upset about their proposed property taxes as presented on their ldquoTruth in Millagerdquo (TRIM) notices Most of those who expressed their frustration were persons who owned property that was not homesteaded and therefore not protected by the ldquoSave Our Homesrdquo taxable value increase cap such as commercial and rental business owners and owners of second homes In response to the publicrsquos concerns the Board of County Commissioners reduced the FY2007 county-wide millage rate by 0701 mills (over 10) the first millage rate reduction since the 1997 budget year Impact of Save Our Homes Amendment Not all local governments were as responsive to the situation as Pinellas and this dramatic growth in taxable values resulted in a surge in property tax revenues that became the focus of legislative concern In reality the primary problem was the systematic inequity resulting from the ldquoSave Our Homesrdquo amendment to the Florida Constitution which has capped the growth in taxable values for homesteaded properties (permanent residences) since 1996 The amendment was intended to protect homeowners from escalating property tax bills resulting from growth in market value a situation that was perceived to be forcing some people particularly residents on fixed incomes to sell their homes While this objective was achieved there were dramatic and in many cases unforeseen consequences as a result of Save Our Homes Because of the large amount of market or ldquojustrdquo value not taxed due to the Save Our Homes exemption a disproportionate share of any increase in tax revenue had been placed on properties that were not established permanent residences such as businesses rental properties and newly purchased homes The increases in values for fiscal years 2002 through 2007 notwithstanding the historical trend over the previous sixteen years in Pinellas had been an average annual increase of about 5 in values (including new construction) Most observers believed that the market would correct itself and return to more normal patterns To some extent the value growth part of the problem could be expected to correct itself over time Legislative Property Tax Roll-Backs The Florida Legislature perceived property tax reform as one of the two most critical issues (along with property insurance reform) that needed to be addressed in 2007 In June a three-day Special Session of the Legislature produced a mandate that was unlike anything ever seen before in its forced reductions in property taxing capability of local government in Florida The Legislature did not make
ECONOMIC OVERVIEW
Pinellas County Budget Forecast FY2014-2023 C-19
similar reductions to FY2008 school property taxes which they control even though these taxes make up about 40 of most property ownersrsquo tax bills Unfortunately this solution failed to address the real inequities that were the focus of public discontent and instead has the potential for even greater disparities in the future The Legislature adopted two key items impacting property tax reform The first approach involved statutory changes requiring all counties cities and special districts to roll back property tax collections in FY2008 to a point below the FY2007 collections adjusted for new construction (also known as the ldquorolled-back raterdquo) This target ranged from 3 to 9 below the rolled-back rate depending on the Statersquos calculation of how much the taxing authorityrsquos property tax revenue increased from FY2002 to FY2007 Independent Districts and Dependent Districts many of which have the primary purpose of providing Fire or Emergency Medical Services were all targeted at 3 below the rolled-back rate These calculations and the resulting reduction categories did not adequately acknowledge the lower tax profile of Pinellas Pinellas County was required to cut 7 below rolled-back (the second-most-severe level) even though
o The Countyrsquos FY2002ndashFY2007 percentage increase in per capita property tax was below the statersquos average increase for counties
o The Countyrsquos FY2007 per capita property tax was less than Orange Hillsborough (and other counties) that were in the 3 or 5 cutback categories
o A city with the same percentage increase was required to cut only 5 o The Statersquos numbers did not reflect seasonal or tourist population impacts and o The Statersquos numbers did not take into account the additional cost pressures for an urban
coastal county (such as property insurance) Property Tax Revenue Cap The other item adopted by the Legislature with important long-term implications was the implementation of a property tax revenue cap Effective FY2009 property tax revenue increases are limited to new construction plus the statewide percentage increase in per capita personal income This percentage has averaged about 38 from 1991-2008 From 2009-2012 growth in personal income was below average or only 1-3 Even this minor increase is neutralized by the historic decreases in property valuation The cap requires that the maximum millage rate that can be approved by a simple majority vote of the Board of County Commissioners equals the prior yearrsquos maximum rolled-back rate adjusted for the change in per capita Florida personal income A two-thirds vote of the Board may approve up to 110 of this maximum Any higher millage rate requires a unanimous vote of the Board or a referendum Based on information from the Florida Department of Revenue the County has some flexibility for increases above the property tax revenue cap in the short term because the Board has not levied the maximum millage since the baseline was set in FY2008 The long-term impact of this cap is that property tax revenue will be constrained even if taxable values increase beyond the average increase in personal income To date the County has not seen an impact from this cap because values have actually declined since it was passed However due to the
ECONOMIC OVERVIEW
Pinellas County Budget Forecast FY2014-2023 C-20
bursting of the housing bubble and the negative impact of foreclosures the baseline of values has been set artificially low which will keep property tax revenues constrained by a higher than anticipated margin Impact of Amendment One The FY2009 budget situation was unique in several ways This was largely due to the passage of Amendment One placed on the ballot by the Legislature and approved by the voters of Florida on January 29 2008 which reduced property tax revenues Also the economic downturn which began in FY2008 intensified which further reduced property taxes and also reduced revenues from other important sources Amendment One made the following changes which reduced taxable property values and revenues available to local government
o ldquoDoubledrdquo the existing $25000 homestead exemption (except for school taxes)
o Allows for up to $500000 of the Save Our Homes exemption to be applied to another property (portability)
o Imposed a 10 cap on assessments for non-homestead property (school taxes exempt)
o Instituted a new tangible personal property exemption of $25000 Impact of the Recession At the same time that the impact of Amendment One was being felt the real estate ldquobubblerdquo burst and market values for property declined dramatically The result was an unprecedented decrease in the property tax base Since World War II the average annual increase in taxable value is about 5 Since 2009 the County-wide taxable value has decreased 84 114 97 and 45 with another 18 decrease in FY2013 Normally some of this revenue decrease would be offset by the rest of the revenue mix such as sales taxes state revenue sharing and other miscellaneous revenues Unfortunately the general economy deteriorated to the point that virtually the entire mix of non-property tax revenues also declined substantially The end result of all of these changes was a large negative impact to the Countyrsquos revenues which have resulted in significant reductions across all of the Countyrsquos funds Impacts to the Pinellas County Budget Since the recession began the County has been faced with resizing the organization to fit the new fiscal reality stemming from legislative action the bursting of the housing bubble and the recession Since FY2007 total positions have decreased 1618 or 25 Within that number the BCC departments have decreased 985 positions or 35 which yields the lowest position count since FY1985 The Constitutionals and Independents have decreased 633 positions or 17 which yields the lowest position count since FY1995 The total position count is currently the lowest since FY1989 In the General Fund the Countyrsquos largest fund that funds most of its operations property taxes (two-thirds of total revenues) have decreased 35 or $151 million from FY2007 to FY2013
ECONOMIC OVERVIEW
Pinellas County Budget Forecast FY2014-2023 C-21
LOCAL OUTLOOK Pinellas County is the 6th largest county in population (916542) and is the most densely populated in the State Pinellas County is mostly built out and expects limited population growth in the future The County is the most popular tourist destination on the Gulf of Mexico drawing 13 million tourists annually Pinellas County is part of the Tampa-St Petersburg-Clearwater Metropolitan Statistical Area (MSA) comprised of Hernando Hillsborough Pasco and Pinellas counties Below is a chart of Employment by Industry for Pinellas County
Source Florida Labor Market Statistics
Over the last five years several of these areas have seen substantial decreases Natural resources mining and construction decreased 46 Manufacturing decreased 26 Information decreased 22 Financial Activities decreased 14 Trade Transportation amp Utilities decreased 11 Professional amp Business Services decreased 9 Other Services decreased 7 and Leisure and Hospitality decreased 4 The only areas that have shown growth since 2006 is Education amp Health Services which increased 11 and Total Government which increased 4 From Wells Fargorsquos May 2012 Florida Economic Outlook Tamparsquos labor market continues to post strong gains The professional and business services sector remains the top performing sector accounting for more than 50 percent of the jobs added since the Bay arearsquos labor market bottomed despite representing only 17 percent of Tamparsquos overall employment base Part of that improvement reflects strong growth at employment staffing companies The recovery has broadened across many other sectors more recently including leisure and hospitality financial services and trade transportation and utilities Construction remains an obvious impediment however as payrolls continue to contract and are now down nearly 53 percent from their peak in April 2006 Unemployment As with the State of Florida Pinellas Countyrsquos unemployment rate reached historically low levels in early 2006 In April 2006 Pinellas County recorded an unemployment rate of 30 As the chart below shows the Countyrsquos unemployment rate rose to 47 by the time the national recession began
Professional amp Business Services
169
Total Government
138
Leisure amp Hospitality
114
Education amp Health
Services 161
Information 23
Manufacturing 52
Other Services 38
Trade Transporation
amp Utilities 185
Financial Activities 79
Natural Resources Mining amp
Construction 42
ECONOMIC OVERVIEW
Pinellas County Budget Forecast FY2014-2023 C-22
in December 2007 reaching a high of 123 in January 2010 seven month after the official end of the recession Since then the Countyrsquos unemployment rate has fallen to 79 (November 2012)
Source Federal Reserve Bank of St Louis
Tourism Tourism is a key economic driver of the economy in Pinellas County and contributes direct and indirect visitor expenditures of $63 billion annually In FY2012 the County reported more than 5 million overnight visitors and collected $287 million in tourist development tax revenue also known as the lsquobed taxrsquo A positive sign of a recovering economy FY2013 collections are 103 higher through the first two months of the fiscal year than the same period in FY2012 which was a record year for Pinellas County Real Estate The real estate market in Pinellas County is struggling to recover from the bursting of the housing bubble Pinellas like the rest of Florida experienced a dramatic rise in housing values for several years during the housing boom Starting in FY2008 property assessments fell for five straight years (-84 -114 -97 -45 and -18) Residential Real Estate Over the last year home sales in the Tampa Bay area have risen However almost half of all the sales are distressed sales involving foreclosed properties Foreclosures continue to hold down the residential real estate market In 2007 there was an average of 628 foreclosure activities per month As unemployment increased and the economy slipped into recession foreclosure activity almost doubled in FY2008 to 1110 per month Activity remained extremely high through FY2009 and FY2010 before dramatically dropping off to 522 per month in FY2011 This drop-off coincided with the federal investigations of lsquorobo-signingrsquo of foreclosure documents As part of a settlement with federal regulators banks and others involved in the foreclosure process agreed to improve their procedures Since the settlement was signed in April 2011 foreclosure activity has begun to increase averaging 822 per month in FY2012 through September The most recent data from Realty Trac
ECONOMIC OVERVIEW
Pinellas County Budget Forecast FY2014-2023 C-23
shown in the chart below shows that most of the foreclosure activities are in the large population centers within Pinellas County
Foreclosure Activity ndash Pinellas County December 2012
Source RealtyTraccom
Summary of Local Outlook While the national recession has been over for more than three years the effects are still being felt in Pinellas County Unemployment is well above pre-recession levels and foreclosures have remained stubbornly high in the past several months However the biggest industry in Pinellas County tourism has shown signs of a strong recovery FY2012 tourist development tax revenues were 124 higher than FY2011 and each month in FY2013 has been higher than the same month in FY2012 And real property values appear to have begun to climb after five years of decreases As the national economy continues to improve Pinellas County is poised to recover as well However because of the high level of unemployment and the potential inventory of residential properties available on the market the recovery is expected to be slow and long
ECONOMIC OVERVIEW
Pinellas County Budget Forecast FY2014-2023 C-24
KEY ASSUMPTIONS
Pinellas County Budget Forecast FY2014-2023 D-1
The Key Assumptions portion of the Budget Forecast FY2014-2023 includes a discussion of the sources of information used to develop assumptions for revenues and expenditures that drive the ten-year forecasts for ten of the Countyrsquos key funds
Assumptions and Forecasting
Revenue Assumptions
o Overview
o Key Assumptions
o Supporting Information
Expenditure Assumptions
o Overview
o Key Assumptions
o Supporting Information
Assumptions and Forecasting Forecasting is not a precise science This is particularly true for forecasts that involve the economy Statistician Nate Silver in his recent book The Signal and the Noise Why So Many Predictions Fail ndash but Some Donrsquot notes the performance of the highly-respected Survey of Professional Forecasters in predicting the one-year growth or decline in Gross Domestic Product (GDP) Silver cites a study which revealed that the actual change in GDP has fallen outside the range of the grouprsquos predictions almost half the time The most recent example was in 2007 where all of the economists predicted growth in GDP even though the Great Recession was already under way As Silver says ldquoForecasting something as large and complex as the American economy is a very challenging taskrdquo Despite this uncertainty forecasting is a useful tool for identifying potential problems and the need for future action The forecasts in this document are a baseline using past trends current policies and assumptions about future conditions based on reasonable expectations We have not attempted to project significant future events such as recessions oil embargos or natural disasters However in each of the fund reviews we have identified the risks to the forecast that could significantly impact the projections In establishing revenue and expenditure assumptions we reviewed data and forecasts from a variety of economists government agencies industry associations and other sources In particular we referenced the State of Floridarsquos Revenue Estimating Conferences frequently The State utilizes a professional nonpartisan consensus process involving the Legislature the Governors Office and the States Division of Economic and Demographic Research in developing national and state economic forecasts that are used in all state planning and budgeting actions The current Conference projections end at FY2022 The projections are available online at httpedrstateflusContentconferencesindexcfm
KEY ASSUMPTIONS
Pinellas County Budget Forecast FY2014-2023 D-2
We also referenced federal agencies such as the Bureau of Labor Statistics the Census Bureau and several Federal Reserve banks as well as private research firms and educational institutions such as The Conference Board Wells Fargo Conway Pedersen Economics Inc the University of Central Florida and the University of Florida The County is not required to use this data but it provides useful background information for projecting changes in revenues and expenditures
Revenue Assumptions Property Taxes ndash General Fund EMS Fund and Fire Districts Fund
Overview Ad valorem taxes commonly called property taxes are assessed on real property and on tangible personal (business) property The tax rate is expressed in ldquomillsrdquo One mill is one dollar of taxes for each thousand dollars of taxable value For example a tax rate of 59 mills on a taxable value of $100000 yields $590 in taxes The Florida Constitution imposes a cap of 10 mills on the total of all County-wide ad valorem rates (which includes the General Fund countywide levy plus the levies for the Health Department and for Emergency Medical Services) A cap of 10 mills is also imposed on the combined total of all MSTU ad valorem rates (which includes the General Fund MSTU levy plus the levies for other dependent districts) The taxable values as of January 1st are established annually by the Property Appraiser and certified for budget purposes by July 1st Final taxable values following appeals and adjustments are certified following the completion of the Value Adjustment Board (VAB) appeals process which recently has been extending into February of the next calendar year
Millage rates are approved annually by the Board of County Commissioners by resolution as part of the budget process This process must follow the ldquoTruth in Millagerdquo (TRIM) law including timing advertisement and conduct of public hearings
Federal state county and municipal property is exempt from property taxes Besides the Homestead and Save Our Homes Exemptions discussed in the Economic Overview section various other exemptions may be available depending on the type of property
Key Assumptions The assumption in the forecast is that after five years of decline taxable values will begin to recover in FY2014 with a slow but sustained rate of growth thereafter
Change in Taxable Values ndash County-wide 2014 2015 2016 2017 2018 2019 2020 2021 2022 2023
25 25 30 30 30 30 30 30 30 30
KEY ASSUMPTIONS
Pinellas County Budget Forecast FY2014-2023 D-3
The County-wide taxable value is the basis for determining the County-wide revenue in the General Fund For the purposes of this forecast the FY2014 through FY2022 percentage change in taxable value for the Emergency Medical Service Fund and the Fire Districts Fund is assumed to be the same as the County-wide taxable value change The rates of growth in the General Fund MSTU and the Fire Districts Fund are projected to be 05 less than the County-wide growth rates based on past trends and the composition of the tax base in the unincorporated area Supporting Information For FY2014 the overall increase of 25 in countywide taxable values reflects differing anticipated changes in the major components of the tax base Within these categories changes in individual properties may vary significantly due to many factors including location (for example beach vs inland) or use (for example hotel vs retail) In the future the growth in property tax revenues will be restrained by the caps put in place by the Legislature in 2007 The amount of new construction in Pinellas County will not provide the boost that other counties that are not built-out will enjoy For example Orange and Hillsborough counties have large undeveloped areas that are available for major residential commercial and industrial expansions Impact of Foreclosures In determining the values as of January 1 2013 which serve as the basis for FY2014 calculations the Property Appraiser will factor in the impact of mortgage foreclosures Foreclosures do not have a significant impact on current year collections of taxes levied because of the recovery mechanisms for delinquent taxes If taxes are unpaid by June 1st a Tax Certificate is offered for sale by the Tax Collector The certificate is sold to an investor and the County receives the equivalent of the taxes due As a result of the recession recent years have seen a dramatic increase in tax certificate sales However although foreclosures do not affect the percentage of property taxes collected during the fiscal year they tend to depress market values of surrounding properties and this has a negative impact on the tax base Along with the rest of the state Pinellas County foreclosure filings increased significantly beginning in 2007 and were averaging about four times higher than the historical norm through 2009 After a decrease in 2010 due to chain-of-title issues and the delay of proceedings in the courts foreclosures once again increased in 2012 to a level about 50 higher than the pre-recession norm For the time being demand is such that new foreclosure inventory is being absorbed fairly efficiently A ldquoglutrdquo of non-mediated rulings could lead to a surge in inventory putting downward pressure on median sales prices which in turn would negatively impact the tax base The forecast assumes that the foreclosure inventory will not experience this type of surge
KEY ASSUMPTIONS
Pinellas County Budget Forecast FY2014-2023 D-4
Source Clerk of the Court data
Taxable values The taxable values for FY2013 were certified by the Property Appraiser on July 1 2012 The county-wide value decreased by 18 compared to the FY2012 values It was the fifth year in a row that the tax base declined Prior to this the tax base only decreased once since World War II a small -06 dip in FY1993
The growth in homesteaded taxable value is subject to the caps imposed by the Save Our Homes amendment This limits the annual growth in a propertyrsquos taxable value to the growth in the Consumer Price Index (CPI) or 3 whichever is lower If the CPI index is negative the allowable change in taxable values is also negative
KEY ASSUMPTIONS
Pinellas County Budget Forecast FY2014-2023 D-5
Save Our Homes Cap for Fiscal Year Based on Change in Consumer Price Index
2005 2006 2007 2008 2009 2010 2011 2012 2013 2014 19 30 30 25 30 0 1 27 15 30 17 There is a two-year lag in the CPI adjustment For example the fiscal year 2014 factor is the CPI change percentage for calendar year 2012
Sources Florida Department of Revenue and US Bureau of Labor Statistics
The factor used is the annual change in the CPI as of December each year For example the limit for FY2013 is the December 2011 index +30 which was issued by the US Bureau of Labor Statistics on January 19 2012 The limit for FY2014 will be the December 2012 index 17 which was issued by the US Bureau of Labor Statistics on January 16 2013 Property Taxes are normally one of the most reliable revenue sources available to local governments As a result most cities counties school districts etc rely on the stability of property taxes to build their budgets Unfortunately due to the combined result of mandatory legislative roll-backs the passing of Amendment One and a correction in the real estate market taxable values have decreased dramatically resulting in a negative multi-year impact in property tax revenue Property Tax Revenue Caps The revenue caps approved by the Legislature in 2007 require that beginning with FY2009 the maximum millage rate that can be approved by a simple majority vote of the Board of County Commissioners equals the prior yearrsquos maximum rolled-back rate adjusted for the change in per capita Florida personal income A two-thirds vote of the Board may approve up to 110 of this maximum Any higher millage rate requires a unanimous vote of the Board or a referendum The County has some flexibility for increases in the short term because we did not levy the maximum millage in FY2009 FY2010 FY2011 FY2012 or 2013 Another aspect of the declining market values (and the ldquodoublingrdquo of the Homestead Exemption from $25000 to $50000) has been the erosion of the amount of value shielded from taxes due to Save Our Homes Prices are now at the point where in some instances homesteaded residential market values have decreased below the prior yearrsquos taxable value This means that rather than an increase due to the Save Our Homes recapture rule some parcels with declining market values previously covered by Save Our Homes will see decreases in their taxable value for FY2014 Fund Variances Because of differences in the composition of their tax base individual fire districts are expected to vary significantly from the overall change The unincorporated area (MSTU) General Fund and Fire Districts Fund taxable value percentage change is assumed to be slightly less than the County-wide taxable value change Other funds not included in this forecast that are dependent on property taxes are the Palm Harbor and Feather Sound Community Service District Funds the Pinellas Public Library Cooperative Fund and the Health Department Fund With the exception of the Health Department the percentage change in taxable value will differ from the County-wide change depending on the composition of the tax roll in each area
KEY ASSUMPTIONS
Pinellas County Budget Forecast FY2014-2023 D-6
Sales Taxes ndash General Fund and Capital Projects Fund Overview Sales tax revenues are highly elastic increasing and falling with the health of the overall economy In addition to food and medicine certain other purchases are exempted from sales tax by legislation The County receives two types of sales taxes the Half-Cent Sales Tax and the Infrastructure Sales Tax (Penny for Pinellas) Half-Cent Sales Tax This General Fund revenue is a portion of the Statersquos six cent sales tax that is shared with counties and cities First authorized in 1982 the program generates the largest amount of revenue for local governments among the state-shared revenue sources currently authorized by the Legislature Sales tax revenue grew by 49 in FY2012 This was the second year of growth following four years of decline beginning in FY2006 We believe this is indicative of a return to sustained sales tax revenue growth
Infrastructure Sales Tax (Penny for Pinellas) The Penny for Pinellas is a 1 percent sales tax which is dedicated to capital improvement projects in Pinellas County such as facilities storm water improvements preservation land purchases roads bridges public safety parks and community centers The Penny makes capital projects and improvements possible without having to raise property taxes Without this funding it is estimated that property owners would have to pay another 15 mills on their property taxes With a sales tax approximately one-third of the total Penny funds are paid for by tourists and seasonal residents Key Assumptions For the State Shared Half-Cent Sales Tax in FY2014 and later years we anticipate growth approaching historical patterns A 40 growth rate is assumed for FY2014 reflecting the
KEY ASSUMPTIONS
Pinellas County Budget Forecast FY2014-2023 D-7
continuing economic recovery This is followed by a 35 growth rate throughout the FY2015-FY2023 forecast period In the near-term our projection is more conservative than the State General Revenue Estimating Conference which anticipates more robust FY2014 growth of 54 followed by 61 and 56 in FY2015 and FY2016 respectively
Change in Half-Cent Sales Tax Revenue 2014 2015 2016 2017 2018 2019 2020 2021 2022 2023
40 35 35 35 35 35 35 35 35 35
The revenue assumptions for the overall Penny sales tax are consistent with the Half-Cent sales tax However the growth rate in the Capital Projects Fund for the Penny sales tax is less at 30 growth from FY2014 to FY2023 This is because the Courts amp Jail allocation is a fixed amount that does not grow over time resulting in a slightly smaller growth rate for the Countyrsquos overall share of the Penny Supporting Information The statewide number from the State General Revenue Estimating Conference reflects population growth that will not be as significant a factor in Pinellas County as in other less built-out counties However we are confident that a strengthening local economy and stronger tourism will result in slightly better growth in the short term Data on potential future job creation growth (provided by Economic Development) and projected tourism growth (provided by the Convention and Visitorrsquos Bureau) support this view Our forecast essentially reflects about 15 to 25 per year growth over the rate of price inflation As a result we are not anticipating a return to the FY2006 peak level of our Half-Cent Sales Tax revenues until FY2016 Communications Services Tax ndash General Fund
Overview The Communications Services Tax (CST) which is 2 of total General Fund revenues is paid by unincorporated area residents and is dedicated entirely to providing services for them through the MSTU The CST legislation was enacted to restructure taxes on telecommunications cable direct-to-home satellite and related services that existed prior to October 1 2001 Previously a county could impose franchise fees on telephone and cable television within its boundaries Currently for charter counties a local CST may be levied at a rate up to 51 percent plus an add-on of up to 012 percent in lieu of imposing permit fees The County has levied the maximum rate of 522 since January 2003 The Communications Services Tax revenue has declined due to the recession and to technological changes in the industry that have reduced the base of taxable services FY2012 CST revenue (excluding audit adjustments) was 28 lower than in FY2011
KEY ASSUMPTIONS
Pinellas County Budget Forecast FY2014-2023 D-8
Key Assumptions The forecast projection reflects a continuation of the decline in this revenue source
Change in Communications Services Tax Revenue 2014 2015 2016 2017 2018 2019 2020 2021 2022 2023 -05 -05 -05 -05 -05 -05 -05 -05 -05 -05
Supporting Information The CST is levied on communication services that originate and terminate within the state Technological advances have allowed for increased competition from communication service providers (particularly wireless providers) which do not meet this definition and whose services are therefore not subject to the CST The 2012 Legislature approved changes to the CST statutes and a State commission the Communications Services Tax Working Group was appointed to study the CST and recommend further structural changes that may lead to even greater reductions in revenue The Working Group is proposing the complete elimination of the CST placing all communications services under the sales tax and increasing the State Sales Tax from 60 to 634 The intent of the proposal is to be ldquorevenue neutralrdquo to the State and to local governments but detailed calculations have not yet been made The cumulative impact of the 2012 changes and the restructuring if it occurs is undetermined at this time State Revenue Sharing - General Fund Overview State Revenue Sharing is primarily based on the Statersquos sales tax revenue The formula for Revenue Sharing is subject to adjustment by the Legislature Similar to the Half-Cent Sales Tax Revenue Sharing revenue demonstrated a second year of growth increasing 34 in FY2012 Prior to FY2011 this source had declined or remained essentially flat since FY2006 As discussed in the section on Expenditure Assumptions the 2012 Legislature as part of the unfunded Medicaid mandate directed that Revenue Sharing distributions to the counties be reduced in order to cover the alleged ldquobacklogrdquo of Medicaid charges This will result in Pinellas County receiving only about two-thirds of the normal Revenue Sharing allocation in FY2013
KEY ASSUMPTIONS
Pinellas County Budget Forecast FY2014-2023 D-9
Key Assumptions For the underlying sources that support State Revenue Sharing the forecast assumes a return to the pattern of moderate growth in this revenue source that predated the economyrsquos boom and bust cycle resulting in an annual increase of 25 through the forecast period However the actual amount the County receives will be reduced in FY2013 through FY2017 The original FY2013 budget showed this as a reduction in revenue After further review the Clerkrsquos Finance Division is posting revenue at the entire ldquoearnedrdquo amount and posting the backlog holdback amount as an expenditure This has no net effect on the projections
Change in State Revenue Sharing Revenue (before Medicaid mandate reductions)
2014 2015 2016 2017 2018 2019 2020 2021 2022 2023 25 25 25 25 25 25 25 25 25 25
Supporting Information State Revenue Sharing has historically grown at a somewhat lower rate than Half-Cent Sales Taxes In addition to differences in the distribution formulas for these two revenues a portion of Revenue Sharing is derived from Cigarette Taxes which have been a declining revenue source for years These factors combine to reduce the potential for growth in Revenue Sharing Interest Earnings and Other Revenue ndash All Funds Overview The County earns interest on fund balances These funds are invested by the Clerk of the Circuit Court in accordance with the Board of County Commissionersrsquo approved Investment Policy All investment activity is conducted in accordance with Section 218415 Florida Statutes and Section 2-144 of the Pinellas County Code The primary objective of the policy is the safety of County funds The second objective is the provision of sufficient liquidity The third objective
KEY ASSUMPTIONS
Pinellas County Budget Forecast FY2014-2023 D-10
subordinate to safety and liquidity is to maximize the return on the investment portfolio while avoiding unreasonable investment risk Key Assumptions Market conditions including record low interest rates were such that interest earnings in FY2012 were once again minimal The forecast reflects the short term outlook for continued low earnings gradually increasing to earnings of approximately 3 on fund balances in the mid- to long-term
Interest Earnings on Fund Balances 2014 2015 2016 2017 2018 2019 2020 2021 2022 2023 07 10 15 30 30 30 30 30 30 30
In each fund forecast the major revenue sources that comprise most of the available resources are specifically analyzed Depending on the fund the remaining revenues may include licenses and permits charges for services fines and forfeitures rents surplus refunds reimbursements and other miscellaneous revenues For these other revenues the forecast assumes the same flat to moderate growth which reflects the anticipated gradual economic recovery
Change in Other Revenue (non-specific) 2014 2015 2016 2017 2018 2019 2020 2021 2022 2023
20 20 20 20 20 20 20 20 20 20
Key Assumptions for Other Fund-Specific Revenues Tourist Development Tax- TDC Fund Tourism is a key driver of the economy in Pinellas County The County imposes a 5 tourist development tax (ie bed tax) on rents collected for temporary lodgings The revenue highly sensitive to general economic and other conditions is driven by several factors including the number of visitors the length of stay and the Average Daily Rate (ADR) that hotels are able to collect for rentals Tourist Development tax revenues have been steadily improving since Spring 2010 and reached record levels in FY2012 FY2013 revenues are estimated to grow 4 beyond actual receipts for FY201 and are anticipated to continue to increase at 35 in FY2014 Beyond FY2014 projections continue to increase by 30 annually through the forecast period matching anticipated gradual growth as part of the recovery in the broader US economy
Change in Tourist Development Tax Revenue 2014 2015 2016 2017 2018 2019 2020 2021 2022 2023
35 30 30 30 30 30 30 30 30 30
KEY ASSUMPTIONS
Pinellas County Budget Forecast FY2014-2023 D-11
Gas Taxes - Transportation Trust Fund The County receives several types of gas tax including State Shared Gas Taxes and Local Option Gas Taxes These revenues are dedicated for transportation-related expenditures and are deposited in the Transportation Trust Fund The State Transportation Revenue Estimating Conference forecasts annual average revenue growth of 19 but this is based on the forecast of total gallons of motor fuel pumped annually in Florida The Countyrsquos gas taxes are based on gallons consumed and not fuel prices and revenue has declined 03 in FY2011 and 02 in FY2012 Pinellas Countyrsquos built out condition and future mandated vehicle fuel efficiency standards leads us to assume a continuing slow decline in these revenues Although the County has the potential to levy an additional 1 to 5 cents in Local Option Gas taxes there are no tax rate increases built into the forecast
Change in Gas Tax Revenues 2014 2015 2016 2017 2018 2019 2020 2021 2022 2023 -05 -05 -05 -05 -05 -05 -05 -05 -05 -05
Ambulance User Fee Revenue ndash EMS Fund Ambulance user fee revenues are subject to a number of variables Unanticipated changes in transport volume (positive or negative) Unanticipated Medicare audit settlements (positive or negative) Potential reductions to Medicare fee schedules (negative) Decreasing mix of private insurance payments and increasing mix of lower-reimbursement
Medicare and Medicaid payments (negative) Increased Medical Necessity verification requirements (negative) Ambulance user fee revenues are primarily driven by patient demand (transport volume) The average increase in transport volume from FY2010 to FY2012 was 20 The average increase or 10 years was 313 ranging from 05 to 74 Revenues are estimated to increase by 20 during the forecast period
Change in Ambulance User Fee Revenue 2014 2015 2016 2017 2018 2019 2020 2021 2022 2023 20 20 20 20 20 20 20 20 20 20
Flight Operations Revenues ndash Airport Fund AirfieldFlight Line revenue for FY2013 is based on the current level of carriers and passenger numbers For FY2014 through FY2023 an increase of 20 per fiscal year is forecast The forecast assumes no new carriers over the ten year period
Change in Airport Flight Operations Revenues
2014 2015 2016 2017 2018 2019 2020 2021 2022 2023 20 20 20 20 20 20 20 20 20 20
KEY ASSUMPTIONS
Pinellas County Budget Forecast FY2014-2023 D-12
Airport RentLeasesConcessions Revenues ndash Airport Fund RentLeasesConcessions revenue for FY2013 is based on current leasesagreements through the termination of these lease agreements Land leases have a five-year adjustment based on the CPI For FY2014 through FY2023 an increase of 20 is forecasted for each fiscal year The County General Fund leases land for the Jail the Criminal Justice Center and other uses from the Airport They comprise 45 of the long-term industrial (non-aviation) land leases
Change in Airport Rental Revenues 2014 2015 2016 2017 2018 2019 2020 2021 2022 2023 20 20 20 20 20 20 20 20 20 20
Water and Sewer Rates In FY2012 the Board of County Commissioners approved a four-year rate plan for both the Water and Sewer systems to meet projected revenue needs through FY2015 Water Funds Revenue In addition to its retail water customers the County has provided water at wholesale rates to six cities that purchase water in bulk and distribute it to their own retail customers The volume of water purchased declined 30 from FY2008 to FY2012 partially due to several of the cities beginning to develop alternative sources of water The amount of water purchased is also affected by economic conditions housing and commercial vacancies and levels of conservation The Water revenue forecast assumes only a 0 to 027 annual increase in retail water demand over the forecast period due to the expected slow growth in the economy The wholesale water demand reflects a continuing decline through FY2016 due to the projected loss of sales to three cities (Clearwater Tarpon Springs and Oldsmar) as they develop their own water resources Sewer Funds Revenue The volume of waste billed has declined 3 from FY2008 to FY2012 The amount of sewage processed is affected by economic conditions housing and commercial vacancies and levels of water conservation The Sewer revenue forecast assumes no increase from FY2013 to FY2014 and a 007 to 021 annual increase from FY2017 to FY2023 in retail and wholesale sewer demand Solid Waste Funds Revenue Tipping fees for the Solid Waste facility are not anticipated to increase during the forecast period Revenues are expected to grow about 05 annually The contract for electricity sales to Progress Energy contains annual escalations of 6 in revenue The contract expires in 2024
Change in Solid Waste Tipping Fee Revenues 2014 2015 2016 2017 2018 2019 2020 2021 2022 2023 05 05 05 05 05 05 05 05 05 05
KEY ASSUMPTIONS
Pinellas County Budget Forecast FY2014-2023 D-13
Expenditure Assumptions Personal Services ndash Salaries ndash All Funds Overview The cost of Personal Services (salaries and benefits) is generally the single largest category of expense (for example 50 of the General Fund) Prior to FY2009 the range of salary merit adjustments generally varied from 0 to as high as 7 No merit pay increases have been granted to County employees in five years (six years for exempt employees) Beginning on July 1 2012 employees are required to contribute 3 of salary to the Florida Retirement System effectively reducing take home pay A limited non-recurring compensation adjustment was approved for FY2013 Key Assumptions Compensation adjustments are included in the forecast for FY2014 through FY2023 County employees have not received merit pay increases for four years and in some cases five years This cost-saving measure was employed as the organization dealt with significant reductions and dramatic decreases in property tax revenue For FY2013 a one-time cost of living wage disbursement was approved In future years moderate pay for performance merit increases are expected to resume to maintain a compensation structure that can attract and retain quality employees No automatic cost of living increases are anticipated in the forecast
Change in Salaries (Merit Increases ndash Net) 2014 2015 2016 2017 2018 2019 2020 2021 2022 2023
0-3 0-3 0-3 0-3 0-3 0-3 0-3 0-3 0-3 0-3
Supporting Information The annual market survey of salaries and benefits for comparable area organizations is being reviewed at this time We have already seen indications that salaries for current employees are becoming non-competitive Additional funds may be required for potential re-classifications due to the reorganizations and reductions in force which have occurred over the past several years Non-recurring compensation adjustments such as one-time flat-amount payments could also be implemented without negatively impacting the forecast Personal Services ndash Employee Benefits ndash All Funds
Overview
The County is responsible for employer contributions to Social Security (FICA) the Florida Retirement System (FRS) State pension fund and to support various other benefits such as health and life insurance short term disability workers compensation and unemployment compensation The two key drivers for employee benefits are the Countyrsquos share of pensions and health insurance costs
KEY ASSUMPTIONS
Pinellas County Budget Forecast FY2014-2023 D-14
Florida Retirement System (FRS) The County is required to participate in the Florida Retirement System (FRS) a State public pension plan Cities have the option of joining the State system or creating their own pension plans Employees of school districts and state agencies also must enroll in FRS and comprise about two-thirds of the total active membership
Source State Board of Administration Investment Report for State Fiscal Year 2012
From 1998 to 2008 the FRS had been one of the few state systems that had an actuarial surplus This lowered the required contributions set by the Legislature that are based on an employeersquos salary and benefit category (public safety employees and elected officials have higher benefits) As with most other pension systems the financial system crisis in the fall of 2008 had a significant effect on the value of FRS investments As a result beginning in 2009 the FRS system has had an unfunded liability
KEY ASSUMPTIONS
Pinellas County Budget Forecast FY2014-2023 D-15
Source State Board of Administration
Investment Report for State Fiscal Year 2012
The FRS investment portfolio which is managed by the State Board of Administration has now substantially recovered from this setback As of March 31 2011 the net asset value for the FRS pension plan was close to the peak value it had reached in 2007
Source State Board of Administration Investment Report for State Fiscal Year 2012
However the 2011 session of the Legislature determined that significant changes were needed in the FRS system These changes are summarized in the following table
KEY ASSUMPTIONS
Pinellas County Budget Forecast FY2014-2023 D-16
These changes affected the future retirement benefits for County employees on the payroll prior to July 1 2011 as well as those hired after that date when these provisions took effect The major impact on the Countyrsquos expenditures results from changing FRS from a non-contributory to a contributory structure This allowed the Legislature to significantly reduce the employer contribution rates for FRS and not coincidentally balance the State budget The rate reductions also resulted in substantial FY2012 cost savings for the County amounting to $13M in the General Fund alone as compared to earlier projections The 2012 Legislature approved rates for the Statersquos 2013 fiscal year (June 2012 to July 2013) that were essentially the same as the previous year Looking ahead employer rates are scheduled to increase in July 2013 under current legislation and the future direction of legislative action cannot be predicted In addition to this general uncertainty the requirement for employee contributions to FRS had been challenged by a lawsuit filed on behalf of public employees by several labor organizations On January 17 2013 the Florida Supreme Court issued its ruling in this case which upheld the employee contribution requirement This avoided potential increases to employer contributions which could have negatively impacted personnel costs Health Insurance Health insurance costs for the County have followed the national trend and outpaced inflation in recent years These increases have been mitigated by the Countyrsquos aggressive cost containment measures including the renegotiation of pharmacy and health contracts the creation of a medication management program increased wellness programs and incentives for employees and the introduction of a fully insured Medicare Advantage Group plan for Medicare-eligible retirees Key Assumptions As of June 30 2012 the FRS system was still only 869 funded
KEY ASSUMPTIONS
Pinellas County Budget Forecast FY2014-2023 D-17
Source Milliman presentation to FRS Actuarial Assumptions Estimating Conference October 1 2012
Due to the reduced value of the Statersquos pension fund investments we are assuming increases in the FRS contribution requirements The forecast assumes that the State will increase rates to address the unfunded liability over the next four years rather than all at once as contemplated in the 2012 legislation because increases in these rates also have negative impacts on the budgets of State agencies and the school districts After reaching a fully funded level the rates should stabilize but there is a large degree of uncertainty in that the Legislature and Governor have demonstrated that they are willing to make major structural changes to the pension system
Projected FRS Employer Blended Contribution Rates (Regular Class) 2014 2015 2016 2017 2018 2019 2020 2021 2022 2023
566 600 640 681 681 681 681 681 681 681
The growth in the Countyrsquos FRS dollar contributions will be a combination of these rate changes and the growth in the salary base to which the rates are applied
Change in FRS Dollar Contributions 2014 2015 2016 2017 2018 2019 2020 2021 2022 2023 30 85 92 89 25 25 25 25 25 25
From 2018-2023 rates are assumed to stay constant but dollar contributions rise at the same rate as salary growth
The forecast assumes that the Countyrsquos aggressive health insurance cost containment measures will continue but that the near-to-mid-term need to supplement required self-insurance reserves as well as longer-term cost increases and employee retiree mix changes will still result in expenditure growth well in excess of CPI throughout the forecast period
KEY ASSUMPTIONS
Pinellas County Budget Forecast FY2014-2023 D-18
The Affordable Health Care Act (ACA) passed in 2010 on the national level to restructure and contain health insurance costs could have a significant impact The forecast does not assume any changes in the current situation some of the potential implications of the ACA are discussed in the Supporting Information below
Change in Health Insurance Contributions 2014 2015 2016 2017 2018 2019 2020 2021 2022 2023 100 100 100 100 100 100 100 100 100 100
The combined result of the forecast changes in salaries and benefits results in the following overall change to Personal Services costs
Change in Personal Services Expenditures (Net Total Salary and Benefit Changes)
2014 2015 2016 2017 2018 2019 2020 2021 2022 2023 41 40 40 40 40 40 40 40 40 40
Supporting Information Health insurance costs are affected by changes in the workforce As the number of active employees decreases due to budget reductions and the number of retirees in the health plan increases costs are spread over a smaller base In recent years the ratio of active employees to retirees has changed from 3 actives for every retiree to 2 actives for every retiree while costs per position have increased The result is that County employer contributions per active position have increased at a higher rate than cost inflation This trend is expected to continue Because the County is self-insured we are required to maintain the equivalent of 2 months of medical claims as a reserve Higher-than-average claims in recent years have led us to draw on our reserves such that they are below the required level This is exacerbated by the employee retiree mix changes discussed above In the near-term OPEB reserves are available to cover the deficit The details of how the Affordable Care Act (ACA) will be implemented in Florida are still being determined The following graphic illustrates the overall timeline of events that will impact employer group health plans such as the Countyrsquos
KEY ASSUMPTIONS
Pinellas County Budget Forecast FY2014-2023 D-19
Timeline Source Buck Consultants presentation ndash July 2012
Florida will be one of a number of states that will not set up a State-run Health Exchange at least initially Instead implementation will default to a Federal-run Exchange
Source Kaiser Family Foundation - Health Reform website
(data as of January 4 2013)
KEY ASSUMPTIONS
Pinellas County Budget Forecast FY2014-2023 D-20
In the future as the ACA is fully implemented the County may be able to consider new structural options For example the County could eliminate the self-insurance system and provide employees an amount to purchase coverage on the Health Exchange Detailed analysis would be needed before implementing any significant structural changes Note that the actual change in Personal Service costs in a department agency or fund may differ from these overall percentages due to reorganizations changes in the number of positions vacancies and other factors specific to the entity Operating Expenses and Capital Outlay- All Funds Overview The cost of services commodities and equipment (Operating Expenses and Capital Outlay) are driven by inflation Many costs will track closely with the Consumer Price Index (CPI) but items such as fuel chemicals and construction materials often exceed that pace The difference between inflation as measured in the CPI and the cost pressure on local governments is illustrated by the Municipal Cost Index (MCI) developed by American City amp County The MCI draws on the CPI the Producer Price Index (PPI) the Construction Cost Index (CCI) monthly statistical data collected by the US Departments of Commerce and Labor and independently compiled data to project a composite cost picture that more accurately reflects inflationary impacts on counties and cities The higher inflationary pressure on local governments is reflected in the report issued by American City and County for December 2012 Compared to the same period last year the Municipal Cost Index increased 20 versus the 17 increase in the CPI In Pinellas County expenses such as fuel electricity and state-mandated Medicaid charges reflect the MCICPI disparity demonstrating historical and projected growth exceeding CPI growth Fuel Fuel costs are dependent on the amount of fuel purchased as well as the price of fuel The County has reduced the size of the fleet and increased fuel efficiency As a result gallons purchased have declined from 136M in FY2008 to 103M in FY2012 for non-Sheriff units Beginning in late FY2011 the Sheriff began purchasing fuel through the Fleet Management Fund which added 102M gallons in FY2012 This change increased total gallons purchased but the expenditures in the Fleet Management fund were offset by an equivalent amount of revenue from the Sheriffrsquos budget Electricity The Countyrsquos office facilities are generally charged a commercial rate for electricity by Progress Energy Historically these rates have averaged annual increases of 5
KEY ASSUMPTIONS
Pinellas County Budget Forecast FY2014-2023 D-21
Medicaid The County is billed by the State for a portion of Medicaid costs The County pays the State for County resident in-patient hospital care for days 11 through 45 The days do not have to be consecutive Because patient stays of less than 11 days or more than 45 days are not paid by the County there is not a strong correlation between the Countyrsquos Medicaid bill and an increase in unemployment from the recession Key Assumptions The forecast assumes that the cost of services commodities grants and aids and equipment will generally track the CPI increases developed by the State in their consensus Revenue Estimating Conference These projections were reviewed against those from various other sources including the Survey of Professional Forecasters the University of Central Florida and the Federal Reserve While there are variations in the specific percentages all of these sources projected continuing low to moderate cost inflation over the forecast period
Change in Other Non-Personnel Expenditures (CPI) 2014 2015 2016 2017 2018 2019 2020 2021 2022 2023 15 18 17 20 19 21 20 20 20 20
Fuel - All Funds with Fleet Equipment The FY2013 Budget baseline was based on a price of $350gallon The price for the County in January 2013 was about $327gallon an average of diesel and unleaded fuel The forecast assumes price increases slightly higher than the rate of inflation
Change in Fuel Costs 2014 2015 2016 2017 2018 2019 2020 2021 2022 2023 30 30 30 30 30 30 30 30 30 30
Electricity - General Fund and Utilities Funds The Real Estate Management and Utilities departments have both taken steps to decrease annual cost increases by implementing measures to reduce energy consumption The forecast assumes flat electricity costs in FY2014 due to recent Progress Energy rate reductions Percentage increases in later years are based on the historical averages
Change in Electricity Costs - Commercial 2014 2015 2016 2017 2018 2019 2020 2021 2022 2023 0 50 50 50 50 50 50 50 50 50
Medicaid - General Fund The 2012 Legislature changed the Statersquos method of billing the County for Medicaid shifting the burden of proof to demonstrate that a claimant is not a county resident in order to dispute an
KEY ASSUMPTIONS
Pinellas County Budget Forecast FY2014-2023 D-22
amount on a bill The State is also reducing the Countyrsquos Revenue Sharing funds to cover a multi-year backlog in billings Unemployment Compensation ndash General Fund Unemployment Compensation for all County operations other than the Sheriff is billed by the State to the General Fund Historically these expenses were less than $01M annually However costs peaked at $12M in FY2010 due to Reductions in Force (RIFs) and declined over the next two years to $02M in FY2012 Future yearsrsquo costs are expected to be closer to the historical average in the absence of another major RIF Supporting Information Fuel efficiency gains are anticipated as new Federal Corporate Average Fuel Economy (CAFEacute) standards for heavy trucks and equipment take effect due to the composition of the fleet Only 47 of 1726 BCC units are cars (less than 3) the bulk of the fleet (excluding the Sheriffrsquos vehicles) is heavy equipment These units usually achieve only 8 to 10 miles per gallon because of idling time (for power take off units) and the gear ratio needed to haul heavy loads The new standard will increase mpg to 12 in 2014 Previously there had been no federally mandated fuel economy standards for heavy trucks and equipment Some departments will have increased fleet replacement costs as units are replaced that are not currently paying into the Fleet fund due to deferral of purchases and life cycle extensions However where feasible some future purchases of replacement equipment may be deferred to take advantage of the new fuel economy standards Other Post Employment Benefits (OPEB) ndash All Funds Overview Consistent with Government Accounting Standards Board directives the Countyrsquos actuarial consultants computed the unfunded Other Post Employment Benefits (OPEB) liability as of October 1 2011 at $392M for Unified Personnel System (UPS) employees and $315M for Sheriff employees The Countyrsquos net Annual Required Contribution (ARC) for OPEB to fully fund this liability would be $277M for UPS employees and $241M for Sheriffrsquos Office employees The FY2013 Budget includes a transfer of $2M from the General Fund to the Employee Benefits Fund for a partial contribution to the annual OPEB ARC for both UPS and Sheriffrsquos Office employees In previous years the County set aside a cumulative total of $27M for OPEB Other local governments in Florida with an OPEB liability are also partially funding those obligations as budgets allow Key Assumptions The forecast assumes that OPEB funding in the General Fund will continue at the current level of $2M per year throughout the forecast period This will be reviewed following analysis of the
KEY ASSUMPTIONS
Pinellas County Budget Forecast FY2014-2023 D-23
next OPEB actuarial report which will provide valuations as of October 2013 OPEB contributions for Enterprise operations are contained within their respective funds
Projected OPEB Contributions - $ millions 2014 2015 2016 2017 2018 2019 2020 2021 2022 2023 $20 $20 $20 $20 $20 $20 $20 $20 $20 $20
Supporting Information Effective January 1 2011 new hires will not further increase the OPEB liability upon retirement and new retirees covered by Medicare must enroll in the less costly Medicare Advantage plan option These actions will help better quantify the OPEB liability in the next OPEB valuation actuarial study Other Fund-Specific Expenditures Ambulance Contract Expenditures ndash EMS Fund The County contracts with Paramedics Plus for the Countyrsquos SUNSTAR ambulance system Contracts with the Countyrsquos ambulance provider were renegotiated in FY2012 with an annual reduction to base service payments of $2 Million A 6 increase was included in the forecast from FY2014 through FY2022 to account for annual CPI increases and increases to transport volume However once the contract is up for negotiation expenditures may change as the economy rebounds and fuel and labor costs and other factors change
Change in EMS Ambulance Contract Expenditures 2014 2015 2016 2017 2018 2019 2020 2021 2022 2023 60 60 60 60 60 60 60 60 60 60
First Responder Expenditures ndash EMS Fund
The County contracts with the eighteen first responder EMS providers that respond to calls using paramedics and that utilize Advanced Life Support (ALS) or Basic Life Support (BLS) equipment and personnel First responder contractual expenditures increased 51 from FY2012 to FY2013 and are estimated to increase at 5 through the forecast period
Change in EMS First Responder Expenditures 2014 2015 2016 2017 2018 2019 2020 2021 2022 2023 50 50 50 50 50 50 50 50 50 50
Purchase of Water - Utilities Water Funds A major expense to the Water System is the purchase of water from Tampa Bay Water The annual change in the cost of water reflects the combined impact of changes in Tampa Bay Water rates andor changes in consumption including decreases in wholesale customer base The actual cost in dollars will be dependent on the amount of water purchased
KEY ASSUMPTIONS
Pinellas County Budget Forecast FY2014-2023 D-24
Change in Cost of Water Purchased from Tampa Bay Water 2014 2015 2016 2017 2018 2019 2020 2021 2022 2023 10 21 08 17 17 18 17 19 21 21
Chemicals - Utilities Water and Sewer Funds The increase in the cost of chemicals for Water and Sewer operations has been historically around 7 annually The forecast projects this trend to continue
Change in Cost of Chemicals for Utilities 2014 2015 2016 2017 2018 2019 2020 2021 2022 2023 70 70 70 70 70 70 70 70 70 70
Capital Outlay - Utilities Water and Sewer Funds The Water and Sewer capital outlay forecasts reflect the construction and purchase needs as estimated by the Pinellas County Department of Environment and Infrastructure Engineering Division in the CIP ten year work plan Solid Waste Expenditures ndash Utilities Solid Waste Funds Solid Waste operating expenditures are projected to generally follow overall inflationary trends The Solid Waste capital outlay forecast reflects the construction and purchase needs as estimated by the consulting engineering services report by CDMSmith Inc There is a large capital need forecasted from FY2013 through FY2018 to install additional air pollution measures in anticipation of tighter regulatory requirements and additional required improvements Other Forecast Considerations While climate change is generally viewed as a long-term problem recent events show that we may already have begun to see an increase in the frequency and intensity of storms such as hurricanes and unseasonable weather Should this trend continue it may be prudent to consider increasing fund reserves to provide adequate resources to deal with the cost of responding to these events As a coastal community rising sea levels due to climate change may require expenditures to reconstruct or relocate facilities that are in low-lying areas At this time it appears that these costs would not be incurred during the timeframe of the forecast
FUND FORECASTS
Pinellas County Budget Forecast FY2014-2023 E-1
The Fund Forecasts portion of the Budget Forecast FY2014-2023 includes ten-year forecasts for ten of the Countyrsquos major funds
General Fund
Tourist Development Fund
Transportation Trust Fund
Capital Projects Fund
Emergency Medical Services Fund
Fire Districts Fund
Airport Fund
Utilities Water Funds
Utilities Sewer Funds
Utilities Solid Waste Funds
Sections in Each Fund Forecast Each fund forecast includes the following sections
Description Provides information concerning the fund such as fund type legal authority authorized uses of proceeds etc
Summary Provides an at-a-glance summary of the ten-year forecast These results are also summarized in the Executive Summary
Revenues Provides a high level overview of the major revenues in the fund
Expenditures Provides a high level overview of the major expenditures in the fund
Ten Year Forecast Includes key assumptions in the forecast a chart of the ten-year forecast and key results interpreted from the forecast chart
Potential Risks Includes key factors that affect assumptions in the forecast over the forecast horizon
Balancing Strategies Includes potential revenue and expenditure options for balancing the funds
Additional Information The fund forecasts in this section are intended to be high level user-friendly summaries of the results of the ten-year forecast for each fund For more detailed information please see the Key Assumptions and Pro-Formas portion of this document
FUND FORECASTS
Pinellas County Budget Forecast FY2014-2023 E-2
GENERAL FUND
Description The General Fund includes the primary governmental functions of the County that are not completely supported by dedicated resources These activities include but are not limited to Sheriffrsquos law enforcement detention and corrections health and human services emergency management and communications parks and leisure services and the operations of the Property Appraiser Tax Collector and Supervisor of Elections The General Fund includes operations for both county-wide functions and the unincorporated area These segments are tracked separately within the fund The unincorporated area is commonly referred to as the MSTU (Municipal Services Taxing Unit) MSTU expenditures are about 9 of the total (net of reserves)
Summary The General Fund encompasses the principal governmental activities of the County that is those that are not primarily supported by dedicated revenues or by user fees The four main revenue sources for the General Fund are Property Taxes State Shared Half-Cent Sales Taxes State Revenue Sharing and Communications Services Taxes The forecast projects that beginning in FY2013 recurring expenditures exceed recurring revenues in the General Fund This is primarily due to the aftereffects of the Great Recession with continued slow recovery of the real estate market In addition caps on taxable value increases and total property tax revenue will inhibit future revenue growth Major expenditure drivers that exceed normal inflation include personnel costs such as health insurance and state-required pension contributions and mandated expenses such as Medicaid There is a long-term structural imbalance of approximately $15M increasing to $60M per year over the forecast period absent action to address this problem The balancing strategy for the General Fund is to cover the shortfall in FY2014 by utilizing the Service Level Stabilization Account (SLSA) Expenditure reductions or revenue increases may be required in FY2014 or future years to address the structural imbalance The extent of the changes needed will be dependent on the pace of the economic recovery particularly the real estate market
Revenues Property Taxes are the single largest source of General Fund revenues accounting for more than two-thirds of the total The four primary funding sources for the General Fund (Property Taxes State Shared Half-Cent Sales Taxes State Revenue Sharing and Communications Services Taxes) comprise about 81 of the revenue The remaining 19 is derived from a variety of resources including User Fees Grants Interest and Cost Recovery from other County funds
Pinellas County Budget Forecast FY2014-2023 E-3
GENERAL FUND
Source FY2013 Adopted Budget Property Taxes The decline in property tax revenue from FY2008 to FY2012 exceeded the increases that occurred from FY2004 though FY2007 The FY2013 budgeted revenue is comparable to the revenue collected in FY2003 The chart below features a dotted line showing what the historical average of 5 growth in property tax revenue would look like It shows that the above-average amounts collected in FY2004 through FY2008 have been overcome by the large gap between current property tax revenues and where they would have been if the historical 5 growth had taken place
Pinellas County Budget Forecast FY2014-2023 E-4
GENERAL FUND
As discussed in the ldquoAssumptionsrdquo section of the forecast document the Statersquos mandated increase in the Countyrsquos Medicaid costs adversely affected the General Fund In order to stay the course on the established multi-year strategy for achieving financial sustainability the FY2013 budget included an increase of 01997 mills in the county-wide millage rate There was no increase in the MSTU millage rate The combined General Fund property taxes for countywide and MSTU are expected to generate $2866M in FY2013 The total property tax revenue will be comparable to FY2003 and is $147M or 34 less than the FY2007 peak revenue The negative impact from reduced property tax revenue is generally less pronounced for the municipalities in Pinellas County Their General Fund revenue mix usually reflects other revenues such as franchise fees and utility taxes that can help mitigate the impact of a reduction in property tax revenue
Sales Taxes The second largest General Fund revenue source is the State Shared Half-Cent Sales Tax which is 9 of total General Fund revenues Sales Tax collections have begun to recover from the effects of the recession but estimated revenues for FY2013 are still 9 under the peak year of FY2006 This tax is expected to generate $382M in FY2013
State Revenue Sharing The third major General Fund source State Revenue Sharing which is 2 of total General Fund revenues is also primarily based on the Statersquos sales tax revenue It is estimated that from this source the County will recognize $142 million in FY2013 This is 20 less than the FY2006 peak year revenue However the Statersquos implementation of the Medicaid mandate which holds back funds for the ldquobacklogrdquo of Medicaid billings means that the County can only expect to receive $94 million in FY2013 The State also plans to reduce the Countyrsquos Revenue Sharing amounts for FY2014 through FY2017 The original FY2013 budget showed this as a reduction in revenue After further review the Clerkrsquos Finance Division is posting revenue at the entire ldquoearnedrdquo amount and posting the backlog holdback amount as an expenditure Communications Services Taxes The fourth major revenue in the General Fund is the Communications Services Tax (CST) The CST is expected to generate $107M in FY2013 down from a peak of $132M in FY2007 The Countyrsquos CST rate is 522 which is the maximum allowed under current State law Pinellas Countyrsquos revenue reflects the statewide trend for this source which has experienced continued erosion due to heightened competition in the wireless market and reduced consumer spending following the recession Other Revenues Lesser revenue sources include User Fees Sheriffrsquos Law Enforcement Contracts Cost Recovery from other funds Interest Earnings and various other sources including Federal and State grants In general these revenues decreased as a result of the recession but are mostly expected to resume moderate growth in FY2014 and future years
Pinellas County Budget Forecast FY2014-2023 E-5
GENERAL FUND
Expenditures The General Fund includes the primary governmental functions of the County that are not completely supported by dedicated resources These activities include but are not limited to Sheriffrsquos law enforcement detention and corrections support of the Court system including facilities and technology health and human services environmental management emergency management and communications parks and leisure services general administration and the operations of the Property Appraiser Tax Collector and Supervisor of Elections The budgeted expenditures in the General Fund for FY2013 total $4514M (net of reserves and the Service Level Stabilization Account) and can be summarized in four groups the Board of County Commissioners the Sheriff Other Constitutional Officers and Independent Agencies
Source FY2013 Adopted Budget
Board of County Commissioners This grouping of departments includes the departments under the County Administrator as well as the County Attorneyrsquos Office and the Board of County Commissioners (BCC) They are $1832M or 41 of total FY2013 General Fund expenditures (net of reserves and Service Level Stabilization Account) Some of the major BCC programs include social services matching funds for Medicaid building operations and maintenance (including the courts jail and Sheriffrsquos headquarters) parks maintenance environmental protection environmental preserves cultural affairs emergency management animal shelter rabies control economic development consumer services veteranrsquos services the county extension service Florida Botanical Gardens Heritage Village public information the County cable television station planning budget purchasing and State-mandated support of juvenile detention
Pinellas County Budget Forecast FY2014-2023 E-6
GENERAL FUND
Sheriff The Sheriff is an independently elected Constitutional Officer The Sheriffrsquos budget is $2133M or 47 of total FY2013 General Fund expenditures (net of reserves and Service Level Stabilization Account) Detention and Corrections programs comprise 53 of this total The Sheriff also provides support to the Court System and provides Law Enforcement services to both the unincorporated area (MSTU) and by contract to 13 municipalities This includes St Pete Beach for which a contract was approved during FY2013 The Sheriffrsquos adopted budget is often supplemented during the year by grants from Federal and State agencies such as the US Department of Justice and the Florida Department of Law Enforcement Other Constitutional Officers These agencies which are headed by independently elected officials comprise $382M or 8 of total FY2013 General Fund expenditures (net of reserves and Service Level Stabilization Account) In most cases the General Fund only reflects part of the total agency budgets The Tax Collector and Property Appraiserrsquos budgets are determined by statutory formulas and are approved by the State Department of Revenue The General Fund provides about 80 of the Tax Collector and 85 of the Property Appraiser total budgets The remainder is supported by other funds and by revenue sources that are specific to certain functions An example of the latter is the processing of driverrsquos licenses which receives some state support but not enough to cover the Tax Collectorrsquos cost of providing the service The Clerk of the Circuit Court has two separate budgets for activities in support of the Board of County Commissioners and for support of the Court system The latter is fee supported and is not included in the Countyrsquos budget it is funded and approved by the State The Board-related functions comprise about 25 of the Clerkrsquos total budget The budget for the Supervisor of Elections experiences annual fluctuations which result from the varying number and scope of elections in a given year The Supervisor is responsible for preparing and conducting all Federal State County and Municipal elections within the County The Board funds 100 of the Supervisorrsquos budget excluding occasional State or Federal grants Independent Agencies These agencies are $167M or 4 of total FY2013 General Fund expenditures (net of reserves and Service Level Stabilization Account) They include the Countyrsquos support for the Judiciary the State Attorney the Public Defender the Criminal Justice Information System (CJIS) the Medical Examiner the Office of Human Rights and Human Resources Court Support Much of the Countyrsquos court support is driven by statutory mandates and Article V of the State Constitution that require the County to fund certain technology expenses programs and facilities Only about 12 of the Judiciaryrsquos total budget 8 of the Public Defenderrsquos budget and 1 of the State Attorneyrsquos budget are funded by Pinellas County This funding includes some local programs over and above the mandated requirements such as Teen Court Drug Court and the Public Defenderrsquos Jail Diversion efforts The Sixth Judicial Circuit encompasses
Pinellas County Budget Forecast FY2014-2023 E-7
GENERAL FUND
both Pinellas and Pasco counties Pasco County provides funding for similar functions at a lower level due to its relative size The balance of these agency budgets are funded by the State Other Agencies The Medical Examiner also serves the entire Sixth Judicial Circuit and therefore is supported by both Pinellas and Pasco Counties The Medical Examiner is not a government employee but provides forensic investigative and laboratory services to the County by contract Two other agencies receive General Fund support The Office of Human Rights provides County citizens protection from employment and housing discrimination and also acts as the Countyrsquos internal affirmative action agency The Human Resources department manages the Unified Personnel System (UPS) which provides centralized personnel services for the BCC and most of the other County elected officials and independent agencies The major exception is the Sheriff who operates a separate personnel system Types of Expenditures In addition to the breakout of organizational responsibilities another way of looking at General Fund requirements is to consider the types of expenditure required for those organizations to carry out their responsibilities Personal Services Operating Expenses and Capital Outlay in the General Fund are similar to those in other County funds Several of the other expenditure categories merit additional discussion Grants amp Aids Debt Service and Transfers Grants and Aids The Grants and Aids expenditure category includes several types of funding provided by the County to other entities such as financial assistance for low income residents and support of community non-profit social action agencies Grants and Aids also include Tax Increment Financing (TIF) payments to cities for community redevelopment areas (CRAs) Nine cities within the county have established a total of twelve CRAs The County is required by interlocal agreements to contribute funds annually based on formulas that reflect the amount of growth in taxable values compared to a specified base year In FY2013 the County will contribute an estimated total of $63M in TIF payments to the cities Debt Service Unlike many other local governments Pinellas County has no outstanding bond issues which are supported by a pledge of property taxes or other general revenue The only budgeted expenses for Debt Service (principal and interest payments) are for potential short term cash flow or financing needs Transfers Transfers between funds includes ongoing or non-recurring items For example an ongoing transfer to the Employee Health Benefits Fund is budgeted to address unfunded liabilities for Other Post Employment Benefits (OPEB) FY2013 includes the first of five $15M transfers to the Capital Projects Fund to support the Centralized Chiller project which had been advance-funded from other sources
Pinellas County Budget Forecast FY2014-2023 E-8
GENERAL FUND
Non-recurring funds may also be included in the other expenditure categories For example FY2013 Operating Expenses includes $39M in cost allocation charges from BTS to complete funding for the Justice Consolidated Case Management System (CCMS) project At the end of each fiscal year non-recurring funds may be realized as additional fund balance resulting from revenue in excess of expenditures in a given fund The amount of non-recurring or one-time funds can vary significantly from year to year As stated in the Countyrsquos budget policies non-recurring funds should be applied to increase reserves or for one-time purposes only They should not be used to fund ongoing programs Reserves Reserves are not expenditures but they are included in the budgeted total requirements for the fund In order to be expended the BCC must take formal action reappropriating these funds Maintaining adequate reserves is key to the Countyrsquos ability to deal with potential emergencies and unforeseen events such as fuel price increases unanticipated dips in revenues or a natural disaster This is even more important in view of our geographic location on the Florida Gulf Coast We need to have the ability to maintain critical public safety transportation and other services during and after hurricanes and other severe storms We need the resources to provide these services immediately and not rely on Federal funding which is often made available as reimbursements and received months or years after the event Also federal (FEMA) reimbursements typically cover only 75 of the loss Additionally due to conditions in the insurance marketplace our coverages are less than the Countyrsquos total asset base The Countyrsquos property value is estimated at approximately $12 billion (net of the Solid Waste and South Cross facilities) We carry $100M worth of wind damage insurance This means that we have additional exposure depending on the kind of damage we could receive in a storm event or natural disaster Having an adequate reserve also demonstrates stability to the financial markets Although Pinellas has the lowest general revenue debt of any major Florida county this stability enhances our ability to raise capital through bonding at a lower cost if required in the future
The budget policies for General Fund Reserves (Fund Balance) were established by the Board of County Commissioners in accordance with principles issued by the Government Accounting Standards Board (GASB) and are summarized in the following table
Pinellas County Budget Forecast FY2014-2023 E-9
GENERAL FUND
The amount and use of Non-Spendable and Restricted Reserves are defined by the value of inventories and limitations imposed by external entities such as grants that are being carried forward from the previous year The budget policies address the other ldquounrestrictedrdquo categories Prior to FY2011 the General Fund reserve policy was ldquoat a minimum no less than 5 to 15 of operating revenues or no less than one to two months of operating expendituresrdquo Over the last several years the Board of County Commissioners set a conservative General Fund reserve target of 15 of total resources For FY2011 the Board revised its budget policy to incorporate this more conservative approach given that Pinellas County is a high hazard coastal county The revised budget policy states
The General Fund Reserve (Ending Balance) should be budgeted at a level of no less than 15 of total resources
The policy essentially sets a floor of 15 for the reserve level and does not set a cap to limit the reserve The FY2013 General Fund budget includes a projected reserve of $818M which meets the Boardrsquos 15 policy target The components of the estimated FY2013 year-end reserves are Contingency Encumbered Contracts Cash Flow and Disaster Response
Contingency Reserve The Contingency Reserve which is budgeted at $272M in FY2013 is an amount equal to 5 of resources to be used for unanticipated revenue shortfalls or expenditures For example fuel costs and electricity rate increases have been highly volatile and often exceed normal inflation Another example is the need for accrued leave payouts due to layoffs
Pinellas County Budget Forecast FY2014-2023 E-10
GENERAL FUND
Encumbered Contracts Reserve During the year at any given time there are purchase orders and service contracts that have been approved and are subject to payment as work is completed or goods delivered The $76M in the Encumbered Contracts Reserve for FY2013 represents the average amount that was encumbered at monthrsquos end for the 12-month period ending May 2012 Cash Flow Reserve The Cash Flow Reserve is required to meet cash flow needs During the first two months of the fiscal year expenditures exceed revenues because most of the property tax revenue is not received until December Property tax revenue represents about 68 of the total General Fund revenue The FY2013 amount for the Cash Flow reserve $357M is equal to one-twelfth of all General Fund revenue budgeted for the fiscal year Disaster Response Reserve As a high hazard coastal county Pinellas needs to have Disaster Response Reserve funds on hand in case of an emergency such as a hurricane or other man-made or natural disasters In FY2013 $113M is budgeted in this reserve Reimbursement from the Federal Emergency Management Agency (FEMA) and the State usually cover only a portion of the costs is not available at the beginning of a disaster and often is not received for many months or years For example FEMA funds for the three 2004 hurricanes which brushed Pinellas County (Jeanne Charley Frances) were not fully received until 2007 after extensive and protracted appeals through FEMA and the State Approximately $16M of the $93M total cost was not reimbursed for these storm events There are other economic impacts which can result from a major disaster With a substantial portion of the countyrsquos highest taxable value properties located on the shoreline or in lower elevation coastal areas there is the potential for a reduction in the tax base if properties are damaged or destroyed by a storm surge or high winds This would result in a decline in property tax revenue in the following year Sales and other taxes would also decrease due to the negative effects on tourism from the storm Rebuilding would generate additional revenues but it would take time to offset the losses in the aftermath of the disaster As an indication of the size of this problem a seven-county area of Florida impacted by 2004rsquos Hurricane Charley sustained over $66 Billion in losses to residential commercial and industrial properties The County is the primary coordinating agency for disaster response and extraordinary unbudgeted expenses are required to respond to such a situation Resources are needed to pay for extended work hours for Sheriffrsquos deputies and other emergency first response personnel and to operate emergency shelters and the emergency communications center Public works crews and equipment and possibly private contractors are needed to repair storm damage Debris removal funding may be required if solid waste resources are not available Since storms may vary greatly in their impact it is not possible to predict the exact amount which would be required
Pinellas County Budget Forecast FY2014-2023 E-11
GENERAL FUND
Ten-Year Forecast Key Assumptions ndash Revenues For the purposes of the forecast it is assumed that the General Fund millage rates for both countywide and MSTU purposes will remain the same as the rates for FY2013 The FY2013 countywide millage rate is 50105 mills and the MSTU rate is 20857 mills As explained in the Key Forecast Assumptions section of this document the forecast is that taxable values will return to positive growth of 25 in FY2014 and FY2015 In FY2016 and later years the forecast assumes an annual growth rate of 3 which is less than the 5 historical average growth which occurred in the years before the real estate boom For the State Shared Half-Cent Sales Tax we anticipate 40 growth for FY2014 and a 35 annual growth for the FY2015-FY2023 forecast period The underlying sources of State Revenue Sharing are expected to return to a pattern of moderate growth slightly less than the sales tax with an annual increase of 25 through the forecast period However as noted above the implementation of the Medicaid mandate will result in the State reducing the amount of revenue sharing funds the County receives for FY2013 through FY2017 Communications Services Tax revenue is forecast to continue a slow decline throughout the forecast period decreasing 05 per year For other revenues in the General Fund the forecast assumes flat to moderate growth which reflects the anticipated gradual economic recovery Key Assumptions - Expenditures The forecast assumes a continuation of current (FY2013) programs and service levels The basic assumptions for Personal Services and Operating Expenses that are used throughout the forecast apply to the General Fund The forecast does not assume any net additional positions However certain expenses such as electricity fuel and state-mandated Medicaid charges result in the General Fundrsquos Operating Expense growth differing somewhat from the Consumer Price Index (CPI) As discussed previously the County has no outstanding bond debt supported by property taxes or other general revenues No such bond issues are anticipated during the term of the forecast Because of the uncertain nature of non-recurring funds none are anticipated in the forecast with the exception of those estimated to be available in FY2014 and $15M per year for FY2015 through FY2017
Pinellas County Budget Forecast FY2014-2023 E-12
GENERAL FUND
No new programs funded by non-routine grants are included in the forecast The assumption is that any such expenditures will be dedicated for non- recurring purposes or will cease when the grant funds are no longer available In the recent past the Sheriff in particular has been very proactive in seeking Federal and State funding for public safety purposes that supplement but not supplant existing budgets While this is desirable and likely to continue for the purposes of the forecast these unpredictable expenses and their offsetting revenue are not included Several capital improvement projects are expected to impact operating expenditures when completed These projections have been incorporated into the forecast For example several energy conservation projects currently in progress are anticipated to reduce future ongoing utilities costs Conversely completion of the Lake Seminole Alum Injection project will place additional demands on General Fund resources As specific increased needs are identified to the extent possible these new demands will be accommodated within existing budgets Key Results The forecast projects that in FY2014 recurring expenditures will exceed recurring revenues in the General Fund by an estimated $121M The gap for FY2014 can be closed on a one-time basis by using the resources available in the Service Level Stabilization Account in accordance with the plan approved by the Board However a structural gap of approximately $15M increasing to $60M would remain throughout the forecast period without action to address this ongoing problem
Pinellas County Budget Forecast FY2014-2023 E-13
GENERAL FUND
Forecast Budget Gap
Without Corrective Action 2014 2015 2016 2017 2018 2019 2020 2021 2022 2023
($14M) ($177M) ($208M) ($251M) ($282M) ($338M) ($390M) ($432M) ($503M) ($575M)
Potential Risks REVENUE FACTORS Taxable Values There are many factors that can alter the ten-year forecast of the General Fund The primary concern due to this fundrsquos reliance on property taxes for a significant portion of revenue is the performance of the real estate market The timing of the valuation of property for tax purposes is important The FY2014 values to be certified on July 1 2013 will reflect the market conditions through the end of the 2012 calendar year Therefore increases or decreases in value after January 1 2013 will not impact the FY2014 tax base A change of 1 in the FY2013 countywide taxable value would result in a $26M change in revenue at the FY2013 millage rate of 50105 Similarly a change of 01 mills in the rate using the FY2013 taxable value would result in a $52M change in revenue In the following years these impacts would be amplified by the other growth factors Save Our Homes Impact Another variable is the homesteaded taxable value increase cap imposed by the Save Our Homes amendment which is based on the annual change (December to December) in the Consumer Price Index Under ldquonormalrdquo circumstances as homesteaded properties represent about 35 of the total countywide taxable value a change of 1 in the CPI (positive or negative) at the current millage rate would produce a change in revenue of approximately $1M Because of the decline in market values the amount of value that is shielded by Save Our Homes has been greatly reduced As the real estate market returns to a pattern of growth Save Our Homes will limit the amount of the increased value that is subject to property taxes Potential Property Tax Exemptions The major proposed amendments to the State Constitution related to property taxes on the November 2012 general election ballot were defeated but it is conceivable that one or more of them will be revisited in the future Amendment 11 would have authorized the Legislature to allow local governments to increase exemption amounts for low-income seniors who have maintained permanent residency for at least 25 years The Legislative staff estimated that this would have had a negative impact on local government revenues of more than $9M statewide beginning in FY2015
Pinellas County Budget Forecast FY2014-2023 E-14
GENERAL FUND
Amendment 10 would have increased the amount of the tangible personal property exemption from $25000 to $50000 The Legislative staff estimated that this would have had a negative impact on local government revenues of more than $20M statewide beginning in FY2014 Amendment 4 included three proposed expansions of property tax exemptions The first would have reduced the cap on the annual change in taxable values for non-homesteaded property from 10 to 5 The second would have allowed the Legislature to eliminate the ldquorecapture rulerdquo and prevent the assessed value of a property from increasing when its market value declines even if the assessed value is less than the market value The third would have granted an additional initial homestead exemption of 50 of market value to homeowners who had not had a homestead exemption in Florida in the previous 3 years The Legislative staff estimated the cumulative impact of the proposals would have been a revenue loss to local governments of nearly $1 billion statewide by FY2016 The Florida Association of Counties estimated the potential revenue loss for Pinellas County at $37M in FY2014 growing to $127M annually by FY2017 Other new exemptions as well as revenue and expenditure caps have been discussed and their passage in future legislative sessions or referendums would have negative revenue impacts as well Annexations In the unincorporated area the property tax base and revenue in the MSTU would be affected by annexations or by the creation of new municipalities If a significant reduction in the tax base occurs costs could be spread across a much smaller population There are two basic methods of annexation in Florida annexation by referendum and voluntary annexation According to a Pinellas Planning analysis from FY2001 through FY2011 approximately 8000 acres representing $12 billion in taxable value was removed from the MSTU through these processes Annexation activity both referendum and voluntary was significantly lower during fiscal years 2008 through 2011 than in the previous seven years As property values begin to rise again there may also be an increase in proposed annexations A thorough reevaluation of the scope and delivery methodology for MSTU services would be required if these changes reach a tipping point in the economies of scale Economic Conditions The three other major revenue sources ndash Sales Tax Revenue Sharing and Communications Services Tax - are highly sensitive to economic conditions If the economy improves collections could be higher than anticipated as disposable income increases The reverse would be true if the economic recovery stalls or deteriorates into a new recession The Sales Tax is highly sensitive to economic conditions If consumer confidence does not continue to improve consumption will not grow at the moderate pace assumed in the forecast The University of Floridarsquos Consumer Confidence Index was down slightly in November and December 2012 from its post-recession peak of September and October possibly due to media attention on the looming federal ldquofiscal cliffrdquo The 35 to 40 annual growth in the Sales Tax
Pinellas County Budget Forecast FY2014-2023 E-15
GENERAL FUND
forecast for FY2014 generates about $13M to $18M in additional revenue each year which would be impacted by variations from the anticipated economic recovery assumptions The forecast assumes that the sources tied to Revenue Sharing will grow at 25 per year a rate slightly less than the growth in Sales Tax However as mentioned previously the Statersquos implementation of the Medicaid mandate which holds back funds for the ldquobacklogrdquo of Medicaid billings means that the County will receive less than the full amount for the next several fiscal years This illustrates the point that there is no Constitutional prohibition against the State changing the formula to reduce or eliminate this revenue source unless the funds have been committed for debt service (which is restricted to 50 of the prior yearrsquos proceeds) Pinellas has no Revenue Sharing pledged to support debt and the entire allocation is subject to revision by the Legislature State Budget Impacts For the fourth year in a row the State faced a significant budget gap for its FY2013 budget Current projections for the Statersquos FY2014 budget are more positive but upcoming budget cycles will continue to be challenging given the reliance on sales taxes as the Statersquos primary revenue stream In dealing with upcoming State budget gaps the Legislature may continue to reduce the amount of revenue it shares with local governments or cost shift more state responsibilities to the counties and cities The Medicaid mandate is only the most recent example of this tactic Previously for example effective in July 2005 the countiesrsquo share of sales tax and revenue sharing revenues was decreased in response to the implementation of Article V Section 7 court funding reforms These formula changes can have serious impacts on the General Fund A 10 cut in the Sales Tax formula would reduce revenues by over $38M Similarly there has been repeated pressure from the telecommunications industry to reduce the scope of services that are subject to the Communications Services Tax (CST) The 2012 Legislature approved a bill subsequently signed by the Governor which will have a negative statewide impact on local CST revenues of more than $25M A State commission is currently studying the CST to recommend further structural changes that may lead to even greater reductions in revenue The cumulative negative impact of these changes is undetermined at this time Limiting Factors A cautionary note for long-term planning relates to the scarcity of undeveloped land in Pinellas County We will see relatively fewer new residents in the future compared to other counties with more opportunities for expansion Because the distribution formulas for both shared sales taxes and revenue sharing are partially based on population Pinellas will represent a declining percentage of the state total and therefore the percentage of these revenues will decline also For example in the 2000 Census Pinellas represented 58 of the Statersquos 16 million residents By the 2010 Census Pinellasrsquo population remained virtually the same while the State population grew to 188 million As a result Pinellas represented 49 of the Statersquos population
Pinellas County Budget Forecast FY2014-2023 E-16
GENERAL FUND
in 2010 Although the slowing of overall population growth in the State will delay the effect some erosion will result for those grants and other revenues that are allocated by population-driven formulas EXPENDITURE FACTORS Inflation On the expenditure side of the equation the Consumer Price Index is a key element For consistency the CPI changes used in the forecast are those produced by the State of Floridarsquos National Economic Estimating Conference It should be noted that this is a consensus process which involves the Legislature the Governorrsquos Office and the Statersquos Division of Economic and Demographic Research The intent is to produce a professional nonpartisan basis for development of the Statersquos budget that melds a variety of perspectives and therefore does not necessarily reflect any one participantrsquos economic model Historically although inflation was as high as 125 in 1981 in the years from 1989 to 2008 the change in the CPI averaged about 3 The true inflation rate will have a significant effect on future requirements For example an increase of 1 in the CPI if applied to all FY2013 recurring costs would require an additional $5M in expenditures A change of 1 in the salary and benefits assumptions would produce a cost variance of $3M and an increase in the inflation rate of 1 would result in a $2M change in operating expenses in FY2014 and would trigger escalating impacts going forward Operating expenses have been assumed to generally follow the CPI inflation rate but costs such as fuel and electricity are subject to unforeseeable variations and could impact this scenario Florida Retirement System Because salaries and benefits are such a significant part of General Fund expenditures higher than projected FRS contribution rates or health insurance cost increases could have significant negative impacts The FRS bill approved in 2012 tentatively establishes increased rates for the State 2014 fiscal year (July 1 2013 to June 30 2014) to address the systemrsquos unfunded liability These rates are subject to change in next yearrsquos legislative session The forecast assumes that the State will increase rates significantly to address the unfunded liability over the next four years rather than all at once as contemplated in the 2012 legislation because increases in these rates also have negative impacts on the budgets of State agencies and the school districts After reaching a fully funded level the rates should stabilize but there is a large degree of uncertainty in that the Legislature and Governor have demonstrated that they are willing to make major structural changes to the pension system In addition to this general uncertainty the requirement for employee contributions to FRS had been challenged by a lawsuit filed on behalf of public employees by several labor organizations On January 17 2013 the Florida Supreme Court issued its ruling in this case which upheld the employee contribution requirement This avoided potential increases to employer contributions which could have negatively impacted personnel costs
Pinellas County Budget Forecast FY2014-2023 E-17
GENERAL FUND
Health Insurance Health insurance costs are impacted by inflation and also by the package of benefits offered The extent to which the ratio of active employees to retirees changes will also impact the Countyrsquos employer contributions to the health plans An additional unknown is the effect of Federal health insurance reform on costs and services including any related mandates to programs such as Medicaid Unfunded Mandates No new State or Federal mandates have been included in the forecast As the State deals with its budget problems there is likely to be growing pressure to push expenses down to local governments even while imposing more restrictions or rollbacks on local revenues The 2012 Legislaturersquos Medicaid mandate illustrates this point Theoretically Article VII Section 18 of the Florida Constitution has a prohibition against imposing unfunded mandates on counties and cities In practice the Legislature can avoid this prohibition in many ways through exemptions (such as mandates to enforce criminal laws) or exceptions including declaring that the mandate ldquofulfills an important state interestrdquo and is approved by a 23 vote of both the Senate and House According to a report prepared by the Legislative Committee on Intergovernmental Relations in 2009 alone the Legislature enacted 25 laws containing 74 provisions that imposed mandates on counties and municipalities
Balancing Strategies One of the key financial strategies employed over the past three years has been the creation of a Service Level Stabilization Account (SLSA) in the General Fund The SLSA represents non-recurring funds generated by taking reductions in FY2010 2011 and 2012 over and above what was necessary to balance the budget A total of $286M was accumulated in the SLSA for this purpose The SLSA is being used to cover estimated shortfalls in the General Fund in FY2013 and FY2014 The SLSA helps provide flexibility in the budget to avoid making reductions to the point where revenues bottom out and allows us to bridge to a time when the budget has stabilized and begins to improve Because it is a non-recurring funding source it is very important that we carefully monitor the structural balance of the General Fund as the SLSA is spent down Assuming that the balance in the SLSA is drawn down in FY2014 there are several balancing strategies that could be considered to address the ongoing structural gap in revenues and expenditures Expenditure reductions are an option to be considered The efforts to find efficiencies and streamline operations will continue to be pursued Due to reductions over the last five years General Fund costs have been reduced to the point that any further cuts would directly impact the continuation of programs as well as service levels Between FY2007 and FY2011 reductions
Pinellas County Budget Forecast FY2014-2023 E-18
GENERAL FUND
of over $182 million were made in General Fund agencies and budgeted positions decreased by 1618 or 25 An additional $183 million in budget reductions were taken in FY2012 As a result of these and other changes the total FY2013 General Fund budget of $556054060 is comparable to the FY2005 budget of $556059420 Revenue increases are another option The County is currently collecting less than the maximum allowed majority-vote property tax revenue In 2007 the Legislature enacted new limitations on property tax revenue increases for local governments Super-majority votes of the Board are required if proposed property tax revenue exceeds caps based on the average growth in Florida personal income and new construction The caps went into effect beginning in FY2009 using the FY2008 level of property tax revenue as the base As shown in the chart below capacity under the cap has increased as property tax revenues have decreased There is currently a wide spread between the FY2013 millage rate of 50105 and the cap limit of 83285
Another revenue balancing option is the implementation of a storm water strategy that includes a new dedicated funding source If a dedicated funding source was available approximately $31 million of storm water costs currently funded in the Municipal Services Taxing Unit (MSTU) could be freed up to create additional capacity The County does not have a wide range of other revenue options User fees can be increased but need to be considered in the context of the local marketplace and the effect on economic recovery In past budget processes both County employees and the general public identified potential revenue generating ideas In addition to increasing user fees some of these ideas include a local business tax (formerly known as occupational tax) and payments in lieu of taxes or a return on equity from enterprise funds
Pinellas County Budget Forecast FY2014-2023 E-19
GENERAL FUND
Pinellas County Budget Forecast FY2014-2023 E-20
TOURIST DEVELOPMENT COUNCIL FUND
Description The TDC Fund is a special revenue fund that accounts for the 5 tourist development tax (ie bed tax) on rents collected for temporary lodgings Section 1250104 Florida Statutes was enacted by the State in 1977 The Board of County Commissioners enacted an ordinance in 1978 to levy a 2 tax to promote tourism in Pinellas County and was approved at a referendum held on October 5 1978 In 1988 the ordinance was amended to increase the tax by an additional 1 with one-half of this amount earmarked to fund beach re-nourishment projects In January 1996 an additional 1 was levied to provide additional funds for promotional activities beach re-nourishment and to service debt on the Countys obligation to the City of St Petersburgs bonds for Tropicana Field In December 2005 an additional 1 was levied to provide funding for promoting and advertising tourism In November 2010 the Board approved an extension of the 5 tourist development tax to 2021 The forecast continues the 5 tax through FY2023 The fund supports the Tourist Development Council serving as Visit St PeteClearwater through the bed tax The bed tax is used to enhance the Countyrsquos economy by increasing tourism and direct visitor expenditures through marketing and promoting the destination
Summary The Tourist Development Council (TDC) Fund is primarily funded by tourist development taxes that are extremely sensitive to general economic conditions Tourist Development tax revenues have been steadily improving since Spring 2010 and reached record levels in FY2012 FY2013 revenues are estimated to grow 4 beyond actual receipts for FY2012 and are anticipated to continue to increase conservatively at 35 in FY2014 Beyond FY2014 projections continue to increase by 30 annually through the forecast period matching anticipated gradual growth as part of the recovery in the broader US economy The forecast for the Tourist Development Council Fund shows that the fund is balanced through the forecast period Through FY2015 more funds are available for additional advertising based on the assumption that the promotional activities budget will be adjusted to reflect any revenue increases or decreases while maintaining a 15 reserve balance Beginning in FY2016 the fund is forecast to have additional capacity once the debt service on Tropicana Field and the Dunedin Spring Training Facility is paid off in 2015 The additional capacity could be dedicated to new capital outlay as with the Board approved Salvador Dali Museum funding new debt service or to supplement the promotional activities budget In FY2010 the Board revised the Tourist Development Plan to allow funding of capital projects for non-profit museums that are open to the public The Board also approved a review of the Tourist Development Plan every five years
Revenues The TDC Fund consists almost exclusively of one primary funding source tourist development taxes
Pinellas County Budget Forecast FY2014-2023 E-21
TOURIST DEVELOPMENT COUNCIL FUND
Tourist Development Taxes Tourism is a key economic driver of the economy in Pinellas County and contributed direct and indirect visitor expenditures of approximately $73 billion during calendar year 2012 (source Research Data Services Inc) The Tourist Development Tax is projected to generate $299M in FY2013 Tourist Development tax collections are very sensitive to economic conditions due to the close relationship between disposable income and leisure travel The following chart showing a 6-month moving average of collections from October 2007 to October 2012 indicates that collections bottomed out at the beginning of 2010 but have been rapidly increasing again as the economy has begun to rebound Over the past year the rebound in tax revenue has outpaced the overall economy This chart demonstrates how sensitive tourist tax collections are to economic and other conditions and why having reserves to withstand changing conditions is necessary
In addition transient rental occupancy increased at least 2 in each month from January to September of 2012 as compared to the same one-month period in 2011 FY2012 actual revenue totaled $287M which was a 124 increase over FY2011 FY2013 revenues are projected to increase by another 40 and FY2014 by 35 From FY2015 through FY2023 collections are expected to increase 3 annually as the general economic recovery continues While recent trends may suggest a stronger rate of recovery the long-range forecast is conservative due to the sensitivity of this revenue source
Pinellas County Budget Forecast FY2014-2023 E-22
TOURIST DEVELOPMENT COUNCIL FUND
The chart below compares visitor origins tracked by Research Data Services Inc (RDS) with year-to-date figures for November 2011 and November 2012 and it shows a net overall increase of 39 Within this figure the Southeast visitor segment increased 66 and European visitors increased 74 Latin America has been added to the table as a visitor segment to track and it shows strong growth with an increase of 544 between August 2011 and August 2012
Calendar Year-to-Date through Novrsquo11 and Novrsquo12
Visitor Origins 2011 2012 Change
Florida 634689 641863 +11
Southeast 307389 327523 +66
Northeast 1115171 1151945 +33
Midwest 1456771 1481345 +17
Canada 290857 304839 +48
Europe 831904 893188 +74
Other US Markets 130519 131497 +07
Latin America 42800 66100 +544
Total 4810100 4998300 +39
Source November 2012 Visitor Profile Research Data Services Inc Latin American numbers are through August 2011 and 2012
The European visitor segment represents about 18 of total visitors tracked by RDS Although a slight recession is anticipated for the Eurozone the number of European visitors is not anticipated to decrease due to the characteristics of the market segment and increased access to the destination European visitors to Pinellas are a younger wealthier market segment generally insulated from economic cycles In addition the European market will gain increased access from additional air service providing easy access to the destination from cities throughout Europe and Germany For example in May 2012 Edelweiss Air started twice weekly non-stop flights from Tampa to Zurich Switzerland The next chart lists the Annual Average Daily Rate (ADR) that hotels are able to collect and the number of Annual Overnight Visitors since 2000 As a result of hurricanes red tide and the economic downturn ADR stayed flat from 2007 to 2010 and visitor counts declined from a peak of 53M in 2007 Since 2010 ADR and visitor counts have rebounded
Pinellas County Budget Forecast FY2014-2023 E-23
TOURIST DEVELOPMENT COUNCIL FUND
Year
Annual ADR
Annual
Overnight Visitors
2000 $7162 4700140 2001 $7416 4726161 2002 $7316 4714432 2003 $7491 4837998 2004 $7811 5077280 2005 $8432 5212435 2006 $9318 5254255 2007 $10000 5300220 2008 $10438 5193980 2009 $10171 4991410 2010 $10015 5041200 2011 $10483 5235200 2012 $11317 5435000
Source Research Data Services Inc
Expenditures The TDC Fund supports budgeted expenditures and reserves in FY2013 totaling $344M The primary expenditures in the fund are $185M for operations and promotional activities $66M for debt service for three sports facilities $37M for two transfers and $56M in reserves
Pinellas County Budget Forecast FY2014-2023 E-24
TOURIST DEVELOPMENT COUNCIL FUND
Operations and Promotional Activities The discretionary expenditure budget of $185M includes the staff operations and promotional activities that promote the St Petersburg Clearwater destination Promotional activities are primarily comprised of the advertising contract with the balance of the funding supporting such programs as sponsorships publicity and promotion via technology The promotional activities budget was increased in FY2012 due to the higher actual collections as compared to budget Sufficient revenue to support $1M in additional advertising was anticipated and appropriated in the FY13 budget The next chart from the Convention and Visitors Bureau provides allocations in the discretionary operations and promotional budget (without debt payments transfers and reserves)
Convention amp Visitors Bureau Operations amp Promotional Expense
Expenses FY 2013 of Operations
Operating amp Capital Outlay $ 821370 44
Personnel $3211630 173
AdvertisingDirect Sales $13437690 725
Research $ 235000 13
ShippingCommunicationsInquiry $ 370000 20
Travel $ 456200 25
Total $18531890 1000
Source Pinellas County Convention amp Visitors Bureau
Undesignated Over the forecast period there are anticipated available funds above the 15 reserve target that are not currently obligated The ldquoUndesignatedrdquo expenditure line in the forecast identifies the amount projected through FY2023 Capital Outlay In FY2010 the Board revised the Tourist Development Plan to allow funding of capital projects for non-profit museums that are open to the public and the Board approved an agreement that provides payments of $500K annually to the Salvador Dali Museum from FY2015 to FY2019 The Board also approved a review of the Tourist Development Plan every five years Debt Service This fund dedicates the proceeds of the 4th cent of tourist development revenue less Tax Collection expense to the City of St Petersburg to fund debt service on bonds for Tropicana Field (expires 2015) At the City of St Petersburgrsquos request ownership of Tropicana Field was turned over to the County by the City in October 2002 as the County is exempt from paying property taxes on the facility The County leases the property back to the City under terms that provide the City the same rights and responsibilities for the property that it had prior to the transfer of
Pinellas County Budget Forecast FY2014-2023 E-25
TOURIST DEVELOPMENT COUNCIL FUND
ownership This fund also pays fixed debt service in the amount of $588K for the City of Clearwaterrsquos spring training facility (expires 2021) and $298K for the City of Dunedinrsquos spring training facility (expires 2015) Transfers The TDC fund transfers half of the proceeds of the 3rd cent to the Capital Projects Fund for beach nourishment projects to support tourism and maintain property values The transfer is budgeted at $32M for FY2013 which is $05M more than the anticipated collections for this half-cent The additional amount accounts for dedicated revenue received in excess of the previous yearrsquos budget for the transfer This fund transfers $494K to the Tax Collector in FY2013 for administration and collection of the tourist development taxes This cost is approximately 17 of collections and is projected to increase by 3 per year through the forecast period Reserves On a budget basis the reserve level in this fund is currently at 16 which is slightly above the reserve level requested by the Tourist Development Council The fund reserve will serve as a fiscal shock absorber in the event tourist development tax revenues deteriorate in response to changes in economic conditions For example tourist development revenues declined dramatically in FY2002 after the September 11th terrorist attack in FY2005 as a result of multiple hurricane landfalls in Florida in FY2009 as a result of the financial crisis and most recently in FY2010 as a result of the British Petroleum (BP) oil spill In order to maintain liquidity in this fund adequate reserves need to be maintained at a minimum level of 10 This fund has several large expenditures such as debt service that come early in the fiscal year while some occur later in the fiscal year Monthly revenues usually peak during the Spring Break and Easter timeframe Since such seasonality occurs for both revenues and expenditures and the fluctuations do not occur together working capital needs are met by using reserves until the revenues are collected
Ten-Year Forecast Key Assumptions The revenue forecast for tourist development taxes reflects increasing growth in the economy with an increase of 35 in FY2014 and an annual increase of 30 through FY2023 On the expenditure side personal services are projected to increase 4 per year Promotional activities (advertising) estimates have been increased to match the increase in revenue through FY2015 Beginning in FY2016 a substantial amount of debt service will be paid off The forecast does not assume that the additional capacity will be re-authorized to service new debt or allocated to supplement the promotional activities budget It does include the additional capital outlay of $500K approved for the Dali Museum beginning in FY2015 and ending in FY2019
Pinellas County Budget Forecast FY2014-2023 E-26
TOURIST DEVELOPMENT COUNCIL FUND
Note This chart reflects forecasted expenditures without the ldquoUndesignatedrdquo amount
Key Results The forecast for this fund from FY2013 to FY2015 shows that revenues and expenditures are in-line while the fund maintains at least a 15 reserve Beginning in FY2016 revenues exceed expenditures by a wide margin as the debt service for Tropicana Field and the Dunedin Spring Training Facility is paid off Even with the Board approved capital outlay to support the Dali Museum for $25M from FY2015 through FY2019 revenues will continue to exceed expenditures The decision point in FY2016 will be whether to continue to use this portion of the proceeds from the 4th cent of tourist development for debt service on sports facilities or use it for other approved tourism development purposes such as promoting and advertising the St PetersburgClearwater destination
Potential Risks There are many impacts that can alter the ten-year forecast of tourist development tax collections The primary concern is the strength of the national economy due to the sensitivity of collections to economic conditions If the economy improves collections could be higher than anticipated as disposable income increases The reverse would be true if the economy deteriorates Increases in fuel costs are also a factor for visitors driving to Pinellas County In the past an increase in hurricane activity has had a negative effect on tourism as have red tide outbreaks in Tampa Bay The appreciation or depreciation of the US dollar also has an impact on the number of international visitors to Pinellas County
Pinellas County Budget Forecast FY2014-2023 E-27
TOURIST DEVELOPMENT COUNCIL FUND
The possibility of offshore drilling in Floridarsquos Gulf Coast could discourage tourism due to the potential negative ecological effects of that industry
Balancing Strategies The forecast does not show any structural gaps in revenues and expenditures as the fund is balanced through the forecast period The assumption is that the promotional activities budget is increased or decreased to match the tourist development tax revenue stream The additional capacity forecast beginning in FY2016 may be applied to newly approved debt service or to other authorized tourism promotion and development activities
Pinellas County Budget Forecast FY2014-2023 E-28
TRANSPORTATION TRUST FUND
Description
The County Transportation Trust Fund is a special revenue fund required by Florida Statute 336022 to account for revenues and expenditures used for the operation and maintenance of transportation facilities and associated drainage infrastructure Activities include road and right-of-way maintenance (eg patching mowing) bridge maintenance and operation traffic engineering traffic signal operation including Intelligent Transportation Systems traffic control signage and striping sidewalk repair and construction and maintenance of ditches culverts and other drainage facilities Resources to support these activities are provided from gas taxes collected and distributed on a shared basis to all Florida Counties by the State of Florida and local option gas taxes levied by the County There are two local option taxes that have been imposed by the Board of County Commissioners The most recent was a one cent levy (referred to by statute as the ldquoNinth Centrdquo) beginning January 2007 dedicated to the installation operation and maintenance of advanced technological traffic signal and messaging systems (Intelligent Transportation Systems) The other local levy is a six cents per gallon tax that is shared by interlocal agreement between the County and all municipalities within Pinellas County The Countyrsquos share of collections is 60 of total receipts and the municipalities each receive portions of the remaining 40 The interlocal agreement will expire in 2017
Summary
The Transportation Trust Fund is primarily funded by state and local fuel taxes and has been impacted by a downturn in collections due to the recessions effect on the number of miles driven and gallons of fuel sold Because of the built out nature of Pinellas County more efficient cars and fuel conservation efforts as well as State law that does not allow indexing fuel taxes for inflation future revenue is projected to continue its slow decline and not keep pace with inflationary increases for expenditures in this fund The forecast for the Transportation Trust Fund indicates that the fund is not in balance beginning in FY2013 resulting in a depletion of fund balance by FY2018 This imbalance primarily results from inflationary pressures on expenditures coupled with the projected reduction in gas tax collections that are based upon the volume of fuel By FY2017 action will need to be taken to manage this future gap such as potential revenue transfers from the General Fund imposition of additional local option gas taxes or reductions in current service levels
Revenues The Transportation Trust Fund consists mainly of three primary funding sources State shared gas taxes ($92 million) a six cent per gallon local option gas tax ($126 million) and a one cent per gallon gas tax (the ldquoNinth Centrdquo) earmarked for the Advanced Traffic Management System Intelligent Transportation System ($37 million) The remaining revenues of the fund include interest and other miscellaneous revenues such as reimbursements from other governments for the Countyrsquos work on municipal and state traffic signal systems
Pinellas County Budget Forecast FY2014-2023 E-29
TRANSPORTATION TRUST FUND
State Shared Gas Taxes This resource is the equivalent of three cents per gallon on motor fuel collected statewide then redistributed to Florida Counties by a formula related to population geographic area and local collections The amount of revenue is driven by the gallons of fuel used and is therefore sensitive to economic activity such as commuting and tourism trips or increases in the price of oil that might reduce demand for gasoline usage The move toward more fuel efficient cars also has an effect in offsetting any population growth that might result in more vehicle trips As a result state shared gas taxes as well as the other gas taxes are anticipated to continue to slowly decline over the forecast period Six Cent Local Option Gas Tax (LOGT) This resource is a six cent per gallon tax on all motor fuel sold within the County including diesel The proceeds are shared with the municipalities through an interlocal agreement stipulating that the County retains 60 of monthly collections and municipalities sharing the remaining 40 Ninth Cent Gas Tax This resource is a one cent per gallon tax on all motor fuel sold within the County including diesel Unlike the Six Cent Local Option Gas Tax the proceeds are not shared with the municipalities This gas tax funds the creation and maintenance of the Advanced Traffic Management SystemIntelligent Transportation System in the county Transfers A transfer of $15 million per year from the General Fund to the Transportation Trust Fund is budgeted beginning in FY2013 to support ongoing operating costs that were reassigned to this fund based on an analysis of the allocation of Department of Environment and Infrastructure expenditures
Expenditures The Transportation Trust Fund supports expenditures totaling approximately $304 million Transportation Programs These expenditures include staff and operating expenses to maintain and operate the Countyrsquos traffic controls bridges roads and associated drainage systems Key program expenditure areas include mowing County right-of-way and ditch maintenance activities ($67 million) traffic signal and traffic control activities ($74 million) and bridge and concrete structures maintenance ($58 million) Intelligent Transportation Systems As a part of improving traffic signal and traffic control activities the County is actively pursuing technological improvements to improve the flow of traffic in Pinellas County This activity is tied to the Ninth Cent gas tax resource and is being focused on high priority traffic corridors in order to size the program to available resources The current operating expenses for this program are approximately $12 million The balance of the available funds are transferred to the Capital Projects Fund
Pinellas County Budget Forecast FY2014-2023 E-30
TRANSPORTATION TRUST FUND
Capital Improvement Project Impacts Some capital improvement projects have the potential to require increased operating expenditures when completed Beginning in FY2014 the forecast includes estimated operating expenditures to support completed capital improvement projects Transfers Since the inception of the Ninth Cent gas tax a transfer takes place annually from the Transportation Trust Fund to the Capital Projects Fund This transfer pays for the installation of capital structures needed to implement the Intelligent Transportation System such as traffic signal controllers fiber optics cameras and message boards Depending upon available revenues after deductions for operating expenses an average of approximately $25 million is transferred annually to the Capital Projects Fund to match state and federal grants available to implement the system on major County and State road corridors Reserves The budgeted FY2013 reserve level of $122 million in the Transportation Trust Fund is approximately 29 which is higher than the 5-15 reserve level budget policy adopted by the Board This is the result of savings gained through recent budgetary reductions and efficiency initiatives The reserve also includes the fund balance previously carried in the Local Option Gas Tax fund which was merged into the Transportation Trust Fund in accordance with new accounting standards (GASB Statement 54) for FY2012 This reserve level is gradually being reduced as expenditures exceed revenues
Ten-Year Forecast Key Assumptions As discussed the main revenue sources for this fund are state shared gas taxes and local option gas taxes The ten-year forecast assumes that the current six cent local option gas tax levy will be extended beyond its current expiration year of 2017 The ldquoNinth Centrdquo levy is in effect until year 2026 Revenue growth assumptions have been based on the States Revenue Estimating Conferences forecast of gallons of motor fuel pumped annually in Florida The Statersquos annual average growth rate is 19 These taxes are based on gallons pumped and not fuel prices Pinellas Countyrsquos built-out condition and the likelihood of future mandated vehicle fuel efficiency standards leads to this forecast assuming a continuing gradual decline in gas tax revenues Based on the historical and future reduction patterns current gas tax revenues are not predicted to keep up with projected inflationary expenditure demand on transportation operation and expenditure needs
Pinellas County Budget Forecast FY2014-2023 E-31
TRANSPORTATION TRUST FUND
Key Results Beginning in FY2013 Transportation Trust Fund expenditures exceed revenues throughout the forecast period which causes a gradual erosion of fund balance until the fund assumes a negative cash position in FY2018 By FY2017 potential revenue and expenditure options will need to be implemented to keep the fund in balance
Potential Risks Impacts on this forecast include macro-economic conditions such as increases or decreases in the price of oil that could affect demand for motor fuel Changes in the price of commodities such as concrete and asphalt could also affect the expenditure side of this forecast as the Transportation Trust Fund activities utilize large amounts of physical commodities An unanticipated increase in fuel conservation efforts an increase in electric vehicles or mass transit efforts could also affect the outer years of this forecast In addition a decision to not extend the current six cent local option gas tax levy would have a major impact (more than $12 million) on this analysis
Pinellas County Budget Forecast FY2014-2023 E-32
TRANSPORTATION TRUST FUND
Balancing Strategies Major strategies to manage the forecasted gap in revenues versus expenditures include a continuation of actions to reduce future costs on the expenditure side transfer of General Fund revenue to support transportation activities or the imposition of additional local option gas taxes From an enhanced revenue standpoint the County has authority to impose an additional five cents tax per gallon of fuel sold within the County however by statute proceeds realized would have to be shared with municipalities Diesel fuel is not subject to this tax The Countyrsquos estimated share of one cent of this local option gas tax is now approximately $19 million which is 60 of the $32 million in proceeds which would be generated countywide
1 cent 2 cents 3 cents 4 cents 5 cents $19M $38M $57M $76M $95M
For comparison purposes other Florida Counties that impose greater local option taxes than Pinellas Countyrsquos seven cents are shown in the following table
Counties Imposing Local Option Taxes Greater
than Seven Cents
Cents Imposed
Alachua 12 Broward 12 Charlotte 12 Citrus 12 Collier 12 DeSoto 12 Hardee 12 Hendry 9 Hernando 9 Highlands 12 Lee 12 Manatee 12 Marion 12 Martin 12 Miami-Dade 10 Monroe 10 Okeechobee 12 Palm Beach 12 Polk 12 Putnam 12 St Lucie 12 Sarasota 12 Suwanee 12 Volusia 12
Source 2012 Local Government Financial
Information Handbook - October 2012
Of Floridarsquos 67 counties
24 levy more than 7 cents 27 including Pinellas Pasco and Hillsborough levy 7 cents 16 levy less than 7 cents
Pinellas County Budget Forecast FY2014-2023 E-33
TRANSPORTATION TRUST FUND
An additional one to five cents is not likely to have a measurable impact on the sale of fuel as normal price differences and fluctuations routinely exceed this amount For this reason there would be little incentive for consumers to redirect their fuel purchases to Hillsborough or Pasco counties if they maintain their current seven cent fuel tax rates The additional five cents may be used for the construction of new roads the reconstruction or resurfacing of existing paved roads the paving of existing graded roads or other expenditures that are needed to meet immediate local transportation problems or are critical for building comprehensive roadway networks Routine maintenance of roads is not considered an authorized expenditure The additional one to five cents could be levied by a majority plus one vote of the Board or by approval in a countywide referendum Another balancing option is the implementation of a storm water strategy that includes a new dedicated funding source If a dedicated funding source was available storm water costs currently funded in the Transportation Trust Fund could be freed up to create additional capacity
Pinellas County Budget Forecast FY2014-2023 E-34
CAPITAL PROJECTS FUND
Description The Capital Projects Fund is used to account for all the governmental capital projects throughout the County Such projects include roads bridges drainage beach nourishment park development and construction of facilities necessary to provide County services
Summary The Capital Projects Fund is used to account for all governmental capital projects throughout the County This fundrsquos primary revenue source is the ldquoPenny for Pinellasrdquo one cent local option sales tax that is very sensitive to general economic conditions Penny tax revenues declined for several years instead of increasing at the original projected rate due to the recession but are predicted to increase gradually during the forecast period matching general economic growth as part of the recovery in the local state and national economy The forecast for the Capital Projects Fund shows that the fund is balanced over the forecast period During several years of the forecast expenditures exceed revenues due to project schedules Additional cash flow necessary in the first half of the ten-year period is being addressed through an interfund loan from the Solid Waste Replacement amp Renewal Fund The forecast includes repayment of the loan from FY2013 to FY2020
Revenues The major revenue components of the Capital Projects Fund are the Penny for Pinellas Grants and Transfers from Other Funds
Local Option Sales Tax (Penny for Pinellas) Penny for Pinellas revenues are proceeds of an additional one cent Local Government Infrastructure Surtax on Sales pursuant to Section 212055(2) Florida Statutes imposed in Pinellas County The authorized use of these funds is generally restricted to infrastructure projects only and cannot be used for ongoing operation and maintenance costs The Penny became effective February 1 1990 for an initial period of ten years and has been extended by referendums in 1997 and 2007 for two additional ten year periods (until 2020) In accordance with statutory requirements and interlocal agreements with each municipality in Pinellas County the County receives approximately 523 of the total monthly collections generated by this tax following the deduction of a dedicated amount for countywide use in improving Court and Jail facilities The Penny for Pinellas is the primary source of revenue supporting the Countys Capital Improvement Program Sales tax as a revenue source is highly elastic and is very sensitive to local and national economic conditions such as inflation wage growth unemployment and tourism Normally sales taxes increase with economic activity and inflation but reflecting the depth of the recent recession collections declined about 15 from FY2007 to FY2009
Pinellas County Budget Forecast FY2014-2023 E-35
CAPITAL PROJECTS FUND
Collections increased in FY2010 and FY2011 due to the transition to the new revenue distribution formula that began in February 2010 and results in a higher percentage of collections going to the County primarily due to the increase in the Courts amp Jail amount from $80M to $225M over the ten year period The revenue increase to the County is misleading as the underlying Penny revenues actually decreased in FY2010 and FY2011 In FY2013 and FY2014 the Penny is anticipated to increase 35 which is consistent with the general improvement in the economy The chart below shows the fluctuation in annual growth rates experienced since FY2000
Grants The second largest sources of revenue in the Capital Projects fund are grants The FY2013 budget includes $327M in local state and federal grants from agencies like the Southwest Florida Water Management District and the Florida Department of Transportation Grant revenues are highly variable over the forecast period The forecast only includes grants that either have been awarded or are highly anticipated to be awarded
Transfers from Other Funds The Capital Projects Fund also receives several transfers from other funds to cover or contribute to costs for specific capital projects
Pinellas County Budget Forecast FY2014-2023 E-36
CAPITAL PROJECTS FUND
The FY2013 and FY2014 Budgets include a transfer of $175M and $450M respectively from the Solid Waste Renewal and Replacement Fund as part of the interfund loan to the Capital Projects Fund On September 21 2010 the Board approved a resolution authorizing an interfund loan amount of up to $85 million in lieu of a $150M bond issue originally planned to finance key projects in the 2010 to 2020 Capital Project Fund The outstanding principal in FY2013 will be $325 million (including the FY2013 loan amount of $175 million) The annual rate of interest is a variable rate which is currently less than 1 Payments on outstanding loan principal are required to begin no later than FY2016 and the loan shall be paid in full no later than December 31 2019 The benefits of an interfund loan versus bonding include lower borrowing costs no reserve requirements interest accrues to a county entity and more flexibility in the implementation and terms of the loan The loan is being tracked separately for the Centralized Chiller Facility project vs the cash flow needed for capital projects in total The loan amount for capital projects consists of $15 million in FY2010 $100 million in FY2013 and $45 million in FY2014 The principal payments for the $70 million loan for capital projects is budgeted for FY2015 ndash FY2020 The loan amount for the Centralized Chiller Facility project is $75 million in the FY2013 budget The principal payments for the Centralized Chiller project is budgeted for FY2013-FY2017 This project funds the construction of a new centralized chiller facility for the downtown Clearwater campus The County will purchase chilled water at a set rate based on the amount of investment towards the cost of the facility Fully funding this project is estimated to result in $507K of annual savings $38M of cost avoidance and potential revenue opportunities of $300-400K a year The total project cost is estimated at $120M of which $15M of design costs are being paid for by a federal grant from the Department of Energy and $30M was allocated from non-recurring funding in the General Fund in the FY2011 Budget The General Fund transfer in FY2013 for $18 million covers the cost of two items The first item is $300K of recurring capital costs paid for by recurring revenue from the implementation of the new parking fees at Fort De Soto Park and Howard Park Beach amp Causeway These funds will be used annually to maintain and improve the bathhouses at the two parks The second item is $15 million for the principal payment on the Centralized Chiller Facility project The FY2013 transfer of $22M from the Transportation Trust Fund (proceeds of the 9th cent Local Option Gas Tax) contributes to the cost of several Intelligent Transportation System Advanced Transportation Management System projects The FY2013 transfer of $32M from the Tourist Development Council Fund (half of the proceeds of the 3rd cent) funds beach nourishment projects in the Coastal Management area The Transportation Impact Fee Fund is used to account for Transportation Impact Fees collected throughout the County thus assuring that new development bears a proportionate share of the cost of capital expenditures necessary to meet transportation needs of the County The transfer of $16M from the Transportation Impact Fee Fund in FY2013 is to cover or
Pinellas County Budget Forecast FY2014-2023 E-37
CAPITAL PROJECTS FUND
contribute to the current or past costs of authorized transportation projects in the twelve geographic transportation impact fee districts of the county
Expenditures Expenditures in the Capital Projects Fund consist of capital project expenditures and debt service costs Capital Projects The majority of expenditures in the Capital Projects fund are for infrastructure projects in the areas of transportation storm water drainage and water quality parks environmental preservation courts jails public safety and other public facilities Planned expenditures in this fund over the forecast period cover the project allocations from the 2010 to 2020 Penny Program Please see the ldquoCapital Improvement Programrdquo section of the FY2013 Budget Message for expenditure highlights of the One-Year CIP and the Ten-Year CIP Debt Service Debt service costs over the forecast period are associated with the interfund loan from the Solid Waste Renewal and Replacement Fund The loan consists of $70M to help necessary liquidity in the Capital Projects Fund related to the acceleration of projects in the first half of the 2010-2020 Penny Program and $75M for the balance of the remaining cost for the Centralized Chiller Facility This project has already been funded $15M by a Department of Energy grant and $30 by non-recurring funds in the General Fund
Ten-Year Forecast Key Assumptions The revenue assumptions for the overall Penny sales tax are consistent with the Half-Cent sales tax in the General Fund at 40 growth from FY2014 to FY2020 However the growth rate in the Capital Projects Fund for the Penny sales tax is less at 35 growth in FY2014 and 30 growth from FY2015 to FY2020 This is because the Courts amp Jail allocation is a fixed amount that does not grow over time resulting in a slightly smaller growth rate for the Countyrsquos overall share of the Penny The expenditure assumptions for the Capital Projects Fund assume consistency with the 2010 to 2020 Penny Program allocations
Pinellas County Budget Forecast FY2014-2023 E-38
CAPITAL PROJECTS FUND
Key Results The forecast for the Capital Projects Fund shows that the fund is balanced over the forecast period During several years of the forecast expenditures exceed revenues due to project schedules Additional cash flow necessary in the first half of the ten-year period is being addressed through an interfund loan from the Solid Waste Renewal amp Replacement Fund A primary driver of cash flow is $81M of expenditures associated with the Public Safety Complex project that started in FY2012 The forecast includes repayment of the loan from FY2013 to FY2020
Potential Risks There are many impacts that can alter the ten-year forecast of the Penny tax collections The primary concern is the strength of the local economy due to the sensitivity of collections to economic conditions If the economy improves collections could be higher than anticipated as consumer activity increases The reverse would be true if the economy deteriorates There are risks of increases in major commodities used in capital project construction such as steel or concrete such as those the County experienced in 2005-2007 where prices escalated as much as 60-80 for these key materials
Pinellas County Budget Forecast FY2014-2023 E-39
CAPITAL PROJECTS FUND
Balancing Strategies The forecast for the Capital Projects Fund shows that the fund is balanced over the forecast period The assumption is that expenditures will be decreased or increased to match the Penny for Pinellas and other revenue streams that support the CIP
Pinellas County Budget Forecast FY2014-2023 E-40
EMERGENCY MEDICAL SERVICE FUND
Description The EMS Fund is a special revenue fund established by referendum in 1980 which allows up to 15 mills to be levied annually on a county-wide basis to finance the operation of a comprehensive county-wide emergency medical service system This system provides advanced life support emergency medical response and transport services to all citizens of Pinellas County The County maintains EMS contracts with 18 fire service agencies (first responders) and one ambulance provider (Paramedics Plus operating in Pinellas County under the trade name ldquoSunstarrdquo) The EMS System is funded by a combination of property taxes and ambulance user fees The ambulance user fees support the ambulance contractual expenditures and property taxes are intended to support the first responder expenditures The EMS System was established by referendum in 1980 by the Special Act (Chapter 80-585 Laws of Florida) that created the EMS Authority as a Dependent Special District In 1988 Pinellas County Ordinance 88-12 solidified the current EMS system design The Fiscal Policy guidelines within Ordinance 88-12 state that the Board of County Commissioners sitting as the Emergency Medical Services Authority directs the following fiscal policy guidelines that governs the financial operations of the Countyrsquos EMS system (a) to establish sound business controls and long term cost containment incentives throughout the County EMS system (b) to provide adequate funding to upgrade all EMS components to state-of-the-art-levels and to maintain that progress in future years (c) to provide for long term financial stability sufficient to sustain quality EMS operations far into the future (d) to reduce the County EMS systemrsquos excessive dependence upon local tax support by developing a more balanced approach to EMS funding and (e) to provide the Board of County Commissioners with a wider range of EMS financing options than have been available in the past
Summary The Emergency Medical Service (EMS) Fund is sensitive to property values as it is funded by ad valorem (property) tax revenue collected from property owners countywide and ambulance user fee revenues Property tax revenues have declined dramatically in recent years due to a downturn in property values and statewide legislation The forecast for the EMS Fund indicates the fund is not balanced over the forecast period On the revenue side the FY2013 Adopted Budget included an increase of 00652 or 77 in the countywide EMS millage rate from 08506 to 09158 With this increase the EMS budget maintains the status quo with respect to level of service and the delivery system The millage increase is not enough over the forecast period to fund the system and maintain the fundrsquos reserve at 25 pursuant to Board policy adopted by ordinance The forecast estimates the reserve at 252 in the FY2013 ending fund balance The estimated percentage decreases to 203 at the end of FY2014 and 130 by the end of FY2015 if the tax rate is not increased again or expenditures are not significantly reduced Though this level is improved from the last forecast expenditures in the EMS Fund are still projected to exceed revenues by an increasing amount each year from FY2013 through FY2023 In FY2016 the projected reserve drops below 4 This leaves approximately $4M in the fund balance for the projected $12M deficit in FY2017
Pinellas County Budget Forecast FY2014-2023 E-41
EMERGENCY MEDICAL SERVICE FUND
Future expenditure savings will be addressed with the results of an operational study and accounting study that are underway to analyze variations of EMS service under consideration for Pinellas County In late 2011 the Pinellas County Legislative delegation created an EMS Fire Transport Special Committee to select a nationally recognized firm that would operationalize analyze and compare costs for three variations of EMS service 1) the current EMS system 2) the system as proposed in the Integral Performance Solutions Study and 3) the Sanford-Millican proposal for fire based transport The current ambulance service contract is in effect through FY2014 with a one year extension option First responder contracts are currently funded based on actual first responder costs as defined in Board Resolution 09-38 It is expected that a combination of revenue increases and expenditure savings will be needed to make up for deficits in prior years and increase reserves to a sustainable level throughout the forecast period
Revenues The primary funding sources for the EMS Fund are ambulance user fees and property taxes Ambulance User Fees The ambulance service user fees provide funding for the ambulance program which includes the ambulance provider (Paramedics Plus) contractual expenditures ambulance billing costs and ambulance program support costs Ambulance user fees are based on transport volume and transport charges An average retail rate charge is $620 per transport The County bills Medicare Medicaid private insurance and various other payors for transport service Billing for the service is done by Pinellas County The collection rate is currently about 70 (net of MedicareMedicaid non-allowable charges) of billing for the transport service The County handles transports for non-emergencies and mental health transports as well The County utilizes the 9-1-1 System to dispatch calls for the proper response to the call Ambulance user fee revenue is projected to reach $446M in FY2013 and then increase by 2 annually over the forecast period The Board of County Commissioners has the authority to increase ambulance user fees as necessary In addition Board Resolution 89-208 calls for an automatic increase in user fee rates by the percentage increase in the medical consumer price index for the previous year until the prudent reserve level is reached (25) The retail rate increased 33 in FY2012
The County also offers an ambulance user fee membership program that citizens can join to minimize the cost of EMS transports Membership revenue is projected to generate $200K per year through the forecast period
Property Taxes Property taxes are used to fund the first responder program Property tax revenues have decreased significantly since FY2008 due to legislative rollbacks the passage of Amendment One the decline in the real estate market and the recession
Pinellas County Budget Forecast FY2014-2023 E-42
EMERGENCY MEDICAL SERVICE FUND
The EMS millage rate is a county-wide millage rate that remained flat at 05832 from FY2008 through FY2011 During this period ad valorem revenue decreased each year from $426M in FY2008 to $306M in FY2011 The Board of County Commissioners has the authority to increase or decrease the millage rate and in FY2012 the millage rate was increased to 08506 This resulted in Ad Valorem revenues recovering to $422M and finishing FY2012 with a net gain in revenues over expenditures For FY2013 a millage rate of 09158 was approved in order to balance the budget and approach a beginning balancereserve of 25 (level set by County Ordinance approved by the Board on December 20 2011) The millage cap for this revenue is 15000 mills and the rollback rate for FY13 was 08698 With the millage increase tax revenue increased $21M from actual FY2012 to estimated FY2013 but the EMS Fund is still projected to use $09M from the fund balance Without another millage increase or significant expenditure reductions in the next two years the fund balance continues to decrease each year until it is depleted in FY2017
Emergency Medical Service Fund
Ad Valorem Revenue amp Millage History
Fiscal Year Millage Budget $ (000s)
2013 09158 $ 438
2012 08506 $ 416
2011 05832 $ 300
2010 05832 $ 336
2009 05832 $ 383
Note Budget figures are at 95 of revenue
Expenditures The Emergency Medical Service Fund supports budgeted expenditures in FY2013 totaling $906M for its operations The primary expenditures in the fund are $382M for payments to the ambulance contractor $402M for contractual payments to the eighteen first responders $13M for transfers to the Property Appraiser and Tax Collector $107M in program support and billing of ambulance claims and $200K in the Trust Fund Grant The reserve is estimated at $219M for FY2013 which is $5M above the budgeted level due to a combination of FY2012 actual revenues being $3M higher and actual expenditures being $2M lower than budget The reserve is still projected to decline as expenditures exceed revenues through the forecast period Ambulance Contractor Payments The County contracts with Paramedics Plus for the Countyrsquos SUNSTAR ambulance system Contracts with the Countyrsquos ambulance provider were renegotiated in FY2012 with an annual reduction to base service payments of $2 Million A 6 increase is included in the forecast from FY2014 through FY2023 to account for annual CPI increases and increases to transport volume However once the contract is up for negotiation expenditures may change as the economy rebounds and fuel and labor costs and other factors change
Pinellas County Budget Forecast FY2014-2023 E-43
EMERGENCY MEDICAL SERVICE FUND
First Responder Contractual Payments The County contracts with the eighteen first responder EMS providers that respond to calls using paramedics and that utilize Advanced Life Support (ALS) or Basic Life Support (BLS) equipment and personnel During FY2013 budgets submitted by the 18 agencies included an overall increase of 5 This 5 annual growth rate continues through the forecast period to FY2023 In FY2013 the first responder agreements also include an agreement of $356K to Eckerd College for basic life support water rescue EMS Program Support Costs The County incurs program support costs (Personal Services and Operating Expenditures) to support the EMS program These costs are allocated between the ambulance function and the first responder function Costs allocated to both functions include the Office of the Medical Director St Pete College training expenses communication and EKG equipment and maintenance and personnel and operating expenses to administer all contracts within the program The FY2013 Ambulance program support expenditures of $63M pay for those support items listed above and the ambulance billing function that includes a staff of 34 The FY2013 First Responder program support expenditures of $44M include those allocated support items listed above Transfers The Emergency Medical Service fund has transfers to the Property Appraiser and Tax Collector to cover the costs for collection of ad valorem revenues FY2013 costs for this function are $13M The commissions for the Property Appraiser and Tax Collector are pursuant to Florida Statutes Reserves Pinellas County Ordinance 88-12 which was amended with Resolution 89-208 authorizes the establishment of a prudent reserve equal to one-third of the annual budget for this fund On December 20 2011 the Board approved changing the prudent reserve amount to 25 Reasons for such a high reserve level include disasters such as a hurricane where a large amount of equipmentvehicles may need to be replaced quickly to sustain EMS service and enough working capital for a potential transition if contract requirements are not met by the service provider In addition this reserve level will provide cash flow needs in the event of interruptions to ambulance collections due to a disaster or a Medicare andor Medicaid audit With high monthly contractor payments it is critical cash flow needs are met With FY2012 actual revenue coming in $3M higher than budget and actual expenditures at $2M less than budget the year ended with the reserve at 28 On a forecast basis with Ad Valorem revenue at 96 and Ambulance revenues at 100 the estimated reserve level is projected at 252 for the end of FY2013 Without additional increases in the millage rate or substantial decreases in expenditures the reserves are forecasted to decline to 185 in FY2014 and 105 in FY2015
Pinellas County Budget Forecast FY2014-2023 E-44
EMERGENCY MEDICAL SERVICE FUND
The net increase in the FY2012 ending balance pushes the projected depletion of remaining reserves out to FY2017
Ten-Year Forecast Key Assumptions The EMS countywide millage is assumed to remain at the FY2013 approved rate of 09158 mills through the forecast period Taxable values should begin to recover as the economy improves and the housing market rebounds Ad Valorem tax revenue is projected to grow 25 in FY2014 and FY2015 followed by a 3 annual growth factor from FY2016 to FY2023 During the forecast period ambulance revenue user fees are estimated to increase by 20 which aligns with projected increases to transport volume First responder contractual expenditures increased 5 from FY2012 to FY2013 and are estimated to increase at 5 per year through the forecast period Contractual payments to the ambulance contractor are assumed to increase by 6 through the forecast period as contracted expenditures will increase due to increased transport volume and increases in the CPI as stipulated in the contract The County will work with the provider to negotiate the lowest possible contract while still maintaining quality service
Pinellas County Budget Forecast FY2014-2023 E-45
EMERGENCY MEDICAL SERVICE FUND
Key Results In the chart for the total EMS Fund above the forecast shows expenditures exceeding revenues over the forecast period Balance for FY2013 is achieved through the FY2013 millage rate increase and use of reserves Without another millage rate increase andor expenditure savings reserves will be exhausted after FY2016 This assumes no changes to the EMS system design
Potential Risks A major variable impacting future revenues for this fund is ad valorem revenue and taxable values As taxable values begin to rebound the opportunity for higher revenues may increase If market values grow more slowly or decline revenue would be negatively affected Another factor in future revenues will be ambulance user fee revenues The ambulance contract will be up for re-negotiation in FY2014 with potential impacts to expenditures Tourism and inflow into the local area of more visitors and residents will impact the number of users of the EMS system Continued aging of the general population (baby boomers) could result in more transport volume in the ambulance area Results from the operational study may impact future revenues and expenditures for the EMS system particularly if significant changes are made to the system design
Balancing Strategies The forecast shows that the fund is not in balance over the forecast period Future balancing strategies will be developed from information gathered in the EMS system operational study
Pinellas County Budget Forecast FY2014-2023 E-46
FIRE DISTRICTS FUND
Description In 1973 a Special Act of the Florida Legislature (Chapter 73-600 Laws of Florida) created the Pinellas County Fire Protection Authority This special legislation subsequently assumed ordinance status as Article II Chapter 62 of the Pinellas County Code The Board of County Commissioners is designated as the Fire Protection Authority with responsibility to ldquoestablish and implement a permanent plan of fire protection for Pinellas County and each of its municipalitiesrdquo and levy ad valorem taxes to fund fire protection services within these districts At present the Fire Districts Fund consists of twelve separate municipal services taxing units (MSTUs) that provide fire protection services in the unincorporated areas of Belleair Bluffs Largo Clearwater Dunedin Gandy Largo Pinellas Park Safety Harbor Tarpon Springs Seminole High Point Tierra Verde and South Pasadena These districts were formed at differing times after the electors in the affected unincorporated areas approved their creation and the levy of ad valorem taxes to fund fire protection Those Fire Districts that were created under Chapter 73-600 Laws of Florida receive compensation based on the pro rata share of the fire departmentrsquos budget in each fire district The pro rata share is allocated based on the value of real property for the unincorporated area in that district
Summary The Fire Districts Fund provides fire protection service to the unincorporated areas of Pinellas County through twelve separate dependent fire protection districts that are funded entirely by ad valorem taxes collected from property owners within these districts This fund forecast is presented in a high-level consolidated manner Budgetarily each Fire District is balanced separately Property taxes have declined dramatically in recent years due to a downturn in property values and statewide legislation As the housing market is recovering property tax revenues are forecast to increase 20 in FY2014 and FY2015 A 25 growth factor continues through the forecast period The forecast for the Fire District Fund indicates that the fund is not balanced through the forecast period Millage rates increased for five of the twelve fire districts in FY2013 The millage rate for the South Pasadena Fire District decreased substantially with a change in contracted service provider Additional increases to millages for the individual fire districts will likely be necessary to cover expenditures over the forecast period Potential millage rate increases will need to take into account the individual millage caps in each fire district
Revenues The Fire Districts Fund consists of primarily one funding source property taxes (ad valorem revenue)
Pinellas County Budget Forecast FY2014-2023 E-47
FIRE DISTRICTS FUND
Property Taxes Property tax revenues have decreased significantly over the last several years due to legislative rollbacks the passage of Amendment One the decline in the real estate market and the recession These revenues are affected by taxable values for properties in the local economy Overall property taxes are budgeted to generate $148M in FY2013 across all districts Each dependent fire district has a separate ad valorem millage rate that is the sole revenue source for each of the fire districts The next chart illustrates five of the fire districts that required an increase in millage rates in FY2013 to fund fire service provider expenditures The five districts were Clearwater Dunedin Largo Safety Harbor and Tierra Verde The millage rate for the South Pasadena Fire District was reduced from 31257 to 09137 in FY2013 as significantly less revenue was needed to fund a new service contract with the City of St Petersburg In FY2012 Public Safety Services requested provider bids for fire service to the district The lowest bid was from St Petersburg at $75000 for an annual contract over five years beginning in FY2013 This was $175000 less than the bid from the City of South Pasadena which had the annual service contract prior to FY2013
Dependent MSTU Fire Protection Districts
Ad Valorem Millage Rates amp Millage Rate Caps
Millage Rate Caps
FY13 Adopted Millage
FY12 Adopted Millage
Variance FY13FY12 Millages
Belleair BluffsLargo 50000 17320 17320 00000
Clearwater 50000 32092 26591 05501
Dunedin 50000 35525 22576 12949
Gandy 50000 22602 22602 00000
Largo 50000 35609 35133 00476
Pinellas Park 50000 23675 23675 00000
Safety Harbor 50000 27631 26800 00831
Tarpon Springs 50000 23745 23745 00000
Seminole 100000 19581 19581 00000
High Point 100000 41916 41916 00000
Tierra Verde 30000 19118 19087 00031
South Pasadena 50000 09137 31257 -22120
Pinellas County Budget Forecast FY2014-2023 E-48
FIRE DISTRICTS FUND
Each district is subject to a mandated millage cap The millage cap threshold for Belleair Bluffs Clearwater Dunedin Gandy Largo Pinellas Park Safety Harbor Tarpon Springs and South Pasadena are set at 5 mills while Seminole and Highpoint have a 10 mill cap Tierra Verde has the lowest millage cap at 30 mills which was increased by the Board from 15 mills in June 2010 to meet increasing operating expenditures The next chart shows the variation in the taxable values between unincorporated fire districts due to the composition of properties within the districts eg beach properties condominiums etc For nine of the 12 Fire Districts FY2013 taxable values decreased from the prior year due to the continued decline in the real estate market Three districts gained taxable value in FY2013 recovering some of the lost value through FY2012
Unincorporated Fire Districts
Percentage Change in Taxable Values FY20122013
Taxing Authority FY12 Taxable
Values FY13 Taxable
Values Chge
Belleair BluffsLargo 281332094 267962625 -475
Clearwater 888428781 831260703 -643
Dunedin 280773821 279367691 -050
Gandy 46246094 45444402 -173
Largo 534088892 512659658 -401
Pinellas Park 268204137 253431862 -551
Safety Harbor 63339041 64246370 +143
Tarpon Springs 168715814 164963370 -222
Seminole 2203015774 2106822294 -437
Highpoint 675532802 657217037 -271
Tierra Verde 714080020 736173857 +309
South Pasadena 99826357 101553248 +173
Consistent with the assumptions for the Countyrsquos Municipal Services Taxing Unit (MSTU) this forecast projects a 20 increase in Ad Valorem revenue for FY2014 and FY2015 From FY2016 through the forecast period this revenue is projected to increase at 25 each year for the unincorporated dependent fire districts
Expenditures The Fire District Fund supports budgeted expenditures and reserves totaling $23M for all twelve districts in FY2013 The primary expenditures budgeted in the fund are $139M for contractual payments to the municipalities and other independent agencies for fire and rescue services FY2013 budgeted reserves are $83M the FY2013 estimate increases the reserve to $9M to reflect a greater than expected FY2012 ending fund balance
Pinellas County Budget Forecast FY2014-2023 E-49
FIRE DISTRICTS FUND
Contractual Fire Payments The forecast includes an annual 40 increase for the service contracts through the forecast period Fire departments submit their operating and capital budget requests on an annual basis and after County review funding is based on the unincorporated pro-rata share of property values within the district The exception is the new contract with the City of St Petersburg for services to the South Pasadena district which is set at $75K per year for five years Administrative Costs Administrative costs from the County are allocated to each fire district based proportionately on the amount of budgeted ad valorem revenue collected This cost has decreased in recent budget years as reductions have been made to this allocation The FY2013 budget is $2645K Operating Expenses for this account reflect the Countyrsquos administrative expenses such as personal services intergovernmental charges and other operating charges that are allocated out to the twelve fire districts Transfers The Fire District fund has transfers to the Property Appraiser and Tax Collector to cover the costs of appraisals and collection of ad valorem revenues These amounts are set by Florida Statute and fluctuate with ad valorem revenue estimates FY2013 costs are estimated at $458K and the annual cost is estimated at 3 of projected ad valorem tax revenue through the forecast period Reserves The reserve level in the Fire District fund fluctuates as a whole but each fire district is evaluated individually The minimum reserve level that each district maintains is 5 reserve for contingency This is at the low end of the 5-15 reserve level budget policy adopted by the Board Several of the individual fire districts currently maintain a 5 minimum reserve including Clearwater Dunedin Gandy Largo and Tierra Verde Safety Harborrsquos contingency reserve was decreased from 10 to 5 in FY2013 which helped reduce the required millage increase Some of the districts including Belleair BluffsLargo Pinellas Park Tarpon Springs and Seminole Fire Districts maintain a 10 reserve level that serves as a buffer to shield the district from economic downturn in their area In FY2013 High Point was able to increase its contingency reserve from 5 to 8 with no increase in millage from FY2012 and South Pasadena increased from 5 to 10 In addition some fire districts set aside funds in Reserve for Future Years for long-term capital projects such as a new fire truck purchase or improvements to a fire station Districts can request these funds with the County sharing its portion of requests based on the unincorporated value of the district
Ten-Year Forecast Key Assumptions The fire district millages are assumed to remain at the approved FY2013 rates through the remainder of the forecast period for each of the districts Property tax revenue is forecasted to
Pinellas County Budget Forecast FY2014-2023 E-50
FIRE DISTRICTS FUND
increase by 20 in FY2014 and FY2015 Annual growth of 25 is projected through the rest of the forecast period as the housing market begins to rebound On the expenditure side the contractual payments to the cities are assumed to increase by 40 through the forecast period which outpaces the property tax revenues for the complete forecast period
Key Results The fire district fund is presented in a consolidated manner for all of the individual unincorporated twelve districts The chart above shows that total fund expenditures are projected to exceed revenues from FY2018 through FY2023 Specific fire districts will vary in how much operating and capital funds are requested how reserves are maintained and how fund balance is utilized So each individual district must be analyzed separately for its specific situation with revenue expenditures and reserves While overall the fund appears to be balanced until FY2018 revenues are outpaced by expenditures sooner in some of the individual fire districts Several of the districts will utilize fund balance during the forecast period to pay for long-term capital projects and current operating expenditures And as the main source of revenue in this fund is property taxes some of the unincorporated fire districts may have to increase millage rates in each budget year to keep up with expenditures
Pinellas County Budget Forecast FY2014-2023 E-51
FIRE DISTRICTS FUND
Potential Risks The major variable impacting future revenues for this fund is ad valorem revenue and taxable values As taxable values begin to rebound the opportunity for higher revenues will increase This is the main driver for increased revenues in the forecast If the districts continue to increase their operating requests at 4 per year and tax revenue grows at an estimated 25 in future years the pressure on increasing millage rates for the fire districts will continue each budget year Another potential impact is annexation of the unincorporated fire district areas As cities increasingly annex more of the available unincorporated properties area there are fewer unincorporated properties to share the burden of service costs The funding formula in most fire districts allows for the remaining unincorporated payment to decrease proportionately The exception to this practice is those Highpoint properties annexed by the City of St Petersburg Another impact to fire service costs would be increased costs of Emergency Medical Service If EMS funding is reduced by the County there is a high probability these same providers may shift those costs to their fire district budget
Balancing Strategies The forecast shows that this combined fund is not balanced through the forecast period This fund cannot be taken as a whole but each district must be looked at individually Unless the ad valorem revenue projection improves further out into the forecast the individual districts will feel pressure to increase their millage rates On the expenditure side the contractual costs from the fire service providersrsquo requests are being reviewed for continued efficiency opportunities Some of the individual districts can continue to use fund balance as long as it is available to them and as long as the minimum reserve of 5 is prudently maintained to continue funding their district personnel and operating expenditures
Pinellas County Budget Forecast FY2014-2023 E-52
AIRPORT FUND
Description In March 1941 construction started for the airport at its present site After Pearl Harbor the airport known as Pinellas Army Airfield was used as a military flight-training base After WWII many army airfields were declared surplus and turned over to cities counties and state sponsors to manage The Pinellas Army Airfield property was granted to Pinellas County by the US Government to operate as a commercial airport It was originally called the Pinellas International Airport and given the airport call letters PIE The Airport Revenue and Operating Fund is used to account for the self-supporting operations of St Petersburg - Clearwater International Airport and its surrounding land uses on the airportrsquos 2000 acres Approximately half of this property is dedicated to the airfield and supporting terminal and other facilities The remaining acreage includes the 129 acre planned development site (former golf course) a 200 acre Airport Business Center and leased industrial commercial and governmental operations All of the entire Airport property is a designated Foreign Trade Zone All activities necessary for Airport operations (eg administration operating and maintenance expense) are included in this fund Also included are airport facility capital improvements which receive federal and state grant funding of up to 95 of costs depending on the type of project with some projects funded 100 when Passenger Facility Charges are included In recognition of the quality of operations and innovative and efficient management the Florida Department of Transportation recognized St Petersburg ndash Clearwater International Airport as the 2010 Commercial Service Airport of the Year In 2011 Allegiant Airlines recognized the Airportrsquos terminal renovation project as their systemrsquos airport construction project of the year
Summary The Airport Operating and Revenue Fund is an enterprise fund that accounts for revenues and expenditures at St Petersburg ndash Clearwater International Airport This includes management of airport properties in addition to airfield operations The airport is self-supporting and no property tax dollars are used to support the operation of the airport Airport revenues have remained stable in recent years due to the rentallease terms and Allegiant Airlinesrsquo popularity Revenues are forecast to increase gradually during the forecast period matching anticipated gradual growth as part of the recovery in the broader US economy The ability to forecast the availability of capital contributions and other grant funding after FY2018 is limited Therefore intergovernmental revenues in FY2019 through FY2023 are forecast at a conservative lower level The forecast for the Airport Revenue and Operating Fund shows that the fund is balanced through the forecast period based on the assumptions that the capital projects budget would be adjusted to reflect the timing and amounts of any grants revenue and that the airportrsquos operating budget would be adjusted to match revenues
Pinellas County Budget Forecast FY2014-2023 E-53
AIRPORT FUND
Revenues Excluding capital contributions and grants the two major funding sources supporting the Airport Revenue and Operating Fund during the forecast period are RentalsLeasesConcession income and AirfieldFlight Line Fees
RentalsLeasesConcessions St Petersburg-Clearwater International Airport which is classified as small-hub airport by the FAA provides commercial and private aviation services for the community The Airport also has a significant amount of land which is leased under long-term leases providing a stable source of revenues Pinellas County Criminal and Juvenile Courts Cracker Barrel Restaurant Dynamet Inc and GE Aviation Systems are just a few examples of long term leases at the airport Forty-five percent (45) of the long-term industrial (non-aviation) land leases are with Pinellas County Also included in this revenue source are concessions operating at airport terminal such as the paid parking car rentals gift shop and restaurant These revenue sources are expected to increase by 2 over the 10 year forecast Long-term leases have a five year adjustment based on the CPI AirfieldFlight Line Airfield fees are charges for the use of the runways and taxiways Flight Line leases are for aircraft parking areas and maintenance hangars These revenue sources are expected to increase by 2 over the 10 year forecast
$00
$20
$40
$60
$80
$100
$120
$140
2013 2014 2015 2016 2017 2018 2019 2020 2021 2022 2023
Mill
ion
s
Airport Revenue amp Operating Fund Major Non-Capital Revenue Sources
Forecasted FY2013-FY2023
AirfieldFlight Lines RentsLeasesConcessions New Property Development
Pinellas County Budget Forecast FY2014-2023 E-54
AIRPORT FUND
The following chart for passenger traffic in 2012 shows that Allegiant Airlines represents 908 of the passengers served on commercial carriers from St Petersburg-Clearwater International Airport Revenues from Terminal concession leases along with airline landing fees and fuel flowage fees are dependent on passenger airline service
Capital Contributions and Grants Capital Contributions funding is in the form of grants from the Federal Aviation Administration (FAA) the Florida Department of Transportation (FDOT) along with Passenger Facility Charges (PFCs) These are the revenue sources typically used for the Airportrsquos capital project funding There are also occasions when Airport Reserves are used to assist with funding of CIP Projects Other Revenues AIRCO Golf Course which had been operating on airport property closed in FY2011 due to significant annual operating losses at the course In FY2010 the course lost $216000 and in FY2011 it lost $139000 As a result of closing the course the Airportrsquos profitability has increased Revenue from new development on this property is not expected to be produced until FY2018
Expenditures The Airport Revenue and Operating Fund supports budgeted expenditures and reserves in FY2013 totaling $329M of which $124M is allocated for capital projects and $114M is reserves
Pinellas County Budget Forecast FY2014-2023 E-55
AIRPORT FUND
Airport Programs Of the remaining $91M in operating expenditures 80 supports the Aviation Services program and 20 the Airport Real Estate program Starting in FY2013 two primary programs were identified for reporting purposes Aviation Services and Airport Real Estate The Aviation Services program consists of all facets of day-to-day aviation activities The Airport Real Estate program oversees and negotiates leases with tenants and future development of the Airport to ensure compliance with Federal Aviation Administration lease requirements Personal Services Personal Services expenses are for the salaries and benefits of the 64 positions needed to operate both programs at the Airport Budgeted Personal Services expenditures in FY2013 total $43M Capital Projects The FY2013 estimate for Capital Projects is $124M These projects receive funding in the form of grants from the Federal Aviation Administration and the Florida Department of Transportation These projects will only commence when the appropriate grants funding is made available The following chart shows the relationship between the scheduling of the revenues and the expenditures of capital projects When additional funds are needed Reserves could be used FY2018 shows preliminary planned improvements such as new T-hangars and expanded cargo ramp
Reserves The total reserve level in the Airport Revenue and Operating fund is budgeted at $114M (40) in FY2013 This reserve level is the result of the Airport building reserves over the past several
$00
$50
$100
$150
$200
2013 2014 2015 2016 2017 2018 2019 2020 2021 2022 2023
Mil
lio
ns
Airport Grant Revenue amp Capital Projects Expenditures
Forecast FY2013 - FY2023
Total Grants Capital Projects
Pinellas County Budget Forecast FY2014-2023 E-56
AIRPORT FUND
years The reserves are then available in the event of unanticipated revenue shortfalls and as well as support future capital funding needs When expenditures in a given year are shown as exceeding revenues the difference is supported by drawing down accumulated reserves including Passenger Facility Charges which must be used for capital projects (See the Reserves chart below) Airport Reserves also include the projected cost of Other Post Employment Benefits (OPEB) as proprietary funds are required by GASB 45 to record the entire annual required contribution (ARC) accrual on the financial statements
Ten-Year Forecast Key Assumptions The revenue forecasts of funding total resources are conservative due to the current economic conditions AirfieldFlight Line revenue for FY2013 is based on the current level of carriers and passenger numbers For FY2014 through FY2023 an increase of 2 per fiscal year is forecast The forecast is conservative as no new carriers have been included RentLeasesConcessions revenue for FY2013 is based on current leasesagreements through the termination of these lease agreements For FY2014 through FY2023 an increase of 2 is forecasted for each fiscal year No new revenue from commercial or industrial development on the former golf course acreage is projected in the forecast until FY2018 However new property development will depend on factors such as site restrictions and future economic conditions The chart below shows that the net of recurring revenues and recurring expenditures is positive through the forecast period
$00
$50
$100
$150
$200
2013 2014 2015 2016 2017 2018 2019 2020 2021 2022 2023
Mill
ion
s
Airport Fund Reserves Forecast FY2013-FY2023
Pinellas County Budget Forecast FY2014-2023 E-57
AIRPORT FUND
With the addition of the Capital expenditures and revenues the chart below tracks the estimated revenues and expenditures in the fund through the forecast period
$00
$20
$40
$60
$80
$100
$120
$140
2013 2014 2015 2016 2017 2018 2019 2020 2021 2022 2023
Mill
ion
s
Airport Fund Forecast FY2014 - FY2023 Excluding Non-Recurring Revenues and Expenditures
Revenues Expenditures
$00
$50
$100
$150
$200
$250
$300
2013 2014 2015 2016 2017 2018 2019 2020 2021 2022 2023
Mill
ion
s
Airport Fund Forecast FY2014 -FY2023 Including Capital Improvement Program
Revenues Expenses
Pinellas County Budget Forecast FY2014-2023 E-58
AIRPORT FUND
Key Results The forecast for the Airport Fund is balanced over the forecast period The fluctuation in total revenues and expenditures is caused by the timing of capital projects Capital project impact to both revenues and expenditures is fund neutral since the projects are dependent on the availability of grants If the grants are not forthcoming the projects are not started
Potential Risks Several items can alter the ten-year forecast of Airport revenue collections A primary concern is the strength of the airline industry and the continued success of Allegiant Airlines Revenues could increase if the airport can attract new passengers and other carrier services Increases in rentalleases income would result when current leases and agreements are renewed and rate formula escalations occur The former AIRCO Golf Course has been rezoned for future aviation and commercial development The potential lease income value of this parcel is approximately $15M annually when all land is fully leased In addition other vacant land parcels could add another $100K to $300K in annual lease income if fully leased Also this forecast does not add any new passenger service An increase of 250000 new airline passengers could provide over $1M in additional income without a significant increase in operating expenses
Balancing Strategies The forecast does not show any structural gaps in revenues and expenditures as the fund is balanced through the forecast period assuming that the operating and capital budget would be adjusted in step with revenues
Pinellas County Budget Forecast FY2014-2023 E-59
AIRPORT FUND
Pinellas County Budget Forecast FY2014-2023 E-60
WATER FUNDS
Description The Pinellas County Water System is responsible for providing quality cost effective potable water service to County retail and wholesale customers The Water System must adhere to State and Federal laws rules and regulations while operating and maintaining this delivery system The Water System is continually being upgraded to provide customers with a safe and sufficient water supply for domestic needs as well as an ample supply for fire protection The Water System also continues to educate its customers on important water conservation issues The Water Funds are enterprise funds and are committed solely to support Water System functions The Pinellas County Water System utilizes four funds Revenue and Operating Renewal and Replacement (capital) Water Certificate and Impact Fees This forecast covers all four funds
Summary The forecast for the Water System Funds shows that the multi-year rate increases approved as part of the FY2012 budget process will provide sufficient revenues to maintain reserves and fund capital replacement needs through FY2015 The forecast revenues include an additional 2 per year annual increase in rates from FY2016 through FY2023 as recommended in the FY2012 Utilities Rates Study performed by Burton amp Associates the Countyrsquos independent utility rates consultant The Department of Environment and Infrastructure will again perform a comprehensive rate study in FY2014 to analyze the future rate structure In FY2013 FY2014 FY2017 and FY2018 recurring expenditures will exceed recurring revenues as fund balance is drawn down as major capital projects are completed From FY2015 through FY2023 excluding FY2017 and FY2018 the Water Funds are structurally balanced
Revenues The Water Funds generate revenues budgeted in FY2013 totaling $814 million The Water Funds have two primary funding sources retail water sales of $621 million and wholesale water sales of $151 million
Retail Water Sales The Water System charges $435 per month base rate an increase of $100 from FY2012 and $478 per 1000 gallons for retail water service In FY2014 and FY2015 additional base rate increases of $100 will go into effect The customer base for retail water sales are both commercial and residential properties in the Pinellas County Water service area The volume of water purchased has declined 9 from FY2008 to FY2012 The amount of water purchased can be affected by economic conditions housing and commercial vacancies and levels of conservation
Pinellas County Budget Forecast FY2014-2023 E-61
WATER FUNDS
Wholesale Water Sales The Water System charged $35648 per 1000 gallons for wholesale water service In FY2014 and FY2015 rates are scheduled to increase by 4 resulting in revised rates of $37074 and $38557 respectively Wholesale Water Sales provide water to the cities of Clearwater Tarpon Springs Safety Harbor Belleair and Pinellas Park The volume of water purchased has declined 30 from FY2008 to FY2012 which can be attributed to the same economic and conservation pressures seen in retail water sales The graph below shows the recent history of the volume of Water sales by the Water System
5380
50015103
47634619
45
50
55
60
2009 actual 2010 actual 2011 actual 2012 actual 2013 estimate
Millio
ns o
f G
allo
ns p
er D
ay (M
GD
)
Fiscal Year
Pinellas County Water Sales MGD
Source Pinellas County Department of Environment and Infrastructure
Expenditures The Water Funds support budgeted expenditures and reserves in FY2013 totaling $1214 million The primary expenditures in the fund are $454 million for the purchase of water $140 million for personal services $150 million for operating expenses (excluding the purchase of water) and $185 million for capital outlay Purchase of Water Under Section 3731963 of the Florida Statutes the Water System is required to purchase water from Tampa Bay Water the regional water supply authority In 1997 an Interlocal Agreement and the Master Water Supply Contract was signed under which Tampa Bay Water provides water to their members Pinellas County Hillsborough County Pasco County City of St Petersburg City of Tampa and City of New Port Richey Tampa Bay Water sets their rates according to the adopted budget and collects those rates from all members according to the Master Water Supply Contract Capital Outlay The Water System must maintain its equipment facilities pipelines and plants in good working order utilizing revenues generated within its proprietary funds Capital outlay reflects the construction and purchase needs as estimated by Pinellas County Department of Environment and Infrastructure Engineering Division in the CIP ten-year work plan and beyond
Pinellas County Budget Forecast FY2014-2023 E-62
WATER FUNDS
Personal Services The Water System employs 202 full-time employees in FY2013 The Personal Services expenses of $127 million are for the salaries and benefits of those positions needed to operate the Water System Water System benefits include the $13 million cost of Other Post Employment Benefits (OPEB) as proprietary funds are required by GASB 45 to record the entire annual required contribution (ARC) accrual Operating Expenses The Water System incurs annual recurring costs for repair and maintenance supplies fuel and communications The Water System also pays for electrical power to run its facilities and for chemicals to treat the water Reserves The reserve level in the Water System is 23 which is above the 5-15 reserve level budget policy adopted by the Board The Water System maintains these reserves for cash flow and future capital needs
Ten-Year Forecast Key Assumptions Due to expected slow growth in the economy the forecast assumes a 0 annual increase from FY2013 to FY2016 a 009 annual increase in FY2017 a 018 annual increase in FY2018 and a 027 annual increase from FY2019 to FY2023 in retail water demand and no growth in wholesale water demand for the forecast period The wholesale water demand reflects a decline in revenues from FY2015 through FY2016 due to the projected loss of sales of three cities (Clearwater Tarpon Springs and Oldsmar) as they develop their own water sources For expenditures Personal Services and Operating Expenses reflect the forecast trends described in the Key Assumptions section of this document Electricity and chemicals costs are projected to increase by 0 and 7 respectively for 2014 both are projected to increase 5 and 7 respectively per year through the remaining forecast period The capital outlay forecast reflects the construction and purchase needs as estimated by the Pinellas County Department of Environment and Infrastructure Engineering Division An increase to $203 million in FY2017 is anticipated to support capital outlay water line projects with Florida Department of Transportation (FDOT) as well as other major capital outlay improvement projects To balance revenues with projected expenditures future rate increases will be necessary for both retail and wholesale rates Burton amp Associates DEI Finance and Economics Independent Consultants computed that rate increases for FY2016 through FY2023 are needed at 2 per year based on a blend of growth and consumption assumptions inflationary cost increases and capital needs at the projected water demand levels
Pinellas County Budget Forecast FY2014-2023 E-63
WATER FUNDS
Source Pinellas County Department of Environment and Infrastructure
Key Results The forecast for the Water System Funds shows that the approved rate increases and rate increases starting in FY2016 as recommended in the FY2012 Utilities Rate Study by Burton amp Associates will provide sufficient revenues to maintain reserves and fund capital replacement needs In FY2013 FY2014 FY2017 and FY2018 recurring expenditures will exceed recurring revenues as fund balance is drawn down as major capital projects are completed From FY2015 through FY2023 excluding FY2017 and FY2018 the Water Funds are structurally balanced
Potential Risks There are some impacts that can alter the ten-year forecast of the Water System Any future economic decline would reduce water demand which would impact revenue more than expenses Operating costs (including the purchase of water from Tampa Bay Water) could increase more than projected The Water System could experience a need for more maintenance than anticipated causing increased operating and capital costs Regulatory pressures could cause an increase of expenditures to maintain the system
Balancing Strategies With the multi-year rate increases approved during the FY2012 budget process and future rate increases as recommended by Burton amp Associates Water System revenues will be sufficient to cover projected expenditures and maintain sufficient reserves over the forecast period
Pinellas County Budget Forecast FY2014-2023 E-64
SEWER FUNDS
Description The Pinellas County Sewer System is responsible for quality cost effective sewer service to the citizens and business owners within the County sewer service areas The Sewer System must adhere to State and Federal laws rules and regulations while operating and maintaining this system The System provides an environmentally safe and sanitary means of collecting and transmitting discharged domestic waste from residential commercial and industrial users The Sewer System provides for the treatment and disposal of objectionable materials and organisms from the waste in order to protect public health property and environment The Sewer Funds are enterprise funds and are committed solely to support Sewer System functions The Pinellas County Sewer System utilizes four funds Revenue and Operating Renewal and Replacement (capital) Interest and Sinking (Debt Service) and Sewer Construction The Sewer System is required to maintain a debt service coverage ratio of 125x per the bond covenants however the fund is maintained at a debt service coverage ratio of 150x to sustain the current bond ratings
Summary The Pinellas County Sewer Funds are proprietary funds dedicated solely to supporting the Pinellas County Sewer System (Sewer System) The forecast for the Sewer System Funds shows that the multi-year rate increases approved in FY2012 will provide sufficient revenues to maintain reserves sustain the recommended debt service coverage ratio of 150x and fund capital replacement needs through FY2015 The forecast revenues include an additional 275 per year annual increase in rates from FY2016 through FY2023 as recommended in the FY2012 Utilities Rates Study performed by Burton amp Associates the Countyrsquos independent utility rates consultant The Department of Environment and Infrastructure will perform a comprehensive rate study in FY2014 to analyze the future rate structure In FY2013 recurring expenditures will exceed recurring revenues as fund balance is drawn down as major capital projects are completed From FY2014 through FY2023 the Sewer Funds are structurally balanced as recurring expenditures are in line with recurring revenues
Revenues The Sewer Funds generate revenues budgeted in FY2013 totaling $600 million The Sewer Funds have four primary funding sources retail sewer charges of $484 million wholesale sewer charges of $67 million retail reclaimed water charges of $39 million and wholesale reclaimed water charges of $03 million
Retail Sewer Charges The Sewer System charges $1180 per month base rate and $431 per 1000 gallons for retail sewer service in FY2013 The FY2014 increase of 6 for retail customers (adopted in 2012) will result in a base rate of $1251 per month and $457 per 1000 gallons The customer base
Pinellas County Budget Forecast FY2014-2023 E-65
SEWER FUNDS
for retail sewer service is both commercial and residential properties in the Pinellas County Sewer service area Total billed retail demand has declined 3 from FY2008 to FY2012 The amount of sewage processed is affected by economic conditions housing and commercial vacancies and levels of water conservation Prior to this approved rate increase there was a 6 increase in 2012 a 15 increase in FY2011 a 35 increase in FY2010 and no rate increases from FY2004 thru FY2009
Wholesale Sewer Sales The Sewer System charges $32264 per 1000 gallons for wholesale sewer service The adopted FY2013 increase of 9 for wholesale customers (adopted in 2012) will equate to $35168 per 1000 gallons Wholesale customers are four cities within Pinellas County that purchase sewer service from the Sewer System in bulk after collecting it from their retail sewer customers The cities of North Redington Beach Redington Shores Indian Rocks Beach and Pinellas Park are the wholesale customers of the Sewer System Similar to retail sewer sales the total billed wholesale demand has declined 12 from FY2008 to FY2012 The amount of waste processed is affected by economic conditions housing and commercial vacancies and levels of water conservation The graph below shows the recent history of the volume of waste billed by the Sewer System
Source Pinellas County Department of Environment and Infrastructure
Retail Reclaimed Water Charges The Reclaimed Water System charges $1700 per month rate for unfunded un-metered service (systems without existing distribution lines) and a $700 per month availability charge and $080 per 1000 gallons for retail reclaimed water service for metered service unfunded systems (systems without existing distribution lines) and $1600 per month base rate for funded un-metered service (systems with pre-existing distribution lines) and $080 per 1000 gallons for metered funded systems (systems with pre-existing distribution lines) Rates for unfunded systems are higher as the Sewer System must recover the cost of constructing the reclaimed water distribution lines Only those accounts that have metered service pay the volumetric rate with most paying only the flat monthly rate The FY2013 budget includes approved rate increases of $100 per year for un-metered service and a user fee per 1000 gallon increase of $08 per year for metered service
27002680
2591
24892551
240
245
250
255
260
265
270
275
280
285
2008 2009 2010 2011 2012
Mil
lio
ns o
f G
all
on
s p
er
Day (
MG
D)
Fiscal Years
Pinellas County Sewer MGD Billed FY2008-FY2012
Sewer MGD
Pinellas County Budget Forecast FY2014-2023 E-66
SEWER FUNDS
Wholesale Reclaimed Water Charges
The Reclaimed Water System charged volumetric rates by contract for wholesale reclaimed water service No increase for wholesale rates was proposed for FY2013 Wholesale customers are four cities within Pinellas County that purchase reclaimed water service from the Reclaimed Water System in bulk and distribute it to their retail customers The cities of St Petersburg Beach South Pasadena Belleair and Pinellas Park are the wholesale customers of the Reclaimed Water System
Expenditures The Sewer Funds support budgeted expenditures and reserves in FY2013 totaling $1076 million The primary expenditures in the funds are $163 million for personal services costs $240 million for operating expenses $148 million for debt service $245 million for capital outlay and $289 million in reserves Personal Services The Sewer System employs 222 full-time employees in FY2013 The Personal Services expenses of $149 million are for the salaries and benefits of those positions needed to operate the Sewer System Sewer System benefits include the $14 million cost of Other Post Employment Benefits (OPEB) as proprietary funds are required by GASB 45 to record the entire annual required contribution (ARC) accrual This cost is included in the calculation of the debt service coverage ratio Debt Service The Sewer System had $1843 million of bond principal outstanding as of September 30 2012 The bonds were issued to fund various sewer system capital projects and require annual principal and interest payments to the holders of those bonds From FY2014 through FY2028 the debt service requirement is between $145 million and $148 million From FY2029 through FY2032 debt service payments fall to between $50 million and $55 million The bonds mature between 2017 and 2032 Operating Expenses The Sewer System incurs annual recurring costs for repair and maintenance supplies fuel and communications In addition utilities to run the facilities and chemicals to treat the waste are major components of the Sewer Systemrsquos operating expenses Capital Outlay The Sewer System must maintain its equipment facilities pipelines and plants in good working order using revenues generated within their proprietary funds Capital outlay reflects the construction and purchase needs as estimated by the Department of Environment and Infrastructure Engineering Division in the CIP ten-year work plan and beyond Reserves
Pinellas County Budget Forecast FY2014-2023 E-67
SEWER FUNDS
The reserve level in the Sewer System is 27 which is higher than the 5-15 reserve level budget policy adopted by the Board The Sewer System maintains $92 million of reserves for cash flow and $197 million to fund future capital needs In addition the 2008 bond issue requires a debt service reserve of $197 million to maintain the recommended debt service ratio of 150x
Source Pinellas County Department of Environment and Infrastructure
Ten-Year Forecast Key Assumptions Due to expected slow growth in the economy the forecast assumes 0 increase from FY2013 to FY2016 a 007 annual increase in FY2017 a 014 in FY2018 and a 021 from FY2019 to FY2023 in retail and wholesale sewer demand For expenditures Personal Services and Operating Expenses reflect the forecast trends described in the Key Assumptions section of this document Electricity and chemical costs are projected to increase by 0 and 7 respectively for 2014 both are projected to increase 5 and 7 respectively per year through the remaining forecast period The capital outlay forecast reflects the construction and purchase needs as estimated by the Department of Environment and Infrastructure Engineering Division To balance revenues with projected expenditures multi-year rate increases were approved during the FY2012 budget process for both retail and wholesale rates Burton and Associates DEI Finance and Economics Independent Consultants have computed that the following sewer rate increases were necessary to meet the projected expenses and reserve needs at the projected sewer demand levels 6 each year FY2012ndashFY2015 for retail sewer and 9 each year FY2012ndashFY2015 for wholesale sewer Reclaimed waterretail customers $100 to the monthly charge each year FY2012ndashFY2015 for unmetered service and an increase of $008 to the user fee per 1000 gallons each year FY2012 to FY2015 These multi-year rates were approved by the Board of County Commissioners in September 2011 Rate increases for FY2016 through FY2023 as recommended in the FY2012 Utilities Rate Study by Burton amp Associates are assumed at 275 based on a blend of growth and consumption assumptions inflationary cost increases capital needs and minimum amount of reserves necessary to meet required debt service ratios
Pinellas County Budget Forecast FY2014-2023 E-68
SEWER FUNDS
Key Results The forecast for the Sewer System Funds shows that the multi-year rate increases approved in FY2012 and future rate increases starting in FY2016 as recommended by Burton amp Associates will provide sufficient revenues to maintain reserves sustain the recommended debt service coverage ratio of 150x and fund capital replacement needs over the forecast period In FY2013 recurring expenditures will exceed recurring revenues as fund balance is drawn down as major capital projects are completed From FY2014 through FY2023 the Sewer Funds are structurally balanced as recurring expenditures are in line with recurring revenues
Potential Risks There are some impacts that can alter the ten-year forecast of the Sewer System Any future economic decline would reduce water demand which reduces sewer revenue that is based on volume Operating costs could increase more than projected The Sewer System could experience a need for more maintenance than anticipated causing increased capital costs
Balancing Strategies With the rate increases approved during the FY2012 budget process and anticipated future rate increases Sewer System revenues will be sufficient to cover projected expenditures maintain sufficient reserves and sustain the recommended debt service coverage ratio of 150x
Pinellas County Budget Forecast FY2014-2023 E-69
SEWER FUNDS
Pinellas County Budget Forecast FY2014-2023 E-70
SOLID WASTE FUNDS
Description Pinellas County Solid Waste provides safe and environmentally sound integrated solid waste services to all citizens of Pinellas County These services emphasize public awareness and communication to enable the citizens to make educated choices concerning proper management of their solid waste and to help maintain the quality of life in Pinellas County In support of that mission Solid Waste operates the landfill the waste-to-energy plant hazardous waste collection recycling programs and litter-reduction program The Solid Waste Funds are enterprise funds and are committed solely to support Solid Waste functions Solid Waste utilizes two funds Revenue and Operating and Renewal and Replacement (capital)
Summary The Pinellas County Solid Waste Funds are enterprise funds dedicated solely to supporting the Solid Waste functions The forecast for the Solid Waste Funds shows that the fund is balanced through the forecast period Solid Waste tipping fees and electricity sales revenues have declined with the slower economy but will remain sufficient to fund operations and maintain sufficient reserves during the forecast period Reserves are being accumulated for future capital replacement needs consistent with their 25 year capital plan
Revenues The Solid Waste Funds generate revenues budgeted in FY2013 totaling $850 million The Solid Waste Funds consist almost exclusively of two primary funding sources tipping fees of $337 million and electricity sales of $486 million
Tipping Fees Solid Waste charges $3750 per ton for all waste brought to the Solid Waste Facility That rate has not changed since 1988 The volume of waste brought to the Solid Waste Facility is expected to increase slightly in FY2014 The amount of waste brought to the facility is affected by economic conditions and levels of recycling
Electricity Sales Solid Waste receives revenue from the electrical capacity contract with Progress Energy for power produced by the waste-to-energy plant The revenue from this contract is defined by rates specified in the contract which expires in 2024 Solid Waste also receives revenue for electricity sales in excess of the capacity contract with Progress Energy This revenue stream is affected by the amount of waste received by the plant and the operating capacity of the plant Due to slow growth in the economy and no planned increases in plant capacity for the next ten years this revenue is forecast to increase by 05 per year from FY2014 through FY2023
Pinellas County Budget Forecast FY2014-2023 E-71
SOLID WASTE FUNDS
The graph below shows the tons of waste delivered to the Solid Waste Facility
Source Pinellas Co Solid Waste Mgmt Tonnage Activity Reports
Interfund Loan Repayment Debt service revenues over the forecast period are associated with an interfund loan from the Solid Waste Renewal and Replacement Fund to the Capital Improvement Fund On September 21 2010 the Board authorized the first interfund loan up to $85 million to assist with cash flow in the Capital Projects Fund through FY2019 The original 2010 to 2020 Penny Program was anticipated to be financed with a $150 million bond issue in order to accelerate several key projects The benefits of an interfund loan versus bonding include lower borrowing costs no reserve requirements interest accrues to a county entity and more flexibility in the implementation and terms of the loan Interest will be collected in FY2011 through FY2020 and loan repayment in FY2015 through FY2020 The interfund loan is available for use through FY2015 An additional loan to the Capital Projects Fund will be necessary to cover the remaining $75 million of costs to fully fund the Centralized Chiller Facility project This project funds the construction of a new centralized chiller facility for the downtown Clearwater campus The County will purchase chilled water at a set rate based on the amount of investment towards the cost of the facility Repayment of the loan will take place from FY2013 to FY2017 at $15 million annually The loan will be repaid from the General Fund but because it is a capital project the expenditures and repayment are taking place from the Capital Projects Fund Based on the forecast it is anticipated that only $70 million of the authorized $85 million will ultimately need to be transferred to the Capital Projects Fund
Expenditures The Solid Waste Funds support budgeted expenditures and reserves in FY2013 totaling $1996 million The primary expenditures in the fund are $313 million for the Waste-to-Energy service contract $113 million for the landfill service contract and $401 million for capital investment Budgeted reserves are $872 million
Pinellas County Budget Forecast FY2014-2023 E-72
SOLID WASTE FUNDS
Waste-to-Energy Service Contract Solid Waste is under contract with Green Conversion Systems LLC (GCS) to operate the Waste-to-Energy (WTE) plant This contract expires in 2024 and has 10 one-year extensions The stock of the parent company for the original contractor Veolia ES Pinellas Inc was purchased by GCS IN 2012 Landfill Service Contract Solid Waste is under contract with Advanced Disposal Inc to operate the landfill This contract expires in 2015 and has a 3-year extension The contract was assigned by the original contractor Veolia when the stock of the parent company was sold Capital Outlay Solid Waste maintains its equipment facilities and plants in good working order utilizing revenues generated within their enterprise fund Project decisions for equipmenttechnology improvements and construction projects are based on condition assessments permit or regulatory requirements and recommendations from consultants The new Industrial Water Treatment Plant (IWTP) at Solid Waste was the result of an analysis of the entire water balance at Bridgeway Acres A comprehensive water management study was completed in 2006 to assess the interrelated issues associated with our management of water including water use at the Waste-to-Energy facility particularly in the cooling towers permit issues associated with maintaining the inward gradient and water quality in the main water retention area The new IWTP was one of several projects that has been completed or is under construction The new facility will enable treatment to the main water retention area to maximize its use at the WTE facility including meeting contractual guarantees with respect to the water quality delivered It reduces reliance on reclaimed water increases capacity to the main water retention area minimizes any discharges required and assures a water supply in the dry spring months Personal Services The Solid Waste System employs 90 full-time employees in FY2013 The Personal Services expenses are for the salaries and benefits of those positions needed to operate the Solid Waste System Solid Waste System benefits include the cost of Other Post Employment Benefits (OPEB) as proprietary funds are required by GASB 45 to record the entire annual required contribution (ARC) accrual Interfund Loan to Capital Projects Fund The forecast includes transfers of $100 million in FY2013 and $450 million in FY2014 from the Solid Waste Renewal and Replacement Fund as part of the interfund loans to the Capital Projects Fund The estimate for FY2013 also includes the transfer of $75 million for the Centralized Chiller Facility project which will be repaid from the General Fund Reserves The budgeted FY2013 reserve level in the Solid Waste System is 44 which is above the 15 reserve level budget policy adopted by the Board Solid Waste maintains the following reserves
Pinellas County Budget Forecast FY2014-2023 E-73
SOLID WASTE FUNDS
$75 million required reserves per the contract with GCS $11 million for insurance deductibles $139 million for three months of operating expenses and the remainder of $548 million is for future needs consistent with their 25 year capital plan The estimated FY2013 reserves are higher than budgeted due to the timing of the loan from Solid Waste to the Capital Projects Fund $45 million of the loan was delayed from FY2012 to FY2014
Ten-Year Forecast Key Assumptions The revenue forecast assumes only a 05 increase in tipping fees and electricity sales throughout the forecast horizon due to the anticipated slow growth in the economy increased recycling and no planned capacity increases to the WTE plant The revenue forecast does not include any increases in tipping fee rates The economy does affect the tons of waste brought to the solid waste facility because less consumption means less waste For expenditures Personal Services and Operating Expense reflect the forecast trends described in the Key Assumptions section of this document The capital outlay forecast reflects the construction and purchase needs based on condition assessments permit or regulatory requirements and recommendations from consultants There are large capital needs forecasted from FY2013 through FY2018 in anticipation of tighter regulatory requirements and additional required improvements
Pinellas County Budget Forecast FY2014-2023 E-74
SOLID WASTE FUNDS
Key Results The forecast for the Solid Waste Funds shows that the forecasted revenues are sufficient to provide for the forecasted expenditures over the next ten years while still maintaining sufficient reserves (The forecast chart does not include the loans to the Capital Projects Fund or the future repayments from that fund) Solid waste revenues exceed expenditures from FY2015 through FY2023 In FY2014 expenditures reflect non-recurring costs associated with additional capital outlay improvements The recurring revenues are sufficient to support recurring operations without any increases in tipping fees Reserves increase during the forecast period and reach the level of 84 of revenues in FY2023 The reserves are planned to fund considerable future capital replacement needs in the Solid Waste 25-year plan
Potential Risks There are some impacts that can alter the ten-year forecast of the Solid Waste Funds Any continued economic decline would reduce incoming waste which would reduce revenue from both the tipping fees and electricity sales The WTE plant could experience more maintenance downtime than anticipated reducing electricity sales and causing increased capital costs
Balancing Strategies Excluding FY2014 with anticipated capital outlay improvements the forecast does not show any structural gaps in revenues and expenditures as the fund is balanced through the forecast period
Pinellas County Budget Forecast FY2014-2023 E-75
SOLID WASTE FUNDS
Pinellas County Budget Forecast FY2014-2023 E-76
PRO-FORMAS
Pinellas County Budget Forecast FY2014-2023
The Pro-Formas portion of the Budget Forecast FY2014-2023 includes the detailed assumptions behind the ten-year fund pro-formas as well as full-size forecast charts for ten of the Countyrsquos major funds
General Fund
Tourist Development Fund
Transportation Trust Fund
Capital Projects Fund
Emergency Medical Services Fund
Fire Districts Fund
Airport Fund
Utilities Water Funds
Utilities Sewer Funds
Utilities Solid Waste Funds
Sections for Each Fund Each fund has the following information
Forecast Chart Provides a forecast of revenues (net of fund balance) and expenditures (net of reserves) for each fund over a ten-year period
Assumptions Provides the key assumptions for each year in the forecast horizon that feed the pro-formas for each fund
Pro-Formas Provides the detailed revenue and expenditure projections over ten years for each fund based on key assumptions
Additional Information The information in this section provides the detail behind the forecast summaries prepared in the Fund Forecasts portion of this document The fund forecasts are intended to be high level user-friendly summaries of the results of the ten-year forecast for each fund The information in this section is much more granular and was used by the Office of Management amp Budget as well as other contributing departments to produce the forecasts
F-1
PRO-FORMAS
Pinellas County Budget Forecast FY2014-2023
F-2
4000
4500
5000
5500
6000
6500
2013
2014
2015
2016
2017
2018
2019
2020
2021
2022
2023
Dollars (millions)
Gen
era
l F
un
d F
ore
ca
st
FY
2014 -
FY
2023
U
sin
g S
erv
ice L
evel
Sta
biliz
ati
on
Acc
ou
nt
in F
Y201
3 -
FY
2014
Revenue
Expenditure
s
F-3
GE
NE
RA
L F
UN
D F
OR
EC
AS
TF
un
d 0
001
Fo
recast
Assu
mp
tio
ns
20
14
20
15
20
16
20
17
20
18
20
19
20
20
20
21
20
22
20
23
RE
VE
NU
ES
Pro
pe
rty T
axe
s -
Co
un
tyw
ide
2
5
25
3
0
30
3
0
30
3
0
30
3
0
30
Pro
pe
rty T
axe
s -
MS
TU
2
0
20
2
5
25
2
5
25
2
5
25
2
5
25
Half C
en
t S
ale
s T
ax
40
3
5
35
3
5
35
3
5
35
3
5
35
3
5
Reve
nu
e S
ha
rin
g2
5
25
2
5
25
2
5
25
2
5
25
2
5
25
Com
mu
nic
atio
ns S
vc T
ax
-05
-0
5
-05
-0
5
-05
-0
5
-05
-0
5
-05
-0
5
Cha
rge
s f
or
Se
rvic
es
15
1
8
17
2
0
19
2
1
20
2
0
20
2
0
Tra
nsfe
rs f
rom
Oth
er
Fu
nd
s0
0
00
0
0
00
0
0
00
0
0
00
0
0
00
Oth
er
reve
nu
es
20
2
0
20
2
0
20
2
0
20
2
0
20
2
0
EX
PE
ND
ITU
RE
S
Pe
rso
na
l S
erv
ice
s4
1
40
4
0
40
4
0
40
4
0
40
4
0
40
Op
era
tin
g E
xp
en
se
s-0
5
26
2
6
29
0
3
29
3
0
31
3
0
31
Cap
ita
l O
utla
y1
5
18
1
7
20
1
9
21
2
0
20
2
0
20
Gra
nts
amp A
ids
15
1
8
17
2
0
19
2
1
20
2
0
20
2
0
Pro
jec
ted
Ec
on
om
ic C
on
dit
ion
s
In
dic
ato
rs
Con
su
me
r P
rice
In
de
x
c
ha
ng
e1
5
18
1
7
20
1
9
21
2
0
20
2
0
20
FL
Pe
r C
ap
ita
Pe
rso
na
l In
co
me
Gro
wth
20
2
2
22
1
8
14
1
5
17
1
6
16
1
6
Estim
ate
d N
ew
Con
str
uctio
n
of
tax b
ase
05
0
5
10
1
0
10
1
0
10
1
0
10
1
0
P
rop
ert
y T
ax
pe
ren
tag
es
are
ch
an
ge
s i
n T
ax
ab
le V
alu
e
F-4
GE
NE
RA
L F
UN
D F
OR
EC
AS
TF
un
d 0
001
OR
IGIN
AL
(in
$ m
illi
on
s)
Ac
tua
lB
UD
GE
TE
sti
ma
ted
Es
tim
ate
dE
sti
ma
ted
Es
tim
ate
dE
sti
ma
ted
Es
tim
ate
dE
sti
ma
ted
Es
tim
ate
dE
sti
ma
ted
Es
tim
ate
dE
sti
ma
ted
20
12
20
13
20
13
20
14
20
15
20
16
20
17
20
18
20
19
20
20
20
21
20
22
20
23
BE
GIN
NIN
G F
UN
D B
AL
AN
CE
12
68
1
15
3
13
05
1
08
9
95
3
7
61
53
8
2
72
(10
)
(3
48
)
(73
8)
(1
17
0)
(16
73
)
RE
VE
NU
ES
Pro
pe
rty T
axe
s -
Cou
nty
wid
e2
58
4
25
90
2
59
0
26
55
2
72
1
28
03
2
88
7
29
74
3
06
3
31
55
3
25
0
33
48
3
44
8
Pro
pe
rty T
axe
s -
MS
TU
29
0
2
76
27
6
2
82
28
8
2
95
30
2
3
10
31
8
3
26
33
4
3
42
35
1
Half C
en
t S
ale
s T
ax
37
0
3
82
38
2
3
97
41
1
4
25
44
0
4
55
47
1
4
87
50
4
5
22
54
0
Reve
nu
e S
ha
rin
g1
43
14
3
1
43
14
7
1
51
15
5
1
59
16
3
1
67
17
1
1
75
17
9
1
83
MA
ND
AT
E M
ed
ica
id (
Rev S
hrg
cu
t)-
(5
1)
no
w s
ho
wn
as O
pe
rati
ng
Exp
en
dit
ure
in
ste
ad
of
rev
en
ue
re
du
cti
on
-
-
-
-
-
Com
mu
nic
atio
ns S
vc T
ax
10
8
1
07
10
7
1
06
10
5
1
04
10
3
1
02
10
1
1
00
10
0
1
00
10
0
Bu
ild
ing
Pe
rmits
-
-
-
-
-
-
-
-
-
-
-
-
-
Gra
nts
(fe
ds
tate
lo
ca
l)1
35
59
5
9
60
6
1
62
6
3
64
6
5
66
6
7
68
6
9
Inte
rest
08
1
0
10
0
8
10
1
5
16
0
8
-
-
-
-
-
Cha
rge
s f
or
Se
rvic
es
68
5
6
35
63
5
6
55
66
5
6
74
68
7
7
03
72
0
7
37
75
5
7
69
78
9
Oth
er
reve
nu
es
13
4
1
21
12
1
1
23
12
5
1
28
13
1
1
34
13
7
1
40
14
3
1
46
14
9
Ad
just
Pro
pe
rty T
axe
s
to 9
6
-
-
30
3
1
32
3
3
34
3
5
36
3
7
38
3
9
40
Ad
just
Ma
jor
Re
ve
nu
e t
o 9
8
-
-
-
21
2
1
22
2
2
23
2
3
24
2
5
25
2
6
Ad
just
Oth
er
Re
ve
nu
e t
o 9
7
-
-
-
18
2
1
25
2
8
31
3
6
40
4
1
45
4
8
TO
TA
L R
EV
EN
UE
S4
45
7
42
72
4
35
3
45
03
4
61
1
47
41
4
87
2
50
02
5
13
7
52
83
5
43
2
55
83
5
74
3
v
s p
rio
r ye
ar
20
-2
3
2
3
3
3
3
3
3
3
3
TO
TA
L R
ES
OU
RC
ES
57
25
5
42
5
56
58
5
59
2
55
64
5
50
2
54
10
5
27
4
51
27
4
93
5
46
94
4
41
3
40
70
EX
PE
ND
ITU
RE
S
Pe
rso
na
l S
erv
ice
s6
37
65
4
6
54
68
1
7
08
73
6
7
65
79
6
8
28
86
1
8
95
93
1
9
68
Op
era
tin
g E
xp
en
se
s9
59
10
23
1
07
4
10
76
1
10
5
11
34
1
16
7
11
75
1
21
0
12
47
1
28
6
13
24
1
36
5
Cap
ita
l O
utla
y1
5
09
0
9
09
0
9
09
0
9
09
0
9
09
0
9
09
0
9
Gra
nts
amp A
ids
15
9
1
91
19
1
1
93
19
8
2
02
20
7
2
12
21
7
2
22
22
7
2
32
23
7
Tra
nsfe
rs2
58
4
25
76
2
57
6
26
84
2
78
4
28
84
2
99
2
31
08
3
22
8
33
52
3
48
2
36
27
3
77
7
Deb
t S
erv
ice
-
03
-
-
-
-
-
-
-
-
-
-
-
Se
rvic
e L
eve
l S
tab
iliz
ati
on
Ac
ct
-
94
-
-
-
-
-
-
-
-
-
-
-
No
n-r
ec
urr
ing
ex
pe
nd
itu
res
16
-
2
6
-
-
-
-
-
-
-
-
-
-
Exp
en
ditu
re L
ap
se
1
-
(1
9)
(19
)
(2
0)
(20
)
(2
1)
(21
)
(2
2)
(23
)
(2
3)
(24
)
(2
5)
Po
ten
tia
l Is
su
es
No
n-r
ec
urr
ing
Tra
ns
fers
to
CIP
06
1
5
15
1
5
15
1
5
15
-
-
-
-
-
-
BT
S n
on
-re
cu
rrin
g p
roje
ct
co
sts
37
4
3
43
-
-
-
-
-
-
-
-
-
-
Ho
me
les
s In
itia
tive
s (
Gamp
A)
07
-
-
-
-
-
-
-
-
-
-
-
-
CIP
Op
era
tin
g Im
pa
cts
(c
um
ula
tive
)-
-
-
-
0
4
04
0
4
05
0
5
05
(1
2)
(13
)
(1
3)
TO
TA
L E
XP
EN
DIT
UR
ES
44
20
4
60
8
45
69
4
63
9
48
03
4
96
4
51
38
5
28
4
54
75
5
67
3
58
64
6
08
6
63
18
v
s p
rio
r ye
ar
31
7
3
2
4
3
4
3
4
4
3
4
4
EN
DIN
G F
UN
D B
AL
AN
CE
13
05
8
17
10
89
9
53
76
1
5
38
27
2
(1
0)
(34
8)
(7
38
)
(11
70
)
(1
67
3)
(22
48
)
AS
SU
MIN
G N
O A
CT
ION
TA
KE
N T
O
RE
SO
LV
E S
HO
RT
FA
LL
S
En
din
g b
ala
nce
as
of
Re
so
urc
es
23
1
6
19
1
7
14
1
0
5
0
-7
-15
-2
5
-38
-5
5
TO
TA
L R
EQ
UIR
EM
EN
TS
57
25
5
42
5
56
58
5
59
2
55
64
5
50
2
54
10
5
27
4
51
27
4
93
5
46
94
4
41
3
40
70
RE
VE
NU
E m
inu
s E
XP
EN
DIT
UR
ES
37
(3
36
)
(21
6)
(1
36
)
(19
2)
(2
23
)
(26
6)
(2
82
)
(33
8)
(3
90
)
(43
2)
(5
03
)
(57
5)
(NO
T c
um
ula
tive
)
no
te
no
n-r
ec
urr
ing
ex
pe
nd
itu
res
66
1
52
84
1
5
15
1
5
15
-
-
-
-
-
-
net
recu
rrin
g r
ev-
exp
103
(184
)
(132
)
(1
21
)
(177
)
(208
)
(251
)
(282
)
(338
)
(390
)
(4
32
)
(503
)
(575
)
E
xp
en
ditu
re la
pse
is c
alc
ula
ted
on
Pe
rso
na
l S
erv
ice
s
Op
era
tin
g E
xp
en
se
s
Cap
ita
l O
utla
y
an
d G
ran
ts amp
Aid
s o
nly
FY
12
ad
va
lore
m a
nd
oth
er
reve
nu
e a
dju
ste
d f
or
de
linqu
en
t ta
xe
s a
nd
ta
x r
ed
em
ptio
ns
FO
RE
CA
ST
F-5
F-6
160
180
200
220
240
260
280
300
320
340
360
380
400
420
440
2014
2015
2016
2017
2018
2019
2020
2021
2022
2023
Dollars (mllions)
To
uri
st
De
ve
lop
me
nt
Co
un
cil
Fu
nd
Fo
rec
as
t F
Y2
01
4 -
FY
20
23
Ex
clu
din
g U
nd
es
ign
ate
d E
xp
en
dit
ure
s
RE
VE
NU
ES
E
XP
EN
DIT
UR
ES
F-7
TO
UR
IST
DE
VE
LO
PM
EN
T C
OU
NC
IL F
UN
D F
OR
EC
AS
TF
un
d 1
04
0
Fo
rec
as
t A
ss
um
pti
on
s2014
2015
2016
2017
2018
2019
2020
2021
2022
2023
RE
VE
NU
ES
Tourist D
evelo
pm
ent T
axes
35
30
30
30
30
30
30
30
30
30
EX
PE
ND
ITU
RE
S
Pers
onal S
erv
ices
41
40
40
40
40
40
40
40
40
40
Opera
ting E
xpenses
15
18
17
20
19
21
20
20
20
20
Advert
isin
g E
xpense
15
18
17
20
19
21
20
20
20
20
Capital O
utlay
15
18
17
20
19
21
20
20
20
20
Pro
jecte
d E
co
no
mic
Co
nd
itio
ns In
dic
ato
rs
Consum
er
Price Index
change
15
18
17
20
19
21
20
20
20
20
FL P
er
Capita P
ers
onal I
ncom
e G
row
th20
22
22
18
14
15
17
16
16
16
F-8
TO
UR
IST
DE
VE
LO
PM
EN
T C
OU
NC
IL F
UN
D F
OR
EC
AS
TF
un
d 1
04
0
(in
$ t
ho
usan
ds)
Actu
al
Bu
dg
et
Esti
mate
dE
sti
mate
dE
sti
mate
dE
sti
mate
dE
sti
mate
dE
sti
mate
dE
sti
mate
dE
sti
mate
dE
sti
mate
dE
sti
mate
dE
sti
mate
d
2012
2013
2013
2014
2015
2016
2017
2018
2019
2020
2021
2022
2023
BE
GIN
NIN
G F
UN
D B
AL
AN
CE
64
290
72
818
80
012
57
874
56
165
56
680
59
561
61
182
62
242
64
540
66
428
69
046
70
450
RE
VE
NU
ES T
ourist D
evelo
pm
ent T
axes
95
287
461
270
972
284
011
293
952
302
770
311
854
321
209
330
845
340
771
350
994
361
524
372
369
383
541
Inte
rest
290
277
400
405
562
1134
1787
1835
1867
1936
1993
2071
2114
Cty
Off F
ees (
TC
)-
-
-
-
-
-
-
-
-
-
-
-
-
Oth
er
revenues (
Int -
TC
)44
66
66
67
68
70
71
72
74
75
77
78
80
Adju
st T
ax R
evenues to 1
00
-
-
14
948
15
471
15
935
16
413
16
906
17
413
17
935
18
473
19
028
19
598
20
186
Adju
st oth
er
Revenues to 1
00
-
-
25
25
25
26
27
27
28
28
29
29
30
RE
VE
NU
ES
287
795
271
315
299
450
309
920
319
361
329
496
339
999
350
193
360
675
371
507
382
650
394
147
405
950
v
s p
rior
year
116
-5
7
40
35
30
32
32
30
30
30
30
30
30
TO
TA
L R
ES
OU
RC
ES
352
085
344
133
379
462
367
794
375
526
386
176
399
560
411
375
422
917
436
047
449
078
463
192
476
400
EX
PE
ND
ITU
RE
S
Pers
onal S
erv
ices
27
276
32
116
32
116
33
433
34
770
36
161
37
607
39
112
40
676
42
303
43
995
45
755
47
585
Opera
ting E
xpenses
62
229
66
646
66
646
67
646
68
863
70
034
71
435
72
792
74
321
75
807
77
323
78
870
80
447
Advert
isin
g E
xpense
75
623
86
514
86
514
87
812
89
392
90
912
92
730
94
492
96
476
98
406
100
374
102
382
104
429
A
ddtl A
dvert
Exp -
one-t
ime
RN
C6000
-
-
-
-
-
-
-
-
-
-
-
-
Un
desig
nate
d-
-
33
000
20
000
15
000
82
000
88
000
93
000
96
000
106
000
110
000
122
000
126
000
Capital O
utlay
-
43
43
44
44
45
46
47
48
49
50
51
52
Capital O
utlay -
Dali
Museum
-
-
-
-
5000
5000
5000
5000
5000
-
-
-
-
Tra
nsfe
r -
Tax C
olle
cto
r4485
4942
4942
5090
5243
5400
5562
5729
5901
6078
6260
6448
6642
Tra
nsfe
r -
Beach R
enourishm
ent
26
513
32
424
32
424
29
395
30
277
31
185
32
121
33
085
34
077
35
099
36
152
37
237
38
354
Debt S
erv
ice
69
947
65
903
65
903
68
210
70
256
5877
5877
5877
5877
5877
5877
-
-
EX
PE
ND
ITU
RE
S272
073
288
588
321
588
311
629
318
846
326
615
338
378
349
133
358
376
369
619
380
032
392
742
403
509
v
s p
rior
year
17
6
18
-3
2
2
4
3
3
3
3
3
3
EN
DIN
G F
UN
D B
AL
AN
CE
80
012
55
545
57
874
56
165
56
680
59
561
61
182
62
242
64
540
66
428
69
046
70
450
72
891
Endin
g b
ala
nce a
s
of R
esourc
es
23
16
15
15
15
15
15
15
15
15
15
15
15
TO
TA
L R
EQ
UIR
EM
EN
TS
352
085
344
133
379
462
367
794
375
526
386
176
399
560
411
375
422
917
436
047
449
078
463
192
476
400
RE
VE
NU
E m
inu
s E
XP
EN
DIT
UR
ES
15
722
(17
273
)
(22
138
)
(1709
)
515
2881
1621
1060
2299
1888
2618
1405
2441
(NO
T c
um
ula
tive)
no
te
no
n-r
ec
urr
ing
exp
en
dit
ure
s-
-
-
-
-
-
-
-
-
-
-
-
-
ne
t re
cu
rrin
g r
ev-
ex
p1
57
22
(17
27
3)
(22
13
8)
(17
09
)
51
5
28
81
16
21
10
60
22
99
18
88
26
18
14
05
24
41
One-t
ime O
pera
ting E
xpenditure
s w
ere
availa
ble
due to a
ctu
al F
Y12 B
egin
nin
g F
und B
ala
nce b
ein
g h
igher
than b
udgete
d
1)
The T
ransfe
r fo
r B
each R
enourishm
ent in
FY
2013 r
eflects
an a
dditio
nal am
ount due b
ased o
n r
econcile
d a
ctu
al ta
x c
olle
ctions v
ers
us b
udget in
prior
years
T
he F
Y2014 a
mount re
turn
s to the b
ase a
nnual tr
ansfe
r of 12
of one c
ent fr
om
the e
stim
ate
d c
olle
ctions
2)
The s
ignific
ant re
duction in D
ebt S
erv
ice in F
Y2016 r
eflects
the e
nd o
f T
ropic
ana F
ield
and D
unedin
Spring T
rain
ing F
acili
ty p
aym
ents
in F
Y2015
3)
The r
eduction in D
ebt S
erv
ice in F
Y2022 r
eflects
the e
nd o
f C
learw
ate
r S
pring T
rain
ing F
acili
ty p
aym
ents
in F
Y2021
4)
Annual paym
ents
of $500k to the D
ali
Musuem
are
schedule
d to e
nd in F
Y2020
5)
The T
ransfe
r fo
r T
ax C
olle
cto
r serv
ices in F
Y13 r
eflects
a r
ecovery
form
ula
based o
n a
ctu
al annual cost It incre
ases 3
p
er
year
in the fore
cast fo
r anticip
ate
d incre
ases in futu
re p
ers
onal serv
ices a
nd o
pera
ting e
xpenses
6)
The
Undesig
nate
d
line u
nder
Expenditure
s s
how
s a
pote
ntial am
ount of fu
nds that could
be a
llocate
d a
bove the targ
et 15
reserv
e based o
n a
ll aoth
er
assum
ptions in the fore
cast
FO
RE
CA
ST
(
100
Reven
ue)
F-9
F-10
$200
$230
$260
$290
$320
$350
$380
$410
$440
2013
2014
2015
2016
2017
2018
2019
2020
2021
2022
2023
Dollars (millions)
Tra
nsp
ort
ati
on
Tru
st
Fu
nd
Fo
reca
st
FY
2014 -
FY
2023
RE
VE
NU
ES
E
XP
EN
DIT
UR
ES
F-11
TR
AN
SP
OR
TA
TIO
N T
RU
ST
FU
ND
FO
RE
CA
ST
Fu
nd
1001
Fo
recast
Assu
mp
tio
ns
20
14
20
15
20
16
20
17
20
18
20
19
20
20
20
21
20
22
20
23
RE
VE
NU
ES
Nin
th C
en
t G
as T
ax
-05
-0
5
-05
-0
5
-05
-0
5
-05
-0
5
-05
-0
5
Sta
te S
ha
red
Ga
s T
axe
s-0
5
-05
-0
5
-05
-0
5
-05
-0
5
-05
-0
5
-05
Lo
ca
l O
ptio
n G
as T
axe
s-0
5
-05
-0
5
-05
-0
5
-05
-0
5
-05
-0
5
-05
Oth
er
reve
nu
es
20
2
0
20
2
0
20
2
0
20
2
0
20
2
0
EX
PE
ND
ITU
RE
S
Pe
rso
na
l S
erv
ice
s4
1
40
4
0
40
4
0
40
4
0
40
4
0
40
Op
era
tin
g E
xp
en
se
s1
5
18
1
7
20
1
9
21
2
0
20
2
0
20
Cap
ita
l O
utla
y1
5
18
1
7
20
1
9
21
2
0
20
2
0
20
Gra
nts
amp A
ids
15
1
8
17
2
0
19
2
1
20
2
0
20
2
0
Tra
nsfe
rs1
60
0
0
00
0
0
00
0
0
00
0
0
00
0
0
Pro
jec
ted
Ec
on
om
ic C
on
dit
ion
s
In
dic
ato
rs
Con
su
me
r P
rice
In
de
x
c
ha
ng
e1
5
18
1
7
20
1
9
21
2
0
20
2
0
20
FL
Pe
r C
ap
ita
Pe
rso
na
l In
co
me
Gro
wth
20
2
2
22
1
8
14
1
5
17
1
6
16
1
6
F-12
TR
AN
SP
OR
TA
TIO
N T
RU
ST
FU
ND
FO
RE
CA
ST
Fu
nd
1001
(in
$ t
ho
us
an
ds
)A
ctu
al
Bu
dg
et
Es
tim
ate
dE
sti
ma
ted
Es
tim
ate
dE
sti
ma
ted
Es
tim
ate
dE
sti
ma
ted
Es
tim
ate
dE
sti
ma
ted
Es
tim
ate
dE
sti
ma
ted
Es
tim
ate
d
20
12
20
13
20
13
20
14
20
15
20
16
20
17
20
18
20
19
20
20
20
21
20
22
20
23
BE
GIN
NIN
G F
UN
D B
AL
AN
CE
14
77
22
13
96
30
17
70
77
16
28
75
13
71
37
10
32
10
60
58
3
74
37
(5
78
00
)
(13
42
92
)
(2
21
99
8)
(32
12
54
)
(4
32
41
2)
RE
VE
NU
ES
Nin
th C
en
t G
as T
ax
37
49
3
37
57
7
37
57
7
37
38
9
37
20
2
37
01
6
36
83
1
36
64
7
36
46
4
36
28
1
36
10
0
35
91
9
35
74
0
Sta
te S
ha
red
Ga
s T
axe
s9
31
90
9
24
20
9
24
20
9
24
20
9
19
58
9
14
98
9
10
41
9
05
85
9
01
32
8
96
82
8
92
33
8
87
87
8
83
43
Lo
ca
l O
ptio
n G
as T
ax
12
49
70
12
59
65
12
59
65
12
53
35
12
47
08
12
40
85
12
34
65
12
28
47
12
22
33
12
16
22
12
10
14
12
04
09
11
98
07
Inte
rest
42
2
5
00
50
0
5
00
13
71
2
06
4
18
18
2
23
-
-
-
-
-
Oth
er
reve
nu
es
23
99
0
15
05
4
15
05
4
15
35
5
15
66
2
15
97
5
16
29
5
16
62
1
16
95
3
17
29
2
17
63
8
17
99
1
18
35
1
Tra
nsfe
r fr
om
oth
er
Fu
nd
s-
1
50
00
1
50
00
1
50
00
1
50
00
1
50
00
1
50
00
1
50
00
1
50
00
1
50
00
1
50
00
1
50
00
1
50
00
Ad
just
Oth
er
Re
ve
nu
e t
o 9
8
49
1
5
01
53
8
5
70
57
2
5
32
53
5
5
46
55
7
5
68
57
9
TO
TA
L R
EV
EN
UE
S2
80
06
5
2
86
51
6
2
87
00
7
2
86
50
0
2
86
44
0
2
86
20
9
2
85
02
1
2
82
45
5
2
81
31
8
2
80
42
3
2
79
54
2
2
78
67
4
2
77
82
0
v
s p
rio
r ye
ar
2
2
0
0
0
0
-1
0
0
0
0
0
TO
TA
L R
ES
OU
RC
ES
42
77
87
42
61
46
46
40
84
44
93
75
42
35
77
38
94
18
34
56
04
28
98
92
22
35
18
14
61
31
57
54
5
(42
58
0)
(1
54
59
2)
EX
PE
ND
ITU
RE
S
Pe
rso
na
l S
erv
ice
s1
10
79
6
1
37
37
9
1
37
37
9
1
43
01
2
1
48
73
2
1
54
68
1
1
60
86
9
1
67
30
3
1
73
99
5
1
80
95
5
1
88
19
3
1
95
72
1
2
03
55
0
Op
era
tin
g E
xp
en
se
s
90
24
6
12
38
33
12
38
33
12
56
90
12
79
53
13
01
28
13
27
31
13
52
53
13
80
93
14
08
55
14
36
72
14
65
45
14
94
76
Cap
ita
l O
utla
y6
89
15
70
1
57
0
15
94
1
62
2
16
50
1
68
3
17
15
1
75
1
17
86
1
82
2
18
58
1
89
5
Gra
nts
amp A
ids
14
5
2
67
26
7
2
71
27
6
2
81
28
6
2
92
29
8
3
04
31
0
3
16
32
2
Fu
ll C
ost
Allo
ca
tio
n1
88
34
1
92
31
1
92
31
1
93
66
1
95
59
1
99
50
2
05
49
2
11
65
2
18
00
2
24
54
2
31
28
2
38
22
2
45
37
Tra
nsfe
rs t
o o
the
r F
un
ds
30
00
0
21
56
0
21
56
0
25
00
0
25
00
0
25
00
0
25
00
0
25
00
0
25
00
0
25
00
0
25
00
0
25
00
0
25
00
0
Exp
en
ditu
re L
ap
se
1
(26
30
)
(2
70
6)
(27
86
)
(2
86
7)
(29
56
)
(3
04
6)
(31
41
)
(3
23
9)
(33
40
)
(3
44
4)
(35
52
)
Po
ten
tia
l Is
su
es
a)
CIP
Op
era
tin
g I
mp
acts
(cu
mu
lative
)1
1
11
1
2
06
1
0
14
1
4
14
1
4
14
TO
TA
L E
XP
EN
DIT
UR
ES
25
07
10
30
38
40
30
12
10
31
22
38
32
03
67
32
88
35
33
81
68
34
76
92
35
78
10
36
81
29
37
87
99
38
98
32
40
12
42
v
s p
rio
r ye
ar
18
1
7
4
3
3
3
3
3
3
3
3
3
EN
DIN
G F
UN
D B
AL
AN
CE
17
70
77
12
23
06
16
28
75
13
71
37
10
32
10
60
58
3
74
37
(5
78
00
)
(13
42
92
)
(2
21
99
8)
(32
12
54
)
(4
32
41
2)
(55
58
33
)
AS
SU
MIN
G N
O A
CT
ION
TA
KE
N T
O
RE
SO
LV
E S
HO
RT
FA
LL
S
En
din
g b
ala
nce
as
of
Reso
urc
es
29
3
5
31
2
4
16
2
-2
0
-60
-1
52
-5
58
1
01
6
36
0
TO
TA
L R
EQ
UIR
EM
EN
TS
42
77
87
42
61
46
46
40
84
44
93
75
42
35
77
38
94
18
34
56
04
28
98
92
22
35
18
14
61
31
57
54
5
(42
58
0)
(1
54
59
2)
RE
VE
NU
E m
inu
s E
XP
EN
DIT
UR
ES
29
35
5
(17
32
4)
(1
42
02
)
(25
73
7)
(3
39
27
)
(42
62
6)
(5
31
47
)
(65
23
7)
(7
64
92
)
(87
70
5)
(9
92
56
)
(11
11
57
)
(1
23
42
2)
(NO
T c
um
ula
tive
)
no
te
no
n-r
ec
urr
ing
ex
pe
nd
itu
res
-
-
-
-
-
-
-
-
-
-
-
-
-
net
recu
rrin
g r
ev-
exp
29
355
(17
324
)
(14
202
)
(25
737
)
(33
927
)
(42
626
)
(53
147
)
(65
237
)
(76
492
)
(87
705
)
(99
256
)
(111
157
)
(123
422
)
O
pe
ratin
g E
xp
en
se
s n
et
of
Fu
ll C
ost
Allo
ca
tio
n
Exp
en
ditu
re la
pse
is c
alc
ula
ted
on
Pe
rso
na
l S
erv
ice
s
Op
era
tin
g E
xp
en
se
s
Cap
ita
l O
utla
y
an
d G
ran
ts amp
Aid
s o
nly
FO
RE
CA
ST
F-13
F-14
00
200
400
600
800
1000
1200
1400
1600
1800
2014
2015
2016
2017
2018
2019
2020
Dollars (millions)
Cap
ital
Pro
jects
Fu
nd
Fo
reca
st
FY
2014
-FY
2020
Revenues
Expenditure
s
F-15
CA
PIT
AL
PR
OJ
EC
TS
FU
ND
FO
RE
CA
ST
Fu
nd
3001
Fo
rec
as
t A
ss
um
pti
on
s2014
2015
2016
2017
2018
2019
2020
2021
2022
2023
RE
VE
NU
ES
Infr
astr
uctu
re S
ale
s T
ax
35
30
30
30
30
30
30
Nin
th C
ent
Gas T
ax (
from
Tra
nsp T
rust)
-05
-0
5
-05
-0
5
-05
-0
5
-05
Impact
Fees (
from
Specia
l R
evenue F
und)
97
111
750
143
00
00
00
Gra
nts
-454
-5
63
-5
65
2494
-4
60
451
-6
37
Tra
nsfe
r fr
om
TD
C F
und
35
30
30
30
30
30
30
Reim
burs
em
ents
00
00
00
00
00
00
00
Oth
er
revenues
20
20
20
20
20
20
20
EX
PE
ND
ITU
RE
S
na
Pro
jecte
d E
co
no
mic
Co
nd
itio
ns
Ind
icato
rs
Consum
er
Price I
ndex
c
hange
15
18
17
20
19
21
20
20
20
20
F-16
CA
PIT
AL
PR
OJ
EC
TS
FU
ND
FO
RE
CA
ST
Fu
nd
3001
(in
$ t
ho
usan
ds
)A
ctu
al
Bu
dg
et
Esti
mate
dE
sti
mate
dE
sti
mate
dE
sti
mate
dE
sti
mate
dE
sti
mate
dE
sti
mate
dE
sti
mate
dE
sti
mate
dE
sti
mate
dE
sti
mate
d
2012
2013
2013
2014
2015
2016
2017
2018
2019
2020
2021
2022
2023
BE
GIN
NIN
G F
UN
D B
AL
AN
CE
513
090
1183
981
811
543
229
618
323
598
225
659
266
472
231
680
279
197
353
804
-
RE
VE
NU
ES
Infr
astr
uctu
re S
ale
s T
ax
(Penny f
or
Pin
ella
s)
777
592
758
824
804
810
832
978
857
968
883
707
910
218
937
524
965
650
328
225
-
Gra
nts
105
006
326
930
326
930
178
459
77
908
33
921
118
510
63
975
92
825
33
715
Reim
burs
em
ents
-
-
-
Nin
th C
ent
Gas T
ax (
Tra
nsfe
r fr
om
Tra
nsport
ation T
rust
Fund)
30
000
21
560
21
560
25
000
25
000
25
000
25
000
25
000
25
000
25
000
Tra
nsport
ation I
mpact
Fees (
from
Specia
l R
evenue F
und)
10
547
16
407
16
407
18
000
20
000
35
000
40
000
40
000
40
000
40
000
Tra
nsfe
r fr
om
Genera
l F
und
8478
18
000
18
000
18
000
18
000
18
000
18
000
3000
3000
3000
Tra
nsfe
r fr
om
TD
C F
und
26
513
32
424
32
424
29
395
30
277
31
185
32
121
33
085
34
077
35
099
Tra
nsfe
r fr
om
Fire D
istr
icts
Suth
erland B
ayou M
arina M
itig
P
ymnt
297
Sale
-Surp
lus C
ounty
Land
366
Inte
rest
2563
2138
2138
1607
3
3236
0
4513
2
7994
2
6950
4
8375
9
10
614
1
Oth
er
revenues
1199
1200
1224
1248
1273
1299
1325
1351
1378
Reappro
priation o
f R
evenue-R
esta
tem
ent
-
-
-
-
-
-
-
-
-
-
Inte
rfund L
oan-S
olid
Waste
-Chill
er
-
75
000
Inte
rfund L
oan-S
olid
Waste
-
100
000
100
000
450
000
-
-
-
-
-
-
-
-
-
TO
TA
L R
EV
EN
UE
S962
561
1276
283
1398
469
1554
664
1033
637
1032
600
1153
142
1110
859
1170
280
477
031
-
-
-
v
s p
rior
year
TO
TA
L R
ES
OU
RC
ES
1475
651
2460
264
2210
012
1784
282
1357
235
1258
259
1419
614
1342
539
1449
477
830
835
-
-
-
EX
PE
ND
ITU
RE
S
Capital P
roje
cts
663
790
1962
594
1962
594
1442
884
1063
776
924
487
1121
434
861
842
894
473
401
483
Debt
Serv
ice o
n I
nte
rfund L
oan
318
2800
2800
2800
2800
2300
1500
1500
1200
500
Paym
ent
on S
W L
oan-C
hill
er
15
000
15
000
15
000
15
000
15
000
15
000
Paym
ent
on S
W L
oan
50
000
50
000
50
000
200
000
200
000
150
000
TO
TA
L E
XP
EN
DIT
UR
ES
664
108
1980
394
1980
394
1460
684
1131
576
991
787
1187
934
1063
342
1095
673
551
983
-
-
-
EN
DIN
G F
UN
D B
AL
AN
CE
811
543
479
870
229
618
323
598
225
659
266
472
231
680
279
197
353
804
278
852
-
-
-
TO
TA
L R
EQ
UIR
EM
EN
TS
1475
651
2460
264
2210
012
1784
282
1357
235
1258
259
1419
614
1342
539
1449
477
830
835
-
-
-
RE
VE
NU
E m
inu
s E
XP
EN
DIT
UR
ES
298
453
(704
111
)
(5
81
925
)
93
980
(9
7939
)
40
813
(3
4792
)
47
517
74
607
(7
4952
)
-
-
-
(NO
T c
um
ula
tive)
ne
t re
cu
rrin
g r
ev-
ex
p2
98
45
3
(70
41
11
)
(5
81
92
5)
93
98
0
(9
79
39
)
40
81
3
(3
47
92
)
47
51
7
7
46
07
(74
95
2)
-
-
-
Note
F
Y2021 a
nd F
Y2022 n
ot
inclu
ded a
s P
enny f
or
Pin
ella
s is a
uth
orized o
nly
thro
ugh a
port
ion o
f F
Y2020
FO
RE
CA
ST
F-17
F-18
600
700
800
900
1000
1100
1200
1300
1400
1500
2014
2015
2016
2017
2018
2019
2020
2021
2022
2023
Dollars (millions) E
me
rge
nc
y M
ed
ica
l S
erv
ice
s F
un
d F
ore
ca
st
FY
20
14
- F
Y2
02
3
RE
VE
NU
ES
E
XP
EN
DIT
UR
ES
F-19
EM
ER
GE
NC
Y M
ED
ICA
L S
ER
VIC
ES
FU
ND
FO
RE
CA
ST
Fu
nd
10
06
Fo
rec
as
t A
ss
um
pti
on
s2014
2015
2016
2017
2018
2019
2020
2021
2022
2023
RE
VE
NU
ES
Ad V
alo
rem
Revenue (
95
)25
25
30
30
30
30
30
30
30
30
Am
bula
nce S
vc C
ontr
act F
ees
20
20
20
20
20
20
20
20
20
20
Am
bula
nce A
nnual M
em
bers
Fees
00
00
00
00
00
00
00
00
00
00
Gra
nt R
evenue (
EM
S T
rust F
und)
20
20
20
20
20
20
20
20
20
20
Oth
er
revenues (
ref of prior
yrs
exp)
00
00
00
00
00
00
00
00
00
00
EX
PE
ND
ITU
RE
S
Pers
onal S
erv
ices
41
40
40
40
40
40
40
40
40
40
Opera
ting E
xpenses
15
18
17
20
19
21
20
20
20
20
Opera
ting E
xpenses-F
irst R
esp M
ed S
upplie
s30
30
30
30
30
30
30
30
30
30
Capital O
utlay
15
18
17
20
19
21
20
20
20
20
Am
bula
nce C
ontr
act
60
60
60
60
60
60
60
60
60
60
EM
S T
rust F
und G
rant E
xpenditure
s20
20
20
20
20
20
20
20
20
20
Gra
nts
amp A
ids (
First R
esponder
Agm
ts)
50
50
50
50
50
50
50
50
50
50
Pro
jecte
d E
co
no
mic
Co
nd
itio
ns In
dic
ato
rs
Consum
er
Price Index
change
15
18
17
20
19
21
20
20
20
20
FL P
er
Capita P
ers
onal I
ncom
e G
row
th20
22
22
18
14
15
17
16
16
16
Estim
ate
d N
ew
Constr
uctio
n
of ta
x b
ase
05
05
10
10
10
10
10
10
10
10
F-20
EM
ER
GE
NC
Y M
ED
ICA
L S
ER
VIC
ES
FU
ND
FO
RE
CA
ST
Fu
nd
10
06
(in
$ t
ho
usan
ds)
Actu
al
Bu
dg
et
Esti
mate
dE
sti
mate
dE
sti
mate
dE
sti
mate
dE
sti
mate
dE
sti
mate
dE
sti
mate
dE
sti
mate
dE
sti
mate
dE
sti
mate
dE
sti
mate
d
2012
2013
2013
2014
2015
2016
2017
2018
2019
2020
2021
2022
2023
BE
GIN
NIN
G F
UN
D B
AL
AN
CE
213
713
212
463
236
861
228
126
193
023
130
444
40
697
(80
635
)
(235
598
)
(425
541
)
(652
971
)
(920
627
)
(1231
417
)
RE
VE
NU
ES
Ad V
alo
rem
Revenue
95
422
112
438
521
438
521
449
484
460
721
474
543
488
779
503
442
518
546
534
102
550
125
566
629
583
628
Am
bula
nce S
vc C
ontr
act F
ees
95
439
968
415
266
423
571
432
043
440
684
449
497
458
487
467
657
477
010
486
550
496
281
506
207
516
331
Am
bula
nce A
nnual M
em
bers
Fees
2225
1995
1995
1995
1995
1995
1995
1995
1995
1995
1995
1995
1995
Gra
nt R
evenue (
EM
S T
rust F
und)
159
2000
2000
2040
2081
2122
2165
2208
2252
2297
2343
2390
2438
Cty
Off F
ees (
TC
amp P
A)
2918
2676
2676
2703
2730
2757
2785
2813
2841
2869
2898
2927
2956
Inte
rest
1348
1360
1360
1370
1930
2609
1221
-
-
-
-
-
-
Oth
er
revenues (
refu
nd o
f prior
yrs
exp)
588
256
256
256
256
256
256
256
256
256
256
256
256
A
dju
st T
ax R
evenues to 9
6
-
4616
4731
4850
4995
5145
5299
5458
5622
5791
5965
6143
A
dju
st A
mbula
nce R
evenues to 1
00
-
22
398
22
846
23
303
23
769
24
245
24
729
25
224
25
729
26
243
26
768
27
303
TO
TA
L R
EV
EN
UE
S869
318
862
074
897
394
917
468
938
549
962
544
985
077
1008
400
1033
582
1059
420
1085
932
1113
136
1141
051
v
s p
rior
yea
r16
-1
3
2
2
3
2
2
2
2
3
3
3
TO
TA
L R
ES
OU
RC
ES
1083
031
1074
537
1134
255
1145
593
1131
573
1092
988
1025
775
927
765
797
984
633
879
432
961
192
510
(90
366
)
EX
PE
ND
ITU
RE
S
Pers
onal S
erv
ices
27
036
28
849
28
849
30
032
31
233
32
482
33
782
35
133
36
538
38
000
39
520
41
101
42
745
Opera
ting E
xpenses
43
723
58
678
58
678
59
558
60
630
61
661
62
894
64
089
65
435
66
744
68
079
69
440
70
829
O
pera
ting E
xpenses -
First R
esponder
Medic
al S
upplie
s
10
885
12
360
12
360
12
731
13
113
13
506
13
911
14
329
14
758
15
201
15
657
16
127
16
611
Capital O
utlay
4699
7900
7900
8019
8163
8302
8468
8629
8810
8986
9166
9349
9536
Am
bula
nce C
ontr
act
366
575
382
000
382
000
404
920
429
215
454
968
482
266
511
202
541
874
574
387
608
850
645
381
684
104
EM
S T
rust F
und G
rant E
xpenditure
s159
2000
2000
2040
2081
2122
2165
2208
2252
2297
2343
2390
2438
Gra
nts
amp A
ids (
First R
esponder
Agm
ts)
381
984
401
566
401
566
421
644
442
727
464
863
488
106
512
511
538
137
565
044
593
296
622
961
654
109
Trf
rs to P
A amp
TC
11
109
12
776
12
776
13
626
13
967
14
386
14
818
15
262
15
720
16
192
16
677
17
178
17
693
Expenditure
Lapse 1
A
mt
Inclu
de
s E
cke
rd C
on
tra
ct
TO
TA
L E
XP
EN
DIT
UR
ES
846
170
906
129
906
129
952
570
1001
128
1052
291
1106
410
1163
363
1223
525
1286
850
1353
588
1423
926
1498
064
v
s p
rior
yea
r1
7
7
5
5
5
5
5
5
5
5
5
5
EN
DIN
G F
UN
D B
AL
AN
CE
236
861
168
408
228
126
193
023
130
444
40
697
(80
635
)
(235
598
)
(425
541
)
(652
971
)
(920
627
)
(1231
417
)
(1588
430
)
Endin
g b
ala
nce a
s
of E
xpenditure
s280
186
252
203
130
39
-7
3
-203
-3
48
-5
07
-6
80
-8
65
-1
060
TO
TA
L R
EQ
UIR
EM
EN
TS
1083
031
1074
537
1134
255
1145
593
1131
573
1092
988
1025
775
927
765
797
984
633
879
432
961
192
510
(90
366
)
RE
VE
NU
E m
inu
s E
XP
EN
DIT
UR
ES
23
148
(44
055
)
(8735
)
(35
102
)
(62
579
)
(89
747
)
(121
332
)
(154
963
)
(189
943
)
(227
430
)
(267
656
)
(310
790
)
(357
013
)
(NO
T c
um
ula
tive)
no
te
no
n-r
ec
urr
ing
exp
en
dit
ure
s-
-
-
-
-
-
-
-
-
-
-
-
-
ne
t re
cu
rrin
g r
ev-
ex
p2
31
48
(44
05
5)
(87
35
)
(35
10
2)
(62
57
9)
(89
74
7)
(12
13
32
)
(15
49
63
)
(18
99
43
)
(22
74
30
)
(26
76
56
)
(31
07
90
)
(35
70
13
)
1)
FY
2013 r
eflects
the n
ew
ord
inance p
assed b
y B
oard
action o
n D
ecem
ber
20th
2011 to
main
tain
as c
lose a
s p
ossib
le a 2
5
Begin
nin
g F
und B
ala
nce P
erc
enta
ge o
f re
serv
e b
ala
nce d
eclin
es g
oin
g into
FY
2014 a
nd is d
eple
ted in F
Y2017
2)
EM
S M
illage incre
ased fro
m 0
5832 in F
Y11 to 0
8506 in F
Y12 is
then incre
ased to 0
9158 in F
Y13 and then a
ssum
ed to r
em
ain
fla
t th
roughout th
e r
em
ain
der
of th
e fore
cast period M
axim
um
annual E
MS
levy is 1
5000 m
ills
3)
Assum
es e
stim
ate
d A
d V
alo
rem
revenue is a
t 96
except th
e F
Y13 A
dopte
d B
udget w
hic
h r
em
ain
s a
t 95
per
sta
tute
4)
Assum
es e
stim
ate
d a
mbula
nce r
evenue is a
t 100
except th
e F
Y13 A
dopte
d B
udget w
hic
h r
em
ain
s a
t 95
per
sta
tute
5)
The F
irst R
esponder
Agre
em
ents
reflect a 5
incre
ase in F
Y2013 a
nd the r
em
ain
ing fore
cast years
T
his
does n
ot re
flect any c
hanges in s
erv
ice
6)
The E
xpenditure
lapse is n
ot calc
ula
ted o
n this
fund a
s the m
ajo
rity
of th
e e
xpenditure
s w
ithin
this
fund a
re c
ontr
actu
al and a
re fully
expended e
ach y
ear
FO
RE
CA
ST
(
96
Ad
Valo
rem
Reven
ue a
nd
100
Am
bu
lan
ce R
even
ue)
F-21
F-22
100
120
140
160
180
200
220
240
2014
2015
2016
2017
2018
2019
2020
2021
2022
2023
Dollars (millions)
Fir
e D
istr
icts
Fu
nd
Fo
rec
as
t F
Y2
01
4 -
FY
20
23
RE
VE
NU
ES
E
XP
EN
DIT
UR
ES
F-23
FIR
E D
IST
RIC
TS
FU
ND
FO
RE
CA
ST
Fu
nd
10
50
Fo
rec
as
t A
ss
um
pti
on
s2014
2015
2016
2017
2018
2019
2020
2021
2022
2023
RE
VE
NU
ES
Ad V
alo
rem
Tax R
evenue
20
20
25
25
25
25
25
25
25
25
EX
PE
ND
ITU
RE
S
Pers
onal S
erv
ices
41
40
40
40
40
40
40
40
40
40
Opera
ting E
xpenses
15
18
17
20
19
21
20
20
20
20
Capital O
utlay
15
18
17
20
19
21
20
20
20
20
Debt S
erv
ice
00
00
00
00
00
00
00
00
00
00
Gra
nts
amp A
ids (
Cty
Pym
ts)
40
40
40
40
40
40
40
40
40
40
Pro
jecte
d E
co
no
mic
Co
nd
itio
ns In
dic
ato
rs
Consum
er
Price Index
change
15
18
17
20
19
21
20
20
20
20
FL P
er
Capita P
ers
onal I
ncom
e G
row
th20
22
22
18
14
15
17
16
16
16
Estim
ate
d N
ew
Constr
uctio
n
of ta
x b
ase
05
05
10
10
10
10
10
10
10
10
F-24
FIR
E D
IST
RIC
TS
FU
ND
FO
RE
CA
ST
Fu
nd
10
50
(in
$ t
ho
usan
ds)
Actu
al
Bu
dg
et
Esti
mate
dE
sti
mate
dE
sti
mate
dE
sti
mate
dE
sti
mate
dE
sti
mate
dE
sti
mate
dE
sti
mate
dE
sti
mate
dE
sti
mate
dE
sti
mate
d
2012
2013
2013
2014
2015
2016
2017
2018
2019
2020
2021
2022
2023
BE
GIN
NIN
G F
UN
D B
AL
AN
CE
84
213
79
934
85
039
89
924
92
274
92
046
90
481
87
379
81
567
72
793
60
793
45
284
25
967
RE
VE
NU
ES
Ad V
alo
rem
Revenue
95
150
180
148
220
148
220
151
184
154
208
158
063
162
015
166
065
170
217
174
472
178
834
183
305
187
888
Cty
Off F
ees (
TC
amp P
A)
1079
949
949
968
987
1007
1027
1048
1069
1090
1112
1134
1157
Oth
er
Rev (
Inte
rest G
ain
Loss Inv)
535
538
538
629
923
1841
2714
2621
2447
2184
1824
1359
779
Inte
rest -
Tax C
olle
cto
r01
01
01
01
01
01
01
01
01
01
01
01
01
Adju
st P
ropert
y T
axes to
96
1560
1591
1623
1664
1705
1748
1792
1837
1882
1930
1978
Adju
st O
ther
Revenue to 1
00
78
84
101
150
197
193
185
172
155
131
102
TO
TA
L R
EV
EN
UE
S151
795
149
708
151
347
154
458
157
843
162
726
167
660
171
677
175
711
179
756
183
808
187
860
191
904
v
s p
rior
yea
r4
-1
0
2
2
3
3
2
2
2
2
2
2
TO
TA
L R
ES
OU
RC
ES
236
008
229
642
236
386
244
382
250
117
254
773
258
142
259
056
257
278
252
549
244
601
233
144
217
872
EX
PE
ND
ITU
RE
S
Pers
onal S
erv
ices
800
1301
1301
1354
1409
1465
1523
1584
1648
1714
1782
1854
1928
Opera
ting E
xpenditure
s1722
1344
1344
1364
1389
1412
1441
1468
1499
1529
1559
1591
1622
C
urr
Chgs amp
Oblig
(C
ty F
ire A
dm
in C
hgs)
2448
2645
2645
2685
2733
2779
2835
2889
2950
3009
3069
3130
3193
Debt S
erv
ice
-
05
05
05
05
05
05
05
05
05
05
05
05
Gra
nts
amp A
ids (
City P
aym
ents
)144
037
139
232
139
232
144
801
150
593
156
617
162
882
169
397
176
173
183
220
190
549
198
171
206
097
Trf
rs to P
A amp
TC
4410
4580
4580
4583
4675
4792
4912
5034
5160
5289
5421
5557
5696
Pro
-Rate
Cle
aring (
County
Fire A
dm
in C
hgs)
(2448
)
(2645
)
(2645
)
(2685
)
(2733
)
(2779
)
(2835
)
(2889
)
(2950
)
(3009
)
(3069
)
(3130
)
(3193
)
Expenditure
Lapse 1
TO
TA
L E
XP
EN
DIT
UR
ES
150
969
146
462
146
462
152
108
158
071
164
291
170
762
177
489
184
485
191
756
199
317
207
177
215
348
v
s p
rior
yea
r1
-3
-3
4
4
4
4
4
4
4
4
4
4
EN
DIN
G F
UN
D B
AL
AN
CE
85
039
83
180
89
924
92
274
92
046
90
481
87
379
81
567
72
793
60
793
45
284
25
967
2523
Endin
g b
ala
nce a
s
of R
esourc
es
360
362
380
378
368
355
338
315
283
241
185
111
12
TO
TA
L R
EQ
UIR
EM
EN
TS
236
008
229
642
236
386
244
382
250
117
254
773
258
142
259
056
257
278
252
549
244
601
233
144
217
872
RE
VE
NU
E m
inu
s E
XP
EN
DIT
UR
ES
826
3246
4885
2350
(227
)
(1565
)
(3102
)
(5812
)
(8774
)
(12
000
)
(15
509
)
(19
317
)
(23
444
)
(NO
T c
um
ula
tive)
no
te
no
n-r
ecu
rrin
g e
xp
en
dit
ure
s-
-
-
-
-
-
-
-
-
-
-
-
-
ne
t re
cu
rrin
g r
ev-
ex
p8
26
32
46
48
85
23
50
(22
7)
(15
65
)
(31
02
)
(58
12
)
(87
74
)
(12
00
0)
(15
50
9)
(19
31
7)
(23
44
4)
E
xpenditure
lapse is
not calc
ula
ted o
n this
fund a
s the m
ajo
rity
of th
e e
xpenditure
s w
ithin
this
fund a
re c
ontr
actu
al a
nd a
re fully
expended e
ach y
ear
1)
Assum
es e
stim
ate
d A
d V
alo
rem
revenue is a
t 96
except th
e F
Y13 A
dopte
d B
udget w
hic
h r
em
ain
s a
t 95
per
sta
tute
FO
RE
CA
ST
(
96
Ad
Valo
rem
Reven
ue a
nd
100
Oth
er
Reven
ue)
F-25
F-26
$0
0
$2
0
$4
0
$6
0
$8
0
$1
00
$1
20
$1
40
20
13
2
01
4
20
15
2
01
6
20
17
2
01
8
20
19
2
02
0
20
21
2
02
2
20
23
Millions A
irp
ort
Fu
nd
Fo
reca
st
FY2
01
3 -
FY
20
23
Ex
clu
din
g N
on
-Re
curr
ing
Rev
en
ue
s an
d E
xpe
nd
itu
res
Rev
enu
es
Exp
end
itu
res
F-27
AIR
PO
RT
FU
ND
FO
RE
CA
ST
Fu
nd
40
01
Fo
recast
Assu
mp
tio
ns
2014
2015
2016
2017
2018
2019
2020
2021
2022
2023
RE
VE
NU
ES
Airfield
Flig
ht
Lin
es
20
20
20
20
20
20
20
20
20
20
Golf C
ours
e00
00
00
00
00
00
00
00
00
00
Rents
LeasesC
oncessio
ns
20
20
20
20
20
20
20
20
20
20
Capital C
ontr
ibutions
-370
-1
41
391
-3
0
1291
-8
24
00
00
00
00
Oth
er
revenues
20
20
20
20
20
20
20
20
20
20
EX
PE
ND
ITU
RE
S
Pers
onal S
erv
ices
41
40
40
40
40
40
40
40
40
40
Opera
ting E
xpenses
15
18
17
20
19
21
20
20
20
20
Capital O
utlay
15
18
17
20
19
21
20
20
20
20
Gra
nts
amp A
ids
15
18
17
20
19
21
20
20
20
20
Pro
jecte
d E
co
no
mic
Co
nd
itio
ns
Ind
icato
rs
Consum
er
Price I
ndex
c
hange
15
18
17
20
19
21
20
20
20
20
FL P
er
Capita P
ers
onal In
com
e G
row
th20
22
22
18
14
15
17
16
16
16
F-28
AIR
PO
RT
FU
ND
FO
RE
CA
ST
Fu
nd
40
01
(in
$ t
ho
usan
ds
)A
ctu
al
Bu
dg
et
Esti
mate
dE
sti
mate
dE
sti
mate
dE
sti
mate
dE
sti
mate
dE
sti
mate
dE
sti
mate
dE
sti
mate
dE
sti
mate
dE
sti
mate
dE
sti
mate
d
2012
2013
2013
2014
2015
2016
2017
2018
2019
2020
2021
2022
2023
BE
GIN
NIN
G F
UN
D B
AL
AN
CE
146
350
136
909
157
937
141
502
146
618
141
557
139
653
119
666
117
424
124
073
129
864
134
705
138
499
RE
VE
NU
ES
Airfield
Flig
ht
Lin
es
25
776
25
452
26
792
27
328
27
874
28
432
29
001
29
581
30
172
30
776
31
391
32
019
32
659
Golf C
ours
e-
-
-
-
-
-
-
-
-
-
-
-
-
Rents
LeasesC
oncessio
ns
71
425
61
530
64
768
66
063
67
385
68
732
70
107
71
509
72
939
74
398
75
886
77
404
78
952
New
Pro
pert
y D
evelo
pm
ent
-
-
-
-
-
-
-
3300
3366
3433
3502
3572
3643
Gra
nts
2754
2650
2650
2703
2757
2812
2868
2926
2984
3044
3105
3167
3230
Capital C
ontr
ibutions
88
893
101
642
101
642
64
050
55
000
76
500
74
200
170
000
30
000
30
000
30
000
30
000
30
000
Inte
rest
743
889
889
991
1466
2831
4190
3590
3523
3722
3896
4041
4155
Oth
er
revenues
288
18
18
18
19
19
19
20
20
21
21
22
22
TO
TA
L R
EV
EN
UE
S189
879
192
181
196
759
161
153
154
501
179
327
180
385
280
925
143
005
145
394
147
801
150
224
152
662
44
4
-18
-4
16
1
56
-49
2
2
2
2
TO
TA
L R
ES
OU
RC
ES
336
229
329
090
354
695
302
655
301
119
320
883
320
038
400
591
260
428
269
467
277
665
284
929
291
161
EX
PE
ND
ITU
RE
S
Pers
onal S
erv
ices
41
940
43
250
43
250
45
023
46
824
48
697
50
645
52
671
54
778
56
969
59
248
61
617
64
082
Opera
ting E
xpenses
34
541
42
394
42
394
43
030
43
804
44
549
45
440
46
303
47
276
48
221
49
186
50
170
51
173
Golf C
ours
e O
pera
tions
main
tenance
-
-
-
-
-
-
-
-
-
-
-
-
-
Capital O
utlay
2665
1451
1451
1473
1499
1525
1555
1585
1618
1650
1683
1717
1751
Full
Cost
Allo
cation
4552
5111
5111
5147
5198
5302
5461
5625
5794
5968
6147
6331
6521
No
n-r
ecu
rrin
g C
IP e
xp
en
dit
ure
s94
594
123
600
123
600
64
050
65
000
84
000
100
200
180
000
30
000
30
000
30
000
30
000
30
000
Expenditure
Lapse 3
-
(2
613
)
(2
686
)
(2
764
)
(2
843
)
(2
929
)
(3
017
)
(3
110
)
(3
205
)
(3
304
)
(3
405
)
(3
510
)
TO
TA
L E
XP
EN
DIT
UR
ES
178
292
215
806
213
193
156
037
159
562
181
230
200
372
283
167
136
355
139
603
142
960
146
430
150
017
48
20
-27
2
14
11
41
-52
2
2
2
2
EN
DIN
G F
UN
D B
AL
AN
CE
157
937
113
284
141
502
146
618
141
557
139
653
119
666
117
424
124
073
129
864
134
705
138
499
141
144
AS
SU
MIN
G N
O A
CT
ION
TA
KE
N T
O
RE
SO
LV
E S
HO
RT
FA
LL
S
Endin
g b
ala
nce a
s
of
Resourc
es
47
34
40
48
47
44
37
29
48
48
49
49
48
TO
TA
L R
EQ
UIR
EM
EN
TS
336
229
329
090
354
695
302
655
301
119
320
883
320
038
400
591
260
428
269
467
277
665
284
929
291
161
RE
VE
NU
E m
inu
s E
XP
EN
DIT
UR
ES
11
587
(2
3625
)
(16
434
)
5116
(5
061
)
(1
903
)
(1
9987
)
(2242
)
6649
5791
4841
3794
2645
no
te
no
n-r
ecu
rrin
g C
IP e
xp
en
dit
ure
s94
594
123
600
123
600
64
050
65
000
84
000
100
200
180
000
30
000
30
000
30
000
30
000
30
000
no
n-r
ecu
rrin
g r
ev(c
ap
ital
co
ntr
ib)
(88
893
)
(101
642
)
(1
01
642
)
(6
4050
)
(55
000
)
(76
500
)
(74
200
)
(170
000
)
(3
0000
)
(30
000
)
(30
000
)
(30
000
)
(30
000
)
net
recu
rrin
g r
ev-
exp
17
288
(1
667
)
5524
5116
4939
5597
6013
7758
6649
5791
4841
3794
2645
O
pera
ting E
xpenses n
et
of
Full
Cost
Allo
cation
Expenditure
la
pse is c
alc
ula
ted o
n P
ers
onal S
erv
ices
Opera
ting E
xpenses
Capital O
utla
y
and G
rants
amp A
ids o
nly
FY
11 la
pse is u
sed t
o a
dju
st
for
update
d info
rmation
FO
RE
CA
ST
F-29
F-30
700
800
900
1000
1100
2014
2015
2016
2017
2018
2019
2020
2021
2022
2023
Dollars (millions)
Wa
ter
Sys
tem
Fu
nd
s F
ore
ca
st
FY
20
14
- F
Y2
02
3
wit
h R
ate
In
cre
as
es
Re
ve
nu
es
Exp
en
ditu
res
F-31
WA
TE
R F
UN
DS
FO
RE
CA
ST
Fu
nd
40
31
4
03
3
40
34
amp 4
03
6
Fo
rec
as
t A
ss
um
pti
on
s2014
2015
2016
2017
2018
2019
2020
2021
2022
2023
RE
VE
NU
ES
~W
ate
r S
ale
s-R
eta
il
20
20
20
21
22
23
23
23
23
23
Wate
r S
ale
s-W
hole
sale
-9
3
-49
-3
73
20
20
20
20
20
20
20
Oth
er
revenues
-29
-2
1
-11
-2
7
-09
20
20
20
20
20
~E
XP
EN
DIT
UR
ES
Pers
onal S
erv
ices
41
40
40
40
40
40
40
40
40
40
Opera
ting E
xpenses
20
23
18
17
17
18
17
19
21
21
Purc
hase o
f W
ate
r
10
21
08
16
10
25
25
25
25
25
Pow
er
00
50
50
50
50
50
50
50
50
50
Chem
icals
70
70
70
70
70
70
70
70
70
70
Pro
jecte
d E
co
no
mic
Co
nd
itio
ns In
dic
ato
rs
Consum
er
Price Index
change
15
18
17
20
19
21
20
20
20
20
FL P
er
Capita P
ers
onal I
ncom
e G
row
th20
22
22
18
14
15
17
16
16
16
R
evenue p
erc
enta
ges r
eflect th
e c
om
bin
ed im
pact of changes in r
ate
s a
ndo
r le
vels
of consum
ption
P
urc
hase o
f w
ate
r perc
enta
ges r
eflect th
e c
om
bin
ed im
pact of changes in T
am
pa B
ay W
ate
r ra
tes a
ndo
r changes in c
onsum
ption inclu
din
g d
ecre
ases in w
hole
sale
custo
mer
base
]
F-32
WA
TE
R F
UN
DS
FO
RE
CA
ST
Fu
nd
40
31
4
03
3
40
34
amp 4
03
6
(in
$ t
ho
usan
ds)
Actu
al
Bu
dg
et
Esti
mate
dE
sti
mate
dE
sti
mate
dE
sti
mate
dE
sti
mate
dE
sti
mate
dE
sti
mate
dE
sti
mate
dE
sti
mate
dE
sti
mate
dE
sti
mate
d
2012
2013
2013
2014
2015
2016
2017
2018
2019
2020
2021
2022
2023
BE
GIN
NIN
G F
UN
D B
AL
AN
CE
468
844
399
838
470
872
377
252
233
322
262
562
305
749
226
890
211
312
231
236
246
972
258
488
266
057
RE
VE
NU
ES
Wate
r S
ale
s -
Reta
il614
408
620
787
653
460
666
831
680
201
693
805
708
315
723
775
740
230
757
054
774
255
791
840
810
053
Wate
r S
ale
s -
Whole
sale
171
563
150
556
158
480
143
667
136
663
85
730
87
445
89
194
90
977
92
797
94
653
96
546
98
477
Inte
r est
2022
1791
1886
2641
2333
5251
9172
6807
6339
6937
7409
7755
7982
Oth
er
Revenues
60
514
40
925
43
079
41
845
40
954
40
495
39
420
39
060
39
069
39
079
39
088
39
098
39
098
TO
TA
L R
EV
EN
UE
S848
507
814
059
856
904
854
983
860
151
825
281
844
353
858
836
876
616
895
867
915
405
935
239
955
609
v
s p
rior
year
1
0
1
-4
2
2
2
2
2
2
2
TO
TA
L R
ES
OU
RC
ES
1317
351
1213
897
1327
776
1232
235
1093
473
1087
843
1150
102
1085
725
1087
929
1127
103
1162
377
1193
727
1221
666
EX
PE
ND
ITU
RE
S
Pers
onal S
erv
ices
123
054
126
772
126
772
131
970
137
248
142
738
148
448
154
386
160
561
166
984
173
663
180
609
187
834
OP
EB
11
862
13
333
13
333
13
880
14
435
15
012
15
613
16
237
16
887
17
562
18
264
18
995
19
755
Opera
ting E
xpenses
43
056
66
557
66
557
67
888
69
449
70
700
71
901
73
124
74
440
75
705
77
144
78
764
80
418
Purc
hase o
f W
ate
r472
008
454
472
454
472
420
906
423
097
383
991
388
292
390
406
401
079
412
042
423
303
434
870
445
741
Pow
er
17
439
18
628
18
628
18
628
19
560
20
538
21
565
22
643
23
775
24
964
26
212
27
523
28
899
Chem
icals
6777
7745
7745
8287
8867
9488
10
152
10
863
11
623
12
437
13
307
14
239
15
236
Gra
nts
amp A
ids
9782
9388
9388
9593
9198
9704
10
218
10
782
11
397
12
308
12
937
13
767
14
593
Cost A
llocation
86
548
57
117
57
117
58
259
59
599
60
672
61
703
62
752
63
882
64
968
66
202
67
593
69
012
Expenditure
Lapse
-
(7540
)
(7294
)
(7415
)
(7128
)
(7279
)
(7412
)
(7636
)
(7870
)
(8110
)
(8364
)
(8615
)
Debt S
erv
ice
81
100
100
-
-
-
-
-
-
-
-
-
-
Capital O
utlay
75
872
185
097
203
952
276
797
96
871
76
380
202
599
140
633
100
685
101
030
100
966
99
674
99
769
TO
TA
L E
XP
EN
DIT
UR
ES
846
479
939
209
950
524
998
914
830
910
782
094
923
212
874
413
856
693
880
131
903
889
927
670
952
642
v
s p
rior
year
-4
14
5
-17
-6
18
-5
-2
3
3
3
3
TO
TA
L E
ND
ING
FU
ND
BA
LA
NC
E470
872
274
688
377
252
233
322
262
562
305
749
226
890
211
312
231
236
246
972
258
488
266
057
269
024
Endin
g b
ala
nce a
s
of R
esourc
es
36
23
28
19
24
28
20
19
21
22
22
22
22
TO
TA
L R
EQ
UIR
EM
EN
TS
1317
351
1213
897
1327
776
1232
235
1093
473
1087
843
1150
102
1085
725
1087
929
1127
103
1162
377
1193
727
1221
666
RE
VE
NU
E m
inu
s E
XP
EN
DIT
UR
ES
2028
(125
150
)
(93
619
)
(143
931
)
29
241
43
187
(78
859
)
(15
578
)
19
924
15
736
11
516
7569
2967
(NO
T c
um
ula
tive)
E
xpenditure
lapse o
f 1
is c
alc
ula
ted o
n a
ll expenses e
xclu
din
g D
ebt S
erv
ice a
nd C
aptia
l Outa
y
Reven
ues r
efl
ect
the c
om
bin
ed
im
pact
of
ch
an
ges in
rate
s a
nd
or
levels
of
co
nsu
mp
tio
n
Estim
ate
d r
evenues fore
caste
d a
t 100
FO
RE
CA
ST
(
100
)
]
F-33
F-34
550
600
650
700
750
800
850
900
950
2014
2015
2016
2017
2018
2019
2020
2021
2022
2023
Dollars (millions)
Se
we
r S
ys
tem
Fo
rec
as
t F
Y2
01
4-F
Y2
02
3 w
ith
Ra
te I
nc
rea
se
s
Revenue
s
Expend
iture
s
F-35
SE
WE
R F
UN
DS
FO
RE
CA
ST
Fu
nd
4051
4052
4053
amp 4
055
Fo
recast
Assu
mp
tio
ns
20
14
20
15
20
16
20
17
20
18
20
19
20
20
20
21
20
22
20
23
RE
VE
NU
ES
Se
we
r C
ha
rge
s -
Re
tail
60
6
0
28
2
8
29
2
9
29
2
9
29
2
9
Se
we
r C
ha
rge
s -
Wh
ole
sa
le
90
9
0
28
2
8
29
3
0
30
3
0
30
3
0
Recla
ime
d -
Re
tail
59
5
6
27
2
8
27
2
8
27
2
8
27
2
7
Recla
ime
d -
Wh
ole
sa
le
20
2
0
20
2
0
20
2
0
20
2
0
20
2
0
Oth
er
reve
nu
es
00
0
0
00
0
0
00
0
0
00
0
0
00
0
0
EX
PE
ND
ITU
RE
S
Pe
rso
na
l S
erv
ice
s4
1
40
4
0
40
4
0
40
4
0
40
4
0
40
Op
era
tin
g E
xp
en
se
s2
0
23
1
8
17
1
7
18
1
7
19
2
1
21
Po
we
r0
0
50
5
0
50
5
0
50
5
0
50
5
0
50
Che
mic
als
70
7
0
70
7
0
70
7
0
70
7
0
70
7
0
Pro
jec
ted
Ec
on
om
ic C
on
dit
ion
s
In
dic
ato
rs
Con
su
me
r P
rice
In
de
x
c
ha
ng
e1
5
18
1
7
20
1
9
21
2
0
20
2
0
20
FL
Pe
r C
ap
ita
Pe
rso
na
l In
co
me
Gro
wth
20
2
2
22
1
8
14
1
5
17
1
6
16
1
6
R
eve
nu
e p
erc
en
tag
es r
efle
ct
the
co
mb
ine
d im
pa
ct
of
ch
an
ge
s in
ra
tes a
nd
or
leve
ls o
f co
nsu
mp
tio
n
F-36
SE
WE
R F
UN
DS
FO
RE
CA
ST
Fu
nd
4051
4052
4053
amp 4
055
(in
$ t
ho
us
an
ds
)A
ctu
al
Bu
dg
et
Es
tim
ate
dE
sti
ma
ted
Es
tim
ate
dE
sti
ma
ted
Es
tim
ate
dE
sti
ma
ted
Es
tim
ate
dE
sti
ma
ted
Es
tim
ate
dE
sti
ma
ted
Es
tim
ate
d
20
12
20
13
20
13
20
14
20
15
20
16
20
17
20
18
20
19
20
20
20
21
20
22
20
23
BE
GIN
NIN
G F
UN
D B
AL
AN
CE
53
19
65
47
58
45
49
87
60
37
52
76
37
98
17
43
50
12
48
44
76
53
16
74
57
54
45
63
35
13
69
87
40
77
08
03
84
94
28
RE
VE
NU
ES
Se
we
r C
ha
rge
s -
Re
tail
49
04
23
48
38
97
50
93
65
53
99
28
57
23
23
58
80
62
60
45
87
62
19
39
64
01
61
65
89
14
67
82
15
69
80
80
71
83
24
Se
we
r C
ha
rge
s -
Wh
ole
sa
le6
73
06
6
73
96
7
09
44
7
73
28
8
42
88
8
66
06
8
90
50
9
16
29
9
43
48
9
71
48
1
00
03
0
1
02
99
8
1
06
08
8
Recla
ime
d -
Re
tail
38
50
5
39
25
5
41
32
1
43
75
2
46
18
3
47
45
3
48
75
8
50
09
8
51
47
6
52
89
2
54
34
6
55
84
1
57
34
8
Recla
ime
d -
Wh
ole
sa
le3
17
1
31
60
3
32
7
33
27
3
32
7
33
27
3
32
7
33
27
3
32
7
33
27
3
32
7
33
27
3
32
7
Inte
rest
23
34
1
80
0
18
95
2
62
7
37
98
8
70
0
14
53
4
15
95
0
17
26
3
19
00
5
20
96
2
23
12
4
25
48
3
Oth
er
Re
ve
nu
es
1
36
84
4
73
7
49
86
4
98
6
49
86
4
98
6
49
86
4
98
6
49
86
4
98
6
49
86
4
98
6
49
86
TO
TA
L R
EV
EN
UE
S6
15
42
2
6
00
24
5
6
31
83
7
6
71
94
7
7
14
90
4
7
39
13
3
7
65
24
1
7
87
92
8
8
11
56
1
8
36
27
1
8
61
86
6
8
88
35
4
9
15
55
5
v
s p
rio
r ye
ar
7
11
6
6
3
4
3
3
3
3
3
3
TO
TA
L R
ES
OU
RC
ES
11
47
38
8
10
76
09
1
11
30
59
7
10
47
22
3
10
94
72
1
11
74
14
5
12
49
71
7
13
19
60
2
13
87
00
6
14
69
78
5
15
60
60
6
16
59
15
7
17
64
98
3
EX
PE
ND
ITU
RE
S
Pe
rso
na
l S
erv
ice
s1
29
23
3
1
49
25
7
1
49
25
7
1
55
37
6
1
61
59
1
1
68
05
5
1
74
77
7
1
81
76
8
1
89
03
9
1
96
60
1
2
04
46
5
2
12
64
3
2
21
14
9
OP
EB
12
99
2
13
52
4
13
52
4
14
07
9
14
64
2
15
22
8
15
83
7
16
47
0
17
12
9
17
81
4
18
52
7
19
26
8
20
03
9
Op
era
tin
g E
xp
en
se
s8
03
15
1
02
14
3
1
02
14
3
1
04
18
6
1
06
58
2
1
08
50
1
1
10
34
5
1
12
22
1
1
14
24
1
1
16
18
3
1
18
39
1
1
20
87
7
1
23
41
5
Po
we
r4
78
19
5
71
26
5
71
26
5
71
26
5
99
83
6
29
82
6
61
31
6
94
37
7
29
09
7
65
55
8
03
83
8
44
02
8
86
22
Che
mic
als
29
78
4
38
04
9
38
04
9
40
71
2
43
56
2
46
61
1
49
87
4
53
36
5
57
10
1
61
09
8
65
37
5
69
95
1
74
84
8
Cost
Allo
ca
tio
n5
59
70
4
30
31
4
30
31
4
38
91
4
49
01
4
57
09
4
64
86
4
72
76
4
81
27
4
89
45
4
98
75
5
09
23
5
19
92
Exp
en
ditu
re L
ap
se
-
-
(40
31
)
(4
15
4)
(43
13
)
(4
47
1)
(46
35
)
(4
80
5)
(49
85
)
(5
17
2)
(53
70
)
(5
58
1)
(58
01
)
Tra
nsfe
r fr
om
Wa
ter
-
(9
38
8)
(93
88
)
(9
59
3)
(91
98
)
(9
70
4)
(10
21
8)
(1
07
82
)
(11
39
7)
(1
23
08
)
(12
93
7)
(1
37
67
)
(14
59
3)
Deb
t S
erv
ice
14
93
99
14
79
88
14
38
71
14
38
61
14
39
48
14
37
47
14
36
75
14
63
45
14
64
38
14
63
07
14
61
55
14
60
64
14
60
08
-
Ca
pita
l O
utla
y1
43
11
6
2
45
34
8
2
21
74
0
1
21
92
0
9
80
10
1
13
01
2
1
25
77
0
1
32
86
0
1
24
89
0
1
25
02
2
1
24
94
0
1
24
95
0
1
24
85
0
TO
TA
L E
XP
EN
DIT
UR
ES
64
86
27
78
70
77
75
53
21
66
74
06
65
97
09
68
96
70
71
80
43
74
41
57
75
34
93
77
10
45
78
98
03
80
97
30
83
05
29
v
s p
rio
r ye
ar
0
30
-1
2
-1
5
4
4
1
2
2
3
3
TO
TA
L E
ND
ING
FU
ND
BA
LA
NC
E4
98
76
0
2
89
01
3
3
75
27
6
3
79
81
7
4
35
01
2
4
84
47
6
5
31
67
4
5
75
44
5
6
33
51
3
6
98
74
0
7
70
80
3
8
49
42
8
9
34
45
4
En
din
g b
ala
nce
as
of
Reso
urc
es
43
2
7
33
3
6
40
4
1
43
4
4
46
4
8
49
5
1
53
TO
TA
L R
EQ
UIR
EM
EN
TS
11
47
38
8
10
76
09
1
11
30
59
7
10
47
22
3
10
94
72
1
11
74
14
5
12
49
71
7
13
19
60
2
13
87
00
6
14
69
78
5
15
60
60
6
16
59
15
7
17
64
98
3
Deb
t S
erv
ice
Co
ve
rag
e1
74
16
81
88
20
62
13
22
02
21
22
52
30
23
52
39
24
4
RE
VE
NU
E m
inu
s E
XP
EN
DIT
UR
ES
(33
20
5)
(1
86
83
2)
(12
34
84
)
4
54
1
55
19
5
49
46
3
47
19
8
43
77
2
58
06
8
65
22
6
72
06
3
78
62
5
85
02
6
(NO
T c
um
ula
tive
)
O
pe
ratin
g E
xp
en
se
s n
et
of
Cost
Allo
ca
tio
n
Exp
en
ditu
re la
pse
of
1
is c
alc
ula
ted
on
all
exp
en
se
s e
xclu
din
g D
eb
t S
erv
ice
an
d C
ap
ita
l O
utla
y
Rev
en
ue
s r
efl
ec
t th
e c
om
bin
ed
im
pa
ct
of
ch
an
ge
s i
n r
ate
s a
nd
or
lev
els
of
co
ns
um
pti
on
FO
RE
CA
ST
(
10
0
)
F-37
F-38
500
600
700
800
900
1000
1100
1200
1300
1400
1500
2014
2015
2016
2017
2018
2019
2020
2021
2022
2023
Dollars (millions)
So
lid
Wa
ste
Fu
nd
s F
ore
ca
st
FY
20
14
- F
Y2
02
3
Reven
ue
s
Exp
en
dit
ure
s
No
te
Do
es n
ot
incl
ud
e C
ap
ita
l Pro
ject
s Fu
nd
loa
n a
ctiv
ity
F-39
SO
LID
WA
ST
E F
UN
DS
FO
RE
CA
ST
Fu
nd
4021 amp
4023
Fo
recast
Assu
mp
tio
ns
20
14
20
15
20
16
20
17
20
18
20
19
20
20
20
21
20
22
20
23
RE
VE
NU
ES
Tip
pin
g F
ee
s0
5
05
0
5
05
0
5
05
0
5
05
0
5
05
Ele
ctr
icity S
ale
s0
5
05
0
5
05
0
5
05
0
5
05
0
5
05
Ele
ctr
ica
l C
ap
acity
64
6
4
64
6
4
64
6
4
64
6
4
64
6
4
Recyclin
g R
eve
nu
e0
0
00
0
0
00
0
0
00
0
0
00
0
0
00
Oth
er
reve
nu
es
20
2
0
20
2
0
20
2
0
20
2
0
20
2
0
EX
PE
ND
ITU
RE
S
Pe
rso
na
l S
erv
ice
s4
1
40
4
0
40
4
0
40
4
0
40
4
0
40
Op
era
tin
g E
xp
en
se
s2
0
23
1
8
17
1
7
18
1
7
19
2
1
21
WT
E S
erv
ice
Fe
e1
9
19
1
9
20
2
0
19
1
9
20
2
0
20
La
nd
fill S
erv
ice
Fe
e1
9
19
1
9
20
2
0
19
1
9
20
2
0
20
HE
C3 C
osts
20
2
3
18
1
7
17
1
8
17
1
9
21
2
1
Gra
nts
amp A
ids
00
0
0
00
0
0
00
0
0
00
0
0
00
0
0
Cost
Allo
ca
tio
n1
9
19
1
9
20
2
0
19
1
9
20
2
0
20
Pro
jec
ted
Ec
on
om
ic C
on
dit
ion
s
In
dic
ato
rs
Con
su
me
r P
rice
In
de
x
c
ha
ng
e1
5
18
1
7
20
1
9
21
2
0
20
2
0
20
FL
Pe
r C
ap
ita
Pe
rso
na
l In
co
me
Gro
wth
20
2
2
22
1
8
14
1
5
17
1
6
16
1
6
F-40
SO
LID
WA
ST
E F
UN
DS
FO
RE
CA
ST
Fu
nd
4021 amp
4023
(in
$ t
ho
us
an
ds
)A
ctu
al
Bu
dg
et
Es
tim
ate
dE
sti
ma
ted
Es
tim
ate
dE
sti
ma
ted
Es
tim
ate
dE
sti
ma
ted
Es
tim
ate
dE
sti
ma
ted
Es
tim
ate
dE
sti
ma
ted
Es
tim
ate
d
20
12
20
13
20
13
20
14
20
15
20
16
20
17
20
18
20
19
20
20
20
21
20
22
20
23
BE
GIN
NIN
G F
UN
D B
AL
AN
CE
16
62
93
71
14
67
68
18
86
75
61
67
89
39
11
24
25
01
23
17
21
13
77
67
31
53
64
28
18
91
29
02
42
47
58
29
38
75
13
34
89
82
38
29
88
1
RE
VE
NU
ES
Tip
pin
g F
ee
s3
34
89
93
37
29
23
55
04
43
56
81
93
58
60
33
60
39
63
62
19
83
64
00
93
65
82
93
67
65
83
69
49
73
71
34
43
73
20
1
Ele
ctr
icity S
ale
s9
78
17
11
29
43
11
88
87
11
94
82
12
00
79
12
06
80
12
12
83
12
18
89
12
24
99
12
31
11
12
37
27
12
43
46
12
49
67
Ele
ctr
ica
l C
ap
acity
36
89
71
37
28
18
39
24
40
41
73
80
44
39
00
47
21
20
50
21
90
53
41
20
56
81
40
60
43
30
64
27
80
68
37
20
72
72
80
Recyclin
g R
eve
nu
e4
65
05
76
86
07
16
07
16
07
16
07
16
07
16
07
16
07
16
07
16
07
16
07
16
07
1
Inte
rest
74
78
18
86
19
85
11
75
31
12
42
24
63
44
13
30
46
09
35
67
39
72
74
38
81
63
10
04
69
11
48
96
Oth
er
reve
nu
es
31
33
11
07
21
12
81
15
01
17
31
19
71
22
11
24
51
27
01
29
61
32
21
34
81
37
5
Deb
t S
erv
ice
on
Lo
an
fro
m C
ap
ita
l F
un
d3
18
28
71
30
22
28
00
28
00
23
00
15
00
15
00
12
00
50
00
00
00
0
Lo
an
re
pa
ym
en
t fr
om
Ca
pita
l F
un
d (
Chille
r)0
01
50
00
15
78
91
50
00
15
00
01
50
00
15
00
00
00
00
00
00
00
0
Lo
an
re
pa
ym
en
t fr
om
Ca
pita
l F
un
d0
00
00
00
05
00
00
50
00
05
00
00
20
00
00
20
00
00
15
00
00
00
00
00
TO
TA
L R
EV
EN
UE
S8
45
46
48
49
64
98
94
36
79
30
45
51
00
88
70
10
52
39
91
10
07
94
12
74
92
81
32
17
48
13
25
71
01
23
15
59
12
87
29
91
34
77
91
v
s p
rio
r ye
ar
-1
5
4
8
4
5
16
4
0
-7
5
5
TO
TA
L R
ES
OU
RC
ES
25
08
40
11
99
64
17
27
81
12
32
60
93
95
21
33
11
92
28
41
19
24
78
46
72
81
13
56
32
13
03
93
75
04
68
41
70
31
04
63
62
81
51
77
67
2
EX
PE
ND
ITU
RE
S
Pe
rso
na
l S
erv
ice
s4
91
07
58
67
85
86
78
61
08
46
35
27
66
06
86
87
11
71
46
07
43
18
77
29
18
03
82
83
59
88
69
41
OP
EB
48
96
50
96
50
96
53
05
55
17
57
38
59
68
62
06
64
55
67
13
69
81
72
60
75
51
Op
era
tin
g E
xp
en
se
s
40
74
67
86
11
78
61
17
97
90
81
22
68
26
07
84
25
98
58
60
87
66
38
94
17
91
20
59
30
29
94
89
0
WT
E S
erv
ice
Fe
e2
23
49
13
12
93
53
12
93
53
18
88
13
24
93
93
31
11
33
37
73
63
44
49
03
51
03
63
57
70
53
64
85
93
72
15
63
79
60
0
La
nd
fill S
erv
ice
Fe
e8
89
03
11
29
71
11
29
71
11
51
18
11
73
05
11
95
34
12
19
24
12
43
63
12
67
26
12
91
34
13
17
16
13
43
51
13
70
38
HE
C3 C
osts
13
41
81
76
42
17
64
21
79
95
18
40
91
87
40
19
05
81
93
82
19
73
12
00
67
20
44
82
08
77
21
31
6
Gra
nts
amp A
ids
49
87
50
00
50
00
50
00
50
00
50
00
50
00
50
00
50
00
50
00
50
00
50
00
50
00
Cost
Allo
ca
tio
ns
29
02
23
27
77
32
77
73
32
69
33
86
73
44
43
35
13
23
58
00
36
55
13
72
82
38
02
83
87
89
39
56
4
Cap
ita
l O
utla
y1
67
07
64
00
89
43
09
71
04
05
06
92
58
10
52
49
83
52
71
02
82
34
43
08
78
75
96
33
59
00
94
58
89
05
77
70
Inte
rfu
nd
Lo
an
to
Ca
pita
l F
un
d0
01
00
00
01
75
00
04
50
00
00
00
00
00
00
00
00
00
00
0
Exp
en
ditu
re L
ap
se
0
0(6
23
7)
(63
64
)(6
49
8)
(66
32
)(6
77
8)
(69
26
)(7
07
5)
(72
26
)(7
38
6)
(75
51
)(7
71
9)
TO
TA
L E
XP
EN
DIT
UR
ES
62
16
45
11
24
60
41
10
21
83
14
85
14
59
01
39
99
06
44
69
42
03
99
20
06
67
88
28
08
11
71
78
21
32
88
06
40
08
21
95
1
v
s p
rio
r ye
ar
-3
72
3
5
-39
1
4
-2
-1
4
3
1
-2
2
EN
DIN
G F
UN
D B
AL
AN
CE
18
86
75
68
71
81
31
67
89
39
11
24
25
01
23
17
21
13
77
67
31
53
64
28
18
91
29
02
42
47
58
29
38
75
13
34
89
82
38
29
88
14
35
57
22
En
din
g b
ala
nce
as
of
Reso
urc
es
75
4
4
60
4
3
58
6
0
62
6
7
75
7
8
80
8
3
84
TO
TA
L R
EQ
UIR
EM
EN
TS
25
08
40
11
99
64
17
27
81
12
32
60
93
95
21
33
11
92
28
41
19
24
78
46
72
81
13
56
32
13
03
93
75
04
68
41
70
31
04
63
62
81
51
77
67
2
RE
VE
NU
E m
inu
s E
XP
EN
DIT
UR
ES
22
38
19
(27
49
55
)(2
07
81
6)
(55
46
90
)1
07
47
11
45
95
21
58
75
53
54
86
25
33
46
85
13
99
34
10
23
14
80
89
95
25
84
0
(NO
T c
um
ula
tive
)
no
te
no
n-r
ec
urr
ing
ex
p amp
re
v (
loa
n)
(31
8)
82
12
91
56
18
94
32
20
0(6
78
00
)(6
73
00
)(6
65
00
)(2
01
50
0)
(20
12
00
)(1
50
50
0)
00
00
00
net
recu
rrin
g r
ev-
exp
223
501
(192
826
)(5
1628
)(1
22
490
)39
671
78
652
92
255
153
362
332
268
363
493
410
231
480
899
525
840
O
pe
ratin
g E
xp
en
se
s n
et
of
Inte
rgo
ve
rnm
en
tal C
ha
rge
s
Exp
en
ditu
re la
pse
of
1
is c
alc
ula
ted
on
Pe
rso
na
l S
erv
ice
s
Op
era
tin
g E
xp
en
se
s
Cost
Allo
ca
tio
n a
nd
Gra
nts
amp A
ids
Exclu
de
s in
terf
un
d lo
an
s
Estim
ate
d r
eve
nu
es f
ore
ca
ste
d a
t 1
00
FO
RE
CA
ST
(
10
0
)
F-41
F-42
GLOSSARY
Pinellas County Budget Forecast FY2014-2023 G-1
AD VALOREM TAX - A tax levied in proportion to the value of the property against which it is levied ADOPTED BUDGET - The financial plan for the fiscal year beginning October 1 It is required by law to be approved by the Board of County Commissioners at the second of two public hearings AMENDMENT ONE ndash Approved by the voters of Florida on January 29 2008 and made the following changes which reduced taxable property values and revenues available to local government o ldquoDoubledrdquo the existing $25000 homestead exemption (except for school taxes)
o Allows for up to $500000 of the Save Our Homes exemption to be applied to another property (portability)
o Imposed a 10 cap on assessments for non-homestead property (school taxes exempt)
o Instituted a new tangible personal property exemption of $25000 AMERICAN RECOVERY amp REINVESTMENT ACT OF 2009 - In February 2009 Congress passed the American Recovery and Reinvestment Act (ARRA) of 2009 at the urging of President Obama who signed it into law on February 17th A direct response to the economic crisis the Recovery Act has three immediate goals (1) Create new jobs as well as save existing ones (2) Spur economic activity and invest in long-term economic growth and (3) Foster unprecedented levels of accountability and transparency in government spending
AMT - Alternative Minimum Tax An income tax imposed by the United States federal government on individuals corporations estates and trusts AMT is imposed at a nearly flat rate on an adjusted amount of taxable income above a certain threshold (exemption)
APPROPRIATION - The legal authorization granted by a legislative body to make expenditures and to incur obligations for specific purposes An appropriation is usually limited in the amount and as to the time when it may be expended It is the act of appropriation that funds the budget ARM - Adjustablendashrate mortgage ASSESSED VALUE - A valuation set upon real estate or other property by a government as basis for levying taxes Taxable valuation is calculated from an assessed valuation The assessed value is set by the Property Appraiser BEGINNING FUND BALANCE - The Ending Fund Balance of the previous period (See Ending Fund Balance definition) BOARD OF COUNTY COMMISSIONERS (BCC) - The Board of County Commissioners is the seven (7) member legislative and governing body for Pinellas County BOND - Written evidence of the issuers obligation to repay a specified principal amount on a certain date (maturity date) together with interest at a stated rate or according to a formula for determining that rate
GLOSSARY
Pinellas County Budget Forecast FY2014-2023 G-2
BUDGET - A financial plan containing an estimate of proposed revenues and expenditures for a given period (typically a fiscal year) CAPITAL BUDGET - The financial plan of capital project expenditures for the fiscal year beginning October 1 It incorporates anticipated revenues and appropriations included in the first year of the six year Capital Improvements Program (CIP) and any anticipated unspent appropriation balances from the previous fiscal year The Capital Budget is adopted by the Board of County Commissioners as a part of the annual County Budget CAPITAL IMPROVEMENT PROGRAM (CIP) - A proposed plan covering each year of a fixed period of years for financing long-term work projects that lead to the physical development of the County CAPITAL OUTLAY OR CAPITAL EQUIPMENT - Items such as office furniture fleet equipment data processing equipment and other operating equipment with a unit cost of $1000 or more CAPITAL PROJECT - An improvement or acquisition of major facilities roads bridges buildings or land with a useful life of at least five years CHARGE FOR SERVICES - Charges for a specific governmental service which covers the cost of providing that service to the user (eg building permits animal licenses park fees) CONSTITUTIONAL OFFICERS - They are elected to administer a specific function of County government and are directly accountable to the public for its proper operation Constitutional Officers include the Clerk of the Circuit Court the Property Appraiser the Sheriff the Supervisor of Elections and the Tax Collector COST CENTER - A budgeting entity which encompasses object level accounts (appropriations) that are used to monitor organization or program level expenditures DEBT SERVICE - The dollars required to repay funds borrowed by means of an issuance of bonds or a bank loan The components of the debt service payment typically include an amount to retire a portion of the principal amount borrowed (ie amortization) as well as interest on the remaining outstanding unpaid principal balance DEBT SERVICE FUND - An account into which the issuer makes periodic deposits to assure the timely availability of sufficient monies for the payment of debt service requirements (ie principal and interest) The revenues to be deposited into the debt service fund and payments from there are determined by terms of the bond covenants DEBT SERVICE COVERAGE RATIO ndash A ratio indicating the amount of cash available to meet annual principal and interest payments on debt The general calculation is net operating income divided by the total debt service amount DEPENDENT SPECIAL DISTRICT - A special district whose governing body or whose budget is established by the governing body of the County or municipality to which it is dependent
GLOSSARY
Pinellas County Budget Forecast FY2014-2023 G-3
DESIGNATED FUNDS ndash Funds that are set apart for a specific purpose to fund on-going or one-time expenditure Examples are bond proceeds reserves for fund balance reserve for contingencies (ldquoRainy Day Fundrdquo) and ldquopay as you gordquo reserves for future facility renewal amp replacement found mostly in the Enterprise Funds ELECTED OFFICIALS - Elected Officials include the Board of County Commissioners the Judiciary the State Attorney the Public Defender and five Constitutional Officers the Clerk of the Circuit Court the Property Appraiser the Sheriff the Supervisor of Elections and the Tax Collector ENDING FUND BALANCE - Funds carried over at the end of the fiscal year Within the fund the revenue on hand at the beginning of the fiscal year plus revenues received during the year less expenses equals ending fund balance The Ending Fund Balance becomes the Beginning Fund balance in the next fiscal year ENTERPRISE FUND - A fund used to account for operations that are financed and operated in a manner similar to private business enterprises--where the intent of the governing body is that the costs (expenses including depreciation) of providing goods or services to the general public on a continuing basis be financed or recovered primarily through user charges FANNIE MAE ndashFederal National Mortgage Association (FNMA) ndash A government-sponsored enterprise (GSE) that was created in 1938 to expand the flow of mortgage money by creating a secondary mortgage market Fannie Mae is a publicly traded company which operates under a congressional charter that directs Fannie Mae to channel its efforts into increasing the availability and affordability of homeownership for low- moderate- and middle-income Americans Fannie Mae purchases and guarantees mortgages that meet its funding criteria Through this process it secures mortgages to form mortgage-backed securities (MBS) The market for Fannie Maes MBS is extremely large and liquid FIRE PROTECTION DISTRICT - A designated area in the County where ad valorem revenues are collected from property owners and distributed to local cities and other agencies to finance fire suppression services to the area FISCAL YEAR - A twelve-month period of time to which the annual budget applies At the end of this time a governmental unit determines its financial position and the results of its operations The Pinellas County fiscal year begins on October 1 and ends on September 30 of the subsequent calendar year FORECLOSURE - A legal process by which a mortgagees right to redeem a mortgage is taken away usually because of failing to make payments FREDDIE MAC ndash Federal Home Loan Mortgage Corp (FHLMC) - A stockholder-owned government-sponsored enterprise (GSE) chartered by Congress in 1970 to keep money flowing to mortgage lenders in support of homeownership and rental housing for middle income Americans The FHLMC purchases guarantees and securitizes mortgages to form mortgage-backed securities The mortgage-backed securities that it issues tend to be very liquid and carry a credit rating close to that of US Treasuries
GLOSSARY
Pinellas County Budget Forecast FY2014-2023 G-4
FUND - An accounting entity with a complete set of self balancing accounts established to account for finances of a specific function or activity The resources and uses are segregated from other resources and uses for the purpose of carrying on specific activities or attaining specific objectives in accordance with special regulations restrictions or limitations FUND ACCOUNTING ndash Accounting method generally used by governmental agencies Usually consists of eleven classifications into which all individual funds can be categorized Governmental fund types include the general fund special revenue funds debt service funds capital projects funds and permanent funds Proprietary fund types include enterprise funds and internal service funds Fiduciary fund types include pension (and other employee benefit) trust funds investment trust funds private-purpose trust funds and agency funds FUNDING SOURCES - The type or origination of funds to finance ongoing or one-time expenditures Examples are ad valorem taxes user fees licenses permits and grants GENERAL FUND - This fund accounts for all financial transactions except those required to be accounted for in other funds The funds resources ad valorem taxes and other revenues provide services or benefits to all residents of Pinellas County GROSS DOMESTIC PRODUCT - Gross Domestic Product (GDP) is the generally accepted measure of the size of the national economy GDP measures the total market value of all final goods and services produced in a country in a given year GROSS METRO PRODUCT - Similar to Gross Domestic Product Gross Metropolitan Product (GMP) is defined as the market value of all final goods and services produced within a metropolitan area in a given period of time INDEPENDENT AGENCIES - A variety of agencies councils and other organizational entities responsible for administering public policy functions independently of the Constitutional Officers and County Administrator These entities are subject to Board of County Commissioner appropriation but operate under the purview of a legislativepolicy making body other than the Board of County Commissioners INFRASTRUCTURE - Infrastructure is a permanent installation-such as a building road or water transmission system - that provides public services INTERGOVERNMENTAL REVENUE - Revenue collected by one government and distributed (usually through some predetermined formula) to another level of government INTERNAL SERVICE FUND - A fund established to finance and account for services and commodities furnished by one department to other departments on a cost reimbursement basis MANDATE - A requirement imposed by a legal act of the federal state or local government
GLOSSARY
Pinellas County Budget Forecast FY2014-2023 G-5
METROPOLITAN STATISTICAL AREA (MSA) ndash MSA is a formal definition of a metropolitan area established by the United States Office of Management and Budget division MSArsquos are used to group counties and cities into specific geographic areas for the purposes of a population census and the compilation of related statistical data
MILLAGE RATE - A rate applied to a propertys taxable value to determine property tax due As used with ad valorem (property) taxes the rate expresses the dollars of tax per one thousand dollars of taxable value (ie a 5 mill tax on $1000 equals $500) MISSION STATEMENT - A broad statement of purpose which is derived from organization andor community values and goals MORTGAGE BACKED SECURITIES (MBS) - A type of security whose cash flows come from debt such as mortgages home-equity loans and subprime mortgages This is a type of security that typically focuses on residential instead of commercial debt MBS are sold and purchased in the open market Holders of a MBS receive interest and principal payments that come from the holders of the debt MUNICIPAL SERVICES TAXING UNIT (MSTU) - A special district authorized by the State Constitution Article VII and Florida Statutes 12501 The MSTU is the legal and financial mechanism for providing specific services andor improvements to a defined geographical area An MSTU may levy ad valorem taxes without a referendum An MSTU may also use assessments service charges or other revenue to provide its sources of income In Pinellas County the MSTU is all the unincorporated areas of the County NET EXPORTS - Exports minus imports OPERATING BUDGET - The operating budget includes appropriations for recurring and certain one-time expenditures that will be consumed in a fixed period of time to provide for day-to-day operations (eg salaries and related benefits operating supplies contractual and maintenance services professional services and software) PERSONAL SERVICES - Expenses for salaries wages and related employee benefits provided for all persons whether full-time part-time temporary or seasonal PREDATORY LENDING - The practice of unscrupulous lenders to enter into unsafe or unsound secured loans for inappropriate purposes PRO-RATE - A budgetary convention (used in Community Development and Fire Administration) that allows for centralized departmental services to be budgeted for in one cost center with the actual costs being allocated to the specific users of the service in other cost centers This is technically accomplished by appropriating a negative amount for the total central departmental service An allocation of the central services total appropriation is then budgeted in each of the user cost centers thereby reflecting the total cost to that particular function
RECESSION - A significant decline in activity across the economy lasting longer than a few months that is visible in industrial production employment real income and wholesale-retail trade The
GLOSSARY
Pinellas County Budget Forecast FY2014-2023 G-6
technical indicator of a recession is two consecutive quarters of negative economic growth as measured by a countrys gross domestic product (GDP)
RESERVES - Included in this category are funds required to meet both anticipated and unanticipated needs the balance of anticipated earmarked revenues not required for operation in the budget year those required to be set aside by bond covenants and accumulated funds set aside to finance capital construction on a pay-as-you-go basis REVENUE - The amount estimated to be received from taxes fees permits or other sources during a fiscal year REVISED BUDGET - The current year adopted budget adjusted to reflect all budget amendments approved by the Board of County Commissioners through January 31 ROLLED-BACK RATE - The millage rate which when applied to the total amount of taxable value of property (excluding new construction) produces the same amount of tax dollars as the previous year Calculation of the ldquorolled-back raterdquo is governed by Florida Statutes SAVE OUR HOMES AMENDMENT - The amendment was intended to protect homeowners from escalating property tax bills resulting from growth in market value a situation that was perceived to be forcing some people particularly residents on fixed incomes to sell their homes SHADOW BANKING SYSTEM - All financial intermediaries involved in facilitating the creation of credit across the global financial system but whose members are not subject to regulatory oversight Shadow Banking System also refers to unregulated activities by regulated institutions Examples of intermediaries not subject to regulation include hedge funds unlisted derivatives and other unlisted instruments SPECIAL ASSESSMENT FUND - A fund used to account for the financing of public improvements or services deemed to benefit the properties against which special assessments are levied SPECIAL REVENUE FUND - A fund used to account for the proceeds of specific revenue sources (other than expendable trusts or major capital projects) that are legally restricted to expenditures for specified purposes STATUTE - A written law enacted by a duly organized and constituted legislative body SUPPORT FUNDING - Support funding is provided by the Board of County Commissioners for those activities for which costs do not apply solely to any specific county departments function but are either applicable to the operation of county government as a whole or are provided for the public good TAXABLE VALUE - The assessed value of property minus any authorized exemptions (ie agricultural homestead exemption) This value is used to determine the amount of property (ad valorem) tax to be levied
GLOSSARY
Pinellas County Budget Forecast FY2014-2023 G-7
TAXES - Compulsory charges levied by a government for the purpose of financing services performed for the common benefit TOXIC ASSETS ndashThe term toxic asset was coined in the financial crisis of 200809 in regards to mortgage-backed securities collateralized debt obligations and credit default swaps all of which could not be sold after they exposed their holders to massive losses A toxic asset is one that becomes illiquid when its secondary market disappears Toxic assets cannot be sold as they are often guaranteed to lose money Many hedge funds banks and financial institutions invested heavily in mortgage-backed securities and collateralized debt obligations often using borrowed money and thus increasing their exposure This strategy proved profitable during the housing boom but resulted in enormous losses when house prices began to decline and mortgages began to default These ldquotoxic assetsrdquo were purchased by banks around the world contributing to a general sense of panic as mortgage defaults rose and liquidity fell TRANSFERS - Because of legal or other restrictions monies collected in one fund may need to be expended in other funds This is accomplished through Transfer-In (a source of funds) for the recipient fund and an equal Transfer-Out (a use of funds) for the donor fund When this movement occurs between different funds it is known as the Interfund Transfer UNINCORPORATED AREA - That portion of the County which is not within the boundaries of any municipality
GLOSSARY
Pinellas County Budget Forecast FY2014-2023 G-8
GLOSSARY
Pinellas County Budget Forecast FY2014-2023 G-1
AD VALOREM TAX - A tax levied in proportion to the value of the property against which it is levied ADOPTED BUDGET - The financial plan for the fiscal year beginning October 1 It is required by law to be approved by the Board of County Commissioners at the second of two public hearings AMENDMENT ONE ndash Approved by the voters of Florida on January 29 2008 and made the following changes which reduced taxable property values and revenues available to local government o ldquoDoubledrdquo the existing $25000 homestead exemption (except for school taxes)
o Allows for up to $500000 of the Save Our Homes exemption to be applied to another property (portability)
o Imposed a 10 cap on assessments for non-homestead property (school taxes exempt)
o Instituted a new tangible personal property exemption of $25000 AMERICAN RECOVERY amp REINVESTMENT ACT OF 2009 - In February 2009 Congress passed the American Recovery and Reinvestment Act (ARRA) of 2009 at the urging of President Obama who signed it into law on February 17th A direct response to the economic crisis the Recovery Act has three immediate goals (1) Create new jobs as well as save existing ones (2) Spur economic activity and invest in long-term economic growth and (3) Foster unprecedented levels of accountability and transparency in government spending
AMT - Alternative Minimum Tax An income tax imposed by the United States federal government on individuals corporations estates and trusts AMT is imposed at a nearly flat rate on an adjusted amount of taxable income above a certain threshold (exemption)
APPROPRIATION - The legal authorization granted by a legislative body to make expenditures and to incur obligations for specific purposes An appropriation is usually limited in the amount and as to the time when it may be expended It is the act of appropriation that funds the budget ARM - Adjustablendashrate mortgage ASSESSED VALUE - A valuation set upon real estate or other property by a government as basis for levying taxes Taxable valuation is calculated from an assessed valuation The assessed value is set by the Property Appraiser BEGINNING FUND BALANCE - The Ending Fund Balance of the previous period (See Ending Fund Balance definition) BOARD OF COUNTY COMMISSIONERS (BCC) - The Board of County Commissioners is the seven (7) member legislative and governing body for Pinellas County BOND - Written evidence of the issuers obligation to repay a specified principal amount on a certain date (maturity date) together with interest at a stated rate or according to a formula for determining that rate
GLOSSARY
Pinellas County Budget Forecast FY2014-2023 G-2
BUDGET - A financial plan containing an estimate of proposed revenues and expenditures for a given period (typically a fiscal year) CAPITAL BUDGET - The financial plan of capital project expenditures for the fiscal year beginning October 1 It incorporates anticipated revenues and appropriations included in the first year of the six year Capital Improvements Program (CIP) and any anticipated unspent appropriation balances from the previous fiscal year The Capital Budget is adopted by the Board of County Commissioners as a part of the annual County Budget CAPITAL IMPROVEMENT PROGRAM (CIP) - A proposed plan covering each year of a fixed period of years for financing long-term work projects that lead to the physical development of the County CAPITAL OUTLAY OR CAPITAL EQUIPMENT - Items such as office furniture fleet equipment data processing equipment and other operating equipment with a unit cost of $1000 or more CAPITAL PROJECT - An improvement or acquisition of major facilities roads bridges buildings or land with a useful life of at least five years CHARGE FOR SERVICES - Charges for a specific governmental service which covers the cost of providing that service to the user (eg building permits animal licenses park fees) CONSTITUTIONAL OFFICERS - They are elected to administer a specific function of County government and are directly accountable to the public for its proper operation Constitutional Officers include the Clerk of the Circuit Court the Property Appraiser the Sheriff the Supervisor of Elections and the Tax Collector COST CENTER - A budgeting entity which encompasses object level accounts (appropriations) that are used to monitor organization or program level expenditures DEBT SERVICE - The dollars required to repay funds borrowed by means of an issuance of bonds or a bank loan The components of the debt service payment typically include an amount to retire a portion of the principal amount borrowed (ie amortization) as well as interest on the remaining outstanding unpaid principal balance DEBT SERVICE FUND - An account into which the issuer makes periodic deposits to assure the timely availability of sufficient monies for the payment of debt service requirements (ie principal and interest) The revenues to be deposited into the debt service fund and payments from there are determined by terms of the bond covenants DEBT SERVICE COVERAGE RATIO ndash A ratio indicating the amount of cash available to meet annual principal and interest payments on debt The general calculation is net operating income divided by the total debt service amount DEPENDENT SPECIAL DISTRICT - A special district whose governing body or whose budget is established by the governing body of the County or municipality to which it is dependent
GLOSSARY
Pinellas County Budget Forecast FY2014-2023 G-3
DESIGNATED FUNDS ndash Funds that are set apart for a specific purpose to fund on-going or one-time expenditure Examples are bond proceeds reserves for fund balance reserve for contingencies (ldquoRainy Day Fundrdquo) and ldquopay as you gordquo reserves for future facility renewal amp replacement found mostly in the Enterprise Funds ELECTED OFFICIALS - Elected Officials include the Board of County Commissioners the Judiciary the State Attorney the Public Defender and five Constitutional Officers the Clerk of the Circuit Court the Property Appraiser the Sheriff the Supervisor of Elections and the Tax Collector ENDING FUND BALANCE - Funds carried over at the end of the fiscal year Within the fund the revenue on hand at the beginning of the fiscal year plus revenues received during the year less expenses equals ending fund balance The Ending Fund Balance becomes the Beginning Fund balance in the next fiscal year ENTERPRISE FUND - A fund used to account for operations that are financed and operated in a manner similar to private business enterprises--where the intent of the governing body is that the costs (expenses including depreciation) of providing goods or services to the general public on a continuing basis be financed or recovered primarily through user charges FANNIE MAE ndashFederal National Mortgage Association (FNMA) ndash A government-sponsored enterprise (GSE) that was created in 1938 to expand the flow of mortgage money by creating a secondary mortgage market Fannie Mae is a publicly traded company which operates under a congressional charter that directs Fannie Mae to channel its efforts into increasing the availability and affordability of homeownership for low- moderate- and middle-income Americans Fannie Mae purchases and guarantees mortgages that meet its funding criteria Through this process it secures mortgages to form mortgage-backed securities (MBS) The market for Fannie Maes MBS is extremely large and liquid FIRE PROTECTION DISTRICT - A designated area in the County where ad valorem revenues are collected from property owners and distributed to local cities and other agencies to finance fire suppression services to the area FISCAL YEAR - A twelve-month period of time to which the annual budget applies At the end of this time a governmental unit determines its financial position and the results of its operations The Pinellas County fiscal year begins on October 1 and ends on September 30 of the subsequent calendar year FORECLOSURE - A legal process by which a mortgagees right to redeem a mortgage is taken away usually because of failing to make payments FREDDIE MAC ndash Federal Home Loan Mortgage Corp (FHLMC) - A stockholder-owned government-sponsored enterprise (GSE) chartered by Congress in 1970 to keep money flowing to mortgage lenders in support of homeownership and rental housing for middle income Americans The FHLMC purchases guarantees and securitizes mortgages to form mortgage-backed securities The mortgage-backed securities that it issues tend to be very liquid and carry a credit rating close to that of US Treasuries
GLOSSARY
Pinellas County Budget Forecast FY2014-2023 G-4
FUND - An accounting entity with a complete set of self balancing accounts established to account for finances of a specific function or activity The resources and uses are segregated from other resources and uses for the purpose of carrying on specific activities or attaining specific objectives in accordance with special regulations restrictions or limitations FUND ACCOUNTING ndash Accounting method generally used by governmental agencies Usually consists of eleven classifications into which all individual funds can be categorized Governmental fund types include the general fund special revenue funds debt service funds capital projects funds and permanent funds Proprietary fund types include enterprise funds and internal service funds Fiduciary fund types include pension (and other employee benefit) trust funds investment trust funds private-purpose trust funds and agency funds FUNDING SOURCES - The type or origination of funds to finance ongoing or one-time expenditures Examples are ad valorem taxes user fees licenses permits and grants GENERAL FUND - This fund accounts for all financial transactions except those required to be accounted for in other funds The funds resources ad valorem taxes and other revenues provide services or benefits to all residents of Pinellas County GROSS DOMESTIC PRODUCT - Gross Domestic Product (GDP) is the generally accepted measure of the size of the national economy GDP measures the total market value of all final goods and services produced in a country in a given year GROSS METRO PRODUCT - Similar to Gross Domestic Product Gross Metropolitan Product (GMP) is defined as the market value of all final goods and services produced within a metropolitan area in a given period of time INDEPENDENT AGENCIES - A variety of agencies councils and other organizational entities responsible for administering public policy functions independently of the Constitutional Officers and County Administrator These entities are subject to Board of County Commissioner appropriation but operate under the purview of a legislativepolicy making body other than the Board of County Commissioners INFRASTRUCTURE - Infrastructure is a permanent installation-such as a building road or water transmission system - that provides public services INTERGOVERNMENTAL REVENUE - Revenue collected by one government and distributed (usually through some predetermined formula) to another level of government INTERNAL SERVICE FUND - A fund established to finance and account for services and commodities furnished by one department to other departments on a cost reimbursement basis MANDATE - A requirement imposed by a legal act of the federal state or local government
GLOSSARY
Pinellas County Budget Forecast FY2014-2023 G-5
METROPOLITAN STATISTICAL AREA (MSA) ndash MSA is a formal definition of a metropolitan area established by the United States Office of Management and Budget division MSArsquos are used to group counties and cities into specific geographic areas for the purposes of a population census and the compilation of related statistical data
MILLAGE RATE - A rate applied to a propertys taxable value to determine property tax due As used with ad valorem (property) taxes the rate expresses the dollars of tax per one thousand dollars of taxable value (ie a 5 mill tax on $1000 equals $500) MISSION STATEMENT - A broad statement of purpose which is derived from organization andor community values and goals MORTGAGE BACKED SECURITIES (MBS) - A type of security whose cash flows come from debt such as mortgages home-equity loans and subprime mortgages This is a type of security that typically focuses on residential instead of commercial debt MBS are sold and purchased in the open market Holders of a MBS receive interest and principal payments that come from the holders of the debt MUNICIPAL SERVICES TAXING UNIT (MSTU) - A special district authorized by the State Constitution Article VII and Florida Statutes 12501 The MSTU is the legal and financial mechanism for providing specific services andor improvements to a defined geographical area An MSTU may levy ad valorem taxes without a referendum An MSTU may also use assessments service charges or other revenue to provide its sources of income In Pinellas County the MSTU is all the unincorporated areas of the County NET EXPORTS - Exports minus imports OPERATING BUDGET - The operating budget includes appropriations for recurring and certain one-time expenditures that will be consumed in a fixed period of time to provide for day-to-day operations (eg salaries and related benefits operating supplies contractual and maintenance services professional services and software) PERSONAL SERVICES - Expenses for salaries wages and related employee benefits provided for all persons whether full-time part-time temporary or seasonal PREDATORY LENDING - The practice of unscrupulous lenders to enter into unsafe or unsound secured loans for inappropriate purposes PRO-RATE - A budgetary convention (used in Community Development and Fire Administration) that allows for centralized departmental services to be budgeted for in one cost center with the actual costs being allocated to the specific users of the service in other cost centers This is technically accomplished by appropriating a negative amount for the total central departmental service An allocation of the central services total appropriation is then budgeted in each of the user cost centers thereby reflecting the total cost to that particular function
RECESSION - A significant decline in activity across the economy lasting longer than a few months that is visible in industrial production employment real income and wholesale-retail trade The
GLOSSARY
Pinellas County Budget Forecast FY2014-2023 G-6
technical indicator of a recession is two consecutive quarters of negative economic growth as measured by a countrys gross domestic product (GDP)
RESERVES - Included in this category are funds required to meet both anticipated and unanticipated needs the balance of anticipated earmarked revenues not required for operation in the budget year those required to be set aside by bond covenants and accumulated funds set aside to finance capital construction on a pay-as-you-go basis REVENUE - The amount estimated to be received from taxes fees permits or other sources during a fiscal year REVISED BUDGET - The current year adopted budget adjusted to reflect all budget amendments approved by the Board of County Commissioners through January 31 ROLLED-BACK RATE - The millage rate which when applied to the total amount of taxable value of property (excluding new construction) produces the same amount of tax dollars as the previous year Calculation of the ldquorolled-back raterdquo is governed by Florida Statutes SAVE OUR HOMES AMENDMENT - The amendment was intended to protect homeowners from escalating property tax bills resulting from growth in market value a situation that was perceived to be forcing some people particularly residents on fixed incomes to sell their homes SHADOW BANKING SYSTEM - All financial intermediaries involved in facilitating the creation of credit across the global financial system but whose members are not subject to regulatory oversight Shadow Banking System also refers to unregulated activities by regulated institutions Examples of intermediaries not subject to regulation include hedge funds unlisted derivatives and other unlisted instruments SPECIAL ASSESSMENT FUND - A fund used to account for the financing of public improvements or services deemed to benefit the properties against which special assessments are levied SPECIAL REVENUE FUND - A fund used to account for the proceeds of specific revenue sources (other than expendable trusts or major capital projects) that are legally restricted to expenditures for specified purposes STATUTE - A written law enacted by a duly organized and constituted legislative body SUPPORT FUNDING - Support funding is provided by the Board of County Commissioners for those activities for which costs do not apply solely to any specific county departments function but are either applicable to the operation of county government as a whole or are provided for the public good TAXABLE VALUE - The assessed value of property minus any authorized exemptions (ie agricultural homestead exemption) This value is used to determine the amount of property (ad valorem) tax to be levied
GLOSSARY
Pinellas County Budget Forecast FY2014-2023 G-7
TAXES - Compulsory charges levied by a government for the purpose of financing services performed for the common benefit TOXIC ASSETS ndashThe term toxic asset was coined in the financial crisis of 200809 in regards to mortgage-backed securities collateralized debt obligations and credit default swaps all of which could not be sold after they exposed their holders to massive losses A toxic asset is one that becomes illiquid when its secondary market disappears Toxic assets cannot be sold as they are often guaranteed to lose money Many hedge funds banks and financial institutions invested heavily in mortgage-backed securities and collateralized debt obligations often using borrowed money and thus increasing their exposure This strategy proved profitable during the housing boom but resulted in enormous losses when house prices began to decline and mortgages began to default These ldquotoxic assetsrdquo were purchased by banks around the world contributing to a general sense of panic as mortgage defaults rose and liquidity fell TRANSFERS - Because of legal or other restrictions monies collected in one fund may need to be expended in other funds This is accomplished through Transfer-In (a source of funds) for the recipient fund and an equal Transfer-Out (a use of funds) for the donor fund When this movement occurs between different funds it is known as the Interfund Transfer UNINCORPORATED AREA - That portion of the County which is not within the boundaries of any municipality
GLOSSARY
Pinellas County Budget Forecast FY2014-2023 G-8
- FY14 Forecast Document
-
- Fund Forecasts Section FY14 Forecastpdf
-
- 01 General Fund FY14 Forecast
- 12_Tourist Dev Fund FY14 Forecast
- 13_Transportation Trust Fund FY14 Forecast
- 14_Capital Projects Fund FY14 Forecast
- 15 Emergency Medical Services Fund FY14 Forecast
- 16 Fire Districts Fund FY14 Forecast
- 17 Airport Fund FY14 Forecast
- 18_Water Funds FY14 Forecast
- 19_Sewer Funds FY14 Forecast
- 20_Solid Waste Funds FY14 Forecast
-
- Pro Formas Section FY14 Forecastpdf
-
- combined pro formas
-
- 01 General Fund FY14 pro forma
- 13 Transportation Trust Fund FY14 pro forma
- 04 Capital Projects Fund FY14 pro forma
- 05 EMS Fund FY14 pro forma
- 06 Fire Districts Fund FY14 pro forma
- 20 Solid Waste Funds FY14 pro forma
-
- 07 Airport Fund FY14 pro forma
- Water_Funds_FY14_pro forma
- Sewer_Funds_FY14_pro forma
- 02 TDC Fund FY14 pro forma
-

INTRODUCTION
Pinellas County Budget Forecast FY2014-2023 A-2
Developing the Forecast The Forecast is developed by the Office of Management amp Budget (OMB) during November December and January for presentation to the Board of County Commissioners in January or February Developing Projections The Forecast is built upon an individual assessment of ten of the Countyrsquos major funds the General Fund Tourist Development Fund Transportation Trust Fund Capital Projects Fund Emergency Medical Services Fund Fire Districts Fund Airport Fund and Utilities Water Sewer and Solid Waste Funds The process for developing the Forecast includes updating the projections for FY2012 with actual revenue and expenditure information following the closeout of the fiscal year as of September 30 2012 At the same time the current FY2013 expenditures are projected on a preliminary basis by analyzing the actual expenditures to date and projecting the remaining months left in the fiscal year These expenditure projections are further refined later in the process as departments provide their expenditure projections The coming FY2014 budget year is forecasted based on the best information available at this point in time The Forecast has a ten year horizon to help determine the long-term financial position of the Countyrsquos funds as well as the impact of todayrsquos budget decisions The out-years through FY2023 are forecasted using various projection methods such as trend analysis linear regression and moving averages Forecast Assumptions The projections are modeled so that assumptions may vary each year to reflect future impacts of known variables and other anticipated events The model is also designed to allow the key assumptions to be adjusted so that sensitivity analysis can be performed to demonstrate the impact of changing key assumptions Additionally unknown risks that could potentially affect the ten-year forecast have been identified and discussed Forecast Results Major assumptions driving the revenue and expenditure projections are outlined to ensure a clear understanding for the basis of the results Shortfalls and surpluses are cumulative in the sense that any individual yearrsquos surplus or deficit flows into the next yearrsquos fund balance thus carrying a current yearrsquos balance forward In using the information contained in the projection it is important to understand that an indicated surplus or deficit reflects the modelrsquos assumptions and demonstrates a potential need for revenue increases expenditure reductions or a mix of both The Power of the Forecast Developing a multi-year forecast provides decision-makers with at least two key benefits (1) assessing the long-term financial sustain-ability of the Countyrsquos Funds and (2) under-standing the impact of todayrsquos decisions on the future
INTRODUCTION
Pinellas County Budget Forecast FY2014-2023 A-3
Long-Term Fiscal Sustainability One of the key purposes of developing a multi-year fund forecast is to identify potential actions necessary to balance revenues and expenditures over the long-term to ensure fiscal sustainability Forecasting over a ten-year horizon can serve as a window into the future to warn of potential future challenges For example if a major capital project (ie jail expansion) will have a significant impact on the operating budget that impact can be anticipated several years in advance and strategies can be developed and implemented to manage the negative impact to the budget Conversely if debt service on a bond is due to expire in the near future additional funds may become available to increase service levels to certain programs or other uses Enhanced Decision-Making Another benefit of long-term forecasting is the ability to assess the impact that decisions made in the present can have on future fiscal capabilities If the Board is considering funding a new or enhancing an existing program the Forecast can demonstrate the long-term impact to the budget Similarly if the Board is considering a new revenue source the Forecast can show how much revenue could be anticipated over the years Implementing cost-saving initiatives can also be forecasted and evaluated over time In summary the Forecast can be a powerful tool to understand how policy changes have real consequences that last far beyond a one-year budget solution Using This Document The Executive Summary section of this document summarizes the key elements of the forecast as a whole over the ten year time horizon The Economic Overview section features an overview of the national state and local economies This section provides important context for the various forecasts in the document The Key Assumptions section discusses the sources of key revenue and expenditure assumptions that were used to develop each of the fund forecasts This section is followed by the Fund Forecasts section which includes individual forecasts for ten of the Countyrsquos major funds These forecasts are designed to be succinct and help focus the reader on the important elements in the ten-year forecasts for each fund The assumptions pro-formas and a full-size forecast chart for each of the funds can be found in the Pro-Formas section A Glossary has also been included to facilitate understanding of key terms
INTRODUCTION
Pinellas County Budget Forecast FY2014-2023 A-4
EXECUTIVE SUMMARY
Pinellas County Budget Forecast FY2014-2023 B-1
Introduction This is the fourth year that the ten-year Budget Forecast has been formalized into a stand-alone document There are no changes to the format of the document from last year The first step in the annual budget process is to update the Budget Forecast and seek Board policy direction in order to develop the budget guidelines for the FY2014 budget process Developing a multi-year forecast provides decision-makers with at least two key benefits (1) assessing the long-term financial sustainability of the Countyrsquos funds and (2) understanding the impact of todayrsquos decisions on the future Economic Overview The national economy appears to be on track for a sustainable recovery and is anticipated to grow by 2 to 3 annually during the forecast period The Statersquos economy is showing signs of improvement in population growth tourism and the housing market As the national economy continues to improve Pinellas County is poised to recover as well The biggest industry in the County is tourism which has shown signs of a strong recovery For FY2014 the property tax base is expected to show positive growth following five years of decline Risks to the economic forecast include uncertainty on federal deficit reduction actions such as sequestration the ongoing European financial crisis and continued high levels of unemployment General Fund Forecast The forecast projects that beginning in FY2013 recurring expenditures exceed recurring revenues in the General Fund This is primarily due to the aftereffects of the Great Recession with continued slow recovery of the real estate market In addition caps on taxable value increases and total property tax revenue will inhibit future revenue growth Major expenditure drivers that exceed normal inflation include personnel costs such as health insurance and state-required pension contributions and mandated expenses such as Medicaid There is a long-term structural imbalance of approximately $15M increasing to $60M per year over the forecast period absent action to address this problem The balancing strategy for the General Fund is to cover the shortfall in FY2014 by utilizing the Service Level Stabilization Account (SLSA) in accordance with the plan approved by the Board of County Commissioners Expenditure reductions or revenue increases may be required in FY2014 or future years to address the structural imbalance The extent of the changes that are needed will be dependent on the pace of the economic recovery particularly the real estate market Tourist Development Council Fund Forecast The forecast for the Tourist Development Council Fund shows that the fund is balanced through the forecast period based on the assumption that the undesignated budget would be adjusted to reflect any revenue increases or decreases that may occur Beginning in FY2016 the fund is forecast to have additional capacity once the debt service on Tropicana Field and the Dunedin Spring Training Facility is paid off in 2015 The additional capacity in the undesignated budget could be dedicated to new capital outlay as with the Board approved Salvador Dali funding to new debt service or to supplement the promotional activities budget Transportation Trust Fund Forecast The forecast for the Transportation Trust Fund indicates that the fund is not in balance beginning in FY2013 resulting in a depletion of fund balance by FY2018 This imbalance primarily results from inflationary pressures on expenditures coupled with the projected reduction in gas tax collections
EXECUTIVE SUMMARY
Pinellas County Budget Forecast FY2014-2023 B-2
that are based upon the volume of fuel By FY2017 action will need to be taken to manage this future gap such as potential revenue transfers from the General Fund imposition of additional local option gas taxes or reductions in current service levels Another balancing option is the implementation of a storm water strategy that includes a new dedicated funding source If a dedicated funding source was available storm water costs currently funded in the Transportation Trust Fund could be freed up to create additional capacity Capital Projects Fund Forecast The forecast for the Capital Projects Fund shows that the fund is balanced over the forecast period Additional cash flow necessary in the first half of the ten-year period is being addressed through an interfund loan from the Solid Waste Renewal amp Replacement Fund A primary driver of cash flow is $81M of expenditures associated with the Public Safety Complex project that began in FY2012 The forecast includes repayment of the loan from FY2013 to FY2020 The forecast does not include projections of revenues or expenditures beyond the current Penny for Pinellas infrastructure sales surtax authorization which ends in FY2020 Emergency Medical Services Fund Forecast The forecast indicates that the fund is not balanced throughout the forecast period The structural imbalance is driven by slower growth in property tax revenue collections than cost increases in ambulance contractual expenditures and first responder funding requests Balance for FY2013 was achieved through a millage rate increase and use of reserves Without another millage rate increase andor expenditure savings reserves will be exhausted after FY2016 Future balancing strategies will be developed from information gathered in the EMS system operational study Fire Districts Fund Forecast The forecast for the Fire Districts Fund indicates that the fund is not balanced through the forecast period Five of the twelve fire districts increased millage rates in FY2013 Additional increases to millage rates for the individual fire districts will likely be necessary to cover expenditures over the forecast period Potential millage rate increases will need to take into account the individual millage caps in each fire district Airport Fund Forecast The forecast for the Airport Revenue and Operating Fund shows that the fund is balanced through the forecast period based on the assumptions that the capital projects budget would be adjusted to reflect the timing and amounts of any grants revenue and that the airportrsquos operating budget would be adjusted to match revenues Utilities Water Funds Forecast The Water System Funds are balanced through the forecast period based on projected rate increases The multi-year rate increases approved as part of the FY2012 budget process will provide sufficient revenues to maintain reserves and fund capital replacement needs through FY2015 The forecast revenues include an additional 2 per year annual increase in rates from FY2016-FY2023 as recommended in the FY2012 Utilities Rate Study performed by the Countyrsquos independent rate consultant A new comprehensive rate study will be performed in FY2014 to analyze the future rate structure In FY2013 FY2014 FY2017 and FY2018 recurring expenditures will exceed recurring revenues as fund balance is drawn down as major capital projects are completed From FY2015
EXECUTIVE SUMMARY
Pinellas County Budget Forecast FY2014-2023 B-3
through FY2023 excluding FY2017 and FY2018 the Water Funds are structurally balanced Utilities Sewer Funds Forecast The Sewer System Funds are balanced through the forecast period based on projected rate increases The multi-year rate increases approved as part of the FY2012 budget process will provide sufficient revenues to maintain reserves sustain the recommended debt service coverage ratio of 150x and fund capital replacement needs through FY2015 The forecast revenues include an additional 275 per year annual increase in rates from FY2016-FY2023 as recommended in the FY2012 Utilities Rate Study performed by the Countyrsquos independent rate consultant A new comprehensive rate study will be performed in FY2014 to analyze the future rate In FY2013 recurring expenditures will exceed recurring revenues as fund balance is drawn down as major capital projects are completed From FY2014 through FY2023 the Sewer Funds are structurally balanced as recurring expenditures are in line with recurring revenues Utilities Solid Waste Funds Forecast The Solid Waste Funds are balanced through the forecast period Forecasted revenues are sufficient to provide for the forecasted expenditures over the next ten years while still maintaining sufficient reserves The recurring revenues are sufficient to support recurring operations without any increases in tipping fees Reserves increase during the forecast period and reach the level of 84 of revenues in FY2023 The reserves are planned to fund considerable future capital replacement needs in the Solid Waste 25-year plan
EXECUTIVE SUMMARY
Pinellas County Budget Forecast FY2014-2023 B-4
ECONOMIC OVERVIEW
Pinellas County Budget Forecast FY2014-2023 C-1
The Economic Overview amp Budget Background portion of the Budget Forecast FY2014-2023 provides important context for the various forecasts in this document and includes the following sections
The National Economy o Background o National Outlook
The State Economy o Background o Florida Outlook
The Local Economy o Background o Local Outlook
The National Economy BACKGROUND ldquoThe Fiscal Cliffrdquo After briefly stepping off the ldquofiscal cliffrdquo as the nation welcomed 2013 the US Senate passed legislation the ldquoAmerican Taxpayer Relief Act of 2012rdquo in the early morning hours of January 1 that prevented income tax rates from increasing for individuals making up to $400000 extended benefits for the long-term unemployed and delayed the automatic spending cuts known as sequester for two months Many economists believed these spending cuts to be split evenly between defense ($55 billion) and non-defense ($55 billion) programs along with the ending of the Bush-era tax cuts would have stalled the current economic recovery and possibly send the economy back into recession While federal income tax rates were kept at 2012 levels for most people the temporary decrease for social security taxes also known as the payroll tax paid by wage earners ended on Dec 31 2012 For two years workers paid 42 instead of the previous 62 rate The reason for the rate cut was to stimulate the economy by allowing workers to bring home more money with each paycheck The financial impact for those earning $30000 per year will be about $50 less in take-home pay per month While the passage of the Act will temporarily avert and delay various elements of the fiscal cliff there will be another showdown in the coming months over automatic across-the-board spending cuts known as ldquosequestrationrdquo the debt ceiling tax and entitlement reform and a long-term solution to the nationrsquos debt and deficits Debt Ceiling Crisis Under the United States Constitution Congress has the authority to appropriate funds for numerous activities including national defense education and payment of the nationrsquos debt obligations When annual revenues fall short of the level required to pay for these activities the Government must then borrow money through the issuance of debt instruments such as short-term bills and notes and long-term bonds In an effort to provide flexibility while still maintaining some control Congress imposed the first debt ceiling in 1917 limiting the amount of debt the federal government can legally borrow to $115 billion Previously Congress had to sign off each time the Department of the Treasury issued
ECONOMIC OVERVIEW
Pinellas County Budget Forecast FY2014-2023 C-2
debt To meet the growing obligations of the federal government Congress must approve a new debt ceiling level before the accrued debt meets the imposed cap This has been done more than 70 times since 1962 with the current debt limit exceeding $16 trillion Increasing the debt ceiling does not authorize new spending but allows the government to raise the necessary funds to pay for previously incurred obligations
During the Spring and Summer of 2011 President Obama and leaders of both the House and Senate faced the need for another increase in the debt ceiling What is usually a routine vote turned into a policy showdown between congressional Republicans and Democrats over how to reduce federal spending and long-term debt After several months of negotiations the House and Senate passed the
Budget Control Act of 2011 which was signed into law by President Obama on August 2 2011 the day the Treasury Department said the United States would begin to default on their obligations without further action
The actions taken during the summer of 2011 did not raise the debt ceiling long-term According to Treasury Secretary Timothy Geithner the United States reached the statutory debt limit on Dec 31 2012 but due to the undertaking of ldquoextraordinary measuresrdquo at the end of 2012 the Treasury extended the deadline by about two months Without a deal to raise the debt ceiling the United States would begin to default on its obligations including payments to holders of US debt and social security recipients among others The United States government has never defaulted on its financial obligations and doing so would have a significant impact on the global economy
Budget Control Act of 2011 The Act established a procedure for increasing the debt limit by $400 billion initially and an additional $500 billion after September 2011 The Act also mandated at least $21 trillion in spending cuts with immediate caps on domestic and defense spending resulting in over $900 billion deficit reduction over ten years To determine the remaining $12 trillion in cuts the Congressional Joint Select Committee on Deficit Reduction (the ldquoSuper Committeerdquo) was established The Super Committee consisted of 12 members of Congress with six coming from the House and six from the Senate split evenly between Democrats and Republicans The committee was charged with issuing recommendations by November 23 2011 for at least $15 trillion in deficit reductions over ten years which could include both revenue increases and spending cuts Downgrade of Federal Government Credit Rating Despite averting default Standard amp Poorrsquos (SampP) downgraded the governmentrsquos credit rating one notch from AAA (highest) to AA+ Citing ldquopolitical brinksmanshiprdquo SampP determined the US governmentrsquos ability to manage its financial house is ldquoless stable less effective and less predictablerdquo and the Budget Control Act of 2011 ldquofell shortrdquo of what was needed to bring the nationrsquos debt under control over time SampP also did not feel the political leaders would be able to achieve the mandated savings in the future On January 15 2013 Fitch Ratings warned of a possible downgrade of US debt without an ldquoagreed and credible medium-term deficit reduction plan that would be consistent with sustaining the economic recovery and restoring confidence in the long-run sustainability of US public financerdquo
ECONOMIC OVERVIEW
Pinellas County Budget Forecast FY2014-2023 C-3
Without a long-term solution to the budget deficit investors will begin to lose confidence in US debt driving interest rates up leading to increased borrowing cost and additional budget pressures As the months pass and pressure mounts all eyes will be on Washington DC and the work of our elected officials Failure of the Super Committee The most visible result of the previous debt ceiling crisis was the creation of the Congressional Super Committee After several months of hard work and intense deliberations the Super Committee was unable to reach agreement The failure of the Super Committee to forge a deficit reduction deal triggers $12 trillion in automatic across-the-board spending cuts starting in 2013 evenly divided between military and non-military spending While most government programs are subject to the automatic cuts programs that assist low-income Americans will be exempt including Social Security Medicaid veteransrsquo benefits and food stamps As 2012 ended and sequestration was looming the US House of Representatives and United States Senate passed legislation delaying the automatic cuts for two months NATIONAL OUTLOOK Gross Domestic Product (GDP) is the generally accepted measure of the size of the national economy GDP measures the total market value of all final goods and services produced in a country in a given year The major components of national GDP (Third Quarter 2012) are shown in the pie chart below
Components of US GDP ndash 3rd Qtr 2012
Consumer Spending
705
Investments132
Net Exports-33
Government Spending
196
Source US Bureau of Economic Analysis
Consumer Spending At 705 consumer spending easily represents the largest portion of GDP This expectation is based on continued high levels of unemployment modest growth in real disposable (after-tax) personal income financial market volatility government debt ceiling and debt downgrade an increase in
ECONOMIC OVERVIEW
Pinellas County Budget Forecast FY2014-2023 C-4
household savings a restrictive supply of credit increases in food and energy prices and continued gridlock in Washington DC The December 2012 unemployment rate was 78 the lowest level since January 2009 Job growth which showed signs of strength in the first quarter of 2012 suffered a slowdown in the second quarter before regaining energy averaging 160000 jobs per month over the last half of the year Through December 2012 the economy has added an average of 153000 jobs per month
Seasonally Adjusted Unemployment Rate 2007-2012
44
100
78
00
20
40
60
80
100
120
Percent
US Unemployment Rate 2007 - 2012
Source US Bureau of Labor StatisticsFRED
While unemployment has shown improvement since the recession ended in 2009 the number of long-term unemployed people who have been looking for employment for more than 26 consecutive weeks has been much higher than the period following the 2001 recession As the chart below shows the pre-2007 recession level of long-term unemployed never returned to the pre-2001 levels and currently is above 40 of the total unemployed One of the effects of long-term unemployment has been a depletion of savings and the draw-down of retirement accounts to pay monthly bills like the mortgage insurance and food The tight financial situation many families find themselves in including working families means there are fewer non-essential purchases being made
ECONOMIC OVERVIEW
Pinellas County Budget Forecast FY2014-2023 C-5
Source Congressional Budget Office An Update to the Budget and Economic Outlook Fiscal Years 2012 to 2022 August 2012
Year Unemployment
2012 82 (78 YTD) 2013 88 2014 87 2015 77 2016 67 2017 59
2018 55
2019 55
2020 54
2021 54
2022 53 Source Congressional Budget Office An Update to the Budget and Economic Outlook Fiscal Years 2012 to 2022
August 2012
According to the US Department of Commerce retail sales for 2012 increased by 49 from 2011 This rise was in part due to increases in automobiles (86) furniture (77) and building materials (54) Although these increases were driven by discounts and promotions these figures do seem to indicate a positive trend in consumer spending NovemberDecember retail sales were up 37 from the same period in 2011
Category December
2012 December
2011
Growth Retail amp Food Services $4687B $4575B 24 Retail $4230B $4145B 21 Automobiles $749B $717B 45
Gas Stations $422B $421B 02
Clothing $317B $309B 26 Source US Department of Commerce January 15 2013
ECONOMIC OVERVIEW
Pinellas County Budget Forecast FY2014-2023 C-6
Inflation also plays a role impacting the outlook for consumer spending The Consumer Price Index the generally accepted measure of overall inflation rose by 17 in 2012 lower than the 35 rise for all of 2011 with the second half of 2012 rising by 23 Short-term projections for CPI range from 18 to 22 through 2017 In addition the Federal Reserve has continued to maintain record low levels on short-term interest rates and is expected to keep them close to zero at least through 2015 which is about two and a half years longer than originally indicated Government Spending The second largest component of GDP is Government Spending at 196 With looming spending cuts and economic pressures the government sector will likely remain a drag on economic growth The state and local government sector represents approximately 60 of total government spending State government budgets have been challenged over the last several years For FY13 sixteen states and the District of Columbia projected a combined gap of $162 billion down from the high of $1741 billion in FY10 Although some states are forecasting budget gaps over the next two years the number of states and the size of the gaps have continued to decline Local government budgets are very dependent on the housing market from tax revenue from home sales to property taxes based on taxable values As the housing market boomed revenues from these sources rose at exceptional rates When the bubble burst so did the revenues While the housing market in general has seemingly hit bottom property values are still below pre-boom levels in many areas as excess inventory and foreclosures continue to suppress housing prices The National Association of Realtors estimates the inventory of existing homes at approximately 286 million units and estimates the shadow inventory made up of homes in the foreclosure process at an additional 20 million units Areas where the real estate market is showing improvement includes the Northeast the Washington DC region Texas and California A sustainable recovery will not truly occur until the backlog of distressed properties is cleared Until real estate markets recover local government spending will likely lag Overall the state and local government sector is anticipated to decrease slightly or be flat over the next few years The federal government sector represents 40 of total government spending Federal spending is anticipated to decrease over the next few years as the mandated spending reductions take place from the Budget Control Act passed in 2011 The Act specified automatic procedures for reducing spending by as much as $12 trillion if legislation was not approved for reducing spending by that amount These cuts would be spread out over the ten years and contribute to more restrained federal spending than in years past and detract from economic growth However the American Taxpayer Relief Act of 2012 which was signed into law by President Obama on January 2 2013 delayed the implementation of the sequestration from January 1 2013 to March 1 2013 This delay will allow the new Congress additional time to find targeted savings without across the board cuts Despite the delay Federal government spending is anticipated to decrease by 2-3 over the next four years as concerns over the four straight years of $1 billion Federal budget deficit grips Washington DC Investment The third largest component of GDP is Investment at 132 This component is made up of Non-Residential Fixed Investment and Residential Fixed Investment
ECONOMIC OVERVIEW
Pinellas County Budget Forecast FY2014-2023 C-7
According to the Congressional Budget Office business and residential investment are growing strongly Business investment in nonresidential structures equipment and software grew at an annual rate of 64 in the first half of 2012 with the second quarter growing by 102 from the same period in 2011 Inventory investments grew in the first half of 2012 from the second half of 2011 However with inventory levels stabilizing this component is unlikely to grow as businesses reduce their stock levels on-hand as the economic recovery continues Net Exports The definition of net exports is exports minus imports Current net exports make up -33 of GDP A key factor driving net exports is the value of the dollar The value of the dollar has gradually weakened and depreciated through much of 2011 due to the Federal Reserversquos policy of quantitative easing which helped decrease the dollar exchange rate against other currencies A depreciated dollar helps increase exports by making the costs of US goods more competitive in the global marketplace and reduces the negative net exports calculation The weakening of the dollar was interrupted by the European debt crisis but is anticipated to continue for several years The pace of export growth is expected to decrease slightly as a result of the anticipated modest recession in Europe However exports to emerging markets should continue to help domestic global producers Import growth will likely be constrained by the slow pace of consumer spending Summary of National Outlook Most economists agree that the national economy hit bottom in 2009 and that we are on track for a sustainable recovery Normally economic recoveries are marked by real economic growth of around 5 in the first year of recovery due to pent up demand It is anticipated that this recovery will be in the 2 to 3 range due to lingering high levels of unemployment the bottoming out of the housing market the continued decline of the commercial real estate market decreases in both federal and state amp local government spending and uneasiness about Europe
Gross Domestic Product (GDP) GDP
Growth 2006 27
2007 19
2008 -03 2009 -35 2010 30 2011 17 2012 (Est) 22 2013 (Est) 20 2014 (Est) 27
2015 (Est) 29 Source Federal Reserve Bank of Philadelphia
Survey of Professional Forecasters November 9 2012
While the national economy appears to have stabilized the lack of job-growth and continued high unemployment in addition to the on-going financial crisis across much of Europe still poses a significant threat to the recovery both nationally and globally
ECONOMIC OVERVIEW
Pinellas County Budget Forecast FY2014-2023 C-8
The State Economy BACKGROUND The background information below for the Statersquos economy is derived primarily from the January 10 2013 report Florida An Economic Overview by The Florida Legislature Office of Economic and Demographic Research Until a few years ago Florida was one of the nationrsquos fastest growing states With the end of the housing boom and the beginning of the real estate market correction the state slipped to virtually no growth on a year-over-year basis While Florida was not the only state to experience a significant deceleration in economic growth (California Nevada and Arizona showed similar trends) it was one of the first and hardest hit State Gross Domestic Product Gross Domestic Product (GDP) the market value of all final goods and services produced or exchanged within a state is one of the key economic measures for the comparison of states In 2006 Florida returned to the national growth level before dropping below it in 2007 (48 US versus 28 FL) 2008 (33 US versus 03 FL) and 2009 (-13 US versus -17 FL) Floridarsquos total GDP in 2007 was $760 billion but dropped to about $726 billion in 2009 before climbing back up to $754 billion in 2011 (the last full year data is available)
Source Federal Reserve Bank of St Louis
After adjusting for inflation Floridarsquos real growth in GDP ranked it tied for 39th in the nation in 2011 with a gain of 25 By way of comparison Florida was ranked 50th in 2008 and 4th in the nation in 2005 For Arizona Nevada and Florida losses in the construction sector accounted for a significant
ECONOMIC OVERVIEW
Pinellas County Budget Forecast FY2014-2023 C-9
portion of the decline as it subtracted more than one percentage point from real GDP growth in each of these states Personal Income Growth Other factors are frequently used to gauge the health of an individual state The first of these measures is personal income growth primarily related to changes in salaries and wages According to The Florida Legislature Office of Economic and Demographic Research Floridarsquos per capita personal income grew 04 during the 3rd quarter of 2012 compared to 05 nationally ranking the state 35th in growth Job Growth and Unemployment In the years leading up to the recent recession unemployment in Florida started increasing from the very low rates of 33 in early 2006 to 45 in November 2007 As the economic slow-down turned into a recession in December 2007 Floridarsquos unemployment rate rose from 47 to a high of 114 in February 2010 eight months after the official end of the recession Since that time the rate has fallen to 80 in December 2012 This rate places Florida at 41st in the country At 80 approximately 749000 residents are unemployed Since the Statersquos peak in employment more than 672000 jobs have been lost To recover from this loss and to accommodate for the additions made to the work force more than 1000000 jobs will need to be created to return Florida to its peak level
Source US Bureau of Labor Statistics Federal Reserve Bank of St Louis
ECONOMIC OVERVIEW
Pinellas County Budget Forecast FY2014-2023 C-10
Housing Market Vigorous home price appreciation that outstripped gains in income and the use of speculative financing arrangements made Florida particularly vulnerable to the decelerating housing market and interest rate risks In 2006 almost 47 of all mortgages in the state were considered ldquoinnovativerdquo (interest only and pay option ARM) With the ease of gaining access to credit long-term homeownership rates were inflated to historic levels ndash moving Florida from a long-term average of 663 to a high of over 72 Essentially easy cheap and innovative credit arrangements enabled people to buy homes that previously would have been denied At first the end of the housing boom brought lower activity and employment in the construction and financial fields as well as spillover consumption effects in closely related industries landscaping and sales of appliances carpeting and other durable goods used to equip houses This began in the summer of 2005 when the volume of existing home sales started to decline in response to extraordinarily high prices and increasing mortgage rates Closely linked to the housing industry Floridarsquos nonagricultural employment annual growth rate began to retreat from its peak in the fall of 2005 By the summer of 2006 existing home prices began to fall and owners started to experience negative wealth effects from the deceleration and losses in property value Mortgage delinquencies and foreclosures became commonplace as property prices further tanked in 2007 and the unemployment rate began to climb as part of a slow slide into a national recession that began in December 2007 By the fall of 2008 Floridarsquos homegrown problems with the housing market were giving way to several worldwide phenomena a national recession that was spreading globally and a credit crisis that was threatening to bring down the worldrsquos largest financial institutions As the sub-prime mortgage difficulties spread to the larger financial market it became clear that any past projections of a relatively quick adjustment in the housing market were overly optimistic Forecasts were dampened through the end of the fiscal year and then again as the excess inventory of unsold homes was further swollen by foreclosures and slowing population growth arising from the national economic contraction While small improvements were seen in late 2009 and early 2010 on the state and national fronts they seemed to sputter as the recovery struggled to take hold Largely these changes were related to Floridarsquos ongoing housing market woes and the gloomy national and global outlooks that plagued most of the year The growing inventory of unsold houses coupled with the sluggish credit crisis dampened residential construction activity throughout the entire year During FY2010 there were 36000 private housing starts for the year statewide but this was just 133 of the FY2006 level Single family starts managed to post a positive gain but multi-family starts worsened the percentage drop they made in FY2009 over FY2008 In yet another manifestation of the significant housing market adjustment still facing Florida existing single family home sales ended FY2010 nearly 30 below the peak volume of the 2005 banner year During 2011 the volume of sales edged up slightly to a level about 25 lower than the peak volume year
ECONOMIC OVERVIEW
Pinellas County Budget Forecast FY2014-2023 C-11
During 2012 the increase in volume continued but still remains at 82 of the sales level during the high-water year of 2005 Median sales prices however have not seen the same increase as volume As the chart below shows prices began to fall very quickly beginning in the last quarter of 2007 before reaching a bottom range between $130000 and $150000 in early 2009 From peak to trough prices fell 418
Source Florida Legislature Office of Economic and Demographic Research Jan 10 2013
FLORIDA OUTLOOK The background information below for the Statersquos economy is derived primarily from the January 10 2013 report Florida An Economic Overview by The Florida Legislature Office of Economic and Demographic Research
With the national recession almost four years behind us Floridarsquos economy is starting to show sustained improvements Growth rates are beginning to return to levels seen during lsquonormalrsquo periods but it will still take several years to make-up for the years of negative growth
ECONOMIC OVERVIEW
Pinellas County Budget Forecast FY2014-2023 C-12
Source Florida Legislature Office of Economic and Demographic Research
Major Economic Drivers
In addition to global and national economic conditions there are several major drivers that are key to the performance of Floridarsquos economy Those drivers include population growth tourism employment growth and new construction
Population Growth
Population growth continues to be the statersquos primary engine of economic growth fueling both employment and income growth and impacting the amount of new construction activity The national economic contraction significantly slowed Floridarsquos population gains but this was not unexpected Over 80 of the statersquos population growth comes from positive net migration primarily from people moving into Florida from other states From past studies it is clear that people are reluctant to move during recessions ndash first because of the inability to sell their homes and second because of the difficulty in finding new jobs Floridarsquos strong international migration which had been a bulwark was also affected by the global economic slowing Floridarsquos long-term population growth rate between 1970 and 1995 was over 3 The annual growth rate hovered between 20 and 26 from the mid 1990rsquos to 2006 and then began slowing to less than 05 in 2009 and 06 in 2010
ECONOMIC OVERVIEW
Pinellas County Budget Forecast FY2014-2023 C-13
In the near term population growth is forecast to remain relatively flat averaging 12 between 2012 and 2015 However over the forecast horizon population growth will improve ndash averaging 14 between 2015 and 2020 with 85 of the growth coming from net migration While this is still significant growth before the recession Florida was adding a city roughly the size of Miami every year in the future it will be a city more like St Petersburg Despite this lower growth rate Florida is still on track to break the 20 million mark in 2016 becoming the third most populous state sometime before then surpassing New York
Source Florida Legislature Office of Economic and Demographic Research Jan 10 2013
By 2030 Floridarsquos population is expected to grow by almost 5 million people The majority of this gain (559) will come from those 60 and older with those under 18 accounting for 149 of this gain Tourism The tourism industry is another key driver of Florida employment growth and economic strength Like other sectors of the economy tourism was hit hard by the recession as job losses and uncertainty coupled with other stresses caused potential visitors to be more conservative in their spending and cut back on their travel plans The industry also had to deal with the negative publicity that resulted from the 2010 Deepwater Horizon oil spill in the Gulf of Mexico (although actual beach damage in Florida was limited to the Panhandle area) During 2011 the impact of these factors declined Tourism growth now appears to be on a steady upward trajectory
ECONOMIC OVERVIEW
Pinellas County Budget Forecast FY2014-2023 C-14
Employment Growth and the Labor Market Floridarsquos current unemployment numbers represent a loss of more than 672000 jobs from the peak with the statersquos negative over-the-year growth rate actually beginning in March 2007 With a projection of about 2500 new working-age people being added to the Florida market each month it will take the creation of about 1000000 jobs to return to the peak level of employment The job market showed strength throughout the year with 89700 jobs being added in November This growth was lead by the leisure and hospitality (+31200) business and professional services (+27500) trade (+22000) and education and healthcare (+17000) industries which performed strongly Negative job growth in government (-7800) and construction (-4400) continue to slow the growth in Florida
Source Fishkind amp Associates Econocast Weekly Jan 07 2013
For wages and salaries Floridarsquos long-term growth prospects essentially match the national forecast However Floridarsquos average annual wages largely fall below the nation as a whole Projections for unemployment show a gradual reduction over the next eight or nine years for Florida dropping to 55 by 2020 from the current level of 80 New Construction and Housing Floridarsquos housing markets are generally improving Sales volume of existing homes and building permits are both back in positive territory showing year-over-year growth The number of documentary stamp tax collections reflects this trend
ECONOMIC OVERVIEW
Pinellas County Budget Forecast FY2014-2023 C-15
Source Florida Legislature Office of Economic and Demographic Research Dec 5 2012
Recent building permit activity has come in better than expected Building permit activity is growing with a 262 increase year-over-year for the first nine month of 2012 Foreclosures have further swelled Floridarsquos unsold inventory of homes Originally related to mortgage interest rate resets and changes in financing terms that placed owners in default activity was also affected by the continuing high level of unemployment In CY2012 Florida had the highest foreclosure rate in the country displacing Nevada at the top of this dubious list At 858 days Florida has the third longest foreclosure process in the United States These two factors along with the struggling economy suggest that the foreclosure problem will remain with Florida for several more years as the existing inventory and inventory soon to be added slowly makes its way through the process
ECONOMIC OVERVIEW
Pinellas County Budget Forecast FY2014-2023 C-16
Foreclosure Activity December 2012
Top 10 Florida Counties
Source RealtyTraccom
A related problem is the ldquoshadow inventoryrdquo of homes that are not on the market but are at risk of foreclosure About 40 of all residential loans in Florida are for homes that are ldquounderwaterrdquo that is have mortgage debt higher than the value of the house However rising home prices in 2012 helped more than 700000 previously underwater homeowners return to a position of equity in their homes There is also a significant percentage of homeowners who are not current with their mortgage payments
Delinquent
Foreclosed Non-
Current National 70 36 106 Florida 78 121 198
Source Florida Legislature Office of Economic and Demographic Research Jan 10 2013
The credit market impacts both employment growth and new construction Although interest rates continue to remain at record low levels credit conditions for those seeking to buy a home or homeowners seeking to refinance remain tight
ECONOMIC OVERVIEW
Pinellas County Budget Forecast FY2014-2023 C-17
The end result of these factors is that in the residential property market sales volume is expected to increase while prices appear to have begun the recovery from their historic lows
State Budget The State of Floridarsquos budget is highly dependent on sales tax revenue accounting for more than 70 of revenues In times of economic distress consumers tend to cut back on discretionary spending which in a state dependent on sales tax will have an immediate effect on revenue Unlike many other states Florida does not have a state personal income tax which is a more stable source of revenue because wages tend to fall at a slower rate than consumption As a result the recession caused major State budget shortfalls and the effects are still being felt in this yearrsquos budget In recent years the State made heavy use of one-time fixes such as diverting revenue from trust funds ($41 billion over 10 years) and using Federal stimulus funds to avoid larger cuts in education and other programs On the expenditure side the single largest driver in State obligations is Medicaid which is projected to increase at an annual rate of 79 over the next 10 years This does not include the potential impact of Federal Health Care Reform As the 2013 Legislature prepares to return to Tallahassee the projected State FY2014 budget is projecting a $480 million surplus the first surplus in six years Summary of Florida Outlook Floridarsquos economy appears to have turned around The major drivers of economic growth are showing signs of improvement The statersquos primary source of economic growth population growth has improved from the very low rates of 2009 (lt05) and 2010 (06) From 2012 to 2015 population growth is expected to average 12 then increase to 14 through 2020 Tourism which was hit hard by both the global recession and the 2010 BP Deep Horizon oil spill has improved greatly The jobs associated with tourism especially in the leisure and hospitality industry grew more than any other industry in 2012 as visitors returned to the beaches and theme parks around the state As the recovery continues the long-range unemployment rate is projected to fall steadily from the current level of 80 to 55 by 2020 Floridarsquos housing market continues to show signs of improvement Sales volume of existing homes has increased most of 2012 However foreclosures continue to depress sales prices around the state In 2012 Florida had the highest foreclosure rate in the country with 198 of all residential mortgages non-current on their mortgage payments The subsequent turnaround in Florida housing will be led by
Low home prices that begin to attract buyers and clear the inventory Long-run sustainable demand caused by continued population growth and household
formation Floridarsquos unique demographics and the aging of the baby-boom generation (2011 marked the
first wave of boomers hitting retirement age)
ECONOMIC OVERVIEW
Pinellas County Budget Forecast FY2014-2023 C-18
Looking ahead the pace of the economic recovery depends heavily on how quickly the job market recovers from the Great Recession the capacity for personal income growth to move ahead of inflation and a substantial reduction in the supply of unsold residential properties
The Local Economy BACKGROUND The context of this section is from the perspective of background impacting the Pinellas County budget Property Value Increases From FY2002 to FY2007 there were unusually large increases in property values in Pinellas County and throughout the state Across Florida public budget hearings brought out many citizens who were upset about their proposed property taxes as presented on their ldquoTruth in Millagerdquo (TRIM) notices Most of those who expressed their frustration were persons who owned property that was not homesteaded and therefore not protected by the ldquoSave Our Homesrdquo taxable value increase cap such as commercial and rental business owners and owners of second homes In response to the publicrsquos concerns the Board of County Commissioners reduced the FY2007 county-wide millage rate by 0701 mills (over 10) the first millage rate reduction since the 1997 budget year Impact of Save Our Homes Amendment Not all local governments were as responsive to the situation as Pinellas and this dramatic growth in taxable values resulted in a surge in property tax revenues that became the focus of legislative concern In reality the primary problem was the systematic inequity resulting from the ldquoSave Our Homesrdquo amendment to the Florida Constitution which has capped the growth in taxable values for homesteaded properties (permanent residences) since 1996 The amendment was intended to protect homeowners from escalating property tax bills resulting from growth in market value a situation that was perceived to be forcing some people particularly residents on fixed incomes to sell their homes While this objective was achieved there were dramatic and in many cases unforeseen consequences as a result of Save Our Homes Because of the large amount of market or ldquojustrdquo value not taxed due to the Save Our Homes exemption a disproportionate share of any increase in tax revenue had been placed on properties that were not established permanent residences such as businesses rental properties and newly purchased homes The increases in values for fiscal years 2002 through 2007 notwithstanding the historical trend over the previous sixteen years in Pinellas had been an average annual increase of about 5 in values (including new construction) Most observers believed that the market would correct itself and return to more normal patterns To some extent the value growth part of the problem could be expected to correct itself over time Legislative Property Tax Roll-Backs The Florida Legislature perceived property tax reform as one of the two most critical issues (along with property insurance reform) that needed to be addressed in 2007 In June a three-day Special Session of the Legislature produced a mandate that was unlike anything ever seen before in its forced reductions in property taxing capability of local government in Florida The Legislature did not make
ECONOMIC OVERVIEW
Pinellas County Budget Forecast FY2014-2023 C-19
similar reductions to FY2008 school property taxes which they control even though these taxes make up about 40 of most property ownersrsquo tax bills Unfortunately this solution failed to address the real inequities that were the focus of public discontent and instead has the potential for even greater disparities in the future The Legislature adopted two key items impacting property tax reform The first approach involved statutory changes requiring all counties cities and special districts to roll back property tax collections in FY2008 to a point below the FY2007 collections adjusted for new construction (also known as the ldquorolled-back raterdquo) This target ranged from 3 to 9 below the rolled-back rate depending on the Statersquos calculation of how much the taxing authorityrsquos property tax revenue increased from FY2002 to FY2007 Independent Districts and Dependent Districts many of which have the primary purpose of providing Fire or Emergency Medical Services were all targeted at 3 below the rolled-back rate These calculations and the resulting reduction categories did not adequately acknowledge the lower tax profile of Pinellas Pinellas County was required to cut 7 below rolled-back (the second-most-severe level) even though
o The Countyrsquos FY2002ndashFY2007 percentage increase in per capita property tax was below the statersquos average increase for counties
o The Countyrsquos FY2007 per capita property tax was less than Orange Hillsborough (and other counties) that were in the 3 or 5 cutback categories
o A city with the same percentage increase was required to cut only 5 o The Statersquos numbers did not reflect seasonal or tourist population impacts and o The Statersquos numbers did not take into account the additional cost pressures for an urban
coastal county (such as property insurance) Property Tax Revenue Cap The other item adopted by the Legislature with important long-term implications was the implementation of a property tax revenue cap Effective FY2009 property tax revenue increases are limited to new construction plus the statewide percentage increase in per capita personal income This percentage has averaged about 38 from 1991-2008 From 2009-2012 growth in personal income was below average or only 1-3 Even this minor increase is neutralized by the historic decreases in property valuation The cap requires that the maximum millage rate that can be approved by a simple majority vote of the Board of County Commissioners equals the prior yearrsquos maximum rolled-back rate adjusted for the change in per capita Florida personal income A two-thirds vote of the Board may approve up to 110 of this maximum Any higher millage rate requires a unanimous vote of the Board or a referendum Based on information from the Florida Department of Revenue the County has some flexibility for increases above the property tax revenue cap in the short term because the Board has not levied the maximum millage since the baseline was set in FY2008 The long-term impact of this cap is that property tax revenue will be constrained even if taxable values increase beyond the average increase in personal income To date the County has not seen an impact from this cap because values have actually declined since it was passed However due to the
ECONOMIC OVERVIEW
Pinellas County Budget Forecast FY2014-2023 C-20
bursting of the housing bubble and the negative impact of foreclosures the baseline of values has been set artificially low which will keep property tax revenues constrained by a higher than anticipated margin Impact of Amendment One The FY2009 budget situation was unique in several ways This was largely due to the passage of Amendment One placed on the ballot by the Legislature and approved by the voters of Florida on January 29 2008 which reduced property tax revenues Also the economic downturn which began in FY2008 intensified which further reduced property taxes and also reduced revenues from other important sources Amendment One made the following changes which reduced taxable property values and revenues available to local government
o ldquoDoubledrdquo the existing $25000 homestead exemption (except for school taxes)
o Allows for up to $500000 of the Save Our Homes exemption to be applied to another property (portability)
o Imposed a 10 cap on assessments for non-homestead property (school taxes exempt)
o Instituted a new tangible personal property exemption of $25000 Impact of the Recession At the same time that the impact of Amendment One was being felt the real estate ldquobubblerdquo burst and market values for property declined dramatically The result was an unprecedented decrease in the property tax base Since World War II the average annual increase in taxable value is about 5 Since 2009 the County-wide taxable value has decreased 84 114 97 and 45 with another 18 decrease in FY2013 Normally some of this revenue decrease would be offset by the rest of the revenue mix such as sales taxes state revenue sharing and other miscellaneous revenues Unfortunately the general economy deteriorated to the point that virtually the entire mix of non-property tax revenues also declined substantially The end result of all of these changes was a large negative impact to the Countyrsquos revenues which have resulted in significant reductions across all of the Countyrsquos funds Impacts to the Pinellas County Budget Since the recession began the County has been faced with resizing the organization to fit the new fiscal reality stemming from legislative action the bursting of the housing bubble and the recession Since FY2007 total positions have decreased 1618 or 25 Within that number the BCC departments have decreased 985 positions or 35 which yields the lowest position count since FY1985 The Constitutionals and Independents have decreased 633 positions or 17 which yields the lowest position count since FY1995 The total position count is currently the lowest since FY1989 In the General Fund the Countyrsquos largest fund that funds most of its operations property taxes (two-thirds of total revenues) have decreased 35 or $151 million from FY2007 to FY2013
ECONOMIC OVERVIEW
Pinellas County Budget Forecast FY2014-2023 C-21
LOCAL OUTLOOK Pinellas County is the 6th largest county in population (916542) and is the most densely populated in the State Pinellas County is mostly built out and expects limited population growth in the future The County is the most popular tourist destination on the Gulf of Mexico drawing 13 million tourists annually Pinellas County is part of the Tampa-St Petersburg-Clearwater Metropolitan Statistical Area (MSA) comprised of Hernando Hillsborough Pasco and Pinellas counties Below is a chart of Employment by Industry for Pinellas County
Source Florida Labor Market Statistics
Over the last five years several of these areas have seen substantial decreases Natural resources mining and construction decreased 46 Manufacturing decreased 26 Information decreased 22 Financial Activities decreased 14 Trade Transportation amp Utilities decreased 11 Professional amp Business Services decreased 9 Other Services decreased 7 and Leisure and Hospitality decreased 4 The only areas that have shown growth since 2006 is Education amp Health Services which increased 11 and Total Government which increased 4 From Wells Fargorsquos May 2012 Florida Economic Outlook Tamparsquos labor market continues to post strong gains The professional and business services sector remains the top performing sector accounting for more than 50 percent of the jobs added since the Bay arearsquos labor market bottomed despite representing only 17 percent of Tamparsquos overall employment base Part of that improvement reflects strong growth at employment staffing companies The recovery has broadened across many other sectors more recently including leisure and hospitality financial services and trade transportation and utilities Construction remains an obvious impediment however as payrolls continue to contract and are now down nearly 53 percent from their peak in April 2006 Unemployment As with the State of Florida Pinellas Countyrsquos unemployment rate reached historically low levels in early 2006 In April 2006 Pinellas County recorded an unemployment rate of 30 As the chart below shows the Countyrsquos unemployment rate rose to 47 by the time the national recession began
Professional amp Business Services
169
Total Government
138
Leisure amp Hospitality
114
Education amp Health
Services 161
Information 23
Manufacturing 52
Other Services 38
Trade Transporation
amp Utilities 185
Financial Activities 79
Natural Resources Mining amp
Construction 42
ECONOMIC OVERVIEW
Pinellas County Budget Forecast FY2014-2023 C-22
in December 2007 reaching a high of 123 in January 2010 seven month after the official end of the recession Since then the Countyrsquos unemployment rate has fallen to 79 (November 2012)
Source Federal Reserve Bank of St Louis
Tourism Tourism is a key economic driver of the economy in Pinellas County and contributes direct and indirect visitor expenditures of $63 billion annually In FY2012 the County reported more than 5 million overnight visitors and collected $287 million in tourist development tax revenue also known as the lsquobed taxrsquo A positive sign of a recovering economy FY2013 collections are 103 higher through the first two months of the fiscal year than the same period in FY2012 which was a record year for Pinellas County Real Estate The real estate market in Pinellas County is struggling to recover from the bursting of the housing bubble Pinellas like the rest of Florida experienced a dramatic rise in housing values for several years during the housing boom Starting in FY2008 property assessments fell for five straight years (-84 -114 -97 -45 and -18) Residential Real Estate Over the last year home sales in the Tampa Bay area have risen However almost half of all the sales are distressed sales involving foreclosed properties Foreclosures continue to hold down the residential real estate market In 2007 there was an average of 628 foreclosure activities per month As unemployment increased and the economy slipped into recession foreclosure activity almost doubled in FY2008 to 1110 per month Activity remained extremely high through FY2009 and FY2010 before dramatically dropping off to 522 per month in FY2011 This drop-off coincided with the federal investigations of lsquorobo-signingrsquo of foreclosure documents As part of a settlement with federal regulators banks and others involved in the foreclosure process agreed to improve their procedures Since the settlement was signed in April 2011 foreclosure activity has begun to increase averaging 822 per month in FY2012 through September The most recent data from Realty Trac
ECONOMIC OVERVIEW
Pinellas County Budget Forecast FY2014-2023 C-23
shown in the chart below shows that most of the foreclosure activities are in the large population centers within Pinellas County
Foreclosure Activity ndash Pinellas County December 2012
Source RealtyTraccom
Summary of Local Outlook While the national recession has been over for more than three years the effects are still being felt in Pinellas County Unemployment is well above pre-recession levels and foreclosures have remained stubbornly high in the past several months However the biggest industry in Pinellas County tourism has shown signs of a strong recovery FY2012 tourist development tax revenues were 124 higher than FY2011 and each month in FY2013 has been higher than the same month in FY2012 And real property values appear to have begun to climb after five years of decreases As the national economy continues to improve Pinellas County is poised to recover as well However because of the high level of unemployment and the potential inventory of residential properties available on the market the recovery is expected to be slow and long
ECONOMIC OVERVIEW
Pinellas County Budget Forecast FY2014-2023 C-24
KEY ASSUMPTIONS
Pinellas County Budget Forecast FY2014-2023 D-1
The Key Assumptions portion of the Budget Forecast FY2014-2023 includes a discussion of the sources of information used to develop assumptions for revenues and expenditures that drive the ten-year forecasts for ten of the Countyrsquos key funds
Assumptions and Forecasting
Revenue Assumptions
o Overview
o Key Assumptions
o Supporting Information
Expenditure Assumptions
o Overview
o Key Assumptions
o Supporting Information
Assumptions and Forecasting Forecasting is not a precise science This is particularly true for forecasts that involve the economy Statistician Nate Silver in his recent book The Signal and the Noise Why So Many Predictions Fail ndash but Some Donrsquot notes the performance of the highly-respected Survey of Professional Forecasters in predicting the one-year growth or decline in Gross Domestic Product (GDP) Silver cites a study which revealed that the actual change in GDP has fallen outside the range of the grouprsquos predictions almost half the time The most recent example was in 2007 where all of the economists predicted growth in GDP even though the Great Recession was already under way As Silver says ldquoForecasting something as large and complex as the American economy is a very challenging taskrdquo Despite this uncertainty forecasting is a useful tool for identifying potential problems and the need for future action The forecasts in this document are a baseline using past trends current policies and assumptions about future conditions based on reasonable expectations We have not attempted to project significant future events such as recessions oil embargos or natural disasters However in each of the fund reviews we have identified the risks to the forecast that could significantly impact the projections In establishing revenue and expenditure assumptions we reviewed data and forecasts from a variety of economists government agencies industry associations and other sources In particular we referenced the State of Floridarsquos Revenue Estimating Conferences frequently The State utilizes a professional nonpartisan consensus process involving the Legislature the Governors Office and the States Division of Economic and Demographic Research in developing national and state economic forecasts that are used in all state planning and budgeting actions The current Conference projections end at FY2022 The projections are available online at httpedrstateflusContentconferencesindexcfm
KEY ASSUMPTIONS
Pinellas County Budget Forecast FY2014-2023 D-2
We also referenced federal agencies such as the Bureau of Labor Statistics the Census Bureau and several Federal Reserve banks as well as private research firms and educational institutions such as The Conference Board Wells Fargo Conway Pedersen Economics Inc the University of Central Florida and the University of Florida The County is not required to use this data but it provides useful background information for projecting changes in revenues and expenditures
Revenue Assumptions Property Taxes ndash General Fund EMS Fund and Fire Districts Fund
Overview Ad valorem taxes commonly called property taxes are assessed on real property and on tangible personal (business) property The tax rate is expressed in ldquomillsrdquo One mill is one dollar of taxes for each thousand dollars of taxable value For example a tax rate of 59 mills on a taxable value of $100000 yields $590 in taxes The Florida Constitution imposes a cap of 10 mills on the total of all County-wide ad valorem rates (which includes the General Fund countywide levy plus the levies for the Health Department and for Emergency Medical Services) A cap of 10 mills is also imposed on the combined total of all MSTU ad valorem rates (which includes the General Fund MSTU levy plus the levies for other dependent districts) The taxable values as of January 1st are established annually by the Property Appraiser and certified for budget purposes by July 1st Final taxable values following appeals and adjustments are certified following the completion of the Value Adjustment Board (VAB) appeals process which recently has been extending into February of the next calendar year
Millage rates are approved annually by the Board of County Commissioners by resolution as part of the budget process This process must follow the ldquoTruth in Millagerdquo (TRIM) law including timing advertisement and conduct of public hearings
Federal state county and municipal property is exempt from property taxes Besides the Homestead and Save Our Homes Exemptions discussed in the Economic Overview section various other exemptions may be available depending on the type of property
Key Assumptions The assumption in the forecast is that after five years of decline taxable values will begin to recover in FY2014 with a slow but sustained rate of growth thereafter
Change in Taxable Values ndash County-wide 2014 2015 2016 2017 2018 2019 2020 2021 2022 2023
25 25 30 30 30 30 30 30 30 30
KEY ASSUMPTIONS
Pinellas County Budget Forecast FY2014-2023 D-3
The County-wide taxable value is the basis for determining the County-wide revenue in the General Fund For the purposes of this forecast the FY2014 through FY2022 percentage change in taxable value for the Emergency Medical Service Fund and the Fire Districts Fund is assumed to be the same as the County-wide taxable value change The rates of growth in the General Fund MSTU and the Fire Districts Fund are projected to be 05 less than the County-wide growth rates based on past trends and the composition of the tax base in the unincorporated area Supporting Information For FY2014 the overall increase of 25 in countywide taxable values reflects differing anticipated changes in the major components of the tax base Within these categories changes in individual properties may vary significantly due to many factors including location (for example beach vs inland) or use (for example hotel vs retail) In the future the growth in property tax revenues will be restrained by the caps put in place by the Legislature in 2007 The amount of new construction in Pinellas County will not provide the boost that other counties that are not built-out will enjoy For example Orange and Hillsborough counties have large undeveloped areas that are available for major residential commercial and industrial expansions Impact of Foreclosures In determining the values as of January 1 2013 which serve as the basis for FY2014 calculations the Property Appraiser will factor in the impact of mortgage foreclosures Foreclosures do not have a significant impact on current year collections of taxes levied because of the recovery mechanisms for delinquent taxes If taxes are unpaid by June 1st a Tax Certificate is offered for sale by the Tax Collector The certificate is sold to an investor and the County receives the equivalent of the taxes due As a result of the recession recent years have seen a dramatic increase in tax certificate sales However although foreclosures do not affect the percentage of property taxes collected during the fiscal year they tend to depress market values of surrounding properties and this has a negative impact on the tax base Along with the rest of the state Pinellas County foreclosure filings increased significantly beginning in 2007 and were averaging about four times higher than the historical norm through 2009 After a decrease in 2010 due to chain-of-title issues and the delay of proceedings in the courts foreclosures once again increased in 2012 to a level about 50 higher than the pre-recession norm For the time being demand is such that new foreclosure inventory is being absorbed fairly efficiently A ldquoglutrdquo of non-mediated rulings could lead to a surge in inventory putting downward pressure on median sales prices which in turn would negatively impact the tax base The forecast assumes that the foreclosure inventory will not experience this type of surge
KEY ASSUMPTIONS
Pinellas County Budget Forecast FY2014-2023 D-4
Source Clerk of the Court data
Taxable values The taxable values for FY2013 were certified by the Property Appraiser on July 1 2012 The county-wide value decreased by 18 compared to the FY2012 values It was the fifth year in a row that the tax base declined Prior to this the tax base only decreased once since World War II a small -06 dip in FY1993
The growth in homesteaded taxable value is subject to the caps imposed by the Save Our Homes amendment This limits the annual growth in a propertyrsquos taxable value to the growth in the Consumer Price Index (CPI) or 3 whichever is lower If the CPI index is negative the allowable change in taxable values is also negative
KEY ASSUMPTIONS
Pinellas County Budget Forecast FY2014-2023 D-5
Save Our Homes Cap for Fiscal Year Based on Change in Consumer Price Index
2005 2006 2007 2008 2009 2010 2011 2012 2013 2014 19 30 30 25 30 0 1 27 15 30 17 There is a two-year lag in the CPI adjustment For example the fiscal year 2014 factor is the CPI change percentage for calendar year 2012
Sources Florida Department of Revenue and US Bureau of Labor Statistics
The factor used is the annual change in the CPI as of December each year For example the limit for FY2013 is the December 2011 index +30 which was issued by the US Bureau of Labor Statistics on January 19 2012 The limit for FY2014 will be the December 2012 index 17 which was issued by the US Bureau of Labor Statistics on January 16 2013 Property Taxes are normally one of the most reliable revenue sources available to local governments As a result most cities counties school districts etc rely on the stability of property taxes to build their budgets Unfortunately due to the combined result of mandatory legislative roll-backs the passing of Amendment One and a correction in the real estate market taxable values have decreased dramatically resulting in a negative multi-year impact in property tax revenue Property Tax Revenue Caps The revenue caps approved by the Legislature in 2007 require that beginning with FY2009 the maximum millage rate that can be approved by a simple majority vote of the Board of County Commissioners equals the prior yearrsquos maximum rolled-back rate adjusted for the change in per capita Florida personal income A two-thirds vote of the Board may approve up to 110 of this maximum Any higher millage rate requires a unanimous vote of the Board or a referendum The County has some flexibility for increases in the short term because we did not levy the maximum millage in FY2009 FY2010 FY2011 FY2012 or 2013 Another aspect of the declining market values (and the ldquodoublingrdquo of the Homestead Exemption from $25000 to $50000) has been the erosion of the amount of value shielded from taxes due to Save Our Homes Prices are now at the point where in some instances homesteaded residential market values have decreased below the prior yearrsquos taxable value This means that rather than an increase due to the Save Our Homes recapture rule some parcels with declining market values previously covered by Save Our Homes will see decreases in their taxable value for FY2014 Fund Variances Because of differences in the composition of their tax base individual fire districts are expected to vary significantly from the overall change The unincorporated area (MSTU) General Fund and Fire Districts Fund taxable value percentage change is assumed to be slightly less than the County-wide taxable value change Other funds not included in this forecast that are dependent on property taxes are the Palm Harbor and Feather Sound Community Service District Funds the Pinellas Public Library Cooperative Fund and the Health Department Fund With the exception of the Health Department the percentage change in taxable value will differ from the County-wide change depending on the composition of the tax roll in each area
KEY ASSUMPTIONS
Pinellas County Budget Forecast FY2014-2023 D-6
Sales Taxes ndash General Fund and Capital Projects Fund Overview Sales tax revenues are highly elastic increasing and falling with the health of the overall economy In addition to food and medicine certain other purchases are exempted from sales tax by legislation The County receives two types of sales taxes the Half-Cent Sales Tax and the Infrastructure Sales Tax (Penny for Pinellas) Half-Cent Sales Tax This General Fund revenue is a portion of the Statersquos six cent sales tax that is shared with counties and cities First authorized in 1982 the program generates the largest amount of revenue for local governments among the state-shared revenue sources currently authorized by the Legislature Sales tax revenue grew by 49 in FY2012 This was the second year of growth following four years of decline beginning in FY2006 We believe this is indicative of a return to sustained sales tax revenue growth
Infrastructure Sales Tax (Penny for Pinellas) The Penny for Pinellas is a 1 percent sales tax which is dedicated to capital improvement projects in Pinellas County such as facilities storm water improvements preservation land purchases roads bridges public safety parks and community centers The Penny makes capital projects and improvements possible without having to raise property taxes Without this funding it is estimated that property owners would have to pay another 15 mills on their property taxes With a sales tax approximately one-third of the total Penny funds are paid for by tourists and seasonal residents Key Assumptions For the State Shared Half-Cent Sales Tax in FY2014 and later years we anticipate growth approaching historical patterns A 40 growth rate is assumed for FY2014 reflecting the
KEY ASSUMPTIONS
Pinellas County Budget Forecast FY2014-2023 D-7
continuing economic recovery This is followed by a 35 growth rate throughout the FY2015-FY2023 forecast period In the near-term our projection is more conservative than the State General Revenue Estimating Conference which anticipates more robust FY2014 growth of 54 followed by 61 and 56 in FY2015 and FY2016 respectively
Change in Half-Cent Sales Tax Revenue 2014 2015 2016 2017 2018 2019 2020 2021 2022 2023
40 35 35 35 35 35 35 35 35 35
The revenue assumptions for the overall Penny sales tax are consistent with the Half-Cent sales tax However the growth rate in the Capital Projects Fund for the Penny sales tax is less at 30 growth from FY2014 to FY2023 This is because the Courts amp Jail allocation is a fixed amount that does not grow over time resulting in a slightly smaller growth rate for the Countyrsquos overall share of the Penny Supporting Information The statewide number from the State General Revenue Estimating Conference reflects population growth that will not be as significant a factor in Pinellas County as in other less built-out counties However we are confident that a strengthening local economy and stronger tourism will result in slightly better growth in the short term Data on potential future job creation growth (provided by Economic Development) and projected tourism growth (provided by the Convention and Visitorrsquos Bureau) support this view Our forecast essentially reflects about 15 to 25 per year growth over the rate of price inflation As a result we are not anticipating a return to the FY2006 peak level of our Half-Cent Sales Tax revenues until FY2016 Communications Services Tax ndash General Fund
Overview The Communications Services Tax (CST) which is 2 of total General Fund revenues is paid by unincorporated area residents and is dedicated entirely to providing services for them through the MSTU The CST legislation was enacted to restructure taxes on telecommunications cable direct-to-home satellite and related services that existed prior to October 1 2001 Previously a county could impose franchise fees on telephone and cable television within its boundaries Currently for charter counties a local CST may be levied at a rate up to 51 percent plus an add-on of up to 012 percent in lieu of imposing permit fees The County has levied the maximum rate of 522 since January 2003 The Communications Services Tax revenue has declined due to the recession and to technological changes in the industry that have reduced the base of taxable services FY2012 CST revenue (excluding audit adjustments) was 28 lower than in FY2011
KEY ASSUMPTIONS
Pinellas County Budget Forecast FY2014-2023 D-8
Key Assumptions The forecast projection reflects a continuation of the decline in this revenue source
Change in Communications Services Tax Revenue 2014 2015 2016 2017 2018 2019 2020 2021 2022 2023 -05 -05 -05 -05 -05 -05 -05 -05 -05 -05
Supporting Information The CST is levied on communication services that originate and terminate within the state Technological advances have allowed for increased competition from communication service providers (particularly wireless providers) which do not meet this definition and whose services are therefore not subject to the CST The 2012 Legislature approved changes to the CST statutes and a State commission the Communications Services Tax Working Group was appointed to study the CST and recommend further structural changes that may lead to even greater reductions in revenue The Working Group is proposing the complete elimination of the CST placing all communications services under the sales tax and increasing the State Sales Tax from 60 to 634 The intent of the proposal is to be ldquorevenue neutralrdquo to the State and to local governments but detailed calculations have not yet been made The cumulative impact of the 2012 changes and the restructuring if it occurs is undetermined at this time State Revenue Sharing - General Fund Overview State Revenue Sharing is primarily based on the Statersquos sales tax revenue The formula for Revenue Sharing is subject to adjustment by the Legislature Similar to the Half-Cent Sales Tax Revenue Sharing revenue demonstrated a second year of growth increasing 34 in FY2012 Prior to FY2011 this source had declined or remained essentially flat since FY2006 As discussed in the section on Expenditure Assumptions the 2012 Legislature as part of the unfunded Medicaid mandate directed that Revenue Sharing distributions to the counties be reduced in order to cover the alleged ldquobacklogrdquo of Medicaid charges This will result in Pinellas County receiving only about two-thirds of the normal Revenue Sharing allocation in FY2013
KEY ASSUMPTIONS
Pinellas County Budget Forecast FY2014-2023 D-9
Key Assumptions For the underlying sources that support State Revenue Sharing the forecast assumes a return to the pattern of moderate growth in this revenue source that predated the economyrsquos boom and bust cycle resulting in an annual increase of 25 through the forecast period However the actual amount the County receives will be reduced in FY2013 through FY2017 The original FY2013 budget showed this as a reduction in revenue After further review the Clerkrsquos Finance Division is posting revenue at the entire ldquoearnedrdquo amount and posting the backlog holdback amount as an expenditure This has no net effect on the projections
Change in State Revenue Sharing Revenue (before Medicaid mandate reductions)
2014 2015 2016 2017 2018 2019 2020 2021 2022 2023 25 25 25 25 25 25 25 25 25 25
Supporting Information State Revenue Sharing has historically grown at a somewhat lower rate than Half-Cent Sales Taxes In addition to differences in the distribution formulas for these two revenues a portion of Revenue Sharing is derived from Cigarette Taxes which have been a declining revenue source for years These factors combine to reduce the potential for growth in Revenue Sharing Interest Earnings and Other Revenue ndash All Funds Overview The County earns interest on fund balances These funds are invested by the Clerk of the Circuit Court in accordance with the Board of County Commissionersrsquo approved Investment Policy All investment activity is conducted in accordance with Section 218415 Florida Statutes and Section 2-144 of the Pinellas County Code The primary objective of the policy is the safety of County funds The second objective is the provision of sufficient liquidity The third objective
KEY ASSUMPTIONS
Pinellas County Budget Forecast FY2014-2023 D-10
subordinate to safety and liquidity is to maximize the return on the investment portfolio while avoiding unreasonable investment risk Key Assumptions Market conditions including record low interest rates were such that interest earnings in FY2012 were once again minimal The forecast reflects the short term outlook for continued low earnings gradually increasing to earnings of approximately 3 on fund balances in the mid- to long-term
Interest Earnings on Fund Balances 2014 2015 2016 2017 2018 2019 2020 2021 2022 2023 07 10 15 30 30 30 30 30 30 30
In each fund forecast the major revenue sources that comprise most of the available resources are specifically analyzed Depending on the fund the remaining revenues may include licenses and permits charges for services fines and forfeitures rents surplus refunds reimbursements and other miscellaneous revenues For these other revenues the forecast assumes the same flat to moderate growth which reflects the anticipated gradual economic recovery
Change in Other Revenue (non-specific) 2014 2015 2016 2017 2018 2019 2020 2021 2022 2023
20 20 20 20 20 20 20 20 20 20
Key Assumptions for Other Fund-Specific Revenues Tourist Development Tax- TDC Fund Tourism is a key driver of the economy in Pinellas County The County imposes a 5 tourist development tax (ie bed tax) on rents collected for temporary lodgings The revenue highly sensitive to general economic and other conditions is driven by several factors including the number of visitors the length of stay and the Average Daily Rate (ADR) that hotels are able to collect for rentals Tourist Development tax revenues have been steadily improving since Spring 2010 and reached record levels in FY2012 FY2013 revenues are estimated to grow 4 beyond actual receipts for FY201 and are anticipated to continue to increase at 35 in FY2014 Beyond FY2014 projections continue to increase by 30 annually through the forecast period matching anticipated gradual growth as part of the recovery in the broader US economy
Change in Tourist Development Tax Revenue 2014 2015 2016 2017 2018 2019 2020 2021 2022 2023
35 30 30 30 30 30 30 30 30 30
KEY ASSUMPTIONS
Pinellas County Budget Forecast FY2014-2023 D-11
Gas Taxes - Transportation Trust Fund The County receives several types of gas tax including State Shared Gas Taxes and Local Option Gas Taxes These revenues are dedicated for transportation-related expenditures and are deposited in the Transportation Trust Fund The State Transportation Revenue Estimating Conference forecasts annual average revenue growth of 19 but this is based on the forecast of total gallons of motor fuel pumped annually in Florida The Countyrsquos gas taxes are based on gallons consumed and not fuel prices and revenue has declined 03 in FY2011 and 02 in FY2012 Pinellas Countyrsquos built out condition and future mandated vehicle fuel efficiency standards leads us to assume a continuing slow decline in these revenues Although the County has the potential to levy an additional 1 to 5 cents in Local Option Gas taxes there are no tax rate increases built into the forecast
Change in Gas Tax Revenues 2014 2015 2016 2017 2018 2019 2020 2021 2022 2023 -05 -05 -05 -05 -05 -05 -05 -05 -05 -05
Ambulance User Fee Revenue ndash EMS Fund Ambulance user fee revenues are subject to a number of variables Unanticipated changes in transport volume (positive or negative) Unanticipated Medicare audit settlements (positive or negative) Potential reductions to Medicare fee schedules (negative) Decreasing mix of private insurance payments and increasing mix of lower-reimbursement
Medicare and Medicaid payments (negative) Increased Medical Necessity verification requirements (negative) Ambulance user fee revenues are primarily driven by patient demand (transport volume) The average increase in transport volume from FY2010 to FY2012 was 20 The average increase or 10 years was 313 ranging from 05 to 74 Revenues are estimated to increase by 20 during the forecast period
Change in Ambulance User Fee Revenue 2014 2015 2016 2017 2018 2019 2020 2021 2022 2023 20 20 20 20 20 20 20 20 20 20
Flight Operations Revenues ndash Airport Fund AirfieldFlight Line revenue for FY2013 is based on the current level of carriers and passenger numbers For FY2014 through FY2023 an increase of 20 per fiscal year is forecast The forecast assumes no new carriers over the ten year period
Change in Airport Flight Operations Revenues
2014 2015 2016 2017 2018 2019 2020 2021 2022 2023 20 20 20 20 20 20 20 20 20 20
KEY ASSUMPTIONS
Pinellas County Budget Forecast FY2014-2023 D-12
Airport RentLeasesConcessions Revenues ndash Airport Fund RentLeasesConcessions revenue for FY2013 is based on current leasesagreements through the termination of these lease agreements Land leases have a five-year adjustment based on the CPI For FY2014 through FY2023 an increase of 20 is forecasted for each fiscal year The County General Fund leases land for the Jail the Criminal Justice Center and other uses from the Airport They comprise 45 of the long-term industrial (non-aviation) land leases
Change in Airport Rental Revenues 2014 2015 2016 2017 2018 2019 2020 2021 2022 2023 20 20 20 20 20 20 20 20 20 20
Water and Sewer Rates In FY2012 the Board of County Commissioners approved a four-year rate plan for both the Water and Sewer systems to meet projected revenue needs through FY2015 Water Funds Revenue In addition to its retail water customers the County has provided water at wholesale rates to six cities that purchase water in bulk and distribute it to their own retail customers The volume of water purchased declined 30 from FY2008 to FY2012 partially due to several of the cities beginning to develop alternative sources of water The amount of water purchased is also affected by economic conditions housing and commercial vacancies and levels of conservation The Water revenue forecast assumes only a 0 to 027 annual increase in retail water demand over the forecast period due to the expected slow growth in the economy The wholesale water demand reflects a continuing decline through FY2016 due to the projected loss of sales to three cities (Clearwater Tarpon Springs and Oldsmar) as they develop their own water resources Sewer Funds Revenue The volume of waste billed has declined 3 from FY2008 to FY2012 The amount of sewage processed is affected by economic conditions housing and commercial vacancies and levels of water conservation The Sewer revenue forecast assumes no increase from FY2013 to FY2014 and a 007 to 021 annual increase from FY2017 to FY2023 in retail and wholesale sewer demand Solid Waste Funds Revenue Tipping fees for the Solid Waste facility are not anticipated to increase during the forecast period Revenues are expected to grow about 05 annually The contract for electricity sales to Progress Energy contains annual escalations of 6 in revenue The contract expires in 2024
Change in Solid Waste Tipping Fee Revenues 2014 2015 2016 2017 2018 2019 2020 2021 2022 2023 05 05 05 05 05 05 05 05 05 05
KEY ASSUMPTIONS
Pinellas County Budget Forecast FY2014-2023 D-13
Expenditure Assumptions Personal Services ndash Salaries ndash All Funds Overview The cost of Personal Services (salaries and benefits) is generally the single largest category of expense (for example 50 of the General Fund) Prior to FY2009 the range of salary merit adjustments generally varied from 0 to as high as 7 No merit pay increases have been granted to County employees in five years (six years for exempt employees) Beginning on July 1 2012 employees are required to contribute 3 of salary to the Florida Retirement System effectively reducing take home pay A limited non-recurring compensation adjustment was approved for FY2013 Key Assumptions Compensation adjustments are included in the forecast for FY2014 through FY2023 County employees have not received merit pay increases for four years and in some cases five years This cost-saving measure was employed as the organization dealt with significant reductions and dramatic decreases in property tax revenue For FY2013 a one-time cost of living wage disbursement was approved In future years moderate pay for performance merit increases are expected to resume to maintain a compensation structure that can attract and retain quality employees No automatic cost of living increases are anticipated in the forecast
Change in Salaries (Merit Increases ndash Net) 2014 2015 2016 2017 2018 2019 2020 2021 2022 2023
0-3 0-3 0-3 0-3 0-3 0-3 0-3 0-3 0-3 0-3
Supporting Information The annual market survey of salaries and benefits for comparable area organizations is being reviewed at this time We have already seen indications that salaries for current employees are becoming non-competitive Additional funds may be required for potential re-classifications due to the reorganizations and reductions in force which have occurred over the past several years Non-recurring compensation adjustments such as one-time flat-amount payments could also be implemented without negatively impacting the forecast Personal Services ndash Employee Benefits ndash All Funds
Overview
The County is responsible for employer contributions to Social Security (FICA) the Florida Retirement System (FRS) State pension fund and to support various other benefits such as health and life insurance short term disability workers compensation and unemployment compensation The two key drivers for employee benefits are the Countyrsquos share of pensions and health insurance costs
KEY ASSUMPTIONS
Pinellas County Budget Forecast FY2014-2023 D-14
Florida Retirement System (FRS) The County is required to participate in the Florida Retirement System (FRS) a State public pension plan Cities have the option of joining the State system or creating their own pension plans Employees of school districts and state agencies also must enroll in FRS and comprise about two-thirds of the total active membership
Source State Board of Administration Investment Report for State Fiscal Year 2012
From 1998 to 2008 the FRS had been one of the few state systems that had an actuarial surplus This lowered the required contributions set by the Legislature that are based on an employeersquos salary and benefit category (public safety employees and elected officials have higher benefits) As with most other pension systems the financial system crisis in the fall of 2008 had a significant effect on the value of FRS investments As a result beginning in 2009 the FRS system has had an unfunded liability
KEY ASSUMPTIONS
Pinellas County Budget Forecast FY2014-2023 D-15
Source State Board of Administration
Investment Report for State Fiscal Year 2012
The FRS investment portfolio which is managed by the State Board of Administration has now substantially recovered from this setback As of March 31 2011 the net asset value for the FRS pension plan was close to the peak value it had reached in 2007
Source State Board of Administration Investment Report for State Fiscal Year 2012
However the 2011 session of the Legislature determined that significant changes were needed in the FRS system These changes are summarized in the following table
KEY ASSUMPTIONS
Pinellas County Budget Forecast FY2014-2023 D-16
These changes affected the future retirement benefits for County employees on the payroll prior to July 1 2011 as well as those hired after that date when these provisions took effect The major impact on the Countyrsquos expenditures results from changing FRS from a non-contributory to a contributory structure This allowed the Legislature to significantly reduce the employer contribution rates for FRS and not coincidentally balance the State budget The rate reductions also resulted in substantial FY2012 cost savings for the County amounting to $13M in the General Fund alone as compared to earlier projections The 2012 Legislature approved rates for the Statersquos 2013 fiscal year (June 2012 to July 2013) that were essentially the same as the previous year Looking ahead employer rates are scheduled to increase in July 2013 under current legislation and the future direction of legislative action cannot be predicted In addition to this general uncertainty the requirement for employee contributions to FRS had been challenged by a lawsuit filed on behalf of public employees by several labor organizations On January 17 2013 the Florida Supreme Court issued its ruling in this case which upheld the employee contribution requirement This avoided potential increases to employer contributions which could have negatively impacted personnel costs Health Insurance Health insurance costs for the County have followed the national trend and outpaced inflation in recent years These increases have been mitigated by the Countyrsquos aggressive cost containment measures including the renegotiation of pharmacy and health contracts the creation of a medication management program increased wellness programs and incentives for employees and the introduction of a fully insured Medicare Advantage Group plan for Medicare-eligible retirees Key Assumptions As of June 30 2012 the FRS system was still only 869 funded
KEY ASSUMPTIONS
Pinellas County Budget Forecast FY2014-2023 D-17
Source Milliman presentation to FRS Actuarial Assumptions Estimating Conference October 1 2012
Due to the reduced value of the Statersquos pension fund investments we are assuming increases in the FRS contribution requirements The forecast assumes that the State will increase rates to address the unfunded liability over the next four years rather than all at once as contemplated in the 2012 legislation because increases in these rates also have negative impacts on the budgets of State agencies and the school districts After reaching a fully funded level the rates should stabilize but there is a large degree of uncertainty in that the Legislature and Governor have demonstrated that they are willing to make major structural changes to the pension system
Projected FRS Employer Blended Contribution Rates (Regular Class) 2014 2015 2016 2017 2018 2019 2020 2021 2022 2023
566 600 640 681 681 681 681 681 681 681
The growth in the Countyrsquos FRS dollar contributions will be a combination of these rate changes and the growth in the salary base to which the rates are applied
Change in FRS Dollar Contributions 2014 2015 2016 2017 2018 2019 2020 2021 2022 2023 30 85 92 89 25 25 25 25 25 25
From 2018-2023 rates are assumed to stay constant but dollar contributions rise at the same rate as salary growth
The forecast assumes that the Countyrsquos aggressive health insurance cost containment measures will continue but that the near-to-mid-term need to supplement required self-insurance reserves as well as longer-term cost increases and employee retiree mix changes will still result in expenditure growth well in excess of CPI throughout the forecast period
KEY ASSUMPTIONS
Pinellas County Budget Forecast FY2014-2023 D-18
The Affordable Health Care Act (ACA) passed in 2010 on the national level to restructure and contain health insurance costs could have a significant impact The forecast does not assume any changes in the current situation some of the potential implications of the ACA are discussed in the Supporting Information below
Change in Health Insurance Contributions 2014 2015 2016 2017 2018 2019 2020 2021 2022 2023 100 100 100 100 100 100 100 100 100 100
The combined result of the forecast changes in salaries and benefits results in the following overall change to Personal Services costs
Change in Personal Services Expenditures (Net Total Salary and Benefit Changes)
2014 2015 2016 2017 2018 2019 2020 2021 2022 2023 41 40 40 40 40 40 40 40 40 40
Supporting Information Health insurance costs are affected by changes in the workforce As the number of active employees decreases due to budget reductions and the number of retirees in the health plan increases costs are spread over a smaller base In recent years the ratio of active employees to retirees has changed from 3 actives for every retiree to 2 actives for every retiree while costs per position have increased The result is that County employer contributions per active position have increased at a higher rate than cost inflation This trend is expected to continue Because the County is self-insured we are required to maintain the equivalent of 2 months of medical claims as a reserve Higher-than-average claims in recent years have led us to draw on our reserves such that they are below the required level This is exacerbated by the employee retiree mix changes discussed above In the near-term OPEB reserves are available to cover the deficit The details of how the Affordable Care Act (ACA) will be implemented in Florida are still being determined The following graphic illustrates the overall timeline of events that will impact employer group health plans such as the Countyrsquos
KEY ASSUMPTIONS
Pinellas County Budget Forecast FY2014-2023 D-19
Timeline Source Buck Consultants presentation ndash July 2012
Florida will be one of a number of states that will not set up a State-run Health Exchange at least initially Instead implementation will default to a Federal-run Exchange
Source Kaiser Family Foundation - Health Reform website
(data as of January 4 2013)
KEY ASSUMPTIONS
Pinellas County Budget Forecast FY2014-2023 D-20
In the future as the ACA is fully implemented the County may be able to consider new structural options For example the County could eliminate the self-insurance system and provide employees an amount to purchase coverage on the Health Exchange Detailed analysis would be needed before implementing any significant structural changes Note that the actual change in Personal Service costs in a department agency or fund may differ from these overall percentages due to reorganizations changes in the number of positions vacancies and other factors specific to the entity Operating Expenses and Capital Outlay- All Funds Overview The cost of services commodities and equipment (Operating Expenses and Capital Outlay) are driven by inflation Many costs will track closely with the Consumer Price Index (CPI) but items such as fuel chemicals and construction materials often exceed that pace The difference between inflation as measured in the CPI and the cost pressure on local governments is illustrated by the Municipal Cost Index (MCI) developed by American City amp County The MCI draws on the CPI the Producer Price Index (PPI) the Construction Cost Index (CCI) monthly statistical data collected by the US Departments of Commerce and Labor and independently compiled data to project a composite cost picture that more accurately reflects inflationary impacts on counties and cities The higher inflationary pressure on local governments is reflected in the report issued by American City and County for December 2012 Compared to the same period last year the Municipal Cost Index increased 20 versus the 17 increase in the CPI In Pinellas County expenses such as fuel electricity and state-mandated Medicaid charges reflect the MCICPI disparity demonstrating historical and projected growth exceeding CPI growth Fuel Fuel costs are dependent on the amount of fuel purchased as well as the price of fuel The County has reduced the size of the fleet and increased fuel efficiency As a result gallons purchased have declined from 136M in FY2008 to 103M in FY2012 for non-Sheriff units Beginning in late FY2011 the Sheriff began purchasing fuel through the Fleet Management Fund which added 102M gallons in FY2012 This change increased total gallons purchased but the expenditures in the Fleet Management fund were offset by an equivalent amount of revenue from the Sheriffrsquos budget Electricity The Countyrsquos office facilities are generally charged a commercial rate for electricity by Progress Energy Historically these rates have averaged annual increases of 5
KEY ASSUMPTIONS
Pinellas County Budget Forecast FY2014-2023 D-21
Medicaid The County is billed by the State for a portion of Medicaid costs The County pays the State for County resident in-patient hospital care for days 11 through 45 The days do not have to be consecutive Because patient stays of less than 11 days or more than 45 days are not paid by the County there is not a strong correlation between the Countyrsquos Medicaid bill and an increase in unemployment from the recession Key Assumptions The forecast assumes that the cost of services commodities grants and aids and equipment will generally track the CPI increases developed by the State in their consensus Revenue Estimating Conference These projections were reviewed against those from various other sources including the Survey of Professional Forecasters the University of Central Florida and the Federal Reserve While there are variations in the specific percentages all of these sources projected continuing low to moderate cost inflation over the forecast period
Change in Other Non-Personnel Expenditures (CPI) 2014 2015 2016 2017 2018 2019 2020 2021 2022 2023 15 18 17 20 19 21 20 20 20 20
Fuel - All Funds with Fleet Equipment The FY2013 Budget baseline was based on a price of $350gallon The price for the County in January 2013 was about $327gallon an average of diesel and unleaded fuel The forecast assumes price increases slightly higher than the rate of inflation
Change in Fuel Costs 2014 2015 2016 2017 2018 2019 2020 2021 2022 2023 30 30 30 30 30 30 30 30 30 30
Electricity - General Fund and Utilities Funds The Real Estate Management and Utilities departments have both taken steps to decrease annual cost increases by implementing measures to reduce energy consumption The forecast assumes flat electricity costs in FY2014 due to recent Progress Energy rate reductions Percentage increases in later years are based on the historical averages
Change in Electricity Costs - Commercial 2014 2015 2016 2017 2018 2019 2020 2021 2022 2023 0 50 50 50 50 50 50 50 50 50
Medicaid - General Fund The 2012 Legislature changed the Statersquos method of billing the County for Medicaid shifting the burden of proof to demonstrate that a claimant is not a county resident in order to dispute an
KEY ASSUMPTIONS
Pinellas County Budget Forecast FY2014-2023 D-22
amount on a bill The State is also reducing the Countyrsquos Revenue Sharing funds to cover a multi-year backlog in billings Unemployment Compensation ndash General Fund Unemployment Compensation for all County operations other than the Sheriff is billed by the State to the General Fund Historically these expenses were less than $01M annually However costs peaked at $12M in FY2010 due to Reductions in Force (RIFs) and declined over the next two years to $02M in FY2012 Future yearsrsquo costs are expected to be closer to the historical average in the absence of another major RIF Supporting Information Fuel efficiency gains are anticipated as new Federal Corporate Average Fuel Economy (CAFEacute) standards for heavy trucks and equipment take effect due to the composition of the fleet Only 47 of 1726 BCC units are cars (less than 3) the bulk of the fleet (excluding the Sheriffrsquos vehicles) is heavy equipment These units usually achieve only 8 to 10 miles per gallon because of idling time (for power take off units) and the gear ratio needed to haul heavy loads The new standard will increase mpg to 12 in 2014 Previously there had been no federally mandated fuel economy standards for heavy trucks and equipment Some departments will have increased fleet replacement costs as units are replaced that are not currently paying into the Fleet fund due to deferral of purchases and life cycle extensions However where feasible some future purchases of replacement equipment may be deferred to take advantage of the new fuel economy standards Other Post Employment Benefits (OPEB) ndash All Funds Overview Consistent with Government Accounting Standards Board directives the Countyrsquos actuarial consultants computed the unfunded Other Post Employment Benefits (OPEB) liability as of October 1 2011 at $392M for Unified Personnel System (UPS) employees and $315M for Sheriff employees The Countyrsquos net Annual Required Contribution (ARC) for OPEB to fully fund this liability would be $277M for UPS employees and $241M for Sheriffrsquos Office employees The FY2013 Budget includes a transfer of $2M from the General Fund to the Employee Benefits Fund for a partial contribution to the annual OPEB ARC for both UPS and Sheriffrsquos Office employees In previous years the County set aside a cumulative total of $27M for OPEB Other local governments in Florida with an OPEB liability are also partially funding those obligations as budgets allow Key Assumptions The forecast assumes that OPEB funding in the General Fund will continue at the current level of $2M per year throughout the forecast period This will be reviewed following analysis of the
KEY ASSUMPTIONS
Pinellas County Budget Forecast FY2014-2023 D-23
next OPEB actuarial report which will provide valuations as of October 2013 OPEB contributions for Enterprise operations are contained within their respective funds
Projected OPEB Contributions - $ millions 2014 2015 2016 2017 2018 2019 2020 2021 2022 2023 $20 $20 $20 $20 $20 $20 $20 $20 $20 $20
Supporting Information Effective January 1 2011 new hires will not further increase the OPEB liability upon retirement and new retirees covered by Medicare must enroll in the less costly Medicare Advantage plan option These actions will help better quantify the OPEB liability in the next OPEB valuation actuarial study Other Fund-Specific Expenditures Ambulance Contract Expenditures ndash EMS Fund The County contracts with Paramedics Plus for the Countyrsquos SUNSTAR ambulance system Contracts with the Countyrsquos ambulance provider were renegotiated in FY2012 with an annual reduction to base service payments of $2 Million A 6 increase was included in the forecast from FY2014 through FY2022 to account for annual CPI increases and increases to transport volume However once the contract is up for negotiation expenditures may change as the economy rebounds and fuel and labor costs and other factors change
Change in EMS Ambulance Contract Expenditures 2014 2015 2016 2017 2018 2019 2020 2021 2022 2023 60 60 60 60 60 60 60 60 60 60
First Responder Expenditures ndash EMS Fund
The County contracts with the eighteen first responder EMS providers that respond to calls using paramedics and that utilize Advanced Life Support (ALS) or Basic Life Support (BLS) equipment and personnel First responder contractual expenditures increased 51 from FY2012 to FY2013 and are estimated to increase at 5 through the forecast period
Change in EMS First Responder Expenditures 2014 2015 2016 2017 2018 2019 2020 2021 2022 2023 50 50 50 50 50 50 50 50 50 50
Purchase of Water - Utilities Water Funds A major expense to the Water System is the purchase of water from Tampa Bay Water The annual change in the cost of water reflects the combined impact of changes in Tampa Bay Water rates andor changes in consumption including decreases in wholesale customer base The actual cost in dollars will be dependent on the amount of water purchased
KEY ASSUMPTIONS
Pinellas County Budget Forecast FY2014-2023 D-24
Change in Cost of Water Purchased from Tampa Bay Water 2014 2015 2016 2017 2018 2019 2020 2021 2022 2023 10 21 08 17 17 18 17 19 21 21
Chemicals - Utilities Water and Sewer Funds The increase in the cost of chemicals for Water and Sewer operations has been historically around 7 annually The forecast projects this trend to continue
Change in Cost of Chemicals for Utilities 2014 2015 2016 2017 2018 2019 2020 2021 2022 2023 70 70 70 70 70 70 70 70 70 70
Capital Outlay - Utilities Water and Sewer Funds The Water and Sewer capital outlay forecasts reflect the construction and purchase needs as estimated by the Pinellas County Department of Environment and Infrastructure Engineering Division in the CIP ten year work plan Solid Waste Expenditures ndash Utilities Solid Waste Funds Solid Waste operating expenditures are projected to generally follow overall inflationary trends The Solid Waste capital outlay forecast reflects the construction and purchase needs as estimated by the consulting engineering services report by CDMSmith Inc There is a large capital need forecasted from FY2013 through FY2018 to install additional air pollution measures in anticipation of tighter regulatory requirements and additional required improvements Other Forecast Considerations While climate change is generally viewed as a long-term problem recent events show that we may already have begun to see an increase in the frequency and intensity of storms such as hurricanes and unseasonable weather Should this trend continue it may be prudent to consider increasing fund reserves to provide adequate resources to deal with the cost of responding to these events As a coastal community rising sea levels due to climate change may require expenditures to reconstruct or relocate facilities that are in low-lying areas At this time it appears that these costs would not be incurred during the timeframe of the forecast
FUND FORECASTS
Pinellas County Budget Forecast FY2014-2023 E-1
The Fund Forecasts portion of the Budget Forecast FY2014-2023 includes ten-year forecasts for ten of the Countyrsquos major funds
General Fund
Tourist Development Fund
Transportation Trust Fund
Capital Projects Fund
Emergency Medical Services Fund
Fire Districts Fund
Airport Fund
Utilities Water Funds
Utilities Sewer Funds
Utilities Solid Waste Funds
Sections in Each Fund Forecast Each fund forecast includes the following sections
Description Provides information concerning the fund such as fund type legal authority authorized uses of proceeds etc
Summary Provides an at-a-glance summary of the ten-year forecast These results are also summarized in the Executive Summary
Revenues Provides a high level overview of the major revenues in the fund
Expenditures Provides a high level overview of the major expenditures in the fund
Ten Year Forecast Includes key assumptions in the forecast a chart of the ten-year forecast and key results interpreted from the forecast chart
Potential Risks Includes key factors that affect assumptions in the forecast over the forecast horizon
Balancing Strategies Includes potential revenue and expenditure options for balancing the funds
Additional Information The fund forecasts in this section are intended to be high level user-friendly summaries of the results of the ten-year forecast for each fund For more detailed information please see the Key Assumptions and Pro-Formas portion of this document
FUND FORECASTS
Pinellas County Budget Forecast FY2014-2023 E-2
GENERAL FUND
Description The General Fund includes the primary governmental functions of the County that are not completely supported by dedicated resources These activities include but are not limited to Sheriffrsquos law enforcement detention and corrections health and human services emergency management and communications parks and leisure services and the operations of the Property Appraiser Tax Collector and Supervisor of Elections The General Fund includes operations for both county-wide functions and the unincorporated area These segments are tracked separately within the fund The unincorporated area is commonly referred to as the MSTU (Municipal Services Taxing Unit) MSTU expenditures are about 9 of the total (net of reserves)
Summary The General Fund encompasses the principal governmental activities of the County that is those that are not primarily supported by dedicated revenues or by user fees The four main revenue sources for the General Fund are Property Taxes State Shared Half-Cent Sales Taxes State Revenue Sharing and Communications Services Taxes The forecast projects that beginning in FY2013 recurring expenditures exceed recurring revenues in the General Fund This is primarily due to the aftereffects of the Great Recession with continued slow recovery of the real estate market In addition caps on taxable value increases and total property tax revenue will inhibit future revenue growth Major expenditure drivers that exceed normal inflation include personnel costs such as health insurance and state-required pension contributions and mandated expenses such as Medicaid There is a long-term structural imbalance of approximately $15M increasing to $60M per year over the forecast period absent action to address this problem The balancing strategy for the General Fund is to cover the shortfall in FY2014 by utilizing the Service Level Stabilization Account (SLSA) Expenditure reductions or revenue increases may be required in FY2014 or future years to address the structural imbalance The extent of the changes needed will be dependent on the pace of the economic recovery particularly the real estate market
Revenues Property Taxes are the single largest source of General Fund revenues accounting for more than two-thirds of the total The four primary funding sources for the General Fund (Property Taxes State Shared Half-Cent Sales Taxes State Revenue Sharing and Communications Services Taxes) comprise about 81 of the revenue The remaining 19 is derived from a variety of resources including User Fees Grants Interest and Cost Recovery from other County funds
Pinellas County Budget Forecast FY2014-2023 E-3
GENERAL FUND
Source FY2013 Adopted Budget Property Taxes The decline in property tax revenue from FY2008 to FY2012 exceeded the increases that occurred from FY2004 though FY2007 The FY2013 budgeted revenue is comparable to the revenue collected in FY2003 The chart below features a dotted line showing what the historical average of 5 growth in property tax revenue would look like It shows that the above-average amounts collected in FY2004 through FY2008 have been overcome by the large gap between current property tax revenues and where they would have been if the historical 5 growth had taken place
Pinellas County Budget Forecast FY2014-2023 E-4
GENERAL FUND
As discussed in the ldquoAssumptionsrdquo section of the forecast document the Statersquos mandated increase in the Countyrsquos Medicaid costs adversely affected the General Fund In order to stay the course on the established multi-year strategy for achieving financial sustainability the FY2013 budget included an increase of 01997 mills in the county-wide millage rate There was no increase in the MSTU millage rate The combined General Fund property taxes for countywide and MSTU are expected to generate $2866M in FY2013 The total property tax revenue will be comparable to FY2003 and is $147M or 34 less than the FY2007 peak revenue The negative impact from reduced property tax revenue is generally less pronounced for the municipalities in Pinellas County Their General Fund revenue mix usually reflects other revenues such as franchise fees and utility taxes that can help mitigate the impact of a reduction in property tax revenue
Sales Taxes The second largest General Fund revenue source is the State Shared Half-Cent Sales Tax which is 9 of total General Fund revenues Sales Tax collections have begun to recover from the effects of the recession but estimated revenues for FY2013 are still 9 under the peak year of FY2006 This tax is expected to generate $382M in FY2013
State Revenue Sharing The third major General Fund source State Revenue Sharing which is 2 of total General Fund revenues is also primarily based on the Statersquos sales tax revenue It is estimated that from this source the County will recognize $142 million in FY2013 This is 20 less than the FY2006 peak year revenue However the Statersquos implementation of the Medicaid mandate which holds back funds for the ldquobacklogrdquo of Medicaid billings means that the County can only expect to receive $94 million in FY2013 The State also plans to reduce the Countyrsquos Revenue Sharing amounts for FY2014 through FY2017 The original FY2013 budget showed this as a reduction in revenue After further review the Clerkrsquos Finance Division is posting revenue at the entire ldquoearnedrdquo amount and posting the backlog holdback amount as an expenditure Communications Services Taxes The fourth major revenue in the General Fund is the Communications Services Tax (CST) The CST is expected to generate $107M in FY2013 down from a peak of $132M in FY2007 The Countyrsquos CST rate is 522 which is the maximum allowed under current State law Pinellas Countyrsquos revenue reflects the statewide trend for this source which has experienced continued erosion due to heightened competition in the wireless market and reduced consumer spending following the recession Other Revenues Lesser revenue sources include User Fees Sheriffrsquos Law Enforcement Contracts Cost Recovery from other funds Interest Earnings and various other sources including Federal and State grants In general these revenues decreased as a result of the recession but are mostly expected to resume moderate growth in FY2014 and future years
Pinellas County Budget Forecast FY2014-2023 E-5
GENERAL FUND
Expenditures The General Fund includes the primary governmental functions of the County that are not completely supported by dedicated resources These activities include but are not limited to Sheriffrsquos law enforcement detention and corrections support of the Court system including facilities and technology health and human services environmental management emergency management and communications parks and leisure services general administration and the operations of the Property Appraiser Tax Collector and Supervisor of Elections The budgeted expenditures in the General Fund for FY2013 total $4514M (net of reserves and the Service Level Stabilization Account) and can be summarized in four groups the Board of County Commissioners the Sheriff Other Constitutional Officers and Independent Agencies
Source FY2013 Adopted Budget
Board of County Commissioners This grouping of departments includes the departments under the County Administrator as well as the County Attorneyrsquos Office and the Board of County Commissioners (BCC) They are $1832M or 41 of total FY2013 General Fund expenditures (net of reserves and Service Level Stabilization Account) Some of the major BCC programs include social services matching funds for Medicaid building operations and maintenance (including the courts jail and Sheriffrsquos headquarters) parks maintenance environmental protection environmental preserves cultural affairs emergency management animal shelter rabies control economic development consumer services veteranrsquos services the county extension service Florida Botanical Gardens Heritage Village public information the County cable television station planning budget purchasing and State-mandated support of juvenile detention
Pinellas County Budget Forecast FY2014-2023 E-6
GENERAL FUND
Sheriff The Sheriff is an independently elected Constitutional Officer The Sheriffrsquos budget is $2133M or 47 of total FY2013 General Fund expenditures (net of reserves and Service Level Stabilization Account) Detention and Corrections programs comprise 53 of this total The Sheriff also provides support to the Court System and provides Law Enforcement services to both the unincorporated area (MSTU) and by contract to 13 municipalities This includes St Pete Beach for which a contract was approved during FY2013 The Sheriffrsquos adopted budget is often supplemented during the year by grants from Federal and State agencies such as the US Department of Justice and the Florida Department of Law Enforcement Other Constitutional Officers These agencies which are headed by independently elected officials comprise $382M or 8 of total FY2013 General Fund expenditures (net of reserves and Service Level Stabilization Account) In most cases the General Fund only reflects part of the total agency budgets The Tax Collector and Property Appraiserrsquos budgets are determined by statutory formulas and are approved by the State Department of Revenue The General Fund provides about 80 of the Tax Collector and 85 of the Property Appraiser total budgets The remainder is supported by other funds and by revenue sources that are specific to certain functions An example of the latter is the processing of driverrsquos licenses which receives some state support but not enough to cover the Tax Collectorrsquos cost of providing the service The Clerk of the Circuit Court has two separate budgets for activities in support of the Board of County Commissioners and for support of the Court system The latter is fee supported and is not included in the Countyrsquos budget it is funded and approved by the State The Board-related functions comprise about 25 of the Clerkrsquos total budget The budget for the Supervisor of Elections experiences annual fluctuations which result from the varying number and scope of elections in a given year The Supervisor is responsible for preparing and conducting all Federal State County and Municipal elections within the County The Board funds 100 of the Supervisorrsquos budget excluding occasional State or Federal grants Independent Agencies These agencies are $167M or 4 of total FY2013 General Fund expenditures (net of reserves and Service Level Stabilization Account) They include the Countyrsquos support for the Judiciary the State Attorney the Public Defender the Criminal Justice Information System (CJIS) the Medical Examiner the Office of Human Rights and Human Resources Court Support Much of the Countyrsquos court support is driven by statutory mandates and Article V of the State Constitution that require the County to fund certain technology expenses programs and facilities Only about 12 of the Judiciaryrsquos total budget 8 of the Public Defenderrsquos budget and 1 of the State Attorneyrsquos budget are funded by Pinellas County This funding includes some local programs over and above the mandated requirements such as Teen Court Drug Court and the Public Defenderrsquos Jail Diversion efforts The Sixth Judicial Circuit encompasses
Pinellas County Budget Forecast FY2014-2023 E-7
GENERAL FUND
both Pinellas and Pasco counties Pasco County provides funding for similar functions at a lower level due to its relative size The balance of these agency budgets are funded by the State Other Agencies The Medical Examiner also serves the entire Sixth Judicial Circuit and therefore is supported by both Pinellas and Pasco Counties The Medical Examiner is not a government employee but provides forensic investigative and laboratory services to the County by contract Two other agencies receive General Fund support The Office of Human Rights provides County citizens protection from employment and housing discrimination and also acts as the Countyrsquos internal affirmative action agency The Human Resources department manages the Unified Personnel System (UPS) which provides centralized personnel services for the BCC and most of the other County elected officials and independent agencies The major exception is the Sheriff who operates a separate personnel system Types of Expenditures In addition to the breakout of organizational responsibilities another way of looking at General Fund requirements is to consider the types of expenditure required for those organizations to carry out their responsibilities Personal Services Operating Expenses and Capital Outlay in the General Fund are similar to those in other County funds Several of the other expenditure categories merit additional discussion Grants amp Aids Debt Service and Transfers Grants and Aids The Grants and Aids expenditure category includes several types of funding provided by the County to other entities such as financial assistance for low income residents and support of community non-profit social action agencies Grants and Aids also include Tax Increment Financing (TIF) payments to cities for community redevelopment areas (CRAs) Nine cities within the county have established a total of twelve CRAs The County is required by interlocal agreements to contribute funds annually based on formulas that reflect the amount of growth in taxable values compared to a specified base year In FY2013 the County will contribute an estimated total of $63M in TIF payments to the cities Debt Service Unlike many other local governments Pinellas County has no outstanding bond issues which are supported by a pledge of property taxes or other general revenue The only budgeted expenses for Debt Service (principal and interest payments) are for potential short term cash flow or financing needs Transfers Transfers between funds includes ongoing or non-recurring items For example an ongoing transfer to the Employee Health Benefits Fund is budgeted to address unfunded liabilities for Other Post Employment Benefits (OPEB) FY2013 includes the first of five $15M transfers to the Capital Projects Fund to support the Centralized Chiller project which had been advance-funded from other sources
Pinellas County Budget Forecast FY2014-2023 E-8
GENERAL FUND
Non-recurring funds may also be included in the other expenditure categories For example FY2013 Operating Expenses includes $39M in cost allocation charges from BTS to complete funding for the Justice Consolidated Case Management System (CCMS) project At the end of each fiscal year non-recurring funds may be realized as additional fund balance resulting from revenue in excess of expenditures in a given fund The amount of non-recurring or one-time funds can vary significantly from year to year As stated in the Countyrsquos budget policies non-recurring funds should be applied to increase reserves or for one-time purposes only They should not be used to fund ongoing programs Reserves Reserves are not expenditures but they are included in the budgeted total requirements for the fund In order to be expended the BCC must take formal action reappropriating these funds Maintaining adequate reserves is key to the Countyrsquos ability to deal with potential emergencies and unforeseen events such as fuel price increases unanticipated dips in revenues or a natural disaster This is even more important in view of our geographic location on the Florida Gulf Coast We need to have the ability to maintain critical public safety transportation and other services during and after hurricanes and other severe storms We need the resources to provide these services immediately and not rely on Federal funding which is often made available as reimbursements and received months or years after the event Also federal (FEMA) reimbursements typically cover only 75 of the loss Additionally due to conditions in the insurance marketplace our coverages are less than the Countyrsquos total asset base The Countyrsquos property value is estimated at approximately $12 billion (net of the Solid Waste and South Cross facilities) We carry $100M worth of wind damage insurance This means that we have additional exposure depending on the kind of damage we could receive in a storm event or natural disaster Having an adequate reserve also demonstrates stability to the financial markets Although Pinellas has the lowest general revenue debt of any major Florida county this stability enhances our ability to raise capital through bonding at a lower cost if required in the future
The budget policies for General Fund Reserves (Fund Balance) were established by the Board of County Commissioners in accordance with principles issued by the Government Accounting Standards Board (GASB) and are summarized in the following table
Pinellas County Budget Forecast FY2014-2023 E-9
GENERAL FUND
The amount and use of Non-Spendable and Restricted Reserves are defined by the value of inventories and limitations imposed by external entities such as grants that are being carried forward from the previous year The budget policies address the other ldquounrestrictedrdquo categories Prior to FY2011 the General Fund reserve policy was ldquoat a minimum no less than 5 to 15 of operating revenues or no less than one to two months of operating expendituresrdquo Over the last several years the Board of County Commissioners set a conservative General Fund reserve target of 15 of total resources For FY2011 the Board revised its budget policy to incorporate this more conservative approach given that Pinellas County is a high hazard coastal county The revised budget policy states
The General Fund Reserve (Ending Balance) should be budgeted at a level of no less than 15 of total resources
The policy essentially sets a floor of 15 for the reserve level and does not set a cap to limit the reserve The FY2013 General Fund budget includes a projected reserve of $818M which meets the Boardrsquos 15 policy target The components of the estimated FY2013 year-end reserves are Contingency Encumbered Contracts Cash Flow and Disaster Response
Contingency Reserve The Contingency Reserve which is budgeted at $272M in FY2013 is an amount equal to 5 of resources to be used for unanticipated revenue shortfalls or expenditures For example fuel costs and electricity rate increases have been highly volatile and often exceed normal inflation Another example is the need for accrued leave payouts due to layoffs
Pinellas County Budget Forecast FY2014-2023 E-10
GENERAL FUND
Encumbered Contracts Reserve During the year at any given time there are purchase orders and service contracts that have been approved and are subject to payment as work is completed or goods delivered The $76M in the Encumbered Contracts Reserve for FY2013 represents the average amount that was encumbered at monthrsquos end for the 12-month period ending May 2012 Cash Flow Reserve The Cash Flow Reserve is required to meet cash flow needs During the first two months of the fiscal year expenditures exceed revenues because most of the property tax revenue is not received until December Property tax revenue represents about 68 of the total General Fund revenue The FY2013 amount for the Cash Flow reserve $357M is equal to one-twelfth of all General Fund revenue budgeted for the fiscal year Disaster Response Reserve As a high hazard coastal county Pinellas needs to have Disaster Response Reserve funds on hand in case of an emergency such as a hurricane or other man-made or natural disasters In FY2013 $113M is budgeted in this reserve Reimbursement from the Federal Emergency Management Agency (FEMA) and the State usually cover only a portion of the costs is not available at the beginning of a disaster and often is not received for many months or years For example FEMA funds for the three 2004 hurricanes which brushed Pinellas County (Jeanne Charley Frances) were not fully received until 2007 after extensive and protracted appeals through FEMA and the State Approximately $16M of the $93M total cost was not reimbursed for these storm events There are other economic impacts which can result from a major disaster With a substantial portion of the countyrsquos highest taxable value properties located on the shoreline or in lower elevation coastal areas there is the potential for a reduction in the tax base if properties are damaged or destroyed by a storm surge or high winds This would result in a decline in property tax revenue in the following year Sales and other taxes would also decrease due to the negative effects on tourism from the storm Rebuilding would generate additional revenues but it would take time to offset the losses in the aftermath of the disaster As an indication of the size of this problem a seven-county area of Florida impacted by 2004rsquos Hurricane Charley sustained over $66 Billion in losses to residential commercial and industrial properties The County is the primary coordinating agency for disaster response and extraordinary unbudgeted expenses are required to respond to such a situation Resources are needed to pay for extended work hours for Sheriffrsquos deputies and other emergency first response personnel and to operate emergency shelters and the emergency communications center Public works crews and equipment and possibly private contractors are needed to repair storm damage Debris removal funding may be required if solid waste resources are not available Since storms may vary greatly in their impact it is not possible to predict the exact amount which would be required
Pinellas County Budget Forecast FY2014-2023 E-11
GENERAL FUND
Ten-Year Forecast Key Assumptions ndash Revenues For the purposes of the forecast it is assumed that the General Fund millage rates for both countywide and MSTU purposes will remain the same as the rates for FY2013 The FY2013 countywide millage rate is 50105 mills and the MSTU rate is 20857 mills As explained in the Key Forecast Assumptions section of this document the forecast is that taxable values will return to positive growth of 25 in FY2014 and FY2015 In FY2016 and later years the forecast assumes an annual growth rate of 3 which is less than the 5 historical average growth which occurred in the years before the real estate boom For the State Shared Half-Cent Sales Tax we anticipate 40 growth for FY2014 and a 35 annual growth for the FY2015-FY2023 forecast period The underlying sources of State Revenue Sharing are expected to return to a pattern of moderate growth slightly less than the sales tax with an annual increase of 25 through the forecast period However as noted above the implementation of the Medicaid mandate will result in the State reducing the amount of revenue sharing funds the County receives for FY2013 through FY2017 Communications Services Tax revenue is forecast to continue a slow decline throughout the forecast period decreasing 05 per year For other revenues in the General Fund the forecast assumes flat to moderate growth which reflects the anticipated gradual economic recovery Key Assumptions - Expenditures The forecast assumes a continuation of current (FY2013) programs and service levels The basic assumptions for Personal Services and Operating Expenses that are used throughout the forecast apply to the General Fund The forecast does not assume any net additional positions However certain expenses such as electricity fuel and state-mandated Medicaid charges result in the General Fundrsquos Operating Expense growth differing somewhat from the Consumer Price Index (CPI) As discussed previously the County has no outstanding bond debt supported by property taxes or other general revenues No such bond issues are anticipated during the term of the forecast Because of the uncertain nature of non-recurring funds none are anticipated in the forecast with the exception of those estimated to be available in FY2014 and $15M per year for FY2015 through FY2017
Pinellas County Budget Forecast FY2014-2023 E-12
GENERAL FUND
No new programs funded by non-routine grants are included in the forecast The assumption is that any such expenditures will be dedicated for non- recurring purposes or will cease when the grant funds are no longer available In the recent past the Sheriff in particular has been very proactive in seeking Federal and State funding for public safety purposes that supplement but not supplant existing budgets While this is desirable and likely to continue for the purposes of the forecast these unpredictable expenses and their offsetting revenue are not included Several capital improvement projects are expected to impact operating expenditures when completed These projections have been incorporated into the forecast For example several energy conservation projects currently in progress are anticipated to reduce future ongoing utilities costs Conversely completion of the Lake Seminole Alum Injection project will place additional demands on General Fund resources As specific increased needs are identified to the extent possible these new demands will be accommodated within existing budgets Key Results The forecast projects that in FY2014 recurring expenditures will exceed recurring revenues in the General Fund by an estimated $121M The gap for FY2014 can be closed on a one-time basis by using the resources available in the Service Level Stabilization Account in accordance with the plan approved by the Board However a structural gap of approximately $15M increasing to $60M would remain throughout the forecast period without action to address this ongoing problem
Pinellas County Budget Forecast FY2014-2023 E-13
GENERAL FUND
Forecast Budget Gap
Without Corrective Action 2014 2015 2016 2017 2018 2019 2020 2021 2022 2023
($14M) ($177M) ($208M) ($251M) ($282M) ($338M) ($390M) ($432M) ($503M) ($575M)
Potential Risks REVENUE FACTORS Taxable Values There are many factors that can alter the ten-year forecast of the General Fund The primary concern due to this fundrsquos reliance on property taxes for a significant portion of revenue is the performance of the real estate market The timing of the valuation of property for tax purposes is important The FY2014 values to be certified on July 1 2013 will reflect the market conditions through the end of the 2012 calendar year Therefore increases or decreases in value after January 1 2013 will not impact the FY2014 tax base A change of 1 in the FY2013 countywide taxable value would result in a $26M change in revenue at the FY2013 millage rate of 50105 Similarly a change of 01 mills in the rate using the FY2013 taxable value would result in a $52M change in revenue In the following years these impacts would be amplified by the other growth factors Save Our Homes Impact Another variable is the homesteaded taxable value increase cap imposed by the Save Our Homes amendment which is based on the annual change (December to December) in the Consumer Price Index Under ldquonormalrdquo circumstances as homesteaded properties represent about 35 of the total countywide taxable value a change of 1 in the CPI (positive or negative) at the current millage rate would produce a change in revenue of approximately $1M Because of the decline in market values the amount of value that is shielded by Save Our Homes has been greatly reduced As the real estate market returns to a pattern of growth Save Our Homes will limit the amount of the increased value that is subject to property taxes Potential Property Tax Exemptions The major proposed amendments to the State Constitution related to property taxes on the November 2012 general election ballot were defeated but it is conceivable that one or more of them will be revisited in the future Amendment 11 would have authorized the Legislature to allow local governments to increase exemption amounts for low-income seniors who have maintained permanent residency for at least 25 years The Legislative staff estimated that this would have had a negative impact on local government revenues of more than $9M statewide beginning in FY2015
Pinellas County Budget Forecast FY2014-2023 E-14
GENERAL FUND
Amendment 10 would have increased the amount of the tangible personal property exemption from $25000 to $50000 The Legislative staff estimated that this would have had a negative impact on local government revenues of more than $20M statewide beginning in FY2014 Amendment 4 included three proposed expansions of property tax exemptions The first would have reduced the cap on the annual change in taxable values for non-homesteaded property from 10 to 5 The second would have allowed the Legislature to eliminate the ldquorecapture rulerdquo and prevent the assessed value of a property from increasing when its market value declines even if the assessed value is less than the market value The third would have granted an additional initial homestead exemption of 50 of market value to homeowners who had not had a homestead exemption in Florida in the previous 3 years The Legislative staff estimated the cumulative impact of the proposals would have been a revenue loss to local governments of nearly $1 billion statewide by FY2016 The Florida Association of Counties estimated the potential revenue loss for Pinellas County at $37M in FY2014 growing to $127M annually by FY2017 Other new exemptions as well as revenue and expenditure caps have been discussed and their passage in future legislative sessions or referendums would have negative revenue impacts as well Annexations In the unincorporated area the property tax base and revenue in the MSTU would be affected by annexations or by the creation of new municipalities If a significant reduction in the tax base occurs costs could be spread across a much smaller population There are two basic methods of annexation in Florida annexation by referendum and voluntary annexation According to a Pinellas Planning analysis from FY2001 through FY2011 approximately 8000 acres representing $12 billion in taxable value was removed from the MSTU through these processes Annexation activity both referendum and voluntary was significantly lower during fiscal years 2008 through 2011 than in the previous seven years As property values begin to rise again there may also be an increase in proposed annexations A thorough reevaluation of the scope and delivery methodology for MSTU services would be required if these changes reach a tipping point in the economies of scale Economic Conditions The three other major revenue sources ndash Sales Tax Revenue Sharing and Communications Services Tax - are highly sensitive to economic conditions If the economy improves collections could be higher than anticipated as disposable income increases The reverse would be true if the economic recovery stalls or deteriorates into a new recession The Sales Tax is highly sensitive to economic conditions If consumer confidence does not continue to improve consumption will not grow at the moderate pace assumed in the forecast The University of Floridarsquos Consumer Confidence Index was down slightly in November and December 2012 from its post-recession peak of September and October possibly due to media attention on the looming federal ldquofiscal cliffrdquo The 35 to 40 annual growth in the Sales Tax
Pinellas County Budget Forecast FY2014-2023 E-15
GENERAL FUND
forecast for FY2014 generates about $13M to $18M in additional revenue each year which would be impacted by variations from the anticipated economic recovery assumptions The forecast assumes that the sources tied to Revenue Sharing will grow at 25 per year a rate slightly less than the growth in Sales Tax However as mentioned previously the Statersquos implementation of the Medicaid mandate which holds back funds for the ldquobacklogrdquo of Medicaid billings means that the County will receive less than the full amount for the next several fiscal years This illustrates the point that there is no Constitutional prohibition against the State changing the formula to reduce or eliminate this revenue source unless the funds have been committed for debt service (which is restricted to 50 of the prior yearrsquos proceeds) Pinellas has no Revenue Sharing pledged to support debt and the entire allocation is subject to revision by the Legislature State Budget Impacts For the fourth year in a row the State faced a significant budget gap for its FY2013 budget Current projections for the Statersquos FY2014 budget are more positive but upcoming budget cycles will continue to be challenging given the reliance on sales taxes as the Statersquos primary revenue stream In dealing with upcoming State budget gaps the Legislature may continue to reduce the amount of revenue it shares with local governments or cost shift more state responsibilities to the counties and cities The Medicaid mandate is only the most recent example of this tactic Previously for example effective in July 2005 the countiesrsquo share of sales tax and revenue sharing revenues was decreased in response to the implementation of Article V Section 7 court funding reforms These formula changes can have serious impacts on the General Fund A 10 cut in the Sales Tax formula would reduce revenues by over $38M Similarly there has been repeated pressure from the telecommunications industry to reduce the scope of services that are subject to the Communications Services Tax (CST) The 2012 Legislature approved a bill subsequently signed by the Governor which will have a negative statewide impact on local CST revenues of more than $25M A State commission is currently studying the CST to recommend further structural changes that may lead to even greater reductions in revenue The cumulative negative impact of these changes is undetermined at this time Limiting Factors A cautionary note for long-term planning relates to the scarcity of undeveloped land in Pinellas County We will see relatively fewer new residents in the future compared to other counties with more opportunities for expansion Because the distribution formulas for both shared sales taxes and revenue sharing are partially based on population Pinellas will represent a declining percentage of the state total and therefore the percentage of these revenues will decline also For example in the 2000 Census Pinellas represented 58 of the Statersquos 16 million residents By the 2010 Census Pinellasrsquo population remained virtually the same while the State population grew to 188 million As a result Pinellas represented 49 of the Statersquos population
Pinellas County Budget Forecast FY2014-2023 E-16
GENERAL FUND
in 2010 Although the slowing of overall population growth in the State will delay the effect some erosion will result for those grants and other revenues that are allocated by population-driven formulas EXPENDITURE FACTORS Inflation On the expenditure side of the equation the Consumer Price Index is a key element For consistency the CPI changes used in the forecast are those produced by the State of Floridarsquos National Economic Estimating Conference It should be noted that this is a consensus process which involves the Legislature the Governorrsquos Office and the Statersquos Division of Economic and Demographic Research The intent is to produce a professional nonpartisan basis for development of the Statersquos budget that melds a variety of perspectives and therefore does not necessarily reflect any one participantrsquos economic model Historically although inflation was as high as 125 in 1981 in the years from 1989 to 2008 the change in the CPI averaged about 3 The true inflation rate will have a significant effect on future requirements For example an increase of 1 in the CPI if applied to all FY2013 recurring costs would require an additional $5M in expenditures A change of 1 in the salary and benefits assumptions would produce a cost variance of $3M and an increase in the inflation rate of 1 would result in a $2M change in operating expenses in FY2014 and would trigger escalating impacts going forward Operating expenses have been assumed to generally follow the CPI inflation rate but costs such as fuel and electricity are subject to unforeseeable variations and could impact this scenario Florida Retirement System Because salaries and benefits are such a significant part of General Fund expenditures higher than projected FRS contribution rates or health insurance cost increases could have significant negative impacts The FRS bill approved in 2012 tentatively establishes increased rates for the State 2014 fiscal year (July 1 2013 to June 30 2014) to address the systemrsquos unfunded liability These rates are subject to change in next yearrsquos legislative session The forecast assumes that the State will increase rates significantly to address the unfunded liability over the next four years rather than all at once as contemplated in the 2012 legislation because increases in these rates also have negative impacts on the budgets of State agencies and the school districts After reaching a fully funded level the rates should stabilize but there is a large degree of uncertainty in that the Legislature and Governor have demonstrated that they are willing to make major structural changes to the pension system In addition to this general uncertainty the requirement for employee contributions to FRS had been challenged by a lawsuit filed on behalf of public employees by several labor organizations On January 17 2013 the Florida Supreme Court issued its ruling in this case which upheld the employee contribution requirement This avoided potential increases to employer contributions which could have negatively impacted personnel costs
Pinellas County Budget Forecast FY2014-2023 E-17
GENERAL FUND
Health Insurance Health insurance costs are impacted by inflation and also by the package of benefits offered The extent to which the ratio of active employees to retirees changes will also impact the Countyrsquos employer contributions to the health plans An additional unknown is the effect of Federal health insurance reform on costs and services including any related mandates to programs such as Medicaid Unfunded Mandates No new State or Federal mandates have been included in the forecast As the State deals with its budget problems there is likely to be growing pressure to push expenses down to local governments even while imposing more restrictions or rollbacks on local revenues The 2012 Legislaturersquos Medicaid mandate illustrates this point Theoretically Article VII Section 18 of the Florida Constitution has a prohibition against imposing unfunded mandates on counties and cities In practice the Legislature can avoid this prohibition in many ways through exemptions (such as mandates to enforce criminal laws) or exceptions including declaring that the mandate ldquofulfills an important state interestrdquo and is approved by a 23 vote of both the Senate and House According to a report prepared by the Legislative Committee on Intergovernmental Relations in 2009 alone the Legislature enacted 25 laws containing 74 provisions that imposed mandates on counties and municipalities
Balancing Strategies One of the key financial strategies employed over the past three years has been the creation of a Service Level Stabilization Account (SLSA) in the General Fund The SLSA represents non-recurring funds generated by taking reductions in FY2010 2011 and 2012 over and above what was necessary to balance the budget A total of $286M was accumulated in the SLSA for this purpose The SLSA is being used to cover estimated shortfalls in the General Fund in FY2013 and FY2014 The SLSA helps provide flexibility in the budget to avoid making reductions to the point where revenues bottom out and allows us to bridge to a time when the budget has stabilized and begins to improve Because it is a non-recurring funding source it is very important that we carefully monitor the structural balance of the General Fund as the SLSA is spent down Assuming that the balance in the SLSA is drawn down in FY2014 there are several balancing strategies that could be considered to address the ongoing structural gap in revenues and expenditures Expenditure reductions are an option to be considered The efforts to find efficiencies and streamline operations will continue to be pursued Due to reductions over the last five years General Fund costs have been reduced to the point that any further cuts would directly impact the continuation of programs as well as service levels Between FY2007 and FY2011 reductions
Pinellas County Budget Forecast FY2014-2023 E-18
GENERAL FUND
of over $182 million were made in General Fund agencies and budgeted positions decreased by 1618 or 25 An additional $183 million in budget reductions were taken in FY2012 As a result of these and other changes the total FY2013 General Fund budget of $556054060 is comparable to the FY2005 budget of $556059420 Revenue increases are another option The County is currently collecting less than the maximum allowed majority-vote property tax revenue In 2007 the Legislature enacted new limitations on property tax revenue increases for local governments Super-majority votes of the Board are required if proposed property tax revenue exceeds caps based on the average growth in Florida personal income and new construction The caps went into effect beginning in FY2009 using the FY2008 level of property tax revenue as the base As shown in the chart below capacity under the cap has increased as property tax revenues have decreased There is currently a wide spread between the FY2013 millage rate of 50105 and the cap limit of 83285
Another revenue balancing option is the implementation of a storm water strategy that includes a new dedicated funding source If a dedicated funding source was available approximately $31 million of storm water costs currently funded in the Municipal Services Taxing Unit (MSTU) could be freed up to create additional capacity The County does not have a wide range of other revenue options User fees can be increased but need to be considered in the context of the local marketplace and the effect on economic recovery In past budget processes both County employees and the general public identified potential revenue generating ideas In addition to increasing user fees some of these ideas include a local business tax (formerly known as occupational tax) and payments in lieu of taxes or a return on equity from enterprise funds
Pinellas County Budget Forecast FY2014-2023 E-19
GENERAL FUND
Pinellas County Budget Forecast FY2014-2023 E-20
TOURIST DEVELOPMENT COUNCIL FUND
Description The TDC Fund is a special revenue fund that accounts for the 5 tourist development tax (ie bed tax) on rents collected for temporary lodgings Section 1250104 Florida Statutes was enacted by the State in 1977 The Board of County Commissioners enacted an ordinance in 1978 to levy a 2 tax to promote tourism in Pinellas County and was approved at a referendum held on October 5 1978 In 1988 the ordinance was amended to increase the tax by an additional 1 with one-half of this amount earmarked to fund beach re-nourishment projects In January 1996 an additional 1 was levied to provide additional funds for promotional activities beach re-nourishment and to service debt on the Countys obligation to the City of St Petersburgs bonds for Tropicana Field In December 2005 an additional 1 was levied to provide funding for promoting and advertising tourism In November 2010 the Board approved an extension of the 5 tourist development tax to 2021 The forecast continues the 5 tax through FY2023 The fund supports the Tourist Development Council serving as Visit St PeteClearwater through the bed tax The bed tax is used to enhance the Countyrsquos economy by increasing tourism and direct visitor expenditures through marketing and promoting the destination
Summary The Tourist Development Council (TDC) Fund is primarily funded by tourist development taxes that are extremely sensitive to general economic conditions Tourist Development tax revenues have been steadily improving since Spring 2010 and reached record levels in FY2012 FY2013 revenues are estimated to grow 4 beyond actual receipts for FY2012 and are anticipated to continue to increase conservatively at 35 in FY2014 Beyond FY2014 projections continue to increase by 30 annually through the forecast period matching anticipated gradual growth as part of the recovery in the broader US economy The forecast for the Tourist Development Council Fund shows that the fund is balanced through the forecast period Through FY2015 more funds are available for additional advertising based on the assumption that the promotional activities budget will be adjusted to reflect any revenue increases or decreases while maintaining a 15 reserve balance Beginning in FY2016 the fund is forecast to have additional capacity once the debt service on Tropicana Field and the Dunedin Spring Training Facility is paid off in 2015 The additional capacity could be dedicated to new capital outlay as with the Board approved Salvador Dali Museum funding new debt service or to supplement the promotional activities budget In FY2010 the Board revised the Tourist Development Plan to allow funding of capital projects for non-profit museums that are open to the public The Board also approved a review of the Tourist Development Plan every five years
Revenues The TDC Fund consists almost exclusively of one primary funding source tourist development taxes
Pinellas County Budget Forecast FY2014-2023 E-21
TOURIST DEVELOPMENT COUNCIL FUND
Tourist Development Taxes Tourism is a key economic driver of the economy in Pinellas County and contributed direct and indirect visitor expenditures of approximately $73 billion during calendar year 2012 (source Research Data Services Inc) The Tourist Development Tax is projected to generate $299M in FY2013 Tourist Development tax collections are very sensitive to economic conditions due to the close relationship between disposable income and leisure travel The following chart showing a 6-month moving average of collections from October 2007 to October 2012 indicates that collections bottomed out at the beginning of 2010 but have been rapidly increasing again as the economy has begun to rebound Over the past year the rebound in tax revenue has outpaced the overall economy This chart demonstrates how sensitive tourist tax collections are to economic and other conditions and why having reserves to withstand changing conditions is necessary
In addition transient rental occupancy increased at least 2 in each month from January to September of 2012 as compared to the same one-month period in 2011 FY2012 actual revenue totaled $287M which was a 124 increase over FY2011 FY2013 revenues are projected to increase by another 40 and FY2014 by 35 From FY2015 through FY2023 collections are expected to increase 3 annually as the general economic recovery continues While recent trends may suggest a stronger rate of recovery the long-range forecast is conservative due to the sensitivity of this revenue source
Pinellas County Budget Forecast FY2014-2023 E-22
TOURIST DEVELOPMENT COUNCIL FUND
The chart below compares visitor origins tracked by Research Data Services Inc (RDS) with year-to-date figures for November 2011 and November 2012 and it shows a net overall increase of 39 Within this figure the Southeast visitor segment increased 66 and European visitors increased 74 Latin America has been added to the table as a visitor segment to track and it shows strong growth with an increase of 544 between August 2011 and August 2012
Calendar Year-to-Date through Novrsquo11 and Novrsquo12
Visitor Origins 2011 2012 Change
Florida 634689 641863 +11
Southeast 307389 327523 +66
Northeast 1115171 1151945 +33
Midwest 1456771 1481345 +17
Canada 290857 304839 +48
Europe 831904 893188 +74
Other US Markets 130519 131497 +07
Latin America 42800 66100 +544
Total 4810100 4998300 +39
Source November 2012 Visitor Profile Research Data Services Inc Latin American numbers are through August 2011 and 2012
The European visitor segment represents about 18 of total visitors tracked by RDS Although a slight recession is anticipated for the Eurozone the number of European visitors is not anticipated to decrease due to the characteristics of the market segment and increased access to the destination European visitors to Pinellas are a younger wealthier market segment generally insulated from economic cycles In addition the European market will gain increased access from additional air service providing easy access to the destination from cities throughout Europe and Germany For example in May 2012 Edelweiss Air started twice weekly non-stop flights from Tampa to Zurich Switzerland The next chart lists the Annual Average Daily Rate (ADR) that hotels are able to collect and the number of Annual Overnight Visitors since 2000 As a result of hurricanes red tide and the economic downturn ADR stayed flat from 2007 to 2010 and visitor counts declined from a peak of 53M in 2007 Since 2010 ADR and visitor counts have rebounded
Pinellas County Budget Forecast FY2014-2023 E-23
TOURIST DEVELOPMENT COUNCIL FUND
Year
Annual ADR
Annual
Overnight Visitors
2000 $7162 4700140 2001 $7416 4726161 2002 $7316 4714432 2003 $7491 4837998 2004 $7811 5077280 2005 $8432 5212435 2006 $9318 5254255 2007 $10000 5300220 2008 $10438 5193980 2009 $10171 4991410 2010 $10015 5041200 2011 $10483 5235200 2012 $11317 5435000
Source Research Data Services Inc
Expenditures The TDC Fund supports budgeted expenditures and reserves in FY2013 totaling $344M The primary expenditures in the fund are $185M for operations and promotional activities $66M for debt service for three sports facilities $37M for two transfers and $56M in reserves
Pinellas County Budget Forecast FY2014-2023 E-24
TOURIST DEVELOPMENT COUNCIL FUND
Operations and Promotional Activities The discretionary expenditure budget of $185M includes the staff operations and promotional activities that promote the St Petersburg Clearwater destination Promotional activities are primarily comprised of the advertising contract with the balance of the funding supporting such programs as sponsorships publicity and promotion via technology The promotional activities budget was increased in FY2012 due to the higher actual collections as compared to budget Sufficient revenue to support $1M in additional advertising was anticipated and appropriated in the FY13 budget The next chart from the Convention and Visitors Bureau provides allocations in the discretionary operations and promotional budget (without debt payments transfers and reserves)
Convention amp Visitors Bureau Operations amp Promotional Expense
Expenses FY 2013 of Operations
Operating amp Capital Outlay $ 821370 44
Personnel $3211630 173
AdvertisingDirect Sales $13437690 725
Research $ 235000 13
ShippingCommunicationsInquiry $ 370000 20
Travel $ 456200 25
Total $18531890 1000
Source Pinellas County Convention amp Visitors Bureau
Undesignated Over the forecast period there are anticipated available funds above the 15 reserve target that are not currently obligated The ldquoUndesignatedrdquo expenditure line in the forecast identifies the amount projected through FY2023 Capital Outlay In FY2010 the Board revised the Tourist Development Plan to allow funding of capital projects for non-profit museums that are open to the public and the Board approved an agreement that provides payments of $500K annually to the Salvador Dali Museum from FY2015 to FY2019 The Board also approved a review of the Tourist Development Plan every five years Debt Service This fund dedicates the proceeds of the 4th cent of tourist development revenue less Tax Collection expense to the City of St Petersburg to fund debt service on bonds for Tropicana Field (expires 2015) At the City of St Petersburgrsquos request ownership of Tropicana Field was turned over to the County by the City in October 2002 as the County is exempt from paying property taxes on the facility The County leases the property back to the City under terms that provide the City the same rights and responsibilities for the property that it had prior to the transfer of
Pinellas County Budget Forecast FY2014-2023 E-25
TOURIST DEVELOPMENT COUNCIL FUND
ownership This fund also pays fixed debt service in the amount of $588K for the City of Clearwaterrsquos spring training facility (expires 2021) and $298K for the City of Dunedinrsquos spring training facility (expires 2015) Transfers The TDC fund transfers half of the proceeds of the 3rd cent to the Capital Projects Fund for beach nourishment projects to support tourism and maintain property values The transfer is budgeted at $32M for FY2013 which is $05M more than the anticipated collections for this half-cent The additional amount accounts for dedicated revenue received in excess of the previous yearrsquos budget for the transfer This fund transfers $494K to the Tax Collector in FY2013 for administration and collection of the tourist development taxes This cost is approximately 17 of collections and is projected to increase by 3 per year through the forecast period Reserves On a budget basis the reserve level in this fund is currently at 16 which is slightly above the reserve level requested by the Tourist Development Council The fund reserve will serve as a fiscal shock absorber in the event tourist development tax revenues deteriorate in response to changes in economic conditions For example tourist development revenues declined dramatically in FY2002 after the September 11th terrorist attack in FY2005 as a result of multiple hurricane landfalls in Florida in FY2009 as a result of the financial crisis and most recently in FY2010 as a result of the British Petroleum (BP) oil spill In order to maintain liquidity in this fund adequate reserves need to be maintained at a minimum level of 10 This fund has several large expenditures such as debt service that come early in the fiscal year while some occur later in the fiscal year Monthly revenues usually peak during the Spring Break and Easter timeframe Since such seasonality occurs for both revenues and expenditures and the fluctuations do not occur together working capital needs are met by using reserves until the revenues are collected
Ten-Year Forecast Key Assumptions The revenue forecast for tourist development taxes reflects increasing growth in the economy with an increase of 35 in FY2014 and an annual increase of 30 through FY2023 On the expenditure side personal services are projected to increase 4 per year Promotional activities (advertising) estimates have been increased to match the increase in revenue through FY2015 Beginning in FY2016 a substantial amount of debt service will be paid off The forecast does not assume that the additional capacity will be re-authorized to service new debt or allocated to supplement the promotional activities budget It does include the additional capital outlay of $500K approved for the Dali Museum beginning in FY2015 and ending in FY2019
Pinellas County Budget Forecast FY2014-2023 E-26
TOURIST DEVELOPMENT COUNCIL FUND
Note This chart reflects forecasted expenditures without the ldquoUndesignatedrdquo amount
Key Results The forecast for this fund from FY2013 to FY2015 shows that revenues and expenditures are in-line while the fund maintains at least a 15 reserve Beginning in FY2016 revenues exceed expenditures by a wide margin as the debt service for Tropicana Field and the Dunedin Spring Training Facility is paid off Even with the Board approved capital outlay to support the Dali Museum for $25M from FY2015 through FY2019 revenues will continue to exceed expenditures The decision point in FY2016 will be whether to continue to use this portion of the proceeds from the 4th cent of tourist development for debt service on sports facilities or use it for other approved tourism development purposes such as promoting and advertising the St PetersburgClearwater destination
Potential Risks There are many impacts that can alter the ten-year forecast of tourist development tax collections The primary concern is the strength of the national economy due to the sensitivity of collections to economic conditions If the economy improves collections could be higher than anticipated as disposable income increases The reverse would be true if the economy deteriorates Increases in fuel costs are also a factor for visitors driving to Pinellas County In the past an increase in hurricane activity has had a negative effect on tourism as have red tide outbreaks in Tampa Bay The appreciation or depreciation of the US dollar also has an impact on the number of international visitors to Pinellas County
Pinellas County Budget Forecast FY2014-2023 E-27
TOURIST DEVELOPMENT COUNCIL FUND
The possibility of offshore drilling in Floridarsquos Gulf Coast could discourage tourism due to the potential negative ecological effects of that industry
Balancing Strategies The forecast does not show any structural gaps in revenues and expenditures as the fund is balanced through the forecast period The assumption is that the promotional activities budget is increased or decreased to match the tourist development tax revenue stream The additional capacity forecast beginning in FY2016 may be applied to newly approved debt service or to other authorized tourism promotion and development activities
Pinellas County Budget Forecast FY2014-2023 E-28
TRANSPORTATION TRUST FUND
Description
The County Transportation Trust Fund is a special revenue fund required by Florida Statute 336022 to account for revenues and expenditures used for the operation and maintenance of transportation facilities and associated drainage infrastructure Activities include road and right-of-way maintenance (eg patching mowing) bridge maintenance and operation traffic engineering traffic signal operation including Intelligent Transportation Systems traffic control signage and striping sidewalk repair and construction and maintenance of ditches culverts and other drainage facilities Resources to support these activities are provided from gas taxes collected and distributed on a shared basis to all Florida Counties by the State of Florida and local option gas taxes levied by the County There are two local option taxes that have been imposed by the Board of County Commissioners The most recent was a one cent levy (referred to by statute as the ldquoNinth Centrdquo) beginning January 2007 dedicated to the installation operation and maintenance of advanced technological traffic signal and messaging systems (Intelligent Transportation Systems) The other local levy is a six cents per gallon tax that is shared by interlocal agreement between the County and all municipalities within Pinellas County The Countyrsquos share of collections is 60 of total receipts and the municipalities each receive portions of the remaining 40 The interlocal agreement will expire in 2017
Summary
The Transportation Trust Fund is primarily funded by state and local fuel taxes and has been impacted by a downturn in collections due to the recessions effect on the number of miles driven and gallons of fuel sold Because of the built out nature of Pinellas County more efficient cars and fuel conservation efforts as well as State law that does not allow indexing fuel taxes for inflation future revenue is projected to continue its slow decline and not keep pace with inflationary increases for expenditures in this fund The forecast for the Transportation Trust Fund indicates that the fund is not in balance beginning in FY2013 resulting in a depletion of fund balance by FY2018 This imbalance primarily results from inflationary pressures on expenditures coupled with the projected reduction in gas tax collections that are based upon the volume of fuel By FY2017 action will need to be taken to manage this future gap such as potential revenue transfers from the General Fund imposition of additional local option gas taxes or reductions in current service levels
Revenues The Transportation Trust Fund consists mainly of three primary funding sources State shared gas taxes ($92 million) a six cent per gallon local option gas tax ($126 million) and a one cent per gallon gas tax (the ldquoNinth Centrdquo) earmarked for the Advanced Traffic Management System Intelligent Transportation System ($37 million) The remaining revenues of the fund include interest and other miscellaneous revenues such as reimbursements from other governments for the Countyrsquos work on municipal and state traffic signal systems
Pinellas County Budget Forecast FY2014-2023 E-29
TRANSPORTATION TRUST FUND
State Shared Gas Taxes This resource is the equivalent of three cents per gallon on motor fuel collected statewide then redistributed to Florida Counties by a formula related to population geographic area and local collections The amount of revenue is driven by the gallons of fuel used and is therefore sensitive to economic activity such as commuting and tourism trips or increases in the price of oil that might reduce demand for gasoline usage The move toward more fuel efficient cars also has an effect in offsetting any population growth that might result in more vehicle trips As a result state shared gas taxes as well as the other gas taxes are anticipated to continue to slowly decline over the forecast period Six Cent Local Option Gas Tax (LOGT) This resource is a six cent per gallon tax on all motor fuel sold within the County including diesel The proceeds are shared with the municipalities through an interlocal agreement stipulating that the County retains 60 of monthly collections and municipalities sharing the remaining 40 Ninth Cent Gas Tax This resource is a one cent per gallon tax on all motor fuel sold within the County including diesel Unlike the Six Cent Local Option Gas Tax the proceeds are not shared with the municipalities This gas tax funds the creation and maintenance of the Advanced Traffic Management SystemIntelligent Transportation System in the county Transfers A transfer of $15 million per year from the General Fund to the Transportation Trust Fund is budgeted beginning in FY2013 to support ongoing operating costs that were reassigned to this fund based on an analysis of the allocation of Department of Environment and Infrastructure expenditures
Expenditures The Transportation Trust Fund supports expenditures totaling approximately $304 million Transportation Programs These expenditures include staff and operating expenses to maintain and operate the Countyrsquos traffic controls bridges roads and associated drainage systems Key program expenditure areas include mowing County right-of-way and ditch maintenance activities ($67 million) traffic signal and traffic control activities ($74 million) and bridge and concrete structures maintenance ($58 million) Intelligent Transportation Systems As a part of improving traffic signal and traffic control activities the County is actively pursuing technological improvements to improve the flow of traffic in Pinellas County This activity is tied to the Ninth Cent gas tax resource and is being focused on high priority traffic corridors in order to size the program to available resources The current operating expenses for this program are approximately $12 million The balance of the available funds are transferred to the Capital Projects Fund
Pinellas County Budget Forecast FY2014-2023 E-30
TRANSPORTATION TRUST FUND
Capital Improvement Project Impacts Some capital improvement projects have the potential to require increased operating expenditures when completed Beginning in FY2014 the forecast includes estimated operating expenditures to support completed capital improvement projects Transfers Since the inception of the Ninth Cent gas tax a transfer takes place annually from the Transportation Trust Fund to the Capital Projects Fund This transfer pays for the installation of capital structures needed to implement the Intelligent Transportation System such as traffic signal controllers fiber optics cameras and message boards Depending upon available revenues after deductions for operating expenses an average of approximately $25 million is transferred annually to the Capital Projects Fund to match state and federal grants available to implement the system on major County and State road corridors Reserves The budgeted FY2013 reserve level of $122 million in the Transportation Trust Fund is approximately 29 which is higher than the 5-15 reserve level budget policy adopted by the Board This is the result of savings gained through recent budgetary reductions and efficiency initiatives The reserve also includes the fund balance previously carried in the Local Option Gas Tax fund which was merged into the Transportation Trust Fund in accordance with new accounting standards (GASB Statement 54) for FY2012 This reserve level is gradually being reduced as expenditures exceed revenues
Ten-Year Forecast Key Assumptions As discussed the main revenue sources for this fund are state shared gas taxes and local option gas taxes The ten-year forecast assumes that the current six cent local option gas tax levy will be extended beyond its current expiration year of 2017 The ldquoNinth Centrdquo levy is in effect until year 2026 Revenue growth assumptions have been based on the States Revenue Estimating Conferences forecast of gallons of motor fuel pumped annually in Florida The Statersquos annual average growth rate is 19 These taxes are based on gallons pumped and not fuel prices Pinellas Countyrsquos built-out condition and the likelihood of future mandated vehicle fuel efficiency standards leads to this forecast assuming a continuing gradual decline in gas tax revenues Based on the historical and future reduction patterns current gas tax revenues are not predicted to keep up with projected inflationary expenditure demand on transportation operation and expenditure needs
Pinellas County Budget Forecast FY2014-2023 E-31
TRANSPORTATION TRUST FUND
Key Results Beginning in FY2013 Transportation Trust Fund expenditures exceed revenues throughout the forecast period which causes a gradual erosion of fund balance until the fund assumes a negative cash position in FY2018 By FY2017 potential revenue and expenditure options will need to be implemented to keep the fund in balance
Potential Risks Impacts on this forecast include macro-economic conditions such as increases or decreases in the price of oil that could affect demand for motor fuel Changes in the price of commodities such as concrete and asphalt could also affect the expenditure side of this forecast as the Transportation Trust Fund activities utilize large amounts of physical commodities An unanticipated increase in fuel conservation efforts an increase in electric vehicles or mass transit efforts could also affect the outer years of this forecast In addition a decision to not extend the current six cent local option gas tax levy would have a major impact (more than $12 million) on this analysis
Pinellas County Budget Forecast FY2014-2023 E-32
TRANSPORTATION TRUST FUND
Balancing Strategies Major strategies to manage the forecasted gap in revenues versus expenditures include a continuation of actions to reduce future costs on the expenditure side transfer of General Fund revenue to support transportation activities or the imposition of additional local option gas taxes From an enhanced revenue standpoint the County has authority to impose an additional five cents tax per gallon of fuel sold within the County however by statute proceeds realized would have to be shared with municipalities Diesel fuel is not subject to this tax The Countyrsquos estimated share of one cent of this local option gas tax is now approximately $19 million which is 60 of the $32 million in proceeds which would be generated countywide
1 cent 2 cents 3 cents 4 cents 5 cents $19M $38M $57M $76M $95M
For comparison purposes other Florida Counties that impose greater local option taxes than Pinellas Countyrsquos seven cents are shown in the following table
Counties Imposing Local Option Taxes Greater
than Seven Cents
Cents Imposed
Alachua 12 Broward 12 Charlotte 12 Citrus 12 Collier 12 DeSoto 12 Hardee 12 Hendry 9 Hernando 9 Highlands 12 Lee 12 Manatee 12 Marion 12 Martin 12 Miami-Dade 10 Monroe 10 Okeechobee 12 Palm Beach 12 Polk 12 Putnam 12 St Lucie 12 Sarasota 12 Suwanee 12 Volusia 12
Source 2012 Local Government Financial
Information Handbook - October 2012
Of Floridarsquos 67 counties
24 levy more than 7 cents 27 including Pinellas Pasco and Hillsborough levy 7 cents 16 levy less than 7 cents
Pinellas County Budget Forecast FY2014-2023 E-33
TRANSPORTATION TRUST FUND
An additional one to five cents is not likely to have a measurable impact on the sale of fuel as normal price differences and fluctuations routinely exceed this amount For this reason there would be little incentive for consumers to redirect their fuel purchases to Hillsborough or Pasco counties if they maintain their current seven cent fuel tax rates The additional five cents may be used for the construction of new roads the reconstruction or resurfacing of existing paved roads the paving of existing graded roads or other expenditures that are needed to meet immediate local transportation problems or are critical for building comprehensive roadway networks Routine maintenance of roads is not considered an authorized expenditure The additional one to five cents could be levied by a majority plus one vote of the Board or by approval in a countywide referendum Another balancing option is the implementation of a storm water strategy that includes a new dedicated funding source If a dedicated funding source was available storm water costs currently funded in the Transportation Trust Fund could be freed up to create additional capacity
Pinellas County Budget Forecast FY2014-2023 E-34
CAPITAL PROJECTS FUND
Description The Capital Projects Fund is used to account for all the governmental capital projects throughout the County Such projects include roads bridges drainage beach nourishment park development and construction of facilities necessary to provide County services
Summary The Capital Projects Fund is used to account for all governmental capital projects throughout the County This fundrsquos primary revenue source is the ldquoPenny for Pinellasrdquo one cent local option sales tax that is very sensitive to general economic conditions Penny tax revenues declined for several years instead of increasing at the original projected rate due to the recession but are predicted to increase gradually during the forecast period matching general economic growth as part of the recovery in the local state and national economy The forecast for the Capital Projects Fund shows that the fund is balanced over the forecast period During several years of the forecast expenditures exceed revenues due to project schedules Additional cash flow necessary in the first half of the ten-year period is being addressed through an interfund loan from the Solid Waste Replacement amp Renewal Fund The forecast includes repayment of the loan from FY2013 to FY2020
Revenues The major revenue components of the Capital Projects Fund are the Penny for Pinellas Grants and Transfers from Other Funds
Local Option Sales Tax (Penny for Pinellas) Penny for Pinellas revenues are proceeds of an additional one cent Local Government Infrastructure Surtax on Sales pursuant to Section 212055(2) Florida Statutes imposed in Pinellas County The authorized use of these funds is generally restricted to infrastructure projects only and cannot be used for ongoing operation and maintenance costs The Penny became effective February 1 1990 for an initial period of ten years and has been extended by referendums in 1997 and 2007 for two additional ten year periods (until 2020) In accordance with statutory requirements and interlocal agreements with each municipality in Pinellas County the County receives approximately 523 of the total monthly collections generated by this tax following the deduction of a dedicated amount for countywide use in improving Court and Jail facilities The Penny for Pinellas is the primary source of revenue supporting the Countys Capital Improvement Program Sales tax as a revenue source is highly elastic and is very sensitive to local and national economic conditions such as inflation wage growth unemployment and tourism Normally sales taxes increase with economic activity and inflation but reflecting the depth of the recent recession collections declined about 15 from FY2007 to FY2009
Pinellas County Budget Forecast FY2014-2023 E-35
CAPITAL PROJECTS FUND
Collections increased in FY2010 and FY2011 due to the transition to the new revenue distribution formula that began in February 2010 and results in a higher percentage of collections going to the County primarily due to the increase in the Courts amp Jail amount from $80M to $225M over the ten year period The revenue increase to the County is misleading as the underlying Penny revenues actually decreased in FY2010 and FY2011 In FY2013 and FY2014 the Penny is anticipated to increase 35 which is consistent with the general improvement in the economy The chart below shows the fluctuation in annual growth rates experienced since FY2000
Grants The second largest sources of revenue in the Capital Projects fund are grants The FY2013 budget includes $327M in local state and federal grants from agencies like the Southwest Florida Water Management District and the Florida Department of Transportation Grant revenues are highly variable over the forecast period The forecast only includes grants that either have been awarded or are highly anticipated to be awarded
Transfers from Other Funds The Capital Projects Fund also receives several transfers from other funds to cover or contribute to costs for specific capital projects
Pinellas County Budget Forecast FY2014-2023 E-36
CAPITAL PROJECTS FUND
The FY2013 and FY2014 Budgets include a transfer of $175M and $450M respectively from the Solid Waste Renewal and Replacement Fund as part of the interfund loan to the Capital Projects Fund On September 21 2010 the Board approved a resolution authorizing an interfund loan amount of up to $85 million in lieu of a $150M bond issue originally planned to finance key projects in the 2010 to 2020 Capital Project Fund The outstanding principal in FY2013 will be $325 million (including the FY2013 loan amount of $175 million) The annual rate of interest is a variable rate which is currently less than 1 Payments on outstanding loan principal are required to begin no later than FY2016 and the loan shall be paid in full no later than December 31 2019 The benefits of an interfund loan versus bonding include lower borrowing costs no reserve requirements interest accrues to a county entity and more flexibility in the implementation and terms of the loan The loan is being tracked separately for the Centralized Chiller Facility project vs the cash flow needed for capital projects in total The loan amount for capital projects consists of $15 million in FY2010 $100 million in FY2013 and $45 million in FY2014 The principal payments for the $70 million loan for capital projects is budgeted for FY2015 ndash FY2020 The loan amount for the Centralized Chiller Facility project is $75 million in the FY2013 budget The principal payments for the Centralized Chiller project is budgeted for FY2013-FY2017 This project funds the construction of a new centralized chiller facility for the downtown Clearwater campus The County will purchase chilled water at a set rate based on the amount of investment towards the cost of the facility Fully funding this project is estimated to result in $507K of annual savings $38M of cost avoidance and potential revenue opportunities of $300-400K a year The total project cost is estimated at $120M of which $15M of design costs are being paid for by a federal grant from the Department of Energy and $30M was allocated from non-recurring funding in the General Fund in the FY2011 Budget The General Fund transfer in FY2013 for $18 million covers the cost of two items The first item is $300K of recurring capital costs paid for by recurring revenue from the implementation of the new parking fees at Fort De Soto Park and Howard Park Beach amp Causeway These funds will be used annually to maintain and improve the bathhouses at the two parks The second item is $15 million for the principal payment on the Centralized Chiller Facility project The FY2013 transfer of $22M from the Transportation Trust Fund (proceeds of the 9th cent Local Option Gas Tax) contributes to the cost of several Intelligent Transportation System Advanced Transportation Management System projects The FY2013 transfer of $32M from the Tourist Development Council Fund (half of the proceeds of the 3rd cent) funds beach nourishment projects in the Coastal Management area The Transportation Impact Fee Fund is used to account for Transportation Impact Fees collected throughout the County thus assuring that new development bears a proportionate share of the cost of capital expenditures necessary to meet transportation needs of the County The transfer of $16M from the Transportation Impact Fee Fund in FY2013 is to cover or
Pinellas County Budget Forecast FY2014-2023 E-37
CAPITAL PROJECTS FUND
contribute to the current or past costs of authorized transportation projects in the twelve geographic transportation impact fee districts of the county
Expenditures Expenditures in the Capital Projects Fund consist of capital project expenditures and debt service costs Capital Projects The majority of expenditures in the Capital Projects fund are for infrastructure projects in the areas of transportation storm water drainage and water quality parks environmental preservation courts jails public safety and other public facilities Planned expenditures in this fund over the forecast period cover the project allocations from the 2010 to 2020 Penny Program Please see the ldquoCapital Improvement Programrdquo section of the FY2013 Budget Message for expenditure highlights of the One-Year CIP and the Ten-Year CIP Debt Service Debt service costs over the forecast period are associated with the interfund loan from the Solid Waste Renewal and Replacement Fund The loan consists of $70M to help necessary liquidity in the Capital Projects Fund related to the acceleration of projects in the first half of the 2010-2020 Penny Program and $75M for the balance of the remaining cost for the Centralized Chiller Facility This project has already been funded $15M by a Department of Energy grant and $30 by non-recurring funds in the General Fund
Ten-Year Forecast Key Assumptions The revenue assumptions for the overall Penny sales tax are consistent with the Half-Cent sales tax in the General Fund at 40 growth from FY2014 to FY2020 However the growth rate in the Capital Projects Fund for the Penny sales tax is less at 35 growth in FY2014 and 30 growth from FY2015 to FY2020 This is because the Courts amp Jail allocation is a fixed amount that does not grow over time resulting in a slightly smaller growth rate for the Countyrsquos overall share of the Penny The expenditure assumptions for the Capital Projects Fund assume consistency with the 2010 to 2020 Penny Program allocations
Pinellas County Budget Forecast FY2014-2023 E-38
CAPITAL PROJECTS FUND
Key Results The forecast for the Capital Projects Fund shows that the fund is balanced over the forecast period During several years of the forecast expenditures exceed revenues due to project schedules Additional cash flow necessary in the first half of the ten-year period is being addressed through an interfund loan from the Solid Waste Renewal amp Replacement Fund A primary driver of cash flow is $81M of expenditures associated with the Public Safety Complex project that started in FY2012 The forecast includes repayment of the loan from FY2013 to FY2020
Potential Risks There are many impacts that can alter the ten-year forecast of the Penny tax collections The primary concern is the strength of the local economy due to the sensitivity of collections to economic conditions If the economy improves collections could be higher than anticipated as consumer activity increases The reverse would be true if the economy deteriorates There are risks of increases in major commodities used in capital project construction such as steel or concrete such as those the County experienced in 2005-2007 where prices escalated as much as 60-80 for these key materials
Pinellas County Budget Forecast FY2014-2023 E-39
CAPITAL PROJECTS FUND
Balancing Strategies The forecast for the Capital Projects Fund shows that the fund is balanced over the forecast period The assumption is that expenditures will be decreased or increased to match the Penny for Pinellas and other revenue streams that support the CIP
Pinellas County Budget Forecast FY2014-2023 E-40
EMERGENCY MEDICAL SERVICE FUND
Description The EMS Fund is a special revenue fund established by referendum in 1980 which allows up to 15 mills to be levied annually on a county-wide basis to finance the operation of a comprehensive county-wide emergency medical service system This system provides advanced life support emergency medical response and transport services to all citizens of Pinellas County The County maintains EMS contracts with 18 fire service agencies (first responders) and one ambulance provider (Paramedics Plus operating in Pinellas County under the trade name ldquoSunstarrdquo) The EMS System is funded by a combination of property taxes and ambulance user fees The ambulance user fees support the ambulance contractual expenditures and property taxes are intended to support the first responder expenditures The EMS System was established by referendum in 1980 by the Special Act (Chapter 80-585 Laws of Florida) that created the EMS Authority as a Dependent Special District In 1988 Pinellas County Ordinance 88-12 solidified the current EMS system design The Fiscal Policy guidelines within Ordinance 88-12 state that the Board of County Commissioners sitting as the Emergency Medical Services Authority directs the following fiscal policy guidelines that governs the financial operations of the Countyrsquos EMS system (a) to establish sound business controls and long term cost containment incentives throughout the County EMS system (b) to provide adequate funding to upgrade all EMS components to state-of-the-art-levels and to maintain that progress in future years (c) to provide for long term financial stability sufficient to sustain quality EMS operations far into the future (d) to reduce the County EMS systemrsquos excessive dependence upon local tax support by developing a more balanced approach to EMS funding and (e) to provide the Board of County Commissioners with a wider range of EMS financing options than have been available in the past
Summary The Emergency Medical Service (EMS) Fund is sensitive to property values as it is funded by ad valorem (property) tax revenue collected from property owners countywide and ambulance user fee revenues Property tax revenues have declined dramatically in recent years due to a downturn in property values and statewide legislation The forecast for the EMS Fund indicates the fund is not balanced over the forecast period On the revenue side the FY2013 Adopted Budget included an increase of 00652 or 77 in the countywide EMS millage rate from 08506 to 09158 With this increase the EMS budget maintains the status quo with respect to level of service and the delivery system The millage increase is not enough over the forecast period to fund the system and maintain the fundrsquos reserve at 25 pursuant to Board policy adopted by ordinance The forecast estimates the reserve at 252 in the FY2013 ending fund balance The estimated percentage decreases to 203 at the end of FY2014 and 130 by the end of FY2015 if the tax rate is not increased again or expenditures are not significantly reduced Though this level is improved from the last forecast expenditures in the EMS Fund are still projected to exceed revenues by an increasing amount each year from FY2013 through FY2023 In FY2016 the projected reserve drops below 4 This leaves approximately $4M in the fund balance for the projected $12M deficit in FY2017
Pinellas County Budget Forecast FY2014-2023 E-41
EMERGENCY MEDICAL SERVICE FUND
Future expenditure savings will be addressed with the results of an operational study and accounting study that are underway to analyze variations of EMS service under consideration for Pinellas County In late 2011 the Pinellas County Legislative delegation created an EMS Fire Transport Special Committee to select a nationally recognized firm that would operationalize analyze and compare costs for three variations of EMS service 1) the current EMS system 2) the system as proposed in the Integral Performance Solutions Study and 3) the Sanford-Millican proposal for fire based transport The current ambulance service contract is in effect through FY2014 with a one year extension option First responder contracts are currently funded based on actual first responder costs as defined in Board Resolution 09-38 It is expected that a combination of revenue increases and expenditure savings will be needed to make up for deficits in prior years and increase reserves to a sustainable level throughout the forecast period
Revenues The primary funding sources for the EMS Fund are ambulance user fees and property taxes Ambulance User Fees The ambulance service user fees provide funding for the ambulance program which includes the ambulance provider (Paramedics Plus) contractual expenditures ambulance billing costs and ambulance program support costs Ambulance user fees are based on transport volume and transport charges An average retail rate charge is $620 per transport The County bills Medicare Medicaid private insurance and various other payors for transport service Billing for the service is done by Pinellas County The collection rate is currently about 70 (net of MedicareMedicaid non-allowable charges) of billing for the transport service The County handles transports for non-emergencies and mental health transports as well The County utilizes the 9-1-1 System to dispatch calls for the proper response to the call Ambulance user fee revenue is projected to reach $446M in FY2013 and then increase by 2 annually over the forecast period The Board of County Commissioners has the authority to increase ambulance user fees as necessary In addition Board Resolution 89-208 calls for an automatic increase in user fee rates by the percentage increase in the medical consumer price index for the previous year until the prudent reserve level is reached (25) The retail rate increased 33 in FY2012
The County also offers an ambulance user fee membership program that citizens can join to minimize the cost of EMS transports Membership revenue is projected to generate $200K per year through the forecast period
Property Taxes Property taxes are used to fund the first responder program Property tax revenues have decreased significantly since FY2008 due to legislative rollbacks the passage of Amendment One the decline in the real estate market and the recession
Pinellas County Budget Forecast FY2014-2023 E-42
EMERGENCY MEDICAL SERVICE FUND
The EMS millage rate is a county-wide millage rate that remained flat at 05832 from FY2008 through FY2011 During this period ad valorem revenue decreased each year from $426M in FY2008 to $306M in FY2011 The Board of County Commissioners has the authority to increase or decrease the millage rate and in FY2012 the millage rate was increased to 08506 This resulted in Ad Valorem revenues recovering to $422M and finishing FY2012 with a net gain in revenues over expenditures For FY2013 a millage rate of 09158 was approved in order to balance the budget and approach a beginning balancereserve of 25 (level set by County Ordinance approved by the Board on December 20 2011) The millage cap for this revenue is 15000 mills and the rollback rate for FY13 was 08698 With the millage increase tax revenue increased $21M from actual FY2012 to estimated FY2013 but the EMS Fund is still projected to use $09M from the fund balance Without another millage increase or significant expenditure reductions in the next two years the fund balance continues to decrease each year until it is depleted in FY2017
Emergency Medical Service Fund
Ad Valorem Revenue amp Millage History
Fiscal Year Millage Budget $ (000s)
2013 09158 $ 438
2012 08506 $ 416
2011 05832 $ 300
2010 05832 $ 336
2009 05832 $ 383
Note Budget figures are at 95 of revenue
Expenditures The Emergency Medical Service Fund supports budgeted expenditures in FY2013 totaling $906M for its operations The primary expenditures in the fund are $382M for payments to the ambulance contractor $402M for contractual payments to the eighteen first responders $13M for transfers to the Property Appraiser and Tax Collector $107M in program support and billing of ambulance claims and $200K in the Trust Fund Grant The reserve is estimated at $219M for FY2013 which is $5M above the budgeted level due to a combination of FY2012 actual revenues being $3M higher and actual expenditures being $2M lower than budget The reserve is still projected to decline as expenditures exceed revenues through the forecast period Ambulance Contractor Payments The County contracts with Paramedics Plus for the Countyrsquos SUNSTAR ambulance system Contracts with the Countyrsquos ambulance provider were renegotiated in FY2012 with an annual reduction to base service payments of $2 Million A 6 increase is included in the forecast from FY2014 through FY2023 to account for annual CPI increases and increases to transport volume However once the contract is up for negotiation expenditures may change as the economy rebounds and fuel and labor costs and other factors change
Pinellas County Budget Forecast FY2014-2023 E-43
EMERGENCY MEDICAL SERVICE FUND
First Responder Contractual Payments The County contracts with the eighteen first responder EMS providers that respond to calls using paramedics and that utilize Advanced Life Support (ALS) or Basic Life Support (BLS) equipment and personnel During FY2013 budgets submitted by the 18 agencies included an overall increase of 5 This 5 annual growth rate continues through the forecast period to FY2023 In FY2013 the first responder agreements also include an agreement of $356K to Eckerd College for basic life support water rescue EMS Program Support Costs The County incurs program support costs (Personal Services and Operating Expenditures) to support the EMS program These costs are allocated between the ambulance function and the first responder function Costs allocated to both functions include the Office of the Medical Director St Pete College training expenses communication and EKG equipment and maintenance and personnel and operating expenses to administer all contracts within the program The FY2013 Ambulance program support expenditures of $63M pay for those support items listed above and the ambulance billing function that includes a staff of 34 The FY2013 First Responder program support expenditures of $44M include those allocated support items listed above Transfers The Emergency Medical Service fund has transfers to the Property Appraiser and Tax Collector to cover the costs for collection of ad valorem revenues FY2013 costs for this function are $13M The commissions for the Property Appraiser and Tax Collector are pursuant to Florida Statutes Reserves Pinellas County Ordinance 88-12 which was amended with Resolution 89-208 authorizes the establishment of a prudent reserve equal to one-third of the annual budget for this fund On December 20 2011 the Board approved changing the prudent reserve amount to 25 Reasons for such a high reserve level include disasters such as a hurricane where a large amount of equipmentvehicles may need to be replaced quickly to sustain EMS service and enough working capital for a potential transition if contract requirements are not met by the service provider In addition this reserve level will provide cash flow needs in the event of interruptions to ambulance collections due to a disaster or a Medicare andor Medicaid audit With high monthly contractor payments it is critical cash flow needs are met With FY2012 actual revenue coming in $3M higher than budget and actual expenditures at $2M less than budget the year ended with the reserve at 28 On a forecast basis with Ad Valorem revenue at 96 and Ambulance revenues at 100 the estimated reserve level is projected at 252 for the end of FY2013 Without additional increases in the millage rate or substantial decreases in expenditures the reserves are forecasted to decline to 185 in FY2014 and 105 in FY2015
Pinellas County Budget Forecast FY2014-2023 E-44
EMERGENCY MEDICAL SERVICE FUND
The net increase in the FY2012 ending balance pushes the projected depletion of remaining reserves out to FY2017
Ten-Year Forecast Key Assumptions The EMS countywide millage is assumed to remain at the FY2013 approved rate of 09158 mills through the forecast period Taxable values should begin to recover as the economy improves and the housing market rebounds Ad Valorem tax revenue is projected to grow 25 in FY2014 and FY2015 followed by a 3 annual growth factor from FY2016 to FY2023 During the forecast period ambulance revenue user fees are estimated to increase by 20 which aligns with projected increases to transport volume First responder contractual expenditures increased 5 from FY2012 to FY2013 and are estimated to increase at 5 per year through the forecast period Contractual payments to the ambulance contractor are assumed to increase by 6 through the forecast period as contracted expenditures will increase due to increased transport volume and increases in the CPI as stipulated in the contract The County will work with the provider to negotiate the lowest possible contract while still maintaining quality service
Pinellas County Budget Forecast FY2014-2023 E-45
EMERGENCY MEDICAL SERVICE FUND
Key Results In the chart for the total EMS Fund above the forecast shows expenditures exceeding revenues over the forecast period Balance for FY2013 is achieved through the FY2013 millage rate increase and use of reserves Without another millage rate increase andor expenditure savings reserves will be exhausted after FY2016 This assumes no changes to the EMS system design
Potential Risks A major variable impacting future revenues for this fund is ad valorem revenue and taxable values As taxable values begin to rebound the opportunity for higher revenues may increase If market values grow more slowly or decline revenue would be negatively affected Another factor in future revenues will be ambulance user fee revenues The ambulance contract will be up for re-negotiation in FY2014 with potential impacts to expenditures Tourism and inflow into the local area of more visitors and residents will impact the number of users of the EMS system Continued aging of the general population (baby boomers) could result in more transport volume in the ambulance area Results from the operational study may impact future revenues and expenditures for the EMS system particularly if significant changes are made to the system design
Balancing Strategies The forecast shows that the fund is not in balance over the forecast period Future balancing strategies will be developed from information gathered in the EMS system operational study
Pinellas County Budget Forecast FY2014-2023 E-46
FIRE DISTRICTS FUND
Description In 1973 a Special Act of the Florida Legislature (Chapter 73-600 Laws of Florida) created the Pinellas County Fire Protection Authority This special legislation subsequently assumed ordinance status as Article II Chapter 62 of the Pinellas County Code The Board of County Commissioners is designated as the Fire Protection Authority with responsibility to ldquoestablish and implement a permanent plan of fire protection for Pinellas County and each of its municipalitiesrdquo and levy ad valorem taxes to fund fire protection services within these districts At present the Fire Districts Fund consists of twelve separate municipal services taxing units (MSTUs) that provide fire protection services in the unincorporated areas of Belleair Bluffs Largo Clearwater Dunedin Gandy Largo Pinellas Park Safety Harbor Tarpon Springs Seminole High Point Tierra Verde and South Pasadena These districts were formed at differing times after the electors in the affected unincorporated areas approved their creation and the levy of ad valorem taxes to fund fire protection Those Fire Districts that were created under Chapter 73-600 Laws of Florida receive compensation based on the pro rata share of the fire departmentrsquos budget in each fire district The pro rata share is allocated based on the value of real property for the unincorporated area in that district
Summary The Fire Districts Fund provides fire protection service to the unincorporated areas of Pinellas County through twelve separate dependent fire protection districts that are funded entirely by ad valorem taxes collected from property owners within these districts This fund forecast is presented in a high-level consolidated manner Budgetarily each Fire District is balanced separately Property taxes have declined dramatically in recent years due to a downturn in property values and statewide legislation As the housing market is recovering property tax revenues are forecast to increase 20 in FY2014 and FY2015 A 25 growth factor continues through the forecast period The forecast for the Fire District Fund indicates that the fund is not balanced through the forecast period Millage rates increased for five of the twelve fire districts in FY2013 The millage rate for the South Pasadena Fire District decreased substantially with a change in contracted service provider Additional increases to millages for the individual fire districts will likely be necessary to cover expenditures over the forecast period Potential millage rate increases will need to take into account the individual millage caps in each fire district
Revenues The Fire Districts Fund consists of primarily one funding source property taxes (ad valorem revenue)
Pinellas County Budget Forecast FY2014-2023 E-47
FIRE DISTRICTS FUND
Property Taxes Property tax revenues have decreased significantly over the last several years due to legislative rollbacks the passage of Amendment One the decline in the real estate market and the recession These revenues are affected by taxable values for properties in the local economy Overall property taxes are budgeted to generate $148M in FY2013 across all districts Each dependent fire district has a separate ad valorem millage rate that is the sole revenue source for each of the fire districts The next chart illustrates five of the fire districts that required an increase in millage rates in FY2013 to fund fire service provider expenditures The five districts were Clearwater Dunedin Largo Safety Harbor and Tierra Verde The millage rate for the South Pasadena Fire District was reduced from 31257 to 09137 in FY2013 as significantly less revenue was needed to fund a new service contract with the City of St Petersburg In FY2012 Public Safety Services requested provider bids for fire service to the district The lowest bid was from St Petersburg at $75000 for an annual contract over five years beginning in FY2013 This was $175000 less than the bid from the City of South Pasadena which had the annual service contract prior to FY2013
Dependent MSTU Fire Protection Districts
Ad Valorem Millage Rates amp Millage Rate Caps
Millage Rate Caps
FY13 Adopted Millage
FY12 Adopted Millage
Variance FY13FY12 Millages
Belleair BluffsLargo 50000 17320 17320 00000
Clearwater 50000 32092 26591 05501
Dunedin 50000 35525 22576 12949
Gandy 50000 22602 22602 00000
Largo 50000 35609 35133 00476
Pinellas Park 50000 23675 23675 00000
Safety Harbor 50000 27631 26800 00831
Tarpon Springs 50000 23745 23745 00000
Seminole 100000 19581 19581 00000
High Point 100000 41916 41916 00000
Tierra Verde 30000 19118 19087 00031
South Pasadena 50000 09137 31257 -22120
Pinellas County Budget Forecast FY2014-2023 E-48
FIRE DISTRICTS FUND
Each district is subject to a mandated millage cap The millage cap threshold for Belleair Bluffs Clearwater Dunedin Gandy Largo Pinellas Park Safety Harbor Tarpon Springs and South Pasadena are set at 5 mills while Seminole and Highpoint have a 10 mill cap Tierra Verde has the lowest millage cap at 30 mills which was increased by the Board from 15 mills in June 2010 to meet increasing operating expenditures The next chart shows the variation in the taxable values between unincorporated fire districts due to the composition of properties within the districts eg beach properties condominiums etc For nine of the 12 Fire Districts FY2013 taxable values decreased from the prior year due to the continued decline in the real estate market Three districts gained taxable value in FY2013 recovering some of the lost value through FY2012
Unincorporated Fire Districts
Percentage Change in Taxable Values FY20122013
Taxing Authority FY12 Taxable
Values FY13 Taxable
Values Chge
Belleair BluffsLargo 281332094 267962625 -475
Clearwater 888428781 831260703 -643
Dunedin 280773821 279367691 -050
Gandy 46246094 45444402 -173
Largo 534088892 512659658 -401
Pinellas Park 268204137 253431862 -551
Safety Harbor 63339041 64246370 +143
Tarpon Springs 168715814 164963370 -222
Seminole 2203015774 2106822294 -437
Highpoint 675532802 657217037 -271
Tierra Verde 714080020 736173857 +309
South Pasadena 99826357 101553248 +173
Consistent with the assumptions for the Countyrsquos Municipal Services Taxing Unit (MSTU) this forecast projects a 20 increase in Ad Valorem revenue for FY2014 and FY2015 From FY2016 through the forecast period this revenue is projected to increase at 25 each year for the unincorporated dependent fire districts
Expenditures The Fire District Fund supports budgeted expenditures and reserves totaling $23M for all twelve districts in FY2013 The primary expenditures budgeted in the fund are $139M for contractual payments to the municipalities and other independent agencies for fire and rescue services FY2013 budgeted reserves are $83M the FY2013 estimate increases the reserve to $9M to reflect a greater than expected FY2012 ending fund balance
Pinellas County Budget Forecast FY2014-2023 E-49
FIRE DISTRICTS FUND
Contractual Fire Payments The forecast includes an annual 40 increase for the service contracts through the forecast period Fire departments submit their operating and capital budget requests on an annual basis and after County review funding is based on the unincorporated pro-rata share of property values within the district The exception is the new contract with the City of St Petersburg for services to the South Pasadena district which is set at $75K per year for five years Administrative Costs Administrative costs from the County are allocated to each fire district based proportionately on the amount of budgeted ad valorem revenue collected This cost has decreased in recent budget years as reductions have been made to this allocation The FY2013 budget is $2645K Operating Expenses for this account reflect the Countyrsquos administrative expenses such as personal services intergovernmental charges and other operating charges that are allocated out to the twelve fire districts Transfers The Fire District fund has transfers to the Property Appraiser and Tax Collector to cover the costs of appraisals and collection of ad valorem revenues These amounts are set by Florida Statute and fluctuate with ad valorem revenue estimates FY2013 costs are estimated at $458K and the annual cost is estimated at 3 of projected ad valorem tax revenue through the forecast period Reserves The reserve level in the Fire District fund fluctuates as a whole but each fire district is evaluated individually The minimum reserve level that each district maintains is 5 reserve for contingency This is at the low end of the 5-15 reserve level budget policy adopted by the Board Several of the individual fire districts currently maintain a 5 minimum reserve including Clearwater Dunedin Gandy Largo and Tierra Verde Safety Harborrsquos contingency reserve was decreased from 10 to 5 in FY2013 which helped reduce the required millage increase Some of the districts including Belleair BluffsLargo Pinellas Park Tarpon Springs and Seminole Fire Districts maintain a 10 reserve level that serves as a buffer to shield the district from economic downturn in their area In FY2013 High Point was able to increase its contingency reserve from 5 to 8 with no increase in millage from FY2012 and South Pasadena increased from 5 to 10 In addition some fire districts set aside funds in Reserve for Future Years for long-term capital projects such as a new fire truck purchase or improvements to a fire station Districts can request these funds with the County sharing its portion of requests based on the unincorporated value of the district
Ten-Year Forecast Key Assumptions The fire district millages are assumed to remain at the approved FY2013 rates through the remainder of the forecast period for each of the districts Property tax revenue is forecasted to
Pinellas County Budget Forecast FY2014-2023 E-50
FIRE DISTRICTS FUND
increase by 20 in FY2014 and FY2015 Annual growth of 25 is projected through the rest of the forecast period as the housing market begins to rebound On the expenditure side the contractual payments to the cities are assumed to increase by 40 through the forecast period which outpaces the property tax revenues for the complete forecast period
Key Results The fire district fund is presented in a consolidated manner for all of the individual unincorporated twelve districts The chart above shows that total fund expenditures are projected to exceed revenues from FY2018 through FY2023 Specific fire districts will vary in how much operating and capital funds are requested how reserves are maintained and how fund balance is utilized So each individual district must be analyzed separately for its specific situation with revenue expenditures and reserves While overall the fund appears to be balanced until FY2018 revenues are outpaced by expenditures sooner in some of the individual fire districts Several of the districts will utilize fund balance during the forecast period to pay for long-term capital projects and current operating expenditures And as the main source of revenue in this fund is property taxes some of the unincorporated fire districts may have to increase millage rates in each budget year to keep up with expenditures
Pinellas County Budget Forecast FY2014-2023 E-51
FIRE DISTRICTS FUND
Potential Risks The major variable impacting future revenues for this fund is ad valorem revenue and taxable values As taxable values begin to rebound the opportunity for higher revenues will increase This is the main driver for increased revenues in the forecast If the districts continue to increase their operating requests at 4 per year and tax revenue grows at an estimated 25 in future years the pressure on increasing millage rates for the fire districts will continue each budget year Another potential impact is annexation of the unincorporated fire district areas As cities increasingly annex more of the available unincorporated properties area there are fewer unincorporated properties to share the burden of service costs The funding formula in most fire districts allows for the remaining unincorporated payment to decrease proportionately The exception to this practice is those Highpoint properties annexed by the City of St Petersburg Another impact to fire service costs would be increased costs of Emergency Medical Service If EMS funding is reduced by the County there is a high probability these same providers may shift those costs to their fire district budget
Balancing Strategies The forecast shows that this combined fund is not balanced through the forecast period This fund cannot be taken as a whole but each district must be looked at individually Unless the ad valorem revenue projection improves further out into the forecast the individual districts will feel pressure to increase their millage rates On the expenditure side the contractual costs from the fire service providersrsquo requests are being reviewed for continued efficiency opportunities Some of the individual districts can continue to use fund balance as long as it is available to them and as long as the minimum reserve of 5 is prudently maintained to continue funding their district personnel and operating expenditures
Pinellas County Budget Forecast FY2014-2023 E-52
AIRPORT FUND
Description In March 1941 construction started for the airport at its present site After Pearl Harbor the airport known as Pinellas Army Airfield was used as a military flight-training base After WWII many army airfields were declared surplus and turned over to cities counties and state sponsors to manage The Pinellas Army Airfield property was granted to Pinellas County by the US Government to operate as a commercial airport It was originally called the Pinellas International Airport and given the airport call letters PIE The Airport Revenue and Operating Fund is used to account for the self-supporting operations of St Petersburg - Clearwater International Airport and its surrounding land uses on the airportrsquos 2000 acres Approximately half of this property is dedicated to the airfield and supporting terminal and other facilities The remaining acreage includes the 129 acre planned development site (former golf course) a 200 acre Airport Business Center and leased industrial commercial and governmental operations All of the entire Airport property is a designated Foreign Trade Zone All activities necessary for Airport operations (eg administration operating and maintenance expense) are included in this fund Also included are airport facility capital improvements which receive federal and state grant funding of up to 95 of costs depending on the type of project with some projects funded 100 when Passenger Facility Charges are included In recognition of the quality of operations and innovative and efficient management the Florida Department of Transportation recognized St Petersburg ndash Clearwater International Airport as the 2010 Commercial Service Airport of the Year In 2011 Allegiant Airlines recognized the Airportrsquos terminal renovation project as their systemrsquos airport construction project of the year
Summary The Airport Operating and Revenue Fund is an enterprise fund that accounts for revenues and expenditures at St Petersburg ndash Clearwater International Airport This includes management of airport properties in addition to airfield operations The airport is self-supporting and no property tax dollars are used to support the operation of the airport Airport revenues have remained stable in recent years due to the rentallease terms and Allegiant Airlinesrsquo popularity Revenues are forecast to increase gradually during the forecast period matching anticipated gradual growth as part of the recovery in the broader US economy The ability to forecast the availability of capital contributions and other grant funding after FY2018 is limited Therefore intergovernmental revenues in FY2019 through FY2023 are forecast at a conservative lower level The forecast for the Airport Revenue and Operating Fund shows that the fund is balanced through the forecast period based on the assumptions that the capital projects budget would be adjusted to reflect the timing and amounts of any grants revenue and that the airportrsquos operating budget would be adjusted to match revenues
Pinellas County Budget Forecast FY2014-2023 E-53
AIRPORT FUND
Revenues Excluding capital contributions and grants the two major funding sources supporting the Airport Revenue and Operating Fund during the forecast period are RentalsLeasesConcession income and AirfieldFlight Line Fees
RentalsLeasesConcessions St Petersburg-Clearwater International Airport which is classified as small-hub airport by the FAA provides commercial and private aviation services for the community The Airport also has a significant amount of land which is leased under long-term leases providing a stable source of revenues Pinellas County Criminal and Juvenile Courts Cracker Barrel Restaurant Dynamet Inc and GE Aviation Systems are just a few examples of long term leases at the airport Forty-five percent (45) of the long-term industrial (non-aviation) land leases are with Pinellas County Also included in this revenue source are concessions operating at airport terminal such as the paid parking car rentals gift shop and restaurant These revenue sources are expected to increase by 2 over the 10 year forecast Long-term leases have a five year adjustment based on the CPI AirfieldFlight Line Airfield fees are charges for the use of the runways and taxiways Flight Line leases are for aircraft parking areas and maintenance hangars These revenue sources are expected to increase by 2 over the 10 year forecast
$00
$20
$40
$60
$80
$100
$120
$140
2013 2014 2015 2016 2017 2018 2019 2020 2021 2022 2023
Mill
ion
s
Airport Revenue amp Operating Fund Major Non-Capital Revenue Sources
Forecasted FY2013-FY2023
AirfieldFlight Lines RentsLeasesConcessions New Property Development
Pinellas County Budget Forecast FY2014-2023 E-54
AIRPORT FUND
The following chart for passenger traffic in 2012 shows that Allegiant Airlines represents 908 of the passengers served on commercial carriers from St Petersburg-Clearwater International Airport Revenues from Terminal concession leases along with airline landing fees and fuel flowage fees are dependent on passenger airline service
Capital Contributions and Grants Capital Contributions funding is in the form of grants from the Federal Aviation Administration (FAA) the Florida Department of Transportation (FDOT) along with Passenger Facility Charges (PFCs) These are the revenue sources typically used for the Airportrsquos capital project funding There are also occasions when Airport Reserves are used to assist with funding of CIP Projects Other Revenues AIRCO Golf Course which had been operating on airport property closed in FY2011 due to significant annual operating losses at the course In FY2010 the course lost $216000 and in FY2011 it lost $139000 As a result of closing the course the Airportrsquos profitability has increased Revenue from new development on this property is not expected to be produced until FY2018
Expenditures The Airport Revenue and Operating Fund supports budgeted expenditures and reserves in FY2013 totaling $329M of which $124M is allocated for capital projects and $114M is reserves
Pinellas County Budget Forecast FY2014-2023 E-55
AIRPORT FUND
Airport Programs Of the remaining $91M in operating expenditures 80 supports the Aviation Services program and 20 the Airport Real Estate program Starting in FY2013 two primary programs were identified for reporting purposes Aviation Services and Airport Real Estate The Aviation Services program consists of all facets of day-to-day aviation activities The Airport Real Estate program oversees and negotiates leases with tenants and future development of the Airport to ensure compliance with Federal Aviation Administration lease requirements Personal Services Personal Services expenses are for the salaries and benefits of the 64 positions needed to operate both programs at the Airport Budgeted Personal Services expenditures in FY2013 total $43M Capital Projects The FY2013 estimate for Capital Projects is $124M These projects receive funding in the form of grants from the Federal Aviation Administration and the Florida Department of Transportation These projects will only commence when the appropriate grants funding is made available The following chart shows the relationship between the scheduling of the revenues and the expenditures of capital projects When additional funds are needed Reserves could be used FY2018 shows preliminary planned improvements such as new T-hangars and expanded cargo ramp
Reserves The total reserve level in the Airport Revenue and Operating fund is budgeted at $114M (40) in FY2013 This reserve level is the result of the Airport building reserves over the past several
$00
$50
$100
$150
$200
2013 2014 2015 2016 2017 2018 2019 2020 2021 2022 2023
Mil
lio
ns
Airport Grant Revenue amp Capital Projects Expenditures
Forecast FY2013 - FY2023
Total Grants Capital Projects
Pinellas County Budget Forecast FY2014-2023 E-56
AIRPORT FUND
years The reserves are then available in the event of unanticipated revenue shortfalls and as well as support future capital funding needs When expenditures in a given year are shown as exceeding revenues the difference is supported by drawing down accumulated reserves including Passenger Facility Charges which must be used for capital projects (See the Reserves chart below) Airport Reserves also include the projected cost of Other Post Employment Benefits (OPEB) as proprietary funds are required by GASB 45 to record the entire annual required contribution (ARC) accrual on the financial statements
Ten-Year Forecast Key Assumptions The revenue forecasts of funding total resources are conservative due to the current economic conditions AirfieldFlight Line revenue for FY2013 is based on the current level of carriers and passenger numbers For FY2014 through FY2023 an increase of 2 per fiscal year is forecast The forecast is conservative as no new carriers have been included RentLeasesConcessions revenue for FY2013 is based on current leasesagreements through the termination of these lease agreements For FY2014 through FY2023 an increase of 2 is forecasted for each fiscal year No new revenue from commercial or industrial development on the former golf course acreage is projected in the forecast until FY2018 However new property development will depend on factors such as site restrictions and future economic conditions The chart below shows that the net of recurring revenues and recurring expenditures is positive through the forecast period
$00
$50
$100
$150
$200
2013 2014 2015 2016 2017 2018 2019 2020 2021 2022 2023
Mill
ion
s
Airport Fund Reserves Forecast FY2013-FY2023
Pinellas County Budget Forecast FY2014-2023 E-57
AIRPORT FUND
With the addition of the Capital expenditures and revenues the chart below tracks the estimated revenues and expenditures in the fund through the forecast period
$00
$20
$40
$60
$80
$100
$120
$140
2013 2014 2015 2016 2017 2018 2019 2020 2021 2022 2023
Mill
ion
s
Airport Fund Forecast FY2014 - FY2023 Excluding Non-Recurring Revenues and Expenditures
Revenues Expenditures
$00
$50
$100
$150
$200
$250
$300
2013 2014 2015 2016 2017 2018 2019 2020 2021 2022 2023
Mill
ion
s
Airport Fund Forecast FY2014 -FY2023 Including Capital Improvement Program
Revenues Expenses
Pinellas County Budget Forecast FY2014-2023 E-58
AIRPORT FUND
Key Results The forecast for the Airport Fund is balanced over the forecast period The fluctuation in total revenues and expenditures is caused by the timing of capital projects Capital project impact to both revenues and expenditures is fund neutral since the projects are dependent on the availability of grants If the grants are not forthcoming the projects are not started
Potential Risks Several items can alter the ten-year forecast of Airport revenue collections A primary concern is the strength of the airline industry and the continued success of Allegiant Airlines Revenues could increase if the airport can attract new passengers and other carrier services Increases in rentalleases income would result when current leases and agreements are renewed and rate formula escalations occur The former AIRCO Golf Course has been rezoned for future aviation and commercial development The potential lease income value of this parcel is approximately $15M annually when all land is fully leased In addition other vacant land parcels could add another $100K to $300K in annual lease income if fully leased Also this forecast does not add any new passenger service An increase of 250000 new airline passengers could provide over $1M in additional income without a significant increase in operating expenses
Balancing Strategies The forecast does not show any structural gaps in revenues and expenditures as the fund is balanced through the forecast period assuming that the operating and capital budget would be adjusted in step with revenues
Pinellas County Budget Forecast FY2014-2023 E-59
AIRPORT FUND
Pinellas County Budget Forecast FY2014-2023 E-60
WATER FUNDS
Description The Pinellas County Water System is responsible for providing quality cost effective potable water service to County retail and wholesale customers The Water System must adhere to State and Federal laws rules and regulations while operating and maintaining this delivery system The Water System is continually being upgraded to provide customers with a safe and sufficient water supply for domestic needs as well as an ample supply for fire protection The Water System also continues to educate its customers on important water conservation issues The Water Funds are enterprise funds and are committed solely to support Water System functions The Pinellas County Water System utilizes four funds Revenue and Operating Renewal and Replacement (capital) Water Certificate and Impact Fees This forecast covers all four funds
Summary The forecast for the Water System Funds shows that the multi-year rate increases approved as part of the FY2012 budget process will provide sufficient revenues to maintain reserves and fund capital replacement needs through FY2015 The forecast revenues include an additional 2 per year annual increase in rates from FY2016 through FY2023 as recommended in the FY2012 Utilities Rates Study performed by Burton amp Associates the Countyrsquos independent utility rates consultant The Department of Environment and Infrastructure will again perform a comprehensive rate study in FY2014 to analyze the future rate structure In FY2013 FY2014 FY2017 and FY2018 recurring expenditures will exceed recurring revenues as fund balance is drawn down as major capital projects are completed From FY2015 through FY2023 excluding FY2017 and FY2018 the Water Funds are structurally balanced
Revenues The Water Funds generate revenues budgeted in FY2013 totaling $814 million The Water Funds have two primary funding sources retail water sales of $621 million and wholesale water sales of $151 million
Retail Water Sales The Water System charges $435 per month base rate an increase of $100 from FY2012 and $478 per 1000 gallons for retail water service In FY2014 and FY2015 additional base rate increases of $100 will go into effect The customer base for retail water sales are both commercial and residential properties in the Pinellas County Water service area The volume of water purchased has declined 9 from FY2008 to FY2012 The amount of water purchased can be affected by economic conditions housing and commercial vacancies and levels of conservation
Pinellas County Budget Forecast FY2014-2023 E-61
WATER FUNDS
Wholesale Water Sales The Water System charged $35648 per 1000 gallons for wholesale water service In FY2014 and FY2015 rates are scheduled to increase by 4 resulting in revised rates of $37074 and $38557 respectively Wholesale Water Sales provide water to the cities of Clearwater Tarpon Springs Safety Harbor Belleair and Pinellas Park The volume of water purchased has declined 30 from FY2008 to FY2012 which can be attributed to the same economic and conservation pressures seen in retail water sales The graph below shows the recent history of the volume of Water sales by the Water System
5380
50015103
47634619
45
50
55
60
2009 actual 2010 actual 2011 actual 2012 actual 2013 estimate
Millio
ns o
f G
allo
ns p
er D
ay (M
GD
)
Fiscal Year
Pinellas County Water Sales MGD
Source Pinellas County Department of Environment and Infrastructure
Expenditures The Water Funds support budgeted expenditures and reserves in FY2013 totaling $1214 million The primary expenditures in the fund are $454 million for the purchase of water $140 million for personal services $150 million for operating expenses (excluding the purchase of water) and $185 million for capital outlay Purchase of Water Under Section 3731963 of the Florida Statutes the Water System is required to purchase water from Tampa Bay Water the regional water supply authority In 1997 an Interlocal Agreement and the Master Water Supply Contract was signed under which Tampa Bay Water provides water to their members Pinellas County Hillsborough County Pasco County City of St Petersburg City of Tampa and City of New Port Richey Tampa Bay Water sets their rates according to the adopted budget and collects those rates from all members according to the Master Water Supply Contract Capital Outlay The Water System must maintain its equipment facilities pipelines and plants in good working order utilizing revenues generated within its proprietary funds Capital outlay reflects the construction and purchase needs as estimated by Pinellas County Department of Environment and Infrastructure Engineering Division in the CIP ten-year work plan and beyond
Pinellas County Budget Forecast FY2014-2023 E-62
WATER FUNDS
Personal Services The Water System employs 202 full-time employees in FY2013 The Personal Services expenses of $127 million are for the salaries and benefits of those positions needed to operate the Water System Water System benefits include the $13 million cost of Other Post Employment Benefits (OPEB) as proprietary funds are required by GASB 45 to record the entire annual required contribution (ARC) accrual Operating Expenses The Water System incurs annual recurring costs for repair and maintenance supplies fuel and communications The Water System also pays for electrical power to run its facilities and for chemicals to treat the water Reserves The reserve level in the Water System is 23 which is above the 5-15 reserve level budget policy adopted by the Board The Water System maintains these reserves for cash flow and future capital needs
Ten-Year Forecast Key Assumptions Due to expected slow growth in the economy the forecast assumes a 0 annual increase from FY2013 to FY2016 a 009 annual increase in FY2017 a 018 annual increase in FY2018 and a 027 annual increase from FY2019 to FY2023 in retail water demand and no growth in wholesale water demand for the forecast period The wholesale water demand reflects a decline in revenues from FY2015 through FY2016 due to the projected loss of sales of three cities (Clearwater Tarpon Springs and Oldsmar) as they develop their own water sources For expenditures Personal Services and Operating Expenses reflect the forecast trends described in the Key Assumptions section of this document Electricity and chemicals costs are projected to increase by 0 and 7 respectively for 2014 both are projected to increase 5 and 7 respectively per year through the remaining forecast period The capital outlay forecast reflects the construction and purchase needs as estimated by the Pinellas County Department of Environment and Infrastructure Engineering Division An increase to $203 million in FY2017 is anticipated to support capital outlay water line projects with Florida Department of Transportation (FDOT) as well as other major capital outlay improvement projects To balance revenues with projected expenditures future rate increases will be necessary for both retail and wholesale rates Burton amp Associates DEI Finance and Economics Independent Consultants computed that rate increases for FY2016 through FY2023 are needed at 2 per year based on a blend of growth and consumption assumptions inflationary cost increases and capital needs at the projected water demand levels
Pinellas County Budget Forecast FY2014-2023 E-63
WATER FUNDS
Source Pinellas County Department of Environment and Infrastructure
Key Results The forecast for the Water System Funds shows that the approved rate increases and rate increases starting in FY2016 as recommended in the FY2012 Utilities Rate Study by Burton amp Associates will provide sufficient revenues to maintain reserves and fund capital replacement needs In FY2013 FY2014 FY2017 and FY2018 recurring expenditures will exceed recurring revenues as fund balance is drawn down as major capital projects are completed From FY2015 through FY2023 excluding FY2017 and FY2018 the Water Funds are structurally balanced
Potential Risks There are some impacts that can alter the ten-year forecast of the Water System Any future economic decline would reduce water demand which would impact revenue more than expenses Operating costs (including the purchase of water from Tampa Bay Water) could increase more than projected The Water System could experience a need for more maintenance than anticipated causing increased operating and capital costs Regulatory pressures could cause an increase of expenditures to maintain the system
Balancing Strategies With the multi-year rate increases approved during the FY2012 budget process and future rate increases as recommended by Burton amp Associates Water System revenues will be sufficient to cover projected expenditures and maintain sufficient reserves over the forecast period
Pinellas County Budget Forecast FY2014-2023 E-64
SEWER FUNDS
Description The Pinellas County Sewer System is responsible for quality cost effective sewer service to the citizens and business owners within the County sewer service areas The Sewer System must adhere to State and Federal laws rules and regulations while operating and maintaining this system The System provides an environmentally safe and sanitary means of collecting and transmitting discharged domestic waste from residential commercial and industrial users The Sewer System provides for the treatment and disposal of objectionable materials and organisms from the waste in order to protect public health property and environment The Sewer Funds are enterprise funds and are committed solely to support Sewer System functions The Pinellas County Sewer System utilizes four funds Revenue and Operating Renewal and Replacement (capital) Interest and Sinking (Debt Service) and Sewer Construction The Sewer System is required to maintain a debt service coverage ratio of 125x per the bond covenants however the fund is maintained at a debt service coverage ratio of 150x to sustain the current bond ratings
Summary The Pinellas County Sewer Funds are proprietary funds dedicated solely to supporting the Pinellas County Sewer System (Sewer System) The forecast for the Sewer System Funds shows that the multi-year rate increases approved in FY2012 will provide sufficient revenues to maintain reserves sustain the recommended debt service coverage ratio of 150x and fund capital replacement needs through FY2015 The forecast revenues include an additional 275 per year annual increase in rates from FY2016 through FY2023 as recommended in the FY2012 Utilities Rates Study performed by Burton amp Associates the Countyrsquos independent utility rates consultant The Department of Environment and Infrastructure will perform a comprehensive rate study in FY2014 to analyze the future rate structure In FY2013 recurring expenditures will exceed recurring revenues as fund balance is drawn down as major capital projects are completed From FY2014 through FY2023 the Sewer Funds are structurally balanced as recurring expenditures are in line with recurring revenues
Revenues The Sewer Funds generate revenues budgeted in FY2013 totaling $600 million The Sewer Funds have four primary funding sources retail sewer charges of $484 million wholesale sewer charges of $67 million retail reclaimed water charges of $39 million and wholesale reclaimed water charges of $03 million
Retail Sewer Charges The Sewer System charges $1180 per month base rate and $431 per 1000 gallons for retail sewer service in FY2013 The FY2014 increase of 6 for retail customers (adopted in 2012) will result in a base rate of $1251 per month and $457 per 1000 gallons The customer base
Pinellas County Budget Forecast FY2014-2023 E-65
SEWER FUNDS
for retail sewer service is both commercial and residential properties in the Pinellas County Sewer service area Total billed retail demand has declined 3 from FY2008 to FY2012 The amount of sewage processed is affected by economic conditions housing and commercial vacancies and levels of water conservation Prior to this approved rate increase there was a 6 increase in 2012 a 15 increase in FY2011 a 35 increase in FY2010 and no rate increases from FY2004 thru FY2009
Wholesale Sewer Sales The Sewer System charges $32264 per 1000 gallons for wholesale sewer service The adopted FY2013 increase of 9 for wholesale customers (adopted in 2012) will equate to $35168 per 1000 gallons Wholesale customers are four cities within Pinellas County that purchase sewer service from the Sewer System in bulk after collecting it from their retail sewer customers The cities of North Redington Beach Redington Shores Indian Rocks Beach and Pinellas Park are the wholesale customers of the Sewer System Similar to retail sewer sales the total billed wholesale demand has declined 12 from FY2008 to FY2012 The amount of waste processed is affected by economic conditions housing and commercial vacancies and levels of water conservation The graph below shows the recent history of the volume of waste billed by the Sewer System
Source Pinellas County Department of Environment and Infrastructure
Retail Reclaimed Water Charges The Reclaimed Water System charges $1700 per month rate for unfunded un-metered service (systems without existing distribution lines) and a $700 per month availability charge and $080 per 1000 gallons for retail reclaimed water service for metered service unfunded systems (systems without existing distribution lines) and $1600 per month base rate for funded un-metered service (systems with pre-existing distribution lines) and $080 per 1000 gallons for metered funded systems (systems with pre-existing distribution lines) Rates for unfunded systems are higher as the Sewer System must recover the cost of constructing the reclaimed water distribution lines Only those accounts that have metered service pay the volumetric rate with most paying only the flat monthly rate The FY2013 budget includes approved rate increases of $100 per year for un-metered service and a user fee per 1000 gallon increase of $08 per year for metered service
27002680
2591
24892551
240
245
250
255
260
265
270
275
280
285
2008 2009 2010 2011 2012
Mil
lio
ns o
f G
all
on
s p
er
Day (
MG
D)
Fiscal Years
Pinellas County Sewer MGD Billed FY2008-FY2012
Sewer MGD
Pinellas County Budget Forecast FY2014-2023 E-66
SEWER FUNDS
Wholesale Reclaimed Water Charges
The Reclaimed Water System charged volumetric rates by contract for wholesale reclaimed water service No increase for wholesale rates was proposed for FY2013 Wholesale customers are four cities within Pinellas County that purchase reclaimed water service from the Reclaimed Water System in bulk and distribute it to their retail customers The cities of St Petersburg Beach South Pasadena Belleair and Pinellas Park are the wholesale customers of the Reclaimed Water System
Expenditures The Sewer Funds support budgeted expenditures and reserves in FY2013 totaling $1076 million The primary expenditures in the funds are $163 million for personal services costs $240 million for operating expenses $148 million for debt service $245 million for capital outlay and $289 million in reserves Personal Services The Sewer System employs 222 full-time employees in FY2013 The Personal Services expenses of $149 million are for the salaries and benefits of those positions needed to operate the Sewer System Sewer System benefits include the $14 million cost of Other Post Employment Benefits (OPEB) as proprietary funds are required by GASB 45 to record the entire annual required contribution (ARC) accrual This cost is included in the calculation of the debt service coverage ratio Debt Service The Sewer System had $1843 million of bond principal outstanding as of September 30 2012 The bonds were issued to fund various sewer system capital projects and require annual principal and interest payments to the holders of those bonds From FY2014 through FY2028 the debt service requirement is between $145 million and $148 million From FY2029 through FY2032 debt service payments fall to between $50 million and $55 million The bonds mature between 2017 and 2032 Operating Expenses The Sewer System incurs annual recurring costs for repair and maintenance supplies fuel and communications In addition utilities to run the facilities and chemicals to treat the waste are major components of the Sewer Systemrsquos operating expenses Capital Outlay The Sewer System must maintain its equipment facilities pipelines and plants in good working order using revenues generated within their proprietary funds Capital outlay reflects the construction and purchase needs as estimated by the Department of Environment and Infrastructure Engineering Division in the CIP ten-year work plan and beyond Reserves
Pinellas County Budget Forecast FY2014-2023 E-67
SEWER FUNDS
The reserve level in the Sewer System is 27 which is higher than the 5-15 reserve level budget policy adopted by the Board The Sewer System maintains $92 million of reserves for cash flow and $197 million to fund future capital needs In addition the 2008 bond issue requires a debt service reserve of $197 million to maintain the recommended debt service ratio of 150x
Source Pinellas County Department of Environment and Infrastructure
Ten-Year Forecast Key Assumptions Due to expected slow growth in the economy the forecast assumes 0 increase from FY2013 to FY2016 a 007 annual increase in FY2017 a 014 in FY2018 and a 021 from FY2019 to FY2023 in retail and wholesale sewer demand For expenditures Personal Services and Operating Expenses reflect the forecast trends described in the Key Assumptions section of this document Electricity and chemical costs are projected to increase by 0 and 7 respectively for 2014 both are projected to increase 5 and 7 respectively per year through the remaining forecast period The capital outlay forecast reflects the construction and purchase needs as estimated by the Department of Environment and Infrastructure Engineering Division To balance revenues with projected expenditures multi-year rate increases were approved during the FY2012 budget process for both retail and wholesale rates Burton and Associates DEI Finance and Economics Independent Consultants have computed that the following sewer rate increases were necessary to meet the projected expenses and reserve needs at the projected sewer demand levels 6 each year FY2012ndashFY2015 for retail sewer and 9 each year FY2012ndashFY2015 for wholesale sewer Reclaimed waterretail customers $100 to the monthly charge each year FY2012ndashFY2015 for unmetered service and an increase of $008 to the user fee per 1000 gallons each year FY2012 to FY2015 These multi-year rates were approved by the Board of County Commissioners in September 2011 Rate increases for FY2016 through FY2023 as recommended in the FY2012 Utilities Rate Study by Burton amp Associates are assumed at 275 based on a blend of growth and consumption assumptions inflationary cost increases capital needs and minimum amount of reserves necessary to meet required debt service ratios
Pinellas County Budget Forecast FY2014-2023 E-68
SEWER FUNDS
Key Results The forecast for the Sewer System Funds shows that the multi-year rate increases approved in FY2012 and future rate increases starting in FY2016 as recommended by Burton amp Associates will provide sufficient revenues to maintain reserves sustain the recommended debt service coverage ratio of 150x and fund capital replacement needs over the forecast period In FY2013 recurring expenditures will exceed recurring revenues as fund balance is drawn down as major capital projects are completed From FY2014 through FY2023 the Sewer Funds are structurally balanced as recurring expenditures are in line with recurring revenues
Potential Risks There are some impacts that can alter the ten-year forecast of the Sewer System Any future economic decline would reduce water demand which reduces sewer revenue that is based on volume Operating costs could increase more than projected The Sewer System could experience a need for more maintenance than anticipated causing increased capital costs
Balancing Strategies With the rate increases approved during the FY2012 budget process and anticipated future rate increases Sewer System revenues will be sufficient to cover projected expenditures maintain sufficient reserves and sustain the recommended debt service coverage ratio of 150x
Pinellas County Budget Forecast FY2014-2023 E-69
SEWER FUNDS
Pinellas County Budget Forecast FY2014-2023 E-70
SOLID WASTE FUNDS
Description Pinellas County Solid Waste provides safe and environmentally sound integrated solid waste services to all citizens of Pinellas County These services emphasize public awareness and communication to enable the citizens to make educated choices concerning proper management of their solid waste and to help maintain the quality of life in Pinellas County In support of that mission Solid Waste operates the landfill the waste-to-energy plant hazardous waste collection recycling programs and litter-reduction program The Solid Waste Funds are enterprise funds and are committed solely to support Solid Waste functions Solid Waste utilizes two funds Revenue and Operating and Renewal and Replacement (capital)
Summary The Pinellas County Solid Waste Funds are enterprise funds dedicated solely to supporting the Solid Waste functions The forecast for the Solid Waste Funds shows that the fund is balanced through the forecast period Solid Waste tipping fees and electricity sales revenues have declined with the slower economy but will remain sufficient to fund operations and maintain sufficient reserves during the forecast period Reserves are being accumulated for future capital replacement needs consistent with their 25 year capital plan
Revenues The Solid Waste Funds generate revenues budgeted in FY2013 totaling $850 million The Solid Waste Funds consist almost exclusively of two primary funding sources tipping fees of $337 million and electricity sales of $486 million
Tipping Fees Solid Waste charges $3750 per ton for all waste brought to the Solid Waste Facility That rate has not changed since 1988 The volume of waste brought to the Solid Waste Facility is expected to increase slightly in FY2014 The amount of waste brought to the facility is affected by economic conditions and levels of recycling
Electricity Sales Solid Waste receives revenue from the electrical capacity contract with Progress Energy for power produced by the waste-to-energy plant The revenue from this contract is defined by rates specified in the contract which expires in 2024 Solid Waste also receives revenue for electricity sales in excess of the capacity contract with Progress Energy This revenue stream is affected by the amount of waste received by the plant and the operating capacity of the plant Due to slow growth in the economy and no planned increases in plant capacity for the next ten years this revenue is forecast to increase by 05 per year from FY2014 through FY2023
Pinellas County Budget Forecast FY2014-2023 E-71
SOLID WASTE FUNDS
The graph below shows the tons of waste delivered to the Solid Waste Facility
Source Pinellas Co Solid Waste Mgmt Tonnage Activity Reports
Interfund Loan Repayment Debt service revenues over the forecast period are associated with an interfund loan from the Solid Waste Renewal and Replacement Fund to the Capital Improvement Fund On September 21 2010 the Board authorized the first interfund loan up to $85 million to assist with cash flow in the Capital Projects Fund through FY2019 The original 2010 to 2020 Penny Program was anticipated to be financed with a $150 million bond issue in order to accelerate several key projects The benefits of an interfund loan versus bonding include lower borrowing costs no reserve requirements interest accrues to a county entity and more flexibility in the implementation and terms of the loan Interest will be collected in FY2011 through FY2020 and loan repayment in FY2015 through FY2020 The interfund loan is available for use through FY2015 An additional loan to the Capital Projects Fund will be necessary to cover the remaining $75 million of costs to fully fund the Centralized Chiller Facility project This project funds the construction of a new centralized chiller facility for the downtown Clearwater campus The County will purchase chilled water at a set rate based on the amount of investment towards the cost of the facility Repayment of the loan will take place from FY2013 to FY2017 at $15 million annually The loan will be repaid from the General Fund but because it is a capital project the expenditures and repayment are taking place from the Capital Projects Fund Based on the forecast it is anticipated that only $70 million of the authorized $85 million will ultimately need to be transferred to the Capital Projects Fund
Expenditures The Solid Waste Funds support budgeted expenditures and reserves in FY2013 totaling $1996 million The primary expenditures in the fund are $313 million for the Waste-to-Energy service contract $113 million for the landfill service contract and $401 million for capital investment Budgeted reserves are $872 million
Pinellas County Budget Forecast FY2014-2023 E-72
SOLID WASTE FUNDS
Waste-to-Energy Service Contract Solid Waste is under contract with Green Conversion Systems LLC (GCS) to operate the Waste-to-Energy (WTE) plant This contract expires in 2024 and has 10 one-year extensions The stock of the parent company for the original contractor Veolia ES Pinellas Inc was purchased by GCS IN 2012 Landfill Service Contract Solid Waste is under contract with Advanced Disposal Inc to operate the landfill This contract expires in 2015 and has a 3-year extension The contract was assigned by the original contractor Veolia when the stock of the parent company was sold Capital Outlay Solid Waste maintains its equipment facilities and plants in good working order utilizing revenues generated within their enterprise fund Project decisions for equipmenttechnology improvements and construction projects are based on condition assessments permit or regulatory requirements and recommendations from consultants The new Industrial Water Treatment Plant (IWTP) at Solid Waste was the result of an analysis of the entire water balance at Bridgeway Acres A comprehensive water management study was completed in 2006 to assess the interrelated issues associated with our management of water including water use at the Waste-to-Energy facility particularly in the cooling towers permit issues associated with maintaining the inward gradient and water quality in the main water retention area The new IWTP was one of several projects that has been completed or is under construction The new facility will enable treatment to the main water retention area to maximize its use at the WTE facility including meeting contractual guarantees with respect to the water quality delivered It reduces reliance on reclaimed water increases capacity to the main water retention area minimizes any discharges required and assures a water supply in the dry spring months Personal Services The Solid Waste System employs 90 full-time employees in FY2013 The Personal Services expenses are for the salaries and benefits of those positions needed to operate the Solid Waste System Solid Waste System benefits include the cost of Other Post Employment Benefits (OPEB) as proprietary funds are required by GASB 45 to record the entire annual required contribution (ARC) accrual Interfund Loan to Capital Projects Fund The forecast includes transfers of $100 million in FY2013 and $450 million in FY2014 from the Solid Waste Renewal and Replacement Fund as part of the interfund loans to the Capital Projects Fund The estimate for FY2013 also includes the transfer of $75 million for the Centralized Chiller Facility project which will be repaid from the General Fund Reserves The budgeted FY2013 reserve level in the Solid Waste System is 44 which is above the 15 reserve level budget policy adopted by the Board Solid Waste maintains the following reserves
Pinellas County Budget Forecast FY2014-2023 E-73
SOLID WASTE FUNDS
$75 million required reserves per the contract with GCS $11 million for insurance deductibles $139 million for three months of operating expenses and the remainder of $548 million is for future needs consistent with their 25 year capital plan The estimated FY2013 reserves are higher than budgeted due to the timing of the loan from Solid Waste to the Capital Projects Fund $45 million of the loan was delayed from FY2012 to FY2014
Ten-Year Forecast Key Assumptions The revenue forecast assumes only a 05 increase in tipping fees and electricity sales throughout the forecast horizon due to the anticipated slow growth in the economy increased recycling and no planned capacity increases to the WTE plant The revenue forecast does not include any increases in tipping fee rates The economy does affect the tons of waste brought to the solid waste facility because less consumption means less waste For expenditures Personal Services and Operating Expense reflect the forecast trends described in the Key Assumptions section of this document The capital outlay forecast reflects the construction and purchase needs based on condition assessments permit or regulatory requirements and recommendations from consultants There are large capital needs forecasted from FY2013 through FY2018 in anticipation of tighter regulatory requirements and additional required improvements
Pinellas County Budget Forecast FY2014-2023 E-74
SOLID WASTE FUNDS
Key Results The forecast for the Solid Waste Funds shows that the forecasted revenues are sufficient to provide for the forecasted expenditures over the next ten years while still maintaining sufficient reserves (The forecast chart does not include the loans to the Capital Projects Fund or the future repayments from that fund) Solid waste revenues exceed expenditures from FY2015 through FY2023 In FY2014 expenditures reflect non-recurring costs associated with additional capital outlay improvements The recurring revenues are sufficient to support recurring operations without any increases in tipping fees Reserves increase during the forecast period and reach the level of 84 of revenues in FY2023 The reserves are planned to fund considerable future capital replacement needs in the Solid Waste 25-year plan
Potential Risks There are some impacts that can alter the ten-year forecast of the Solid Waste Funds Any continued economic decline would reduce incoming waste which would reduce revenue from both the tipping fees and electricity sales The WTE plant could experience more maintenance downtime than anticipated reducing electricity sales and causing increased capital costs
Balancing Strategies Excluding FY2014 with anticipated capital outlay improvements the forecast does not show any structural gaps in revenues and expenditures as the fund is balanced through the forecast period
Pinellas County Budget Forecast FY2014-2023 E-75
SOLID WASTE FUNDS
Pinellas County Budget Forecast FY2014-2023 E-76
PRO-FORMAS
Pinellas County Budget Forecast FY2014-2023
The Pro-Formas portion of the Budget Forecast FY2014-2023 includes the detailed assumptions behind the ten-year fund pro-formas as well as full-size forecast charts for ten of the Countyrsquos major funds
General Fund
Tourist Development Fund
Transportation Trust Fund
Capital Projects Fund
Emergency Medical Services Fund
Fire Districts Fund
Airport Fund
Utilities Water Funds
Utilities Sewer Funds
Utilities Solid Waste Funds
Sections for Each Fund Each fund has the following information
Forecast Chart Provides a forecast of revenues (net of fund balance) and expenditures (net of reserves) for each fund over a ten-year period
Assumptions Provides the key assumptions for each year in the forecast horizon that feed the pro-formas for each fund
Pro-Formas Provides the detailed revenue and expenditure projections over ten years for each fund based on key assumptions
Additional Information The information in this section provides the detail behind the forecast summaries prepared in the Fund Forecasts portion of this document The fund forecasts are intended to be high level user-friendly summaries of the results of the ten-year forecast for each fund The information in this section is much more granular and was used by the Office of Management amp Budget as well as other contributing departments to produce the forecasts
F-1
PRO-FORMAS
Pinellas County Budget Forecast FY2014-2023
F-2
4000
4500
5000
5500
6000
6500
2013
2014
2015
2016
2017
2018
2019
2020
2021
2022
2023
Dollars (millions)
Gen
era
l F
un
d F
ore
ca
st
FY
2014 -
FY
2023
U
sin
g S
erv
ice L
evel
Sta
biliz
ati
on
Acc
ou
nt
in F
Y201
3 -
FY
2014
Revenue
Expenditure
s
F-3
GE
NE
RA
L F
UN
D F
OR
EC
AS
TF
un
d 0
001
Fo
recast
Assu
mp
tio
ns
20
14
20
15
20
16
20
17
20
18
20
19
20
20
20
21
20
22
20
23
RE
VE
NU
ES
Pro
pe
rty T
axe
s -
Co
un
tyw
ide
2
5
25
3
0
30
3
0
30
3
0
30
3
0
30
Pro
pe
rty T
axe
s -
MS
TU
2
0
20
2
5
25
2
5
25
2
5
25
2
5
25
Half C
en
t S
ale
s T
ax
40
3
5
35
3
5
35
3
5
35
3
5
35
3
5
Reve
nu
e S
ha
rin
g2
5
25
2
5
25
2
5
25
2
5
25
2
5
25
Com
mu
nic
atio
ns S
vc T
ax
-05
-0
5
-05
-0
5
-05
-0
5
-05
-0
5
-05
-0
5
Cha
rge
s f
or
Se
rvic
es
15
1
8
17
2
0
19
2
1
20
2
0
20
2
0
Tra
nsfe
rs f
rom
Oth
er
Fu
nd
s0
0
00
0
0
00
0
0
00
0
0
00
0
0
00
Oth
er
reve
nu
es
20
2
0
20
2
0
20
2
0
20
2
0
20
2
0
EX
PE
ND
ITU
RE
S
Pe
rso
na
l S
erv
ice
s4
1
40
4
0
40
4
0
40
4
0
40
4
0
40
Op
era
tin
g E
xp
en
se
s-0
5
26
2
6
29
0
3
29
3
0
31
3
0
31
Cap
ita
l O
utla
y1
5
18
1
7
20
1
9
21
2
0
20
2
0
20
Gra
nts
amp A
ids
15
1
8
17
2
0
19
2
1
20
2
0
20
2
0
Pro
jec
ted
Ec
on
om
ic C
on
dit
ion
s
In
dic
ato
rs
Con
su
me
r P
rice
In
de
x
c
ha
ng
e1
5
18
1
7
20
1
9
21
2
0
20
2
0
20
FL
Pe
r C
ap
ita
Pe
rso
na
l In
co
me
Gro
wth
20
2
2
22
1
8
14
1
5
17
1
6
16
1
6
Estim
ate
d N
ew
Con
str
uctio
n
of
tax b
ase
05
0
5
10
1
0
10
1
0
10
1
0
10
1
0
P
rop
ert
y T
ax
pe
ren
tag
es
are
ch
an
ge
s i
n T
ax
ab
le V
alu
e
F-4
GE
NE
RA
L F
UN
D F
OR
EC
AS
TF
un
d 0
001
OR
IGIN
AL
(in
$ m
illi
on
s)
Ac
tua
lB
UD
GE
TE
sti
ma
ted
Es
tim
ate
dE
sti
ma
ted
Es
tim
ate
dE
sti
ma
ted
Es
tim
ate
dE
sti
ma
ted
Es
tim
ate
dE
sti
ma
ted
Es
tim
ate
dE
sti
ma
ted
20
12
20
13
20
13
20
14
20
15
20
16
20
17
20
18
20
19
20
20
20
21
20
22
20
23
BE
GIN
NIN
G F
UN
D B
AL
AN
CE
12
68
1
15
3
13
05
1
08
9
95
3
7
61
53
8
2
72
(10
)
(3
48
)
(73
8)
(1
17
0)
(16
73
)
RE
VE
NU
ES
Pro
pe
rty T
axe
s -
Cou
nty
wid
e2
58
4
25
90
2
59
0
26
55
2
72
1
28
03
2
88
7
29
74
3
06
3
31
55
3
25
0
33
48
3
44
8
Pro
pe
rty T
axe
s -
MS
TU
29
0
2
76
27
6
2
82
28
8
2
95
30
2
3
10
31
8
3
26
33
4
3
42
35
1
Half C
en
t S
ale
s T
ax
37
0
3
82
38
2
3
97
41
1
4
25
44
0
4
55
47
1
4
87
50
4
5
22
54
0
Reve
nu
e S
ha
rin
g1
43
14
3
1
43
14
7
1
51
15
5
1
59
16
3
1
67
17
1
1
75
17
9
1
83
MA
ND
AT
E M
ed
ica
id (
Rev S
hrg
cu
t)-
(5
1)
no
w s
ho
wn
as O
pe
rati
ng
Exp
en
dit
ure
in
ste
ad
of
rev
en
ue
re
du
cti
on
-
-
-
-
-
Com
mu
nic
atio
ns S
vc T
ax
10
8
1
07
10
7
1
06
10
5
1
04
10
3
1
02
10
1
1
00
10
0
1
00
10
0
Bu
ild
ing
Pe
rmits
-
-
-
-
-
-
-
-
-
-
-
-
-
Gra
nts
(fe
ds
tate
lo
ca
l)1
35
59
5
9
60
6
1
62
6
3
64
6
5
66
6
7
68
6
9
Inte
rest
08
1
0
10
0
8
10
1
5
16
0
8
-
-
-
-
-
Cha
rge
s f
or
Se
rvic
es
68
5
6
35
63
5
6
55
66
5
6
74
68
7
7
03
72
0
7
37
75
5
7
69
78
9
Oth
er
reve
nu
es
13
4
1
21
12
1
1
23
12
5
1
28
13
1
1
34
13
7
1
40
14
3
1
46
14
9
Ad
just
Pro
pe
rty T
axe
s
to 9
6
-
-
30
3
1
32
3
3
34
3
5
36
3
7
38
3
9
40
Ad
just
Ma
jor
Re
ve
nu
e t
o 9
8
-
-
-
21
2
1
22
2
2
23
2
3
24
2
5
25
2
6
Ad
just
Oth
er
Re
ve
nu
e t
o 9
7
-
-
-
18
2
1
25
2
8
31
3
6
40
4
1
45
4
8
TO
TA
L R
EV
EN
UE
S4
45
7
42
72
4
35
3
45
03
4
61
1
47
41
4
87
2
50
02
5
13
7
52
83
5
43
2
55
83
5
74
3
v
s p
rio
r ye
ar
20
-2
3
2
3
3
3
3
3
3
3
3
TO
TA
L R
ES
OU
RC
ES
57
25
5
42
5
56
58
5
59
2
55
64
5
50
2
54
10
5
27
4
51
27
4
93
5
46
94
4
41
3
40
70
EX
PE
ND
ITU
RE
S
Pe
rso
na
l S
erv
ice
s6
37
65
4
6
54
68
1
7
08
73
6
7
65
79
6
8
28
86
1
8
95
93
1
9
68
Op
era
tin
g E
xp
en
se
s9
59
10
23
1
07
4
10
76
1
10
5
11
34
1
16
7
11
75
1
21
0
12
47
1
28
6
13
24
1
36
5
Cap
ita
l O
utla
y1
5
09
0
9
09
0
9
09
0
9
09
0
9
09
0
9
09
0
9
Gra
nts
amp A
ids
15
9
1
91
19
1
1
93
19
8
2
02
20
7
2
12
21
7
2
22
22
7
2
32
23
7
Tra
nsfe
rs2
58
4
25
76
2
57
6
26
84
2
78
4
28
84
2
99
2
31
08
3
22
8
33
52
3
48
2
36
27
3
77
7
Deb
t S
erv
ice
-
03
-
-
-
-
-
-
-
-
-
-
-
Se
rvic
e L
eve
l S
tab
iliz
ati
on
Ac
ct
-
94
-
-
-
-
-
-
-
-
-
-
-
No
n-r
ec
urr
ing
ex
pe
nd
itu
res
16
-
2
6
-
-
-
-
-
-
-
-
-
-
Exp
en
ditu
re L
ap
se
1
-
(1
9)
(19
)
(2
0)
(20
)
(2
1)
(21
)
(2
2)
(23
)
(2
3)
(24
)
(2
5)
Po
ten
tia
l Is
su
es
No
n-r
ec
urr
ing
Tra
ns
fers
to
CIP
06
1
5
15
1
5
15
1
5
15
-
-
-
-
-
-
BT
S n
on
-re
cu
rrin
g p
roje
ct
co
sts
37
4
3
43
-
-
-
-
-
-
-
-
-
-
Ho
me
les
s In
itia
tive
s (
Gamp
A)
07
-
-
-
-
-
-
-
-
-
-
-
-
CIP
Op
era
tin
g Im
pa
cts
(c
um
ula
tive
)-
-
-
-
0
4
04
0
4
05
0
5
05
(1
2)
(13
)
(1
3)
TO
TA
L E
XP
EN
DIT
UR
ES
44
20
4
60
8
45
69
4
63
9
48
03
4
96
4
51
38
5
28
4
54
75
5
67
3
58
64
6
08
6
63
18
v
s p
rio
r ye
ar
31
7
3
2
4
3
4
3
4
4
3
4
4
EN
DIN
G F
UN
D B
AL
AN
CE
13
05
8
17
10
89
9
53
76
1
5
38
27
2
(1
0)
(34
8)
(7
38
)
(11
70
)
(1
67
3)
(22
48
)
AS
SU
MIN
G N
O A
CT
ION
TA
KE
N T
O
RE
SO
LV
E S
HO
RT
FA
LL
S
En
din
g b
ala
nce
as
of
Re
so
urc
es
23
1
6
19
1
7
14
1
0
5
0
-7
-15
-2
5
-38
-5
5
TO
TA
L R
EQ
UIR
EM
EN
TS
57
25
5
42
5
56
58
5
59
2
55
64
5
50
2
54
10
5
27
4
51
27
4
93
5
46
94
4
41
3
40
70
RE
VE
NU
E m
inu
s E
XP
EN
DIT
UR
ES
37
(3
36
)
(21
6)
(1
36
)
(19
2)
(2
23
)
(26
6)
(2
82
)
(33
8)
(3
90
)
(43
2)
(5
03
)
(57
5)
(NO
T c
um
ula
tive
)
no
te
no
n-r
ec
urr
ing
ex
pe
nd
itu
res
66
1
52
84
1
5
15
1
5
15
-
-
-
-
-
-
net
recu
rrin
g r
ev-
exp
103
(184
)
(132
)
(1
21
)
(177
)
(208
)
(251
)
(282
)
(338
)
(390
)
(4
32
)
(503
)
(575
)
E
xp
en
ditu
re la
pse
is c
alc
ula
ted
on
Pe
rso
na
l S
erv
ice
s
Op
era
tin
g E
xp
en
se
s
Cap
ita
l O
utla
y
an
d G
ran
ts amp
Aid
s o
nly
FY
12
ad
va
lore
m a
nd
oth
er
reve
nu
e a
dju
ste
d f
or
de
linqu
en
t ta
xe
s a
nd
ta
x r
ed
em
ptio
ns
FO
RE
CA
ST
F-5
F-6
160
180
200
220
240
260
280
300
320
340
360
380
400
420
440
2014
2015
2016
2017
2018
2019
2020
2021
2022
2023
Dollars (mllions)
To
uri
st
De
ve
lop
me
nt
Co
un
cil
Fu
nd
Fo
rec
as
t F
Y2
01
4 -
FY
20
23
Ex
clu
din
g U
nd
es
ign
ate
d E
xp
en
dit
ure
s
RE
VE
NU
ES
E
XP
EN
DIT
UR
ES
F-7
TO
UR
IST
DE
VE
LO
PM
EN
T C
OU
NC
IL F
UN
D F
OR
EC
AS
TF
un
d 1
04
0
Fo
rec
as
t A
ss
um
pti
on
s2014
2015
2016
2017
2018
2019
2020
2021
2022
2023
RE
VE
NU
ES
Tourist D
evelo
pm
ent T
axes
35
30
30
30
30
30
30
30
30
30
EX
PE
ND
ITU
RE
S
Pers
onal S
erv
ices
41
40
40
40
40
40
40
40
40
40
Opera
ting E
xpenses
15
18
17
20
19
21
20
20
20
20
Advert
isin
g E
xpense
15
18
17
20
19
21
20
20
20
20
Capital O
utlay
15
18
17
20
19
21
20
20
20
20
Pro
jecte
d E
co
no
mic
Co
nd
itio
ns In
dic
ato
rs
Consum
er
Price Index
change
15
18
17
20
19
21
20
20
20
20
FL P
er
Capita P
ers
onal I
ncom
e G
row
th20
22
22
18
14
15
17
16
16
16
F-8
TO
UR
IST
DE
VE
LO
PM
EN
T C
OU
NC
IL F
UN
D F
OR
EC
AS
TF
un
d 1
04
0
(in
$ t
ho
usan
ds)
Actu
al
Bu
dg
et
Esti
mate
dE
sti
mate
dE
sti
mate
dE
sti
mate
dE
sti
mate
dE
sti
mate
dE
sti
mate
dE
sti
mate
dE
sti
mate
dE
sti
mate
dE
sti
mate
d
2012
2013
2013
2014
2015
2016
2017
2018
2019
2020
2021
2022
2023
BE
GIN
NIN
G F
UN
D B
AL
AN
CE
64
290
72
818
80
012
57
874
56
165
56
680
59
561
61
182
62
242
64
540
66
428
69
046
70
450
RE
VE
NU
ES T
ourist D
evelo
pm
ent T
axes
95
287
461
270
972
284
011
293
952
302
770
311
854
321
209
330
845
340
771
350
994
361
524
372
369
383
541
Inte
rest
290
277
400
405
562
1134
1787
1835
1867
1936
1993
2071
2114
Cty
Off F
ees (
TC
)-
-
-
-
-
-
-
-
-
-
-
-
-
Oth
er
revenues (
Int -
TC
)44
66
66
67
68
70
71
72
74
75
77
78
80
Adju
st T
ax R
evenues to 1
00
-
-
14
948
15
471
15
935
16
413
16
906
17
413
17
935
18
473
19
028
19
598
20
186
Adju
st oth
er
Revenues to 1
00
-
-
25
25
25
26
27
27
28
28
29
29
30
RE
VE
NU
ES
287
795
271
315
299
450
309
920
319
361
329
496
339
999
350
193
360
675
371
507
382
650
394
147
405
950
v
s p
rior
year
116
-5
7
40
35
30
32
32
30
30
30
30
30
30
TO
TA
L R
ES
OU
RC
ES
352
085
344
133
379
462
367
794
375
526
386
176
399
560
411
375
422
917
436
047
449
078
463
192
476
400
EX
PE
ND
ITU
RE
S
Pers
onal S
erv
ices
27
276
32
116
32
116
33
433
34
770
36
161
37
607
39
112
40
676
42
303
43
995
45
755
47
585
Opera
ting E
xpenses
62
229
66
646
66
646
67
646
68
863
70
034
71
435
72
792
74
321
75
807
77
323
78
870
80
447
Advert
isin
g E
xpense
75
623
86
514
86
514
87
812
89
392
90
912
92
730
94
492
96
476
98
406
100
374
102
382
104
429
A
ddtl A
dvert
Exp -
one-t
ime
RN
C6000
-
-
-
-
-
-
-
-
-
-
-
-
Un
desig
nate
d-
-
33
000
20
000
15
000
82
000
88
000
93
000
96
000
106
000
110
000
122
000
126
000
Capital O
utlay
-
43
43
44
44
45
46
47
48
49
50
51
52
Capital O
utlay -
Dali
Museum
-
-
-
-
5000
5000
5000
5000
5000
-
-
-
-
Tra
nsfe
r -
Tax C
olle
cto
r4485
4942
4942
5090
5243
5400
5562
5729
5901
6078
6260
6448
6642
Tra
nsfe
r -
Beach R
enourishm
ent
26
513
32
424
32
424
29
395
30
277
31
185
32
121
33
085
34
077
35
099
36
152
37
237
38
354
Debt S
erv
ice
69
947
65
903
65
903
68
210
70
256
5877
5877
5877
5877
5877
5877
-
-
EX
PE
ND
ITU
RE
S272
073
288
588
321
588
311
629
318
846
326
615
338
378
349
133
358
376
369
619
380
032
392
742
403
509
v
s p
rior
year
17
6
18
-3
2
2
4
3
3
3
3
3
3
EN
DIN
G F
UN
D B
AL
AN
CE
80
012
55
545
57
874
56
165
56
680
59
561
61
182
62
242
64
540
66
428
69
046
70
450
72
891
Endin
g b
ala
nce a
s
of R
esourc
es
23
16
15
15
15
15
15
15
15
15
15
15
15
TO
TA
L R
EQ
UIR
EM
EN
TS
352
085
344
133
379
462
367
794
375
526
386
176
399
560
411
375
422
917
436
047
449
078
463
192
476
400
RE
VE
NU
E m
inu
s E
XP
EN
DIT
UR
ES
15
722
(17
273
)
(22
138
)
(1709
)
515
2881
1621
1060
2299
1888
2618
1405
2441
(NO
T c
um
ula
tive)
no
te
no
n-r
ec
urr
ing
exp
en
dit
ure
s-
-
-
-
-
-
-
-
-
-
-
-
-
ne
t re
cu
rrin
g r
ev-
ex
p1
57
22
(17
27
3)
(22
13
8)
(17
09
)
51
5
28
81
16
21
10
60
22
99
18
88
26
18
14
05
24
41
One-t
ime O
pera
ting E
xpenditure
s w
ere
availa
ble
due to a
ctu
al F
Y12 B
egin
nin
g F
und B
ala
nce b
ein
g h
igher
than b
udgete
d
1)
The T
ransfe
r fo
r B
each R
enourishm
ent in
FY
2013 r
eflects
an a
dditio
nal am
ount due b
ased o
n r
econcile
d a
ctu
al ta
x c
olle
ctions v
ers
us b
udget in
prior
years
T
he F
Y2014 a
mount re
turn
s to the b
ase a
nnual tr
ansfe
r of 12
of one c
ent fr
om
the e
stim
ate
d c
olle
ctions
2)
The s
ignific
ant re
duction in D
ebt S
erv
ice in F
Y2016 r
eflects
the e
nd o
f T
ropic
ana F
ield
and D
unedin
Spring T
rain
ing F
acili
ty p
aym
ents
in F
Y2015
3)
The r
eduction in D
ebt S
erv
ice in F
Y2022 r
eflects
the e
nd o
f C
learw
ate
r S
pring T
rain
ing F
acili
ty p
aym
ents
in F
Y2021
4)
Annual paym
ents
of $500k to the D
ali
Musuem
are
schedule
d to e
nd in F
Y2020
5)
The T
ransfe
r fo
r T
ax C
olle
cto
r serv
ices in F
Y13 r
eflects
a r
ecovery
form
ula
based o
n a
ctu
al annual cost It incre
ases 3
p
er
year
in the fore
cast fo
r anticip
ate
d incre
ases in futu
re p
ers
onal serv
ices a
nd o
pera
ting e
xpenses
6)
The
Undesig
nate
d
line u
nder
Expenditure
s s
how
s a
pote
ntial am
ount of fu
nds that could
be a
llocate
d a
bove the targ
et 15
reserv
e based o
n a
ll aoth
er
assum
ptions in the fore
cast
FO
RE
CA
ST
(
100
Reven
ue)
F-9
F-10
$200
$230
$260
$290
$320
$350
$380
$410
$440
2013
2014
2015
2016
2017
2018
2019
2020
2021
2022
2023
Dollars (millions)
Tra
nsp
ort
ati
on
Tru
st
Fu
nd
Fo
reca
st
FY
2014 -
FY
2023
RE
VE
NU
ES
E
XP
EN
DIT
UR
ES
F-11
TR
AN
SP
OR
TA
TIO
N T
RU
ST
FU
ND
FO
RE
CA
ST
Fu
nd
1001
Fo
recast
Assu
mp
tio
ns
20
14
20
15
20
16
20
17
20
18
20
19
20
20
20
21
20
22
20
23
RE
VE
NU
ES
Nin
th C
en
t G
as T
ax
-05
-0
5
-05
-0
5
-05
-0
5
-05
-0
5
-05
-0
5
Sta
te S
ha
red
Ga
s T
axe
s-0
5
-05
-0
5
-05
-0
5
-05
-0
5
-05
-0
5
-05
Lo
ca
l O
ptio
n G
as T
axe
s-0
5
-05
-0
5
-05
-0
5
-05
-0
5
-05
-0
5
-05
Oth
er
reve
nu
es
20
2
0
20
2
0
20
2
0
20
2
0
20
2
0
EX
PE
ND
ITU
RE
S
Pe
rso
na
l S
erv
ice
s4
1
40
4
0
40
4
0
40
4
0
40
4
0
40
Op
era
tin
g E
xp
en
se
s1
5
18
1
7
20
1
9
21
2
0
20
2
0
20
Cap
ita
l O
utla
y1
5
18
1
7
20
1
9
21
2
0
20
2
0
20
Gra
nts
amp A
ids
15
1
8
17
2
0
19
2
1
20
2
0
20
2
0
Tra
nsfe
rs1
60
0
0
00
0
0
00
0
0
00
0
0
00
0
0
Pro
jec
ted
Ec
on
om
ic C
on
dit
ion
s
In
dic
ato
rs
Con
su
me
r P
rice
In
de
x
c
ha
ng
e1
5
18
1
7
20
1
9
21
2
0
20
2
0
20
FL
Pe
r C
ap
ita
Pe
rso
na
l In
co
me
Gro
wth
20
2
2
22
1
8
14
1
5
17
1
6
16
1
6
F-12
TR
AN
SP
OR
TA
TIO
N T
RU
ST
FU
ND
FO
RE
CA
ST
Fu
nd
1001
(in
$ t
ho
us
an
ds
)A
ctu
al
Bu
dg
et
Es
tim
ate
dE
sti
ma
ted
Es
tim
ate
dE
sti
ma
ted
Es
tim
ate
dE
sti
ma
ted
Es
tim
ate
dE
sti
ma
ted
Es
tim
ate
dE
sti
ma
ted
Es
tim
ate
d
20
12
20
13
20
13
20
14
20
15
20
16
20
17
20
18
20
19
20
20
20
21
20
22
20
23
BE
GIN
NIN
G F
UN
D B
AL
AN
CE
14
77
22
13
96
30
17
70
77
16
28
75
13
71
37
10
32
10
60
58
3
74
37
(5
78
00
)
(13
42
92
)
(2
21
99
8)
(32
12
54
)
(4
32
41
2)
RE
VE
NU
ES
Nin
th C
en
t G
as T
ax
37
49
3
37
57
7
37
57
7
37
38
9
37
20
2
37
01
6
36
83
1
36
64
7
36
46
4
36
28
1
36
10
0
35
91
9
35
74
0
Sta
te S
ha
red
Ga
s T
axe
s9
31
90
9
24
20
9
24
20
9
24
20
9
19
58
9
14
98
9
10
41
9
05
85
9
01
32
8
96
82
8
92
33
8
87
87
8
83
43
Lo
ca
l O
ptio
n G
as T
ax
12
49
70
12
59
65
12
59
65
12
53
35
12
47
08
12
40
85
12
34
65
12
28
47
12
22
33
12
16
22
12
10
14
12
04
09
11
98
07
Inte
rest
42
2
5
00
50
0
5
00
13
71
2
06
4
18
18
2
23
-
-
-
-
-
Oth
er
reve
nu
es
23
99
0
15
05
4
15
05
4
15
35
5
15
66
2
15
97
5
16
29
5
16
62
1
16
95
3
17
29
2
17
63
8
17
99
1
18
35
1
Tra
nsfe
r fr
om
oth
er
Fu
nd
s-
1
50
00
1
50
00
1
50
00
1
50
00
1
50
00
1
50
00
1
50
00
1
50
00
1
50
00
1
50
00
1
50
00
1
50
00
Ad
just
Oth
er
Re
ve
nu
e t
o 9
8
49
1
5
01
53
8
5
70
57
2
5
32
53
5
5
46
55
7
5
68
57
9
TO
TA
L R
EV
EN
UE
S2
80
06
5
2
86
51
6
2
87
00
7
2
86
50
0
2
86
44
0
2
86
20
9
2
85
02
1
2
82
45
5
2
81
31
8
2
80
42
3
2
79
54
2
2
78
67
4
2
77
82
0
v
s p
rio
r ye
ar
2
2
0
0
0
0
-1
0
0
0
0
0
TO
TA
L R
ES
OU
RC
ES
42
77
87
42
61
46
46
40
84
44
93
75
42
35
77
38
94
18
34
56
04
28
98
92
22
35
18
14
61
31
57
54
5
(42
58
0)
(1
54
59
2)
EX
PE
ND
ITU
RE
S
Pe
rso
na
l S
erv
ice
s1
10
79
6
1
37
37
9
1
37
37
9
1
43
01
2
1
48
73
2
1
54
68
1
1
60
86
9
1
67
30
3
1
73
99
5
1
80
95
5
1
88
19
3
1
95
72
1
2
03
55
0
Op
era
tin
g E
xp
en
se
s
90
24
6
12
38
33
12
38
33
12
56
90
12
79
53
13
01
28
13
27
31
13
52
53
13
80
93
14
08
55
14
36
72
14
65
45
14
94
76
Cap
ita
l O
utla
y6
89
15
70
1
57
0
15
94
1
62
2
16
50
1
68
3
17
15
1
75
1
17
86
1
82
2
18
58
1
89
5
Gra
nts
amp A
ids
14
5
2
67
26
7
2
71
27
6
2
81
28
6
2
92
29
8
3
04
31
0
3
16
32
2
Fu
ll C
ost
Allo
ca
tio
n1
88
34
1
92
31
1
92
31
1
93
66
1
95
59
1
99
50
2
05
49
2
11
65
2
18
00
2
24
54
2
31
28
2
38
22
2
45
37
Tra
nsfe
rs t
o o
the
r F
un
ds
30
00
0
21
56
0
21
56
0
25
00
0
25
00
0
25
00
0
25
00
0
25
00
0
25
00
0
25
00
0
25
00
0
25
00
0
25
00
0
Exp
en
ditu
re L
ap
se
1
(26
30
)
(2
70
6)
(27
86
)
(2
86
7)
(29
56
)
(3
04
6)
(31
41
)
(3
23
9)
(33
40
)
(3
44
4)
(35
52
)
Po
ten
tia
l Is
su
es
a)
CIP
Op
era
tin
g I
mp
acts
(cu
mu
lative
)1
1
11
1
2
06
1
0
14
1
4
14
1
4
14
TO
TA
L E
XP
EN
DIT
UR
ES
25
07
10
30
38
40
30
12
10
31
22
38
32
03
67
32
88
35
33
81
68
34
76
92
35
78
10
36
81
29
37
87
99
38
98
32
40
12
42
v
s p
rio
r ye
ar
18
1
7
4
3
3
3
3
3
3
3
3
3
EN
DIN
G F
UN
D B
AL
AN
CE
17
70
77
12
23
06
16
28
75
13
71
37
10
32
10
60
58
3
74
37
(5
78
00
)
(13
42
92
)
(2
21
99
8)
(32
12
54
)
(4
32
41
2)
(55
58
33
)
AS
SU
MIN
G N
O A
CT
ION
TA
KE
N T
O
RE
SO
LV
E S
HO
RT
FA
LL
S
En
din
g b
ala
nce
as
of
Reso
urc
es
29
3
5
31
2
4
16
2
-2
0
-60
-1
52
-5
58
1
01
6
36
0
TO
TA
L R
EQ
UIR
EM
EN
TS
42
77
87
42
61
46
46
40
84
44
93
75
42
35
77
38
94
18
34
56
04
28
98
92
22
35
18
14
61
31
57
54
5
(42
58
0)
(1
54
59
2)
RE
VE
NU
E m
inu
s E
XP
EN
DIT
UR
ES
29
35
5
(17
32
4)
(1
42
02
)
(25
73
7)
(3
39
27
)
(42
62
6)
(5
31
47
)
(65
23
7)
(7
64
92
)
(87
70
5)
(9
92
56
)
(11
11
57
)
(1
23
42
2)
(NO
T c
um
ula
tive
)
no
te
no
n-r
ec
urr
ing
ex
pe
nd
itu
res
-
-
-
-
-
-
-
-
-
-
-
-
-
net
recu
rrin
g r
ev-
exp
29
355
(17
324
)
(14
202
)
(25
737
)
(33
927
)
(42
626
)
(53
147
)
(65
237
)
(76
492
)
(87
705
)
(99
256
)
(111
157
)
(123
422
)
O
pe
ratin
g E
xp
en
se
s n
et
of
Fu
ll C
ost
Allo
ca
tio
n
Exp
en
ditu
re la
pse
is c
alc
ula
ted
on
Pe
rso
na
l S
erv
ice
s
Op
era
tin
g E
xp
en
se
s
Cap
ita
l O
utla
y
an
d G
ran
ts amp
Aid
s o
nly
FO
RE
CA
ST
F-13
F-14
00
200
400
600
800
1000
1200
1400
1600
1800
2014
2015
2016
2017
2018
2019
2020
Dollars (millions)
Cap
ital
Pro
jects
Fu
nd
Fo
reca
st
FY
2014
-FY
2020
Revenues
Expenditure
s
F-15
CA
PIT
AL
PR
OJ
EC
TS
FU
ND
FO
RE
CA
ST
Fu
nd
3001
Fo
rec
as
t A
ss
um
pti
on
s2014
2015
2016
2017
2018
2019
2020
2021
2022
2023
RE
VE
NU
ES
Infr
astr
uctu
re S
ale
s T
ax
35
30
30
30
30
30
30
Nin
th C
ent
Gas T
ax (
from
Tra
nsp T
rust)
-05
-0
5
-05
-0
5
-05
-0
5
-05
Impact
Fees (
from
Specia
l R
evenue F
und)
97
111
750
143
00
00
00
Gra
nts
-454
-5
63
-5
65
2494
-4
60
451
-6
37
Tra
nsfe
r fr
om
TD
C F
und
35
30
30
30
30
30
30
Reim
burs
em
ents
00
00
00
00
00
00
00
Oth
er
revenues
20
20
20
20
20
20
20
EX
PE
ND
ITU
RE
S
na
Pro
jecte
d E
co
no
mic
Co
nd
itio
ns
Ind
icato
rs
Consum
er
Price I
ndex
c
hange
15
18
17
20
19
21
20
20
20
20
F-16
CA
PIT
AL
PR
OJ
EC
TS
FU
ND
FO
RE
CA
ST
Fu
nd
3001
(in
$ t
ho
usan
ds
)A
ctu
al
Bu
dg
et
Esti
mate
dE
sti
mate
dE
sti
mate
dE
sti
mate
dE
sti
mate
dE
sti
mate
dE
sti
mate
dE
sti
mate
dE
sti
mate
dE
sti
mate
dE
sti
mate
d
2012
2013
2013
2014
2015
2016
2017
2018
2019
2020
2021
2022
2023
BE
GIN
NIN
G F
UN
D B
AL
AN
CE
513
090
1183
981
811
543
229
618
323
598
225
659
266
472
231
680
279
197
353
804
-
RE
VE
NU
ES
Infr
astr
uctu
re S
ale
s T
ax
(Penny f
or
Pin
ella
s)
777
592
758
824
804
810
832
978
857
968
883
707
910
218
937
524
965
650
328
225
-
Gra
nts
105
006
326
930
326
930
178
459
77
908
33
921
118
510
63
975
92
825
33
715
Reim
burs
em
ents
-
-
-
Nin
th C
ent
Gas T
ax (
Tra
nsfe
r fr
om
Tra
nsport
ation T
rust
Fund)
30
000
21
560
21
560
25
000
25
000
25
000
25
000
25
000
25
000
25
000
Tra
nsport
ation I
mpact
Fees (
from
Specia
l R
evenue F
und)
10
547
16
407
16
407
18
000
20
000
35
000
40
000
40
000
40
000
40
000
Tra
nsfe
r fr
om
Genera
l F
und
8478
18
000
18
000
18
000
18
000
18
000
18
000
3000
3000
3000
Tra
nsfe
r fr
om
TD
C F
und
26
513
32
424
32
424
29
395
30
277
31
185
32
121
33
085
34
077
35
099
Tra
nsfe
r fr
om
Fire D
istr
icts
Suth
erland B
ayou M
arina M
itig
P
ymnt
297
Sale
-Surp
lus C
ounty
Land
366
Inte
rest
2563
2138
2138
1607
3
3236
0
4513
2
7994
2
6950
4
8375
9
10
614
1
Oth
er
revenues
1199
1200
1224
1248
1273
1299
1325
1351
1378
Reappro
priation o
f R
evenue-R
esta
tem
ent
-
-
-
-
-
-
-
-
-
-
Inte
rfund L
oan-S
olid
Waste
-Chill
er
-
75
000
Inte
rfund L
oan-S
olid
Waste
-
100
000
100
000
450
000
-
-
-
-
-
-
-
-
-
TO
TA
L R
EV
EN
UE
S962
561
1276
283
1398
469
1554
664
1033
637
1032
600
1153
142
1110
859
1170
280
477
031
-
-
-
v
s p
rior
year
TO
TA
L R
ES
OU
RC
ES
1475
651
2460
264
2210
012
1784
282
1357
235
1258
259
1419
614
1342
539
1449
477
830
835
-
-
-
EX
PE
ND
ITU
RE
S
Capital P
roje
cts
663
790
1962
594
1962
594
1442
884
1063
776
924
487
1121
434
861
842
894
473
401
483
Debt
Serv
ice o
n I
nte
rfund L
oan
318
2800
2800
2800
2800
2300
1500
1500
1200
500
Paym
ent
on S
W L
oan-C
hill
er
15
000
15
000
15
000
15
000
15
000
15
000
Paym
ent
on S
W L
oan
50
000
50
000
50
000
200
000
200
000
150
000
TO
TA
L E
XP
EN
DIT
UR
ES
664
108
1980
394
1980
394
1460
684
1131
576
991
787
1187
934
1063
342
1095
673
551
983
-
-
-
EN
DIN
G F
UN
D B
AL
AN
CE
811
543
479
870
229
618
323
598
225
659
266
472
231
680
279
197
353
804
278
852
-
-
-
TO
TA
L R
EQ
UIR
EM
EN
TS
1475
651
2460
264
2210
012
1784
282
1357
235
1258
259
1419
614
1342
539
1449
477
830
835
-
-
-
RE
VE
NU
E m
inu
s E
XP
EN
DIT
UR
ES
298
453
(704
111
)
(5
81
925
)
93
980
(9
7939
)
40
813
(3
4792
)
47
517
74
607
(7
4952
)
-
-
-
(NO
T c
um
ula
tive)
ne
t re
cu
rrin
g r
ev-
ex
p2
98
45
3
(70
41
11
)
(5
81
92
5)
93
98
0
(9
79
39
)
40
81
3
(3
47
92
)
47
51
7
7
46
07
(74
95
2)
-
-
-
Note
F
Y2021 a
nd F
Y2022 n
ot
inclu
ded a
s P
enny f
or
Pin
ella
s is a
uth
orized o
nly
thro
ugh a
port
ion o
f F
Y2020
FO
RE
CA
ST
F-17
F-18
600
700
800
900
1000
1100
1200
1300
1400
1500
2014
2015
2016
2017
2018
2019
2020
2021
2022
2023
Dollars (millions) E
me
rge
nc
y M
ed
ica
l S
erv
ice
s F
un
d F
ore
ca
st
FY
20
14
- F
Y2
02
3
RE
VE
NU
ES
E
XP
EN
DIT
UR
ES
F-19
EM
ER
GE
NC
Y M
ED
ICA
L S
ER
VIC
ES
FU
ND
FO
RE
CA
ST
Fu
nd
10
06
Fo
rec
as
t A
ss
um
pti
on
s2014
2015
2016
2017
2018
2019
2020
2021
2022
2023
RE
VE
NU
ES
Ad V
alo
rem
Revenue (
95
)25
25
30
30
30
30
30
30
30
30
Am
bula
nce S
vc C
ontr
act F
ees
20
20
20
20
20
20
20
20
20
20
Am
bula
nce A
nnual M
em
bers
Fees
00
00
00
00
00
00
00
00
00
00
Gra
nt R
evenue (
EM
S T
rust F
und)
20
20
20
20
20
20
20
20
20
20
Oth
er
revenues (
ref of prior
yrs
exp)
00
00
00
00
00
00
00
00
00
00
EX
PE
ND
ITU
RE
S
Pers
onal S
erv
ices
41
40
40
40
40
40
40
40
40
40
Opera
ting E
xpenses
15
18
17
20
19
21
20
20
20
20
Opera
ting E
xpenses-F
irst R
esp M
ed S
upplie
s30
30
30
30
30
30
30
30
30
30
Capital O
utlay
15
18
17
20
19
21
20
20
20
20
Am
bula
nce C
ontr
act
60
60
60
60
60
60
60
60
60
60
EM
S T
rust F
und G
rant E
xpenditure
s20
20
20
20
20
20
20
20
20
20
Gra
nts
amp A
ids (
First R
esponder
Agm
ts)
50
50
50
50
50
50
50
50
50
50
Pro
jecte
d E
co
no
mic
Co
nd
itio
ns In
dic
ato
rs
Consum
er
Price Index
change
15
18
17
20
19
21
20
20
20
20
FL P
er
Capita P
ers
onal I
ncom
e G
row
th20
22
22
18
14
15
17
16
16
16
Estim
ate
d N
ew
Constr
uctio
n
of ta
x b
ase
05
05
10
10
10
10
10
10
10
10
F-20
EM
ER
GE
NC
Y M
ED
ICA
L S
ER
VIC
ES
FU
ND
FO
RE
CA
ST
Fu
nd
10
06
(in
$ t
ho
usan
ds)
Actu
al
Bu
dg
et
Esti
mate
dE
sti
mate
dE
sti
mate
dE
sti
mate
dE
sti
mate
dE
sti
mate
dE
sti
mate
dE
sti
mate
dE
sti
mate
dE
sti
mate
dE
sti
mate
d
2012
2013
2013
2014
2015
2016
2017
2018
2019
2020
2021
2022
2023
BE
GIN
NIN
G F
UN
D B
AL
AN
CE
213
713
212
463
236
861
228
126
193
023
130
444
40
697
(80
635
)
(235
598
)
(425
541
)
(652
971
)
(920
627
)
(1231
417
)
RE
VE
NU
ES
Ad V
alo
rem
Revenue
95
422
112
438
521
438
521
449
484
460
721
474
543
488
779
503
442
518
546
534
102
550
125
566
629
583
628
Am
bula
nce S
vc C
ontr
act F
ees
95
439
968
415
266
423
571
432
043
440
684
449
497
458
487
467
657
477
010
486
550
496
281
506
207
516
331
Am
bula
nce A
nnual M
em
bers
Fees
2225
1995
1995
1995
1995
1995
1995
1995
1995
1995
1995
1995
1995
Gra
nt R
evenue (
EM
S T
rust F
und)
159
2000
2000
2040
2081
2122
2165
2208
2252
2297
2343
2390
2438
Cty
Off F
ees (
TC
amp P
A)
2918
2676
2676
2703
2730
2757
2785
2813
2841
2869
2898
2927
2956
Inte
rest
1348
1360
1360
1370
1930
2609
1221
-
-
-
-
-
-
Oth
er
revenues (
refu
nd o
f prior
yrs
exp)
588
256
256
256
256
256
256
256
256
256
256
256
256
A
dju
st T
ax R
evenues to 9
6
-
4616
4731
4850
4995
5145
5299
5458
5622
5791
5965
6143
A
dju
st A
mbula
nce R
evenues to 1
00
-
22
398
22
846
23
303
23
769
24
245
24
729
25
224
25
729
26
243
26
768
27
303
TO
TA
L R
EV
EN
UE
S869
318
862
074
897
394
917
468
938
549
962
544
985
077
1008
400
1033
582
1059
420
1085
932
1113
136
1141
051
v
s p
rior
yea
r16
-1
3
2
2
3
2
2
2
2
3
3
3
TO
TA
L R
ES
OU
RC
ES
1083
031
1074
537
1134
255
1145
593
1131
573
1092
988
1025
775
927
765
797
984
633
879
432
961
192
510
(90
366
)
EX
PE
ND
ITU
RE
S
Pers
onal S
erv
ices
27
036
28
849
28
849
30
032
31
233
32
482
33
782
35
133
36
538
38
000
39
520
41
101
42
745
Opera
ting E
xpenses
43
723
58
678
58
678
59
558
60
630
61
661
62
894
64
089
65
435
66
744
68
079
69
440
70
829
O
pera
ting E
xpenses -
First R
esponder
Medic
al S
upplie
s
10
885
12
360
12
360
12
731
13
113
13
506
13
911
14
329
14
758
15
201
15
657
16
127
16
611
Capital O
utlay
4699
7900
7900
8019
8163
8302
8468
8629
8810
8986
9166
9349
9536
Am
bula
nce C
ontr
act
366
575
382
000
382
000
404
920
429
215
454
968
482
266
511
202
541
874
574
387
608
850
645
381
684
104
EM
S T
rust F
und G
rant E
xpenditure
s159
2000
2000
2040
2081
2122
2165
2208
2252
2297
2343
2390
2438
Gra
nts
amp A
ids (
First R
esponder
Agm
ts)
381
984
401
566
401
566
421
644
442
727
464
863
488
106
512
511
538
137
565
044
593
296
622
961
654
109
Trf
rs to P
A amp
TC
11
109
12
776
12
776
13
626
13
967
14
386
14
818
15
262
15
720
16
192
16
677
17
178
17
693
Expenditure
Lapse 1
A
mt
Inclu
de
s E
cke
rd C
on
tra
ct
TO
TA
L E
XP
EN
DIT
UR
ES
846
170
906
129
906
129
952
570
1001
128
1052
291
1106
410
1163
363
1223
525
1286
850
1353
588
1423
926
1498
064
v
s p
rior
yea
r1
7
7
5
5
5
5
5
5
5
5
5
5
EN
DIN
G F
UN
D B
AL
AN
CE
236
861
168
408
228
126
193
023
130
444
40
697
(80
635
)
(235
598
)
(425
541
)
(652
971
)
(920
627
)
(1231
417
)
(1588
430
)
Endin
g b
ala
nce a
s
of E
xpenditure
s280
186
252
203
130
39
-7
3
-203
-3
48
-5
07
-6
80
-8
65
-1
060
TO
TA
L R
EQ
UIR
EM
EN
TS
1083
031
1074
537
1134
255
1145
593
1131
573
1092
988
1025
775
927
765
797
984
633
879
432
961
192
510
(90
366
)
RE
VE
NU
E m
inu
s E
XP
EN
DIT
UR
ES
23
148
(44
055
)
(8735
)
(35
102
)
(62
579
)
(89
747
)
(121
332
)
(154
963
)
(189
943
)
(227
430
)
(267
656
)
(310
790
)
(357
013
)
(NO
T c
um
ula
tive)
no
te
no
n-r
ec
urr
ing
exp
en
dit
ure
s-
-
-
-
-
-
-
-
-
-
-
-
-
ne
t re
cu
rrin
g r
ev-
ex
p2
31
48
(44
05
5)
(87
35
)
(35
10
2)
(62
57
9)
(89
74
7)
(12
13
32
)
(15
49
63
)
(18
99
43
)
(22
74
30
)
(26
76
56
)
(31
07
90
)
(35
70
13
)
1)
FY
2013 r
eflects
the n
ew
ord
inance p
assed b
y B
oard
action o
n D
ecem
ber
20th
2011 to
main
tain
as c
lose a
s p
ossib
le a 2
5
Begin
nin
g F
und B
ala
nce P
erc
enta
ge o
f re
serv
e b
ala
nce d
eclin
es g
oin
g into
FY
2014 a
nd is d
eple
ted in F
Y2017
2)
EM
S M
illage incre
ased fro
m 0
5832 in F
Y11 to 0
8506 in F
Y12 is
then incre
ased to 0
9158 in F
Y13 and then a
ssum
ed to r
em
ain
fla
t th
roughout th
e r
em
ain
der
of th
e fore
cast period M
axim
um
annual E
MS
levy is 1
5000 m
ills
3)
Assum
es e
stim
ate
d A
d V
alo
rem
revenue is a
t 96
except th
e F
Y13 A
dopte
d B
udget w
hic
h r
em
ain
s a
t 95
per
sta
tute
4)
Assum
es e
stim
ate
d a
mbula
nce r
evenue is a
t 100
except th
e F
Y13 A
dopte
d B
udget w
hic
h r
em
ain
s a
t 95
per
sta
tute
5)
The F
irst R
esponder
Agre
em
ents
reflect a 5
incre
ase in F
Y2013 a
nd the r
em
ain
ing fore
cast years
T
his
does n
ot re
flect any c
hanges in s
erv
ice
6)
The E
xpenditure
lapse is n
ot calc
ula
ted o
n this
fund a
s the m
ajo
rity
of th
e e
xpenditure
s w
ithin
this
fund a
re c
ontr
actu
al and a
re fully
expended e
ach y
ear
FO
RE
CA
ST
(
96
Ad
Valo
rem
Reven
ue a
nd
100
Am
bu
lan
ce R
even
ue)
F-21
F-22
100
120
140
160
180
200
220
240
2014
2015
2016
2017
2018
2019
2020
2021
2022
2023
Dollars (millions)
Fir
e D
istr
icts
Fu
nd
Fo
rec
as
t F
Y2
01
4 -
FY
20
23
RE
VE
NU
ES
E
XP
EN
DIT
UR
ES
F-23
FIR
E D
IST
RIC
TS
FU
ND
FO
RE
CA
ST
Fu
nd
10
50
Fo
rec
as
t A
ss
um
pti
on
s2014
2015
2016
2017
2018
2019
2020
2021
2022
2023
RE
VE
NU
ES
Ad V
alo
rem
Tax R
evenue
20
20
25
25
25
25
25
25
25
25
EX
PE
ND
ITU
RE
S
Pers
onal S
erv
ices
41
40
40
40
40
40
40
40
40
40
Opera
ting E
xpenses
15
18
17
20
19
21
20
20
20
20
Capital O
utlay
15
18
17
20
19
21
20
20
20
20
Debt S
erv
ice
00
00
00
00
00
00
00
00
00
00
Gra
nts
amp A
ids (
Cty
Pym
ts)
40
40
40
40
40
40
40
40
40
40
Pro
jecte
d E
co
no
mic
Co
nd
itio
ns In
dic
ato
rs
Consum
er
Price Index
change
15
18
17
20
19
21
20
20
20
20
FL P
er
Capita P
ers
onal I
ncom
e G
row
th20
22
22
18
14
15
17
16
16
16
Estim
ate
d N
ew
Constr
uctio
n
of ta
x b
ase
05
05
10
10
10
10
10
10
10
10
F-24
FIR
E D
IST
RIC
TS
FU
ND
FO
RE
CA
ST
Fu
nd
10
50
(in
$ t
ho
usan
ds)
Actu
al
Bu
dg
et
Esti
mate
dE
sti
mate
dE
sti
mate
dE
sti
mate
dE
sti
mate
dE
sti
mate
dE
sti
mate
dE
sti
mate
dE
sti
mate
dE
sti
mate
dE
sti
mate
d
2012
2013
2013
2014
2015
2016
2017
2018
2019
2020
2021
2022
2023
BE
GIN
NIN
G F
UN
D B
AL
AN
CE
84
213
79
934
85
039
89
924
92
274
92
046
90
481
87
379
81
567
72
793
60
793
45
284
25
967
RE
VE
NU
ES
Ad V
alo
rem
Revenue
95
150
180
148
220
148
220
151
184
154
208
158
063
162
015
166
065
170
217
174
472
178
834
183
305
187
888
Cty
Off F
ees (
TC
amp P
A)
1079
949
949
968
987
1007
1027
1048
1069
1090
1112
1134
1157
Oth
er
Rev (
Inte
rest G
ain
Loss Inv)
535
538
538
629
923
1841
2714
2621
2447
2184
1824
1359
779
Inte
rest -
Tax C
olle
cto
r01
01
01
01
01
01
01
01
01
01
01
01
01
Adju
st P
ropert
y T
axes to
96
1560
1591
1623
1664
1705
1748
1792
1837
1882
1930
1978
Adju
st O
ther
Revenue to 1
00
78
84
101
150
197
193
185
172
155
131
102
TO
TA
L R
EV
EN
UE
S151
795
149
708
151
347
154
458
157
843
162
726
167
660
171
677
175
711
179
756
183
808
187
860
191
904
v
s p
rior
yea
r4
-1
0
2
2
3
3
2
2
2
2
2
2
TO
TA
L R
ES
OU
RC
ES
236
008
229
642
236
386
244
382
250
117
254
773
258
142
259
056
257
278
252
549
244
601
233
144
217
872
EX
PE
ND
ITU
RE
S
Pers
onal S
erv
ices
800
1301
1301
1354
1409
1465
1523
1584
1648
1714
1782
1854
1928
Opera
ting E
xpenditure
s1722
1344
1344
1364
1389
1412
1441
1468
1499
1529
1559
1591
1622
C
urr
Chgs amp
Oblig
(C
ty F
ire A
dm
in C
hgs)
2448
2645
2645
2685
2733
2779
2835
2889
2950
3009
3069
3130
3193
Debt S
erv
ice
-
05
05
05
05
05
05
05
05
05
05
05
05
Gra
nts
amp A
ids (
City P
aym
ents
)144
037
139
232
139
232
144
801
150
593
156
617
162
882
169
397
176
173
183
220
190
549
198
171
206
097
Trf
rs to P
A amp
TC
4410
4580
4580
4583
4675
4792
4912
5034
5160
5289
5421
5557
5696
Pro
-Rate
Cle
aring (
County
Fire A
dm
in C
hgs)
(2448
)
(2645
)
(2645
)
(2685
)
(2733
)
(2779
)
(2835
)
(2889
)
(2950
)
(3009
)
(3069
)
(3130
)
(3193
)
Expenditure
Lapse 1
TO
TA
L E
XP
EN
DIT
UR
ES
150
969
146
462
146
462
152
108
158
071
164
291
170
762
177
489
184
485
191
756
199
317
207
177
215
348
v
s p
rior
yea
r1
-3
-3
4
4
4
4
4
4
4
4
4
4
EN
DIN
G F
UN
D B
AL
AN
CE
85
039
83
180
89
924
92
274
92
046
90
481
87
379
81
567
72
793
60
793
45
284
25
967
2523
Endin
g b
ala
nce a
s
of R
esourc
es
360
362
380
378
368
355
338
315
283
241
185
111
12
TO
TA
L R
EQ
UIR
EM
EN
TS
236
008
229
642
236
386
244
382
250
117
254
773
258
142
259
056
257
278
252
549
244
601
233
144
217
872
RE
VE
NU
E m
inu
s E
XP
EN
DIT
UR
ES
826
3246
4885
2350
(227
)
(1565
)
(3102
)
(5812
)
(8774
)
(12
000
)
(15
509
)
(19
317
)
(23
444
)
(NO
T c
um
ula
tive)
no
te
no
n-r
ecu
rrin
g e
xp
en
dit
ure
s-
-
-
-
-
-
-
-
-
-
-
-
-
ne
t re
cu
rrin
g r
ev-
ex
p8
26
32
46
48
85
23
50
(22
7)
(15
65
)
(31
02
)
(58
12
)
(87
74
)
(12
00
0)
(15
50
9)
(19
31
7)
(23
44
4)
E
xpenditure
lapse is
not calc
ula
ted o
n this
fund a
s the m
ajo
rity
of th
e e
xpenditure
s w
ithin
this
fund a
re c
ontr
actu
al a
nd a
re fully
expended e
ach y
ear
1)
Assum
es e
stim
ate
d A
d V
alo
rem
revenue is a
t 96
except th
e F
Y13 A
dopte
d B
udget w
hic
h r
em
ain
s a
t 95
per
sta
tute
FO
RE
CA
ST
(
96
Ad
Valo
rem
Reven
ue a
nd
100
Oth
er
Reven
ue)
F-25
F-26
$0
0
$2
0
$4
0
$6
0
$8
0
$1
00
$1
20
$1
40
20
13
2
01
4
20
15
2
01
6
20
17
2
01
8
20
19
2
02
0
20
21
2
02
2
20
23
Millions A
irp
ort
Fu
nd
Fo
reca
st
FY2
01
3 -
FY
20
23
Ex
clu
din
g N
on
-Re
curr
ing
Rev
en
ue
s an
d E
xpe
nd
itu
res
Rev
enu
es
Exp
end
itu
res
F-27
AIR
PO
RT
FU
ND
FO
RE
CA
ST
Fu
nd
40
01
Fo
recast
Assu
mp
tio
ns
2014
2015
2016
2017
2018
2019
2020
2021
2022
2023
RE
VE
NU
ES
Airfield
Flig
ht
Lin
es
20
20
20
20
20
20
20
20
20
20
Golf C
ours
e00
00
00
00
00
00
00
00
00
00
Rents
LeasesC
oncessio
ns
20
20
20
20
20
20
20
20
20
20
Capital C
ontr
ibutions
-370
-1
41
391
-3
0
1291
-8
24
00
00
00
00
Oth
er
revenues
20
20
20
20
20
20
20
20
20
20
EX
PE
ND
ITU
RE
S
Pers
onal S
erv
ices
41
40
40
40
40
40
40
40
40
40
Opera
ting E
xpenses
15
18
17
20
19
21
20
20
20
20
Capital O
utlay
15
18
17
20
19
21
20
20
20
20
Gra
nts
amp A
ids
15
18
17
20
19
21
20
20
20
20
Pro
jecte
d E
co
no
mic
Co
nd
itio
ns
Ind
icato
rs
Consum
er
Price I
ndex
c
hange
15
18
17
20
19
21
20
20
20
20
FL P
er
Capita P
ers
onal In
com
e G
row
th20
22
22
18
14
15
17
16
16
16
F-28
AIR
PO
RT
FU
ND
FO
RE
CA
ST
Fu
nd
40
01
(in
$ t
ho
usan
ds
)A
ctu
al
Bu
dg
et
Esti
mate
dE
sti
mate
dE
sti
mate
dE
sti
mate
dE
sti
mate
dE
sti
mate
dE
sti
mate
dE
sti
mate
dE
sti
mate
dE
sti
mate
dE
sti
mate
d
2012
2013
2013
2014
2015
2016
2017
2018
2019
2020
2021
2022
2023
BE
GIN
NIN
G F
UN
D B
AL
AN
CE
146
350
136
909
157
937
141
502
146
618
141
557
139
653
119
666
117
424
124
073
129
864
134
705
138
499
RE
VE
NU
ES
Airfield
Flig
ht
Lin
es
25
776
25
452
26
792
27
328
27
874
28
432
29
001
29
581
30
172
30
776
31
391
32
019
32
659
Golf C
ours
e-
-
-
-
-
-
-
-
-
-
-
-
-
Rents
LeasesC
oncessio
ns
71
425
61
530
64
768
66
063
67
385
68
732
70
107
71
509
72
939
74
398
75
886
77
404
78
952
New
Pro
pert
y D
evelo
pm
ent
-
-
-
-
-
-
-
3300
3366
3433
3502
3572
3643
Gra
nts
2754
2650
2650
2703
2757
2812
2868
2926
2984
3044
3105
3167
3230
Capital C
ontr
ibutions
88
893
101
642
101
642
64
050
55
000
76
500
74
200
170
000
30
000
30
000
30
000
30
000
30
000
Inte
rest
743
889
889
991
1466
2831
4190
3590
3523
3722
3896
4041
4155
Oth
er
revenues
288
18
18
18
19
19
19
20
20
21
21
22
22
TO
TA
L R
EV
EN
UE
S189
879
192
181
196
759
161
153
154
501
179
327
180
385
280
925
143
005
145
394
147
801
150
224
152
662
44
4
-18
-4
16
1
56
-49
2
2
2
2
TO
TA
L R
ES
OU
RC
ES
336
229
329
090
354
695
302
655
301
119
320
883
320
038
400
591
260
428
269
467
277
665
284
929
291
161
EX
PE
ND
ITU
RE
S
Pers
onal S
erv
ices
41
940
43
250
43
250
45
023
46
824
48
697
50
645
52
671
54
778
56
969
59
248
61
617
64
082
Opera
ting E
xpenses
34
541
42
394
42
394
43
030
43
804
44
549
45
440
46
303
47
276
48
221
49
186
50
170
51
173
Golf C
ours
e O
pera
tions
main
tenance
-
-
-
-
-
-
-
-
-
-
-
-
-
Capital O
utlay
2665
1451
1451
1473
1499
1525
1555
1585
1618
1650
1683
1717
1751
Full
Cost
Allo
cation
4552
5111
5111
5147
5198
5302
5461
5625
5794
5968
6147
6331
6521
No
n-r
ecu
rrin
g C
IP e
xp
en
dit
ure
s94
594
123
600
123
600
64
050
65
000
84
000
100
200
180
000
30
000
30
000
30
000
30
000
30
000
Expenditure
Lapse 3
-
(2
613
)
(2
686
)
(2
764
)
(2
843
)
(2
929
)
(3
017
)
(3
110
)
(3
205
)
(3
304
)
(3
405
)
(3
510
)
TO
TA
L E
XP
EN
DIT
UR
ES
178
292
215
806
213
193
156
037
159
562
181
230
200
372
283
167
136
355
139
603
142
960
146
430
150
017
48
20
-27
2
14
11
41
-52
2
2
2
2
EN
DIN
G F
UN
D B
AL
AN
CE
157
937
113
284
141
502
146
618
141
557
139
653
119
666
117
424
124
073
129
864
134
705
138
499
141
144
AS
SU
MIN
G N
O A
CT
ION
TA
KE
N T
O
RE
SO
LV
E S
HO
RT
FA
LL
S
Endin
g b
ala
nce a
s
of
Resourc
es
47
34
40
48
47
44
37
29
48
48
49
49
48
TO
TA
L R
EQ
UIR
EM
EN
TS
336
229
329
090
354
695
302
655
301
119
320
883
320
038
400
591
260
428
269
467
277
665
284
929
291
161
RE
VE
NU
E m
inu
s E
XP
EN
DIT
UR
ES
11
587
(2
3625
)
(16
434
)
5116
(5
061
)
(1
903
)
(1
9987
)
(2242
)
6649
5791
4841
3794
2645
no
te
no
n-r
ecu
rrin
g C
IP e
xp
en
dit
ure
s94
594
123
600
123
600
64
050
65
000
84
000
100
200
180
000
30
000
30
000
30
000
30
000
30
000
no
n-r
ecu
rrin
g r
ev(c
ap
ital
co
ntr
ib)
(88
893
)
(101
642
)
(1
01
642
)
(6
4050
)
(55
000
)
(76
500
)
(74
200
)
(170
000
)
(3
0000
)
(30
000
)
(30
000
)
(30
000
)
(30
000
)
net
recu
rrin
g r
ev-
exp
17
288
(1
667
)
5524
5116
4939
5597
6013
7758
6649
5791
4841
3794
2645
O
pera
ting E
xpenses n
et
of
Full
Cost
Allo
cation
Expenditure
la
pse is c
alc
ula
ted o
n P
ers
onal S
erv
ices
Opera
ting E
xpenses
Capital O
utla
y
and G
rants
amp A
ids o
nly
FY
11 la
pse is u
sed t
o a
dju
st
for
update
d info
rmation
FO
RE
CA
ST
F-29
F-30
700
800
900
1000
1100
2014
2015
2016
2017
2018
2019
2020
2021
2022
2023
Dollars (millions)
Wa
ter
Sys
tem
Fu
nd
s F
ore
ca
st
FY
20
14
- F
Y2
02
3
wit
h R
ate
In
cre
as
es
Re
ve
nu
es
Exp
en
ditu
res
F-31
WA
TE
R F
UN
DS
FO
RE
CA
ST
Fu
nd
40
31
4
03
3
40
34
amp 4
03
6
Fo
rec
as
t A
ss
um
pti
on
s2014
2015
2016
2017
2018
2019
2020
2021
2022
2023
RE
VE
NU
ES
~W
ate
r S
ale
s-R
eta
il
20
20
20
21
22
23
23
23
23
23
Wate
r S
ale
s-W
hole
sale
-9
3
-49
-3
73
20
20
20
20
20
20
20
Oth
er
revenues
-29
-2
1
-11
-2
7
-09
20
20
20
20
20
~E
XP
EN
DIT
UR
ES
Pers
onal S
erv
ices
41
40
40
40
40
40
40
40
40
40
Opera
ting E
xpenses
20
23
18
17
17
18
17
19
21
21
Purc
hase o
f W
ate
r
10
21
08
16
10
25
25
25
25
25
Pow
er
00
50
50
50
50
50
50
50
50
50
Chem
icals
70
70
70
70
70
70
70
70
70
70
Pro
jecte
d E
co
no
mic
Co
nd
itio
ns In
dic
ato
rs
Consum
er
Price Index
change
15
18
17
20
19
21
20
20
20
20
FL P
er
Capita P
ers
onal I
ncom
e G
row
th20
22
22
18
14
15
17
16
16
16
R
evenue p
erc
enta
ges r
eflect th
e c
om
bin
ed im
pact of changes in r
ate
s a
ndo
r le
vels
of consum
ption
P
urc
hase o
f w
ate
r perc
enta
ges r
eflect th
e c
om
bin
ed im
pact of changes in T
am
pa B
ay W
ate
r ra
tes a
ndo
r changes in c
onsum
ption inclu
din
g d
ecre
ases in w
hole
sale
custo
mer
base
]
F-32
WA
TE
R F
UN
DS
FO
RE
CA
ST
Fu
nd
40
31
4
03
3
40
34
amp 4
03
6
(in
$ t
ho
usan
ds)
Actu
al
Bu
dg
et
Esti
mate
dE
sti
mate
dE
sti
mate
dE
sti
mate
dE
sti
mate
dE
sti
mate
dE
sti
mate
dE
sti
mate
dE
sti
mate
dE
sti
mate
dE
sti
mate
d
2012
2013
2013
2014
2015
2016
2017
2018
2019
2020
2021
2022
2023
BE
GIN
NIN
G F
UN
D B
AL
AN
CE
468
844
399
838
470
872
377
252
233
322
262
562
305
749
226
890
211
312
231
236
246
972
258
488
266
057
RE
VE
NU
ES
Wate
r S
ale
s -
Reta
il614
408
620
787
653
460
666
831
680
201
693
805
708
315
723
775
740
230
757
054
774
255
791
840
810
053
Wate
r S
ale
s -
Whole
sale
171
563
150
556
158
480
143
667
136
663
85
730
87
445
89
194
90
977
92
797
94
653
96
546
98
477
Inte
r est
2022
1791
1886
2641
2333
5251
9172
6807
6339
6937
7409
7755
7982
Oth
er
Revenues
60
514
40
925
43
079
41
845
40
954
40
495
39
420
39
060
39
069
39
079
39
088
39
098
39
098
TO
TA
L R
EV
EN
UE
S848
507
814
059
856
904
854
983
860
151
825
281
844
353
858
836
876
616
895
867
915
405
935
239
955
609
v
s p
rior
year
1
0
1
-4
2
2
2
2
2
2
2
TO
TA
L R
ES
OU
RC
ES
1317
351
1213
897
1327
776
1232
235
1093
473
1087
843
1150
102
1085
725
1087
929
1127
103
1162
377
1193
727
1221
666
EX
PE
ND
ITU
RE
S
Pers
onal S
erv
ices
123
054
126
772
126
772
131
970
137
248
142
738
148
448
154
386
160
561
166
984
173
663
180
609
187
834
OP
EB
11
862
13
333
13
333
13
880
14
435
15
012
15
613
16
237
16
887
17
562
18
264
18
995
19
755
Opera
ting E
xpenses
43
056
66
557
66
557
67
888
69
449
70
700
71
901
73
124
74
440
75
705
77
144
78
764
80
418
Purc
hase o
f W
ate
r472
008
454
472
454
472
420
906
423
097
383
991
388
292
390
406
401
079
412
042
423
303
434
870
445
741
Pow
er
17
439
18
628
18
628
18
628
19
560
20
538
21
565
22
643
23
775
24
964
26
212
27
523
28
899
Chem
icals
6777
7745
7745
8287
8867
9488
10
152
10
863
11
623
12
437
13
307
14
239
15
236
Gra
nts
amp A
ids
9782
9388
9388
9593
9198
9704
10
218
10
782
11
397
12
308
12
937
13
767
14
593
Cost A
llocation
86
548
57
117
57
117
58
259
59
599
60
672
61
703
62
752
63
882
64
968
66
202
67
593
69
012
Expenditure
Lapse
-
(7540
)
(7294
)
(7415
)
(7128
)
(7279
)
(7412
)
(7636
)
(7870
)
(8110
)
(8364
)
(8615
)
Debt S
erv
ice
81
100
100
-
-
-
-
-
-
-
-
-
-
Capital O
utlay
75
872
185
097
203
952
276
797
96
871
76
380
202
599
140
633
100
685
101
030
100
966
99
674
99
769
TO
TA
L E
XP
EN
DIT
UR
ES
846
479
939
209
950
524
998
914
830
910
782
094
923
212
874
413
856
693
880
131
903
889
927
670
952
642
v
s p
rior
year
-4
14
5
-17
-6
18
-5
-2
3
3
3
3
TO
TA
L E
ND
ING
FU
ND
BA
LA
NC
E470
872
274
688
377
252
233
322
262
562
305
749
226
890
211
312
231
236
246
972
258
488
266
057
269
024
Endin
g b
ala
nce a
s
of R
esourc
es
36
23
28
19
24
28
20
19
21
22
22
22
22
TO
TA
L R
EQ
UIR
EM
EN
TS
1317
351
1213
897
1327
776
1232
235
1093
473
1087
843
1150
102
1085
725
1087
929
1127
103
1162
377
1193
727
1221
666
RE
VE
NU
E m
inu
s E
XP
EN
DIT
UR
ES
2028
(125
150
)
(93
619
)
(143
931
)
29
241
43
187
(78
859
)
(15
578
)
19
924
15
736
11
516
7569
2967
(NO
T c
um
ula
tive)
E
xpenditure
lapse o
f 1
is c
alc
ula
ted o
n a
ll expenses e
xclu
din
g D
ebt S
erv
ice a
nd C
aptia
l Outa
y
Reven
ues r
efl
ect
the c
om
bin
ed
im
pact
of
ch
an
ges in
rate
s a
nd
or
levels
of
co
nsu
mp
tio
n
Estim
ate
d r
evenues fore
caste
d a
t 100
FO
RE
CA
ST
(
100
)
]
F-33
F-34
550
600
650
700
750
800
850
900
950
2014
2015
2016
2017
2018
2019
2020
2021
2022
2023
Dollars (millions)
Se
we
r S
ys
tem
Fo
rec
as
t F
Y2
01
4-F
Y2
02
3 w
ith
Ra
te I
nc
rea
se
s
Revenue
s
Expend
iture
s
F-35
SE
WE
R F
UN
DS
FO
RE
CA
ST
Fu
nd
4051
4052
4053
amp 4
055
Fo
recast
Assu
mp
tio
ns
20
14
20
15
20
16
20
17
20
18
20
19
20
20
20
21
20
22
20
23
RE
VE
NU
ES
Se
we
r C
ha
rge
s -
Re
tail
60
6
0
28
2
8
29
2
9
29
2
9
29
2
9
Se
we
r C
ha
rge
s -
Wh
ole
sa
le
90
9
0
28
2
8
29
3
0
30
3
0
30
3
0
Recla
ime
d -
Re
tail
59
5
6
27
2
8
27
2
8
27
2
8
27
2
7
Recla
ime
d -
Wh
ole
sa
le
20
2
0
20
2
0
20
2
0
20
2
0
20
2
0
Oth
er
reve
nu
es
00
0
0
00
0
0
00
0
0
00
0
0
00
0
0
EX
PE
ND
ITU
RE
S
Pe
rso
na
l S
erv
ice
s4
1
40
4
0
40
4
0
40
4
0
40
4
0
40
Op
era
tin
g E
xp
en
se
s2
0
23
1
8
17
1
7
18
1
7
19
2
1
21
Po
we
r0
0
50
5
0
50
5
0
50
5
0
50
5
0
50
Che
mic
als
70
7
0
70
7
0
70
7
0
70
7
0
70
7
0
Pro
jec
ted
Ec
on
om
ic C
on
dit
ion
s
In
dic
ato
rs
Con
su
me
r P
rice
In
de
x
c
ha
ng
e1
5
18
1
7
20
1
9
21
2
0
20
2
0
20
FL
Pe
r C
ap
ita
Pe
rso
na
l In
co
me
Gro
wth
20
2
2
22
1
8
14
1
5
17
1
6
16
1
6
R
eve
nu
e p
erc
en
tag
es r
efle
ct
the
co
mb
ine
d im
pa
ct
of
ch
an
ge
s in
ra
tes a
nd
or
leve
ls o
f co
nsu
mp
tio
n
F-36
SE
WE
R F
UN
DS
FO
RE
CA
ST
Fu
nd
4051
4052
4053
amp 4
055
(in
$ t
ho
us
an
ds
)A
ctu
al
Bu
dg
et
Es
tim
ate
dE
sti
ma
ted
Es
tim
ate
dE
sti
ma
ted
Es
tim
ate
dE
sti
ma
ted
Es
tim
ate
dE
sti
ma
ted
Es
tim
ate
dE
sti
ma
ted
Es
tim
ate
d
20
12
20
13
20
13
20
14
20
15
20
16
20
17
20
18
20
19
20
20
20
21
20
22
20
23
BE
GIN
NIN
G F
UN
D B
AL
AN
CE
53
19
65
47
58
45
49
87
60
37
52
76
37
98
17
43
50
12
48
44
76
53
16
74
57
54
45
63
35
13
69
87
40
77
08
03
84
94
28
RE
VE
NU
ES
Se
we
r C
ha
rge
s -
Re
tail
49
04
23
48
38
97
50
93
65
53
99
28
57
23
23
58
80
62
60
45
87
62
19
39
64
01
61
65
89
14
67
82
15
69
80
80
71
83
24
Se
we
r C
ha
rge
s -
Wh
ole
sa
le6
73
06
6
73
96
7
09
44
7
73
28
8
42
88
8
66
06
8
90
50
9
16
29
9
43
48
9
71
48
1
00
03
0
1
02
99
8
1
06
08
8
Recla
ime
d -
Re
tail
38
50
5
39
25
5
41
32
1
43
75
2
46
18
3
47
45
3
48
75
8
50
09
8
51
47
6
52
89
2
54
34
6
55
84
1
57
34
8
Recla
ime
d -
Wh
ole
sa
le3
17
1
31
60
3
32
7
33
27
3
32
7
33
27
3
32
7
33
27
3
32
7
33
27
3
32
7
33
27
3
32
7
Inte
rest
23
34
1
80
0
18
95
2
62
7
37
98
8
70
0
14
53
4
15
95
0
17
26
3
19
00
5
20
96
2
23
12
4
25
48
3
Oth
er
Re
ve
nu
es
1
36
84
4
73
7
49
86
4
98
6
49
86
4
98
6
49
86
4
98
6
49
86
4
98
6
49
86
4
98
6
49
86
TO
TA
L R
EV
EN
UE
S6
15
42
2
6
00
24
5
6
31
83
7
6
71
94
7
7
14
90
4
7
39
13
3
7
65
24
1
7
87
92
8
8
11
56
1
8
36
27
1
8
61
86
6
8
88
35
4
9
15
55
5
v
s p
rio
r ye
ar
7
11
6
6
3
4
3
3
3
3
3
3
TO
TA
L R
ES
OU
RC
ES
11
47
38
8
10
76
09
1
11
30
59
7
10
47
22
3
10
94
72
1
11
74
14
5
12
49
71
7
13
19
60
2
13
87
00
6
14
69
78
5
15
60
60
6
16
59
15
7
17
64
98
3
EX
PE
ND
ITU
RE
S
Pe
rso
na
l S
erv
ice
s1
29
23
3
1
49
25
7
1
49
25
7
1
55
37
6
1
61
59
1
1
68
05
5
1
74
77
7
1
81
76
8
1
89
03
9
1
96
60
1
2
04
46
5
2
12
64
3
2
21
14
9
OP
EB
12
99
2
13
52
4
13
52
4
14
07
9
14
64
2
15
22
8
15
83
7
16
47
0
17
12
9
17
81
4
18
52
7
19
26
8
20
03
9
Op
era
tin
g E
xp
en
se
s8
03
15
1
02
14
3
1
02
14
3
1
04
18
6
1
06
58
2
1
08
50
1
1
10
34
5
1
12
22
1
1
14
24
1
1
16
18
3
1
18
39
1
1
20
87
7
1
23
41
5
Po
we
r4
78
19
5
71
26
5
71
26
5
71
26
5
99
83
6
29
82
6
61
31
6
94
37
7
29
09
7
65
55
8
03
83
8
44
02
8
86
22
Che
mic
als
29
78
4
38
04
9
38
04
9
40
71
2
43
56
2
46
61
1
49
87
4
53
36
5
57
10
1
61
09
8
65
37
5
69
95
1
74
84
8
Cost
Allo
ca
tio
n5
59
70
4
30
31
4
30
31
4
38
91
4
49
01
4
57
09
4
64
86
4
72
76
4
81
27
4
89
45
4
98
75
5
09
23
5
19
92
Exp
en
ditu
re L
ap
se
-
-
(40
31
)
(4
15
4)
(43
13
)
(4
47
1)
(46
35
)
(4
80
5)
(49
85
)
(5
17
2)
(53
70
)
(5
58
1)
(58
01
)
Tra
nsfe
r fr
om
Wa
ter
-
(9
38
8)
(93
88
)
(9
59
3)
(91
98
)
(9
70
4)
(10
21
8)
(1
07
82
)
(11
39
7)
(1
23
08
)
(12
93
7)
(1
37
67
)
(14
59
3)
Deb
t S
erv
ice
14
93
99
14
79
88
14
38
71
14
38
61
14
39
48
14
37
47
14
36
75
14
63
45
14
64
38
14
63
07
14
61
55
14
60
64
14
60
08
-
Ca
pita
l O
utla
y1
43
11
6
2
45
34
8
2
21
74
0
1
21
92
0
9
80
10
1
13
01
2
1
25
77
0
1
32
86
0
1
24
89
0
1
25
02
2
1
24
94
0
1
24
95
0
1
24
85
0
TO
TA
L E
XP
EN
DIT
UR
ES
64
86
27
78
70
77
75
53
21
66
74
06
65
97
09
68
96
70
71
80
43
74
41
57
75
34
93
77
10
45
78
98
03
80
97
30
83
05
29
v
s p
rio
r ye
ar
0
30
-1
2
-1
5
4
4
1
2
2
3
3
TO
TA
L E
ND
ING
FU
ND
BA
LA
NC
E4
98
76
0
2
89
01
3
3
75
27
6
3
79
81
7
4
35
01
2
4
84
47
6
5
31
67
4
5
75
44
5
6
33
51
3
6
98
74
0
7
70
80
3
8
49
42
8
9
34
45
4
En
din
g b
ala
nce
as
of
Reso
urc
es
43
2
7
33
3
6
40
4
1
43
4
4
46
4
8
49
5
1
53
TO
TA
L R
EQ
UIR
EM
EN
TS
11
47
38
8
10
76
09
1
11
30
59
7
10
47
22
3
10
94
72
1
11
74
14
5
12
49
71
7
13
19
60
2
13
87
00
6
14
69
78
5
15
60
60
6
16
59
15
7
17
64
98
3
Deb
t S
erv
ice
Co
ve
rag
e1
74
16
81
88
20
62
13
22
02
21
22
52
30
23
52
39
24
4
RE
VE
NU
E m
inu
s E
XP
EN
DIT
UR
ES
(33
20
5)
(1
86
83
2)
(12
34
84
)
4
54
1
55
19
5
49
46
3
47
19
8
43
77
2
58
06
8
65
22
6
72
06
3
78
62
5
85
02
6
(NO
T c
um
ula
tive
)
O
pe
ratin
g E
xp
en
se
s n
et
of
Cost
Allo
ca
tio
n
Exp
en
ditu
re la
pse
of
1
is c
alc
ula
ted
on
all
exp
en
se
s e
xclu
din
g D
eb
t S
erv
ice
an
d C
ap
ita
l O
utla
y
Rev
en
ue
s r
efl
ec
t th
e c
om
bin
ed
im
pa
ct
of
ch
an
ge
s i
n r
ate
s a
nd
or
lev
els
of
co
ns
um
pti
on
FO
RE
CA
ST
(
10
0
)
F-37
F-38
500
600
700
800
900
1000
1100
1200
1300
1400
1500
2014
2015
2016
2017
2018
2019
2020
2021
2022
2023
Dollars (millions)
So
lid
Wa
ste
Fu
nd
s F
ore
ca
st
FY
20
14
- F
Y2
02
3
Reven
ue
s
Exp
en
dit
ure
s
No
te
Do
es n
ot
incl
ud
e C
ap
ita
l Pro
ject
s Fu
nd
loa
n a
ctiv
ity
F-39
SO
LID
WA
ST
E F
UN
DS
FO
RE
CA
ST
Fu
nd
4021 amp
4023
Fo
recast
Assu
mp
tio
ns
20
14
20
15
20
16
20
17
20
18
20
19
20
20
20
21
20
22
20
23
RE
VE
NU
ES
Tip
pin
g F
ee
s0
5
05
0
5
05
0
5
05
0
5
05
0
5
05
Ele
ctr
icity S
ale
s0
5
05
0
5
05
0
5
05
0
5
05
0
5
05
Ele
ctr
ica
l C
ap
acity
64
6
4
64
6
4
64
6
4
64
6
4
64
6
4
Recyclin
g R
eve
nu
e0
0
00
0
0
00
0
0
00
0
0
00
0
0
00
Oth
er
reve
nu
es
20
2
0
20
2
0
20
2
0
20
2
0
20
2
0
EX
PE
ND
ITU
RE
S
Pe
rso
na
l S
erv
ice
s4
1
40
4
0
40
4
0
40
4
0
40
4
0
40
Op
era
tin
g E
xp
en
se
s2
0
23
1
8
17
1
7
18
1
7
19
2
1
21
WT
E S
erv
ice
Fe
e1
9
19
1
9
20
2
0
19
1
9
20
2
0
20
La
nd
fill S
erv
ice
Fe
e1
9
19
1
9
20
2
0
19
1
9
20
2
0
20
HE
C3 C
osts
20
2
3
18
1
7
17
1
8
17
1
9
21
2
1
Gra
nts
amp A
ids
00
0
0
00
0
0
00
0
0
00
0
0
00
0
0
Cost
Allo
ca
tio
n1
9
19
1
9
20
2
0
19
1
9
20
2
0
20
Pro
jec
ted
Ec
on
om
ic C
on
dit
ion
s
In
dic
ato
rs
Con
su
me
r P
rice
In
de
x
c
ha
ng
e1
5
18
1
7
20
1
9
21
2
0
20
2
0
20
FL
Pe
r C
ap
ita
Pe
rso
na
l In
co
me
Gro
wth
20
2
2
22
1
8
14
1
5
17
1
6
16
1
6
F-40
SO
LID
WA
ST
E F
UN
DS
FO
RE
CA
ST
Fu
nd
4021 amp
4023
(in
$ t
ho
us
an
ds
)A
ctu
al
Bu
dg
et
Es
tim
ate
dE
sti
ma
ted
Es
tim
ate
dE
sti
ma
ted
Es
tim
ate
dE
sti
ma
ted
Es
tim
ate
dE
sti
ma
ted
Es
tim
ate
dE
sti
ma
ted
Es
tim
ate
d
20
12
20
13
20
13
20
14
20
15
20
16
20
17
20
18
20
19
20
20
20
21
20
22
20
23
BE
GIN
NIN
G F
UN
D B
AL
AN
CE
16
62
93
71
14
67
68
18
86
75
61
67
89
39
11
24
25
01
23
17
21
13
77
67
31
53
64
28
18
91
29
02
42
47
58
29
38
75
13
34
89
82
38
29
88
1
RE
VE
NU
ES
Tip
pin
g F
ee
s3
34
89
93
37
29
23
55
04
43
56
81
93
58
60
33
60
39
63
62
19
83
64
00
93
65
82
93
67
65
83
69
49
73
71
34
43
73
20
1
Ele
ctr
icity S
ale
s9
78
17
11
29
43
11
88
87
11
94
82
12
00
79
12
06
80
12
12
83
12
18
89
12
24
99
12
31
11
12
37
27
12
43
46
12
49
67
Ele
ctr
ica
l C
ap
acity
36
89
71
37
28
18
39
24
40
41
73
80
44
39
00
47
21
20
50
21
90
53
41
20
56
81
40
60
43
30
64
27
80
68
37
20
72
72
80
Recyclin
g R
eve
nu
e4
65
05
76
86
07
16
07
16
07
16
07
16
07
16
07
16
07
16
07
16
07
16
07
16
07
1
Inte
rest
74
78
18
86
19
85
11
75
31
12
42
24
63
44
13
30
46
09
35
67
39
72
74
38
81
63
10
04
69
11
48
96
Oth
er
reve
nu
es
31
33
11
07
21
12
81
15
01
17
31
19
71
22
11
24
51
27
01
29
61
32
21
34
81
37
5
Deb
t S
erv
ice
on
Lo
an
fro
m C
ap
ita
l F
un
d3
18
28
71
30
22
28
00
28
00
23
00
15
00
15
00
12
00
50
00
00
00
0
Lo
an
re
pa
ym
en
t fr
om
Ca
pita
l F
un
d (
Chille
r)0
01
50
00
15
78
91
50
00
15
00
01
50
00
15
00
00
00
00
00
00
00
0
Lo
an
re
pa
ym
en
t fr
om
Ca
pita
l F
un
d0
00
00
00
05
00
00
50
00
05
00
00
20
00
00
20
00
00
15
00
00
00
00
00
TO
TA
L R
EV
EN
UE
S8
45
46
48
49
64
98
94
36
79
30
45
51
00
88
70
10
52
39
91
10
07
94
12
74
92
81
32
17
48
13
25
71
01
23
15
59
12
87
29
91
34
77
91
v
s p
rio
r ye
ar
-1
5
4
8
4
5
16
4
0
-7
5
5
TO
TA
L R
ES
OU
RC
ES
25
08
40
11
99
64
17
27
81
12
32
60
93
95
21
33
11
92
28
41
19
24
78
46
72
81
13
56
32
13
03
93
75
04
68
41
70
31
04
63
62
81
51
77
67
2
EX
PE
ND
ITU
RE
S
Pe
rso
na
l S
erv
ice
s4
91
07
58
67
85
86
78
61
08
46
35
27
66
06
86
87
11
71
46
07
43
18
77
29
18
03
82
83
59
88
69
41
OP
EB
48
96
50
96
50
96
53
05
55
17
57
38
59
68
62
06
64
55
67
13
69
81
72
60
75
51
Op
era
tin
g E
xp
en
se
s
40
74
67
86
11
78
61
17
97
90
81
22
68
26
07
84
25
98
58
60
87
66
38
94
17
91
20
59
30
29
94
89
0
WT
E S
erv
ice
Fe
e2
23
49
13
12
93
53
12
93
53
18
88
13
24
93
93
31
11
33
37
73
63
44
49
03
51
03
63
57
70
53
64
85
93
72
15
63
79
60
0
La
nd
fill S
erv
ice
Fe
e8
89
03
11
29
71
11
29
71
11
51
18
11
73
05
11
95
34
12
19
24
12
43
63
12
67
26
12
91
34
13
17
16
13
43
51
13
70
38
HE
C3 C
osts
13
41
81
76
42
17
64
21
79
95
18
40
91
87
40
19
05
81
93
82
19
73
12
00
67
20
44
82
08
77
21
31
6
Gra
nts
amp A
ids
49
87
50
00
50
00
50
00
50
00
50
00
50
00
50
00
50
00
50
00
50
00
50
00
50
00
Cost
Allo
ca
tio
ns
29
02
23
27
77
32
77
73
32
69
33
86
73
44
43
35
13
23
58
00
36
55
13
72
82
38
02
83
87
89
39
56
4
Cap
ita
l O
utla
y1
67
07
64
00
89
43
09
71
04
05
06
92
58
10
52
49
83
52
71
02
82
34
43
08
78
75
96
33
59
00
94
58
89
05
77
70
Inte
rfu
nd
Lo
an
to
Ca
pita
l F
un
d0
01
00
00
01
75
00
04
50
00
00
00
00
00
00
00
00
00
00
0
Exp
en
ditu
re L
ap
se
0
0(6
23
7)
(63
64
)(6
49
8)
(66
32
)(6
77
8)
(69
26
)(7
07
5)
(72
26
)(7
38
6)
(75
51
)(7
71
9)
TO
TA
L E
XP
EN
DIT
UR
ES
62
16
45
11
24
60
41
10
21
83
14
85
14
59
01
39
99
06
44
69
42
03
99
20
06
67
88
28
08
11
71
78
21
32
88
06
40
08
21
95
1
v
s p
rio
r ye
ar
-3
72
3
5
-39
1
4
-2
-1
4
3
1
-2
2
EN
DIN
G F
UN
D B
AL
AN
CE
18
86
75
68
71
81
31
67
89
39
11
24
25
01
23
17
21
13
77
67
31
53
64
28
18
91
29
02
42
47
58
29
38
75
13
34
89
82
38
29
88
14
35
57
22
En
din
g b
ala
nce
as
of
Reso
urc
es
75
4
4
60
4
3
58
6
0
62
6
7
75
7
8
80
8
3
84
TO
TA
L R
EQ
UIR
EM
EN
TS
25
08
40
11
99
64
17
27
81
12
32
60
93
95
21
33
11
92
28
41
19
24
78
46
72
81
13
56
32
13
03
93
75
04
68
41
70
31
04
63
62
81
51
77
67
2
RE
VE
NU
E m
inu
s E
XP
EN
DIT
UR
ES
22
38
19
(27
49
55
)(2
07
81
6)
(55
46
90
)1
07
47
11
45
95
21
58
75
53
54
86
25
33
46
85
13
99
34
10
23
14
80
89
95
25
84
0
(NO
T c
um
ula
tive
)
no
te
no
n-r
ec
urr
ing
ex
p amp
re
v (
loa
n)
(31
8)
82
12
91
56
18
94
32
20
0(6
78
00
)(6
73
00
)(6
65
00
)(2
01
50
0)
(20
12
00
)(1
50
50
0)
00
00
00
net
recu
rrin
g r
ev-
exp
223
501
(192
826
)(5
1628
)(1
22
490
)39
671
78
652
92
255
153
362
332
268
363
493
410
231
480
899
525
840
O
pe
ratin
g E
xp
en
se
s n
et
of
Inte
rgo
ve
rnm
en
tal C
ha
rge
s
Exp
en
ditu
re la
pse
of
1
is c
alc
ula
ted
on
Pe
rso
na
l S
erv
ice
s
Op
era
tin
g E
xp
en
se
s
Cost
Allo
ca
tio
n a
nd
Gra
nts
amp A
ids
Exclu
de
s in
terf
un
d lo
an
s
Estim
ate
d r
eve
nu
es f
ore
ca
ste
d a
t 1
00
FO
RE
CA
ST
(
10
0
)
F-41
F-42
GLOSSARY
Pinellas County Budget Forecast FY2014-2023 G-1
AD VALOREM TAX - A tax levied in proportion to the value of the property against which it is levied ADOPTED BUDGET - The financial plan for the fiscal year beginning October 1 It is required by law to be approved by the Board of County Commissioners at the second of two public hearings AMENDMENT ONE ndash Approved by the voters of Florida on January 29 2008 and made the following changes which reduced taxable property values and revenues available to local government o ldquoDoubledrdquo the existing $25000 homestead exemption (except for school taxes)
o Allows for up to $500000 of the Save Our Homes exemption to be applied to another property (portability)
o Imposed a 10 cap on assessments for non-homestead property (school taxes exempt)
o Instituted a new tangible personal property exemption of $25000 AMERICAN RECOVERY amp REINVESTMENT ACT OF 2009 - In February 2009 Congress passed the American Recovery and Reinvestment Act (ARRA) of 2009 at the urging of President Obama who signed it into law on February 17th A direct response to the economic crisis the Recovery Act has three immediate goals (1) Create new jobs as well as save existing ones (2) Spur economic activity and invest in long-term economic growth and (3) Foster unprecedented levels of accountability and transparency in government spending
AMT - Alternative Minimum Tax An income tax imposed by the United States federal government on individuals corporations estates and trusts AMT is imposed at a nearly flat rate on an adjusted amount of taxable income above a certain threshold (exemption)
APPROPRIATION - The legal authorization granted by a legislative body to make expenditures and to incur obligations for specific purposes An appropriation is usually limited in the amount and as to the time when it may be expended It is the act of appropriation that funds the budget ARM - Adjustablendashrate mortgage ASSESSED VALUE - A valuation set upon real estate or other property by a government as basis for levying taxes Taxable valuation is calculated from an assessed valuation The assessed value is set by the Property Appraiser BEGINNING FUND BALANCE - The Ending Fund Balance of the previous period (See Ending Fund Balance definition) BOARD OF COUNTY COMMISSIONERS (BCC) - The Board of County Commissioners is the seven (7) member legislative and governing body for Pinellas County BOND - Written evidence of the issuers obligation to repay a specified principal amount on a certain date (maturity date) together with interest at a stated rate or according to a formula for determining that rate
GLOSSARY
Pinellas County Budget Forecast FY2014-2023 G-2
BUDGET - A financial plan containing an estimate of proposed revenues and expenditures for a given period (typically a fiscal year) CAPITAL BUDGET - The financial plan of capital project expenditures for the fiscal year beginning October 1 It incorporates anticipated revenues and appropriations included in the first year of the six year Capital Improvements Program (CIP) and any anticipated unspent appropriation balances from the previous fiscal year The Capital Budget is adopted by the Board of County Commissioners as a part of the annual County Budget CAPITAL IMPROVEMENT PROGRAM (CIP) - A proposed plan covering each year of a fixed period of years for financing long-term work projects that lead to the physical development of the County CAPITAL OUTLAY OR CAPITAL EQUIPMENT - Items such as office furniture fleet equipment data processing equipment and other operating equipment with a unit cost of $1000 or more CAPITAL PROJECT - An improvement or acquisition of major facilities roads bridges buildings or land with a useful life of at least five years CHARGE FOR SERVICES - Charges for a specific governmental service which covers the cost of providing that service to the user (eg building permits animal licenses park fees) CONSTITUTIONAL OFFICERS - They are elected to administer a specific function of County government and are directly accountable to the public for its proper operation Constitutional Officers include the Clerk of the Circuit Court the Property Appraiser the Sheriff the Supervisor of Elections and the Tax Collector COST CENTER - A budgeting entity which encompasses object level accounts (appropriations) that are used to monitor organization or program level expenditures DEBT SERVICE - The dollars required to repay funds borrowed by means of an issuance of bonds or a bank loan The components of the debt service payment typically include an amount to retire a portion of the principal amount borrowed (ie amortization) as well as interest on the remaining outstanding unpaid principal balance DEBT SERVICE FUND - An account into which the issuer makes periodic deposits to assure the timely availability of sufficient monies for the payment of debt service requirements (ie principal and interest) The revenues to be deposited into the debt service fund and payments from there are determined by terms of the bond covenants DEBT SERVICE COVERAGE RATIO ndash A ratio indicating the amount of cash available to meet annual principal and interest payments on debt The general calculation is net operating income divided by the total debt service amount DEPENDENT SPECIAL DISTRICT - A special district whose governing body or whose budget is established by the governing body of the County or municipality to which it is dependent
GLOSSARY
Pinellas County Budget Forecast FY2014-2023 G-3
DESIGNATED FUNDS ndash Funds that are set apart for a specific purpose to fund on-going or one-time expenditure Examples are bond proceeds reserves for fund balance reserve for contingencies (ldquoRainy Day Fundrdquo) and ldquopay as you gordquo reserves for future facility renewal amp replacement found mostly in the Enterprise Funds ELECTED OFFICIALS - Elected Officials include the Board of County Commissioners the Judiciary the State Attorney the Public Defender and five Constitutional Officers the Clerk of the Circuit Court the Property Appraiser the Sheriff the Supervisor of Elections and the Tax Collector ENDING FUND BALANCE - Funds carried over at the end of the fiscal year Within the fund the revenue on hand at the beginning of the fiscal year plus revenues received during the year less expenses equals ending fund balance The Ending Fund Balance becomes the Beginning Fund balance in the next fiscal year ENTERPRISE FUND - A fund used to account for operations that are financed and operated in a manner similar to private business enterprises--where the intent of the governing body is that the costs (expenses including depreciation) of providing goods or services to the general public on a continuing basis be financed or recovered primarily through user charges FANNIE MAE ndashFederal National Mortgage Association (FNMA) ndash A government-sponsored enterprise (GSE) that was created in 1938 to expand the flow of mortgage money by creating a secondary mortgage market Fannie Mae is a publicly traded company which operates under a congressional charter that directs Fannie Mae to channel its efforts into increasing the availability and affordability of homeownership for low- moderate- and middle-income Americans Fannie Mae purchases and guarantees mortgages that meet its funding criteria Through this process it secures mortgages to form mortgage-backed securities (MBS) The market for Fannie Maes MBS is extremely large and liquid FIRE PROTECTION DISTRICT - A designated area in the County where ad valorem revenues are collected from property owners and distributed to local cities and other agencies to finance fire suppression services to the area FISCAL YEAR - A twelve-month period of time to which the annual budget applies At the end of this time a governmental unit determines its financial position and the results of its operations The Pinellas County fiscal year begins on October 1 and ends on September 30 of the subsequent calendar year FORECLOSURE - A legal process by which a mortgagees right to redeem a mortgage is taken away usually because of failing to make payments FREDDIE MAC ndash Federal Home Loan Mortgage Corp (FHLMC) - A stockholder-owned government-sponsored enterprise (GSE) chartered by Congress in 1970 to keep money flowing to mortgage lenders in support of homeownership and rental housing for middle income Americans The FHLMC purchases guarantees and securitizes mortgages to form mortgage-backed securities The mortgage-backed securities that it issues tend to be very liquid and carry a credit rating close to that of US Treasuries
GLOSSARY
Pinellas County Budget Forecast FY2014-2023 G-4
FUND - An accounting entity with a complete set of self balancing accounts established to account for finances of a specific function or activity The resources and uses are segregated from other resources and uses for the purpose of carrying on specific activities or attaining specific objectives in accordance with special regulations restrictions or limitations FUND ACCOUNTING ndash Accounting method generally used by governmental agencies Usually consists of eleven classifications into which all individual funds can be categorized Governmental fund types include the general fund special revenue funds debt service funds capital projects funds and permanent funds Proprietary fund types include enterprise funds and internal service funds Fiduciary fund types include pension (and other employee benefit) trust funds investment trust funds private-purpose trust funds and agency funds FUNDING SOURCES - The type or origination of funds to finance ongoing or one-time expenditures Examples are ad valorem taxes user fees licenses permits and grants GENERAL FUND - This fund accounts for all financial transactions except those required to be accounted for in other funds The funds resources ad valorem taxes and other revenues provide services or benefits to all residents of Pinellas County GROSS DOMESTIC PRODUCT - Gross Domestic Product (GDP) is the generally accepted measure of the size of the national economy GDP measures the total market value of all final goods and services produced in a country in a given year GROSS METRO PRODUCT - Similar to Gross Domestic Product Gross Metropolitan Product (GMP) is defined as the market value of all final goods and services produced within a metropolitan area in a given period of time INDEPENDENT AGENCIES - A variety of agencies councils and other organizational entities responsible for administering public policy functions independently of the Constitutional Officers and County Administrator These entities are subject to Board of County Commissioner appropriation but operate under the purview of a legislativepolicy making body other than the Board of County Commissioners INFRASTRUCTURE - Infrastructure is a permanent installation-such as a building road or water transmission system - that provides public services INTERGOVERNMENTAL REVENUE - Revenue collected by one government and distributed (usually through some predetermined formula) to another level of government INTERNAL SERVICE FUND - A fund established to finance and account for services and commodities furnished by one department to other departments on a cost reimbursement basis MANDATE - A requirement imposed by a legal act of the federal state or local government
GLOSSARY
Pinellas County Budget Forecast FY2014-2023 G-5
METROPOLITAN STATISTICAL AREA (MSA) ndash MSA is a formal definition of a metropolitan area established by the United States Office of Management and Budget division MSArsquos are used to group counties and cities into specific geographic areas for the purposes of a population census and the compilation of related statistical data
MILLAGE RATE - A rate applied to a propertys taxable value to determine property tax due As used with ad valorem (property) taxes the rate expresses the dollars of tax per one thousand dollars of taxable value (ie a 5 mill tax on $1000 equals $500) MISSION STATEMENT - A broad statement of purpose which is derived from organization andor community values and goals MORTGAGE BACKED SECURITIES (MBS) - A type of security whose cash flows come from debt such as mortgages home-equity loans and subprime mortgages This is a type of security that typically focuses on residential instead of commercial debt MBS are sold and purchased in the open market Holders of a MBS receive interest and principal payments that come from the holders of the debt MUNICIPAL SERVICES TAXING UNIT (MSTU) - A special district authorized by the State Constitution Article VII and Florida Statutes 12501 The MSTU is the legal and financial mechanism for providing specific services andor improvements to a defined geographical area An MSTU may levy ad valorem taxes without a referendum An MSTU may also use assessments service charges or other revenue to provide its sources of income In Pinellas County the MSTU is all the unincorporated areas of the County NET EXPORTS - Exports minus imports OPERATING BUDGET - The operating budget includes appropriations for recurring and certain one-time expenditures that will be consumed in a fixed period of time to provide for day-to-day operations (eg salaries and related benefits operating supplies contractual and maintenance services professional services and software) PERSONAL SERVICES - Expenses for salaries wages and related employee benefits provided for all persons whether full-time part-time temporary or seasonal PREDATORY LENDING - The practice of unscrupulous lenders to enter into unsafe or unsound secured loans for inappropriate purposes PRO-RATE - A budgetary convention (used in Community Development and Fire Administration) that allows for centralized departmental services to be budgeted for in one cost center with the actual costs being allocated to the specific users of the service in other cost centers This is technically accomplished by appropriating a negative amount for the total central departmental service An allocation of the central services total appropriation is then budgeted in each of the user cost centers thereby reflecting the total cost to that particular function
RECESSION - A significant decline in activity across the economy lasting longer than a few months that is visible in industrial production employment real income and wholesale-retail trade The
GLOSSARY
Pinellas County Budget Forecast FY2014-2023 G-6
technical indicator of a recession is two consecutive quarters of negative economic growth as measured by a countrys gross domestic product (GDP)
RESERVES - Included in this category are funds required to meet both anticipated and unanticipated needs the balance of anticipated earmarked revenues not required for operation in the budget year those required to be set aside by bond covenants and accumulated funds set aside to finance capital construction on a pay-as-you-go basis REVENUE - The amount estimated to be received from taxes fees permits or other sources during a fiscal year REVISED BUDGET - The current year adopted budget adjusted to reflect all budget amendments approved by the Board of County Commissioners through January 31 ROLLED-BACK RATE - The millage rate which when applied to the total amount of taxable value of property (excluding new construction) produces the same amount of tax dollars as the previous year Calculation of the ldquorolled-back raterdquo is governed by Florida Statutes SAVE OUR HOMES AMENDMENT - The amendment was intended to protect homeowners from escalating property tax bills resulting from growth in market value a situation that was perceived to be forcing some people particularly residents on fixed incomes to sell their homes SHADOW BANKING SYSTEM - All financial intermediaries involved in facilitating the creation of credit across the global financial system but whose members are not subject to regulatory oversight Shadow Banking System also refers to unregulated activities by regulated institutions Examples of intermediaries not subject to regulation include hedge funds unlisted derivatives and other unlisted instruments SPECIAL ASSESSMENT FUND - A fund used to account for the financing of public improvements or services deemed to benefit the properties against which special assessments are levied SPECIAL REVENUE FUND - A fund used to account for the proceeds of specific revenue sources (other than expendable trusts or major capital projects) that are legally restricted to expenditures for specified purposes STATUTE - A written law enacted by a duly organized and constituted legislative body SUPPORT FUNDING - Support funding is provided by the Board of County Commissioners for those activities for which costs do not apply solely to any specific county departments function but are either applicable to the operation of county government as a whole or are provided for the public good TAXABLE VALUE - The assessed value of property minus any authorized exemptions (ie agricultural homestead exemption) This value is used to determine the amount of property (ad valorem) tax to be levied
GLOSSARY
Pinellas County Budget Forecast FY2014-2023 G-7
TAXES - Compulsory charges levied by a government for the purpose of financing services performed for the common benefit TOXIC ASSETS ndashThe term toxic asset was coined in the financial crisis of 200809 in regards to mortgage-backed securities collateralized debt obligations and credit default swaps all of which could not be sold after they exposed their holders to massive losses A toxic asset is one that becomes illiquid when its secondary market disappears Toxic assets cannot be sold as they are often guaranteed to lose money Many hedge funds banks and financial institutions invested heavily in mortgage-backed securities and collateralized debt obligations often using borrowed money and thus increasing their exposure This strategy proved profitable during the housing boom but resulted in enormous losses when house prices began to decline and mortgages began to default These ldquotoxic assetsrdquo were purchased by banks around the world contributing to a general sense of panic as mortgage defaults rose and liquidity fell TRANSFERS - Because of legal or other restrictions monies collected in one fund may need to be expended in other funds This is accomplished through Transfer-In (a source of funds) for the recipient fund and an equal Transfer-Out (a use of funds) for the donor fund When this movement occurs between different funds it is known as the Interfund Transfer UNINCORPORATED AREA - That portion of the County which is not within the boundaries of any municipality
GLOSSARY
Pinellas County Budget Forecast FY2014-2023 G-8
GLOSSARY
Pinellas County Budget Forecast FY2014-2023 G-1
AD VALOREM TAX - A tax levied in proportion to the value of the property against which it is levied ADOPTED BUDGET - The financial plan for the fiscal year beginning October 1 It is required by law to be approved by the Board of County Commissioners at the second of two public hearings AMENDMENT ONE ndash Approved by the voters of Florida on January 29 2008 and made the following changes which reduced taxable property values and revenues available to local government o ldquoDoubledrdquo the existing $25000 homestead exemption (except for school taxes)
o Allows for up to $500000 of the Save Our Homes exemption to be applied to another property (portability)
o Imposed a 10 cap on assessments for non-homestead property (school taxes exempt)
o Instituted a new tangible personal property exemption of $25000 AMERICAN RECOVERY amp REINVESTMENT ACT OF 2009 - In February 2009 Congress passed the American Recovery and Reinvestment Act (ARRA) of 2009 at the urging of President Obama who signed it into law on February 17th A direct response to the economic crisis the Recovery Act has three immediate goals (1) Create new jobs as well as save existing ones (2) Spur economic activity and invest in long-term economic growth and (3) Foster unprecedented levels of accountability and transparency in government spending
AMT - Alternative Minimum Tax An income tax imposed by the United States federal government on individuals corporations estates and trusts AMT is imposed at a nearly flat rate on an adjusted amount of taxable income above a certain threshold (exemption)
APPROPRIATION - The legal authorization granted by a legislative body to make expenditures and to incur obligations for specific purposes An appropriation is usually limited in the amount and as to the time when it may be expended It is the act of appropriation that funds the budget ARM - Adjustablendashrate mortgage ASSESSED VALUE - A valuation set upon real estate or other property by a government as basis for levying taxes Taxable valuation is calculated from an assessed valuation The assessed value is set by the Property Appraiser BEGINNING FUND BALANCE - The Ending Fund Balance of the previous period (See Ending Fund Balance definition) BOARD OF COUNTY COMMISSIONERS (BCC) - The Board of County Commissioners is the seven (7) member legislative and governing body for Pinellas County BOND - Written evidence of the issuers obligation to repay a specified principal amount on a certain date (maturity date) together with interest at a stated rate or according to a formula for determining that rate
GLOSSARY
Pinellas County Budget Forecast FY2014-2023 G-2
BUDGET - A financial plan containing an estimate of proposed revenues and expenditures for a given period (typically a fiscal year) CAPITAL BUDGET - The financial plan of capital project expenditures for the fiscal year beginning October 1 It incorporates anticipated revenues and appropriations included in the first year of the six year Capital Improvements Program (CIP) and any anticipated unspent appropriation balances from the previous fiscal year The Capital Budget is adopted by the Board of County Commissioners as a part of the annual County Budget CAPITAL IMPROVEMENT PROGRAM (CIP) - A proposed plan covering each year of a fixed period of years for financing long-term work projects that lead to the physical development of the County CAPITAL OUTLAY OR CAPITAL EQUIPMENT - Items such as office furniture fleet equipment data processing equipment and other operating equipment with a unit cost of $1000 or more CAPITAL PROJECT - An improvement or acquisition of major facilities roads bridges buildings or land with a useful life of at least five years CHARGE FOR SERVICES - Charges for a specific governmental service which covers the cost of providing that service to the user (eg building permits animal licenses park fees) CONSTITUTIONAL OFFICERS - They are elected to administer a specific function of County government and are directly accountable to the public for its proper operation Constitutional Officers include the Clerk of the Circuit Court the Property Appraiser the Sheriff the Supervisor of Elections and the Tax Collector COST CENTER - A budgeting entity which encompasses object level accounts (appropriations) that are used to monitor organization or program level expenditures DEBT SERVICE - The dollars required to repay funds borrowed by means of an issuance of bonds or a bank loan The components of the debt service payment typically include an amount to retire a portion of the principal amount borrowed (ie amortization) as well as interest on the remaining outstanding unpaid principal balance DEBT SERVICE FUND - An account into which the issuer makes periodic deposits to assure the timely availability of sufficient monies for the payment of debt service requirements (ie principal and interest) The revenues to be deposited into the debt service fund and payments from there are determined by terms of the bond covenants DEBT SERVICE COVERAGE RATIO ndash A ratio indicating the amount of cash available to meet annual principal and interest payments on debt The general calculation is net operating income divided by the total debt service amount DEPENDENT SPECIAL DISTRICT - A special district whose governing body or whose budget is established by the governing body of the County or municipality to which it is dependent
GLOSSARY
Pinellas County Budget Forecast FY2014-2023 G-3
DESIGNATED FUNDS ndash Funds that are set apart for a specific purpose to fund on-going or one-time expenditure Examples are bond proceeds reserves for fund balance reserve for contingencies (ldquoRainy Day Fundrdquo) and ldquopay as you gordquo reserves for future facility renewal amp replacement found mostly in the Enterprise Funds ELECTED OFFICIALS - Elected Officials include the Board of County Commissioners the Judiciary the State Attorney the Public Defender and five Constitutional Officers the Clerk of the Circuit Court the Property Appraiser the Sheriff the Supervisor of Elections and the Tax Collector ENDING FUND BALANCE - Funds carried over at the end of the fiscal year Within the fund the revenue on hand at the beginning of the fiscal year plus revenues received during the year less expenses equals ending fund balance The Ending Fund Balance becomes the Beginning Fund balance in the next fiscal year ENTERPRISE FUND - A fund used to account for operations that are financed and operated in a manner similar to private business enterprises--where the intent of the governing body is that the costs (expenses including depreciation) of providing goods or services to the general public on a continuing basis be financed or recovered primarily through user charges FANNIE MAE ndashFederal National Mortgage Association (FNMA) ndash A government-sponsored enterprise (GSE) that was created in 1938 to expand the flow of mortgage money by creating a secondary mortgage market Fannie Mae is a publicly traded company which operates under a congressional charter that directs Fannie Mae to channel its efforts into increasing the availability and affordability of homeownership for low- moderate- and middle-income Americans Fannie Mae purchases and guarantees mortgages that meet its funding criteria Through this process it secures mortgages to form mortgage-backed securities (MBS) The market for Fannie Maes MBS is extremely large and liquid FIRE PROTECTION DISTRICT - A designated area in the County where ad valorem revenues are collected from property owners and distributed to local cities and other agencies to finance fire suppression services to the area FISCAL YEAR - A twelve-month period of time to which the annual budget applies At the end of this time a governmental unit determines its financial position and the results of its operations The Pinellas County fiscal year begins on October 1 and ends on September 30 of the subsequent calendar year FORECLOSURE - A legal process by which a mortgagees right to redeem a mortgage is taken away usually because of failing to make payments FREDDIE MAC ndash Federal Home Loan Mortgage Corp (FHLMC) - A stockholder-owned government-sponsored enterprise (GSE) chartered by Congress in 1970 to keep money flowing to mortgage lenders in support of homeownership and rental housing for middle income Americans The FHLMC purchases guarantees and securitizes mortgages to form mortgage-backed securities The mortgage-backed securities that it issues tend to be very liquid and carry a credit rating close to that of US Treasuries
GLOSSARY
Pinellas County Budget Forecast FY2014-2023 G-4
FUND - An accounting entity with a complete set of self balancing accounts established to account for finances of a specific function or activity The resources and uses are segregated from other resources and uses for the purpose of carrying on specific activities or attaining specific objectives in accordance with special regulations restrictions or limitations FUND ACCOUNTING ndash Accounting method generally used by governmental agencies Usually consists of eleven classifications into which all individual funds can be categorized Governmental fund types include the general fund special revenue funds debt service funds capital projects funds and permanent funds Proprietary fund types include enterprise funds and internal service funds Fiduciary fund types include pension (and other employee benefit) trust funds investment trust funds private-purpose trust funds and agency funds FUNDING SOURCES - The type or origination of funds to finance ongoing or one-time expenditures Examples are ad valorem taxes user fees licenses permits and grants GENERAL FUND - This fund accounts for all financial transactions except those required to be accounted for in other funds The funds resources ad valorem taxes and other revenues provide services or benefits to all residents of Pinellas County GROSS DOMESTIC PRODUCT - Gross Domestic Product (GDP) is the generally accepted measure of the size of the national economy GDP measures the total market value of all final goods and services produced in a country in a given year GROSS METRO PRODUCT - Similar to Gross Domestic Product Gross Metropolitan Product (GMP) is defined as the market value of all final goods and services produced within a metropolitan area in a given period of time INDEPENDENT AGENCIES - A variety of agencies councils and other organizational entities responsible for administering public policy functions independently of the Constitutional Officers and County Administrator These entities are subject to Board of County Commissioner appropriation but operate under the purview of a legislativepolicy making body other than the Board of County Commissioners INFRASTRUCTURE - Infrastructure is a permanent installation-such as a building road or water transmission system - that provides public services INTERGOVERNMENTAL REVENUE - Revenue collected by one government and distributed (usually through some predetermined formula) to another level of government INTERNAL SERVICE FUND - A fund established to finance and account for services and commodities furnished by one department to other departments on a cost reimbursement basis MANDATE - A requirement imposed by a legal act of the federal state or local government
GLOSSARY
Pinellas County Budget Forecast FY2014-2023 G-5
METROPOLITAN STATISTICAL AREA (MSA) ndash MSA is a formal definition of a metropolitan area established by the United States Office of Management and Budget division MSArsquos are used to group counties and cities into specific geographic areas for the purposes of a population census and the compilation of related statistical data
MILLAGE RATE - A rate applied to a propertys taxable value to determine property tax due As used with ad valorem (property) taxes the rate expresses the dollars of tax per one thousand dollars of taxable value (ie a 5 mill tax on $1000 equals $500) MISSION STATEMENT - A broad statement of purpose which is derived from organization andor community values and goals MORTGAGE BACKED SECURITIES (MBS) - A type of security whose cash flows come from debt such as mortgages home-equity loans and subprime mortgages This is a type of security that typically focuses on residential instead of commercial debt MBS are sold and purchased in the open market Holders of a MBS receive interest and principal payments that come from the holders of the debt MUNICIPAL SERVICES TAXING UNIT (MSTU) - A special district authorized by the State Constitution Article VII and Florida Statutes 12501 The MSTU is the legal and financial mechanism for providing specific services andor improvements to a defined geographical area An MSTU may levy ad valorem taxes without a referendum An MSTU may also use assessments service charges or other revenue to provide its sources of income In Pinellas County the MSTU is all the unincorporated areas of the County NET EXPORTS - Exports minus imports OPERATING BUDGET - The operating budget includes appropriations for recurring and certain one-time expenditures that will be consumed in a fixed period of time to provide for day-to-day operations (eg salaries and related benefits operating supplies contractual and maintenance services professional services and software) PERSONAL SERVICES - Expenses for salaries wages and related employee benefits provided for all persons whether full-time part-time temporary or seasonal PREDATORY LENDING - The practice of unscrupulous lenders to enter into unsafe or unsound secured loans for inappropriate purposes PRO-RATE - A budgetary convention (used in Community Development and Fire Administration) that allows for centralized departmental services to be budgeted for in one cost center with the actual costs being allocated to the specific users of the service in other cost centers This is technically accomplished by appropriating a negative amount for the total central departmental service An allocation of the central services total appropriation is then budgeted in each of the user cost centers thereby reflecting the total cost to that particular function
RECESSION - A significant decline in activity across the economy lasting longer than a few months that is visible in industrial production employment real income and wholesale-retail trade The
GLOSSARY
Pinellas County Budget Forecast FY2014-2023 G-6
technical indicator of a recession is two consecutive quarters of negative economic growth as measured by a countrys gross domestic product (GDP)
RESERVES - Included in this category are funds required to meet both anticipated and unanticipated needs the balance of anticipated earmarked revenues not required for operation in the budget year those required to be set aside by bond covenants and accumulated funds set aside to finance capital construction on a pay-as-you-go basis REVENUE - The amount estimated to be received from taxes fees permits or other sources during a fiscal year REVISED BUDGET - The current year adopted budget adjusted to reflect all budget amendments approved by the Board of County Commissioners through January 31 ROLLED-BACK RATE - The millage rate which when applied to the total amount of taxable value of property (excluding new construction) produces the same amount of tax dollars as the previous year Calculation of the ldquorolled-back raterdquo is governed by Florida Statutes SAVE OUR HOMES AMENDMENT - The amendment was intended to protect homeowners from escalating property tax bills resulting from growth in market value a situation that was perceived to be forcing some people particularly residents on fixed incomes to sell their homes SHADOW BANKING SYSTEM - All financial intermediaries involved in facilitating the creation of credit across the global financial system but whose members are not subject to regulatory oversight Shadow Banking System also refers to unregulated activities by regulated institutions Examples of intermediaries not subject to regulation include hedge funds unlisted derivatives and other unlisted instruments SPECIAL ASSESSMENT FUND - A fund used to account for the financing of public improvements or services deemed to benefit the properties against which special assessments are levied SPECIAL REVENUE FUND - A fund used to account for the proceeds of specific revenue sources (other than expendable trusts or major capital projects) that are legally restricted to expenditures for specified purposes STATUTE - A written law enacted by a duly organized and constituted legislative body SUPPORT FUNDING - Support funding is provided by the Board of County Commissioners for those activities for which costs do not apply solely to any specific county departments function but are either applicable to the operation of county government as a whole or are provided for the public good TAXABLE VALUE - The assessed value of property minus any authorized exemptions (ie agricultural homestead exemption) This value is used to determine the amount of property (ad valorem) tax to be levied
GLOSSARY
Pinellas County Budget Forecast FY2014-2023 G-7
TAXES - Compulsory charges levied by a government for the purpose of financing services performed for the common benefit TOXIC ASSETS ndashThe term toxic asset was coined in the financial crisis of 200809 in regards to mortgage-backed securities collateralized debt obligations and credit default swaps all of which could not be sold after they exposed their holders to massive losses A toxic asset is one that becomes illiquid when its secondary market disappears Toxic assets cannot be sold as they are often guaranteed to lose money Many hedge funds banks and financial institutions invested heavily in mortgage-backed securities and collateralized debt obligations often using borrowed money and thus increasing their exposure This strategy proved profitable during the housing boom but resulted in enormous losses when house prices began to decline and mortgages began to default These ldquotoxic assetsrdquo were purchased by banks around the world contributing to a general sense of panic as mortgage defaults rose and liquidity fell TRANSFERS - Because of legal or other restrictions monies collected in one fund may need to be expended in other funds This is accomplished through Transfer-In (a source of funds) for the recipient fund and an equal Transfer-Out (a use of funds) for the donor fund When this movement occurs between different funds it is known as the Interfund Transfer UNINCORPORATED AREA - That portion of the County which is not within the boundaries of any municipality
GLOSSARY
Pinellas County Budget Forecast FY2014-2023 G-8
- FY14 Forecast Document
-
- Fund Forecasts Section FY14 Forecastpdf
-
- 01 General Fund FY14 Forecast
- 12_Tourist Dev Fund FY14 Forecast
- 13_Transportation Trust Fund FY14 Forecast
- 14_Capital Projects Fund FY14 Forecast
- 15 Emergency Medical Services Fund FY14 Forecast
- 16 Fire Districts Fund FY14 Forecast
- 17 Airport Fund FY14 Forecast
- 18_Water Funds FY14 Forecast
- 19_Sewer Funds FY14 Forecast
- 20_Solid Waste Funds FY14 Forecast
-
- Pro Formas Section FY14 Forecastpdf
-
- combined pro formas
-
- 01 General Fund FY14 pro forma
- 13 Transportation Trust Fund FY14 pro forma
- 04 Capital Projects Fund FY14 pro forma
- 05 EMS Fund FY14 pro forma
- 06 Fire Districts Fund FY14 pro forma
- 20 Solid Waste Funds FY14 pro forma
-
- 07 Airport Fund FY14 pro forma
- Water_Funds_FY14_pro forma
- Sewer_Funds_FY14_pro forma
- 02 TDC Fund FY14 pro forma
-