fy 2013 results
TRANSCRIPT

FY 2013 ResultsFY 2013 Results

DisclaimerDisclaimer
This presentation (the “Presentation”) is strictly confidential and is being provided to you solely for your information and may not be reproduced in any form, retransmitted, further distributedto any other person or published, in whole or in part, for any purpose.
The materials contained in this Presentation have been prepared solely for the use in this Presentation and have not been independently verified. No representation, warranty orundertaking, express or implied, is made as to, and no reliance should be placed on, the fairness, accuracy, completeness or correctness of the information or the opinions containedherein. None of OJSC “Magnit” (“the Company”), nor any shareholder of the Company, nor any of its or their affiliates, advisors or representatives shall have any liability whatsoever (innegligence or otherwise) for any loss howsoever arising from any use of this Presentation or its contents or otherwise arising in connection with the Presentation.
No part of this Presentation, nor the fact of its distribution, should form the basis of, or be relied on in connection with, any contract or commitment or investment decision whatsoever.
This Presentation is not directed to, or intended for distribution to or use by, any person or entity that is a citizen or resident or located in any locality, state, country or other jurisdictionwhere such distribution, publication, availability or use would be contrary to law or regulation or which would require any registration or licensing within such jurisdiction.
This Presentation is not an offer for sale of securities in the United States and is only addressed to and is only directed at persons who are “qualified institutional buyers” (as defined in Rule144A under the U.S. Securities Act of 1933, as amended) in the United States. The Company has not registered and does not intend to register any of its securities in the United States.
This Presentation is only being distributed to and is only directed at (i) persons who are outside the United Kingdom or (ii) to investment professionals falling within Article 19(5) of theFinancial Services and Markets Act 2000 (Financial Promotion) Order 2005 (the “Order”) or (iii) high net worth companies, and other persons to whom it may lawfully be communicated,falling within Article 49(2)(a) to (d) of the Order (all such persons in (i), (ii) and (iii) above together being referred to as “relevant persons”). Any person who is not a relevant person shouldnot act or rely on this Presentation or any of its contents.
This Presentation is only addressed to and is only directed at qualified investors in EU Member States within the meaning of the Directive 2003/71/EC.
2
This Presentation is only addressed to and is only directed at qualified investors in EU Member States within the meaning of the Directive 2003/71/EC.
Information contained in this Presentation does not constitute a public offer or an advertisement of any securities in Russia, is not an offer, or an invitation to make offers, to purchase anysecurities in Russia, and must not be passed on to third parties or otherwise made publicly available in Russia.
Matters discussed in this Presentation may constitute forward-looking statements. Forward-looking statements include statements concerning plans, objectives, goals, strategies, futureevents or performance, and underlying assumptions and other statements, which are other than statements of historical facts. The words “believe,” “expect,” “anticipate,” “intends,”“estimate,” “forecast,” “project,” “will,” “may,” “should” and similar expressions identify forward-looking statements. Forward-looking statements include statements regarding: strategies,outlook and growth prospects; future plans and potential for future growth; liquidity, capital resources and capital expenditures; growth in demand for products; economic outlook andindustry trends; developments of markets; the impact of regulatory initiatives; and the strength of competitors.
The forward-looking statements in this Presentation are based upon various assumptions, many of which are based, in turn, upon further assumptions, including without limitation,management’s examination of historical operating trends, data contained in the Company’s records and other data available from third parties. These assumptions are inherently subject tosignificant uncertainties and contingencies which are difficult or impossible to predict and are beyond the Company’s control and the Company may not achieve or accomplish theseexpectations, beliefs or projections. In addition, important factors that, in the view of the Company, could cause actual results to differ materially from those discussed in the forward-lookingstatements include the achievement of the anticipated levels of profitability, growth, cost, recent acquisitions, the timely development of new projects, the impact of competitive pricing, theability to obtain necessary regulatory approvals, and the impact of general business and global economic conditions. Past performance should not be taken as an indication or guaranteeof future results, and no representation or warranty, express or implied, is made regarding future performance.
Neither the Company, nor any of its affiliates, agents, employees, advisors or any other person intend or have any duty or obligation to supplement, amend, update or revise any of theforward-looking statements contained in this Presentation or to update or to keep current any other information contained in this Presentation. The information and opinions contained inthis document are provided as at the date of this Presentation and are subject to change without notice.
By reviewing this Presentation and/or accepting a copy of this document, you acknowledge and agree to be bound by the foregoing.

Table of ContentsTable of Contents
1.1. Magnit at a GlanceMagnit at a Glance
2.2. Market OverviewMarket Overview
3.3. Operational OverviewOperational Overview
3
5.5. Summary ConclusionsSummary Conclusions
4.4. Financial OverviewFinancial Overview

1. Magnit at a Glance1. Magnit at a Glance

Our HistoryOur History
� Foundation of wholesale business by Mr. Galitskiy
� Tander becomesone of the major distributors of household products and cosmetics in Russia
� Decision to expand into
1994 1994 –– 19981998
Early years:wholesale distribution
� First convenience store opened in Krasnodar
� Experiments with format
� Stores merged into Magnitdiscounter retail chain
1998 1998 –– 19991999
Entrance into
food retail
� Rapid regionalroll-out: 1,500 stores by the end of 2005
� Adoption of IFRS
� Strict financial control
� Performance-linked compensation
2001 2001 –– 20052005
Extensive roll-out
to capturemarket share
� Leading food retailer inRussia by number ofstores
� IPO in 2006
� Independent director elected to the Board
� Audit Committee established
� Corporate governance
2006 2006 –– 2009 crisis2009 crisis
Continued growth with focus on
margin expansion and multi-format
� Successful SPO in December 2011, proceeds amounted to US$ 475 mn
� Acceleration of growth –1,575 stores added in 2012
� Leading food retailer in Russia by sales from 1Q 2013
� Total of 8,093 stores as of
20102010--20120133
Strong performer
compared to peers
5
� Decision to expand into food retail market � Corporate governance
rules established to comply with best practice
� SPO – 2008, 2009
� 24 hypermarkets openedin 2007-2009
� 636 convenience stores opened in 2009
December 31, 2013 with plan to open over 1,350 stores in 2014
� Ongoing development of logistics system and efficiency improvement
� Large investment program for 2014 - plan to make CAPEX of about US$ 1.8 bn
� Vertical integration via own vegetables and other food production
Magnit TodayMagnit Today
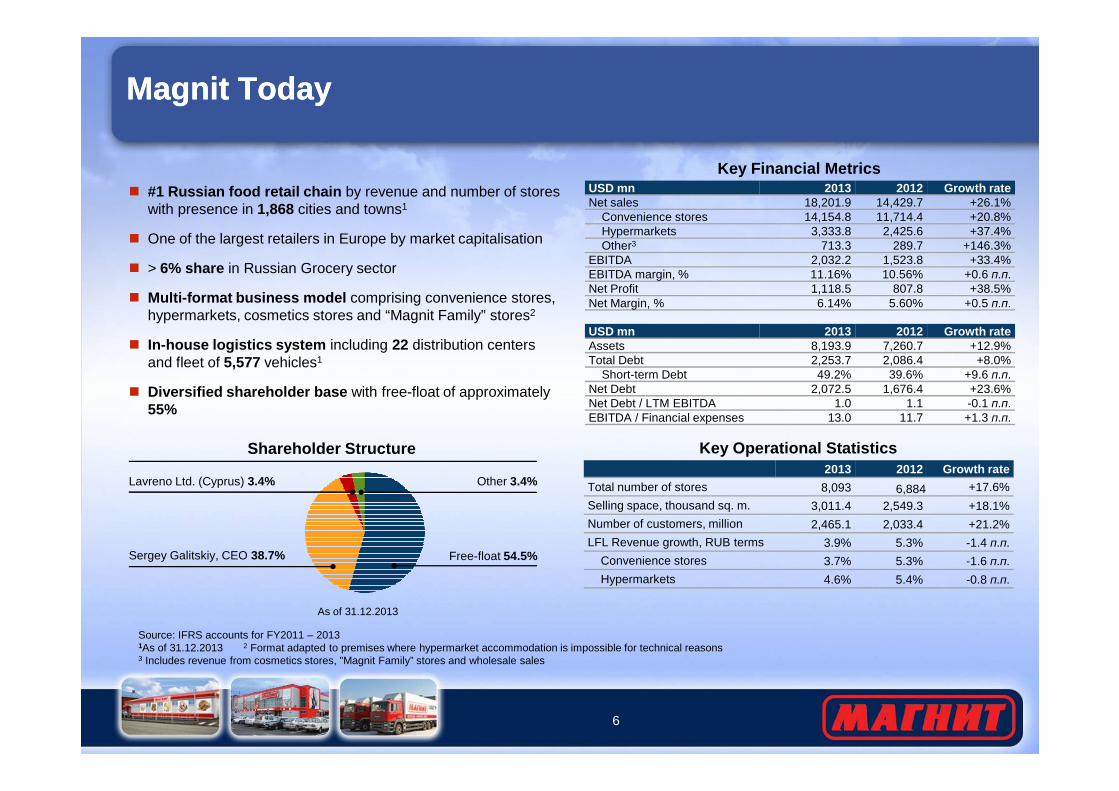
� #1 Russian food retail chain by revenue and number of stores with presence in 1,868 cities and towns1
� One of the largest retailers in Europe by market capitalisation
� > 6% share in Russian Grocery sector
� Multi-format business model comprising convenience stores, hypermarkets, cosmetics stores and “Magnit Family” stores2
� In-house logistics system including 22 distribution centers and fleet of 5,577 vehicles1
� Diversified shareholder base with free-float of approximately
Key Financial MetricsUSD mn 2013 2012 Growth rateNet sales 18,201.9 14,429.7 +26.1%
Convenience stores 14,154.8 11,714.4 +20.8%Hypermarkets 3,333.8 2,425.6 +37.4%Other3 713.3 289.7 +146.3%
EBITDA 2,032.2 1,523.8 +33.4%EBITDA margin, % 11.16% 10.56% +0.6 п.п.Net Profit 1,118.5 807.8 +38.5%Net Margin, % 6.14% 5.60% +0.5 п.п.
USD mn 2013 2012 Growth rateAssets 8,193.9 7,260.7 +12.9%Total Debt 2,253.7 2,086.4 +8.0%
Short-term Debt 49.2% 39.6% +9.6 п.п.Net Debt 2,072.5 1,676.4 +23.6%
6
� Diversified shareholder base with free-float of approximately 55%
Shareholder Structure
Free-float 54.5%Sergey Galitskiy, CEO 38.7%
Lavreno Ltd. (Cyprus) 3.4% Other 3.4%
Key Operational Statistics2013 2012 Growth rate
Total number of stores 8,093 6,884 +17.6%
Selling space, thousand sq. m. 3,011.4 2,549.3 +18.1%
Number of customers, million 2,465.1 2,033.4 +21.2%
LFL Revenue growth, RUB terms 3.9% 5.3% -1.4 п.п.
Convenience stores 3.7% 5.3% -1.6 п.п.
Hypermarkets 4.6% 5.4% -0.8 п.п.
Net Debt / LTM EBITDA 1.0 1.1 -0.1 п.п.EBITDA / Financial expenses 13.0 11.7 +1.3 п.п.
Source: IFRS accounts for FY2011 – 20131As of 31.12.2013 2 Format adapted to premises where hypermarket accommodation is impossible for technical reasons3 Includes revenue from cosmetics stores, "Magnit Family” stores and wholesale sales
As of 31.12.2013
Recent DevelopmentsRecent Developments
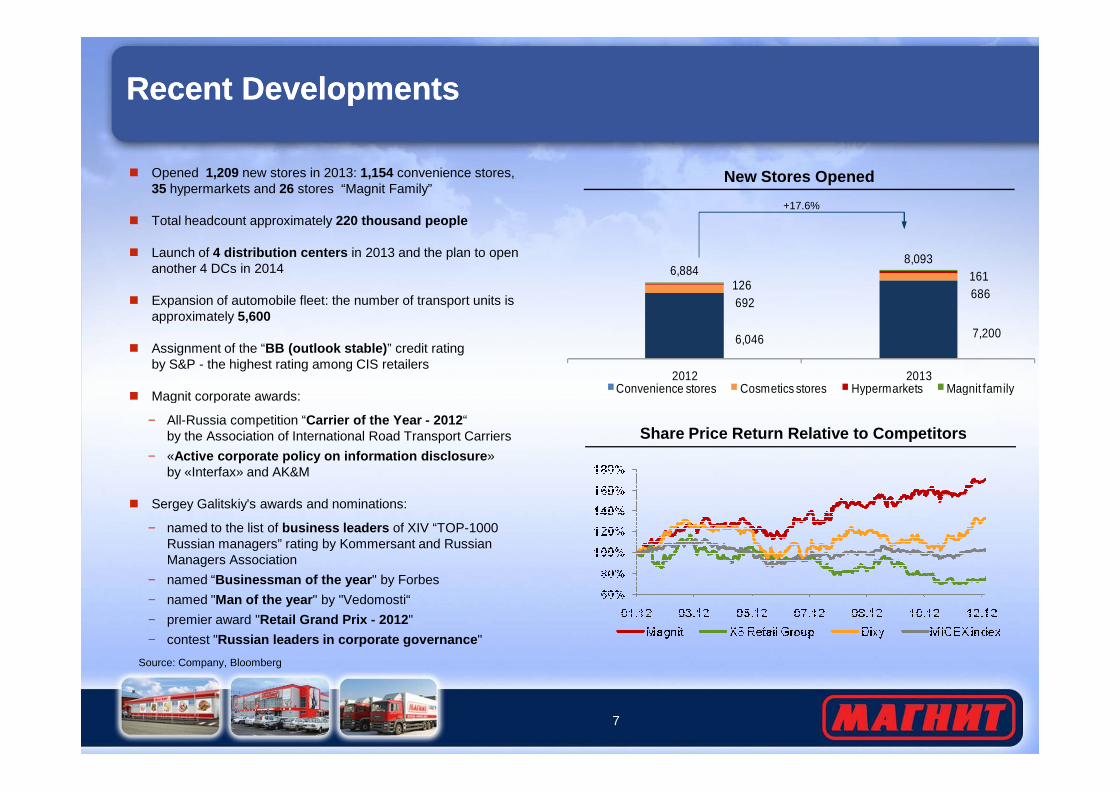
� Opened 1,209 new stores in 2013: 1,154 convenience stores, 35 hypermarkets and 26 stores “Magnit Family”
� Total headcount approximately 220 thousand people
� Launch of 4 distribution centers in 2013 and the plan to open another 4 DCs in 2014
� Expansion of automobile fleet: the number of transport units is approximately 5,600
� Assignment of the “BB (outlook stable) ” credit rating by S&P - the highest rating among CIS retailers
� Magnit corporate awards:
New Stores Opened
6,046 7,200
692686
1261616,884
8,093
2012 2013Convenience stores Cosmetics stores Hypermarkets Magnit family
+17.6%
7
� Magnit corporate awards:
− All-Russia competition “Carrier of the Year - 2012 “ by the Association of International Road Transport Carriers
− «Active corporate policy on information disclosure » by «Interfax» and AK&M
� Sergey Galitskiy's awards and nominations:
− named to the list of business leaders of XIV “TOP-1000 Russian managers” rating by Kommersant and Russian Managers Association
− named “Businessman of the year " by Forbes
− named "Man of the year " by "Vedomosti“
− premier award "Retail Grand Prix - 2012 "
− contest "Russian leaders in corporate governance "
Source: Company, Bloomberg
Share Price Return Relative to Competitors

StrategyStrategy
Expansion of conveniencestore operations
Hypermarketroll-out
Efficiency and profitability improvement
Further penetrationin existing regions Creation of a leading hypermarket
chain in regions with low
Increase of the shareof products
distributed through
8
Plan to add in 2014:1,100 convenience stores;
300 cosmetics stores
Qualitative analysis of eachobject opening prospects
Adjusting format to customers’ needs
Plan to add in 2014:70-80 hypermarkets
Use of the existing business platform
chain in regions with low competition and income growth
potential
Synergies between hypermarkets and convenience stores
distributed throughown logistics
system
Improvement ofthe product mix
Increase ofpurchasing power
Labor productivity optimization
Shift to multi-format:Growth of cosmetics store chain
Shift to multi-format:Development of the format
"Magnit Family"
2. Market Overview2. Market Overview
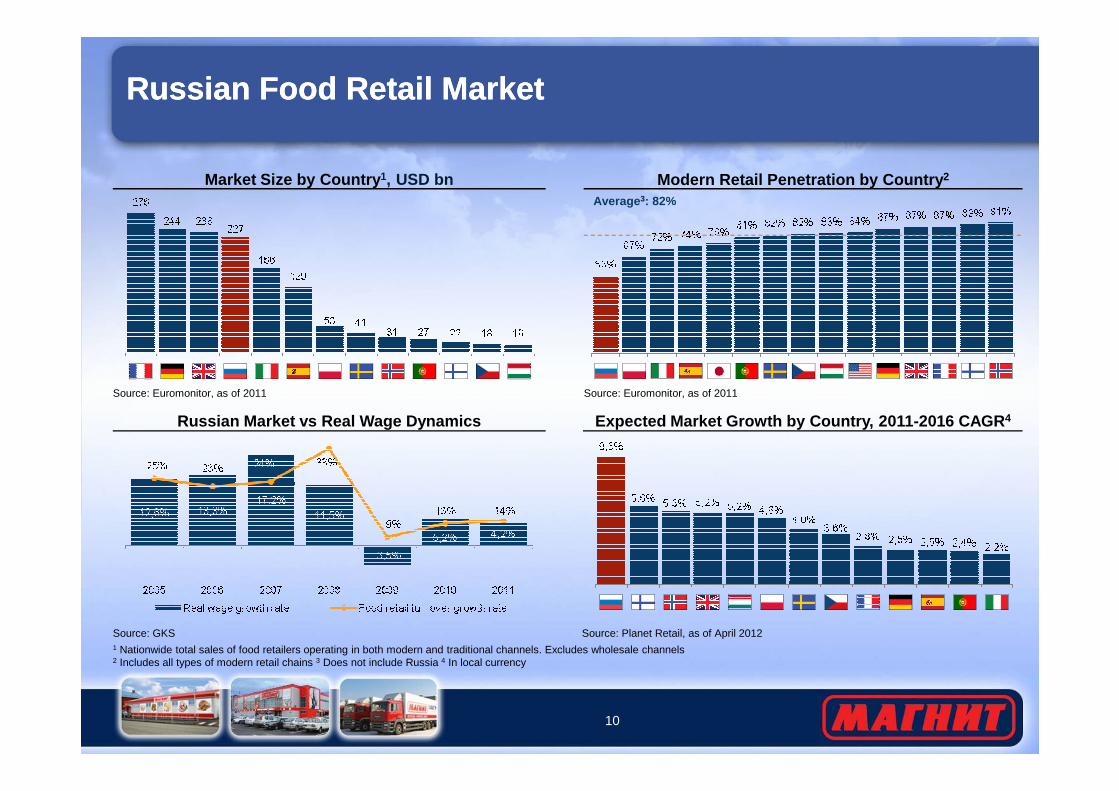
Russian Food Retail MarketRussian Food Retail Market
Average 3: 82%
Modern Retail Penetration by Country 2
Source: Euromonitor, as of 2011
Market Size by Country 1, USD bn
Source: Euromonitor, as of 2011
10
Source: GKS
Russian Market vs Real Wage Dynamics
Source: Planet Retail, as of April 2012
Source: Euromonitor, as of 2011Source: Euromonitor, as of 2011
Expected Market Growth by Country, 2011-2016 CAGR 4
1 Nationwide total sales of food retailers operating in both modern and traditional channels. Excludes wholesale channels2 Includes all types of modern retail chains 3 Does not include Russia 4 In local currency

3. Operational Overview3. Operational Overview
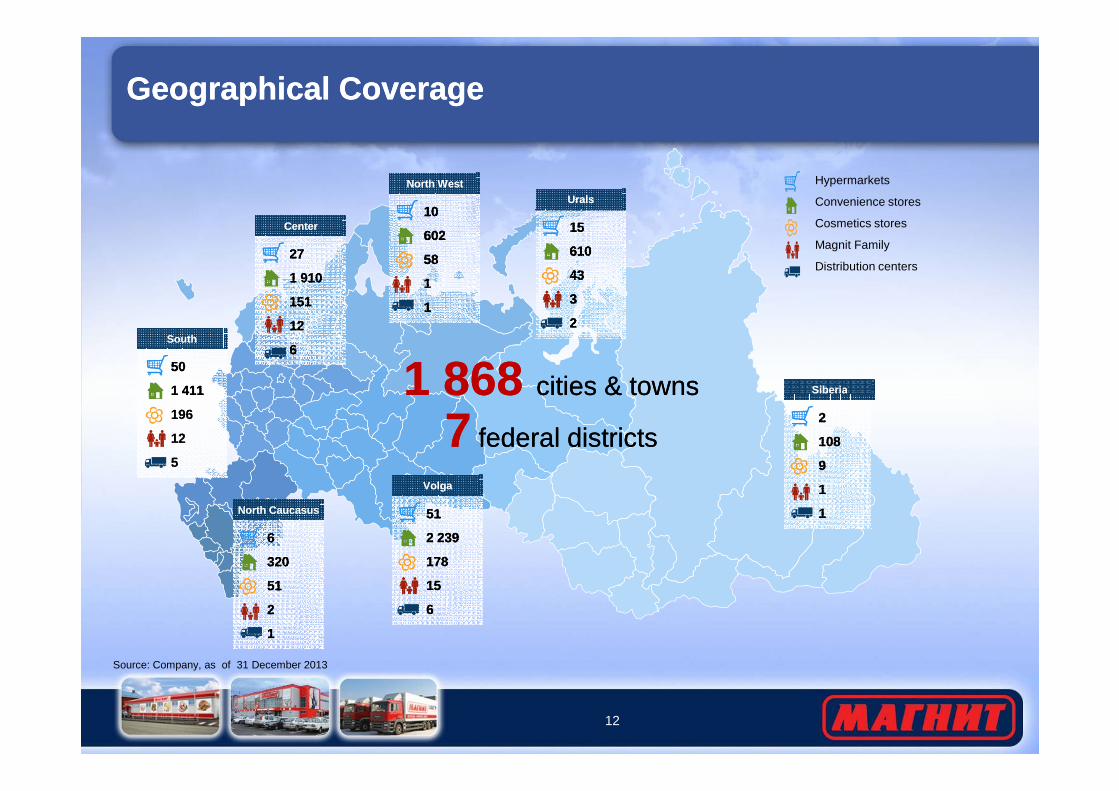
Geographical CoverageGeographical Coverage
Hypermarkets
Convenience stores
Cosmetics stores
Magnit Family
Distribution centers
11 868 868 cities & towns cities & towns
27
1 910
151
12
6
27
1 910
151
12
6
CenterCenter
27
1 910
151
12
6
Center10
602
58
1
1
10
602
58
1
1
North WestNorth West
10
602
58
1
1
North West
50
1 411
50
1 411
SouthSouth
50
1 411
South
15
610
43
3
2
15
610
43
3
2
UralsUrals
15
610
43
3
2
Urals
SiberiaSiberiaSiberia
12
Source: Company, as of 31 December 2013
11 868 868 cities & towns cities & towns
77 federal districtsfederal districts
1 411
196
12
5
1 411
196
12
5
1 411
196
12
5
6
320
51
2
1
6
320
51
2
1
North CaucasusNorth Caucasus
6
320
51
2
1
North Caucasus 51
2 239
178
15
6
51
2 239
178
15
6
VolgaVolga
51
2 239
178
15
6
Volga
2
108
9
1
1
2
108
9
1
1
SiberiaSiberia
2
108
9
1
1
Siberia

Store Opening DynamicsStore Opening Dynamics
2003 2004 2005 2006 2007 2008 2009 2010 2011 2012 2013
Southern 387 550 684 783 889 1,013 1,167
1,103 1,298 1,531 1,669
North-Caucasian 263 302 375 379
Central 100 224 379 461 546 642 807 961 1,270 1,692 2,100
Volga 114 214 368 536 628 744 954 1,245 1,662 2,142 2,483
North-West 9 26 61 84 89 116 161 217 348 504 671
Urals 8 29 45 67 139 245 372 550 671
Siberian 21 57 90 120
13
Siberian 21 57 90 120
Total 610 1,014 1,500 1,893 2,197 2,582 3,228 4,055 5,309 6,8 84 8,093
New openings 259 438 550 513 412 463 712 892 1,337 1,675 1,385
Closings 17 34 64 120 108 78 66 65 83 100 176
Net openings 242 404 486 393 304 385 646 827 1,254 1,575 1,209
� 1,154 convenience stores (net) launched in 2013, 1,000 to be added in 2014
� 85 convenience stores were closed in 2013– 30 due to poor performance– 42 were relocated to better locations– 13 were shut due to disagreements with landlords
Source: Company

A Shift to Multi FormatA Shift to Multi Format
Number of stores 7,200 161 686
Average store size� Total space: 458 sq. m.� Selling space: 321 sq. m.
� Total space: 7,126 sq. m.� Magnit selling space (1): 2,999 sq. m.
� Total space: 316 sq. m.� Selling space: 238 sq. m
Convenience Store Hypermarket Cosmetics store
14
Product range� 3,051 SKUs on average� Private label – 14.7% of retail
sales
� 12,803 SKUs on average (may vary by format)
� Private label – 7.3% of retail sales
� 8,750 SKUs on average� Private label – 3.9% of retail
sales
Positioning (format)
� Walking distance from home� Ground floor stores or
freestanding� Open 12hrs/7 days
� All hypermarkets are built in convenient locations
� All easily accessed by public transport
� Walking distance from home� Ground floor stores or above the
convenience stores
Target group� People living within 500 meters
from the store
� People living within 15 minutes by car / 30 minutes by public transport from the store. Effective radius – 7 km
� People living within 500 meters from the store
Ownership � 29.4% owned / 70.6% leased � 85.1% owned / 14.9% leased � 31% owned / 69% leased
% in total revenue 78% 18% 2%
Notes: December 31, 2013 (1) Excludes selling space designated for leases <2% of sales is accounted for Magnit Family stores
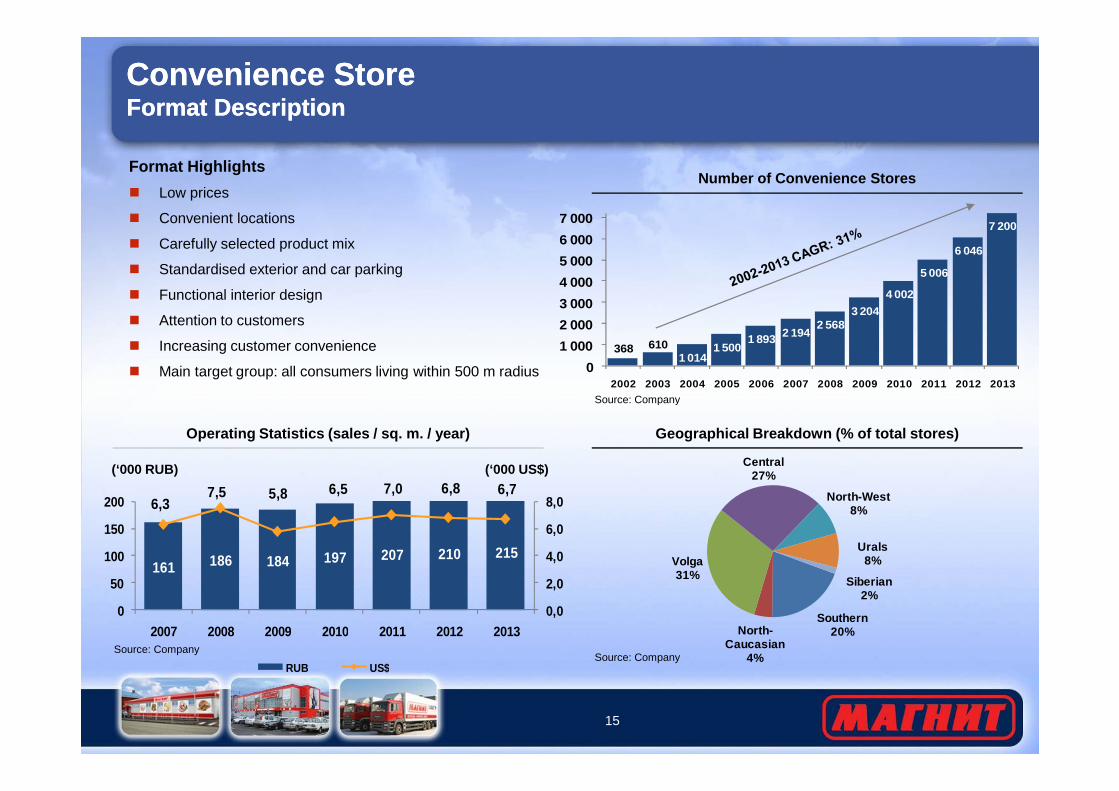
Convenience StoreFormat DescriptionConvenience StoreFormat Description
Format Highlights
� Low prices
� Convenient locations
� Carefully selected product mix
� Standardised exterior and car parking
� Functional interior design
� Attention to customers
� Increasing customer convenience
� Main target group: all consumers living within 500 m radius
Number of Convenience Stores
368 6101 014
1 5001 893 2 194
2 5683 204
4 002
5 006
6 046
7 200
0
1 000
2 000
3 000
4 000
5 000
6 000
7 000
2002 2003 2004 2005 2006 2007 2008 2009 2010 2011 2012 2013
Source: Company
15
161 186 184 197 207 210 215
6,37,5 5,8 6,5 7,0 6,8 6,7
0,0
2,0
4,0
6,0
8,0
0
50
100
150
200
2007 2008 2009 2010 2011 2012 2013
RUB US$
Geographical Breakdown (% of total stores)Operating Statistics (sales / sq. m. / year)
Source: Company
Source: Company
Source: Company
(‘000 RUB) (‘000 US$)
Southern20%North-
Caucasian4%
Volga31%
Central27%
North-West8%
Urals8%
Siberian2%

Convenience StoreKey Operating StatisticsConvenience StoreKey Operating Statistics
Traffic
(tickets / sq. m. / day)
Average Ticket
(RUB) (US$)
3,1 2,9 2,8 2,8
0,0
2,0
4,0
6,0
2010 2011 2012 2013
169186 195 205
5,66,3 6,3 6,5
0
2
4
6
8
0
70
140
210
2010 2011 2012 2013
RUB US$
16
Sales Mix Average Floor Size
314 327 327 321
469 467 466 458
0
200
400
600
2010 2011 2012 2013Selling Space Total Space
Source: Company
Note: (1) In RUR terms
Source: Company
Source: Company
Source: Company
(sq. m.)(%)
87,2 88,4 88,5 88,5
12,8 11,6 11,5 11,5
0
20
40
60
80
100
2010 2011 2012 2013
Non Food Food
RUB US$
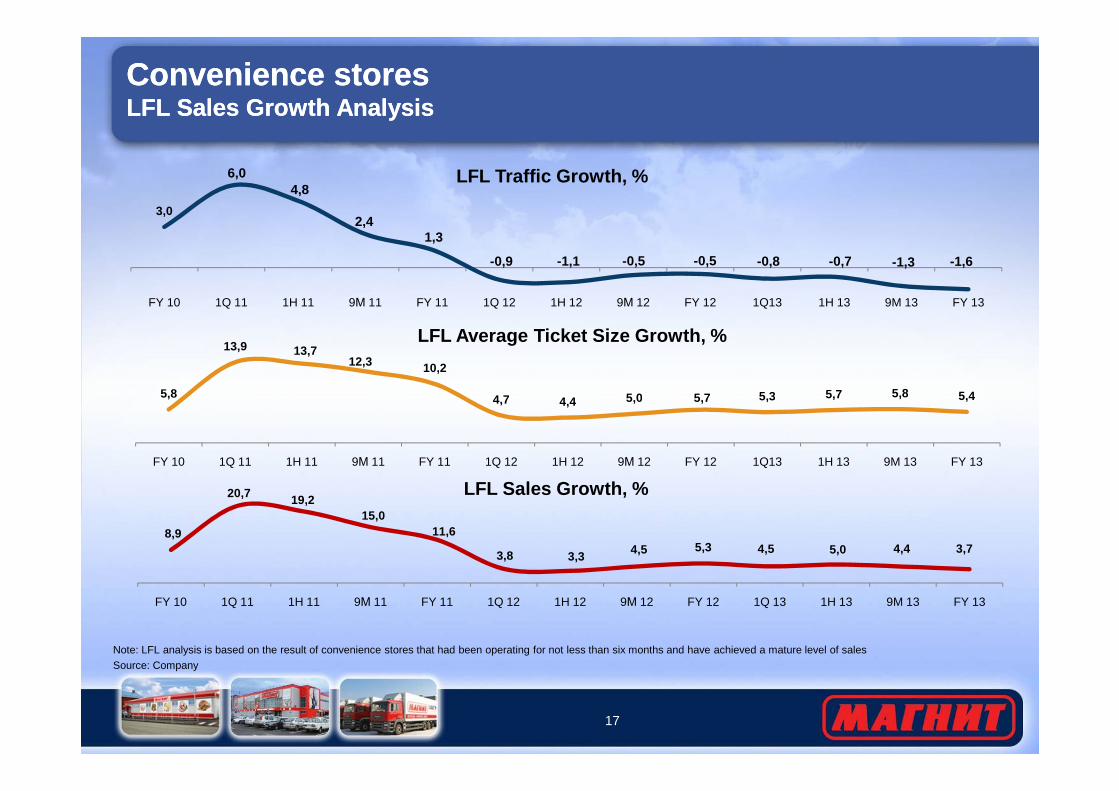
Convenience storesLFL Sales Growth AnalysisConvenience storesLFL Sales Growth Analysis
3,0
6,04,8
2,41,3
-0,9 -1,1 -0,5 -0,5 -0,8 -0,7 -1,3 -1,6
FY 10 1Q 11 1H 11 9М 11 FY 11 1Q 12 1H 12 9М 12 FY 12 1Q13 1H 13 9M 13 FY 13
LFL Traffic Growth, %
5,8
13,9 13,712,3 10,2
4,7 4,4 5,0 5,7 5,3 5,7 5,8 5,4
LFL Average Ticket Size Growth, %
17
Note: LFL analysis is based on the result of convenience stores that had been operating for not less than six months and have achieved a mature level of sales
Source: Company
5,8 4,7 4,4 5,0 5,7 5,3 5,7 5,8 5,4
FY 10 1Q 11 1H 11 9М 11 FY 11 1Q 12 1H 12 9М 12 FY 12 1Q13 1H 13 9M 13 FY 13
8,9
20,7 19,215,0
11,6
3,8 3,3 4,5 5,3 4,5 5,0 4,4 3,7
FY 10 1Q 11 1H 11 9М 11 FY 11 1Q 12 1H 12 9М 12 FY 12 1Q 13 1H 13 9M 13 FY 13
LFL Sales Growth, %
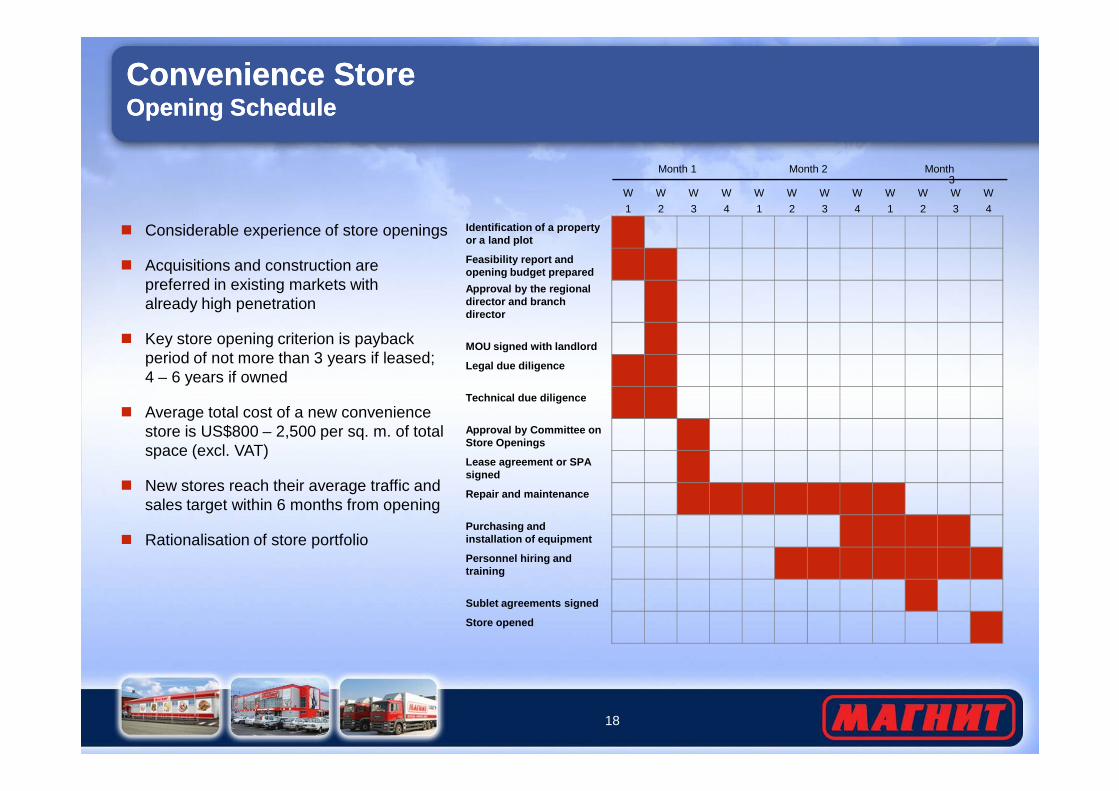
Convenience StoreOpening ScheduleConvenience StoreOpening Schedule
� Considerable experience of store openings
� Acquisitions and construction are preferred in existing markets with already high penetration
� Key store opening criterion is payback period of not more than 3 years if leased; 4 – 6 years if owned
Identification of a property or a land plot
Feasibility report and opening budget prepared
Approval by the regional director and branch director
MOU signed with landlord
Legal due diligence
Technical due diligence
W
1
W
2
W
3
W
4
W
1
W
2
W
3
W
4
W
1
W
2
W
3
W
4
Month 1 Month 2 Month 3
18
� Average total cost of a new convenience store is US$800 – 2,500 per sq. m. of total space (excl. VAT)
� New stores reach their average traffic and sales target within 6 months from opening
� Rationalisation of store portfolio
Technical due diligence
Approval by Committee on Store Openings
Lease agreement or SPA signed
Repair and maintenance
Purchasing and installation of equipment
Personnel hiring and training
Sublet agreements signed
Store opened

HypermarketFormat DescriptionHypermarketFormat Description
Format Highlights
� 3 principal hypermarket sub-formats
– Small: selling space (1) of up to 3,000 sq. m.
– Medium: selling space (1) of3,000 – 6,000 sq. m.
– Large: selling space (1) of over 6,000 sq. m.
� The decision with regards to hypermarket format principally depends on the following factors:
– Consumer disposable budget of the region
Number of Hypermarkets and Selling Space
(No of hypermarkets, eop) (‘000 sq. m.)
14 24 5193 126 16156 78
165282
388483
0
250
500
050
100150
2008 2009 2010 2011 2012 2013
Number of Hypermarkets Selling Space
19
Source: Company
– Consumer disposable budget of the region
– 5-7 year budget forecast
– Percentage of the consumer budget, attributable to hypermarket
– Population of the region
– Competition
Breakdown by Sub-format (2) Breakdown by Population
32%
27%
18%
23%
50 - 100 100 - 250 250 - 500 >500Source: Company
Notes: (1) Excluding rental space; (2) Based on selling space Source: Company
Source: Company
(ths.)
65%
31%
4%
small medium large

HypermaketKey Operating StatisticsHypermaketKey Operating Statistics
1,0 1,1 1,1 1,2
0,0
0,5
1,0
1,5
2010 2011 2012 2013
TrafficAverage Ticket
(tickets/sq. m./day)
527 521 548 550
17 18 18 17
0
200
400
600
2010 2011 2012 2013
RUB US$
(RUB) (US$)
Source: Company Source: Company
20
2,0
3,22,5 2,1
4,65,4
-1
2
5
8
FY13-FY12 FY12-FY11
Average Ticket Size Growth Traffic Growth Sales Growth
LFL Analysis (RUB Terms) (1)Sales Mix
(%)
76 77 79 80
24 23 21 20
0
25
50
75
100
2010 2011 2012 2013
Non Food Food
(%)
Source: Company
Source: Company
Note: (1) Based on hypermarkets that had been operating for not less than 8 months and have achieved a mature level of sales
Source: Company
Source: Company
HypermarketOpening ScheduleHypermarketOpening Schedule
M
1
M
2
M
3
M
4
M
5
M
6
M
7
M
8
M
9
M
10
M
11
M
12
M
13
M
14
M
15
M
16
M
17
M
18
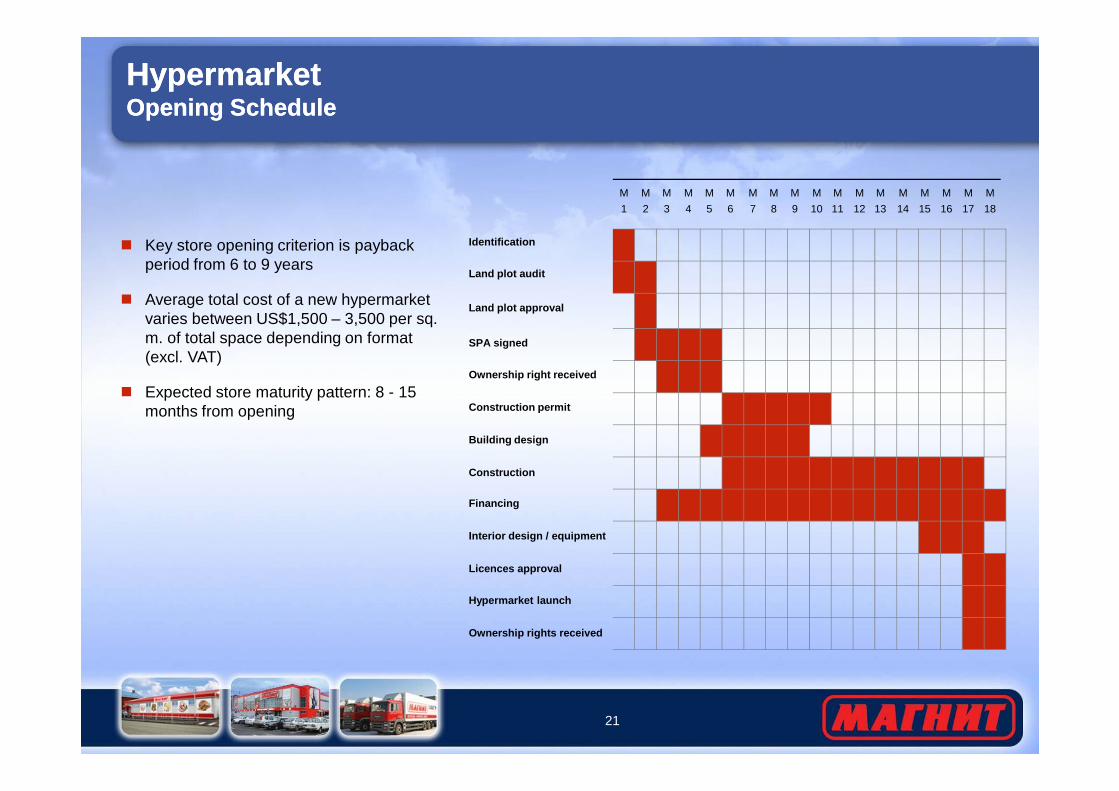
Identification
Land plot audit
Land plot approval
SPA signed
Ownership right received
� Key store opening criterion is payback period from 6 to 9 years
� Average total cost of a new hypermarket varies between US$1,500 – 3,500 per sq. m. of total space depending on format (excl. VAT)
� Expected store maturity pattern: 8 - 15
21
Construction permit
Building design
Construction
Financing
Interior design / equipment
Licences approval
Hypermarket launch
Ownership rights received
� Expected store maturity pattern: 8 - 15 months from opening

Magnit FamilyFormat DescriptionMagnit FamilyFormat Description
Magnit Family is a new format introduced in May 201 2 as a hybrid of a hypermarket and a convenience store
� One of the reasons to expand into this format is to meet the needs of customers in wider assortment and aggressive pricing in premises which are not suitable for a standard hypermarket due to technical features
� As of December 31, 2013 there were 46 Magnit Family stores
22
Format Highlights
� Selling space of up to 1,500 sq. m.
� Assortment of about 7,000 SKUs
� Expanded fresh zone
� Limited non-food assortment (<15%)
� Own production facilities (ready meals)
� Main technologies of the hypermarket format
� Pricing of the hypermarket format
� Location primarily in the leased premises of the shopping and entertainment malls
Store Ownership StructureStore Ownership Structure
Store Ownership Structure
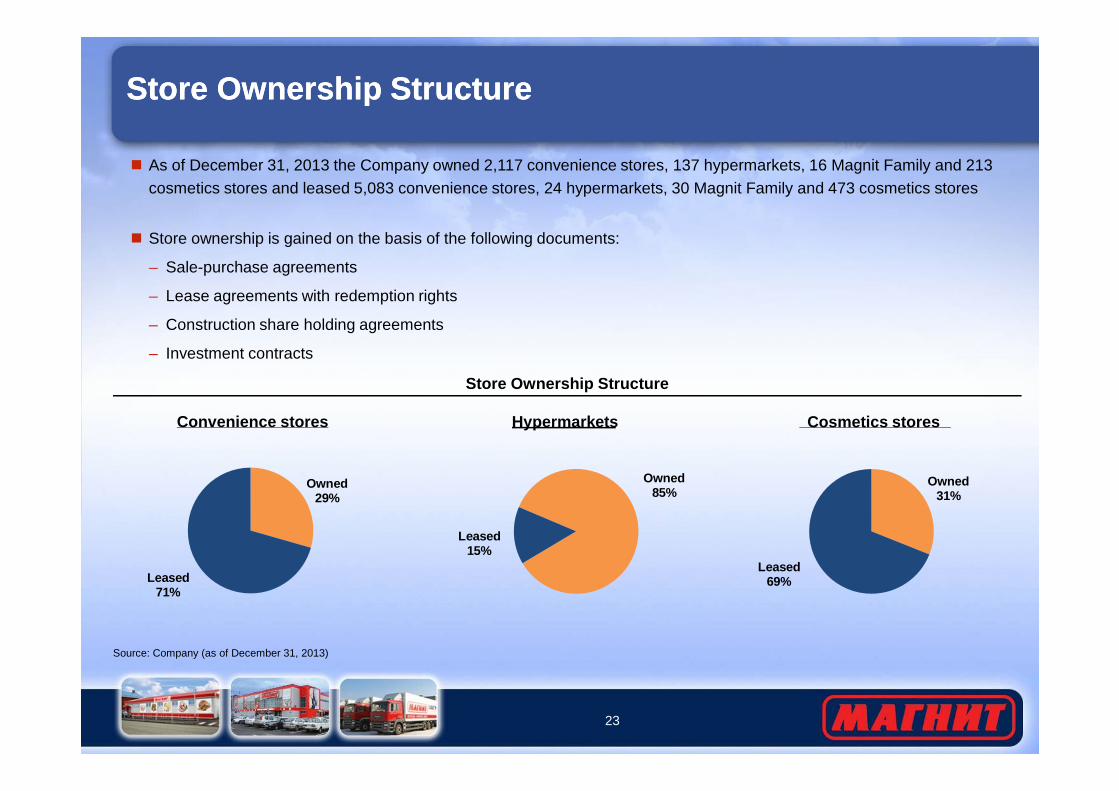
� As of December 31, 2013 the Company owned 2,117 convenience stores, 137 hypermarkets, 16 Magnit Family and 213 cosmetics stores and leased 5,083 convenience stores, 24 hypermarkets, 30 Magnit Family and 473 cosmetics stores
� Store ownership is gained on the basis of the following documents:
– Sale-purchase agreements
– Lease agreements with redemption rights
– Construction share holding agreements
– Investment contracts
23
Owned29%
Leased71%
Source: Company (as of December 31, 2013)
Convenience stores Hypermarkets
Owned85%
Leased15%
Cosmetics stores
Owned31%
Leased69%

Logistics SystemLogistics System
As of December 31, 2013 approximately 85%of COGS vs. 57% in 2005 were distributed through the company’s distribution centers and the long-term target is to increase this share up to 90-92% for convenience stores and up to 80% for hypermarkets (vs. 69% today)
At the moment the Company’s logistics system includes:
� Automated stock replenishment system
� 22 distribution centers with approximately 634,997 sq. m. capacity
Federal District Number of DCs Effective Space sq. m.No. of Serviced
Stores
Southern 5 111,832 1,724
Volga 6 147,883 2,581
Central 6 219,823 2,334
Urals 2 92,782 522
North-Caucasian 1 34,503 345
North-Western 1 21,060 428
Siberian 1 7,114 159
24
634,997 sq. m. capacity
� Fleet of 5,577 vehicles
Goods Processed through Magnit DCs
Target20132013
Outsourced11%
Magnit89%
Outsourced8%
Magnit69%
Outsourced31%
Magnit80%
TargetConvenience stores Hypermarkets
Magnit92%
Outsourced20%
Source: Company
Total 22 634,997 8,093

Suppliers, Purchasing and Private LabelSuppliers, Purchasing and Private Label
Magnit is the largest buyer for many domestic and international FMCG producers
� Weekly Assortment Committee approves the assortment and suppliers
� Direct purchasing and delivery contracts
� Economies of scale and wide geographical presence enable low prices and favorable contract terms
– Volume discounts
– Compensation of external and internal logistics costs
– Average credit term in 2013 was 39 days
Private label products are designed to replace the cheapest SKUs to maximize returns on each meter of shelf space
� 681 private label SKUs
� Private label products accounted for 13,0% share of retail revenue in 2013
� Approximately 87% of private label products are food
� Share of non-food products in private label is expected to increase
25
Share of Private Label Products in Revenue
(%)
700 700530 614 637 613 681
12,1 12,1 12,3 12,7 14,0 13,2 13,0
0
3
6
9
12
15
0
200
400
600
800
2007 2008 2009 2010 2011 2012 2013
Number of items Share in revenue, %
– Average credit term in 2013 was 39 days
– Contract term is typically 1-year
– Often can be unilaterally terminated by Magnit withno penalties
� Supplier bonuses criteria is based on
– Meeting sales targets
– Store promotions
– Loyalty
Source: Company
(No. of items)

Well-Trained Dedicated PersonnelWell-Trained Dedicated Personnel
123,5140,2 175,7
19,6 22,9 25,9
051015202530
20
40
60
80
100
2011 2012 2013
Average Headcount Average Monthly Salary
Average Number of Employees vs. Average Salary, 2011 – 2013
� The average number of employees (1) in the Group amounted to 175,720 in 2013:
– 121,228 in-store personnel,– 36,497 people engaged in distribution,– 11,636 people in regional branches,– 6,359 people employed by head office
� The average age of our employees is approximately 25 years� The gross average monthly salary in 2013 was RUB 25,899
(c. US$813(2)) per month of which approximately 75% was basic salary
� Special performance-linked bonuses and incentives help to motivate the employees at all levels
� Key members of the Management hold Company’s shares� Performance monitoring and evaluation on a regular basis� Career development programs for all levels to ensure
(No. of employees, ’000) (’000 RUB per month)
26
� Career development programs for all levels to ensure– Lower staff turnover– Increased motivation– Higher productivity
� Personnel training– 174 classrooms for trainings at all levels– Regular meetings and seminars between mid-level managers to
exchange best practices– Coaching for top-management
� Strong corporate culture aimed at development of loyalty of employees
– The Company publishes a corporate newspaper monthly– Team building events to ensure integrity of the team
Source: IFRS accounts
Notes: (1) Total number of employees as of December 31, 2013 is 217,258(2) Converted to US$ using average exchange rate for 2013 of 31.8480 RUB/US$ (CBR)

4. Financial Overview4. Financial Overview

Summary P&LSummary P&L
US$ MM2012 2013 2012 / 2013
Y-o-Y Growth
Net sales 14,429.7 18,201.9 26.1%
Cost of sales (10,600.8) (13,012.8) 22.8%
Gross profit 3,828.9 5,189.1 35.5%
Gross margin, % 26.5% 28.5%
SG&A (2,340.6) (3,194.2) 36.5%
Other income/(expense) 35.6 37.0 4.1%
EBITDA 1,523.8 2,032.2 33.3%
EBITDA margin,% 10.6% 11.2%
28
Source: IFRS accounts
EBITDA margin,% 10.6% 11.2%
Depreciation & amortization (362.5) (445.4) 22.9%
EBIT 1,161.4 1,586.8 36.6%
Net finance costs (122.1) (150.2) 23.0%
Profit before tax 1,039.2 1,436.6 38.2%
Taxes (231.4) (318.2) 37.5%
Effective tax rate 22.3% 22.1%
Net income 807.8 1,118.5 38.5%
Net margin, % 5.6% 6.1%

Revenue and CostsRevenue and Costs
Revenue Dynamics, USD mn
LFL Revenue Growth (RUB terms)
11 42314 430
18 202
2011 2012 2013
5.3%
3.9%
+26.3%
+26.1%
24,3 26,5 28,5
8,2
10,611,2
3,7
5,66,1
2011 2012 2013Gross Margin EBITDA margin Net Margin
Margin Dynamics, %
29
SG&A Expense Structure
3,639 USDmnPayroll and
related taxes 56.1%
Taxes, other than income tax 2.3%
Repair and maintenance 1.7%
Packaging and raw materials 2.1%
Other 5.6%
Depreciation & amortization 12.2%
Rent and Utilities 20.0
EBITDA Dynamics, USD mn
939
1 524
2 032
2011 2012 2013
+62.2%
+33.3%
As of 31.12.2013
Source: IFRS accounts for FY2011 - 2013

Gross Margin / EBITDA Margin BridgesGross Margin / EBITDA Margin Bridges
Gross Margin Bridge (as % of Sales)
24,33%
26,53%
28,51%
2,06%1,85% 0,08%
0,25%
(0,11%)
0,05%
15%
18%
21%
24%
27%
30%
GM 2011 Trading Margin,% Transport Losses GM 2012 Trading Margin, % Transport Losses GM 2013
30
Source: Company, IFRS accounts
EBITDA Margin Bridge (as % of Sales)
GM 2011 Trading Margin,% Transport Losses GM 2012 Trading Margin, % Transport Losses GM 2013
8,22%
10,56%11,16%
2,21%
1,97%
(1,01%)(0,35%) (0,01%)
0,28%
(0,15%)
0,08%
(0,08%)
2%
4%
6%
8%
10%
12%
14%
EBITDA 2011 Gross Margin Salaries Rent and utilities
Marketing expenses
Other EBITDA 2012 Gross Margin Salaries Rent and utilities
Other EBITDA 2013

Free Cash FlowFree Cash Flow
Free Cash Flow Bridge, USD mn
2012
Working Capital Analysis
� The average days payable to suppliers is 39 days
� Inventory management days is 42 days
� Working capital: 3 mn US$ as of 31.12.2013
20132 052
1391
(248)
(266)(143)
(252)
(1647)8
31
Source: IFRS accounts for FY2012 - 20131 Adjusted for loss from disposal of PPE, provision for doubtful receivables, foreign exchange gain, finance costs, gain on disposal of subsidiary and investment income2 Calculated as additions + transfers of PP&E during the respective period 3 Does not include cash flow from financing activities
20121 522
1194
(357)
(15)(133)
(180)
(1541) (10)
Adjusted EBIDTA¹
Change in working capital
Net interest expense
Taxes paid CFO Capex² Other cash flow from investing
activities
FCF³
Balance SheetBalance Sheet
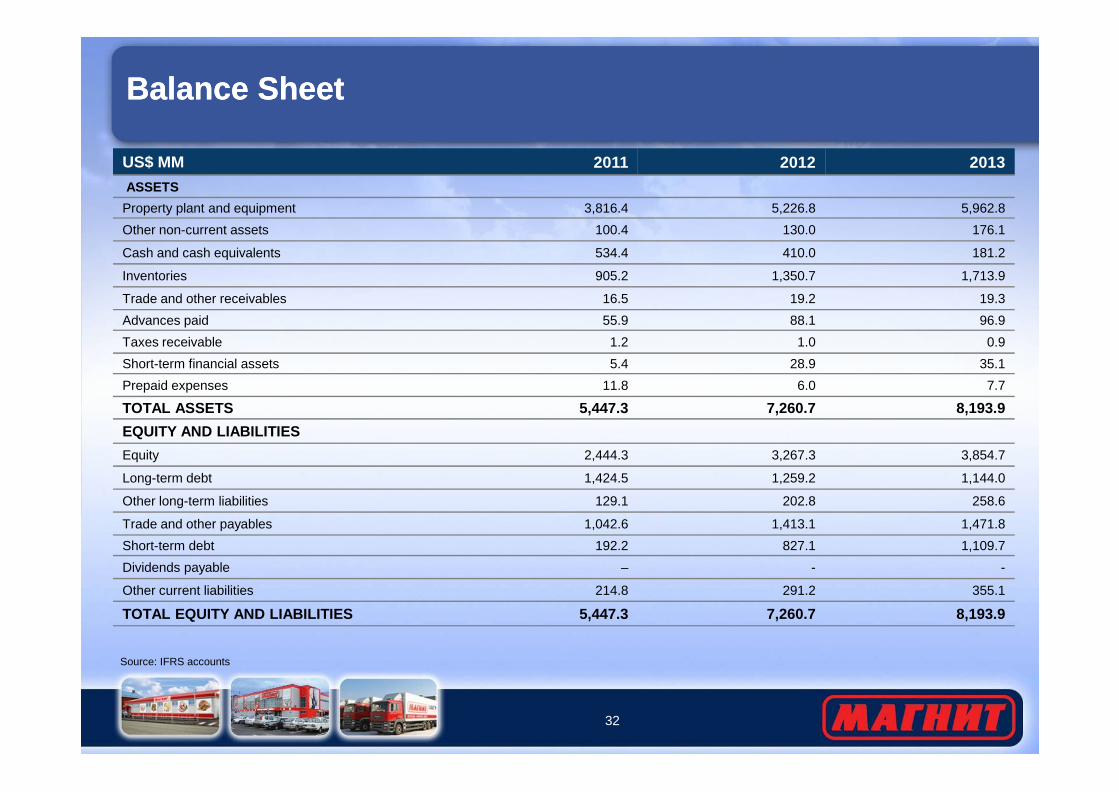
US$ MM 2011 2012 2013
ASSETS
Property plant and equipment 3,816.4 5,226.8 5,962.8
Other non-current assets 100.4 130.0 176.1
Cash and cash equivalents 534.4 410.0 181.2
Inventories 905.2 1,350.7 1,713.9
Trade and other receivables 16.5 19.2 19.3
Advances paid 55.9 88.1 96.9
Taxes receivable 1.2 1.0 0.9
Short-term financial assets 5.4 28.9 35.1
Prepaid expenses 11.8 6.0 7.7
32
Source: IFRS accounts
TOTAL ASSETS 5,447.3 7,260.7 8,193.9
EQUITY AND LIABILITIES
Equity 2,444.3 3,267.3 3,854.7
Long-term debt 1,424.5 1,259.2 1,144.0
Other long-term liabilities 129.1 202.8 258.6
Trade and other payables 1,042.6 1,413.1 1,471.8
Short-term debt 192.2 827.1 1,109.7
Dividends payable – - -
Other current liabilities 214.8 291.2 355.1
TOTAL EQUITY AND LIABILITIES 5,447.3 7,260.7 8,193.9

1,647 USD mn
Other assets 16%
Construction in progress &
Land 4%
Capex AnalysisCapex Analysis
Capex DynamicsCapex Breakdown, 2013
1 220
1 742
1 553
1 647
2,8x
Acquisition of subsidiaries 3%
mn progress &Buildings 55%
Machinery and Equipment 22%
33
Source: IFRS accounts for FY2010 – 2013Note: Capex calculated as additions + transfers of PP&E during the respective period
150
272
362445
1,8x1,3x
1,2x
2010 2011 2012 2013
Capex, USD mn Depreciation & Amortization, USD mn Capex/CFO
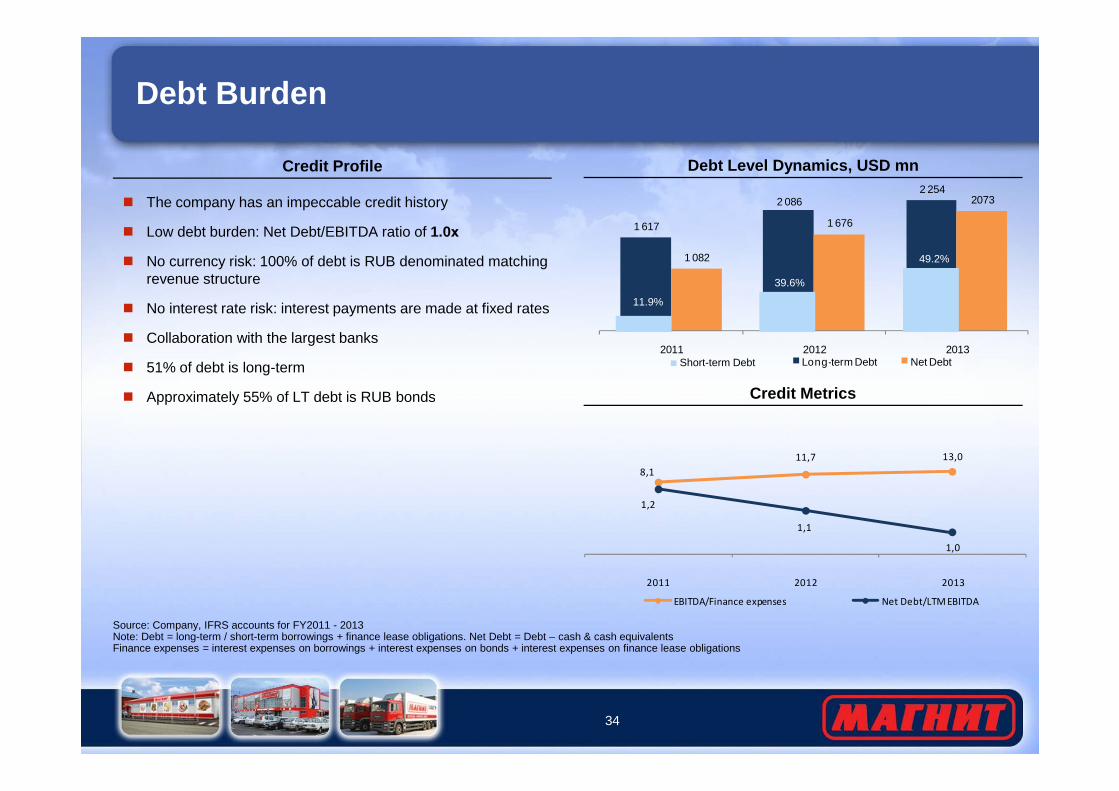
Debt Burden
Credit Metrics
Debt Level Dynamics, USD mn
1 617
2 0862 254
1 082
1 676
2073
2011 2012 2013Long-term Debt Net DebtShort-term Debt
11.9%
39.6%
49.2%
� The company has an impeccable credit history
� Low debt burden: Net Debt/EBITDA ratio of 1.0х
� No currency risk: 100% of debt is RUB denominated matching revenue structure
� No interest rate risk: interest payments are made at fixed rates
� Collaboration with the largest banks
� 51% of debt is long-term
� Approximately 55% of LT debt is RUB bonds
Credit Profile
34
Source: Company, IFRS accounts for FY2011 - 2013Note: Debt = long-term / short-term borrowings + finance lease obligations. Net Debt = Debt – cash & cash equivalentsFinance expenses = interest expenses on borrowings + interest expenses on bonds + interest expenses on finance lease obligations
8,1
11,7 13,0
1,2
1,1
1,0
2011 2012 2013
EBITDA/Finance expenses Net Debt/LTM EBITDA
Credit Metrics� Approximately 55% of LT debt is RUB bonds

5. Summary Conclusions5. Summary Conclusions

Summary ConclusionsSummary Conclusions
Leading Russian retailer: broadest geographic coverage with about 8,100 stores (as of 31December 2013) in about 1,900 cities in seven out of the eight federal districts in Russia
Further organic growth of store operations: continued roll-out of established business model in existing markets and selective expansion into new geographic areas
First-mover advantage in many cities and towns of R ussia with low competition from other chains outside of Russia’s major cities
36
in existing markets and selective expansion into new geographic areas
Expanding hypermarket operations: leveraging strong existing platform (operations, logistics, brand, scale) to develop a leading hypermarket chain in the European part of Russia
Additional opportunities to improve profitability: enhancing product mix, shifting to direct import contracts, increasing private label and increasing distribution through own logistics system to achieve margin improvements and cost savings
Stable financing of expansion: Company’s mid-term strategy will be executed through a mix of operating cashflow (80-85% of Capex) and debt (bank loans and bonds)