fy 14-15 annual report & fy 15-16 work plan · fy 14-15 annual report & fy 15-16 work plan...
TRANSCRIPT

FY 14-15 Annual Report & FY 15-16 Work Plan
We are delivering projects ON-TIME and ON-BUDGET, providing APPA
LEVEL II SERVICE at LEED-EBOM PLATINUM
equivalency with overall CUSTOMER SERVICE SCORE OF 8+ / 10

IntroductionFS’s Role: To Keep the Campus Functioning
Facilities Services (DFS) is responsible for space planning, designing and constructing new buildings and renovations, maintaining the buildings, landscaping, providing custodial services, and managing utility services. Our job is to provide clean, safe, functioning, and aesthetically pleasing facilities for the campus, where the campus community can fulfill the University’s mission, i.e., teaching and learning.1.1 Our Accomplishments in FY 14-15
• SOP/ Process Guidelines Development and Interactive PDF
• Robust PM Program Development
• Emergency Preparedness Plan Updates and Interactive PDF
• Completion of Facilities Condition Assessment
• Campus Wide Electrical Safety Repairs- Panel Replacements and switchgear/transformer rebuilds.
• Failed Roof Replacement (Sage Hall)
• Redevelopment of Dept. KPIs to include individual group KPIsand scorecardthat tie into the master DFS Scorecard.
• High marks on customer service scores.
• Completion of APPA FPI which show that DFS isoperationally in line withother CSUs and PCAPPA- nooutliers.
• Awarded MSFT Funds for classroom refreshes
• Received multiple rebates and incentive checks from energyefficiency projectsthat will be used for additional energyefficiency projects.
• Awarded CO money for water savings project
• Awarded grant $ from Water Wise for water savings project
• Met new MS4 Regulations Requirements for this FY- Compliant
• Successful completion of Sierra Hall, adding muchneeded instruction space.
• With project budget savings, we are beginninginterior renovation on three labsin Aliso Hall tomeet the academic needs for the Biology &Chemistry programs.
• Start of construction on the Student Housing PhaseIII and Dining CommonsExpansion projects.
• Enhancement of our existing facilities database bythe addition of a BuildingInformation Model ofSierra Hall that will support increased operationalefficien-cies of the building.
• We are providing “highest value of service” by operating at the lowest unitcost amongst the 23-campus system, as measured by FY 12-13 APPA FPI Survey (last year data is available).
Charts and graphs summarizing the Key Performance Indicators (KPI’s), Summary report on FY 14-15 Strategic Initiatives, proposed initiatives for FY 15-16 and FY 15-16 Key Performance Indicators are presented in the following pages.
Mission Statement
Facilities Services provides highest value of ser-vice by promoting a safe, healthy and produc-tive learning and work environment, exhibiting forward vision, using resources effectively and efficiently, and continuously improving the qual-ity of service.
Core Values
Excellence in Service - On-time and on-budget task or project completion; and always going the extra mile.
Valuing Our Colleagues - showing respect, promoting team work, and helping others get better.
Continuous Improvement - improving our processes and exemplary customer service.
Sustainable Performance - promoting and improving sustainability performance.
Create Best Value - always providing the “best value” - by stretching the value of the dollar with innovation and efficiency.
Key Performance Indicators
• Customer Service Scores > 8(in a scale of 1-10.)
• On-schedule = 94%
• On-Budget = 100%
• High Level of Service basedon APPA Standards

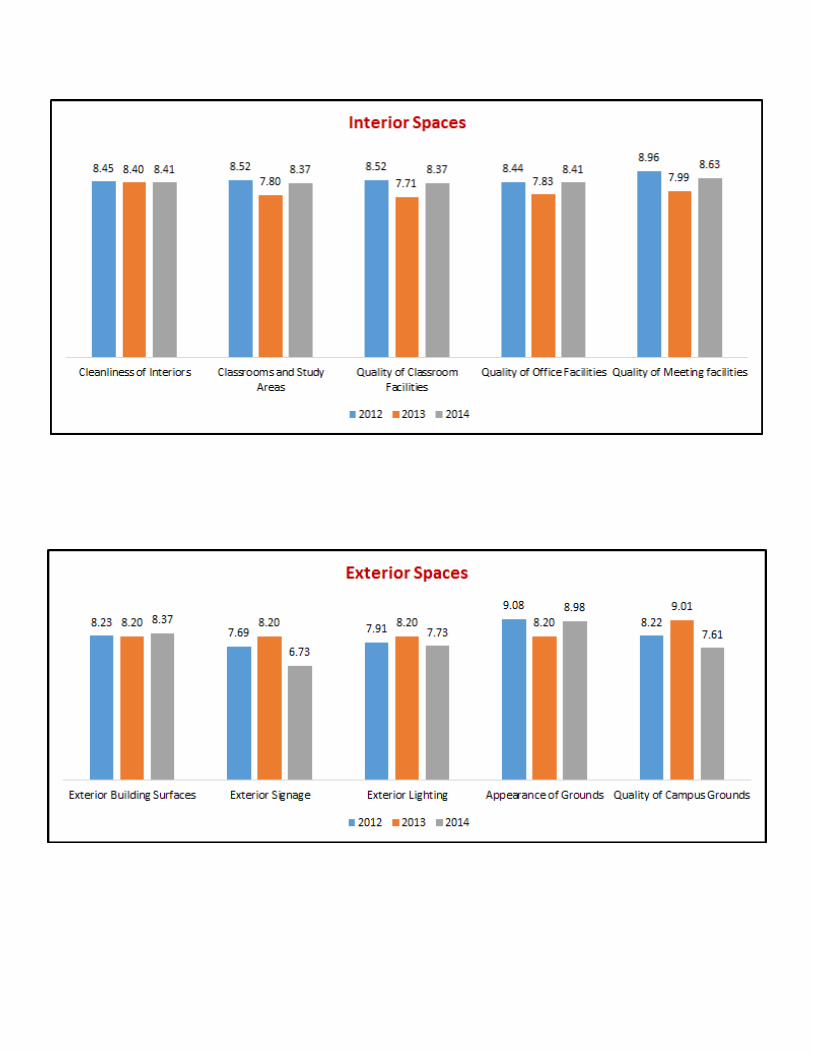
1.2 Customer Service Scores
8.50
7.37
8.45
2012 2013 2014
Overall Services
8.437.58
8.91
7.868.77
7.70 7.56
8.718.10 8.308.40
7.868.80
7.918.81
Service Call Response time communication duringrepair and construction
activities
Courtesy andprofessionalism of staff
Ability of staff tocollaborate with my unit
Quality of results
Maintenance Services
2012 2013 2014

8.008.48 8.70
2012 2013 2014
Custodial Services Cleanliness of Campus buildings
8.86
9.16
8.80
2012 2013 2014
Landscaping

8.667.63
8.54
2012 2013 2014
Sustainability Performance Improves the sustainability performance in CI's built habitat

Sustainable Accomplishments
Newly constructed Sierra Hall is LEED “Gold” equivalent Awarded Tree Campus USA for third consecutive year Earned APPA rating of 85% in Energy Sustainability Assessment Tool (ESAT) Scored “Gold” in ASHEE Sustainability Tracking, Assessment & Rating System (STARS)
Energy Efficiency
Reduced electricity consumption by 23% since 2008 All buildings are rated “Energy Star” Exterior and interior lighting upgrades to high efficiency CFL and LED across campus
Water Conservation
Reduced potable water consumption by 40% (on HCF/FTES basis) since 2008-10 Baseline Period Reduced recycled water consumption by 58% (on HCF/Acre basis) since 2008-10 Baseline Period Planting of drought-tolerant vegetation in place of water-intensive turf
Waste and Recycling
Achieved 47% diversion rate of recycling versus landfill Reduced waste in 2014 by 61.7% since 2008 on Tone/FTES basis Reduced waste by 38% overall since 2008
Electricity Consumption (kWh/GSF)
10.5 8.4 8.6 8.4 9.1
0
29% 28% 30%23%
0%
10%
20%
30%
40%
50%
60%
70%
80%
90%
100%-1.0
1.0
3.0
5.0
7.0
9.0
11.0
13.0
15.0
08-10 averagefor baseline
11-12 12-13 13-14 14-15 (est.)
% C
hang
e fr
om B
asel
ine
year
kWh
/ GSF
CSUCI Electricity Usage kWh per GSF
kWh/GSF % Change from Baseline
1.3 Sustainability Score Card 2014-2015

Domestic Water Consumption (HCF/FTES)
Recycled Water Consumption (HCF/Acre)

Source: FY 13-14 APPA FPI Survey
1.4 APPA FPI Survey 2013-2014
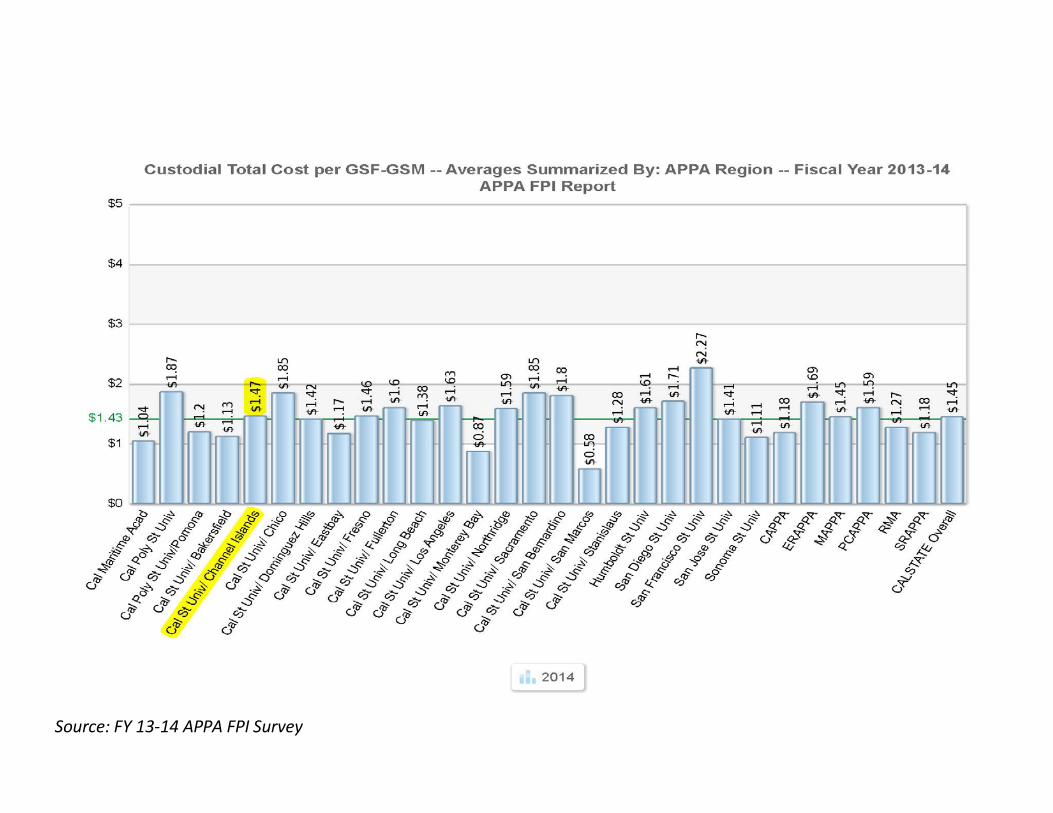
Source: FY 13-14 APPA FPI Survey
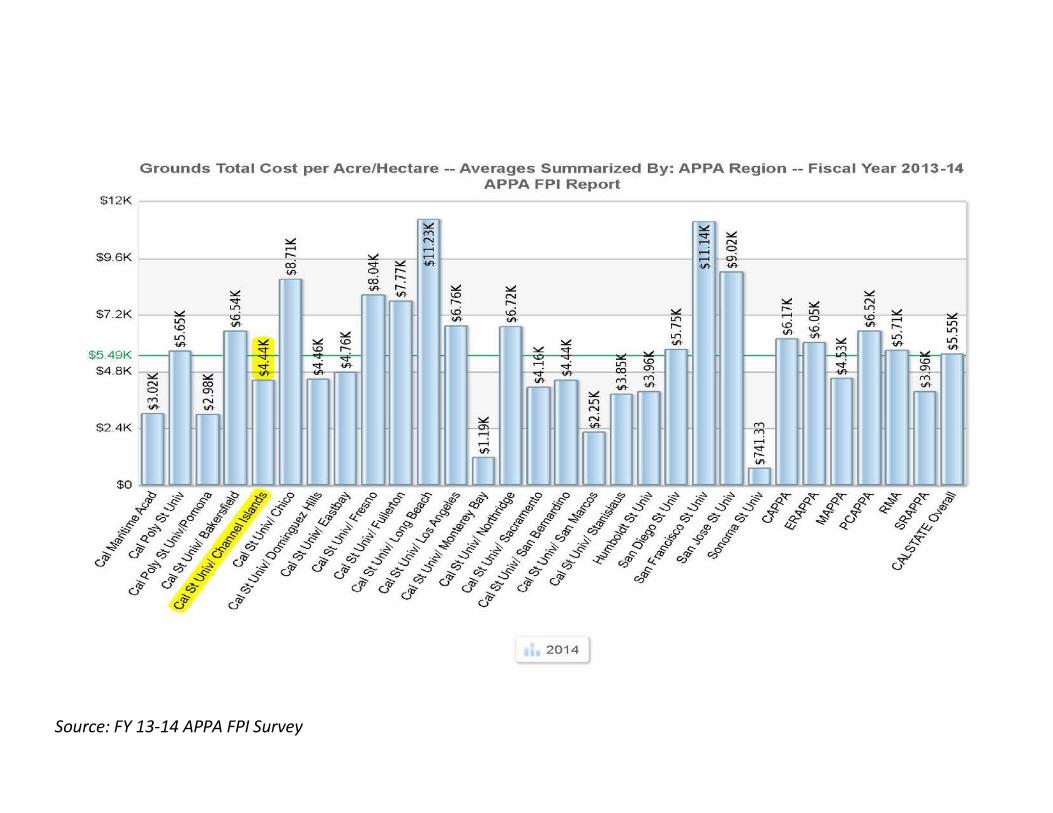
Source: FY 13-14 APPA FPI Survey
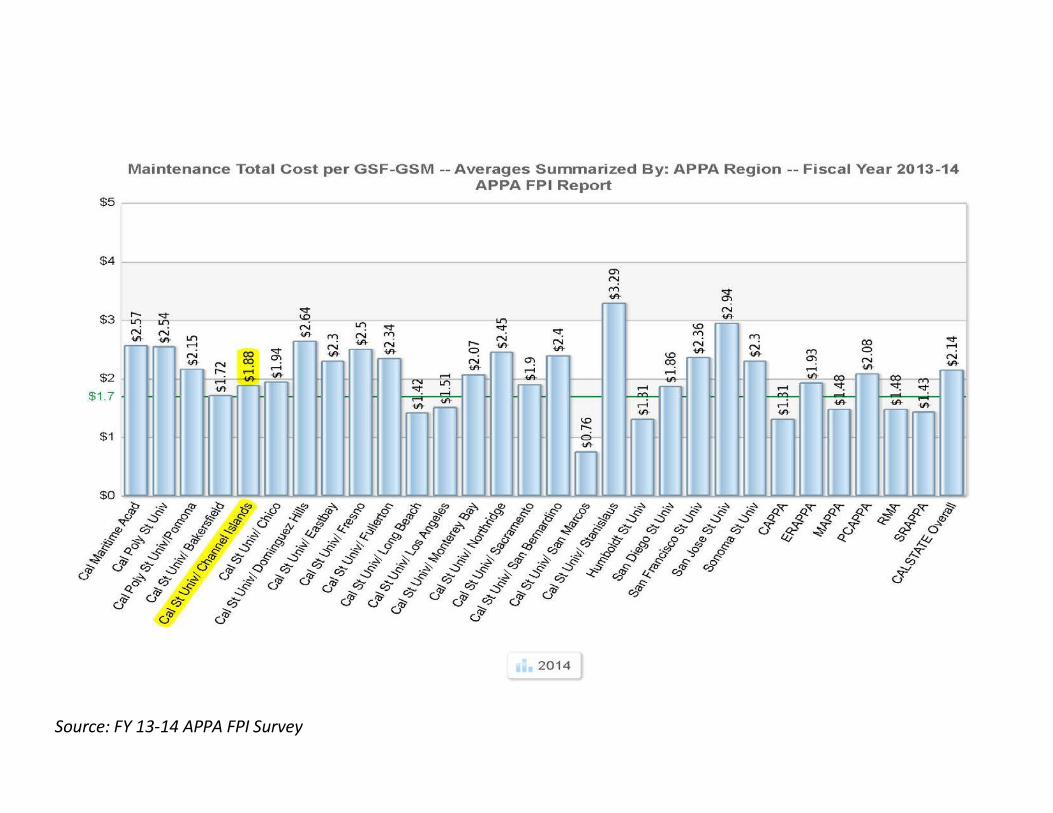
Source: FY 13-14 APPA FPI Survey

Source: FY 13-14 APPA FPI Survey

2.27
1.90 1.88
1.20 1.34 1.47
0.69 0.49 0.52
0.12 0.12 0.10 0.00
0.50
1.00
1.50
2.00
2.50
2011-2012 2012-2013 2013-2014
CSUCI-APPA Cost Per GSF
Maintenance
Custodial
Administration
Grounds
Source: Annual APPA FPI Survey
Operational Cost Trends at CSU Channel Islands (Past 3 years by Gross Square Footage)
2

FY 14-15 Strategic Initiatives Report
FY14-15 Facilities Services Strategic Initiative Status Report
Strategic Goal Key Initiative Status Next Steps
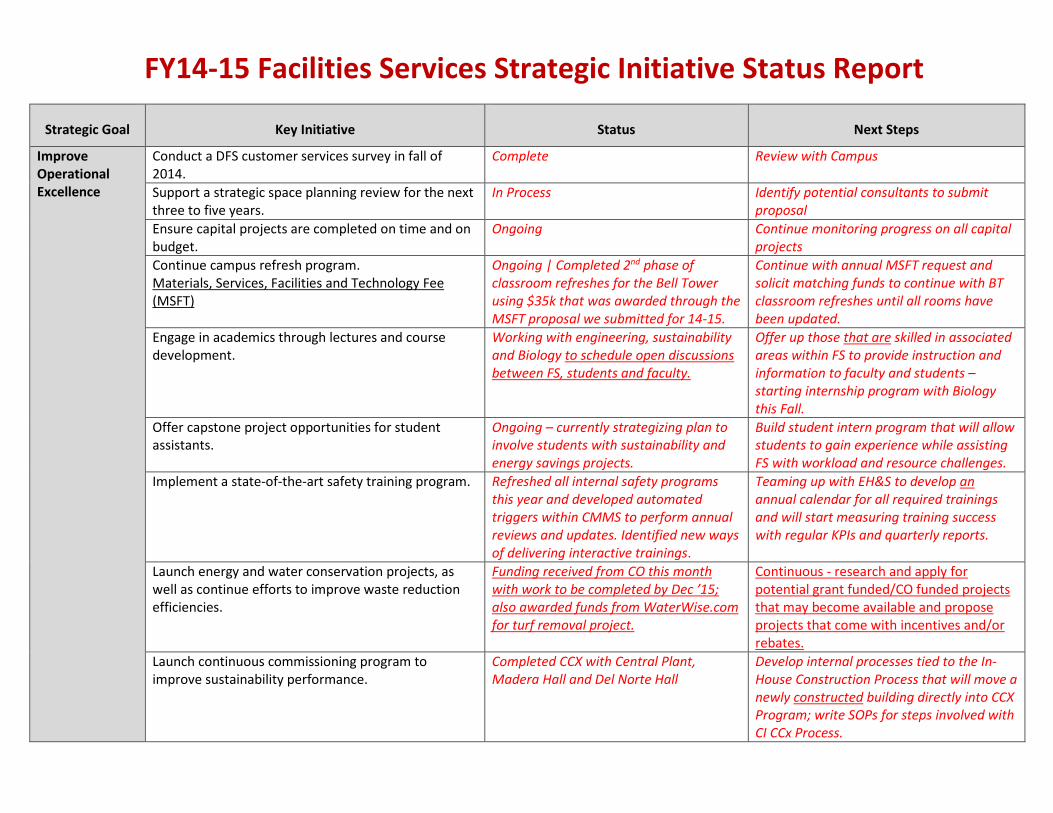
Improve Operational Excellence
Conduct a DFS customer services survey in fall of 2014.
Complete Review with Campus
Support a strategic space planning review for the next three to five years.
In Process Identify potential consultants to submit proposal
Ensure capital projects are completed on time and on budget.
Ongoing Continue monitoring progress on all capital projects
Continue campus refresh program. Materials, Services, Facilities and Technology Fee (MSFT)
Ongoing | Completed 2nd phase of classroom refreshes for the Bell Tower using $35k that was awarded through the MSFT proposal we submitted for 14-15.
Continue with annual MSFT request and solicit matching funds to continue with BT classroom refreshes until all rooms have been updated.
Engage in academics through lectures and course development.
Working with engineering, sustainability and Biology to schedule open discussions between FS, students and faculty.
Offer up those that are skilled in associated areas within FS to provide instruction and information to faculty and students – starting internship program with Biology this Fall.
Offer capstone project opportunities for student assistants.
Ongoing – currently strategizing plan to involve students with sustainability and energy savings projects.
Build student intern program that will allow students to gain experience while assisting FS with workload and resource challenges.
Implement a state-of-the-art safety training program. Refreshed all internal safety programs this year and developed automated triggers within CMMS to perform annual reviews and updates. Identified new ways of delivering interactive trainings.
Teaming up with EH&S to develop an annual calendar for all required trainings and will start measuring training success with regular KPIs and quarterly reports.
Launch energy and water conservation projects, as well as continue efforts to improve waste reduction efficiencies.
Funding received from CO this month with work to be completed by Dec ’15; also awarded funds from WaterWise.com for turf removal project.
Continuous - research and apply for potential grant funded/CO funded projects that may become available and propose projects that come with incentives and/or rebates.
Launch continuous commissioning program to improve sustainability performance.
Completed CCX with Central Plant, Madera Hall and Del Norte Hall
Develop internal processes tied to the In-House Construction Process that will move a newly constructed building directly into CCX Program; write SOPs for steps involved with CI CCx Process.
FY14-15 Facilities Services Strategic Initiative Status Report
Strategic Goal Key Initiative Status Next Steps
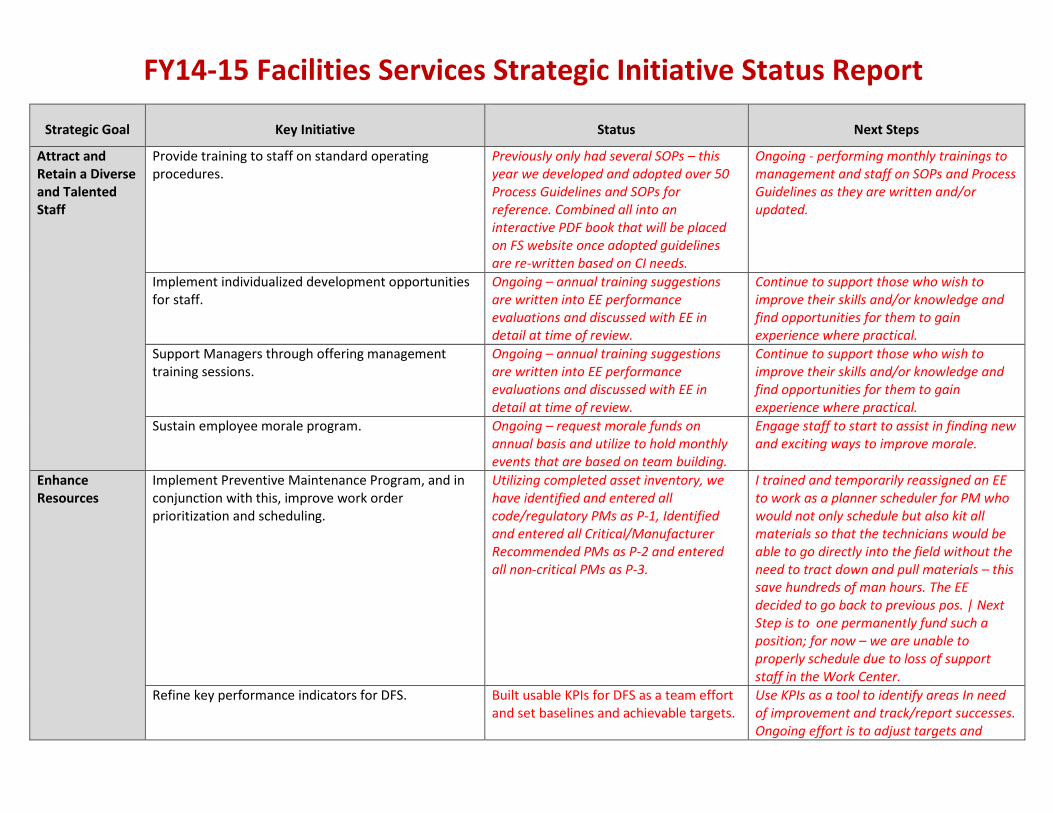
Attract and Retain a Diverse and Talented Staff
Provide training to staff on standard operating procedures.
Previously only had several SOPs – this year we developed and adopted over 50 Process Guidelines and SOPs for reference. Combined all into an interactive PDF book that will be placed on FS website once adopted guidelines are re-written based on CI needs.
Ongoing - performing monthly trainings to management and staff on SOPs and Process Guidelines as they are written and/or updated.
Implement individualized development opportunities for staff.
Ongoing – annual training suggestions are written into EE performance evaluations and discussed with EE in detail at time of review.
Continue to support those who wish to improve their skills and/or knowledge and find opportunities for them to gain experience where practical.
Support Managers through offering management training sessions.
Ongoing – annual training suggestions are written into EE performance evaluations and discussed with EE in detail at time of review.
Continue to support those who wish to improve their skills and/or knowledge and find opportunities for them to gain experience where practical.
Sustain employee morale program. Ongoing – request morale funds on annual basis and utilize to hold monthly events that are based on team building.
Engage staff to start to assist in finding new and exciting ways to improve morale.
Enhance Resources
Implement Preventive Maintenance Program, and in conjunction with this, improve work order prioritization and scheduling.
Utilizing completed asset inventory, we have identified and entered all code/regulatory PMs as P-1, Identified and entered all Critical/Manufacturer Recommended PMs as P-2 and entered all non-critical PMs as P-3.
I trained and temporarily reassigned an EE to work as a planner scheduler for PM who would not only schedule but also kit all materials so that the technicians would be able to go directly into the field without the need to tract down and pull materials – this save hundreds of man hours. The EE decided to go back to previous pos. | Next Step is to one permanently fund such a position; for now – we are unable to properly schedule due to loss of support staff in the Work Center.
Refine key performance indicators for DFS. Built usable KPIs for DFS as a team effort and set baselines and achievable targets.
Use KPIs as a tool to identify areas In need of improvement and track/report successes. Ongoing effort is to adjust targets and
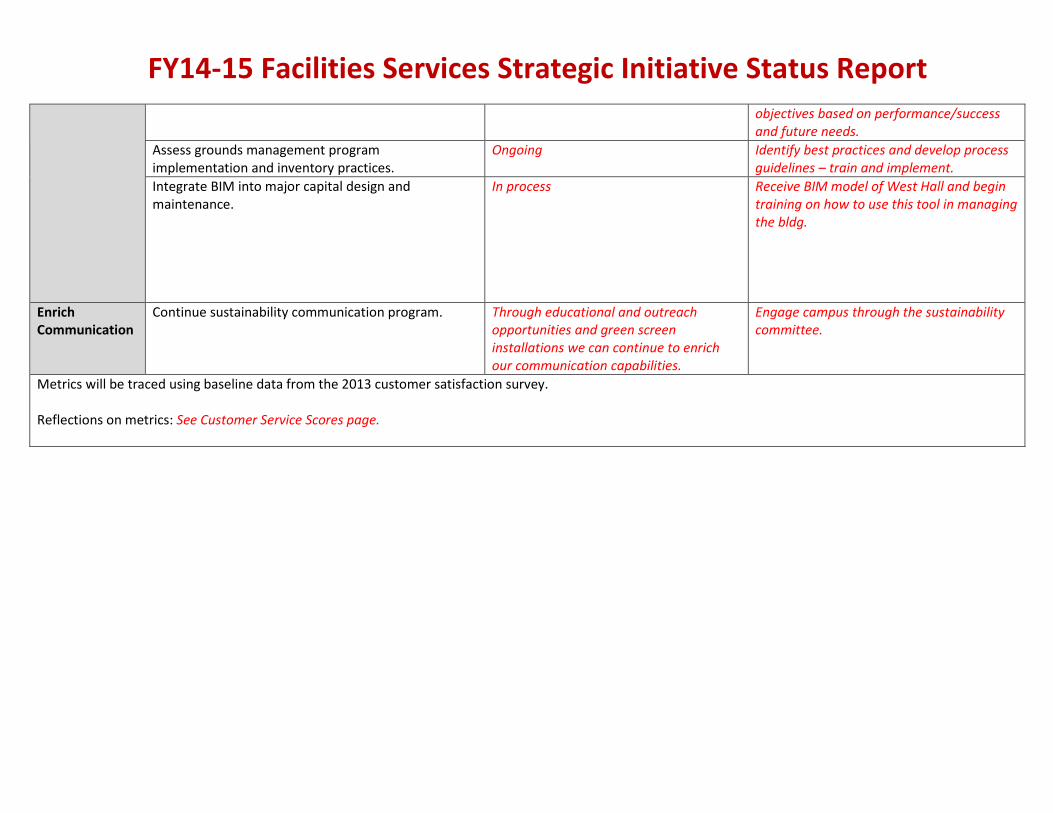
FY14-15 Facilities Services Strategic Initiative Status Report objectives based on performance/success and future needs.
Assess grounds management program implementation and inventory practices.
Ongoing Identify best practices and develop process guidelines – train and implement.
Integrate BIM into major capital design and maintenance.
In process Receive BIM model of West Hall and begin training on how to use this tool in managing the bldg.
Enrich Communication
Continue sustainability communication program. Through educational and outreach opportunities and green screen installations we can continue to enrich our communication capabilities.
Engage campus through the sustainability committee.
Metrics will be traced using baseline data from the 2013 customer satisfaction survey.
Reflections on metrics: See Customer Service Scores page.

• FS Strategy Map• FS Scorecard• 310-Business Services• 310-Employee Services 330-Work Center• 330-Operations• 345-Landscaping• 330-Maintenance Stores• 340-Custodial• 320/350-Planning, Design and Construction
FY 14-15 Key Performance Indicators Report

Facilities Services Strategy Map
Asset Life Cycles 100% or Greater
Return on Assets Robust PM Program Work Center ManagementMaintenance Costs VS
Replacement <5%
Customer Survey Score of 8 Provide a level 2 service based on APPA Criteria
Department Directors and Managers
FPI Survey At Median Averages
Tracking Schedules 90%+ on time Development
To be timely and efficient WO Completion Rates
80% on time Management
Create Training Procedures Employee Survey Managers
80% of Training Budgets Met
Offer Development Opportunities Evaluation Reviews Shop Budget
Employee ServicesSafety
Department Directors and Managers
Customer:
Internal:
Learning:
Strategic Theme:Operating
EfficiencyObjective Description
Eliminate Signatures
Measurement Target Initiative Responsible
Financial:
Schedule Trainings suggested by management
Document Processes
Total Cost of Ownership
Provide responsive, flexible and dependable
service.Dependable
Service
Value
Effectiveness & Efficiency
Development Opportunities
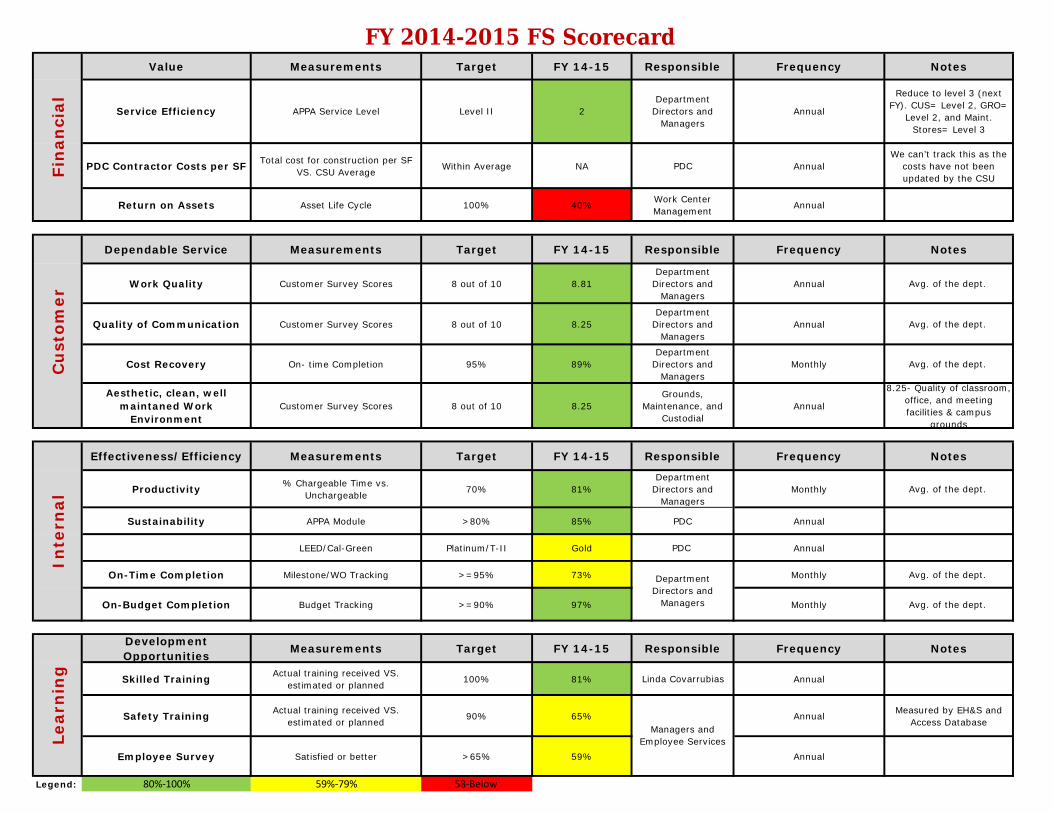
Value Measurements Target FY 14-15 Responsible Frequency Notes
PDC Contractor Costs per SF Total cost for construction per SF VS. CSU Average Within Average NA PDC Annual
We can’t track this as the costs have not been updated by the CSU
Return on Assets Asset Life Cycle 100% 40% Work Center Management Annual
Dependable Service Measurements Target FY 14-15 Responsible Frequency Notes
Work Quality Customer Survey Scores 8 out of 10 8.81Department
Directors and Managers
Annual Avg. of the dept.
Quality of Communication Customer Survey Scores 8 out of 10 8.25Department
Directors and Managers
Annual Avg. of the dept.
Cost Recovery On- time Completion 95% 89%Department
Directors and Managers
Monthly Avg. of the dept.
Aesthetic, clean, well maintaned Work
EnvironmentCustomer Survey Scores 8 out of 10 8.25
Grounds, Maintenance, and
CustodialAnnual
8.25- Quality of classroom, office, and meeting facilities & campus
grounds
Effectiveness/Efficiency Measurements Target FY 14-15 Responsible Frequency Notes
Productivity % Chargeable Time vs. Unchargeable 70% 81%
Department Directors and
ManagersMonthly Avg. of the dept.
Sustainability APPA Module >80% 85% PDC Annual
LEED/Cal-Green Platinum/T-II Gold PDC Annual
On-Time Completion Milestone/WO Tracking >=95% 73% Monthly Avg. of the dept.
On-Budget Completion Budget Tracking >=90% 97% Monthly Avg. of the dept.
Development Opportunities Measurements Target FY 14-15 Responsible Frequency Notes
Skilled Training Actual training received VS. estimated or planned 100% 81% Linda Covarrubias Annual
Safety Training Actual training received VS. estimated or planned 90% 65% Annual Measured by EH&S and
Access Database
Employee Survey Satisfied or better >65% 59% Annual
Legend: 80%-100% 59%-79% 58-Below
FY 2014-2015 FS Scorecard
Managers and Employee Services
Fin
anci
al
Department Directors and
Managers
Department Directors and
Managers
Service Efficiency
Cu
stom
er
Inte
rnal
Le
arn
ing
APPA Service Level Level II 2 Annual
Reduce to level 3 (next FY). CUS= Level 2, GRO=
Level 2, and Maint. Stores= Level 3
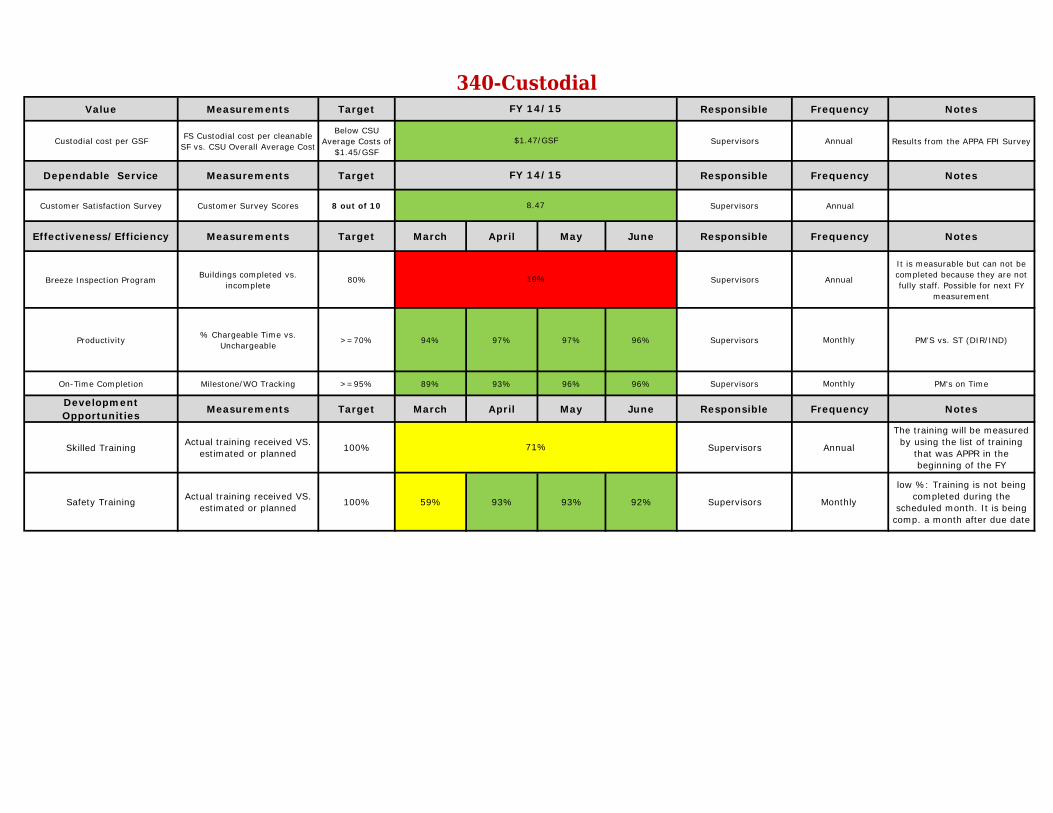
Value Measurements Target Responsible Frequency Notes
Custodial cost per GSF FS Custodial cost per cleanable SF vs. CSU Overall Average Cost
Below CSU Average Costs of
$1.45/GSF Supervisors Annual Results from the APPA FPI Survey
Dependable Service Measurements Target Responsible Frequency Notes
Customer Satisfaction Survey Customer Survey Scores 8 out of 10 Supervisors Annual
Effectiveness/Efficiency Measurements Target March April May June Responsible Frequency Notes
Breeze Inspection Program Buildings completed vs. incomplete
80% Supervisors Annual
It is measurable but can not be completed because they are not fully staff. Possible for next FY
measurement
Productivity % Chargeable Time vs. Unchargeable >=70% 94% 97% 97% 96% Supervisors Monthly PM'S vs. ST (DIR/IND)
On-Time Completion Milestone/WO Tracking >=95% 89% 93% 96% 96% Supervisors Monthly PM's on Time
Development Opportunities Measurements Target March April May June Responsible Frequency Notes
Skilled Training Actual training received VS. estimated or planned 100% Supervisors Annual
The training will be measured by using the list of training
that was APPR in the beginning of the FY
Safety Training Actual training received VS. estimated or planned 100% 59% 93% 93% 92% Supervisors Monthly
low %: Training is not being completed during the
scheduled month. It is being comp. a month after due date
71%
340-Custodial FY 14/15
$1.47/GSF
8.47
FY 14/15
19%

Value Measurement Target Responsible Frequency Notes
Maintenance Costs per GSF FS Maintenance cost per GSF vs. CSU Overall Average Cost
Below CSU Average Costs of
$2.14/GSFFS Support Annual Results from the APPA
FPI Survey
Dependable Service Measurement Target July August September October November December January February March April May June Responsible Frequency Notes
Cost Recovery On-time Completion 95% 90% 69% Sharon Seravic Monthly
Effectiveness/Efficiency Measurement Target July August September October November December January February March April May June Responsible Frequency Notes
Work Order Completion Rate Priority 3
Average Time to Complete Work Orders for priority 3 (30 days) 100% 43% 73% 88% 84% 87% 86% 83% 92% 93% 82% 90% 93% Bianca Acosta Monthly
Work Order Completion Rate Priority 1
Average Time to Complete Work Orders for Priority 1 (7 days) 100% 76% 31% 62% 70% 34% 53% 79% 49% 56% 58% 56% 59% Tim Berndtson Monthly
Reactive WO %Indicates percentage of total regular maintenance work that is reactive or
unscheduled.<10% 16% 15% 23% 11% 10% 29% 18% 21% 17% 25% 11% 21% Work Center Monthly
Work Backlog in Crew Weeks Monthly report of estimated man hours in backlog and waiting to be scheduled. <4 Weeks 2.5 weeks 1.2 NA 3 weeks 4.2 16.65 Sharon Seravic Monthly
Wrench TimeWrench time report to show direct time spent on WOs vs. indirect time (Shop
Time)>70% 64% 70% 68% 65% 75% 73% 77% 71% 77% 82% 83% 82% Bianca Acosta Monthly
Projects On budget vs. actuals 95% 100% 97% 85% 92% 97% 96% 100% 100% 100% 100% 99% 94% Jeanne Burgin Monthly
Projects Scheduled vs. actuals 95% 31% 23% 19% 34% 27% 42% 77% 88% 55% 18% 73% 67% Bianca Acosta Monthly
HRE Comp Rates WOs to be completed within 7 working days for student support 95% 45% 44% 73% 52% 61% 40% 60% 33% 39% 50% 27% 86% Sharon Seravic Monthly
Development Opportunities Measurement Target July August September October November December January February March April May June Responsible Frequency Notes
Skilled Training Actual training received VS. estimated or planned 100% Managers Annual
Safety Training Actual training received VS. estimated or planned 85% 71% NA 64% 97% 50% 35% 46% 37% Managers AnnualNA
330-Operations
96%
NA
$1.88/GSF
FY 14-15
NA
NA

Value Measurements Target Responsible Frequency Notes
$ Cost per acre Landscaping costs per Sq.Ft vs. CSU overall average cost
Below CSU Average Costs of
$5.55k/GSFManager Annual
Results from the APPA FPI Survey
Dependable Service Measurements Target March April May June Responsible Frequency Notes
Customer Service Scores Do the services meet or surpass the customer
expectations 8+ out of 10 Manager Annual Campus Facility Survey
Cost Recovery On-time Completion 95% 98% 98% 100% 100% Manager Monthly Web Works
Effectiveness/Efficiency Measurements Target March April May June Responsible Frequency Notes
Reduce recycled water consumption
Inspection of equipment, reports and measure areas for reduction of recycled
water
>20% 30% 30% 30% 30% Manager Monthly SmartLink Web Reports
On-Time Completion Milestone/WO Tracking >=95% 98% 98% 100% 100% Manager Monthly Web Works
Productivity % Chargeable Time vs. Unchargeable 70% 80% 85% 85% 90% Manager Monthly Web Works
Development Opportunities Measurements Target March April May June Responsible Frequency Notes
Skilled Training Actual training received VS. estimated or planned
100% 68% Manager Annual
Safety Training Actual training received VS. estimated or planned
95% 88% 47% 76% 85% Manager Monthly
58%
FY 14-15
$4,439.16/GSF
345-Landscaping
9 out of 10

Value Measurement Target Actuals Responsible Frequency Notes
PDC Contractor Costs per SF
Total cost for construction per SF VS. CSU Average Within Average NA John Gormley Annual We can’t track this as the costs have not been
updated by the CSU
Dependable Service Measurements Target Actuals Responsible Frequency Notes
West Hall 0.003%West Hall exceeded our goals, which allowed the
project to deliver additional scope that will serve the academic needs of the campus.
Student Housing 0% Project is just starting constructionDining 0% Project is just starting construction
Productivity % Chargeable Time vs. Unchargeable 70% 0% John/Susan Quarterly This metric was not tracked as changes in budgeting were implemented.
Effectiveness Measurements Target Actuals Responsible Frequency Notes
West Hall The Project provided 4 additional instructional labs
approximately 3,285 SF
Student HousingThe Project is attempting to provide additional
infrastructure that will serve the campus' needs.
Dining The Project is attempting to provide additional
infrastructure that will serve the campus' needs.
LEED "Platinum" Cal-Green Tier II
West Hall Terry Tarr QuarterlyWest Hall meets a LEED "Gold" level equivalency if the
project went through certification.LEED "Platinum" Cal-
Green Tier II SH3 Terry Tarr Quarterly
SH3 project was submitted to LEED and in process of their review.
Cal-Green Tier II SH3 Quarterly
CA Green: SCB has issued a draft of the CA Green matrix but it needed some work so I am waiting on the revised version
of that but call it 50% at least.
Development Opportunities Measurements Target Actuals Responsible Frequency Notes
Transfer of Knowledge All staff become "knowledge leaders". Cross Training to ensure transfer of
knowledge 100% NA Susan Davis NA Not Applicable this year. Will apply to next FY15-
16
John Gormley-AIA 100% Bi-Annual Due Oct 2017Terry Tarr-AIA 100% Bi-Annual Due Feb 2017
Terry Tarr-LEED Green 40% 15 hours 2 Yrs Cal Green 6 hrs in May 2015-OngoingDavid Carlson-AIA 100% Bi-Annual Due Jan 2018David Carlson-CAS 100% 3 Years Due Mar 2016
Dan Gerrard-OSHPOD 100% 3 Years Due 9/30/2016
Skilled Training Actual training received VS. estimated or planned
100% 100% Susan Davis Annual
320/350- PDC
Prepare project scorecard template & post construction assessment
Achieve and maintain appropriate Certification/
Licensure 100% NA
Track all change orders "errors & omissions"
<3% of const.budget
Incorporate sustainable strategies
Susan Davis Monthly
Maintain original overall project duration while maximizing the built
project scope for avail. Budget
90% of all projectsAll projects are on
schedule and within approved budgets.
PM Quarterly
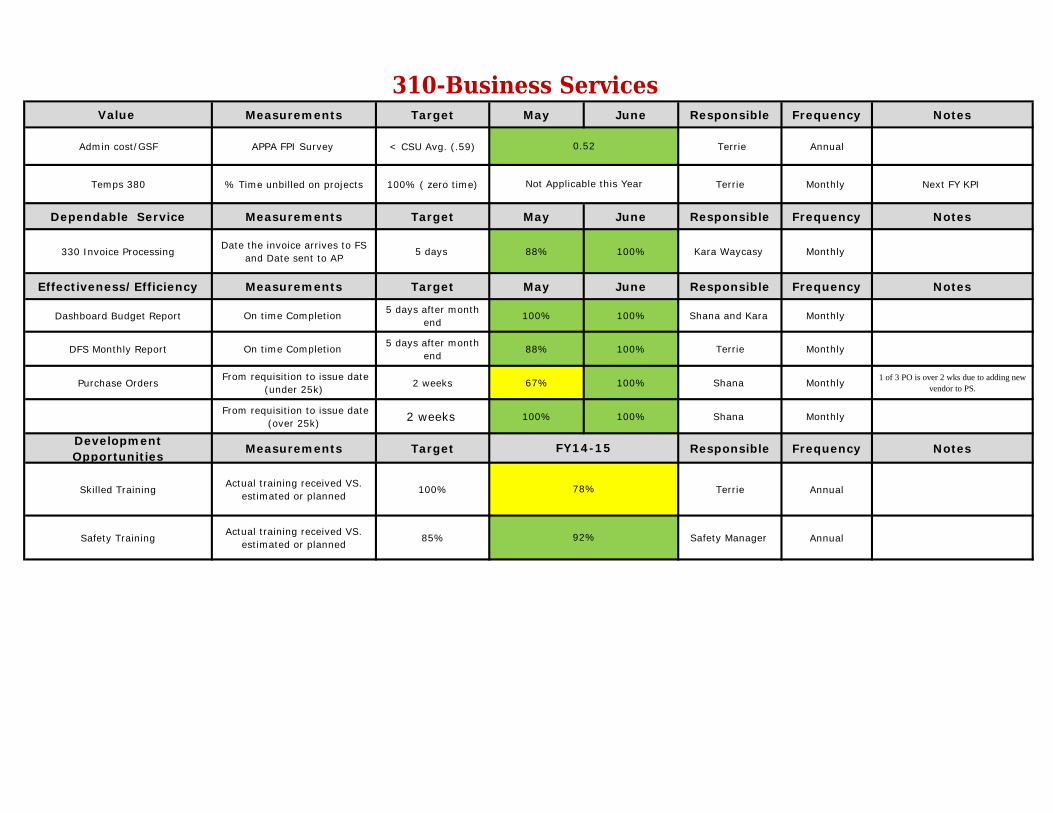
Value Measurements Target May June Responsible Frequency Notes
Admin cost/GSF APPA FPI Survey < CSU Avg. (.59) Terrie Annual
Temps 380 % Time unbilled on projects 100% ( zero time) Terrie Monthly Next FY KPI
Dependable Service Measurements Target May June Responsible Frequency Notes
330 Invoice Processing Date the invoice arrives to FS and Date sent to AP 5 days 88% 100% Kara Waycasy Monthly
Effectiveness/Efficiency Measurements Target May June Responsible Frequency Notes
Dashboard Budget Report On time Completion 5 days after month end
100% 100% Shana and Kara Monthly
DFS Monthly Report On time Completion 5 days after month end
88% 100% Terrie Monthly
Purchase Orders From requisition to issue date (under 25k) 2 weeks 67% 100% Shana Monthly 1 of 3 PO is over 2 wks due to adding new
vendor to PS.
From requisition to issue date (over 25k) 2 weeks 100% 100% Shana Monthly
Development Opportunities Measurements Target Responsible Frequency Notes
Skilled Training Actual training received VS. estimated or planned 100% Terrie Annual
Safety Training Actual training received VS. estimated or planned 85% Safety Manager Annual92%
0.52
310-Business Services
78%
Not Applicable this Year
FY14-15

Value Measurements Target FY 14/15 Responsible Frequency Notes
Efficient Hiring Process Hiring employees on a timely
basis50% 50% Linda Quarterly
Turnaround hinges on signature approval by VP and
AVP of Financial Services
Dependable Service Measurements Target FY 14/15 Responsible Frequency Notes
Temp hire turnaround time Track spreadsheet from
beginning to end(2 months) and follow up
50% 50% Linda Annual
Turnaround hinges on signature approval by VP and
AVP of Financial Services
Effectiveness/Efficiency Measurements Target FY 14/15 Responsible Frequency Notes
Document ProcessTracking spreadsheet between
FS and other departments 80% 50% Linda Annual
Development Opportunities Measurements Target FY 14/15 Responsible Frequency Notes
Skilled Training Actual training received VS. estimated or planned 100% 100% Linda Annual
Safety Training Actual training received VS. estimated or planned 85% 75% Safety Coordinator Annual
310-Employee Services

Value Measurement Target FY14-15 Responsible Frequency Notes
Maintenance Stores Stock value, annual inventory NA $ 533,744.99 Work Center
Management Annual
Maintenance Stores annual turnover dollars $ NA $ 2,609,843.56 Work Center
Management Annual
Dependable Service Measurements Target June Responsible Frequency Notes
Stock to WO's On time vs late 100% 73% Karl Richert Monthly
Effectiveness/Efficiency Measurements Target June Responsible Frequency Notes
Request to Purchase Stock on hand On time (24 hr) completion 100% 82% Chris Rice Monthly
Receiving Received on time after item/product arrives 100% 79% Maintenance Store
Management Monthly
Development Opportunities Measurements Target FY14-15 Responsible Frequency Notes
Skilled Training Actual training received
VS. estimated or planned
100% NA Linda Annual No Skilled Training was required for FY14-15
Safety TrainingActual training received
VS. estimated or planned
90% 28% Safety Coordinator Monthly
330-Maintenance Stores
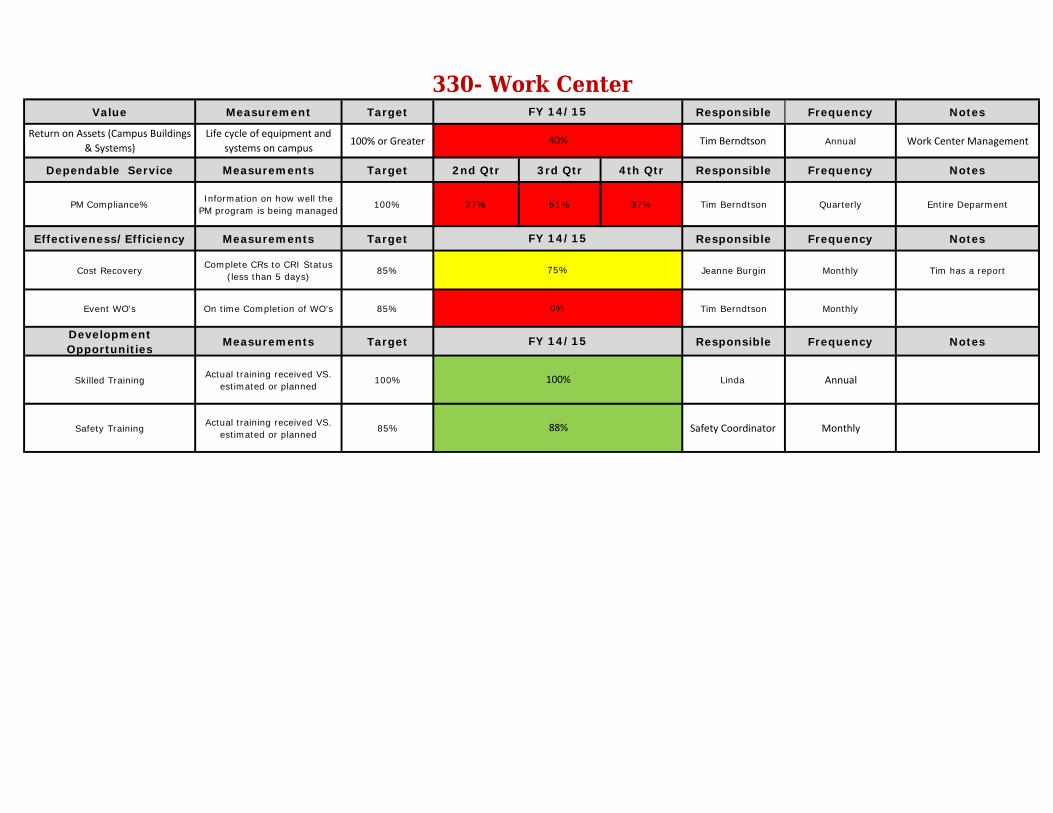
Value Measurement Target Responsible Frequency Notes
Return on Assets (Campus Buildings & Systems)
Life cycle of equipment and systems on campus 100% or Greater Tim Berndtson Annual Work Center Management
Dependable Service Measurements Target 2nd Qtr 3rd Qtr 4th Qtr Responsible Frequency Notes
PM Compliance% Information on how well the PM program is being managed 100% 27% 51% 37% Tim Berndtson Quarterly Entire Deparment
Effectiveness/Efficiency Measurements Target Responsible Frequency Notes
Cost Recovery Complete CRs to CRI Status (less than 5 days) 85% Jeanne Burgin Monthly Tim has a report
Event WO's On time Completion of WO's 85% Tim Berndtson Monthly
Development Opportunities Measurements Target Responsible Frequency Notes
Skilled Training Actual training received VS. estimated or planned
100% Linda Annual
Safety Training Actual training received VS. estimated or planned
85% Safety Coordinator Monthly
330- Work Center
40%
100%
FY 14/15
FY 14/15
88%
FY 14/15
75%
0%

FY 15-16 Proposed Strategic Initiatives
• Facilities Services Strategic Initiative Planned Action Report
• PDC Strategic Initiative Planned Action Report
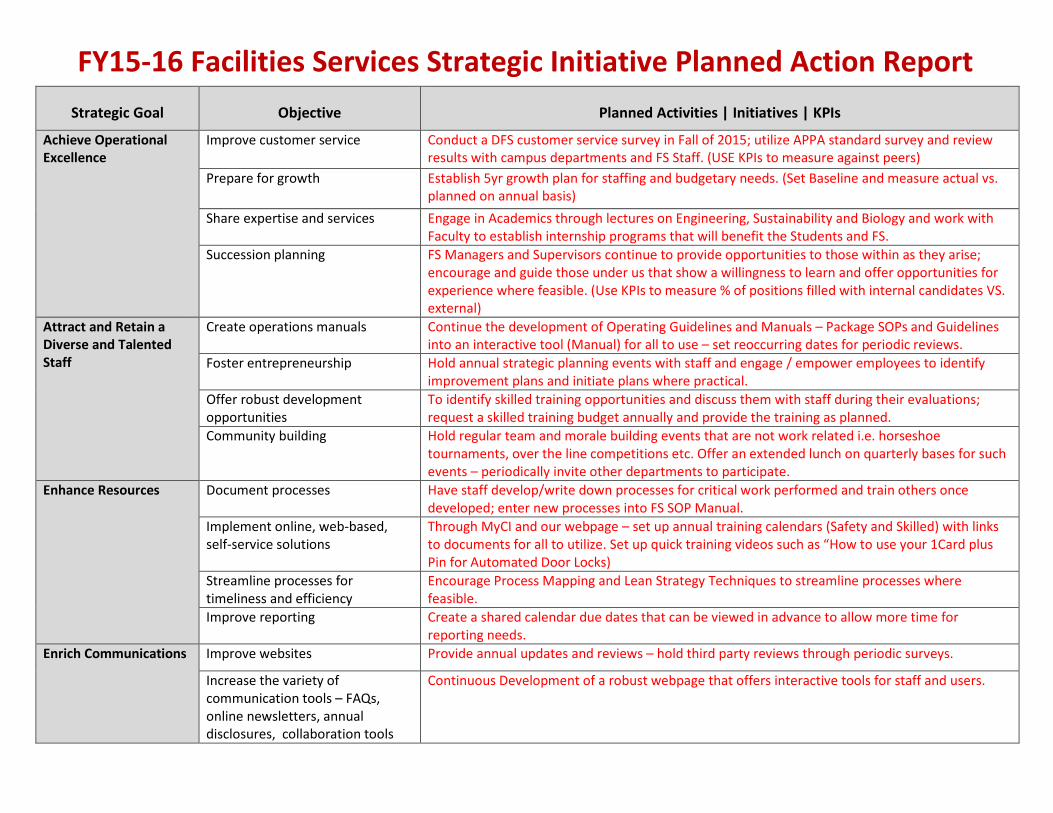
FY15-16 Facilities Services Strategic Initiative Planned Action Report Strategic Goal Objective Planned Activities | Initiatives | KPIs
Achieve Operational Excellence
Improve customer service Conduct a DFS customer service survey in Fall of 2015; utilize APPA standard survey and review results with campus departments and FS Staff. (USE KPIs to measure against peers)
Prepare for growth Establish 5yr growth plan for staffing and budgetary needs. (Set Baseline and measure actual vs. planned on annual basis)
Share expertise and services Engage in Academics through lectures on Engineering, Sustainability and Biology and work with Faculty to establish internship programs that will benefit the Students and FS.
Succession planning FS Managers and Supervisors continue to provide opportunities to those within as they arise; encourage and guide those under us that show a willingness to learn and offer opportunities for experience where feasible. (Use KPIs to measure % of positions filled with internal candidates VS. external)
Attract and Retain a Diverse and Talented Staff
Create operations manuals Continue the development of Operating Guidelines and Manuals – Package SOPs and Guidelines into an interactive tool (Manual) for all to use – set reoccurring dates for periodic reviews.
Foster entrepreneurship Hold annual strategic planning events with staff and engage / empower employees to identify improvement plans and initiate plans where practical.
Offer robust development opportunities
To identify skilled training opportunities and discuss them with staff during their evaluations; request a skilled training budget annually and provide the training as planned.
Community building Hold regular team and morale building events that are not work related i.e. horseshoe tournaments, over the line competitions etc. Offer an extended lunch on quarterly bases for such events – periodically invite other departments to participate.
Enhance Resources Document processes Have staff develop/write down processes for critical work performed and train others once developed; enter new processes into FS SOP Manual.
Implement online, web-based, self-service solutions
Through MyCI and our webpage – set up annual training calendars (Safety and Skilled) with links to documents for all to utilize. Set up quick training videos such as “How to use your 1Card plus Pin for Automated Door Locks)
Streamline processes for timeliness and efficiency
Encourage Process Mapping and Lean Strategy Techniques to streamline processes where feasible.
Improve reporting Create a shared calendar due dates that can be viewed in advance to allow more time for reporting needs.
Enrich Communications Improve websites Provide annual updates and reviews – hold third party reviews through periodic surveys.
Increase the variety of communication tools – FAQs, online newsletters, annual disclosures, collaboration tools
Continuous Development of a robust webpage that offers interactive tools for staff and users.
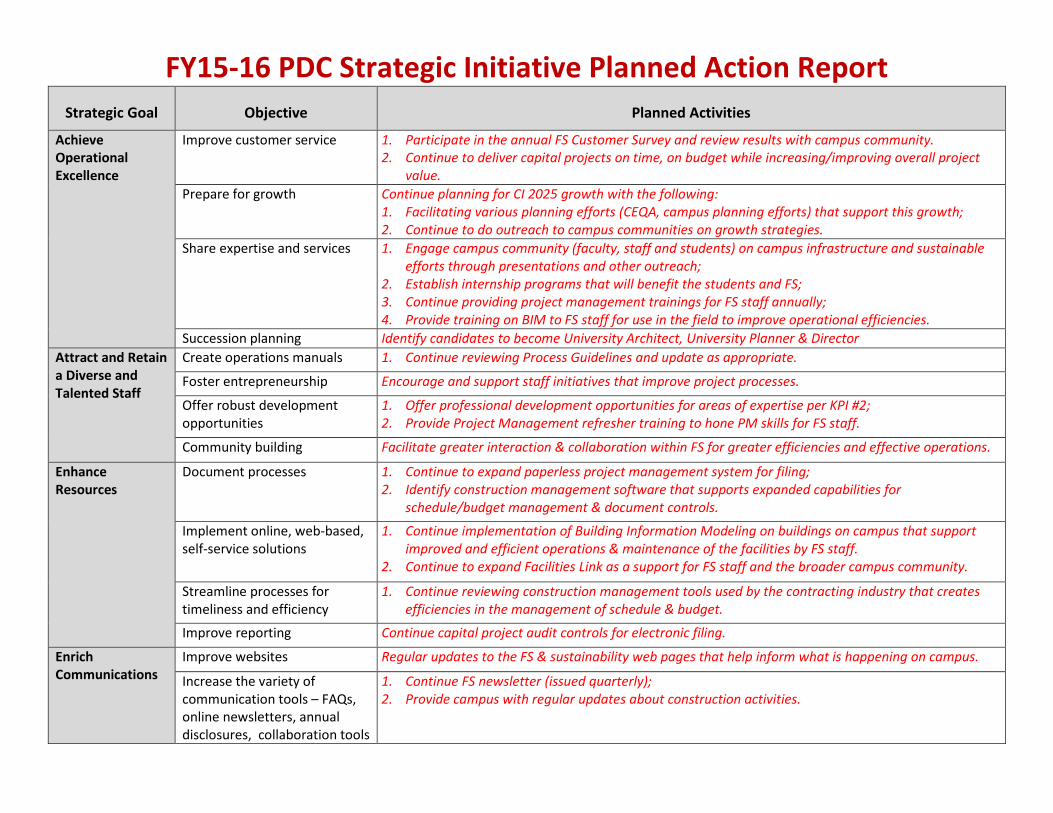
FY15-16 PDC Strategic Initiative Planned Action Report Strategic Goal Objective Planned Activities
Achieve Operational Excellence
Improve customer service 1. Participate in the annual FS Customer Survey and review results with campus community.2. Continue to deliver capital projects on time, on budget while increasing/improving overall project
value.Prepare for growth Continue planning for CI 2025 growth with the following:
1. Facilitating various planning efforts (CEQA, campus planning efforts) that support this growth;2. Continue to do outreach to campus communities on growth strategies.
Share expertise and services 1. Engage campus community (faculty, staff and students) on campus infrastructure and sustainableefforts through presentations and other outreach;
2. Establish internship programs that will benefit the students and FS;3. Continue providing project management trainings for FS staff annually;4. Provide training on BIM to FS staff for use in the field to improve operational efficiencies.
Succession planning Identify candidates to become University Architect, University Planner & Director Attract and Retain a Diverse and Talented Staff
Create operations manuals 1. Continue reviewing Process Guidelines and update as appropriate.
Foster entrepreneurship Encourage and support staff initiatives that improve project processes.
Offer robust development opportunities
1. Offer professional development opportunities for areas of expertise per KPI #2;2. Provide Project Management refresher training to hone PM skills for FS staff.
Community building Facilitate greater interaction & collaboration within FS for greater efficiencies and effective operations.
Enhance Resources
Document processes 1. Continue to expand paperless project management system for filing;2. Identify construction management software that supports expanded capabilities for
schedule/budget management & document controls.
Implement online, web-based, self-service solutions
1. Continue implementation of Building Information Modeling on buildings on campus that supportimproved and efficient operations & maintenance of the facilities by FS staff.
2. Continue to expand Facilities Link as a support for FS staff and the broader campus community.
Streamline processes for timeliness and efficiency
1. Continue reviewing construction management tools used by the contracting industry that createsefficiencies in the management of schedule & budget.
Improve reporting Continue capital project audit controls for electronic filing.
Enrich Communications
Improve websites Regular updates to the FS & sustainability web pages that help inform what is happening on campus.
Increase the variety of communication tools – FAQs, online newsletters, annual disclosures, collaboration tools
1. Continue FS newsletter (issued quarterly);2. Provide campus with regular updates about construction activities.