fy 12 scrap tire report - marylandmde.maryland.gov/programs/land/documents/... · metro golf cart...
TRANSCRIPT
Department of the Environment
MARYLAND SCRAP TIRE ANNUAL REPORT – Fiscal Year 2012 –
Prepared by: Land Management Administration
Prepared for: Senate Education, Health and Environmental Affairs Committee
House Environmental Matters Committee
November 2012
MARYLAND DEPARTMENT OF THE ENVIRONMENT 1800 Washington Boulevard │ Baltimore, MD 21230 │ www.mde.state.md.us
410-537-3314 │ 800-633-6101 x3314 │ TTY Users: 800-735-2258 Martin O’Malley, Governor │ Anthony G. Brown, Lt. Governor │ Robert M. Summers, Ph.D., Secretary


TABLE OF CONTENTS EXECUTIVE SUMMARY .......................................................................................................... 1
INTRODUCTION..........................................................................................................................................................1 ACCOMPLISHMENTS AND RESULTS ...........................................................................................................................1 FINANCIAL STATEMENT SUMMARY...........................................................................................................................1 LEGISLATIVE UPDATE ...............................................................................................................................................2
OVERVIEW.................................................................................................................................. 3 SCRAP TIRE STOCKPILE CLEANUPS.................................................................................. 3
OBJECTIVE.................................................................................................................................................................3 ACCOMPLISHMENTS ..................................................................................................................................................4 FY 2013 ONGOING STOCKPILE CLEANUPS ................................................................................................................5 COST RECOVERY ACTIONS......................................................................................................................................11
SCRAP TIRE PROJECTS......................................................................................................... 12 PROJECTS INITIATED DURING FY 2012 ...................................................................................................................13 PROJECTS CONTINUING FROM PREVIOUS YEARS.....................................................................................................13 SCRAP TIRE PROJECTS PLANNED FOR FY 2013 .......................................................................................................14
LICENSING ................................................................................................................................ 14 LICENSING ACCOMPLISHMENTS IN FY 2012 ...........................................................................................................15
SCRAP TIRE MARKETS AND MARKET DEVELOPMENT ............................................ 15 MARKET ANALYSIS.................................................................................................................................................15 MARYLAND’S SCRAP TIRE FLOW AND DESTINATIONS ............................................................................................17
COMPLIANCE AND ENFORCEMENT ACTIVITIES........................................................ 19 STRATEGIES FOR COMPLIANCE AND ENFORCEMENT ACTIONS IN FY 2012 .............................................................19 ACCOMPLISHMENTS IN FY 2012 .............................................................................................................................19
TABLE OF FIGURES & TABLES
FIGURE 1 – MARYLAND SCRAP TIRE PROCESSING CAPACITY.........................................................15 FIGURE 2 – MARYLAND GENERATED SCRAP TIRE MANAGEMENT..................................................16 FIGURE 3 – SCRAP TIRE FLOW IN FY 2012 .....................................................................................18 FIGURE 4 – INSPECTIONS AND SPOT CHECKS ..................................................................................19 FIGURE 5 – NUMBER OF ENFORCEMENT ACTIONS ..........................................................................20
TABLE I – MARYLAND USED TIRE CLEANUP AND RECYCLING FUND FY 2012 REVENUES AND EXPENDITURES..............................................................................................................2
TABLE II – SCRAP TIRE CLEANUP SITES COMPLETED IN FY 2012 ....................................................4 TABLE III – SCRAP TIRE STOCKPILE CLEANUPS ONGOING IN FY 2013.............................................6 TABLE IV – MARYLAND INITIATED COST RECOVERY ACTIONS THROUGH FY 2012......................11 TABLE V – SCRAP TIRE LICENSES IN FY 2012................................................................................15 TABLE VI – MARYLAND LICENSED SCRAP TIRE PROCESSING FACILITIES ......................................18 TABLE VII – SCRAP TIRE COMPLIANCE AND ENFORCEMENT IN FY 2012.......................................21
The Waste Diversion and Utilization Program of the Maryland Department of the Environment produced this report. Contents may be used without permission, provided credit is given.
This Report is Printed on Recycled Paper With 100% Post Consumer Fiber.

1
Executive Summary
Introduction This is the Fiscal Year (“FY”) 2012 Scrap Tire Annual Report as required by Environment Article, Section 9-275(b), which is prepared for the standing committees of the Maryland General Assembly. The report addresses Maryland’s Scrap Tire Program activities as undertaken by the Maryland Department of the Environment (“the Department” or “MDE”) and the Maryland Environmental Service (“MES”) from July 2011 through June 2012, and describes activities for the coming year.
Accomplishments and Results • Maryland generated an estimated 5.8 million scrap tires in FY 2012 that were managed in the
following manner: Recycled or used as fuel in Maryland (71 percent) and exported to other states for disposal, recycling, or used as fuel (29 percent).
• Maryland’s licensed scrap tire facilities processed 7.7 million scrap tires in FY 2012, including 4.1 million Maryland-generated scrap tires and 3.6 million scrap tires imported from out-of-State.
• Approximately 80 percent of the tires processed in Maryland were recycled and 20 percent were used as supplemental fuel in cement plants and waste-to-energy facilities.
• Since the inception of the Scrap Tire Program in 1992, over 10.6 million scrap tires have been recovered from 916 stockpile cleanup sites.
• During FY 2012, a total of 56 illegal scrap tire stockpile sites were cleaned up and approximately 1,028,821 tires were removed.
• Approximately 96 percent of all stockpile site cleanups accomplished in FY 2012 were achieved by administrative enforcement, without using the Used Tire Cleanup and Recycling Fund (“the Fund”).
• A total of 209 new scrap tire licenses were issued. • A total of 63 scrap tire licenses were renewed. • At the end of FY 2012, there were a total of 3,256 valid Maryland scrap tire licenses. • MDE inspectors performed 598 scrap tire site inspections/investigations.
Financial Statement Summary The Environment Article, Section 9-275, Annotated Code of Maryland, provides the
Department with the responsibility for administering the Fund. The Fund is generated through the collection of an eighty cent ($0.80) per tire recycling fee
on the first sale of any new tire in the State. Gross tire fee revenues to the Fund were significantly lower (26%) in FY 2012 than in FY
2011. However, that amount is somewhat skewed because in FY 2011 the Maryland Comptroller’s office forwarded 5 quarters of revenue to the Department, rather than the usual 4 quarters. During FY 2012, the Comptroller’s office forwarded 4 quarters of revenue.
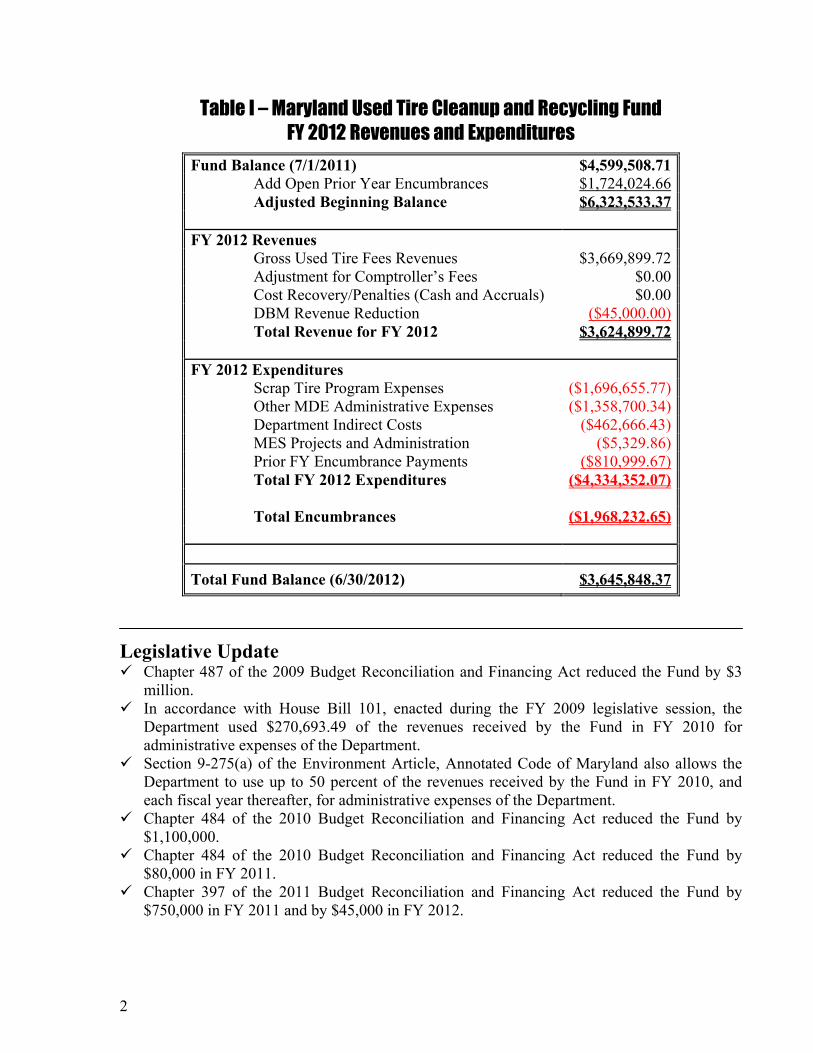
Table I summarizes the Scrap Tire Program expenditures for FY 2012.
2
Table I – Maryland Used Tire Cleanup and Recycling Fund FY 2012 Revenues and Expenditures
Fund Balance (7/1/2011) $4,599,508.71 Add Open Prior Year Encumbrances $1,724,024.66 Adjusted Beginning Balance $6,323,533.37 FY 2012 Revenues Gross Used Tire Fees Revenues $3,669,899.72 Adjustment for Comptroller’s Fees $0.00 Cost Recovery/Penalties (Cash and Accruals) $0.00 DBM Revenue Reduction ($45,000.00) Total Revenue for FY 2012 $3,624,899.72 FY 2012 Expenditures Scrap Tire Program Expenses ($1,696,655.77) Other MDE Administrative Expenses ($1,358,700.34) Department Indirect Costs ($462,666.43) MES Projects and Administration ($5,329.86) Prior FY Encumbrance Payments ($810,999.67) Total FY 2012 Expenditures ($4,334,352.07) Total Encumbrances ($1,968,232.65) Total Fund Balance (6/30/2012) $3,645,848.37
Legislative Update
Chapter 487 of the 2009 Budget Reconciliation and Financing Act reduced the Fund by $3 million.
In accordance with House Bill 101, enacted during the FY 2009 legislative session, the Department used $270,693.49 of the revenues received by the Fund in FY 2010 for administrative expenses of the Department.
Section 9-275(a) of the Environment Article, Annotated Code of Maryland also allows the Department to use up to 50 percent of the revenues received by the Fund in FY 2010, and each fiscal year thereafter, for administrative expenses of the Department.
Chapter 484 of the 2010 Budget Reconciliation and Financing Act reduced the Fund by $1,100,000.
Chapter 484 of the 2010 Budget Reconciliation and Financing Act reduced the Fund by $80,000 in FY 2011.
Chapter 397 of the 2011 Budget Reconciliation and Financing Act reduced the Fund by $750,000 in FY 2011 and by $45,000 in FY 2012.
3
In accordance with the Environment Article, Section 9-275(a), Annotated Code of Maryland, the Department used $354,098.65 of the revenues received by the Fund in FY 2011 for administrative expenses of the Department.
In accordance with the Environment Article, Section 9-275(a), Annotated Code of Maryland, the Department used $1,358,700.34 of the revenues received by the Fund in FY 2012 for administrative expenses of the Department.
Overview This report has been prepared for the Senate Education, Health, and Environmental Affairs Committee and the House Environmental Matters Committee, as required by the scrap tire law, to advise the Standing Committees of the Department’s progress in implementing the law and ensuring the proper management of scrap tires in Maryland. This report includes additional information about the program and future activities. The Scrap Tire Recycling Act established a mechanism for the cleanup of scrap tire stockpiles and for the collection, transportation, and recycling or processing of all scrap tires that are generated annually in Maryland. The Act established the Fund to support the Scrap Tire Program.
The Department uses the Fund for administration of the program, licensing activities, stockpile cleanups, enforcement/compliance, remedial actions, and for the development and distribution of public information concerning scrap tire issues.
Under the Department’s authorization, MES may use portions of the Fund to implement and oversee programs established as part of a Scrap Tire Recycling System and other projects that reduce, recover, and/or recycle scrap tires.
Scrap Tire Stockpile Cleanups Objective The Department’s Scrap Tire Cleanup Objective for FY 2012, to initiate the planning and cleanup process for 100 percent of illegal scrap tire stockpile sites identified during the year, was accomplished. During FY 2012, the Scrap Tire Program continued cleanup and recovery of the remaining 2.06 million scrap tires identified in stockpiles at the end of FY 2011, along with those scrap tires from 58 stockpiles newly identified during the year. In order to achieve this goal, the following strategies were undertaken:
The initial employment of administrative enforcement procedures to persuade property owners to remove stockpiles using their own resources.
Use of the Fund to clean up stockpile sites only when administrative enforcement efforts were unsuccessful.

4
Targeting efforts toward eliminating all scrap tire stockpile sites. Seeking cost recovery from responsible parties for Department expenses
incurred at sites that are not eligible for exemption.
Accomplishments Since the inception of the Scrap Tire Program in 1992, over 10.6 million scrap tires have been recovered from completed and ongoing stockpile cleanup sites. During FY 2012, the Scrap Tire Program successfully completed cleanup of 56 illegal scrap tire stockpiles, consisting of approximately 1,028,821 scrap tires. These sites were located in 16 of the State’s 24 jurisdictions and ranged in size from 15 to 845,160 tires (see Table II for a list of stockpile cleanups completed during FY 2012). The Scrap Tire Program also initiated the planning and cleanup process for the 58 illegal scrap tire stockpile sites newly identified during FY 2012. Most of the scrap tire stockpile cleanups occurred without using the Fund. Ninety-six percent (96%) of all stockpile abatements completed in FY 2012 – 54 of 56 completed stockpile cleanups – used the administrative approach. The two remaining sites qualified for the inheritance exemption for cost recovery and were conducted using the Fund (in bold below).
Table II – Scrap Tire Cleanup Sites Completed in FY 2012
Site Name
County Initial Number
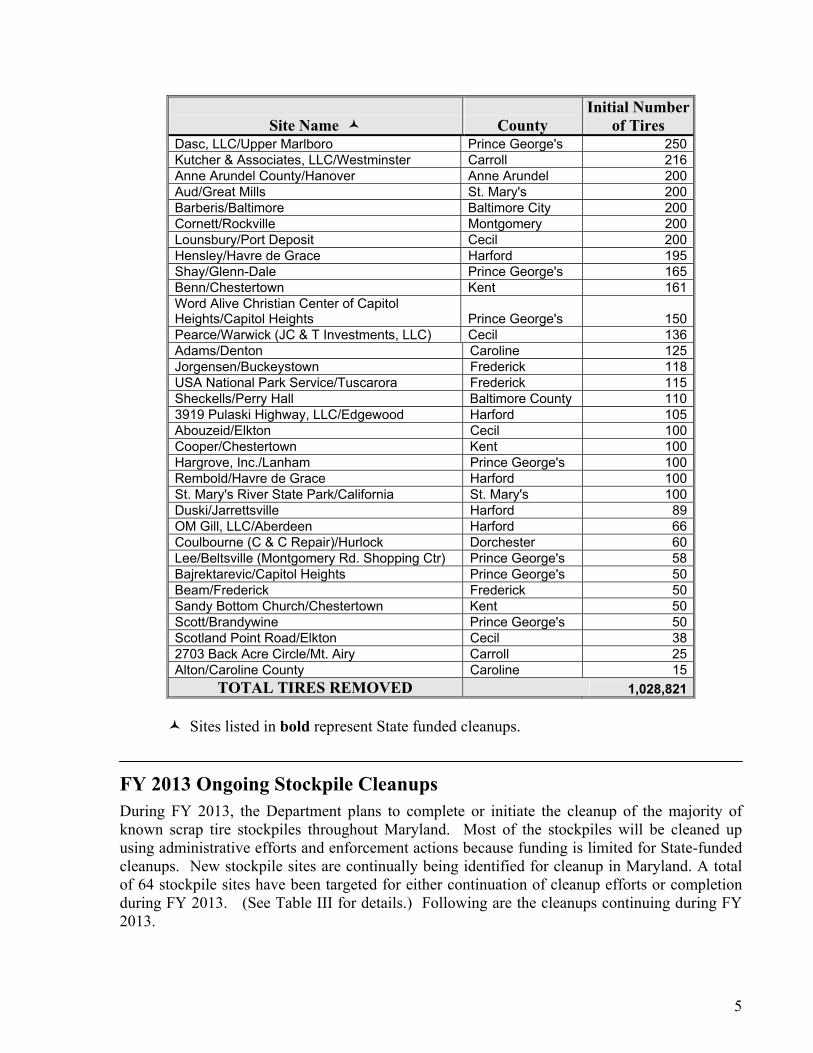
of Tires Garner/Brandywine - Ravines 1-4 Prince George's 845,160Polvi/Brandywine Prince George's 103,406Tucker/West River Anne Arundel 37,000P & J Contracting, LLC/Baltimore Baltimore City 10,659Grant County Mulch/Laurel Prince George's 8,642SOMCO Towing & Salvage/Westover Somerset 6,800Miller/Damascus Montgomery 1,988Sprig, LLC/Glen Burnie Anne Arundel 1,334Touchstone Perryville, LLC/Perryville Cecil 1,260MacFarland/Ridgely #2 Caroline 1,100Reid/Darlington Harford 971DNR/Cedarville State Park #2 Prince George's 808Lofland/Sudlersville #2 Queen Anne's 700State of MD (DOT)/Baltimore Baltimore County 653Pennymac Corporation/Middle River Baltimore County 610Ben Lee Farms, Inc./Church Hill Queen Anne's 600Peterson/Baltimore Baltimore City 600Metro Golf Cart Rntls S&S, LLC/Brandywine Prince George's 592Delano/Federalsburg Caroline 500Piper/Oldtown Allegany 452Bauer/Middle River Baltimore County 400Maitland Terrace/Frederick Frederick 3619280 Edmonston Road/Greenbelt Prince George's 328
Sites listed in bold represent State funded cleanups.
5
Site Name
County
Initial Number of Tires
Dasc, LLC/Upper Marlboro Prince George's 250Kutcher & Associates, LLC/Westminster Carroll 216Anne Arundel County/Hanover Anne Arundel 200Aud/Great Mills St. Mary's 200Barberis/Baltimore Baltimore City 200Cornett/Rockville Montgomery 200Lounsbury/Port Deposit Cecil 200Hensley/Havre de Grace Harford 195Shay/Glenn-Dale Prince George's 165Benn/Chestertown Kent 161Word Alive Christian Center of Capitol Heights/Capitol Heights Prince George's 150Pearce/Warwick (JC & T Investments, LLC) Cecil 136Adams/Denton Caroline 125Jorgensen/Buckeystown Frederick 118USA National Park Service/Tuscarora Frederick 115Sheckells/Perry Hall Baltimore County 1103919 Pulaski Highway, LLC/Edgewood Harford 105Abouzeid/Elkton Cecil 100Cooper/Chestertown Kent 100Hargrove, Inc./Lanham Prince George's 100Rembold/Havre de Grace Harford 100St. Mary's River State Park/California St. Mary's 100Duski/Jarrettsville Harford 89OM Gill, LLC/Aberdeen Harford 66Coulbourne (C & C Repair)/Hurlock Dorchester 60Lee/Beltsville (Montgomery Rd. Shopping Ctr) Prince George's 58Bajrektarevic/Capitol Heights Prince George's 50Beam/Frederick Frederick 50Sandy Bottom Church/Chestertown Kent 50Scott/Brandywine Prince George's 50Scotland Point Road/Elkton Cecil 382703 Back Acre Circle/Mt. Airy Carroll 25Alton/Caroline County Caroline 15
TOTAL TIRES REMOVED 1,028,821 Sites listed in bold represent State funded cleanups.
FY 2013 Ongoing Stockpile Cleanups During FY 2013, the Department plans to complete or initiate the cleanup of the majority of known scrap tire stockpiles throughout Maryland. Most of the stockpiles will be cleaned up using administrative efforts and enforcement actions because funding is limited for State-funded cleanups. New stockpile sites are continually being identified for cleanup in Maryland. A total of 64 stockpile sites have been targeted for either continuation of cleanup efforts or completion during FY 2013. (See Table III for details.) Following are the cleanups continuing during FY 2013.
6
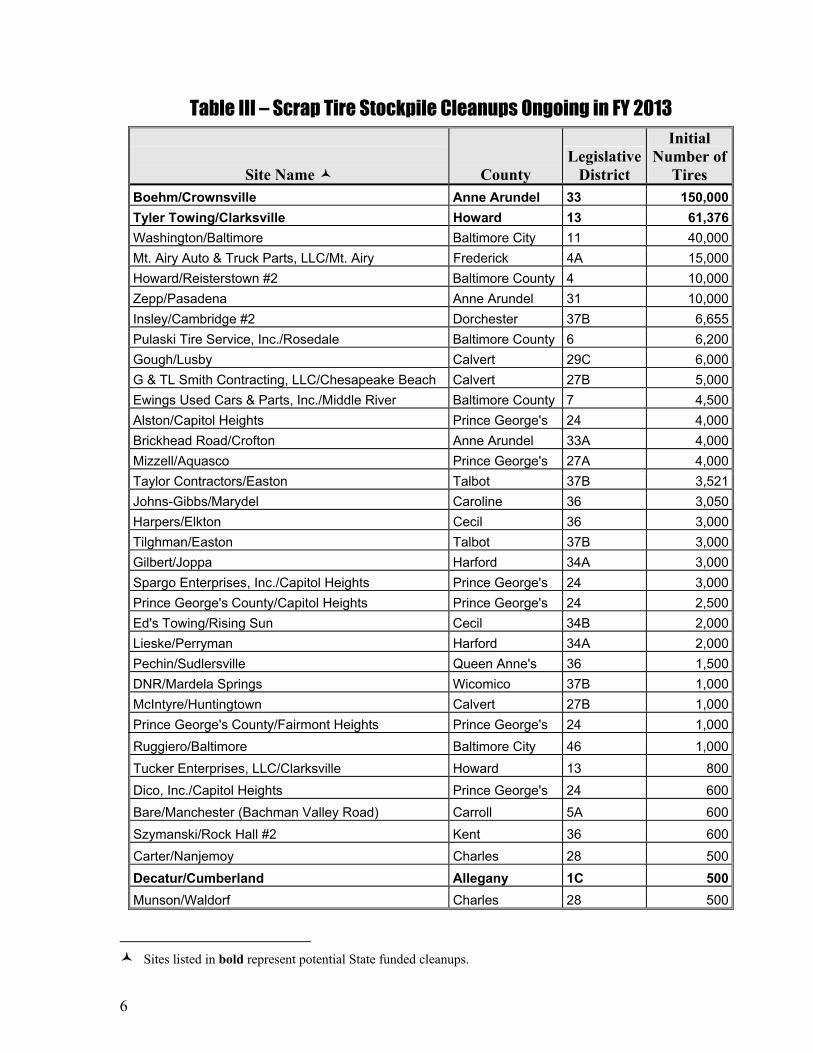
Table III – Scrap Tire Stockpile Cleanups Ongoing in FY 2013
Site Name County
Legislative District
Initial Number of
Tires Boehm/Crownsville Anne Arundel 33 150,000Tyler Towing/Clarksville Howard 13 61,376Washington/Baltimore Baltimore City 11 40,000Mt. Airy Auto & Truck Parts, LLC/Mt. Airy Frederick 4A 15,000Howard/Reisterstown #2 Baltimore County 4 10,000Zepp/Pasadena Anne Arundel 31 10,000Insley/Cambridge #2 Dorchester 37B 6,655Pulaski Tire Service, Inc./Rosedale Baltimore County 6 6,200Gough/Lusby Calvert 29C 6,000G & TL Smith Contracting, LLC/Chesapeake Beach Calvert 27B 5,000Ewings Used Cars & Parts, Inc./Middle River Baltimore County 7 4,500Alston/Capitol Heights Prince George's 24 4,000Brickhead Road/Crofton Anne Arundel 33A 4,000Mizzell/Aquasco Prince George's 27A 4,000Taylor Contractors/Easton Talbot 37B 3,521Johns-Gibbs/Marydel Caroline 36 3,050Harpers/Elkton Cecil 36 3,000Tilghman/Easton Talbot 37B 3,000Gilbert/Joppa Harford 34A 3,000Spargo Enterprises, Inc./Capitol Heights Prince George's 24 3,000Prince George's County/Capitol Heights Prince George's 24 2,500Ed's Towing/Rising Sun Cecil 34B 2,000Lieske/Perryman Harford 34A 2,000Pechin/Sudlersville Queen Anne's 36 1,500DNR/Mardela Springs Wicomico 37B 1,000McIntyre/Huntingtown Calvert 27B 1,000Prince George's County/Fairmont Heights Prince George's 24 1,000Ruggiero/Baltimore Baltimore City 46 1,000Tucker Enterprises, LLC/Clarksville Howard 13 800Dico, Inc./Capitol Heights Prince George's 24 600Bare/Manchester (Bachman Valley Road) Carroll 5A 600Szymanski/Rock Hall #2 Kent 36 600Carter/Nanjemoy Charles 28 500Decatur/Cumberland Allegany 1C 500Munson/Waldorf Charles 28 500
Sites listed in bold represent potential State funded cleanups.
7
Site Name County Legislative
District
Initial Number of
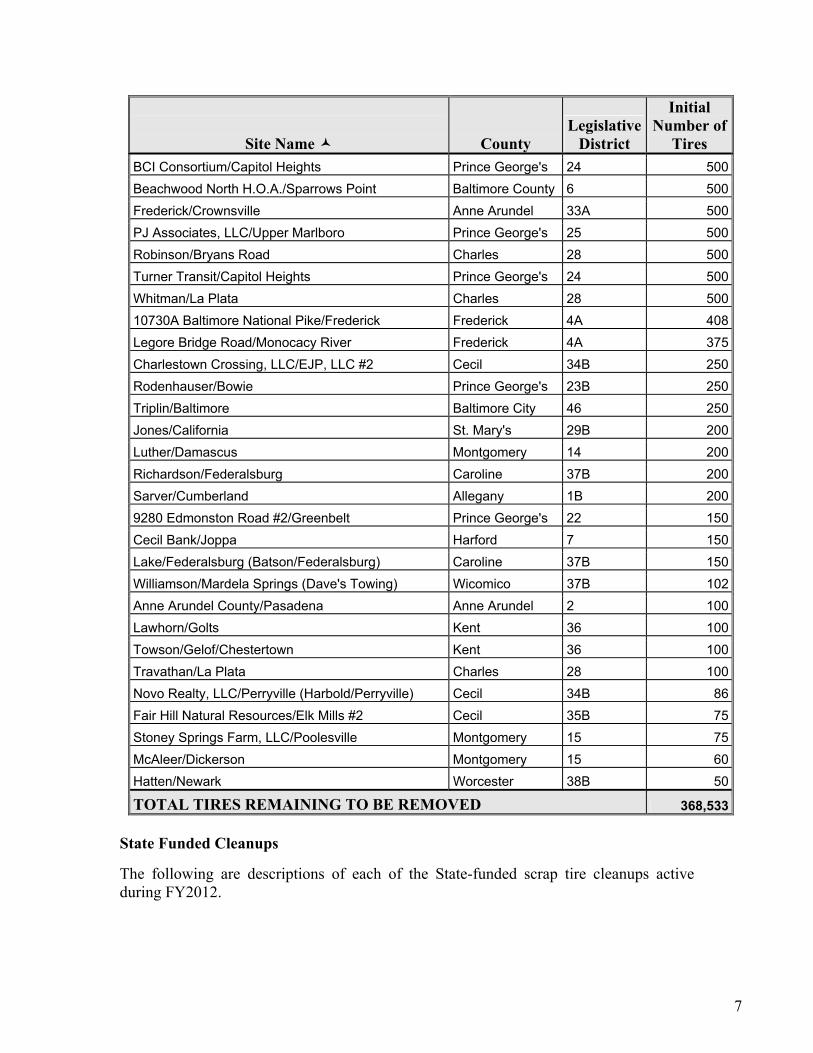
Tires BCI Consortium/Capitol Heights Prince George's 24 500Beachwood North H.O.A./Sparrows Point Baltimore County 6 500Frederick/Crownsville Anne Arundel 33A 500PJ Associates, LLC/Upper Marlboro Prince George's 25 500Robinson/Bryans Road Charles 28 500Turner Transit/Capitol Heights Prince George's 24 500Whitman/La Plata Charles 28 50010730A Baltimore National Pike/Frederick Frederick 4A 408Legore Bridge Road/Monocacy River Frederick 4A 375Charlestown Crossing, LLC/EJP, LLC #2 Cecil 34B 250Rodenhauser/Bowie Prince George's 23B 250Triplin/Baltimore Baltimore City 46 250Jones/California St. Mary's 29B 200Luther/Damascus Montgomery 14 200Richardson/Federalsburg Caroline 37B 200Sarver/Cumberland Allegany 1B 2009280 Edmonston Road #2/Greenbelt Prince George's 22 150Cecil Bank/Joppa Harford 7 150Lake/Federalsburg (Batson/Federalsburg) Caroline 37B 150Williamson/Mardela Springs (Dave's Towing) Wicomico 37B 102Anne Arundel County/Pasadena Anne Arundel 2 100Lawhorn/Golts Kent 36 100Towson/Gelof/Chestertown Kent 36 100Travathan/La Plata Charles 28 100Novo Realty, LLC/Perryville (Harbold/Perryville) Cecil 34B 86Fair Hill Natural Resources/Elk Mills #2 Cecil 35B 75Stoney Springs Farm, LLC/Poolesville Montgomery 15 75McAleer/Dickerson Montgomery 15 60Hatten/Newark Worcester 38B 50
TOTAL TIRES REMAINING TO BE REMOVED 368,533
State Funded Cleanups The following are descriptions of each of the State-funded scrap tire cleanups active during FY2012.
8
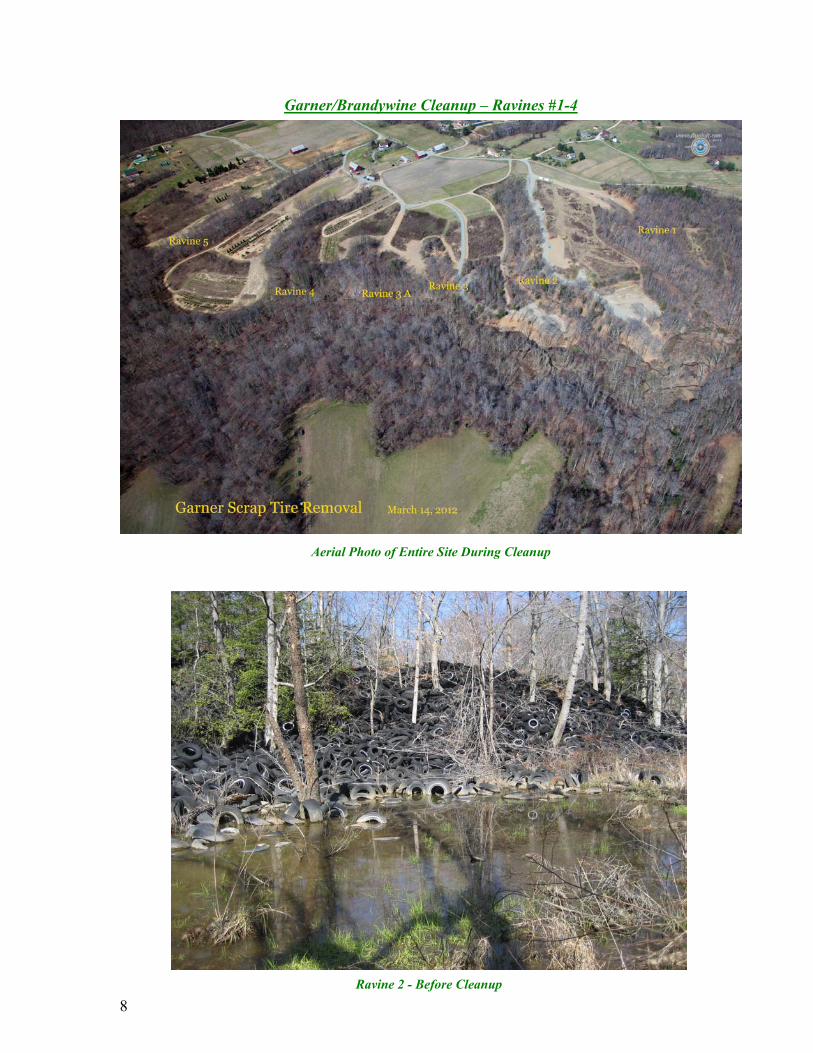
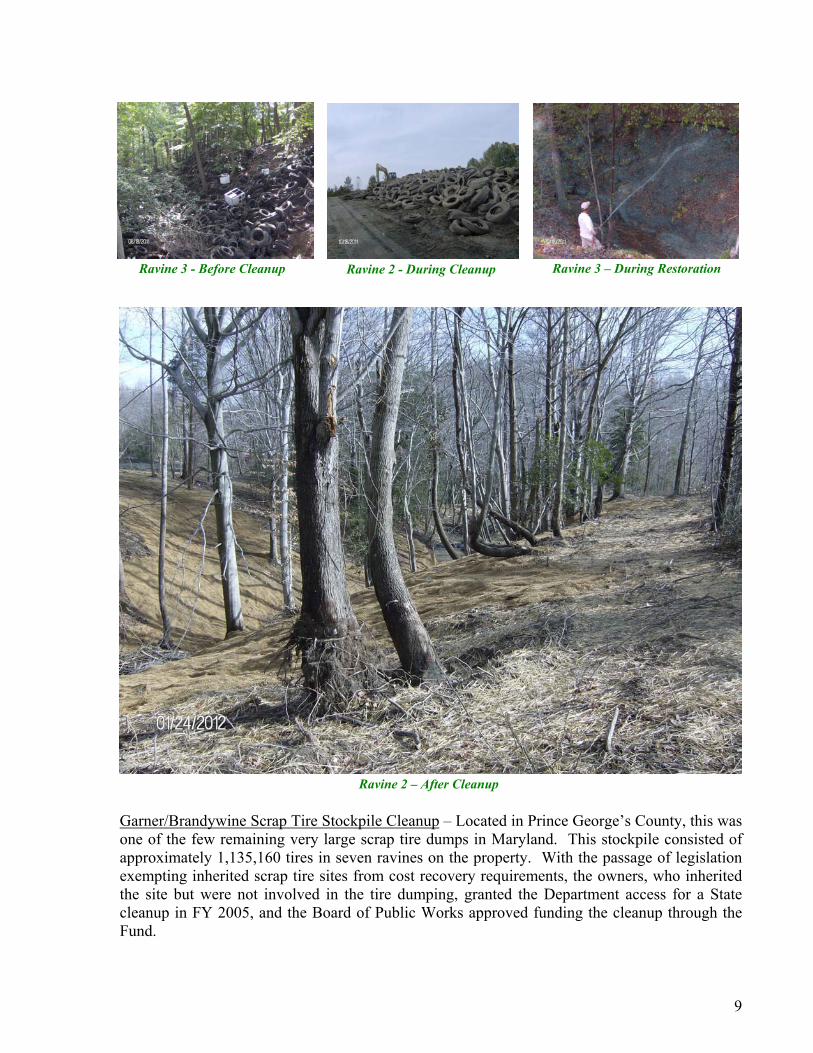
Garner/Brandywine Cleanup – Ravines #1-4
Ravine 2 - Before Cleanup
Aerial Photo of Entire Site During Cleanup
9
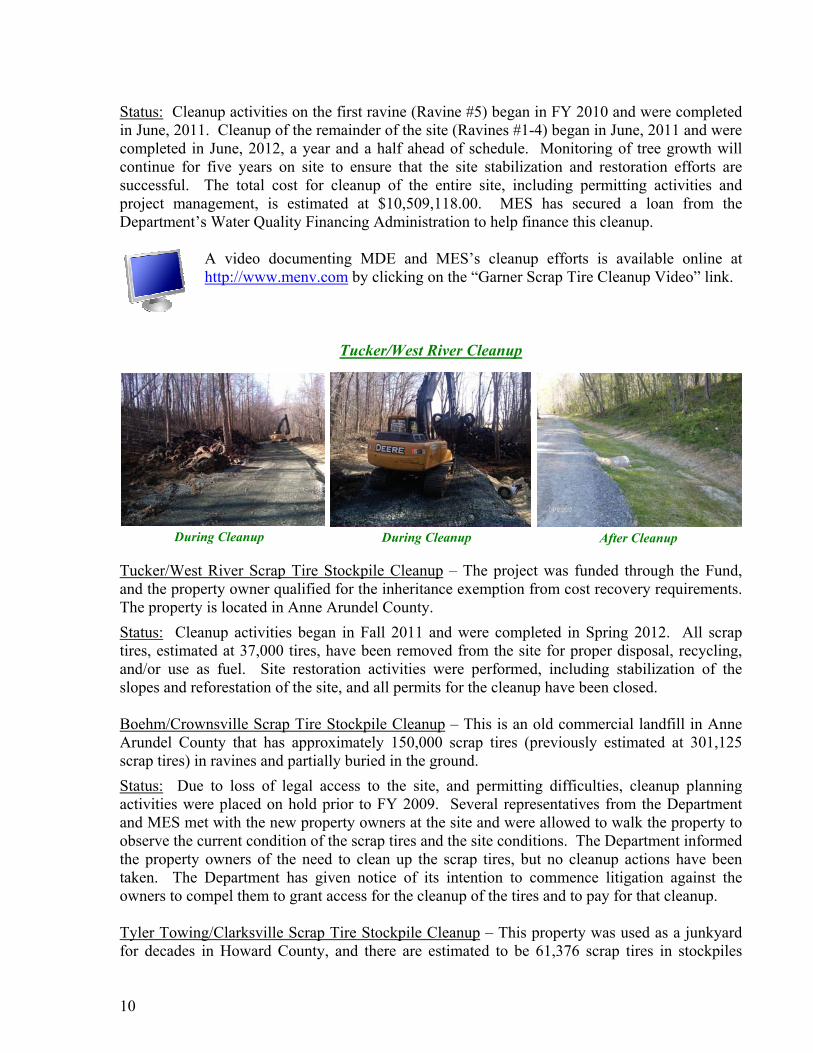
Garner/Brandywine Scrap Tire Stockpile Cleanup – Located in Prince George’s County, this was one of the few remaining very large scrap tire dumps in Maryland. This stockpile consisted of approximately 1,135,160 tires in seven ravines on the property. With the passage of legislation exempting inherited scrap tire sites from cost recovery requirements, the owners, who inherited the site but were not involved in the tire dumping, granted the Department access for a State cleanup in FY 2005, and the Board of Public Works approved funding the cleanup through the Fund.
Ravine 3 - Before Cleanup Ravine 2 - During Cleanup Ravine 3 – During Restoration
Ravine 2 – After Cleanup
10
Status: Cleanup activities on the first ravine (Ravine #5) began in FY 2010 and were completed in June, 2011. Cleanup of the remainder of the site (Ravines #1-4) began in June, 2011 and were completed in June, 2012, a year and a half ahead of schedule. Monitoring of tree growth will continue for five years on site to ensure that the site stabilization and restoration efforts are successful. The total cost for cleanup of the entire site, including permitting activities and project management, is estimated at $10,509,118.00. MES has secured a loan from the Department’s Water Quality Financing Administration to help finance this cleanup.
A video documenting MDE and MES’s cleanup efforts is available online at http://www.menv.com by clicking on the “Garner Scrap Tire Cleanup Video” link.
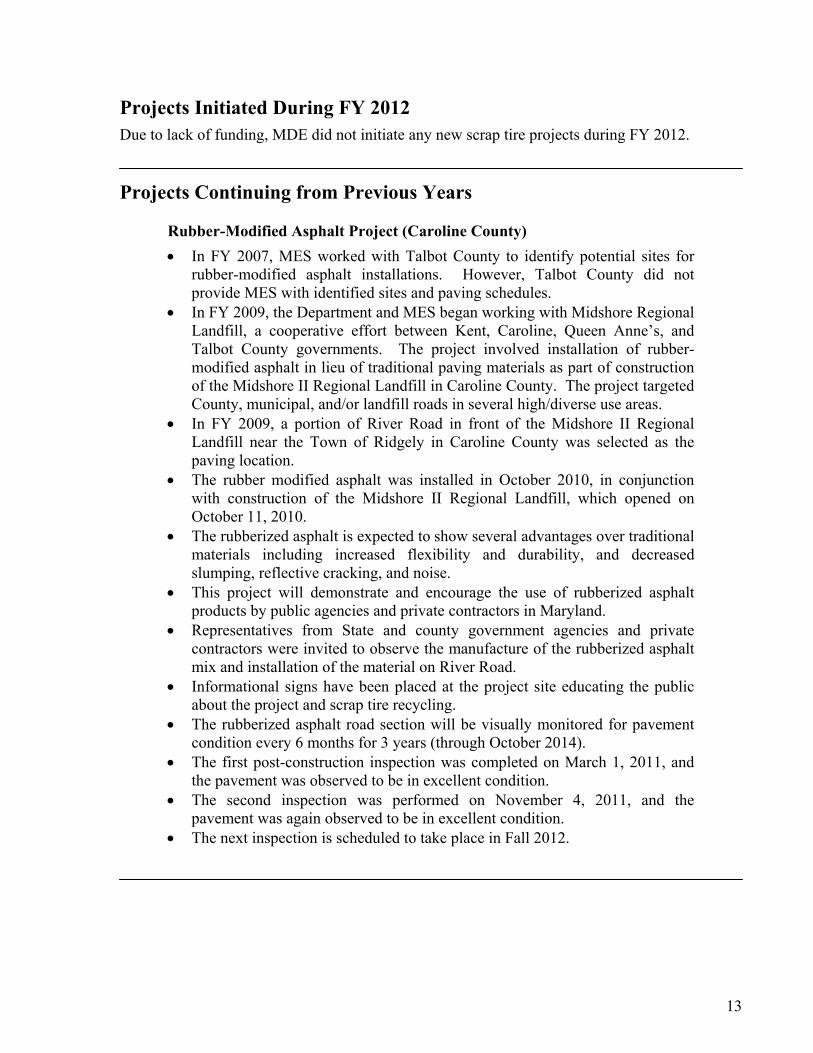
Tucker/West River Cleanup
Tucker/West River Scrap Tire Stockpile Cleanup – The project was funded through the Fund, and the property owner qualified for the inheritance exemption from cost recovery requirements. The property is located in Anne Arundel County. Status: Cleanup activities began in Fall 2011 and were completed in Spring 2012. All scrap tires, estimated at 37,000 tires, have been removed from the site for proper disposal, recycling, and/or use as fuel. Site restoration activities were performed, including stabilization of the slopes and reforestation of the site, and all permits for the cleanup have been closed. Boehm/Crownsville Scrap Tire Stockpile Cleanup – This is an old commercial landfill in Anne Arundel County that has approximately 150,000 scrap tires (previously estimated at 301,125 scrap tires) in ravines and partially buried in the ground. Status: Due to loss of legal access to the site, and permitting difficulties, cleanup planning activities were placed on hold prior to FY 2009. Several representatives from the Department and MES met with the new property owners at the site and were allowed to walk the property to observe the current condition of the scrap tires and the site conditions. The Department informed the property owners of the need to clean up the scrap tires, but no cleanup actions have been taken. The Department has given notice of its intention to commence litigation against the owners to compel them to grant access for the cleanup of the tires and to pay for that cleanup. Tyler Towing/Clarksville Scrap Tire Stockpile Cleanup – This property was used as a junkyard for decades in Howard County, and there are estimated to be 61,376 scrap tires in stockpiles
During Cleanup After Cleanup During Cleanup

11
throughout the property and mixed with scrap metal, soil, and other solid wastes in a berm that roughly follows the property perimeter. Status: All administrative and enforcement efforts by the Department have been exhausted, and the property owners have failed to remove and properly dispose of the scrap tires on site. The Department is working with the OAG to pursue other cleanup and/or enforcement actions. Cost Recovery Actions The Department continues to use the services of the OAG to handle scrap tire cost recovery
actions (see Table IV for details). To date, 139 cleanups have been performed using the Fund. In total, 32 property owners have been pursued in cost recovery actions for cases in which
the State initiated scrap tire cleanups with Fund monies. Cost recovery actions have not been performed against:
– 92 sites because they were on publicly owned property; – 9 sites because they qualified for the inheritance exemption; – 3 sites because the property owner passed away and the estate was closed
before a cost recovery action could be completed; and – 3 sites because the cost to pursue the case was higher than the cost recovery
amount that could be sought. To date, the Department has sought a total of $3,438,877.55 from property owners and has
collected a total of $323,349.24 in cost recovery actions. Many of these cases are still in litigation or have been sent to the Central Collections Unit (“CCU”). Some cases were settled out-of-court for less than the amount originally sought due to the Defendant’s inability to pay.
The Garner/Brandywine (significantly completed in FY 2012, except for monitoring of restoration efforts) and Tucker/West River (completed in FY 2012) sites qualify for the inheritance exemption. Therefore, cost recovery will not be sought for these sites.
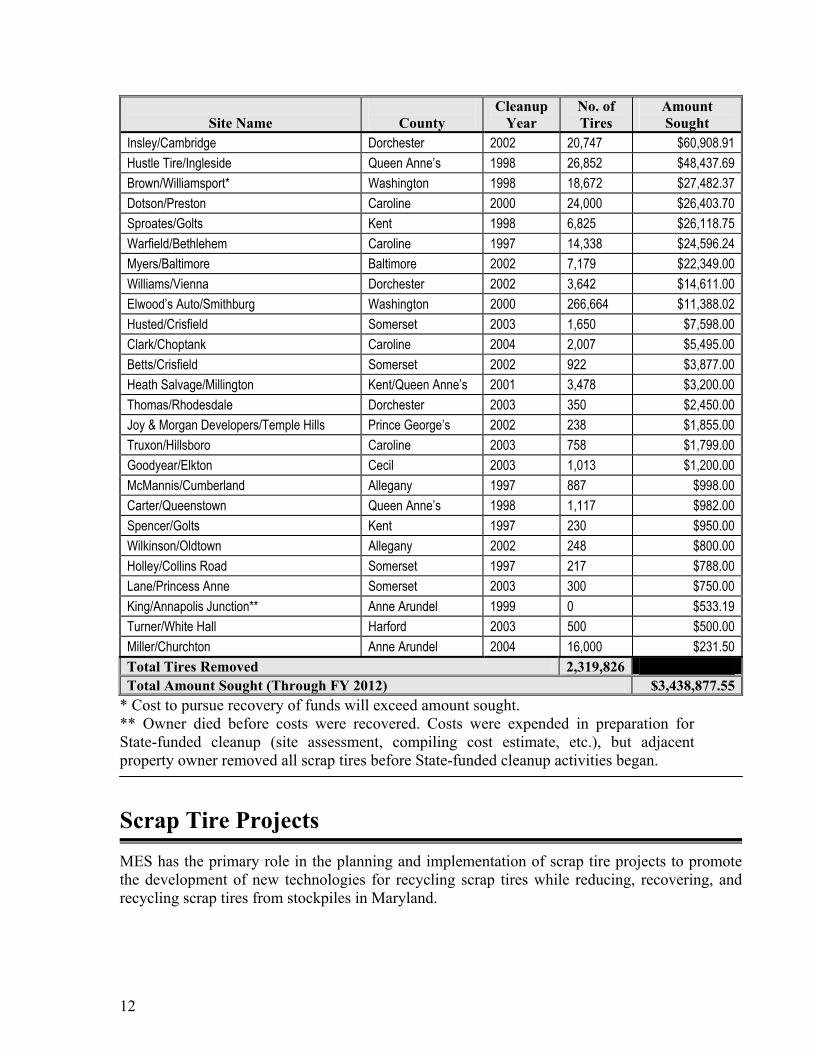
Table IV – Initiated Cost Recovery Actions Through FY 2012
Site Name
County
Cleanup Year
No. of Tires
Amount Sought
Hughesville/Underwood Charles 1996 720,000 $1,015,299.72 Western Commercial/Smithburg Washington 1996 505,500 $770,174.47 Oak Hill Realty/Easton Talbot 1997 158,325 $375,294.16 Lofland/Sudlersville Queen Anne’s 1996 120,000 $226,083.74 Mack 1, 2, & 3/Reisterstown** Baltimore 2000 44,087 $184,451.09 Snyder/Calvert Cecil 1996 129,526 $151,266.00 Shorter/Waldorf** Charles 1998 129,626 $137,902.00 Tull/Federalsburg Caroline 1997 61,688 $104,586.00 Johnson/Sunderland Calvert 2003 10,735 $91,123.00 Howard/Crisfield Somerset 2002 21,505 $86,395.00
12
Site Name
County
Cleanup Year
No. of Tires
Amount Sought
Insley/Cambridge Dorchester 2002 20,747 $60,908.91 Hustle Tire/Ingleside Queen Anne’s 1998 26,852 $48,437.69 Brown/Williamsport* Washington 1998 18,672 $27,482.37 Dotson/Preston Caroline 2000 24,000 $26,403.70 Sproates/Golts Kent 1998 6,825 $26,118.75 Warfield/Bethlehem Caroline 1997 14,338 $24,596.24 Myers/Baltimore Baltimore 2002 7,179 $22,349.00 Williams/Vienna Dorchester 2002 3,642 $14,611.00 Elwood’s Auto/Smithburg Washington 2000 266,664 $11,388.02 Husted/Crisfield Somerset 2003 1,650 $7,598.00 Clark/Choptank Caroline 2004 2,007 $5,495.00 Betts/Crisfield Somerset 2002 922 $3,877.00 Heath Salvage/Millington Kent/Queen Anne’s 2001 3,478 $3,200.00 Thomas/Rhodesdale Dorchester 2003 350 $2,450.00 Joy & Morgan Developers/Temple Hills Prince George’s 2002 238 $1,855.00 Truxon/Hillsboro Caroline 2003 758 $1,799.00 Goodyear/Elkton Cecil 2003 1,013 $1,200.00 McMannis/Cumberland Allegany 1997 887 $998.00 Carter/Queenstown Queen Anne’s 1998 1,117 $982.00 Spencer/Golts Kent 1997 230 $950.00 Wilkinson/Oldtown Allegany 2002 248 $800.00 Holley/Collins Road Somerset 1997 217 $788.00 Lane/Princess Anne Somerset 2003 300 $750.00 King/Annapolis Junction** Anne Arundel 1999 0 $533.19 Turner/White Hall Harford 2003 500 $500.00 Miller/Churchton Anne Arundel 2004 16,000 $231.50 Total Tires Removed 2,319,826 Total Amount Sought (Through FY 2012) $3,438,877.55
* Cost to pursue recovery of funds will exceed amount sought. ** Owner died before costs were recovered. Costs were expended in preparation for State-funded cleanup (site assessment, compiling cost estimate, etc.), but adjacent property owner removed all scrap tires before State-funded cleanup activities began. Scrap Tire Projects MES has the primary role in the planning and implementation of scrap tire projects to promote the development of new technologies for recycling scrap tires while reducing, recovering, and recycling scrap tires from stockpiles in Maryland.
13
Projects Initiated During FY 2012 Due to lack of funding, MDE did not initiate any new scrap tire projects during FY 2012. Projects Continuing from Previous Years
Rubber-Modified Asphalt Project (Caroline County) • In FY 2007, MES worked with Talbot County to identify potential sites for
rubber-modified asphalt installations. However, Talbot County did not provide MES with identified sites and paving schedules.
• In FY 2009, the Department and MES began working with Midshore Regional Landfill, a cooperative effort between Kent, Caroline, Queen Anne’s, and Talbot County governments. The project involved installation of rubber-modified asphalt in lieu of traditional paving materials as part of construction of the Midshore II Regional Landfill in Caroline County. The project targeted County, municipal, and/or landfill roads in several high/diverse use areas.
• In FY 2009, a portion of River Road in front of the Midshore II Regional Landfill near the Town of Ridgely in Caroline County was selected as the paving location.
• The rubber modified asphalt was installed in October 2010, in conjunction with construction of the Midshore II Regional Landfill, which opened on October 11, 2010.
• The rubberized asphalt is expected to show several advantages over traditional materials including increased flexibility and durability, and decreased slumping, reflective cracking, and noise.
• This project will demonstrate and encourage the use of rubberized asphalt products by public agencies and private contractors in Maryland.
• Representatives from State and county government agencies and private contractors were invited to observe the manufacture of the rubberized asphalt mix and installation of the material on River Road.
• Informational signs have been placed at the project site educating the public about the project and scrap tire recycling.
• The rubberized asphalt road section will be visually monitored for pavement condition every 6 months for 3 years (through October 2014).
• The first post-construction inspection was completed on March 1, 2011, and the pavement was observed to be in excellent condition.
• The second inspection was performed on November 4, 2011, and the pavement was again observed to be in excellent condition.
• The next inspection is scheduled to take place in Fall 2012.
14
Scrap Tire Projects Planned for FY 2013 Due to reduction of available revenues in the Fund, the Scrap Tire Program will not conduct any new scrap tire projects during FY 2013. Instead, available funds will be used to pursue cleanup of illegal scrap tire stockpiles that would otherwise remain a threat to public health and the environment. Licensing Under Maryland law (Section 9-228 of the Environment Article), the Department is required to regulate scrap tire facilities and scrap tire haulers.
Facilities that collect or process scrap tires are required to obtain an appropriate license for their respective operations.
Scrap tire haulers are also required to obtain licenses for their activities.
This comprehensive licensing program allows for the efficient management of scrap tires:
from the point of generation, via a licensed or approved
transportation system, to a licensed or approved scrap
tire facility for the transfer, collection, or processing of the scrap tires.
The Department issues the following types of scrap tire licenses: Scrap Tire Recycler License – For activities that convert scrap tires into a
marketable product. Scrap Tire Collection Facility License – For operations that collect or
accumulate scrap tires temporarily on a site and transfer scrap tires to licensed or approved scrap tire facilities. There are three categories of collection facility licenses:
– General License: Sites with up to 50 scrap tires at any given time. – Secondary License: Sites with up to 1,500 scrap tires at any given
time. – Primary License: Sites with more than 1,500 scrap tires at any given
time. Scrap Tire Hauler License – For a person who, as a part of a commercial
business, transports scrap tires in the State. Substitute Fuel/Tire Derived Fuel (TDF) Facility Approval – For
operations that use whole or chipped scrap tires to replace existing fuel sources.
Solid Waste Acceptance Facility Approval – For a permitted refuse disposal or acceptance facility that accepts scrap tires for collection or processing.
15
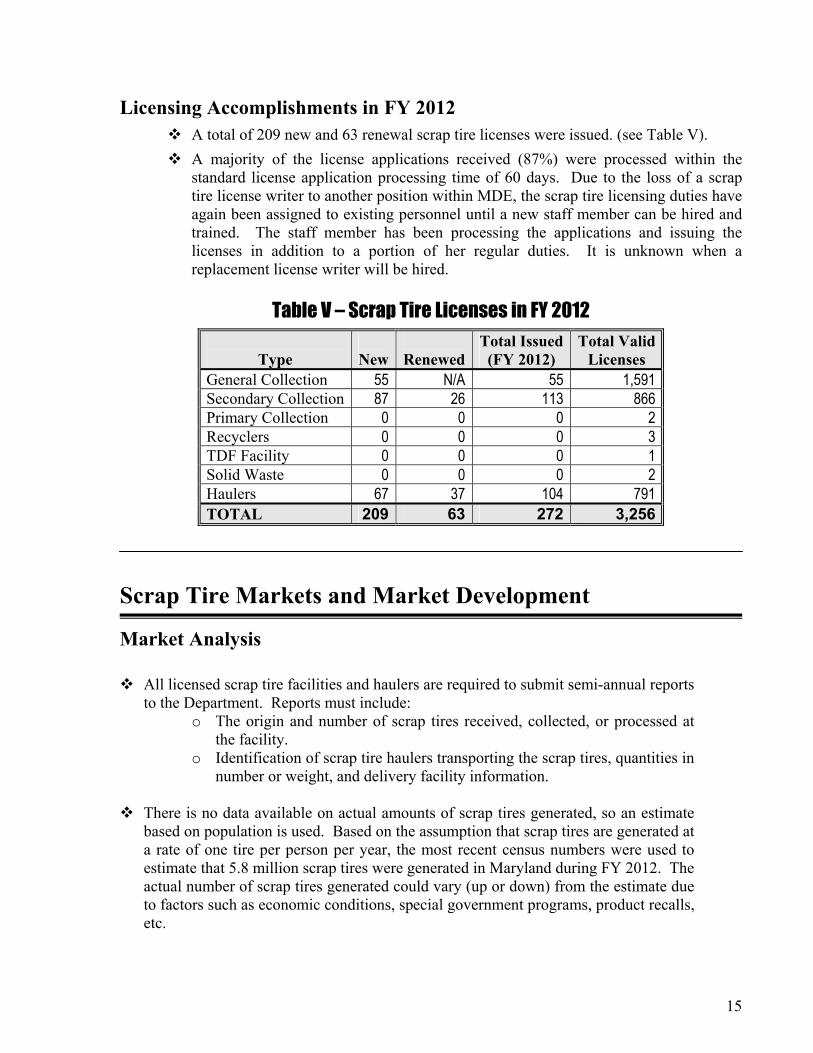
Licensing Accomplishments in FY 2012 A total of 209 new and 63 renewal scrap tire licenses were issued. (see Table V).
A majority of the license applications received (87%) were processed within the standard license application processing time of 60 days. Due to the loss of a scrap tire license writer to another position within MDE, the scrap tire licensing duties have again been assigned to existing personnel until a new staff member can be hired and trained. The staff member has been processing the applications and issuing the licenses in addition to a portion of her regular duties. It is unknown when a replacement license writer will be hired.
Table V – Scrap Tire Licenses in FY 2012
Type
New
RenewedTotal Issued(FY 2012)
Total ValidLicenses
General Collection 55 N/A 55 1,591 Secondary Collection 87 26 113 866 Primary Collection 0 0 0 2 Recyclers 0 0 0 3 TDF Facility 0 0 0 1 Solid Waste 0 0 0 2 Haulers 67 37 104 791 TOTAL 209 63 272 3,256
Scrap Tire Markets and Market Development Market Analysis
All licensed scrap tire facilities and haulers are required to submit semi-annual reports to the Department. Reports must include:
o The origin and number of scrap tires received, collected, or processed at the facility.
o Identification of scrap tire haulers transporting the scrap tires, quantities in number or weight, and delivery facility information.
There is no data available on actual amounts of scrap tires generated, so an estimate
based on population is used. Based on the assumption that scrap tires are generated at a rate of one tire per person per year, the most recent census numbers were used to estimate that 5.8 million scrap tires were generated in Maryland during FY 2012. The actual number of scrap tires generated could vary (up or down) from the estimate due to factors such as economic conditions, special government programs, product recalls, etc.
16
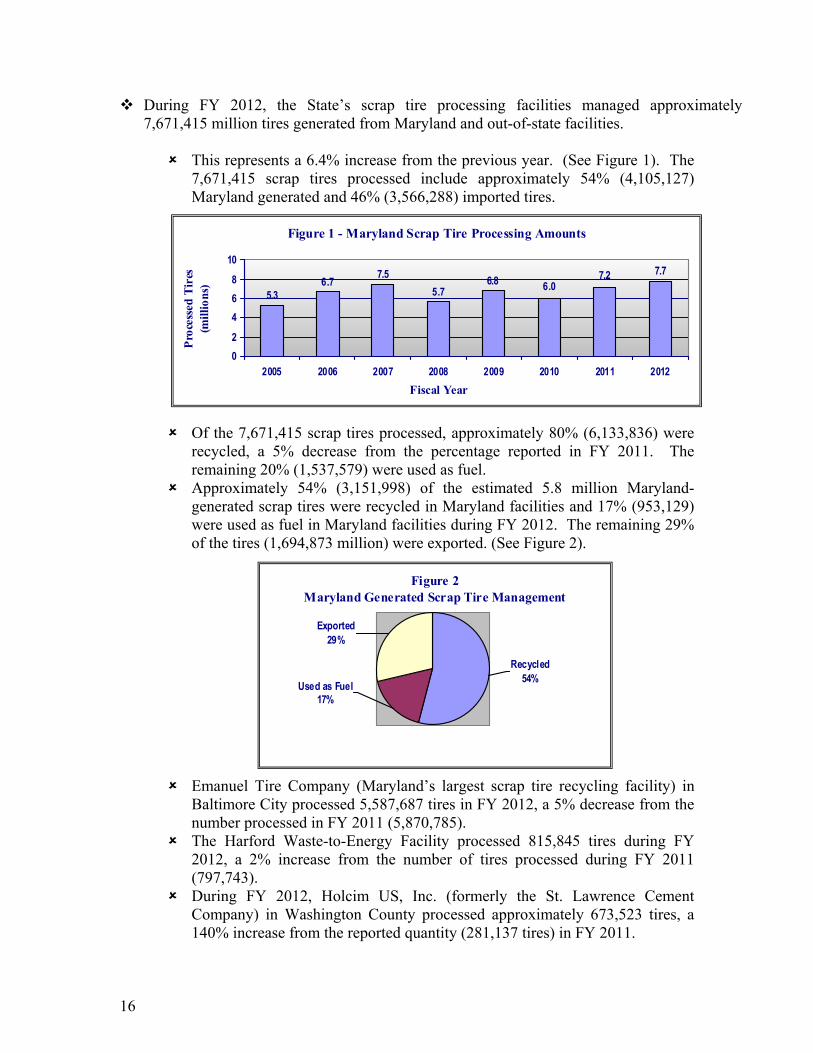
During FY 2012, the State’s scrap tire processing facilities managed approximately 7,671,415 million tires generated from Maryland and out-of-state facilities.
This represents a 6.4% increase from the previous year. (See Figure 1). The
7,671,415 scrap tires processed include approximately 54% (4,105,127) Maryland generated and 46% (3,566,288) imported tires.
Of the 7,671,415 scrap tires processed, approximately 80% (6,133,836) were
recycled, a 5% decrease from the percentage reported in FY 2011. The remaining 20% (1,537,579) were used as fuel.
Approximately 54% (3,151,998) of the estimated 5.8 million Maryland-generated scrap tires were recycled in Maryland facilities and 17% (953,129) were used as fuel in Maryland facilities during FY 2012. The remaining 29% of the tires (1,694,873 million) were exported. (See Figure 2).
Emanuel Tire Company (Maryland’s largest scrap tire recycling facility) in Baltimore City processed 5,587,687 tires in FY 2012, a 5% decrease from the number processed in FY 2011 (5,870,785).
The Harford Waste-to-Energy Facility processed 815,845 tires during FY 2012, a 2% increase from the number of tires processed during FY 2011 (797,743).
During FY 2012, Holcim US, Inc. (formerly the St. Lawrence Cement Company) in Washington County processed approximately 673,523 tires, a 140% increase from the reported quantity (281,137 tires) in FY 2011.
Figure 1 - Maryland Scrap Tire Processing Amounts
6.07.2 7.7
6.85.7
7.56.75.3
02
468
10
2005 2006 2007 2008 2009 2010 2011 2012Fiscal Year
Proc
esse
d Ti
res
(mill
ions
)
Figure 2Maryland Generated Scrap Tire Management
Recycled54%
Exported29%
Used as Fuel17%

17
The Auston Tire Recycling facility in Harford County processed 294,909 tires in FY 2012, a increase of 30% from the 226,531 tires processed in FY 2011.
K & K Tire, Inc. in Anne Arundel County processed 251,240 tires in FY 2012, a 728% increase from the 30,339 tires processed in FY 2011.
Wheelabrator Baltimore LP in Baltimore City processed 47,968 tires in FY 2012, a 354% increase from the 1,318 tires processed in FY 2011.
Fort Detrick in Frederick County processed 243 scrap tires in FY 2012, a 9% decrease from the 266 tires processed in FY 2011.
Maryland’s Scrap Tire Flow and Destinations
The overall scrap tire processing capacity (7,671,415 scrap tires) increased 6.4% from the reported processing capacity for FY 2011 (7,208,119 scrap tires). Although two Maryland processing facilities decreased their processing capacity slightly (Emanuel by 5% and Fort Detrick by 9%), the other five Maryland processing facilities (Harford Waste-to-Energy Facility, Holcim US, Inc., Auston Tire Recycling, K & K Tire, Inc., and Wheelabrator Baltimore LP) significantly increased their processing capacities in FY 2012 by a combined total of 746,417 tires. The overall amount of scrap tires processed in Maryland increased by 6.4%, and the ratio of scrap tires that were recycled versus used as fuel in Maryland decreased 5% during FY 2012.
Overall, the scrap tire generation, processing, and handling of the estimated
5.8 million Maryland scrap tires follow the traditional trends, remaining almost the same as in FY 2011: 3,151,998 scrap tires were recycled, approximately 1,694,873 scrap tires were exported, and the remaining 953,129 scrap tires were used as fuel.
Continued emphasis needs to be given to market development of scrap tire products and processed raw materials. During FY 2009, the Department worked with MES and the private sector to develop a “best practices” manual to encourage engineers and designers to incorporate the use of tire-derived products into civil engineering projects. The manual advises the design engineer of possible uses for engineering materials derived from scrap tires, including the use of tire chips in drainage layers. The guidance will increase the utilization of these materials, and using alternatives will help conserve natural resources, such as gravel and crushed stone. The manual is available free of charge online at the Department’s website at: http://www.mde.state.md.us/programs/Land/RecyclingandOperationsprogram/ScrapTire/Documents/www.mde.state.md.us/assets/document/Guidance_Manual_For_Scrap_Tires.pdf and on MES’s website at: http://www.menv.com/content/recycling/Guidance%20Manual%20for%20Scrap%20Tires.pdf.
18
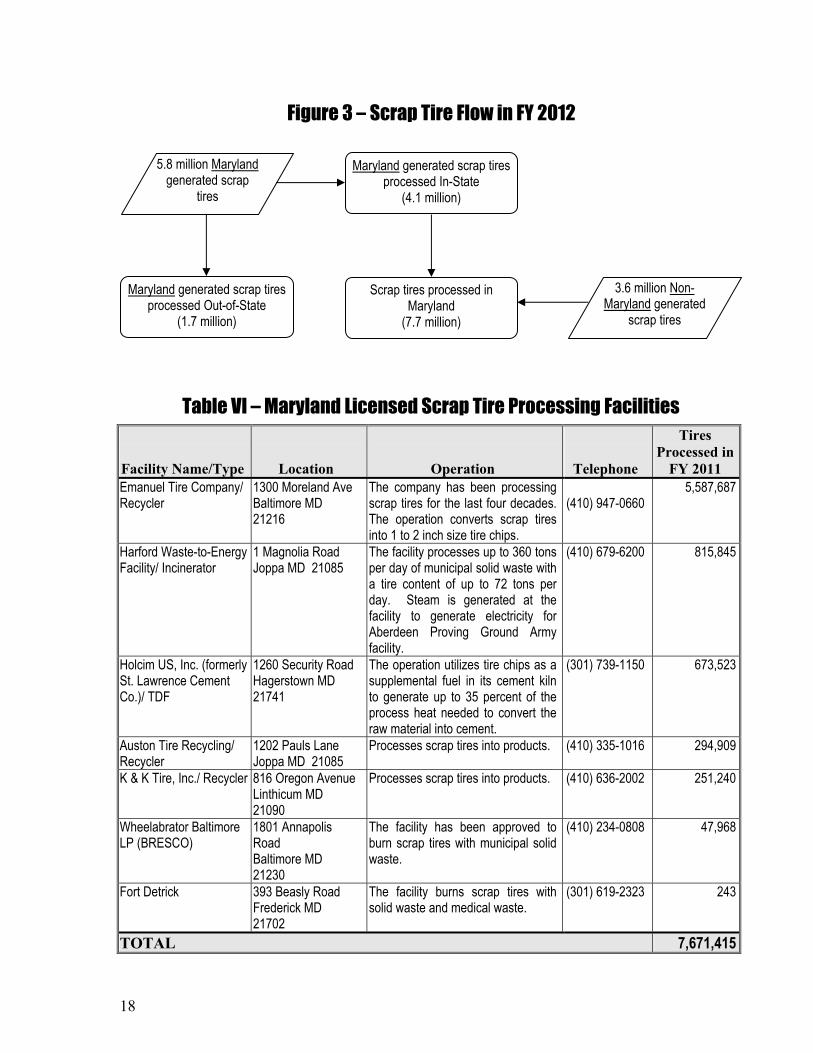
Table VI – Maryland Licensed Scrap Tire Processing Facilities
Facility Name/Type
Location
Operation
Telephone
Tires Processed in
FY 2011 Emanuel Tire Company/ Recycler
1300 Moreland Ave Baltimore MD 21216
The company has been processing scrap tires for the last four decades. The operation converts scrap tires into 1 to 2 inch size tire chips.
(410) 947-0660
5,587,687
Harford Waste-to-Energy Facility/ Incinerator
1 Magnolia Road Joppa MD 21085
The facility processes up to 360 tons per day of municipal solid waste with a tire content of up to 72 tons per day. Steam is generated at the facility to generate electricity for Aberdeen Proving Ground Army facility.
(410) 679-6200 815,845
Holcim US, Inc. (formerly St. Lawrence Cement Co.)/ TDF
1260 Security Road Hagerstown MD 21741
The operation utilizes tire chips as a supplemental fuel in its cement kiln to generate up to 35 percent of the process heat needed to convert the raw material into cement.
(301) 739-1150 673,523
Auston Tire Recycling/ Recycler
1202 Pauls Lane Joppa MD 21085
Processes scrap tires into products. (410) 335-1016 294,909
K & K Tire, Inc./ Recycler 816 Oregon Avenue Linthicum MD 21090
Processes scrap tires into products. (410) 636-2002 251,240
Wheelabrator Baltimore LP (BRESCO)
1801 Annapolis Road Baltimore MD 21230
The facility has been approved to burn scrap tires with municipal solid waste.
(410) 234-0808 47,968
Fort Detrick 393 Beasly Road Frederick MD 21702
The facility burns scrap tires with solid waste and medical waste.
(301) 619-2323 243
TOTAL 7,671,415
5.8 million Marylandgenerated scrap
tires
3.6 million Non-Maryland generated
scrap tires
Figure 3 – Scrap Tire Flow in FY 2012
Scrap tires processed in Maryland
(7.7 million)
Maryland generated scrap tires processed Out-of-State
(1.7 million)
Maryland generated scrap tires processed In-State
(4.1 million)

19
Compliance and Enforcement Activities The goal of the Department’s compliance and enforcement activities is to ensure that all of Maryland’s licensed scrap tire facilities, scrap tire haulers, and scrap tire stockpiles are in full compliance with the scrap tire law, regulations and license conditions. Strategies for Compliance and Enforcement Actions in FY 2012
Continue to maintain the quality of compliance and enforcement activities and routinely perform site inspections and investigations.
Maintain inspection, compliance assistance, and enforcement actions of scrap tire licensees to discourage illegal scrap tire stockpiles.
Continue coordinating with the State Fire Marshal’s Office to ensure that plans for tire recycling and storage facilities meet applicable fire prevention standards and have adequate provisions for fighting fires should they occur.
Continue identification and cleanup of illegal scrap tire stockpiles. Accomplishments in FY 2012
A total of 598 scrap tire investigations and inspections were conducted. There was a significant decrease (25%) in the number of scrap tire inspections conducted in
FY 2012 to 598 from 801 in FY 2011. The inspection coverage rate of 13% in FY 2012 is a 24% decrease from the coverage rate reported in FY 2011. The reason for the decline in the number of inspections and in inspection coverage rates is that there has been more compliance and enforcement focus on Refuse Disposal, especially unpermitted activities. As a result, inspectors were unable to devote as much time to performing site inspections for scrap tire activities. (Scrap tire inspections are performed by inspectors in the Solid Waste Program).
The percentage of inspected facilities in significant compliance was 96% during FY 2012, a slight decrease from the compliance rate of 99% reported in FY 2011.
A total of 25 significant violations were resolved, a 52% decrease from the number (52) resolved in FY 2011.
Figure 4 - Inspections and Spot Checks
840 801598
765834798747728
0200400600800
1000
2005 2006 2007 2008 2009 2010 2011 2012Fiscal Year
Insp
ectio
ns &
Spo
t Ch
ecks
20
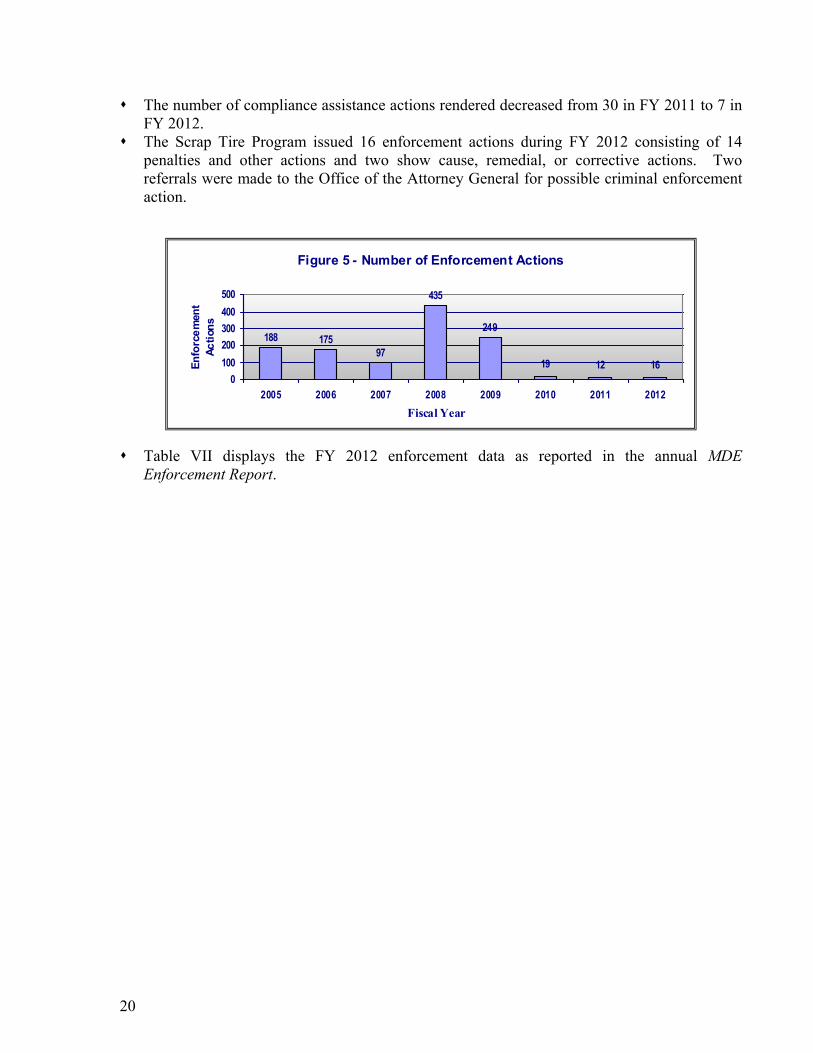
The number of compliance assistance actions rendered decreased from 30 in FY 2011 to 7 in FY 2012.
The Scrap Tire Program issued 16 enforcement actions during FY 2012 consisting of 14 penalties and other actions and two show cause, remedial, or corrective actions. Two referrals were made to the Office of the Attorney General for possible criminal enforcement action.
Table VII displays the FY 2012 enforcement data as reported in the annual MDE
Enforcement Report.
Figure 5 - Number of Enforcement Actions
19 12 16
249
435
97175188
0100200300400500
2005 2006 2007 2008 2009 2010 2011 2012Fiscal Year
Enfo
rcem
ent
Actio
ns

21
Table VII – Scrap Tire Compliance and Enforcement in FY 2012 Permitted Sites/Facilities Number of Permits/Licenses issued 299 Number of Permits/Licenses in effect at Fiscal Year End 3,256 Other Regulated Sites/Facilities Stockpiles to be cleaned up 62 Inspections Number of Sites inspected (“inspected” defined as “at the site”) 416 Number of Sites audited but not inspected (“not inspected” defined as “places where MDE reviewed submittals but did not go to the site”)
754
Number of Sites evaluated for compliance (sum of the two measures above) 1,170 Number of Inspections and Spot Checks (captures the number of compliance activities at sites)
598
Number of Audits (captures the number of reviews of file/submittals for compliance) 754 Number of Inspections, Audits, Spot Checks (sum of the two measures above, same as current count)
1,352
Compliance Profile Number of Inspected Sites/Facilities with Significant Violations 15 Percent of Inspected Sites/Facilities with Significant Violations 4% Inspection Coverage Rate* 13% Significant Violations Number of Significant Violations involving Environmental or Health Impact 0 Number of Significant Violations based on Technical/Preventative Deficiencies 17 Number of Significant Violations carried over awaiting disposition from Previous Fiscal Year
152
Total 169 Disposition of Significant Violations Resolved 25 Ongoing 144 Enforcement Actions Number of Compliance Assistance rendered 7 Number of Administrative Corrective Orders issued 2 Number of Civil Corrective Orders/Injunctions issued 0 Number of Criminal Corrective Orders issued 0 Number of Stop Work orders 0 Number of SEP’s entered into 0 Number of Administrative Penalties and Other Enforcement Actions 14 Number of Civil Penalties and Other Enforcement Actions 0 Number of Referrals to Attorney General for possible Criminal Action 2 Penalties Number of Administrative Penalties issued 1 Number of Civil Penalties issued 0 Number of Criminal Penalties issued 0 Value of SEP’s entered into $0.00 Amount of Penalties obtained $700.00 Citizen Suits Number of Notifications received of 3rd Party Lawsuits being filed against regulated entities 0
* Coverage rate above is computed as the total number of sites inspected and dividing that by the total number of permits/licenses in effect plus the number of stockpiles to be cleaned up.