fuzzy multi-objective optimization for wheat flour supply
TRANSCRIPT

Fuzzy multi-objective optimization for wheat flour supply chain considering raw material substitution
1. Introduction
Generally, food industries in Indonesia main-ly based on wheat flour for both small-medium in-dustries and large modern industries such as instant noodles, biscuits, bread, dry noodles, wet noodles, etc. In order to reduce wheat flour usage, many kinds of research have been conducted on the Indonesian local flour which can substitute wheat flour such as modified cassava flour (mocaf), tapioca, sweet potato flour etc. However, they have not been fully utilized.
If the substitution of wheat flour with the local
flour is conducted then it can reduce wheat flour us-age in the food industry and indirectly it can reduce wheat imports and the impact of supply disruptions. On the other hand, wheat flour substitution with lo-cal flour can affect policies and reliability’s supply chain due to use multiple sources and causes addi-tional costs. Moreover, the substitution of local flour to wheat flour can reduce products quality mainly on swelling power of the wheat flour-based product.
In supply chain problems, conflicts often occur in some company’s goals to be achieved. Similarly, the attempt to substitute the wheat flour also caus-
This study aimed to develop a multi-objective optimization model of the wheat flour supply chain considering raw material substitution in which supplier capacity and product demand were considered in uncertain conditions. There are four objectives to be achieved: to min-imize the total cost and to maximize product quality, reliability, and local flour usage. We established multi-objective fuzzy mixed integer non-linear programming to solve the problem and used non-dominated sorting genetic algorithm (NSGA) II methods to found the best solution. The result provides a referral for a decision maker to design the optimal substituted wheat flour supply chain.
Article history:
Received June 30, 2020 Revised September 12, 2020 Accepted September 14, 2020 Published online September 29, 2020
Keywords:Fuzzy multi-objective optimization; Possibilistic programming; Fuzzy numbers;Raw material substitution;NSGA II
*Corresponding author:Trisna Trisna [email protected]
ISSN 2683-345X
DOI: http://doi.org/10.24867/IJIEM-2020-3-263Published by the University of Novi Sad, Faculty of Technical Sciences, Novi Sad, Serbia. This is an open access article distributed under the CC BY-NC-ND 4.0 terms and conditions
A B S T R A C T A R T I C L E I N F O
International Journal of Industrial Engineering and Management
Volume 11 / No 3 / September 2020 / 180 - 191
T. Trisna ab*, M. Marimin b, Y. Arkeman b, T. C. Sunarti ba Department of Industrial Engineering, Faculty of Engineering, Universitas Malikussaleh, Jl. Batam Kampus Bukit Indah Lhokseumawe, Indonesia; b Department of Agroindustrial Technology, Faculty of Agricultural Technology, Bogor Agricultural University, Campus IPB Darmaga, Bogor 16002, Indonesia
journal homepage: http://ijiemjournal.uns.ac.rs/
Original research article

181Trisna et al.
International Journal of Industrial Engineering and Management Vol 11 No 3 (2020)
es aforementioned conflicts so that it is necessary to solve that problem by multi-objective optimization approach. In this study, there are four objectives to be achieved for supply chain optimization, namely: to minimize supply chain total cost, and to maximize product quality after raw materials substitution, sup-ply chain reliability, and local flour usage.
In this study, the raw material substitution was conducted on wheat flour mill with a maximum of 15% of local flour in which local flour used consisting of mocaf flour, tapioca flour, and sweet potato flour. The selection of the three types of local flour is due to their sufficient availability in Indonesia.
In the real world, supply chain problem often fac-es uncertain conditions such as raw material price, availability of supply, demand, delivery time and oth-ers. In the case of wheat flour supply chain related to the global supply chain for using imported raw mate-rials, it often faces uncertain conditions. Local flour is an agriculture-based commodity so it often expe-riences the uncertainty of supply. Moreover, prod-uct demand to plan is also an uncertain conditions. Therefore, uncertain demand and raw material sup-ply were considered as fuzzy parameters in this study.
Researchers had used the fuzzy mixed integer linear programming (FMILP) model to solve sup-ply chain problems in uncertain conditions [1], [2], [3], [4], [5],[6], [7]. The model can be solved using the Non-dominated Sorting Genetic Algorithm II (NSGA II) method. This method is a model evolu-tionary algorithm or meta-heuristic method that pro-vides efficient calculation and identification of the Pa-reto front set by maintaining diversity without using additional parameters. This method as an alternative approach can improve the solution quality compared to heuristics [8]. Researchers had used the NSGA II to solve multi objective optimization (MOO) prob-lems in various fields, including allocation problems [9], for optimizing the performance of helium-heated reverse water gas shift reactor [10], distributed ener-gy system [11], pavement management system [12], resource scheduling [13], task scheduling [14], site selection [15], heat transfer optimization[16], and others. Besides, MOO has also been widely used to solve various problems in supply chain manage-ment, including for green supply chain design [17], closed-loop supply chain [18]–[20], perishable food supply chain [21], supplier selection and order allo-cation [22], [23], designing multi-period supply chain network [24], routing problem [25], etc. The liter-ature review conducted by Trisna [10] can be seen that numerous prior researches on the multi-objec-tive optimization have been conducted to solve the
supply chain problems in uncertain conditions, but there is no consideration yet about the raw material substitution.
This study aimed to establish wheat flour supply chain model considering wheat flour substitution with local flour in uncertain conditions using multi-objec-tive optimization approach which is the development of supply chain model that developed by Trisna [11]. Four objectives to be satisfied simultaneously are including to minimize total cost, and to maximize product quality, supply chain reliability, and local flour usage.
The main contribution of this paper is to solve wheat flour supply chain problems in fuzzy condi-tions using genetic algorithm approach to obtain Pa-reto front set. This study contribute to a academics, practitioners, government as policy makers to obtain supply chain design model considering raw material substitution that meets the four objectives including to: minimize supply chain cost, and maximize prod-uct quality, supply chain reliability, and local flour usage.
The stages carried out in this study include: 1) de-fine wheat supply chain problem, 2) formulate prob-lem into multi-objective possibilistic mixed integer non-linear programming. 3) convert fuzzy program-ming formulation into an equivalent auxiliary crisp model to form deterministic programming model base on [12,13], 4) apply the non-dominated sorting genetic algorithm II, 5) determine the best solution by implying parameter of feasibility degree of deci-sion variable and satisfaction degree of the decision maker.
2. Problem definitions
In this study, the intended raw material substitu-tion is to replace a part of the wheat flour with local flour in order to reduce the consumption in Indo-nesia and mitigate supply chain disruption. Wheat flour substituted with local flour in flour mill so that it can be used for all wheat flour-based product. Local flour considered to substitute wheat flour is tapioca, mocaf, and sweet potato flour with a mixture of 15% at maximum. The formulation of the multi-objective mathematical model for this supply chain problem aims to determine the amount of raw materials sent from the supplier to the flour mill and the amount of product allocated from the flour mill to distribu-tors and food industries, as well as the amount of the optimum local flour usage to substitute wheat flour. Besides that, the mathematical model is established

182 Trisna et al.
International Journal of Industrial Engineering and Management Vol 11 No 3 (2020)
to select raw material suppliers that meet flour mill’s demand. Supplier capacity and product demand are considered as uncertain conditions defined as trian-gular fuzzy numbers There are four objectives to be achieved simultaneously which are to minimize sup-ply chain cost, and to maximize product quality, sup-ply chain reliability, and local flour usage.
The configuration of wheat flour supply chain includes raw material suppliers, flour mills, food in-dustries and distributors with details consisting of two hard wheat suppliers, two soft wheat suppliers, three mocaf suppliers, five tapioca suppliers, and one sweet potato flour supplier, 3 flour mills, 3 food industries, and 9 distributors that can be shown in Figure 4. The capacity of each mill flour mill is 2000 MT per day or 180,000 MT per period which produces flour for 75% of the raw materials are milled wheat.
To simplify establishing of mathematical formula-tion model for substituted wheat flour supply chain, there are several assumptions required, as follows:
1. Multi-objective optimization is implied in the one planning period for 3 months with flour mill capacity of 180,000 MT / period for each flour mill.
2. Wheat flour substituted with local flour is conducted at the flour mill by substituting a maximum of 15% wheat and local flour used are mocaf flour, tapioca flour, sweet potato flour, which can be used only one type of flour or the mixture of two or three kinds of flours.
3. The investment cost of the flour mixing machine installation is ignored in the model.
4. Raw material price used is the prevailing when the research was conducted.
5. The price of importing the wheat includes landing fees, customs, clearing fees, and the cost of special additional duty.
6. The capacity of the vessel for maximum wheat delivery is of 50,000 MT.
7. The local flour delivery transportation is by trucks with a maximum capacity of 30 MT.
8. The shortage is not justified in this model.
Notations description required on wheat flour supply chain optimization:
i = index for suppliers of hard wheat (i є I) l = Index for suppliers of soft wheat (l є L) j = Index for mocaf flour supplier (j є J) k = Index for tapioca starch supplier (k є K) m = Index for sweet potato flour supplier (mє M) n = Index for flour factory (nє N) o = Index for the food manufacturer (o є O)
p = Index for distributor (pє P) The decision variables:
Gint = Total hard wheat supplied from country i to flour mill n in period t (MT)
Wlnt = Total soft wheat supplied from country l to flour mill n in period t (MT)
Mjnt = The amount of mocaf supplied from the factory j to factory n in period t (MT)
Tknt = The amount of tapioca supplied from the factory k to factory n in period t (MT)
Umnt = The amount of potato flour supplied from factory m to factory n in period t (MT)
TFnot = The amount of substituted wheat flour sent from factory n to food factory o in period t (MT)
TDnpt = The amount of wheat flour from factory n to distributor p in period t (MT)
Mp = Percentage of mocaf flour used for the substitution of wheat flour
Tp = Percentage of tapioca used for the substitution of wheat flour
Up = Percentage of sweet potato flour used for the substitution of wheat flour
Model parameters used:
CPnt = Capacity of wheat flour factory n (MT/period)
CG ̃ it = Capacity of hard wheat flour supplier from country i (MT/period)
CW ̃ it = Capacity of soft wheat flour supplier from country l (MT/period)
CM ̃ it = Capacity of mocaf flour supplier from factory j (MT/period)
CT ̃ it = Capacity of tapioca flour supplier from factory k (MT/period)
CU ̃ it = Capacity of sweet potato flour supplier from factory m (MT/period)

183Trisna et al.
International Journal of Industrial Engineering and Management Vol 11 No 3 (2020)
OGin = Ordering cost of hard wheat flour from country i
OGln = Ordering cost of soft wheat flour from country l
OMjn = Ordering cost of mocaf flour from supplier j
OTkn = Ordering cost of tapioca flour from supplier k
OUmn = Ordering cost of sweet potato flour from supplier m
PCnt = Production process cost per MT of wheat flour in factory n in period t
HGi = Hard wheat price from supplier i
HWl = Soft wheat price from supplier l
HMj = Mocaf price from supplier j
HTk = Tapioca price from supplier k
HUm = Sweet potato flour price from supplier m
UF ̃ ot = The use of wheat flour in food factory o in period t (MT)
UD ̃ pt = Wheat flour sent out from distributor p in period t (MT)
CFnot = Transportation cost of wheat flour unit from flour mill n to food industry o in period t
CDnpt = Transportation cost of wheat flour unit from flour mill n to distributor p in period t
TMot = The amount of wheat flour used in food industry o in period t
DG ̃ nt = Hard wheat demand of flour mill n in period t
DW ̃ nt = Soft wheat demand of flour mill n in period t (MT)
DM ̃ nt = Mocaf flour demand of flour mill n in period t (MT)
DT ̃ nt = = Tapioca flour demand of flour mill n in period t (MT)
DU ̃ nt = = Sweet potato flour demand of flour mill n in period t (MT)
Re = Utility of raw material e per product unit
Ugn = Limitation of hard wheat supplier for factory n
Uwn = Limitation of soft wheat supplier for factory n
Umn = Limitation of mocaf flour supplier for factory n
Utn = Limitation of tapioca flour supplier for factory n
Uun = Limitation of sweet potato supplier for factory n
Hent = holding cost of raw material e in factory n
HFot = Holding cost of wheat flour in food industry o in period t
HDpt = Holding cost of substituted wheat flour in distributor o in period t
SCent = Shortage cost of raw material e in factory n
SSent = Total shortage of raw material e in factory n
DD ̃ npt = Demand of wheat flour in distributor o from wheat flour factory n in period t
DF ̃ npt = Demand of substituted wheat flour in food manufacturer o from wheat flour factory in period t
TCnt = Total substituted wheat flour is gained in factory n in period t
a, b, c, d = Coefficient of regression equation of the relation between the percentage of four mixture toward the product quality
Tilde (~) sign above the notation indicates a fuzzy parameter or coefficient. Coefficient or parameter of the equation for the objective can be in the form of fuzzy, which are the products that sent out (consumer demand) from the distributor and the food factory in every period.
3. Results and discussions
3.1 Model Formulation
The mathematical formulations for the objective functions are described, as follows:
(1) Objective function 1: minimizing supply chain
total cost
Supply chain total costs consists of ordering cost, raw materials purchasing cost, production process cost, inventory cost, and transportation cost. Detail formulations of the supply chain costs are stated in equation 1-8. • Ordering cost(OC)
Ordering cost consists of ordering cost of wheat, mocaf flour, tapioca starch, and sweet potato flour. The ordering cost includes transportation cost from raw material suppliers to flour mill n and administra-tive costs that can be formulated as follows:

184 Trisna et al.
International Journal of Industrial Engineering and Management Vol 11 No 3 (2020)
• Purchasing cost of raw materials (PC) Purchasing cost of raw materials based on raw ma-
terials price multiplied by the amount of raw material purchased that can be formulated as follows:
• Transportation cost from flour mill to distributors and food industries (TC)
Transportation cost is the amount of product units transported multiplied by the transportation cost per unit that can be written as follows:
In this case, the flour mill 1 is as supplier of substi-tuted flour for distributor 1, 2, 3 and food factory 1, flour mill 2 is as supplier of substituted wheat flour for distributor 4, 5, and food factory 2, flour mill 3 is as supplier of substituted wheat flour for distributors 6, 7, and food factory 3. The transportation total cost can be formulated as follows:
• The production process cost The production process cost is determined by the
cost required to produce 1 MT of wheat flour. The formulation of wheat flour production process cost can be written as follows:
• Inventory costs (IC) The inventory cost consists of inventory cost at
the flour mill n (ICn), distributor (ICD) and food factory (ICO ). The mathematical formulation for inventory cost of the raw materials (wheat, tapioca flour, mocaf, and sweet potato flour) in the flour mill is given below:
Inventory cost of the finished product in the wheat flour mill occurs because the amount of flour produced is greater than the products delivered in period t. The wheat flour produced from flour mill is 75% of the amount of wheat usage. Local flour mixed with wheat flour to produce substituted wheat flour is 15% at maximum so that the amount of the total product produced can be formulated as follows:
TPnt = r.CPnt +(β/(1-β)r.CPnt) (6)
Where: r = conversion coefficient of raw materials
into products β = percentage of the local flour mixture with
wheat flour
Mathematical formulation for inventory cost of the finished product (substituted wheat flour) in the flour mill can be written as follows:
− +
∑∑ ∑∑ ∑∑∑ ∑∑∑nt nt not nptn t n t n o t n p t
h TP TF TD
Mathematical formulation for inventory cost of the substituted wheat flour in food industry and dis-tributors can be written as follows:
(2) Objective 2: Maximizing product quality
The equation of the product quality based on regression relation between the percentage of the substituted flour mixture toward product quality. In this study, the product quality is determined based on swelling power (tested on the basic bread prod-uct) which is the percentage of the swelling power of product (basic bread) from the mixture of the local flour and wheat flour compared with the bread from 100% wheat flour. The mathematical formulation of the quality function can be written as follows:
int in lnt ln jnt jn knt kn mnt mni n t l n t j n t k n t m n t
OG r OW w OM s OT x O y U+ + + +∑∑∑ ∑∑∑ ∑∑∑ ∑∑∑ ∑∑∑
int in lnt ln jnt jn knt kn mnt mni n t l n t j n t k n t m n t
OG r OW w OM s OT x O y U+ + + +∑∑∑ ∑∑∑ ∑∑∑ ∑∑∑ ∑∑∑(1)
(2)
int i in lnt i ln jnt j jn knt k kni n t l n t j n t k n t
mnt m mnm n t
G HG r W HW w M HM s T HT x
U HU y
+ + +∑∑∑ ∑∑∑ ∑∑∑ ∑∑∑
+∑∑∑int i in lnt i ln jnt j jn knt k kni n t l n t j n t k n t
mnt m mnm n t
G HG r W HW w M HM s T HT x
U HU y
+ + +∑∑∑ ∑∑∑ ∑∑∑ ∑∑∑
+∑∑∑
int i in lnt i ln jnt j jn knt k kni n t l n t j n t k n t
mnt m mnm n t
G HG r W HW w M HM s T HT x
U HU y
+ + +∑∑∑ ∑∑∑ ∑∑∑ ∑∑∑
+∑∑∑
npt npt not notn p t n o t
TD CD TF CF+∑∑∑ ∑∑∑(3)
(4)
(5)
3 5 7
1pt 1pt 11t 11t 2pt 2pt 22t 22t 3pt 3pt 33t 33t1 4 6
TD CD TF CF TD CD TF CF TD CD TF CF= = =
+ + + + +∑∑ ∑∑ ∑∑p t p t p t
3 5 7
1pt 1pt 11t 11t 2pt 2pt 22t 22t 3pt 3pt 33t 33t1 4 6
TD CD TF CF TD CD TF CF TD CD TF CF= = =
+ + + + +∑∑ ∑∑ ∑∑p t p t p t
1nt int nt 2nt lnt ntt i n t n t t l n t n t
3nt jnt nt 4nt knt ntt j n t n t t j n t n t
5nt jnt ntt j n t n t
H ( G 0.5CP ) H ( W 0.5CP )
H ( M Mp. CP ) H ( T Tp. CP )
H ( U Up. CP )
− + − +
− + − +
−
∑∑ ∑∑∑ ∑∑ ∑∑ ∑∑∑ ∑∑
∑∑ ∑∑∑ ∑∑ ∑∑ ∑∑∑ ∑∑
∑∑ ∑∑∑ ∑∑
n n
n n
n
1nt int nt 2nt lnt ntt i n t n t t l n t n t
3nt jnt nt 4nt knt ntt j n t n t t j n t n t
5nt jnt ntt j n t n t
H ( G 0.5CP ) H ( W 0.5CP )
H ( M Mp. CP ) H ( T Tp. CP )
H ( U Up. CP )
− + − +
− + − +
−
∑∑ ∑∑∑ ∑∑ ∑∑ ∑∑∑ ∑∑
∑∑ ∑∑∑ ∑∑ ∑∑ ∑∑∑ ∑∑
∑∑ ∑∑∑ ∑∑
n n
n n
n
1nt int nt 2nt lnt ntt i n t n t t l n t n t
3nt jnt nt 4nt knt ntt j n t n t t j n t n t
5nt jnt ntt j n t n t
H ( G 0.5CP ) H ( W 0.5CP )
H ( M Mp. CP ) H ( T Tp. CP )
H ( U Up. CP )
− + − +
− + − +
−
∑∑ ∑∑∑ ∑∑ ∑∑ ∑∑∑ ∑∑
∑∑ ∑∑∑ ∑∑ ∑∑ ∑∑∑ ∑∑
∑∑ ∑∑∑ ∑∑
n n
n n
n
1nt int nt 2nt lnt ntt i n t n t t l n t n t
3nt jnt nt 4nt knt ntt j n t n t t j n t n t
5nt jnt ntt j n t n t
H ( G 0.5CP ) H ( W 0.5CP )
H ( M Mp. CP ) H ( T Tp. CP )
H ( U Up. CP )
− + − +
− + − +
−
∑∑ ∑∑∑ ∑∑ ∑∑ ∑∑∑ ∑∑
∑∑ ∑∑∑ ∑∑ ∑∑ ∑∑∑ ∑∑
∑∑ ∑∑∑ ∑∑
n n
n n
n
1nt int nt 2nt lnt ntt i n t n t t l n t n t
3nt jnt nt 4nt knt ntt j n t n t t j n t n t
5nt jnt ntt j n t n t
H ( G 0.5CP ) H ( W 0.5CP )
H ( M Mp. CP ) H ( T Tp. CP )
H ( U Up. CP )
− + − +
− + − +
−
∑∑ ∑∑∑ ∑∑ ∑∑ ∑∑∑ ∑∑
∑∑ ∑∑∑ ∑∑ ∑∑ ∑∑∑ ∑∑
∑∑ ∑∑∑ ∑∑
n n
n n
n
(7)
(8)
� �ot ptot not pt npto t n o t o t p t n p t p t
HF DF UF HD (TD UD )
− + − ∑∑ ∑∑∑ ∑∑ ∑∑ ∑∑∑ ∑∑
� �ot ptot not pt npto t n o t o t p t n p t p t
HF DF UF HD (TD UD )
− + − ∑∑ ∑∑∑ ∑∑ ∑∑ ∑∑∑ ∑∑
(23)

185Trisna et al.
International Journal of Industrial Engineering and Management Vol 11 No 3 (2020)
Max f2 = a + b.Mp + c.Tp+ d.Up (9)
To simplify the model, the value of Mp, Tp, and Up can be stated as the quantity of mocaf flour, tap-ioca flour and sweet potato flour respectively that is sent from the supplier to the flour mill n divided by the amount of substituted wheat flour produced in the flour factory in the period t so that the formula-tion can be written as follows:
Analysis result of the relation between the wheat flour mixture and the local flour obtains the regres-sion coefficient of a = 100, b = -155, c = -118 011, and, d = -178 736.
Objective 3: Maximizing the supply chain reliability
Supply chain reliability is determined by the on time delivery so that it can reduce the possibility of raw material shortage due to tardiness. The supply chain reliability has fuzzy parameters so that the for-mulation is given in equation 11.
Objective 4: maximizing the use of local flour
The formulation of the amount of local flour as the mixture of wheat flour can be written as equation 30.
Model constraints can be formulated as follows: The constraint of the hard wheat supplier capacity
(the total demand of hard wheat for flour mill does not exceed the supply from supplier i)
The constraint of the soft wheat supplier capacity (the total demand of hard wheat for flour mill does
not exceed the supply from supplier l).
The constraint of mocaf flour supplier capacity (the
total mocaf demand for flour mill does not exceed the capacity of mocaf supplier j)
The constraint of tapioca supplier capacity
The constraint of sweet potato flour supplier capacity
The constraint of the amount of wheat flour pro-duction must exceed the demand from the food manufacturer and distributor
The total raw material received by the wheat flour factory should be higher than the demand of the food manufacturers and distributors
The maximum limitation of the mixture of local flour with the wheat flour sent to the wheat flour fac-tory should not exceed 0.15 from the total flour pro-duced by the factory, given below:
(11)
(12)
(13)
(14)
(15)
(16)
(17)
(18)
(19)
(20)
4 jn t kn t mntj n t k n t m n t
Maks f M T U= + +∑∑∑ ∑∑∑ ∑∑∑
4 jn t kn t mntj n t k n t m n t
Maks f M T U= + +∑∑∑ ∑∑∑ ∑∑∑
0.1125+ + ≤∑∑∑ ∑∑∑ ∑∑∑ ∑∑jnt knt mnt ntj n t k n t m n t n t
M T U CP
0.1125+ + ≤∑∑∑ ∑∑∑ ∑∑∑ ∑∑jnt knt mnt ntj n t k n t m n t n t
M T U CP
(10)
2Max. f . / ( ) . / (
. (
)
) /
+= + + ++
+∑ ∑ ∑ ∑ ∑ ∑
∑ ∑ ∑jnt nt jnt knt nt knt
mnt nt mnt
a b M TP M c T TP T
d Up TP Up2Max. f . / ( ) . / (
. (
)
) /
+= + + ++
+∑ ∑ ∑ ∑ ∑ ∑
∑ ∑ ∑jnt nt jnt knt nt knt
mnt nt mnt
a b M TP M c T TP T
d Up TP Up
2Max. f . / ( ) . / (
. (
)
) /
+= + + ++
+∑ ∑ ∑ ∑ ∑ ∑
∑ ∑ ∑jnt nt jnt knt nt knt
mnt nt mnt
a b M TP M c T TP T
d Up TP Up
186 Trisna et al.
International Journal of Industrial Engineering and Management Vol 11 No 3 (2020)
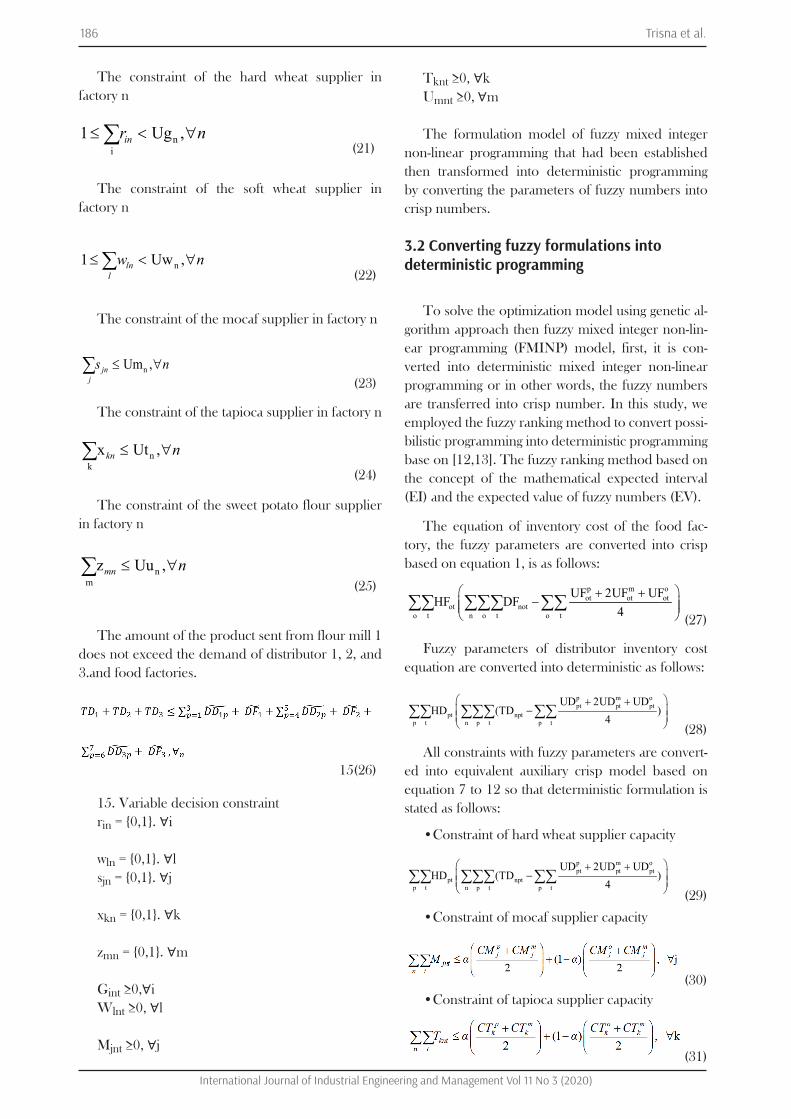
The constraint of the hard wheat supplier in factory n
The constraint of the soft wheat supplier in factory n
The constraint of the mocaf supplier in factory n
The constraint of the tapioca supplier in factory n
The constraint of the sweet potato flour supplier in factory n
The amount of the product sent from flour mill 1
does not exceed the demand of distributor 1, 2, and 3.and food factories.
15. Variable decision constraintrin = {0,1}. ∀i
wln = {0,1}. ∀lsjn = {0,1}. ∀j
xkn = {0,1}. ∀k
zmn = {0,1}. ∀m
Gint ≥0,∀i Wlnt ≥0, ∀l
Mjnt ≥0, ∀j
Tknt ≥0, ∀k Umnt ≥0, ∀m
The formulation model of fuzzy mixed integer non-linear programming that had been established then transformed into deterministic programming by converting the parameters of fuzzy numbers into crisp numbers.
3.2 Converting fuzzy formulations into deterministic programming
To solve the optimization model using genetic al-gorithm approach then fuzzy mixed integer non-lin-ear programming (FMINP) model, first, it is con-verted into deterministic mixed integer non-linear programming or in other words, the fuzzy numbers are transferred into crisp number. In this study, we employed the fuzzy ranking method to convert possi-bilistic programming into deterministic programming base on [12,13]. The fuzzy ranking method based on the concept of the mathematical expected interval (EI) and the expected value of fuzzy numbers (EV).
The equation of inventory cost of the food fac-tory, the fuzzy parameters are converted into crisp based on equation 1, is as follows:
Fuzzy parameters of distributor inventory cost equation are converted into deterministic as follows:
All constraints with fuzzy parameters are convert-ed into equivalent auxiliary crisp model based on equation 7 to 12 so that deterministic formulation is stated as follows:
• Constraint of hard wheat supplier capacity
• Constraint of mocaf supplier capacity
• Constraint of tapioca supplier capacity
(22)
(23)
(24)
(25)
(27)
(28)
(29)
(30)
(31)
15(26)
(21)n
i1 ,Ug<≤ ∀∑ inr n
nUm ,≤ ∀∑ jnj
s n
mnz Uu ,≤ ∀∑ mn n
p m oot ot ot
ot noto t n o t o t
UF 2UF UFHF DF
4 + +
−
∑∑ ∑∑∑ ∑∑
p m opt pt pt
pt nptp t n p t p t
UD 2UD UDHD (TD )
4
+ +−
∑∑ ∑∑∑ ∑∑
p m opt pt pt
pt nptp t n p t p t
UD 2UD UDHD (TD )
4
+ +−
∑∑ ∑∑∑ ∑∑
n1 ,Uw<≤ ∀∑ lnl
w n
knx Ut ,≤ ∀∑ kn n

187Trisna et al.
International Journal of Industrial Engineering and Management Vol 11 No 3 (2020)
• Constraint of sweet potato flour supplier capacity
• Constraint of the amount of raw materials received by flour mill should exceed the demand from food industries and distributors
The value α is determined by the degree of the decision makers that at least the minimum constraint are fulfilled, or α is feasibility degree of a decision variable x (minimum acceptable feasibility degree of decision vector) in which the value is between 0 and 1. The higher the value of α, the higher feasibility degree of decision variables.
3.3 Applying NSGA II for optimization
After the possibilistic programming model was converted into deterministic programming then NSGA II approach is conducted for optimization. This multi-objective optimization is performed to obtain the optimum solution set or called the Pareto front set. NSGA II technique developed by [14] using the α value between 0.1 and 1. To solve the fuzzy multi-objective optimization using the NSGA II approach, we used MOEA Framework version 2.8 available in http://www.moeaframework.org/ and
coded in Java Netbeans. NSGA II parameters are used including:
• Population size = 200 • Number of genes (decision variables) on each chromosome = 88 genes • Generation numbers= 20,000 • Crossover operator employed Simulated Binary Crossover (SBX) algorithm with SBX parameter rate of 0.9 and distribution index of 20.• Mutation used polynomial operator with mutation rate 0.1 and distribution index of 20.
In Table 1 shows the results of the numerical calculations of multi-objective optimization of wheat flour supply chain for α value between 0.1 and 1. The larger α-feasibility degree leads the worse achievement of objective 1, 2, 3, and 4. However, the larger α value provides the more feasibility decision variable result.
3.4 Determining the final decision
After possibilistic programming was converted into deterministic programming then multi-objective optimization can be conducted to obtain Pareto fronts set based on the value of α-feasibility degree. The results of Pareto front set usually prove that the lower of α-feasibility degrees, the greater constraint model to be violated. The decision makers will not take high risks by violating the constraints. To make the best decision of the results of multi-objective optimization on the different value of α-feasibility degree then we employed [13] approach. Besides using α-feasibility degree, they also implied satisfaction degree of decision makers to obtain fuzzy membership degree for each solution of Pareto front.
The decision makers are asked to state their
( )
0.75 0.75
1 (1 )2 2 2 2
+ + + + ≥
+ + + ++ − + + −
∑∑ ∑∑ ∑∑ ∑∑ ∑∑
∑ ∑
int lnt jnt knt mnti n l n j n k n m n
m o p m m o p ml l l l l l l l
G W M T U
DD DR DD DD DF DF DF DFá á á á
( )
0.75 0.75
1 (1 )2 2 2 2
+ + + + ≥
+ + + ++ − + + −
∑∑ ∑∑ ∑∑ ∑∑ ∑∑
∑ ∑
int lnt jnt knt mnti n l n j n k n m n
m o p m m o p ml l l l l l l l
G W M T U
DD DR DD DD DF DF DF DFá á á á
( )
0.75 0.75
1 (1 )2 2 2 2
+ + + + ≥
+ + + ++ − + + −
∑∑ ∑∑ ∑∑ ∑∑ ∑∑
∑ ∑
int lnt jnt knt mnti n l n j n k n m n
m o p m m o p ml l l l l l l l
G W M T U
DD DR DD DD DF DF DF DFá á á á
( )
0.75 0.75
1 (1 )2 2 2 2
+ + + + ≥
+ + + ++ − + + −
∑∑ ∑∑ ∑∑ ∑∑ ∑∑
∑ ∑
int lnt jnt knt mnti n l n j n k n m n
m o p m m o p ml l l l l l l l
G W M T U
DD DR DD DD DF DF DF DFá á á á
(33)
Table 1. The evaluation of fuzzy multi-objective for wheat flour supply chain with different α-feasibility degree
α Total cost (USD) Product quality (%) reliability Local flour usage (MT)
0.1 204 548 301 93.67 6.02 22958
0.2 204 788 498 93.90 6.71 22059
0.3 204 701 556 93.50 5.46 23622
0.4 205 645 073 93.59 6.69 23258
0.5 205 971 800 93.85 6.70 22251
0.6 206 262 920 93.32 6.67 24318
0.7 210 103 894 93.72 6.69 22774
0.8 214 837 308 91.70 4.94 30336
0.9 217 153 017 90.15 5.36 35730
1 220 509 961 88.87 4.88 42162
(32)

188 Trisna et al.
International Journal of Industrial Engineering and Management Vol 11 No 3 (2020)
satisfaction level of very satisfied and not satisfied about constraint of the results of the objective functions. For the maximization objective function, the decision makers will be more satisfied if the result of the objective function is bigger, and vice versa. For minimization objective function, the decision makers will be satisfied if the result of the objective function is smaller. In this case, the fuzzy membership function in which very satisfied decision-makers is 1, and that of very dissatisfied decision-makers is 0 in which it can be formulated in equation 34 and 35.
For maximization objective function:
For minimization objective function:
Where i(f ( ))µ α is the fuzzy membership
function i at α-feasibility degree, if ( )α is the value
of the objective function i. minif ( )α and max
if ( )α are
the value of the minimum and maximum limit of the objective function i, respectively.
Furthermore, the fuzzy decision membership degree for each objective function is calculated using equation (36).
Where i jD (f ( ))µ α is the fuzzy membership
function i for the jth α-feasibility degree. i j(f ( ))µ α
the satisfaction degree of decision makers for objective i for jth α-feasibility degree. The fuzzy final decision for optimal solution is the intersection of all membership degrees of objective function i at the jth solution. Determining the degree of membership intersection based on [15] can be
written, as follows:The final decision for the optimal solution is
those having the maximum value of ( )( )i j Dfµ α or
can be written as follows:
The lower α-feasibility degree value, the greater model constraint is violated. The decision makers will not take high risks by breaking the constraint. To make the best decision multi-objective optimization result on the different value of α-feasibility degree, [13] approach was conducted. Beside using α-feasibility degree, satisfaction degree of decision makers is implied to obtain fuzzy membership degree for each solution of Pareto front.
For objective 1, decision makers were asked about their satisfaction with optimization result of objective 1. Suppose that the decision makers were very satisfied if the supply chain cost is lower than $ 204,548,301 and do not want more than $ 217,153,017. Satisfaction degree of decision maker for the objective 1 employing equation (35) can be stated in linear fuzzy membership function as
equation 39.In the same way, the satisfaction degree of
the decision maker for the objective 2, 3, and 4 employing equation (34) can be stated in linear fuzzy membership function illustrated in equations 40, 41, and 42, respectively.
(34)
(35)
(40)
(41)
(36)
(37)
(38)
(39)
mini i
maxmin maxi i
i i i imax mini i
1, if f ( ) f ( )f ( ) f ( )(f ( )) , if f ( ) f ( ) f ( )
f ( ) f ( )0, if
α ≤ α
α − αµ α = α ≤ α ≤ α
α − αmax
i i f ( ) f ( )
α ≥ α
i j j i jD (f ( )) . (f ( ))µ α = α µ α
( )( ) ( ) ( ) ( )( ) ( ) ( )
i j j 1 j j 2 j j i jD
j 1 j j 2 j j i j
f . (f ) . (f ) .... . (f )
Min( .f , .f ,...., .f )
µ α = α µ α α µ α α µ α
= α α α α α α
( )( ) ( ) ( ) ( )( ) ( ) ( )
i j j 1 j j 2 j j i jD
j 1 j j 2 j j i j
f . (f ) . (f ) .... . (f )
Min( .f , .f ,...., .f )
µ α = α µ α α µ α α µ α
= α α α α α α
( )( ) ( ) ( ) ( )( ) ( ) ( )
i j j 1 j j 2 j j i jD
j 1 j j 2 j j i j
f . (f ) . (f ) .... . (f )
Min( .f , .f ,...., .f )
µ α = α µ α α µ α α µ α
= α α α α α α
( )( ) ( ) ( ) ( )( )i j j 1 j j 2 j j i jDMax f Max Min( .f , .f ,...., .f ) µ α = α α α α α α
( )( ) ( ) ( ) ( )( )i j j 1 j j 2 j j i jDMax f Max Min( .f , .f ,...., .f ) µ α = α α α α α α
1
11 1
1, if f ( ) 204548301217153017 f ( )(f ( )) , if 204548301 f ( ) 217153017
217153017 2045483010,
α ≤− α
µ α = ≤ α ≤−
1 if f ( ) 217153017
α ≥
1
11 1
1, if f ( ) 204548301217153017 f ( )(f ( )) , if 204548301 f ( ) 217153017
217153017 2045483010,
α ≤− α
µ α = ≤ α ≤−
1 if f ( ) 217153017
α ≥
2 j
2 j2 j 2 j
2 j
1, if f ( ) 93.90f ( ) 88.87
(f ( )) , if 88.87 f ( ) 93.9093.90 88.870, if f ( ) 88.87
α ≥ α −µ α = ≤ α ≤ −
α ≤
3 j
3 j3 j 3 j
3 j
1, if f ( ) 6.71f ( ) 4.88
(f ( )) , if 4.88 f ( ) 6.716.71 4.88
0, if f ( ) 4.88
α ≥ α −µ α = ≤ α ≤ −
α ≤
mini i
minmin maxi i
i i i imax mini i
i i
0, if f ( ) f ( )f ( ) f ( )(f ( )) , if f ( ) f ( ) f ( )
f ( ) f ( )1, if f ( ) f (
α ≤ α
α − αµ α = α ≤ α ≤ α
α − α
α ≥ max)
α

189Trisna et al.
International Journal of Industrial Engineering and Management Vol 11 No 3 (2020)
Furthermore, based on the equation (36), satisfaction degree of objective 1 can be calculated at different α values, as follows:
f1(0.1) = 204548301 then μ(f1(0.1))=1 f1(0.2) = 204788498 μ(f1(0.2))=(217153017-204788498)/
(217153017-204788498)=0.981
In the same way, fuzzy membership functions for objectives 1, 2, 3, and 4 can be computed on α-values in interval 0.1 to 1 which can be seen in Table 2.
After satisfaction degree for each objective function at α-feasibility degree was obtained then the fuzzy decision membership degree is calculated for each objective function using equation 37.
Suppose that the satisfaction degree of objective 1
at α = 0.1 and ( 1 0.1(f ( ))µ α = 1 then the fuzzy decision
membership degree 1 0.1D (f ( ))µ α = 0.1(1) = 0.1. Satisfaction degree of objective 1 at α = 0.2 and
( 1 0.2(f ( ))µ α = 0.981, then fuzzy decision membership
degree 1 0.2D (f ( ))µ α = 0.2(0.981)=0.196. The completing of fuzzy decision membership
degree for each objective at satisfaction degree α can be seen in Table 3.
Table 3 shows the intersection between α-feasibility degree and satisfaction degree of the decision makers for each objective function that generates fuzzy membership degree for each α-feasibility degree solution. The most optimal solution is which have the highest fuzzy membership degree. The analysis of fuzzy membership degree shows that the optimal solution is at α-feasibility degree 0.6 because it has the highest final decision membership degree, which is 0.067. If the decision makers are not satisfied with the final solution, the decision makers can alter the fuzzy boundary of objectives or select the degree of
Table 2. Satisfaction degree for each objective function at α- feasibility degree
Table 3. Fuzzy decision membership degree of objective i for jth α
αj μ(f1(αj)) μ(f2(αj)) μ(f3(αj)) μ(f4(αj))
0.1 1.000 0.953 0.625 0.045
0.2 0.981 1.000 1.000 0.000
0.3 0.988 0.919 0.320 0.078
0.4 0.913 0.938 0.988 0.060
0.5 0.887 0.990 0.998 0.010
0.6 0.864 0.883 0.979 0.112
0.7 0.559 0.963 0.993 0.036
0.8 0.184 0.562 0.035 0.412
0.9 0.000 0.253 0.261 0.680
1 0.000 0.000 0.000 1.000
αj αj .μ(f1(αj)) αj .μ(f2(αj)) αj .μ(f3(αj)) αj .μ(f4(αj) Min(αj .μ(fi(αj))
0.1 0.100 0.095 0.062 0.004 0.004
0.2 0.196 0.200 0.200 0.000 0.000
0.3 0.296 0.276 0.096 0.023 0.023
0.4 0.365 0.375 0.395 0.024 0.024
0.5 0.444 0.495 0.499 0.005 0.005
0.6 0.518 0.530 0.587 0.067 0.067
0.7 0.391 0.674 0.695 0.025 0.025
0.8 0.147 0.450 0.028 0.329 0.028
0.9 0.000 0.228 0.235 0.612 0.000
1 0.000 0.000 0.000 1.000 0.000
(42)
4 j
4 j4 j 4 j
4 j
1, if f ( ) 42162f ( ) 22059
(f ( )) , if 22059 f ( ) 4216242162 220590, if f ( ) 22059
α ≥ α −µ α = ≤ α ≤ −
α ≤
190 Trisna et al.
International Journal of Industrial Engineering and Management Vol 11 No 3 (2020)
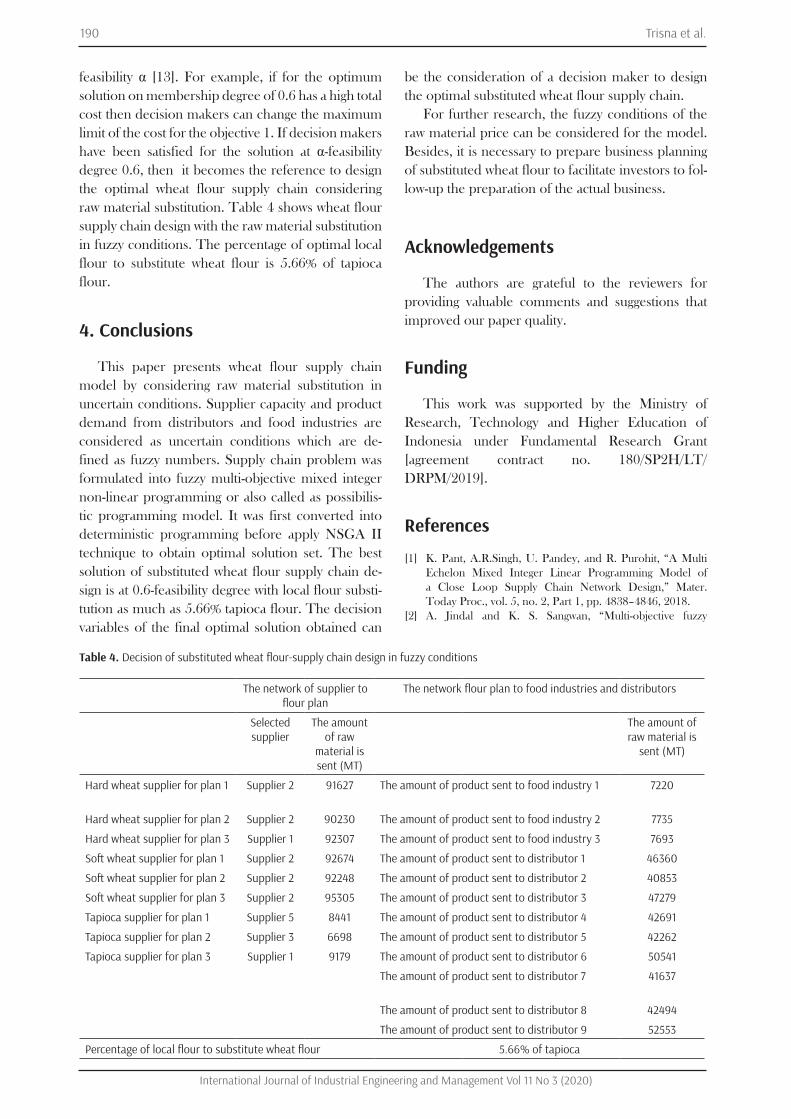
feasibility α [13]. For example, if for the optimum solution on membership degree of 0.6 has a high total cost then decision makers can change the maximum limit of the cost for the objective 1. If decision makers have been satisfied for the solution at α-feasibility degree 0.6, then it becomes the reference to design the optimal wheat flour supply chain considering raw material substitution. Table 4 shows wheat flour supply chain design with the raw material substitution in fuzzy conditions. The percentage of optimal local flour to substitute wheat flour is 5.66% of tapioca flour.
4. Conclusions
This paper presents wheat flour supply chain model by considering raw material substitution in uncertain conditions. Supplier capacity and product demand from distributors and food industries are considered as uncertain conditions which are de-fined as fuzzy numbers. Supply chain problem was formulated into fuzzy multi-objective mixed integer non-linear programming or also called as possibilis-tic programming model. It was first converted into deterministic programming before apply NSGA II technique to obtain optimal solution set. The best solution of substituted wheat flour supply chain de-sign is at 0.6-feasibility degree with local flour substi-tution as much as 5.66% tapioca flour. The decision variables of the final optimal solution obtained can
be the consideration of a decision maker to design the optimal substituted wheat flour supply chain.
For further research, the fuzzy conditions of the raw material price can be considered for the model. Besides, it is necessary to prepare business planning of substituted wheat flour to facilitate investors to fol-low-up the preparation of the actual business.
Acknowledgements
The authors are grateful to the reviewers for providing valuable comments and suggestions that improved our paper quality.
Funding
This work was supported by the Ministry of Research, Technology and Higher Education of Indonesia under Fundamental Research Grant [agreement contract no. 180/SP2H/LT/ DRPM/2019].
References
[1] K. Pant, A.R.Singh, U. Pandey, and R. Purohit, “A Multi Echelon Mixed Integer Linear Programming Model of a Close Loop Supply Chain Network Design,” Mater. Today Proc., vol. 5, no. 2, Part 1, pp. 4838–4846, 2018.[2] A. Jindal and K. S. Sangwan, “Multi-objective fuzzy
Table 4. Decision of substituted wheat flour-supply chain design in fuzzy conditions
The network of supplier to flour plan
The network flour plan to food industries and distributors
Selected supplier
The amount of raw
material is sent (MT)
The amount of raw material is
sent (MT)
Hard wheat supplier for plan 1 Supplier 2 91627 The amount of product sent to food industry 1 7220
Hard wheat supplier for plan 2 Supplier 2 90230 The amount of product sent to food industry 2 7735
Hard wheat supplier for plan 3 Supplier 1 92307 The amount of product sent to food industry 3 7693
Soft wheat supplier for plan 1 Supplier 2 92674 The amount of product sent to distributor 1 46360
Soft wheat supplier for plan 2 Supplier 2 92248 The amount of product sent to distributor 2 40853
Soft wheat supplier for plan 3 Supplier 2 95305 The amount of product sent to distributor 3 47279
Tapioca supplier for plan 1 Supplier 5 8441 The amount of product sent to distributor 4 42691
Tapioca supplier for plan 2 Supplier 3 6698 The amount of product sent to distributor 5 42262
Tapioca supplier for plan 3 Supplier 1 9179 The amount of product sent to distributor 6 50541
The amount of product sent to distributor 7 41637
The amount of product sent to distributor 8 42494
The amount of product sent to distributor 9 52553
Percentage of local flour to substitute wheat flour 5.66% of tapioca

191Trisna et al.
International Journal of Industrial Engineering and Management Vol 11 No 3 (2020)
mathematical modelling of closed-loop supply chain considering economical and environmental factors,” Ann. Oper. Res., vol. 257, no. 1, pp. 95–120, 2017.[3] S. H. Amin and F. Baki, “A facility location model for global closed-loop supply chain network design,” Appl. Math. Model., vol. 41, pp. 316–330, 2017.[4] Z. Dai and Z. Li, “Design of a dynamic closed-loop supply chain network using fuzzy bi-objective linear programming approach,” J. Ind. Prod. Eng., vol. 34, no. 5, pp. 330–343, Jul. 2017.[5] A. Jabbarzadeh, M. Pishvaee, and A. Papi, “A multi- period fuzzy mathematical programming model for crude oil supply chain network design considering budget and equipment limitations,” J. Ind. Syst. Eng., vol. 9, no. special issue on supply chain, pp. 88–107, 2016.[6] Ş. Yılmaz Balaman and H. Selim, “Sustainable design of renewable energy supply chains integrated with district heating systems: A fuzzy optimization approach,” J. Clean. Prod., vol. 133, pp. 863–885, 2016.[7] E. Pourjavad and R. V Mayorga, “Multi-objective fuzzy programming of closed-loop supply chain considering sustainable measures,” Int. J. Fuzzy Syst., vol. 21, no. 2, pp. 655–673, 2019.[8] G. A. Süer, X. Yang, O. I. Alhawari, J. Santos, and R. Vazquez, “A genetic algorithm approach for minimizing total tardiness in single machine scheduling,” Int. J. Ind. Eng. Manag., vol. 3, no. 3, pp. 163–171, 2012.[9] M. A. Ardakan and M. T. Rezvan, “Multi-objective optimization of reliability--redundancy allocation problem with cold-standby strategy using NSGA-II,” Reliab. Eng. Syst. Saf., vol. 172, pp. 225–238, 2018.[10] L. Zhang, L. Chen, S. Xia, Y. Ge, C. Wang, and H. Feng, “Multi-objective optimization for helium-heated reverse water gas shift reactor by using NSGA-II,” Int. J. Heat Mass Transf., vol. 148, p. 119025, 2020.[11] H. Ren, Y. Lu, Q. Wu, X. Yang, and A. Zhou, “Multi- objective optimization of a hybrid distributed energy system using NSGA-II algorithm,” Front. Energy, vol. 12, no. 4, pp. 518–528, 2018.[12] A. Khavandi Khiavi and H. Mohammadi, “Multiobjective optimization in pavement management system using NSGA-II method,” J. Transp. Eng. Part B Pavements, vol. 144, no. 2, p. 4018016, 2018.[13] Y. Sun, F. Lin, and H. Xu, “Multi-objective optimization of resource scheduling in fog computing using an improved NSGA-II,” Wirel. Pers. Commun., vol. 102, no. 2, pp. 1369–1385, 2018.[14] A. S. Sofia and P. GaneshKumar, “Multi-objective task scheduling to minimize energy consumption and makespan of cloud computing using NSGA-II,” J. Netw. Syst. Manag., vol. 26, no. 2, pp. 463–485, 2018.[15] B. Wang, Y. Liang, T. Zheng, M. Yuan, and H. Zhang, “Multi-objective site selection optimization of the gas- gathering station using NSGA-II,” Process Saf. Environ. Prot., vol. 119, pp. 350–359, 2018.[16] G. W. Mann and S. Eckels, “Multi-objective heat transfer optimization of 2D helical micro-fins using NSGA-II,” Int. J. Heat Mass Transf., vol. 132, pp. 1250–1261, 2019.[17] M. Kadziński, T. Tervonen, M. Tomczyk, and R. Dekker, “Evaluation of multi-objective optimization approaches for solving green supply chain design problems,” Omega, vol. 68, pp. 168–184, 2017.[18] V. Babaveisi, M. M. Paydar, and A. S. Safaei, “Optimizing a multi-product closed-loop supply chain using NSGA-II, MOSA, and MOPSO meta-heuristic algorithms,” J. Ind. Eng. Int., vol. 14, no. 2, pp. 305–326, 2018.[19] J. Shi, Z. Liu, L. Tang, and J. Xiong, “Multi-objective optimization for a closed-loop network design problem using an improved genetic algorithm,” Appl. Math. Model.,
vol. 45, pp. 14–30, 2017.[20] S. Moslemi, M. H. Z. Sabegh, A. Mirzazadeh, Y. Ozturkoglu, and E. Maass, “A multi-objective model for multi-production and multi-echelon closed-loop pharmaceutical supply chain considering quality concepts: NSGAII approach,” Int. J. Syst. Assur. Eng. Manag., vol. 8, no. 2, pp. 1717–1733, 2017.[21] M. Musavi and A. Bozorgi-Amiri, “A multi-objective sustainable hub location-scheduling problem for perishable food supply chain,” Comput. Ind. Eng., vol. 113, pp. 766–778, 2017.[22] M. A. Sobhanallahi, A. Mahmoodzadeh, and B. Naderi, “A novel fuzzy multi-objective method for supplier selection and order allocation problem using NSGA II,” Sci. Iran., vol. 27, no. 1, pp. 481–493, 2020.[23] M. Safaeian, A. M. Fathollahi-Fard, G. Tian, Z. Li, and H. Ke, “A multi-objective supplier selection and order allocation through incremental discount in a fuzzy environment,” J. Intell. Fuzzy Syst., vol. 37, no. 1, pp. 1435–1455, 2019.[24] R. S. Kumar, A. Choudhary, S. A. K. I. Babu, S. K. Kumar, A. Goswami, and M. K. Tiwari, “Designing multi-period supply chain network considering risk and emission: A multi-objective approach,” Ann. Oper. Res., vol. 250, no. 2, pp. 427–461, 2017.[25] M. Rabbani, H. Farrokhi-Asl, and B. Asgarian, “Solving a bi-objective location routing problem by a NSGA-II combined with clustering approach: application in waste collection problem,” J. Ind. Eng. Int., vol. 13, no. 1, pp. 13–27, 2017.[26] T. Trisna, M. Marimin, Y. Arkeman, and T. C. Sunarti, “Multi-objective optimization for supply chain management problem: A literature review,” Decis. Sci. Lett., vol. 5, pp. 283–316, 2016.[27] Trisna, Marimin, Y. Arkeman, and T. C. Sunarti, “Genetic Algorithm Based Multi-objective Optimization of Wheat Flour Supply Chain Considering Raw Material Substitution,” in The 7th International Conference on Advanced Computer Science and Information Systems (ICACSIS), 2015, pp. 76–81.[28] M. Jiménez, “Ranking fuzzy numbers through the comparison of its expected intervals,” Int. J. Uncertainty, Fuzziness Knowledge-Based Syst., vol. 04, no. 04, pp. 379–388, 1996.[29] M. Jiménez, M. Arenas, A. Bilbao, and M. V. Rodrıguez, “Linear programming with fuzzy parameters: An interactive method resolution,” Eur. J. Oper. Res., vol. 177, pp. 1599–1609, 2007.[30] K. Deb, A. Pratap, S. Agarwal, and T. Meyarivan, “A fast and elitist multiobjective genetic algorithm: NSGA-II,” Evol. Comput. IEEE Trans., vol. 6, no. 2, pp. 182–197, 2002.[31] R. E. Bellman and L. A. Zadeh, “Decision making in fuzzy environment,” Manage. Sci., vol. 17, no. 4, pp. 141–164, 1970.