future transport investment in the north · excluded all but ‘central ... a number of ways to...
TRANSCRIPT
Luke Raikes
January 2018
Institute for Public Policy Research
FUTURE TRANSPORT INVESTMENT IN THE NORTHA BRIEFING ON THE GOVERNMENT’S NEW REGIONAL ANALYSIS OF THE NATIONAL INFRASTRUCTURE AND CONSTRUCTION PIPELINE

The progressive policy think tank
ABOUT IPPR NORTHIPPR North is the dedicated think tank for the north of England, with bases in Manchester and Newcastle.
IPPR, the Institute for Public Policy Research, is the UK's leading progressive think tank. We are an independent charitable organisation with our main office in London. IPPR Scotland is based in Edinburgh.
IPPR's purpose is to conduct and promote research into, and the education of the public in, the economic, social and political sciences, science and technology, the voluntary sector and social enterprise, public services, and industry and commerce.
20th Floor City Tower Piccadilly Plaza Manchester M1 4BT T: +44 (0)161 694 9680 E: [email protected] www.ippr.org/north
Registered charity no: 800065 (England and Wales), SC046557 (Scotland)
This paper was first published in January 2018. © IPPR 2018
The contents and opinions expressed in this paper are those of the author only.

A briefing on the government’s new regional analysis of the National Infrastructure and Construction Pipeline 1
CONTENTS
Summary ..........................................................................................................................3
1. Introduction and background ................................................................................5
1.1 Historic spending .....................................................................................................5
2. The new IPA regional analysis of future transport investment .................... 72.1 IPA regional analysis ..................................................................................8
Assumption 1 Key national programmes have been allocated regionally ................ 9Assumption 2 Regional spending figures now include HS2 .......................................... 9Assumption 3 Despite creating new spending categories, the analysis has excluded all but ‘central government’ spending ................................. 10Assumption 4 The new analysis excludes more than £11.6 billion that is spent in London on the grounds that it is no longer central government funding ..................................................................................11Assumption 5 The analysis only includes spending up to the financial year 2020/21 ............................................................................................... 12
3. Consideration of the IPA regional analysis methodology and assumptions .....................................................................................................133.1 On the treatment of ‘national’ projects and programmes ............... 133.2 On HS2 ....................................................................................................... 133.3. On the treatment of spending categories.......................................... 143.4. On the treatment of TfL expenditure .................................................. 143.5 On only including spending to 2020/21 ............................................... 15
4. New IPPR north regional analysis ......................................................................16
Conclusions ...................................................................................................................18
References ....................................................................................................................19

2 IPPR NORTH | Future Transport Investment in the North
ABOUT THE AUTHORLuke Raikes is a senior research fellow at IPPR North.
ACKNOWLEDGEMENTSThe author would like to thank Ed Cox, Director of IPPR North and Tom Kibasi, Director of IPPR, for their comments on drafts of this briefing. We would like to thanks colleagues at the Infrastructure and Projects Authority for their assistance in understanding the new methodology.
DownloadThis document is available to download as a free PDF and in other formats at:http://www.ippr.org/publications/future-transport-investment-in-the-north-briefing
CitationIf you are using this document in your own writing, our preferred citation is:Raikes L (2018) Future Transport Investment in the North: A briefing on the government’s new regional analysis of the National Infrastructure and Construction Pipeline, IPPR. http://www.ippr.org/publications/future-transport-investment-in-the-north-briefing
Permission to shareThis document is published under a creative commons licence: Attribution-NonCommercial-NoDerivs 2.0 UK http://creativecommons.org/licenses/by-nc-nd/2.0/uk/ For commercial use, please contact [email protected]

A briefing on the government’s new regional analysis of the National Infrastructure and Construction Pipeline 3
SUMMARY
The Infrastructure and Projects Authority (IPA)1 recently published the annual National Infrastructure and Construction Pipeline, which sets out the government’s infrastructure plans for the coming years.
Previous iterations have shown planned transport infrastructure spending to be vastly higher in London than in the rest of the country. This year, the IPA introduced a new regional analysis, which showed much more even regional spending. This is because the data and the methodology used by the IPA is different from that used by IPPR North.
The IPA has made five significant developments and assumptions as follows:1. the analysis only includes spending up to the financial year 2020/21 – this
effectively excludes £56.2 billion of spending, of which a large proportion is in London
2. more than £11.6 billion spent by Transport for London (TfL) is excluded on the grounds that it is no longer central government funding. Following an arrangement between the Mayor of London and the Transport Secretary in April 2017, the central government transport grant has been traded in return for retention of local business rates allowing the government to say it no longer funds a large proportion of London’s transport funding
3. key ‘national’ programmes of transport investment have been allocated regionally – in the past this has been considered impossible to do but the IPA has now found a number of ways to allocate funding to the regions in which they are located. It has not published the actual data tables associated with this analysis
4. regional spending figures now include HS2 – but unlike other national programmes the spending is allocated according to the forecast economic impact, rather than where the spending takes place
5. despite creating new ‘categories’ of spending, the analysis has excluded all but central government spending. This means that the private and local money leveraged in by central government (on projects such as Crossrail) is excluded.
IPPR North commends the IPA for responding to our frequent calls to improve the available data on regional infrastructure and accepting the argument that it is important to disaggregate public spending on a regional, per capita basis. We support some of the assumptions made in the new regional analysis including the importance of allocating ‘national’ projects, including HS2, across different regions and excluding private-only investments.
However, there are a number of assumptions which may have been applied accurately but manage to disregard large amounts spent in London and many people might consider misleading. In particular, IPPR North believes:• it is wrong to exclude spending after 2020/21 as the whole point of the
National Infrastructure Pipeline is that it represents a long-term plan for government expenditure on the nation’s infrastructure needs. If the IPA continues with this approach then the regional analysis in the next two years will be almost entirely meaningless
• it is wrong to exclude all local spending and, in particular, the £11.7 billion spending planned in London. Allowing the Greater London Authority to retain its business rates and allowing TfL alone to retain fare box receipts represent central government decisions for which the transport secretary and chancellor should be
1 The IPA is a government agency reporting to the Cabinet Office and the Treasury.

4 IPPR NORTH | Future Transport Investment in the North4
held to account. This is particularly the case given that business rate retention is likely to exacerbate the actual spending disparities in the years ahead
• it is wrong to exclude private spending where it supports ‘public/private’ projects because – as the pipeline makes clear – public spending on transport nearly always leverages or guarantees the private spending.
Based on the new data available through the latest pipeline and our consideration of the methodological assumptions made by the IPA, IPPR North has been able to carry out its own new analysis of the regional figures. This is an improvement on our previous work due to the new data available but we do not accept all of the IPA assumptions for the reasons cited above.
When we include all public and public/private spending, and spending from central and local governments and all combinations of these where possible; and when we include spending after 2020/21, our own figures (below)* show that:• planned transport investment in London is almost 2.6 times higher per capita
than in the North• £4,155 per capita is planned on London, compared to just £1,600 in the North
as a whole• planned spending in London is almost five times more per capita more than in
Yorkshire and the Humber (£844 per capita) or the North East (£855 per capita) – the lowest of all English regions
• the North West is set to receive more than the England regional average, at £2,439 per capita, but still far less than London, and also less than the West Midlands (£3,029 per capita).
£4,155
£3,029
£2,439 £1,955
£1,600 £1,307 £1,134 £1,134 £984 £855 £844
£0 £500
£1,000 £1,500 £2,000 £2,500 £3,000 £3,500 £4,000 £4,500
Lond
on
Wes
t Mid
land
s
Nort
h W
est
Engl
and
Nort
h
Sout
h Ea
st
East
Mid
land
s
East
of
Engl
and
Sout
h W
est
Nort
h Ea
st
York
shire
and
the
Hum
ber
Source: IPPR North analysis of HM Treasury and the IPA 2017a *IPPR North analysis of planned central and local public/private transport infrastructure spending per capita 2017/18 onwards (real terms 2016/17 prices)
For those who take an interest in the detail of transport spending we hope this briefing helps to elaborate the different methodological issues at stake when it comes to making regional comparisons. These debates would be greatly assisted if the IPA and the Department for Transport published more details of their new regional analysis and applied greater consistency to the ways in which they make regional allocations. For the majority of road and rail users, there should be significant concern that – however government chooses to present the figures – London will continue to receive the lion’s share of tax-payers’ money spent on transport and that these disparities will widen further as the Greater London Authority gets to keep business rate revenues which have historically been pooled, in part, to rebalance the economy.
Unless and until central government makes significant new investments in transport priorities outside the capital and affords bodies like Transport for the North the same powers as those exercised by TfL, it will be impossible to repaint a different picture and we will continue to live in a nation which is dangerously unbalanced.

A briefing on the government’s new regional analysis of the National Infrastructure and Construction Pipeline 5
1. INTRODUCTION AND BACKGROUND
Transport spending is vital for the UK economy. Although no silver bullet, it is an important part of the solution to the UK’s low productivity relative to other advanced economies, and to the concentration of economic growth in the capital. If the right transport decisions are made, it can drive up wages, productivity, employment and economic growth. If the wrong decisions are made there are risks that transport can be ineffective or cause negative consequences (Laird and Mackie 2010; WWCLEG 2015; Blakeley 2017).
Currently – in contrast to other countries – most transport decisions in the UK are made by central government. Some decisions around transport are devolved to the constituent nations, but England’s transport policy is decided by central government in London. Local authorities in England have limited transport powers and get the majority of their funding from central government or from taxes which central government controls. London is the exception to this, although six new metro mayors and a number of combined authorities have recently taken on some small additional powers. In countries such as France, Germany and the Netherlands, regional and local governments undertake a much bigger role in financing, planning and managing transport (see Cox and Raikes 2015).
1.1 HISTORIC SPENDINGProjections of future spending must be understood alongside historic spending patterns. These historic figures have some drawbacks in that they only include public spending and exclude the private financing often used to invest in infrastructure. But unlike the projections of future spending they are more comprehensive in that they include revenue spending. There is a complex relationship between revenue and capital that is beyond the scope of this briefing, but both are vital. It is also important to note that, while the forward-looking figures have been the subject of debate and interpretation, these historical figures are generally agreed to be accurate.
The historical figures show that over the last five years (between 2012/13 and 2016/17), £121 billion has been spent on transport in UK regions:2 • two thirds (65.6 per cent) of this is capital, making up £79.4 billion• just over half of the total (54.1 per cent) is central government direct spending,
making up £65.4 billion• 39.9 per cent was spent by local government, although local government
funding is largely allocated by central government, accounting for £48.3 billion• 6.0 per cent was spent by public corporations, accounting for £7.2 billion.(HM Treasury 2017)
These figures show that there has been significantly more transport investment in London than anywhere else. The regional pattern of this spending was as follows: • London received £33.3 billion of public money for transport in the last five
years. This is £3,902 per capita – more than twice the UK average £1,872 per
2 All figures are in real terms, 2016/17 prices, and include only spending in UK regions (i.e. excluding spending overseas) by the public sector (local government, central government and public corporations)

6 IPPR NORTH | Future Transport Investment in the North
capita and the average for the North, which was £1,513 per capita over the same period
• central government spending in London has more than doubled – rising by 135.4 per cent since 2012/13 – more than in any other region, and more than double the rate of increase in the North (58.8 per cent)
• public corporation funding has also increased by almost a third (31.1 per cent) in London – this is again a bigger increase than anywhere else. In the North, it increased by 18.9 per cent
• if the North had received the same amount of money per capita as London has in the last five years £36 billion more would have been spent in the North.3
(IPPR North analysis of HM Treasury 2017)
FIGURE 1.1LONDON HAS RECEIVED TWICE AS MUCH TRANSPORT SPENDING PER PERSON THAN THE UK AVERAGE OR THE NORTH OVER THE PAST FIVE YEARSHistoric transport spending in UK nations and regions, in real terms (2016/17 prices)
0
100
200
300
400
500
600
700
800
900
1,000
2012–13 2013–14 2014–15 2015–16 2016–17
London
Scotland
UK Regional Spending
Wales
South East
North West
Yorkshire and the Humber
East
West Midlands
Northern Ireland
South West
NorthEast
East Midlands
Source: HM Treasury 2017
3 Previous IPPR North analyses have been conducted over ten years, for which the North’s ‘catch up’ figure is £59 billion
A briefing on the government’s new regional analysis of the National Infrastructure and Construction Pipeline 7
2. THE NEW IPA REGIONAL ANALYSIS OF FUTURE TRANSPORT INVESTMENT
This section turns to the main subject of this briefing, the planned transport investment figures. These figures are published on an annual basis as part of the National Infrastructure and Construction Pipeline, which is produced by the Infrastructure and Projects Authority – the government’s centre of expertise for infrastructure and major projects – reporting to the Cabinet Office and HM Treasury (see HM Treasury and the IPA 2017).
For several years IPPR North has analysed the government’s spending plans on transport infrastructure, and our analysis of the last (2016) pipeline showed that planned spending was more than four times higher in London per capita than in the North (Blakeley 2017).
The 2017 pipeline introduced a new analysis: for the first time the government has produced its own calculations of regional transport spending per capita. This in itself seems to be recognition on the part of government that analysing public spending on a per capita basis is a legitimate and meaningful exercise. However, it uses some new data sources and a very different methodology from the IPPR North analysis and it comes to very different conclusions.
In order to fully understand this new analysis and compare it with previous analyses it is important to note a few things about this dataset more generally:• it is simply a pipeline of projects and programmes – a list of government plans
for infrastructure spending – set out in a large spreadsheet which is helpfully accessible to anybody to scrutinise4
• the ‘funding source’ for each project is now divided into seven categories. Previously there were only three (public, private and public/private) but these have been further subdivided in this release as follows:
– central government – central government/private – central government/local government – central government/local government/private – local government – local government/private – private
• projects and programmes are listed at various stages of their lifecycle. They can be ‘ in construction’, ‘scoping’ and so on. It is important to note for the purposes of regional analysis that Crossrail 2 is not yet included – this is a £31 billion project, with half of the funding provided by central government and the other half funded directly by TfL.5 Likewise, Northern Powerhouse Rail is excluded
4 See: https://www.gov.uk/government/publications/national-infrastructure-and-construction-pipeline-2017
5 A small amount of funding for Crossrail 2 does appear in the pipeline for its development work only – it is not Capex spend and is not assigned to any year
8 IPPR NORTH | Future Transport Investment in the North
• the pipeline is open-ended. Although most of the planned projects are, understandably, in the next few years, any project that is at the appropriate stage of its development is included. For example, the capital costs of HS2 (phases 1 and 2) are included in the pipeline although the bulk of this spending occurs in ‘2021/22 and Beyond’
• projects are allocated to regions ‘based on the location of the built asset, when the asset is located within one region’ (IPA 2017). Approximately 40 per cent of projects can be analysed in this way, but some are part of programmes (such as maintenance and renewals) or traverse regional boundaries (such as HS2). Historically, these have been considered ‘national’ projects and not been counted in regional tables, but the IPA has conducted an additional regional analysis of these for the first time this year (see below).
(See HM Treasury and the IPA 2017a and 2017b)
2.1 IPA REGIONAL ANALYSISThe IPA has produced a new regional analysis of transport in its December 2017 publication, which is presented in figure 2.1. Despite being published within the pipeline documents and in the workbook containing the list of projects, the analysis is not of pipeline itself but of the Department for Transport’s data which the pipeline also uses as its source. The Department for Transport’s figures are not available to the public in the same way as the IPA pipeline. This means that it is difficult to understand in fine detail how the regional analysis has been undertaken but there is sufficient information in the pipeline and in Annex B on the methodology used to be able to understand the main assumptions and their implications.
In future we would suggest that the government publishes the actual data tables from which its regional analysis is derived.
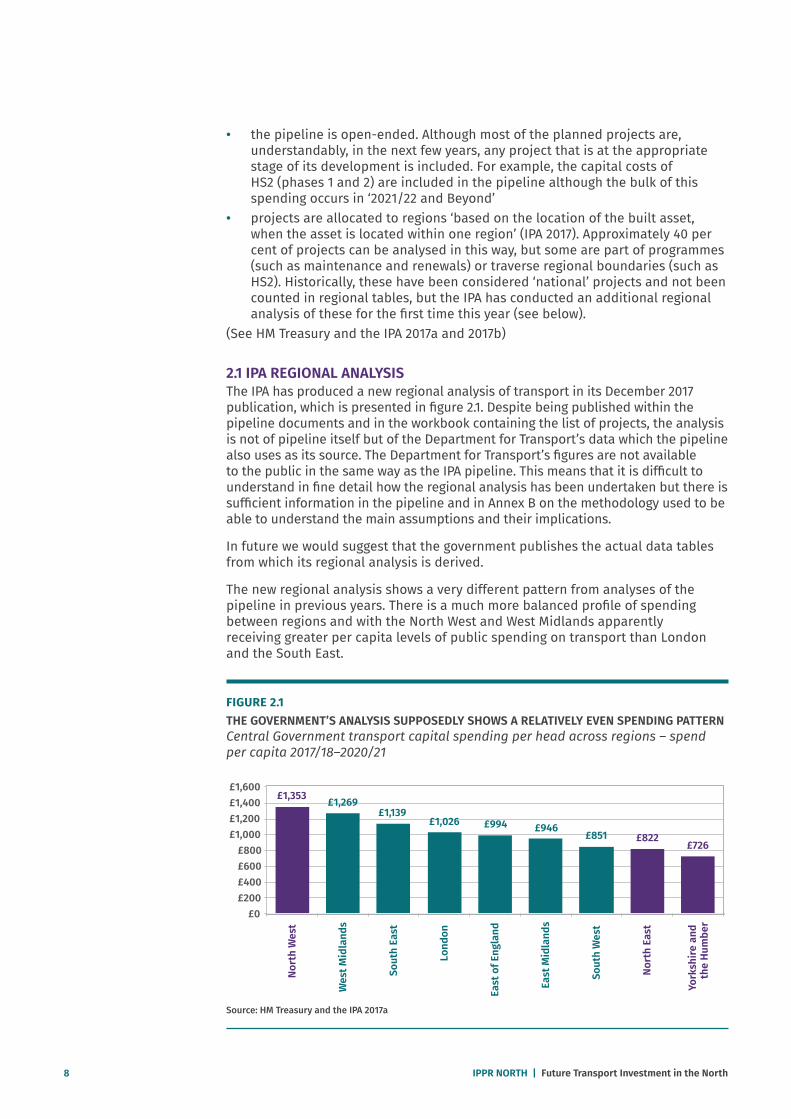
The new regional analysis shows a very different pattern from analyses of the pipeline in previous years. There is a much more balanced profile of spending between regions and with the North West and West Midlands apparently receiving greater per capita levels of public spending on transport than London and the South East.
FIGURE 2.1THE GOVERNMENT’S ANALYSIS SUPPOSEDLY SHOWS A RELATIVELY EVEN SPENDING PATTERNCentral Government transport capital spending per head across regions – spend per capita 2017/18–2020/21
£1,353 £1,269£1,139
£1,026 £994 £946£851 £822
£726
£0£200£400£600£800
£1,000£1,200£1,400£1,600
Nort
h W
est
Wes
t Mid
land
s
Sout
h Ea
st
Lond
on
East
of E
ngla
nd
East
Mid
land
s
Sout
h W
est
Nort
h Ea
st
York
shire
and
th
e Hu
mbe
r
Source: HM Treasury and the IPA 2017a
A briefing on the government’s new regional analysis of the National Infrastructure and Construction Pipeline 9
In order to arrive at this breakdown it would appear that the IPA has made five significant assumptions that differ from the analytical framework previously used by IPPR North. These are as follows.
Assumption 1 Key national programmes have been allocated regionally
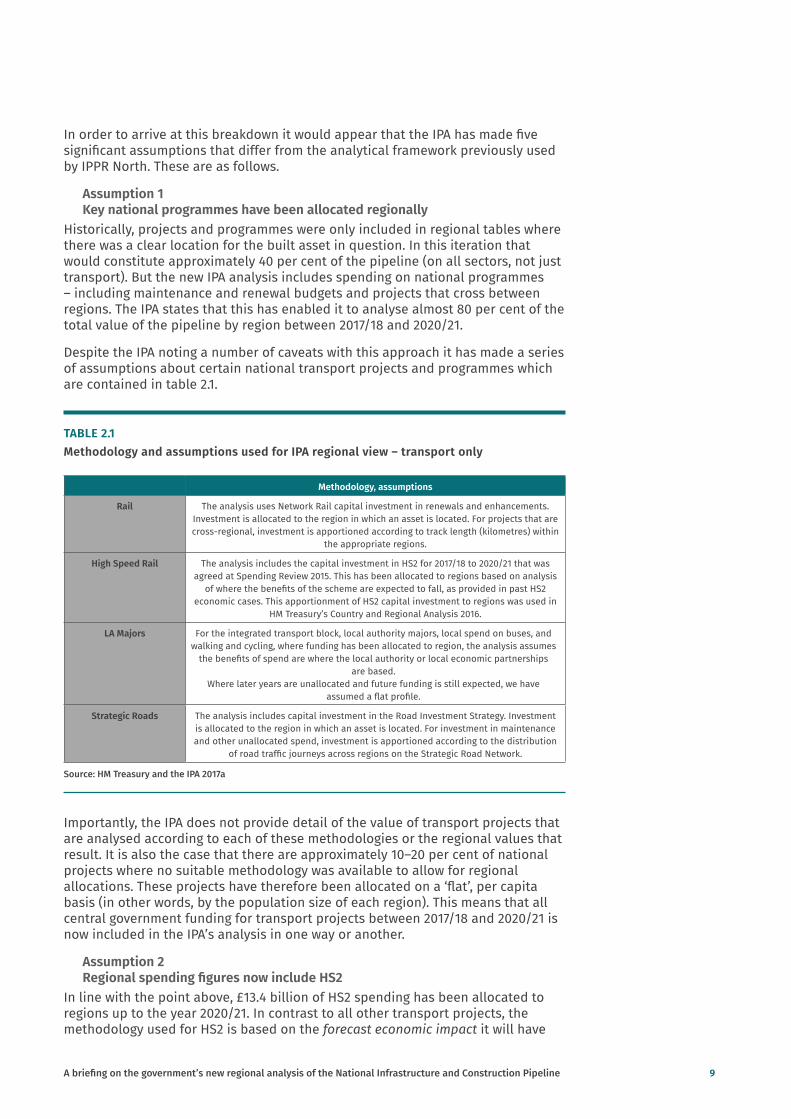
Historically, projects and programmes were only included in regional tables where there was a clear location for the built asset in question. In this iteration that would constitute approximately 40 per cent of the pipeline (on all sectors, not just transport). But the new IPA analysis includes spending on national programmes – including maintenance and renewal budgets and projects that cross between regions. The IPA states that this has enabled it to analyse almost 80 per cent of the total value of the pipeline by region between 2017/18 and 2020/21.
Despite the IPA noting a number of caveats with this approach it has made a series of assumptions about certain national transport projects and programmes which are contained in table 2.1.
TABLE 2.1Methodology and assumptions used for IPA regional view – transport only
Methodology, assumptions
Rail The analysis uses Network Rail capital investment in renewals and enhancements. Investment is allocated to the region in which an asset is located. For projects that are cross-regional, investment is apportioned according to track length (kilometres) within
the appropriate regions.
High Speed Rail The analysis includes the capital investment in HS2 for 2017/18 to 2020/21 that was agreed at Spending Review 2015. This has been allocated to regions based on analysis
of where the benefits of the scheme are expected to fall, as provided in past HS2 economic cases. This apportionment of HS2 capital investment to regions was used in
HM Treasury’s Country and Regional Analysis 2016.
LA Majors For the integrated transport block, local authority majors, local spend on buses, and walking and cycling, where funding has been allocated to region, the analysis assumes
the benefits of spend are where the local authority or local economic partnerships are based.
Where later years are unallocated and future funding is still expected, we have assumed a flat profile.
Strategic Roads The analysis includes capital investment in the Road Investment Strategy. Investment is allocated to the region in which an asset is located. For investment in maintenance and other unallocated spend, investment is apportioned according to the distribution
of road traffic journeys across regions on the Strategic Road Network.
Source: HM Treasury and the IPA 2017a
Importantly, the IPA does not provide detail of the value of transport projects that are analysed according to each of these methodologies or the regional values that result. It is also the case that there are approximately 10–20 per cent of national projects where no suitable methodology was available to allow for regional allocations. These projects have therefore been allocated on a ‘flat’, per capita basis (in other words, by the population size of each region). This means that all central government funding for transport projects between 2017/18 and 2020/21 is now included in the IPA’s analysis in one way or another.
Assumption 2 Regional spending figures now include HS2
In line with the point above, £13.4 billion of HS2 spending has been allocated to regions up to the year 2020/21. In contrast to all other transport projects, the methodology used for HS2 is based on the forecast economic impact it will have
10 IPPR NORTH | Future Transport Investment in the North
on different regions. The established methodology for the pipeline’s regional allocation is specifically ‘not based on analysis of the benefits that assets will deliver’ (HM Treasury and the IPA 2017b) but the IPA has made an exception for HS2. This has not been previously included in the pipeline.
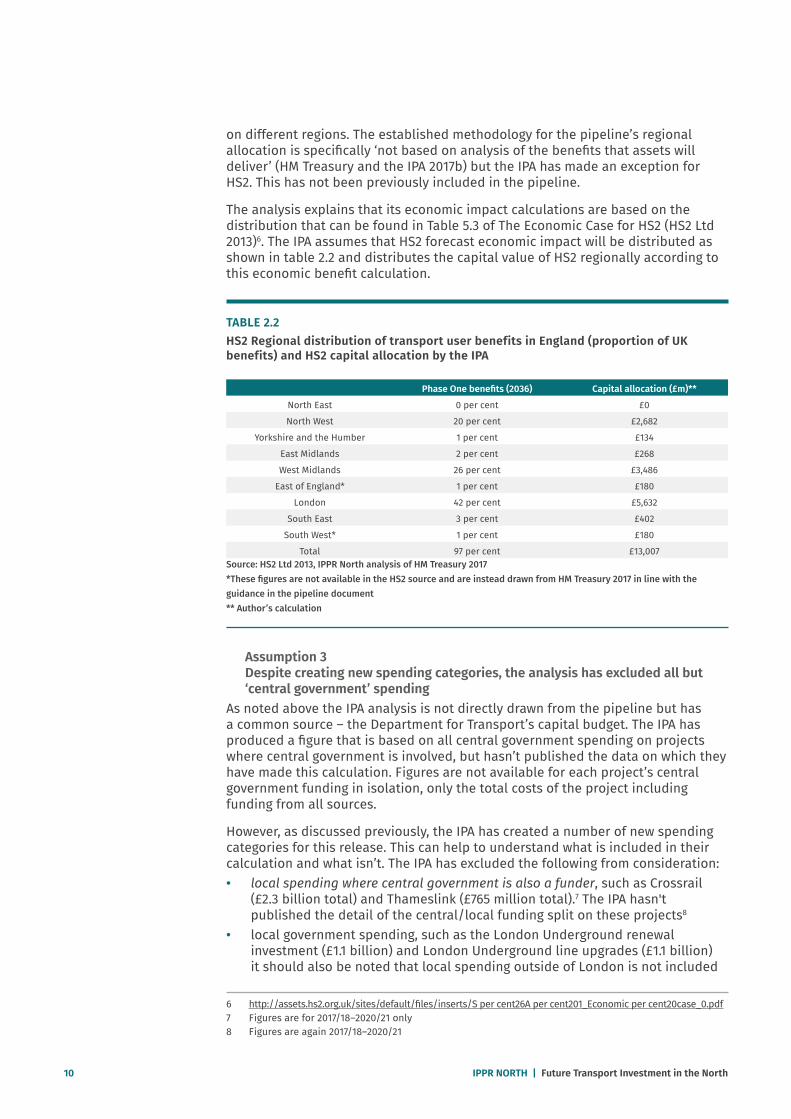
The analysis explains that its economic impact calculations are based on the distribution that can be found in Table 5.3 of The Economic Case for HS2 (HS2 Ltd 2013)6. The IPA assumes that HS2 forecast economic impact will be distributed as shown in table 2.2 and distributes the capital value of HS2 regionally according to this economic benefit calculation.
TABLE 2.2HS2 Regional distribution of transport user benefits in England (proportion of UK benefits) and HS2 capital allocation by the IPA
Phase One benefits (2036) Capital allocation (£m)**
North East 0 per cent £0
North West 20 per cent £2,682
Yorkshire and the Humber 1 per cent £134
East Midlands 2 per cent £268
West Midlands 26 per cent £3,486
East of England* 1 per cent £180
London 42 per cent £5,632
South East 3 per cent £402
South West* 1 per cent £180
Total 97 per cent £13,007Source: HS2 Ltd 2013, IPPR North analysis of HM Treasury 2017 *These figures are not available in the HS2 source and are instead drawn from HM Treasury 2017 in line with the guidance in the pipeline document ** Author’s calculation
Assumption 3 Despite creating new spending categories, the analysis has excluded all but ‘central government’ spending
As noted above the IPA analysis is not directly drawn from the pipeline but has a common source – the Department for Transport’s capital budget. The IPA has produced a figure that is based on all central government spending on projects where central government is involved, but hasn’t published the data on which they have made this calculation. Figures are not available for each project’s central government funding in isolation, only the total costs of the project including funding from all sources.
However, as discussed previously, the IPA has created a number of new spending categories for this release. This can help to understand what is included in their calculation and what isn’t. The IPA has excluded the following from consideration:• local spending where central government is also a funder, such as Crossrail
(£2.3 billion total) and Thameslink (£765 million total).7 The IPA hasn't published the detail of the central/local funding split on these projects8
• local government spending, such as the London Underground renewal investment (£1.1 billion) and London Underground line upgrades (£1.1 billion) it should also be noted that local spending outside of London is not included
6 http://assets.hs2.org.uk/sites/default/files/inserts/S per cent26A per cent201_Economic per cent20case_0.pdf7 Figures are for 2017/18–2020/21 only8 Figures are again 2017/18–2020/21

A briefing on the government’s new regional analysis of the National Infrastructure and Construction Pipeline 11
in the IPA analysis, and isn’t in the pipeline either (and so is excluded from our own analysis which follows)
• private sector spending when either central or local government is a co-funder, for example the Barking Riverside extension in London (£61 million total) and the Charging Infrastructure Investment Fund (£300 million total)
• projects funded by the private sector alone, including £5.4 billion to be spent on airports (£4.9 billion) and ports (£598 million) such as the Heathrow Capital Investment Programme Q6 (£1.4 billion) and the Gatwick Capital Investment Programme (£1.0 billion).
The total amount of funding then excluded from the analysis for this reason alone is £20.7 billion. £5.5 billion of this is exclusively funded by the private sector. But £7.7 billion local or local/private funding has been excluded, all of which is in London.
Assumption 4 The new analysis excludes more than £11.6 billion that is spent in London on the grounds that it is no longer central government funding.
The government has excluded more than half of all public and public/private money being spent in London. This is because, as noted above, the government has only included direct central government spending. It appears that the IPA has included only £9.0 billion of spending in London, and excluded £11.6 billion – £7.7 billion of which is pre 2020/21 and £3.9 billion of which is post 2020/21 because it is local or local/private.
FIGURE 2.2IPA ANALYSIS EXCLUDES A NUMBER OF FUNDING STREAMS CONCENTRATED ALMOST ENTIRELY IN LONDONIPA representation of transport spending per capita, with IPPR North calculations of local government spending added 2017/18-2020/21*
£0 £200 £400 £600 £800
£1,000 £1,200 £1,400 £1,600 £1,800 £2,000
Nort
h Ea
st
Nort
h W
est
East
Mid
land
s
Wes
tM
idla
nds
East
of
Engl
and
Lond
on
Sout
h Ea
st
Sout
h W
est
Local government/privateLocal governmentIPA figure
York
shire
and
The
Hum
ber
Source: IPPR North analysis of HM Treasury and the IPA 2017a *This figure excludes from consideration that spending which local government contributes to ‘central/local’ spending because this is not available; the ‘central’ component of ‘central/local’ will be included in the IPA analysis, but these figures haven’t been published

12 IPPR NORTH | Future Transport Investment in the North
The rationale behind this derives from the way the IPA chooses to treat TfL business rates and fare receipts. The IPA states that:
‘As this table only looks at transport capital spending funded by central government, TfL expenditure is excluded. TfL’s capital programme is funded by a mixture of locally-retained business rates and fare receipts from TfL-operated services, and from 2017/18 onwards it receives no direct central government funding. However, DfT does directly fund major transport projects across London, such as Crossrail, and Thameslink’ (HM Treasury and the IPA 2017a).
Assumption 5 The analysis only includes spending up to the financial year 2020/21.
The pipeline includes transport projects and programmes that ‘go into service’ up to the year 2033 and spending of £135.3 billion (from all sources). However, the IPA methodology chooses only to analyse spending earmarked within the current spending review period to 2020/21 on the grounds that public spending has yet to be finalised beyond this date.
As a result of all the above considerations, of the £129.2 billion spending involving the public sector, the IPA includes less than half (£57.8 billion) of spending. Of the £42.5 billion excluded because it is outside of this timeframe, almost half (£19.8 billion) is in London, and £36.5 billion is on HS2 (England only).
A briefing on the government’s new regional analysis of the National Infrastructure and Construction Pipeline 13
3. CONSIDERATION OF THE IPA REGIONAL ANALYSIS METHODOLOGY AND ASSUMPTIONS
IPPR North commends the IPA for responding to our frequent calls to improve the available data on regional infrastructure. The public has a right to know where in the country the £135.3 billion of total transport investment in the pipeline is going to go. We understand the difficulties in improving the data on regional allocations but recognise the big steps taken and the opportunities for further refinement in the next iteration.
IPPR North also commends the IPA for accepting the argument that it is important to disaggregate public spending by region, to do so on a per capita basis, and to analyse the forward-looking pipeline in this way. Previously these matters have been the subject of some dispute.
While we agree with the overall approach and a number of the assumptions made in this analysis, we disagree with others. This section considers each of the key methodological issues presented in the previous section.
3.1 ON THE TREATMENT OF ‘NATIONAL’ PROJECTS AND PROGRAMMESWe agree with the IPA that it is a good idea to attempt to allocate ‘national’ projects and programmes across different regions as far as this is possible. However, the manner in which this has been done in the current analysis could be improved:• where it is genuinely impossible to make regional allocations around a small
number of projects these should be excluded from the analysis altogether and not distributed on a per capita basis
• given that the IPA has undertaken this analysis, it should put the actual figures into the public domain as it does with the rest of the pipeline analysis, even where these are derived from separate Department for Transport sources.
3.2 ON HS2HS2 is the UK’s most high-value and transformative infrastructure project, therefore finding a way to include it in the analysis is especially important. However, the manner by which this has been done in the current analysis could be improved:• in any one presentation of the data there should be a consistent methodology.
The IPA analysis mixes two approaches. One which is based on the asset’s location (as is the case with Rail, Strategic Roads and Local Transport) and another on the basis of where the benefits of the scheme are most likely to fall (as is the case with the treatment of HS2). Any one presentation of the data should set out the figures for all projects either based on the location of the asset or based on where the benefits of the scheme are most likely to fall. Ideally the IPA should produce both different analyses for all projects

14 IPPR NORTH | Future Transport Investment in the North
• as with the national projects and programmes, given the IPA has undertaken this analysis, it should put the actual figures assigned to regions within the pipeline as with other projects.
3.3. ON THE TREATMENT OF SPENDING CATEGORIESIPPR North agrees with the IPA that exclusively private spending is outside of the government’s direct control and therefore excluded. That said, the government should be held to account when private investment in assets is lacking in the long term and so it is important that the government continues to feature them in the pipeline.
However, we disagree with the exclusion of the private spending that funds public/private projects from the IPA’s analysis. The IPA analysis only includes the central government funding component of all public/private projects. We disagree with this because public spending leverages in private spending, as is evident in the pipeline itself: the only project in the pipeline which is central government/private funded is the charging infrastructure investment fund (£400m total), and the only project which is local government/private is the Barking Riverside extension (£61 million total). Without public spending, much private spending wouldn’t happen, and the government should therefore be held accountable for it. The same logic clearly applies to central/local spending, but for reasons outlined below we think local spending should be included in its own right.
IPPR North also disputes the IPA methodology, which excludes local spending. We understand the persuasiveness of the argument that central government should only be held to account for projects under its direct control and that it can be difficult to analyse and account for local spending, but to suggest that local spending is somehow independent of central government decision making is inaccurate. The vast majority of local government funding comes directly from central government at the discretion of the Secretary of State. Even taxation for which local government is nominally responsible is controlled by central government, especially in the case of business rates: the national audit office and the OBR consider business rates to be a central government tax, and as Mirrlees et al (2011) state: ‘Although locally administered, it is a national tax, with the rate set centrally and all receipts flowing into national coffers’ (NAO 2015, OBR 2016).
3.4. ON THE TREATMENT OF TFL EXPENDITUREThe decision to exclude local spending is all the more significant given the huge amount of expenditure undertaken by TfL. Until recent years this spending had been funded by a grant provided by central government. But this has recently been switched for a different arrangement. London benefits from retained business rates in a similar way that it used to from direct grant funding. Now, instead of London giving business rates to government in return for a grant, it just keeps the rates that it raises.9 This has been expressed explicitly in a letter from the Transport Secretary to the Mayor of London:
‘the Department for Transport would no longer pay any investment grant to the GLA from April 2017. Instead, the GLA will receive an equivalent amount through retention of a larger proportion of London’s business rates’ (Grayling 2017)
So while it is technically true that central government doesn’t directly fund local spending in London, it effectively does so by allowing London to retain business
9 All local authorities now retain 50 per cent of locally-raised business rates, but London (and some other areas) retains 100 per cent
A briefing on the government’s new regional analysis of the National Infrastructure and Construction Pipeline 15
rates and thus foregoing revenue it would otherwise have to spend elsewhere in the country.
Most significantly, London is set to gain year-on-year from this arrangement. The objective of business rate retention is to ‘reward growth’. A similar arrangement is being piloted in Greater Manchester and Liverpool City Region. London is expected to gain significantly from this arrangement – the latest estimate is that London will benefit by around £240 million in 2018/19 (TfL 2017). To be clear, by circumventing the normal arrangements for business rate redistribution, this is £240 million additional public money that will be spent in London, that would have otherwise been redistributed centrally and spent across the country.
Therefore London benefits from central government policy in three ways:• by keeping its own business rates it no longer has to share the proceeds of its
growth with the rest of the country• over time, it is likely to grow its business rates base at a faster rate than
anywhere else thereby giving itself even more money for transport investment and widening the differential
• furthermore, the arrangement that TfL has regarding fare revenues means that it is uniquely able to gather funding in a way that no other local or regional transport authority can and then it can borrow based on this revenue and its other funding streams to fund capital investment.
The narrative that London’s transport investment is being paid for directly by London’s businesses and fare-payers is a compelling one, but it denies the truth that this comes about due to a unique arrangement engineered with central government, which could not be afforded to the rest of the country and which means there is less money in the pot to be spent on transport projects elsewhere.
3.5 ON ONLY INCLUDING SPENDING TO 2020/21IPPR North disagrees with the IPA’s decision to exclude all spending in the pipeline which extends beyond 2020/21. Because of the way government sets out its spending plans only a proportion of spending beyond 2020/21 will be available. But it should be included for a number of reasons:• most importantly, infrastructure planning is by its nature a long-term
endeavour, and one of the primary purposes of the pipeline is to give investors and other stakeholders clear sight of the government’s medium to long-term plans. The financial year 2020/21 is just over two years away
• long-term projects like HS2 are the most important and high-value investments, but the majority of HS2 spending is excluded by this approach, and when Crossrail 2 and Northern Powerhouse Rail are brought forward these will be mostly excluded too
• if the policy of only including projects in the current spending round is to be adopted, then as the next spending round approaches the regional analysis of the pipeline will become increasingly useless, until the 2020 edition of the publication when there would be no analysis to conduct
• what is particularly significant though about the IPA’s decision is that as things stand, a significant proportion of the spending in the pipeline after 2020/21 is dedicated to projects which are in or will benefit London (£19.8 billion). And this is before Crossrail 2 capital spend is included in the pipeline.

16 IPPR NORTH | Future Transport Investment in the North
4. NEW IPPR NORTH REGIONAL ANALYSIS
Based on the new data available through the latest pipeline and our consideration of the methodological assumptions made by the IPA in the previous section, we have carried out a new analysis of the regional breakdown of spending.
To be completely transparent about our assumptions, they are as follows: • including the regional allocations of national programmes, but we have not
been able to do this after 2020/21 because the data has not been published• including HS2 – before 2020/21 in line with the IPA analysis and after 2020/21
making the same assumptions, noting that this is imperfect• including all public and public/private spending, and spending from central and
local governments and all combinations of these where possible. Exclusively private spending is excluded with good reason (as outlined above), however we have had to exclude the private and local government spending that is invested jointly with central government, because the IPA have not provided the figures necessary to do so. However, we have been able to include all regionally allocated central/local and central private spend from 2021/22, and all local and local/private spending. There is only £400 million central/private spending, the central component of which is included pre 2020/21)
• including spending beyond 2020/21 where possible – although as noted non-HS2 national projects/programmes beyond 2020/21 cannot be included due to data availability.
Table 4.1 sets out a comparison of IPA assumptions alongside IPPR North assumptions.
TABLE 4.1Comparison of IPA assumptions alongside IPPR North assumptions
Assumption IPA analysis IPPR North analysis
National projects and programmes allocated according to region
Included – though detailed data unavailable to consider
Included – following IPA methodology as far as possible
HS2 allocated by region according to predicted regional benefits
Included – though this methodology varies from other national projects
Included – following IPA methodology despite concerns about consistency of approach
Categories of spending Only 'central' and central component of 'central/private', 'central local'
and 'central/local/private' spending category included
Includes 'central', 'central/private', 'central/local', 'central local/local/
private' and 'local/private'
Consideration of GLA/TfL spending Excluded on the grounds funding comes from Business Rates and Fare
Revenues
Included on the grounds that central government remains responsible
for the agreements which underpin these revenue streams
Timeframe considered Only considers spending up to and including 2020/21
Includes the whole pipeline on the grounds that this is what the
pipeline is intended for
Source: IPPR/Author's own analysis
A briefing on the government’s new regional analysis of the National Infrastructure and Construction Pipeline 17
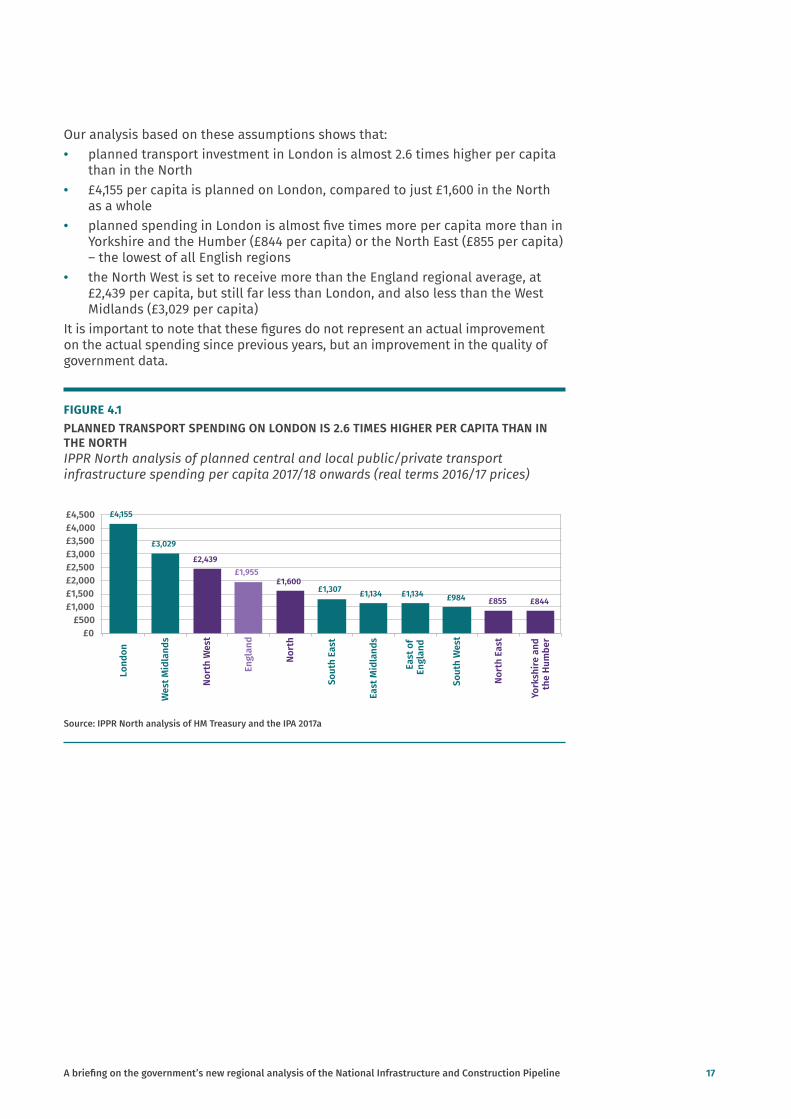
Our analysis based on these assumptions shows that: • planned transport investment in London is almost 2.6 times higher per capita
than in the North• £4,155 per capita is planned on London, compared to just £1,600 in the North
as a whole• planned spending in London is almost five times more per capita more than in
Yorkshire and the Humber (£844 per capita) or the North East (£855 per capita) – the lowest of all English regions
• the North West is set to receive more than the England regional average, at £2,439 per capita, but still far less than London, and also less than the West Midlands (£3,029 per capita)
It is important to note that these figures do not represent an actual improvement on the actual spending since previous years, but an improvement in the quality of government data.
FIGURE 4.1PLANNED TRANSPORT SPENDING ON LONDON IS 2.6 TIMES HIGHER PER CAPITA THAN IN THE NORTHIPPR North analysis of planned central and local public/private transport infrastructure spending per capita 2017/18 onwards (real terms 2016/17 prices)
£4,155
£3,029
£2,439 £1,955
£1,600 £1,307 £1,134 £1,134 £984 £855 £844
£0 £500
£1,000 £1,500 £2,000 £2,500 £3,000 £3,500 £4,000 £4,500
Lond
on
Wes
t Mid
land
s
Nort
h W
est
Engl
and
Nort
h
Sout
h Ea
st
East
Mid
land
s
East
of
Engl
and
Sout
h W
est
Nort
h Ea
st
York
shire
and
the
Hum
ber
Source: IPPR North analysis of HM Treasury and the IPA 2017a
18 IPPR NORTH | Future Transport Investment in the North
CONCLUSIONS
The IPA’s regional analysis of transport infrastructure spending is a welcome addition to the national infrastructure and construction pipeline. We commend the IPA for undertaking this task and for accepting the legitimacy of per capita analyses of planned transport spending.
We agree with some of the assumptions made by the IPA but others are not justified when assessing the spending for which central government should be held to account. The IPA’s analysis is a presentation of central government funding alone. It isn’t inaccurate but it is misleading. There is no reason to exclude spending beyond 2021, private spending when it has been enabled by central government, or local spending (especially when this has been enabled by central government). By making these exclusions the IPA has disregarded vast amounts of spending in London, which have led to a supposed even distribution of transport spending.
IPPR North include in our analysis all of the spending for which central government could be reasonably held to account and we have been transparent about these assumptions in this briefing.
Using the updates data but with our own assumptions, we conclude that central government is responsible for transport spending in London which is 2.6 times higher than the North on a per capita basis and twice as high as the national average. We acknowledge that this analysis is still incomplete but it is a further improvement on the IPA’s efforts and, in our opinion, a more accurate reflection of future transport spending plans.
In order to improve the quality of the data further and the IPA should now:• publish all the data that underpin the assumptions they have made, especially
the breakdown between central government and local or private funding in each project, and the allocation of each individual programme or project to regions
• present analyses of the pipeline on a consistent basis: HS2 is currently an anomaly in that it is allocated according to where economic benefit is likely to accrue, rather than where the assets will be located
• exclude from consideration all projects which cannot be reasonably allocated to regions, rather than allocating them on a ‘flat’ per capita basis
• include local government spending in all its forms within the analysis, and seek to gather data from non-London local authorities where possible
• conduct and publish a regional analysis of nation-wide projects and programmes for 2021 and beyond.
A briefing on the government’s new regional analysis of the National Infrastructure and Construction Pipeline 19
REFERENCES
Blakeley G (2017) Paying for our progress: How will the northern powerhouse be financed and funded? IPPR North. http://www.ippr.org/publications/paying-for-our-progress
Cox E and Raikes L (2015) Transport for the North: A blueprint for devolving and integrating transport powers in England, IPPR North. http://www.ippr.org/publications/transport-for-the-north-a-blueprintfor-devolving-and-integrating-transport-powers-in-england
Grayling (2017) ‘Transport for London funding agreement’, letter to the Mayor of London. http://content.tfl.gov.uk/tfl-funding-agreement-letter-march-2017.pdf
HM Treasury (2017) ‘Country and regional analysis 2017: interactive tables in Excel format’, data. https://www.gov.uk/government/statistics/country-and-regional-analysis-2017
HM Treasury and the Infrastructure and Projects Authority [IPA] (2017a) ‘National Infrastructure and Construction Pipeline Autumn 2017’, data. https://www.gov.uk/government/publications/national-infrastructure-and-construction-pipeline-2017
HM Treasury and the Infrastructure and Projects Authority [IPA] (2017b) Analysis of National Infrastructure and Construction Pipeline 2017. https://www.gov.uk/government/publications/national-infrastructure-and-construction-pipeline-2017
HS2 Ltd (2013) The economic case for HS2. http://assets.hs2.org.uk/sites/default/files/inserts/S per cent26A per cent201_Economic per cent20case_0.pdf
Laird J and Mackie P (2010) Review of methodologies to assess transport’s impacts on the size of the economy, The northern way. http://www. northernwaytransportcompact.com/downloads/Evidence per cent20Base/Transport per cent20& per cent20the per cent20Economy/Review_of_Methodologies_to_Assess_Transports_Impacts_on_the_Size_of_the_Economy.pdf
Mirrlees J, Adam S, Besley T, Blundell R, Bond S, Chote R, Gammie M, Johnson P, Myles G and Poterba JM (2011) Tax by design, IFS. https://www.ifs.org.uk/publications/5353
National Audit Office [NAO] (2017) Planning for 100 per cent local retention of business rates, Report by the Comptroller and Auditor General. https://www.nao.org.uk/wp-content/uploads/2017/03/Planning-for-100-local-retention-of-local-business-rates.pdf
Office for Budget Responsibility [OBR] (2016) Economic and fiscal outlook – March 2016. http://obr.uk/box/local-authorities-retention-of-business-rates/
Transport for London [TfL] (2017) London to retain more business rates income in landmark deal. https://www.london.gov.uk/press-releases/mayoral/ london-to-retain-more-business-rates-income
What Works Centre for Local Economic Growth [WWCLEG] (2015) Evidence review 7: Transport. http://www.whatworksgrowth.org/policy-reviews/transport/

Institute for Public Policy Research

The progressive policy think tank
GET IN TOUCHFor more information about IPPR North, please go to www.ippr.org/north
You can also call us on +44 (0)161 694 9680, e-mail [email protected] or tweet us @ipprnorth
Institute for Public Policy ResearchRegistered Charity no. 800065 (England & Wales), SC046557 (Scotland), Company no, 2292601 (England & Wales)