future landscapes the effects of changing demographics
TRANSCRIPT
FUTURE LANDSCAPES
The effects of changing demographics

Background

Our region is changing
• Demographic facts:
– Rapid growth of the older population
– Increasing immigration
• Flexible, creative policies are the response to this increasing diversity
– “Change is the only constant”
• Maintaining an innovative, competitive workforce will be the key to a thriving, prosperous region

Are you a baby boomer?

Baby boomer quiz: True or false?
1. The majority of boomers plan to work in some capacity during their retirement years
2. The top two boomer concerns about retirement are “being lonely” and “not being able to drive”

15% 10% 5% 0% 5% 10% 15%
0-4 yrs
5-9
10-14
15-19
20-24
25-29
30-34
35-39
40-44
45-49
50-54
55-59
60-64
65-69
70-74
75-79
80-84
85+ yrs
>
1980
15% 10% 5% 0% 5% 10% 15%
0-4 yrs
5-9
10-14
15-19
20-24
25-29
30-34
35-39
40-44
45-49
50-54
55-59
60-64
65-69
70-74
75-79
80-84
85+ yrs
1960
>
15% 10% 5% 0% 5% 10% 15%
0-4 yrs
5-9
10-14
15-19
20-24
25-29
30-34
35-39
40-44
45-49
50-54
55-59
60-64
65-69
70-74
75-79
80-84
85+ yrs
>
1970
15% 10% 5% 0% 5% 10% 15%
0-4 yrs
5-9
10-14
15-19
20-24
25-29
30-34
35-39
40-44
45-49
50-54
55-59
60-64
65-69
70-74
75-79
80-84
85+ yrs
15% 10% 5% 0% 5% 10% 15%
0-4 yrs
5-9
10-14
15-19
20-24
25-29
30-34
35-39
40-44
45-49
50-54
55-59
60-64
65-69
70-74
75-79
80-84
85+ yrs
>
1990
15% 10% 5% 0% 5% 10% 15%
0-4 yrs
5-9
10-14
15-19
20-24
25-29
30-34
35-39
40-44
45-49
50-54
55-59
60-64
65-69
70-74
75-79
80-84
85+ yrs
>
2000
15% 10% 5% 0% 5% 10% 15%
0-4 yrs
5-9
10-14
15-19
20-24
25-29
30-34
35-39
40-44
45-49
50-54
55-59
60-64
65-69
70-74
75-79
80-84
85+ yrs
>
2010
15% 10% 5% 0% 5% 10% 15%
0-4 yrs
5-9
10-14
15-19
20-24
25-29
30-34
35-39
40-44
45-49
50-54
55-59
60-64
65-69
70-74
75-79
80-84
85+ yrs
>
2020
15% 10% 5% 0% 5% 10% 15%
0-4 yrs
5-9
10-14
15-19
20-24
25-29
30-34
35-39
40-44
45-49
50-54
55-59
60-64
65-69
70-74
75-79
80-84
85+ yrs
>
2030
15% 10% 5% 0% 5% 10% 15%
0-4 yrs
5-9
10-14
15-19
20-24
25-29
30-34
35-39
40-44
45-49
50-54
55-59
60-64
65-69
70-74
75-79
80-84
85+ yrs
20401950
Aging of the U.S. baby boomer generation
>
Source: US Census Bureau

Source: US Census Bureau
Growth of the “very old” (85+) population is particularly dramatic
1950
2000
2040
0.4%
1.5%
3.9%

Local growth of the age 60+ population 2004 - 2009
Douglas County
60%
Arapahoe County26%
Adams County19%Jefferson
County18%
BoulderCounty
24%
Clear CreekCounty
40%
GilpinCounty
46%
Denver10%
Broomfield41%

Most boomers say they want to “age in community” . . .
but communities are not generally set up for successful aging

Even today, we are not meeting the needs of our region’s seniors
25%
24%
20%
11%
6%
45%Health problems
Financial problems
Depression
Difficulty performing everyday activities:walking, bathing, etc.
Inadequate transportation
Not enough food
Percent of the older population facing problems

A huge gap exists between needs and funding for aging services
$72
$95
$158
$55
$0
$30
$60
$90
$120
$150
$180
2004 2008 2012 2020
Current and projected costs to meet identified needs
($ millions)
2006 funding level: $8 million
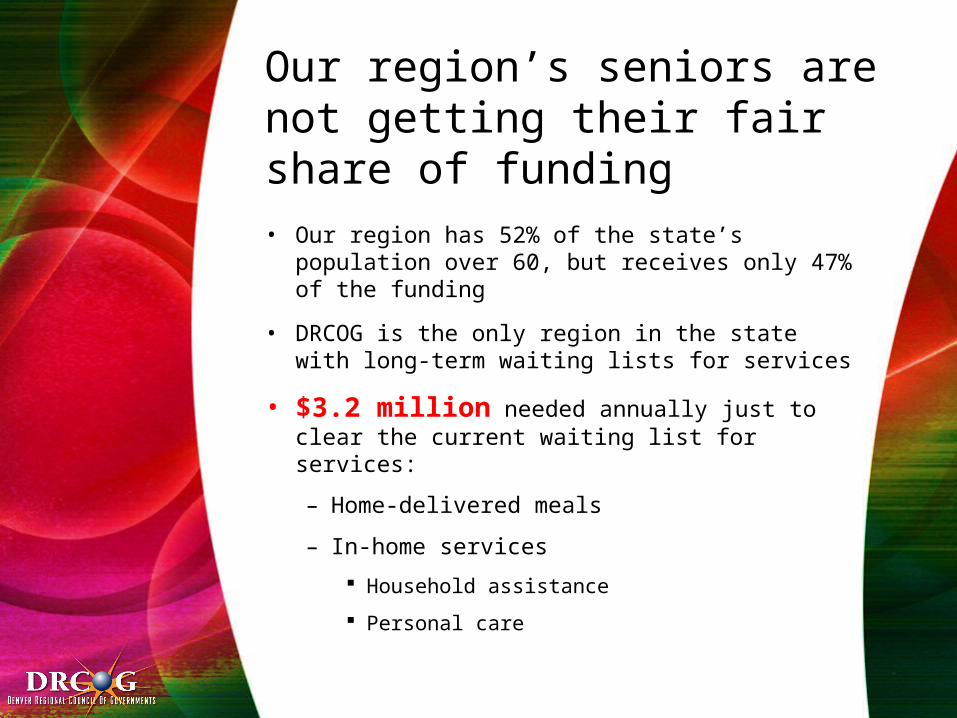
Our region’s seniors are not getting their fair share of funding • Our region has 52% of the state’s population
over 60, but receives only 47% of the funding
• DRCOG is the only region in the state with long-term waiting lists for services
• $3.2 million needed annually just to clear the current waiting list for services:
– Home-delivered meals
– In-home services
Household assistance
Personal care

As the U.S.-born population ages, immigration brings new families with new needs

U.S. foreign-born population • Increasing since 1970s
– Back to levels typical of early 20th century
• Substantially different– Past migrants – Europe– Today’s migrants – Latin America, Asia
• More diverse ethnically, racially, culturally, linguistically
• As boomers retire, immigrants will account for increasing share of the workforce

Most of our region’s immigrants are from Latin America
3.5%
3.7%5.5%
12.8%
87.2%
51.7%
35.7%
Latin America
Mexico
Other countries
Other Latin American countries
GermanyVietnam
Canada
Percent of the Denver region’s immigrant population by place of birth

Net population change in Denver metro area by race and Hispanic or Latino origin,
2000-2005
Race and Hispanic or Latino2005
Population
Net Gain
2000-2005Percent Change
Total 2,729,358 147,852 5.7%
White 2,225,673 145,953 7.0%
Black or African American 126,040 6,211 5.2%
American Indian or Alaska Native 21,543 -1,357 -5.9%
Asian 88,808 15,413 21.0%
Native Hawaiian and other Pacific Islander
1,389 -1,106 -44.3%
Some Other Race 196,893 -11,466 -5.5%
Hispanic or Latino (of any race) 595,781 119,154 25.0%

Persons living below the poverty line
10%
35%
Total population Latin-Americanimmigrants
Latin-American immigrants are more likely to live in poverty and suffer from disabilities
Persons with disabilitiies
16%
25%
Total population Latin Americanimmigrants
Source: US Census Bureau
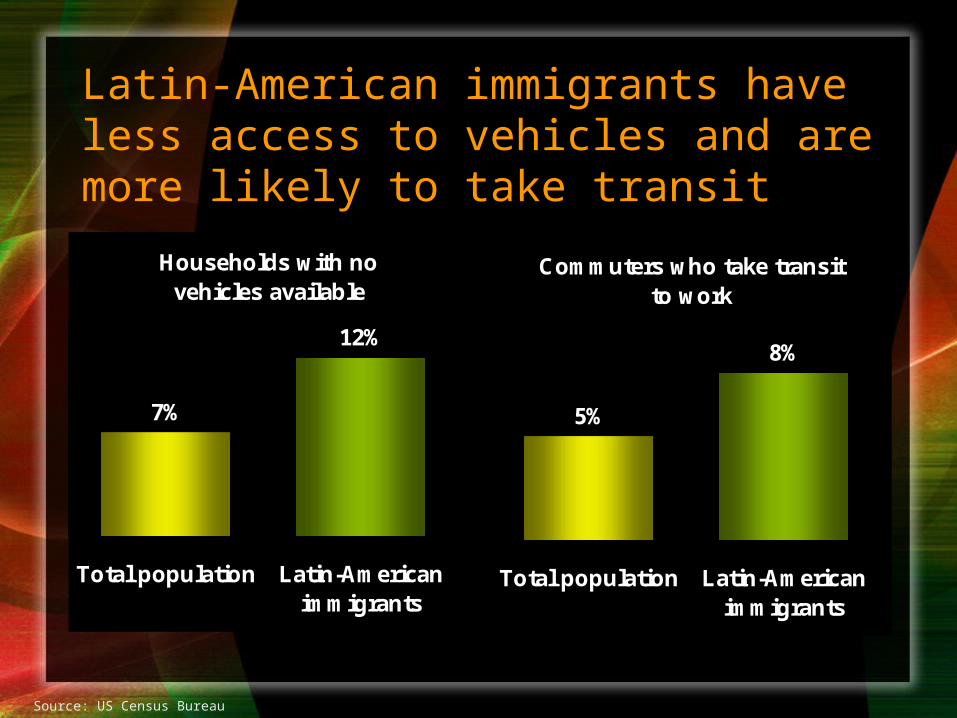
Households with no vehicles available
7%
12%
Total population Latin-Americanimmigrants
Latin-American immigrants have less access to vehicles and are more likely to take transit
Commuters who take transit to work
5%
8%
Total population Latin-Americanimmigrants
Source: US Census Bureau

Adults (25+) with at least some college education
50%
14%
Total population Latin-Americanimmigrants
Latin-American immigrants are less likely to attend college or speak English fluently
Persons who speak English "very well"
92%
28%
Total population Latin-Americanimmigrants
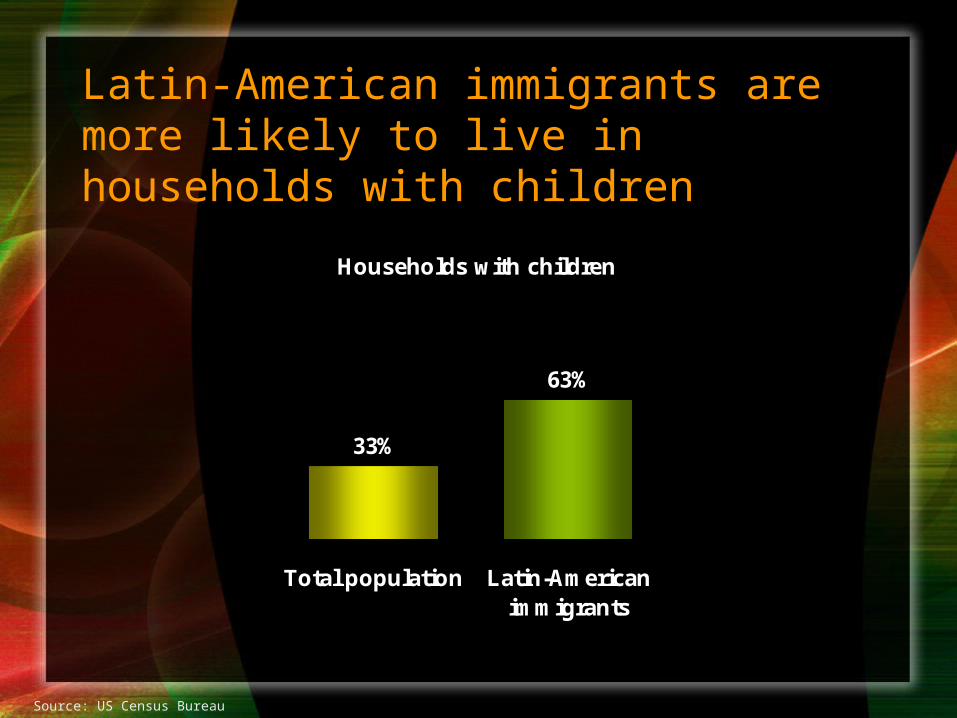
Latin-American immigrants are more likely to live in households with children
Households with children
33%
63%
Total population Latin-Americanimmigrants
Source: US Census Bureau

Households that rent
34%
53%
Total population Latin-Americanimmigrants
Latin-American immigrants are more likely to rent homes and live in multifamily housing
Households that live in multifamily housing
29%
44%
Total population Latin Americanimmigrants
Source: US Census Bureau

Average number of people per household
2.51
4.35
Total population Latin-Americanimmigrants
Latin-American immigrants tend to live in larger households
Source: US Census Bureau

Policy implications

Flexible, creative public policy
• Policies supporting a diversity of options– Housing– Transportation– Human services
• Policies that support a united regional economy– Globally competitive

Diverse housing options
• “Livable Communities”– Affordable– Multifamily– Assisted-living senior housing– Family-friendly housing– Located near transit
Communities that enable all to be active, independent, productive members of society

Diverse transportation options
• Transit• Specialized transportation for
elderly, people with disabilities• Pedestrian and bicycle facilities• Safe lighting, street design• Connectivity
Diverse human services
• Senior centers• Workforce training• Day care• Bi-lingual education• Dispersed into immigrant
neighborhoods and accessible by transit

Maintaining a competitive workforce
• Able to retain the knowledge of the boomer generation
• Able to compete for skilled labor in a shrinking pool– “Place” matters
• Able to support local businesses to be competitive in a global marketplace

Maintaining a competitive region
• Able to retain our region’s unique sense of “place” and quality of life – Key to attracting/retaining skilled
workers

Action items
Early action items
• Advocate at federal, state and local levels for needed resources– Meet with representatives– Testify at hearings– Meet with editorial boards, other
members of the press

Early action items
• Complete and disseminate livable communities development guidelines– Strengthen Metro Vision policies– Help local governments incorporate
into comprehensive plans
Early action items
• Adopt and distribute findings of DRCOG’s EPA-funded smart growth and aging study– Barriers to senior-friendly
development– Case studies senior-friendly land-
use codes
• Seek funding for similar study of immigrant needs

Early action items
• Formulate a comprehensive outreach program
– Raise awareness of demographic changes and implications
– Work with other non-profits to engage seniors and immigrant community in Metro Vision process

Longer-term efforts
• Work to secure long-term funding for aging services commensurate with needs
• Track and highlight best practices within and outside the region
• Research issues related to attracting and developing a competitive workforce