future energy needs and engineering reality michael 10943.pdf · future energy needs and...
TRANSCRIPT

Department of Engineering
Future Energy Needs and
Engineering Reality
Michael J Kelly
Electrical Engineering Division, Department of Engineering
Electrical Engineering Division, Department of Engineering, University of Cambridge
9 JJ Thomson Avenue, Cambridge CB3 0FA, UK
(Contact: [email protected] )
2nd Int. Symp. on Energy Challenges, Aberdeen, 25 Sept 2104
Kensington Town Hall 08 October 2014
CAPE, Engineering, Cambridge. 03 Dec, 2014
Victoria University of Wellington 31 March 2015
IPENZ at Auckland University 9 April 2015
University of Bergen, 5 May 2015
1
© 2010 U. of Cambridge
Department of Engineering
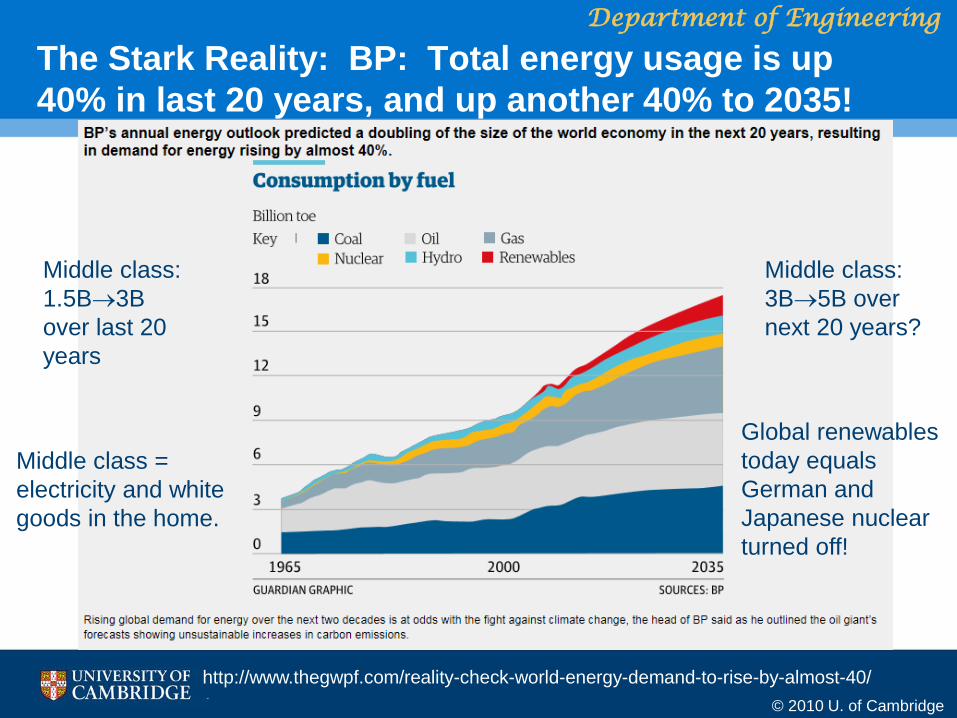
The Stark Reality: BP: Total energy usage is up
40% in last 20 years, and up another 40% to 2035!
http://www.thegwpf.com/reality-check-world-energy-demand-to-rise-by-almost-40/
Middle class:
1.5B3B
over last 20
years
Middle class:
3B5B over
next 20 years?
Global renewables
today equals
German and
Japanese nuclear
turned off!
Middle class =
electricity and white
goods in the home.
© 2010 U. of Cambridge
Department of Engineering
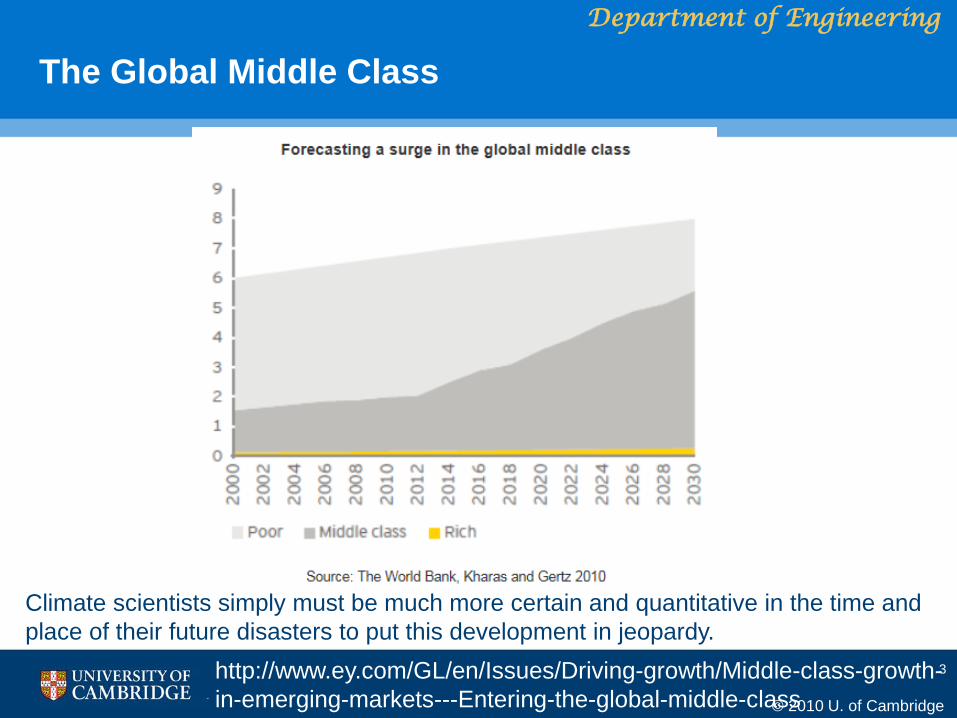
The Global Middle Class
3 http://www.ey.com/GL/en/Issues/Driving-growth/Middle-class-growth-
in-emerging-markets---Entering-the-global-middle-class
Climate scientists simply must be much more certain and quantitative in the time and
place of their future disasters to put this development in jeopardy.

© 2010 U. of Cambridge
Department of Engineering
Context
4
The climate science community has convinced many
policymakers and politicians of the need to decarbonise the world
economy in short order. Their case, and whether it is credible or
not, is not the issue in this presentation, but rather some of the
lessons of the recent history of technology evolution that should
not be lost in the rush.
There are rules concerning the introduction of new technologies,
and there are penalties for flouting them. If we are setting out to
decarbonise the world economy, we should set out as if we mean
to succeed, and not, as now, take actions that will certainly not
succeed.

© 2010 U. of Cambridge
Department of Engineering
Contents
• Context and History
• Ten lessons, backed up with hard, real-world data, not model predictions!
• Three concrete suggestions
• Summary conclusions
• Back-up material
Notes
1: I take climate science at the IPCC face value at first but do come back at it.
2: Lack of engineering reality tests cripple most suggested decarbonisations.
3: Nothing here detracts from need to reduce human profligacy
5

© 2010 U. of Cambridge
Department of Engineering
Context and History: Technology / Mankind / Earth
• Thomas Malthus FRS 1798: “The power of population is so superior to the
power in the earth to produce subsistence for man, that premature death
must in some shape or other visit the human race.”
• 1st Baron Macaulay FRS 1830: “On what principle is it that, when we look we
see nothing but improvement behind us, we are to expect nothing but
deterioration before us?”
• William Stanley Jevons FRS 1868: ‘The Coal Question’ Get off the industrial
revolution now as the collapse of society when coal is exhausted is too
terrible to contemplate.
• Club of Rome 1970: Multiple mineral exhaustion by 2000: only helium in fact
• James Hansen 1988: Continuing temperature rises from CO2 emissions.
• James Hansen 2012: World has used as little as 5% of fossil fuels so far.
6

© 2010 U. of Cambridge
Department of Engineering
Thermodynamics
Work, heat, electricity, hydro- fossil fuels, are all forms of energy
-----------------------------------------------
Three Laws of Thermodynamics:
Energy is conserved but downgraded in any process.
Processes go from more ordered to less ordered states unless there is a
large input of energy.
Cannot reach absolute zero of temperature.
--------------------------------------------------
No free lunch: thermodynamics the miserable part of physics!
7

© 2010 U. of Cambridge
Department of Engineering
An Informative Interlude
A seven slide interlude of a concrete case study by the Royal Academy of
Engineering in 2010. I was a co-author.
Title: Generating the Future
Thesis: Assume 2050 UK CO2 emissions targets have been met under one
of several high-level scenarios – the simplest being no change on energy
consumption from 2010, the harshest being a 40% reduction in total energy
usage in 2050.
Content: What does the energy budget of the UK look like, what is the
capacity of the grid, and what does the journey to those end-points look
like?
Results: Follow them!
8
© 2010 U. of Cambridge
Department of Engineering
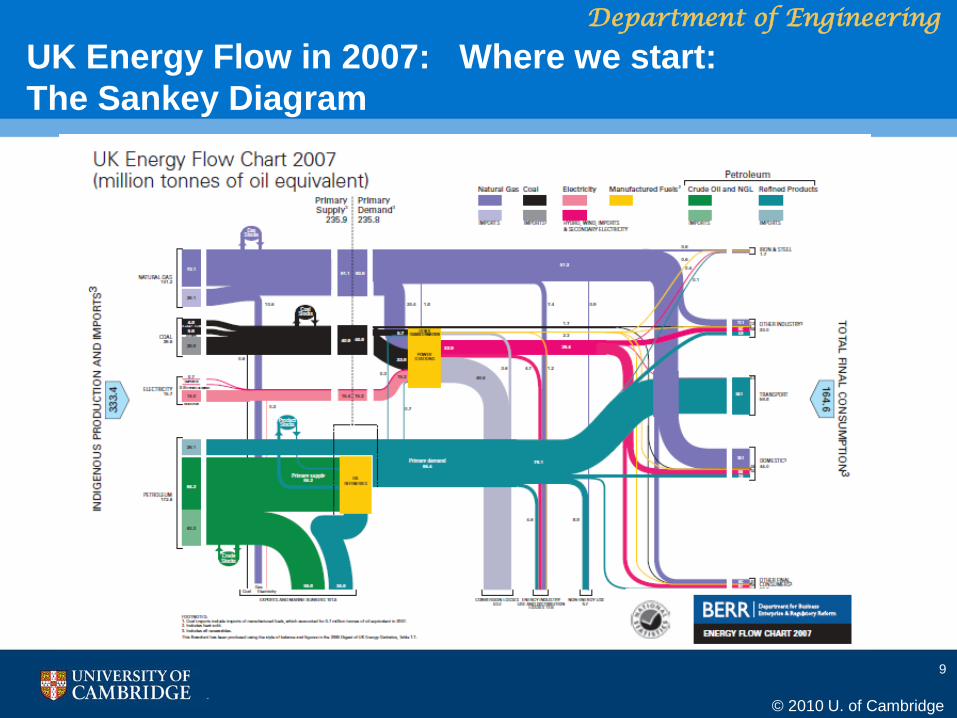
UK Energy Flow in 2007: Where we start:
The Sankey Diagram
9

© 2010 U. of Cambridge
Department of Engineering
Today’s Simplified Energy Flows (2008)
Royal Academy of Engineering 2010 “Generating the Future”
Coal
Oil Petroleum
Gas

© 2010 U. of Cambridge
Department of Engineering
2050 with Level Demand
Royal Academy of Engineering 2010 “Generating the Future
© 2010 U. of Cambridge
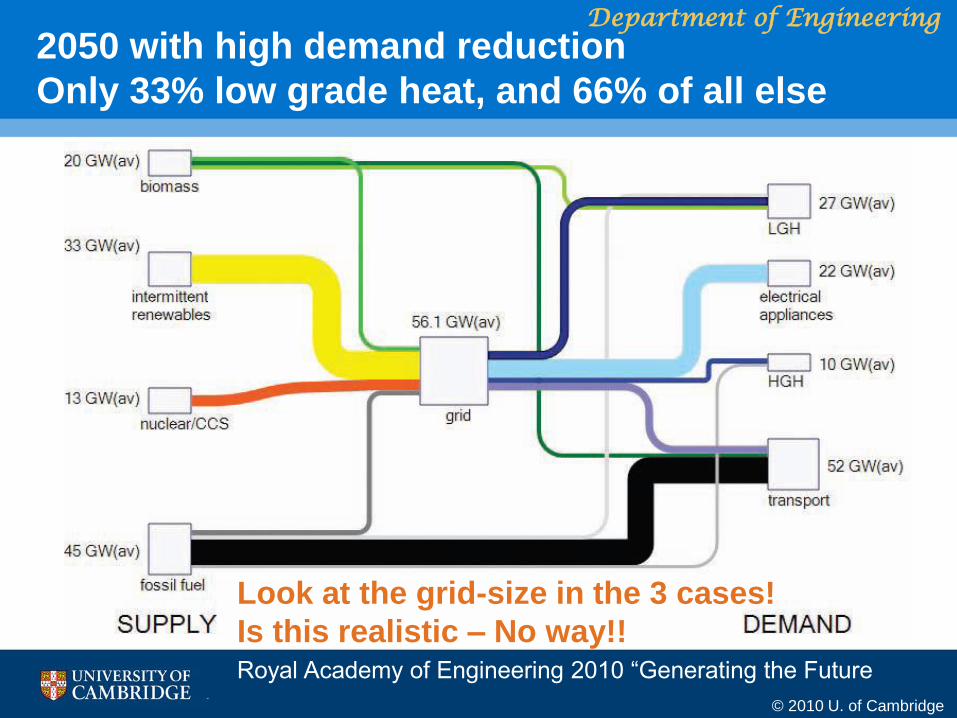
Department of Engineering 2050 with high demand reduction
Only 33% low grade heat, and 66% of all else
Look at the grid-size in the 3 cases!
Is this realistic – No way!! Royal Academy of Engineering 2010 “Generating the Future

© 2010 U. of Cambridge
Department of Engineering
Five Main Messages for Royal Academy of Engineering
• There is no single ‘silver bullet’ that will achieve the
required cuts in emissions.
• Demand reduction across all sectors of the economy will be
essential.
• The full suite of low-carbon energy supply technologies will
be needed.
• Simple starting assumption leads to quite different grid size.
• The scale of the engineering challenge is massive and
unprecedented in peacetime.

© 2010 U. of Cambridge
Department of Engineering
RAEng Conclusion
The experience of engineers shows that
implementing fundamental changes to a system as
large and complex as the UK’s energy system to
meet the 2050 greenhouse gas emissions targets
will bring with it many challenges for government,
business and industry, engineering and the public
alike. Turning the theoretical emissions reduction
targets into reality will require more than political will:
it will require nothing short of the biggest peacetime
programme of change ever seen in the UK.

© 2010 U. of Cambridge
Department of Engineering
Ten Lessons from Recent History of Technology
15
1. Successful new technologies improve the lot of mankind
2. The scale of the decarbonisation problem is unprecedented
3. Tackle megacities first
4. Only deploy new energy technologies when they are mature and economic
5. Salutary lessons from the first round of renewables technologies
6. Subsidies for premature rollout are a recipe for disaster
7. Technology developments are not usually pre-programmable
8. Nothing will happen if the population is not trusting
9. Finance is limited, so actions at scale must be prioritised
10. If the climate imperative weakens, so does the decarbonisation imperative

© 2010 U. of Cambridge
Department of Engineering
1. Successful new technologies improve the lot of mankind
• Watt’s steam engine – aided agricultural productivity – stopped windmills
• Electricity from steam turbines - lightened the dark, increased productivity
• Jet engines – reduced distance
• Semiconductor technologies – eliminated distance
• Genetic engineering – green revolution – accelerated plant breeding
• Antibiotics – reduced level of infection, but, …
• Smart phone – shrinkage of 20 bulky items of only 20 years ago
• Integrated sensor networks – basis of the future city
• How will decarbonisation improve the lot of mankind?
16

© 2010 U. of Cambridge
Department of Engineering Dematerialisation: more for less
This is mainstream business
getting more sustainable!

© 2010 U. of Cambridge
Department of Engineering
2. The scale of the decarbonisation problem is unprecedented
• 90% of energy used in the world since 1800 is fossil fuel based.
• Today biomass, hydro-, geothermal and nuclear produce 15% of energy
• First generation renewables produce less than 1% of world energy
• [About the capacity of the nuclear energy turned off in Japan/Germany!]
• I assert: decarbonising by 80% by 2050 is impossible without mass deaths
• UK scale: reduce emissions by 23% by retrofitting all buildings at a cost of
£1.7T, with a workforce of over 1M over 40 years. Who pays?
• Chinese emissions have grown each year over last 10 years by an amount
equal to the whole of UK emissions. [Every seven weeks for NZ emissions!!!]
• How would £10T spent over a decade on CO2 emission reduction actually
affect future climates and ‘solve the climate change problem’? No-one knows.
18

© 2010 U. of Cambridge
Department of Engineering
Insert on scale of 21st century western energy use.
We use six-seven times as much energy per person per day as a European
in 1800. Take that 1800 daily consumption as a unit.
Used then for heating and lighting and cooking in one room in home, and
the production and use of local foods and goods.
In the UK we use one unit on personal mobility (private motoring)
We use one unit on air and public ground transport
We use three units on the manufacture and logistics of stuff and food.
We still use the same unit on a fraction of our domestic heating, locally
sourced food and goods.
19

© 2010 U. of Cambridge
Department of Engineering Retrofit
UK by
2035:
20

© 2010 U. of Cambridge
Department of Engineering
World Oil Production
http://www.thegwpf.com/peak-oil-no-and-maybe-never/
Fixed at 13% since 1990:
Fossil fuels grow 7 times faster than non-carbon fuels!

© 2010 U. of Cambridge
Department of Engineering
3. Tackle megacities first
• >50% of 9B world population in 2050 will live in cities/megacities.
• All 4000km2 of Fenland diverted from food to miscanthus grass
would produce 1.3GW, the same as <0.1km2 nuclear Sizewell B
• Wind, solar and biomass within a factor of 30 in energy capture
• Fossil fuel energy density million times denser than gravity fuels
and a million times less energy dense than nuclear fuel.
• Shanghai: 22M and 6000km2 needs X4 area for wind, solar and
biofuels for electricity, and X40 area for renewables for all
energy, but that land feeds Shanghai!
• The challenge is to power Hong Kong, Singapore, in 2050
• Only nuclear and fossil fuels will actually energise 2050
megacities. A science breakthrough tomorrow is too late.
• CCS: Only 20MtCO2 sequestered out of 51000MtCO2 produced
yearly. Unproven at scale.. 22

© 2010 U. of Cambridge
Department of Engineering
4. Only deploy new energy technologies when they are mature and
economic
• Japanese solar thermal panels
• Spanish solar: case study follows.
• Stranded assets = economic waste.
• Batteries not ready
• Abandoned wind and solar farms
• Modern ‘Towers of Babel’ in engineering terms!
23

© 2010 U. of Cambridge
Department of Engineering
Energy Return on Investment for Modern Living
24
Pedro A Prieto and
Charles A S Hall: ‘Spain’s
Photovoltaic Revolution:
The Energy Return on
Investment’, Springer
2013, p7
Activity Minimum EROI Needed from Sweet
Crude Oil
Arts and Other 14:1
Health Care 12:1
Education 9/10:1
Support Worker
Families
7/8:1
Grow Food 5:1
Transportation 3:1
Refine Oil 1.2:1
Extract Oil 1.1:1

© 2010 U. of Cambridge
Department of Engineering
Energy Return on Energy Invested: Spain 2006-9
• Add up all the costs needed to install and deliver electricity
– permissions, rent, roads, fences, surveillance and security, manufacture
of panels, logistics, installation, maintenance.
• Convert cost to energy using ratio of total Spanish energy/Spanish GDP to
get to energy in.
• Add up all the metered electricity at the grid entry point and extrapolate to 25
years to get energy out.
• Ratio = energy return on investment (EROI)
• Result: EROI for Spanish solar: 2.5:1 over the 25 year life of the panels,
i.e. the first ten years of energy generation is still paying back farm creation!
Contrast: six months payback for fossil fuel or nuclear energy for 40yr life!
25

© 2010 U. of Cambridge
Department of Engineering
Spain’s Photovoltaic Revolution: The Energy Return on Investment
• EROI for Spanish solar: 2.5:1 over the 25 year life of the panels
• Poor in energy and economics terms compared with fossil fuels.
• Nowhere near enough for civilized living unless supplemented by fossil fuels.
• Other analyses: more focussed on site, less inclusive of costs: 7-11:1
• 7-11 people needed here per MW installed; 2.7 in other energy sectors.
• 3 units of heat energy of coal gives 1 units of electricity now but 3 units of heat
to make solar gives 7.35 units of electricity over 25 years.
• Panel manufacture already only 30% of 25-year life-cycle costs
• Other costs all scale with the vast land areas covered.
• Solar has serious EROI constraints and materials constraints if scaled up.
26

© 2010 U. of Cambridge
Department of Engineering
Comparative EROI: The killer blow for renewables
http://theenergycollective.com/barrybrook/471651/catch-22-energy-storage
D. Weißbach, G.
Ruprechta, A. Huke, K.
Czerski, S. Gottlieb, and
A. Hussein, ‘Energy
intensities, EROIs (energy
returned on invested), and
energy payback times of
electricity generating
power plants’, Energy
2013; 52: 210-221.
© 2010 U. of Cambridge
Department of Engineering
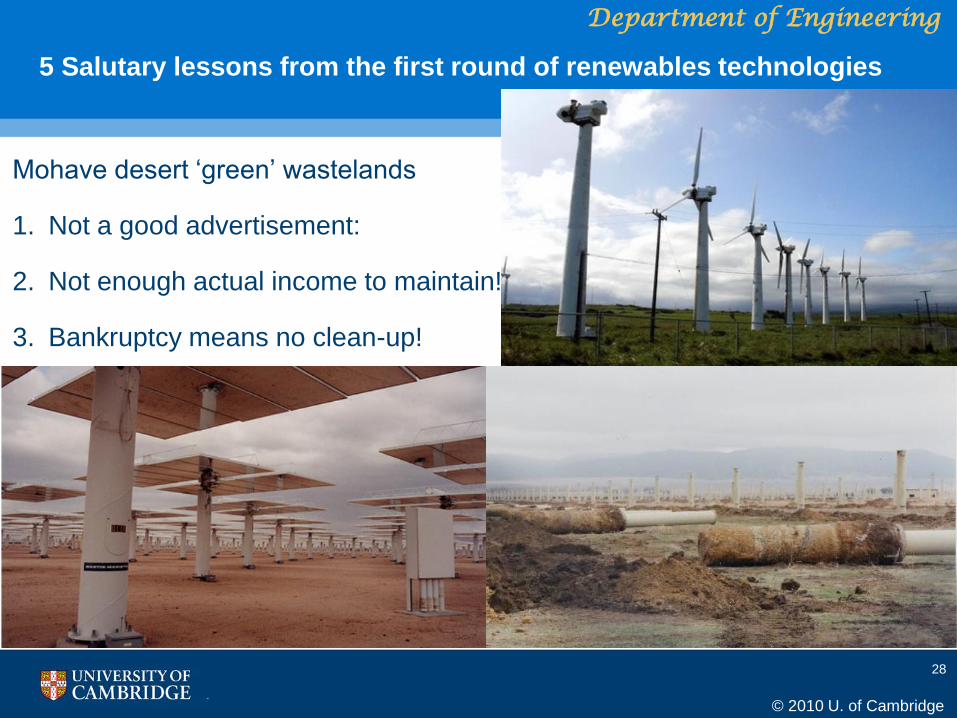
5 Salutary lessons from the first round of renewables technologies
Mohave desert ‘green’ wastelands
1. Not a good advertisement:
2. Not enough actual income to maintain!
3. Bankruptcy means no clean-up!
28

© 2010 U. of Cambridge
Department of Engineering
6 Subsidies for premature rollout are a recipe for disaster
Subsidies cut because of financial hardship leading to bankruptcies (2012)
• California and USA
• Spain
• China $8.2B
• Germany
• UK
• Government & private
investments hit: no place for pension funds!
• REMIXX: index of renewable stock prices: -80%
has crept up again to 500: still under water.
29
http://tomnelson.blogspot.co.nz/2012/10/the-green-jobs-debacle.html
© 2010 U. of Cambridge
Department of Engineering
7 Technology developments are not usually pre-programmable
• Why did we not get steam power 100 years earlier than we did?
• Why can’t we have nuclear fusion tomorrow?
• 40 years is a typical lead timeline for a new infrastructure technology
• Remember it is 40 years since the first oil shocks which started the
renewables and still <1% of world energy, and less than 40 years to 2050!
• Sequestration unproven at scale for economics and safety: only about 20
Mt CO2/yr sequestered out of a global total of 50,600 Mt CO2/yr.
• What will we have in 2050 at the scale needed to energise the world?
• Only nuclear and fossils fuels will power the world in 2050, and even if
there was a scientific breakthrough tomorrow, it takes 40 years to develop
and deploy. Don’t count of am imminent breakthough!
• Only nuclear fission and solar photovoltaics are new since Biblical times!
30

© 2010 U. of Cambridge
Department of Engineering
8. Nothing will happen if the population is not trusting
Reports from the front line of intervention:
• Saving the planet and reducing energy bills were not enough of a spur
• Cambridge take up of free loft insulation less than 5%
• Don’t trust men in white vans:
• Hassle factor of clearing loft
• No 25 year guarantee against any unintended consequences
• Village near Cambridge: £10M secured to improve insulation:
• Mailshot: 2 replies from 600 homes
• Door-to-door: up to 19 expressed some interest: others a firm no!
31

© 2010 U. of Cambridge
Department of Engineering
9 Finance is limited, so actions at scale must be prioritised
• Who pays? Taxpayer or consumer – there is no-one else!
• £200B over next decade for UK energy infrastructure renewal
• raised on the international money market in competition
• creditworthiness of many nations too low.
• Still need business as usual in terms of food production and manufacturing
• Early adopters in real financial trouble: Spanish energy indebtedness
($100B) is much greater than sum involved in recent banking crisis ($36B)
• Giving away unneeded peak solar/wind energy disrupts markets and grids.
• Germany CO2 emissions rising with a return to coal. CCGT not designed
for load balancing and not economical run that way, so are shut down!
32

© 2010 U. of Cambridge
Department of Engineering
10 If the climate imperative weakens, so too decarbonisation
• 18 years since last global temperature rise of any significance, during which
over 15% increase of overall man-made emissions has occurred.
• Recent IPCC downgraded the rate of predicted temperature rise from that
predicted by the models.
• If the sun has been responsible for recent climate change, mitigation is in vain.
• James Hansen’s 1988 Scenario C climate model: wrong input, right output!
• We need track-record of 20 years of successful prediction of future climate
change before we use model data as a guide for investing in the global future.
• If other events intervene and temperature rise goes off the agenda, the next
decade of infrastructure decisions must be fossil fuel based.
• No shortage of fossil fuels over next 100-200 years. 33

© 2010 U. of Cambridge
Department of Engineering
Hansen: Prediction versus data
Wrong input gives
right output!

© 2010 U. of Cambridge
Department of Engineering
Models or data?
http://wattsupwiththat.com/2014/02/10/95-of-climate-models-agree-the-observations-must-be-
wrong/
The famous Cornell Nobel prize winning
Physicist Richard Feynman explained the
scientific method.
“In general, we look for a new law by the
following process. First, we guess it
(audience laughter), no, don’t laugh, that’s
really true. Then we compute the
consequences of the guess, to see what, if
this is right, if this law we guess is right, to
see what it would imply and then we
compare the computation results to nature,
or we say compare to experiment or
experience, compare it directly with
observations to see if it works.
If it disagrees with experiment, it’s wrong. In
that simple statement is the key to science. It
doesn’t make any difference how beautiful
your guess is, it doesn’t matter how smart
you are who made the guess, or what his
name is.. If it disagrees with experiment, it’s
wrong. That’s all there is to it.”

© 2010 U. of Cambridge
Department of Engineering
Extreme Weather and Related Deaths Trends
http://wattsupwiththat.com/2015/04/20/memo-to-our-cousins-at-
the-american-physical-society-time-to-embrace-reality/

© 2010 U. of Cambridge
Department of Engineering
Greening the Planet
http://www.thegwpf.com/forests-and-fields-in-record-growth-around-the-planet/

© 2010 U. of Cambridge
Department of Engineering
Conclusions and Actions
• An agreed first order pathway at national level, cascadable to local levels
• Economic development will trump science fears every time.
• Urgent demonstrators at scale based on no-regrets actions.
• A rebalancing of the debate in favour of adaptation over mitigation
• A Trial-Type Enquiry into Scientific and Engineering Integrity and a
means to restore public trust.
– Not convinced that the RS ‘Science as a Public Enterprise’ will suffice
• A
38
S-Y Akasofu , 2010, Natural Science 2 1211-24
‘On the recovery from the little ice age’
Let us agree now at what
point should the GCM
modellers must concede a
problem if this trend
continues.
d2T/dt2>0 in IPPC models
d2T/dt2<0 since 1995 in data
2008 at red dot
2011 on green arrowhead
Natural in 1930s versus
man-made in 1990s?
Akasofu’s prediction is
out-performing the IPCC.

© 2010 U. of Cambridge
Department of Engineering
Miscellany
• The poor everywhere are being impoverished by high costs of green energy
• Delaying the development of Africa by denying cheap fossil fuels is immoral.
• Climate change a distant distraction from more serious and imminent
challenges to humanity: antibiotic resistance, financial collapse, water wars…
• Many measures counter-productive – close aluminium smelters in UK and
import from coal-based smelters in China – total madness in total CO2 terms.
• Public resentment at mis-investments will grow with public apathy or
cognitive exhaustion on non-existent climate disasters.
• Do we know we are preparing for the right global disaster?
• Decarbonisation: still no route-map or indicative budget by decades to 2050.
• How will this period be viewed in retrospect in 2050? 39

© 2010 U. of Cambridge
Department of Engineering
Now for some upsides!
10 minutes to go
40

© 2010 U. of Cambridge
Department of Engineering
Peak Population: A century to survive
41
Wolfgang Lutz et al, ‘The end of
world population growth’, Nature
412 543-5 2001
Fred Pearce ‘Peoplequake’ , Transworld, 2011: p
294
Without change/immigration, by 2100, Italy goes
from 58M to 8M, Germany goes to Berlin, Ukraine
loses 43%, …..
What to do then with unwanted infrastructure?
http://news.nationalgeographic.com/ne
ws/2014/09/140918-population-global-
united-nations-2100-boom-africa/

© 2010 U. of Cambridge
Department of Engineering
1st Suggestion: STAY WITHIN BUSINESS AS USUAL
• Malthusians over-estimate the problems, and underestimate the ingenuity
of humanity to deal with them.
• Business as usual has always had energy and resource efficiency on the
agenda – the recent increases in car fuel efficiency a good example.
• New generation of very low power electronics controlling integrated
sensor networks will reduce need of much travel and reduce logistical
footprints.
• Megacities can be self-sufficient in animal protein and green vegetables
from food factories within city boundaries by 2050.
• Too much rose-tinted technological optimism shown by scientists.
42

© 2010 U. of Cambridge
Department of Engineering
2nd Suggestion: DERISK INFRASTRUCTURE PROJECTS
• Infrastructure is very expensive and must make some return over its life time
• Scarce resources must be husbanded, especially on infrastructure scale
• Abandoned motorways, buildings, windmills and solar farms remain for
decades to be mocked
• Grid costs should be bookkept with energy sources (e.g. wind, solar)
• Back-up energy for intermittent sources should be bookkept with source
• Full life costs usually not transparent when governments spent public money
on infrastructure projects. Blackmail to complete – c.f. military projects
• Contrast this with private industry investment decisions!
43

© 2010 U. of Cambridge
Department of Engineering
Warning of UK Blackouts
http://blogs.bsria.co.uk/2013/07/01/when-will-the-lights-go-
out/?utm_source=http%3a%2f%2fmarketing.bsria.co.uk%2fbsrialz%2f&utm_medium=email&utm_campaign=BSRIA+E-
News+July+2013&utm_term=Code+6%c2%a0home%c2%a0l+When+the+lights+go+out+l+Hybrid+renewables&utm_content=15367
Note: the climate change
debate is one of the main
causes of the delay in
acting at the scale required
by this figure.
Mild winters recently!
Diesel back-ups from UPS
systems (hospitals,…)
lined up by UK Grid to
come on with extravagant
CO2 emissions!

© 2010 U. of Cambridge
Department of Engineering
3rd Suggestion: PERSONAL BEHAVIOUR AND ATTITUDES
• Significant changes in personal attitudes and behaviour are possible as
exemplified by drink-driving, smoking in public confined spaces, etc
• If energy and resource profligacy were considered deeply antisocial,
demand reduction would make much greater inroads on energy budgets
• We could live a high standard of living with half our per capita use of energy,
with less travel, shorter supply chains and lower heating budgets.
• Such an approach immediately effective and engages all, but probably has
serious unintended and unwanted economic consequences if done rapidly.
• Faster to implement and greater impact than any technology can deliver!
• European actions are penalising EU economy, while China and India forge
ahead with much greater use of fossil fuels.
45

© 2010 U. of Cambridge
Department of Engineering
Summary Conclusions
• The current decarbonisation regimes will fail to meet their objectives.
• Malthusians too pessimistic.
• Much mitigation is madness as of today – adaptation as practiced by the
Dutch for centuries is the way forward.
• No-one knows the effects on future climates of a crash project to
decarbonise the global economy: does it represent value-for-money?
• Until now, the cure has been worse than the symptoms.
• Noble causes are not helped by poor science or bad engineering.
• Deserved backlash against all science/technology if we get this wrong.
• Engineers must speak out for the sake of the world!!!!!!
46

© 2010 U. of Cambridge
Department of Engineering
If it really that bad, the climate advocates must
• Develop a compelling story – not ‘mights’ or ‘coulds’, but ‘will’s, ‘whens’ and
‘how much’.
• Get a much better grip on the problems of scale of actions.
• Put their own capital and savings up as co-lateral to support radical action.
• Note that preaching to spend other’s money gets nowhere.
• Live an exemplary condign lifestyle – minimal use of air travel,
supercomputers, internet, cars, heating, …
to reduce their own CO2 emissions.
• Recognise their societal obligations as the client of any engineering project
undertaken to mitigate or adapt to climate change.
• Appreciate that engineering reality will not be cheated. Thermodynamics!
47
© 2010 U. of Cambridge
Department of Engineering Parting Food for Thought
“The future seemed to them bright so long as environmental pessimism did not lead to the
creation of misguided policies” p 178
“It was certainly a good idea – now as always – not to be wasteful or profligate with resources, It
was a good idea to continue seeking alternative energy sources and to make existing energy
sources more efficient. On the other hand it is not a good idea to devote massive resources to
cutting carbon dioxide emissions if, in doing so, other worthwhile ends could no longer be pursued.
The great paradox of the 1990s and 2000s was that poor people in developing countries
continued to suffer from malnutrition, smoke inhalation, and remediable diseases and to die from
drinking contaminated water, while developed nations discussed astronomically expensive carbon
dioxide abatement schemes whose benefits were highly conjectural and could only be realised – if
at all – in the distant future.” p241
“Few people have paused to ask: How would we benefit now if our grandparents and great-
grandparents had exercised more self-restraint and self-denial? Would we live better if they had
exercised greater prudence and self-control.” p241
“The rising carbon dioxide footprint may be troublesome, but it is a side effect of the creation of
immense benefits.” p242
48
Patrick Allitt: “A climate of crisis: America in the age of environmentalism” Penguin, NY 2014

© 2010 U. of Cambridge
Department of Engineering
References
• M J Kelly, ‘Energy efficiency, resilience to future climates and long-term
sustainability: the role of the built environment’, Philosophical
Transactions of the Royal Society A 368 1083-9 (2010)
• M J Kelly, ‘Why a collapse of global civilization will be avoided: a
comment on Ehrlich and Ehrlich’, Proc. Roy. Soc. B 280 20131193
(2013)
• Michael J Kelly, ‘Technology introductions in the context of
decarbonisation: Lessons from recent history’, The Global Warming
Policy Foundation, GWPF Note 7, 2014,
http://www.thegwpf.org/content/uploads/2014/03/Kelly-lessons.pdf
• M J Kelly, “Future Energy Needs and Engineering Reality”, Journal of
Energy Challenges and Mechanics, 1, #3, 1 (2014)
http://www.nscj.co.uk/JECM/PDF/1-3-1-Kelly.pdf
49

© 2010 U. of Cambridge
Department of Engineering
The End
THANK YOU FOR YOUR ATTENTION
Q & A & DEBATE
50

© 2010 U. of Cambridge
Department of Engineering Scafetta: if future is like the past

© 2010 U. of Cambridge
Department of Engineering The Sun – the cooling is coming
http://www.dailymail.co.uk/sciencetech/article-2093264/Forget-global-warming--Cycle-25-need-worry-NASA-scientists-right-Thames-freezing-again.html

© 2010 U. of Cambridge
Department of Engineering
On-going Adjustments to Raw Data
A picture tells a thousand words http://jonova.s3.amazonaws.com/graphs/giss/hansen-giss-1940-1980.gif

© 2010 U. of Cambridge
Department of Engineering
Proposed Coal Fired Plants
Total UK Coal capacity: 25,000MW http://tomnelson.blogspot.co.nz/2013/01/global-map-of-planned-coal-fired.html

© 2010 U. of Cambridge
Department of Engineering
Hormesis
http://www.drroyspencer.com/2014/08/earths-response-to-increasing-co2-an-example-of-
hormesis/

© 2010 U. of Cambridge
Department of Engineering
RS/NAS: note the balance of bad and good: Hormesis!
56
17: Are climate changes of a few degrees a cause for concern?
Yes. Even though an increase of a few degrees in global average temperature does not sound like
much, global average temperature during the last ice age was only about 4 to 5 °C (7 to 9 °F) colder
than now. Global warming of just a few degrees will be associated with widespread changes in
regional and local temperature and precipitation as well as with increases in some types of extreme
weather events. These and other changes (such as sea level rise and storm surge) will have serious
impacts on human societies and the natural world.
Both theory and direct observations have confirmed that global warming is associated with greater
warming over land than oceans, moistening of the atmosphere, shifts in regional precipitation
patterns and increases in extreme weather events, ocean acidification, melting glaciers, and rising
sea levels (which increases the risk of coastal inundation and storm surge). Already, record high
temperatures are on average significantly outpacing record low temperatures, wet areas are
becoming wetter as dry areas are becoming drier, heavy rainstorms have become heavier, and
snow packs (an important source of freshwater for many regions) are decreasing.
These impacts are expected to increase with greater warming and will threaten food production,
freshwater supplies, coastal infrastructure, and especially the welfare of the huge population
currently living in low-lying areas. Even though certain regions may realise some local benefit
from the warming, the long-term consequences overall will be disruptive.

© 2010 U. of Cambridge
Department of Engineering
Progress on the home front: UofC Footprint
57

© 2010 U. of Cambridge
Department of Engineering
58
AC energy in building B in Beijing
0
100
200
300
400
500
600
700
800
1 2 3 4 5 6 7 8 9 10 11 12 13 14 15 16 17 18
住户层数
空调耗电量(kWh/户)
Floor
AC
en
erg
y d
ata
( kW
h/h
om
e u
nit
)
0
100
200
300
400
500
600
700
800
1 2 3 4 5 6 7 8 9 10 11 12 13 14 15 16 17 18
住户层数
空调耗电量(kWh/户)
Floor
AC
en
erg
y d
ata
( kW
h/h
om
e u
nit
)
Electricity consumption by AC for home units
at same location but different floors in building B
Lesson: personal behavior can thwart technology
Prof Jiang, Tsinghua

© 2010 U. of Cambridge
Department of Engineering
59
0
50
100
150
200
250
300
350
Coolling Heating Electricity
kW
H/m
2
Annual Energy Intensity
US Campus Avg.
Beijing Single Bldg.
Monthly Mean Temp. in Philadelphia and Beijing
-5
0
5
10
15
20
25
30
Jan Feb Mar Apr May Jun Jul Aug Sep Oct Nov Dec
Degr
ee.C
Philadelphia
Beijing
Campus building in US
Building in Beijing
Beijing & Philadelphia
Prof Jiang, Tsinghua

© 2010 U. of Cambridge
Department of Engineering Energy Futures (Hans Rosling)
Democracy Means Votes for Washing Machines
Increase in wealth http://rogerpielkejr.blogspot.co.uk/2011/11/democracy-means-votes-for-waching.html

© 2010 U. of Cambridge
Department of Engineering
Context and History: Technology / Mankind / Earth
61
Every age has its peculiar folly; some scheme, project, or phantasy
into which it plunges, spurred on either by the love of gain, the
necessity of excitement, or the mere force of imitation. Failing in
these, it has some madness, to which it is goaded by political or
religious causes, or both combined. --Charles MacKay, Memoirs of
Extraordinary Popular Delusions and the Madness of Crowds, London
1852.
Should we now add science and/or environmentalism to political and
religious causes?