fusion registry - metadata technology
TRANSCRIPT

Fusion Registry: 10.x Document Last Updated: 12th September 2018 Version 20180912
FUSION REGISTRY Use Case – Collection using Excel Reporting Template
FUSION REGISTRY VERSION 10 Tutorial This guide describes how to set up a data collection using Excel Reporting Templates
1
Contents 1 Overview ......................................................................................................................................... 2
1.1 What is a Reporting Template? .............................................................................................. 2
1.2 About this Tutorial .................................................................................................................. 2
2 Required Fusion Registry Metadata ................................................................................................ 3
2.1 Defining Reporting Universe ................................................................................................... 4
2.1.1 Series Constraint ............................................................................................................. 4
2.1.2 Cube Region Constraint .................................................................................................. 4
2.1.3 Creating Constraints ........................................................................................................ 5
2.1.4 From User Interface ........................................................................................................ 5
2.1.5 From Excel ....................................................................................................................... 5
2.1.6 From a Dataset ................................................................................................................ 6
2.2 Fix Floating Point Errors using DSD to specify Max Decimals ................................................. 7
3 Creating a Basic Excel Reporting Template ..................................................................................... 8
3.1 Overview ................................................................................................................................. 8
3.1.1 Purpose ........................................................................................................................... 8
3.1.2 Functionality ................................................................................................................... 8
3.2 Creating the Template from the User Interface ..................................................................... 9
3.2.1 Template Authoring Wizard ............................................................................................ 9
3.2.2 Registry Metadata ........................................................................................................... 9
3.2.3 Stage 1 Details ............................................................................................................... 10
3.2.4 Stage 2 Excel Worksheets ............................................................................................. 10
3.2.5 Stage 3 Table Structure – Dimensions .......................................................................... 11
3.2.6 Stage 4 Table Structure – Attributes ............................................................................. 14
3.3 Generate Reporting Template .............................................................................................. 19
4 Validation and Transformation ..................................................................................................... 21
2
1 Overview
1.1 What is a Reporting Template? Reporting Templates enable data reporters to be provided with a custom built excel template for
data reporting. The template provides a tabular form that the data provider can fill in with
observation values. The form contains only the cells that the data provider is expected to report
data for, and cells can make use of colour to provide pre-defined defaults for observation attributes
such as observation confidentiality.
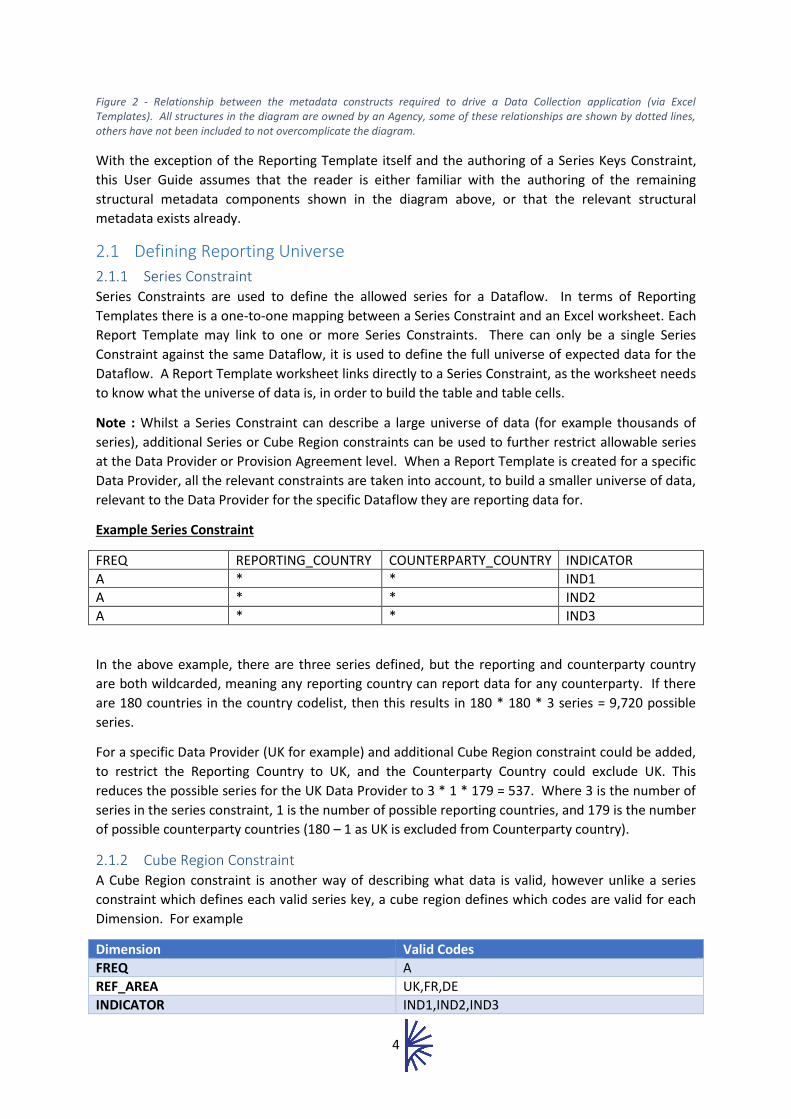
Figure 1 - Example layout for a data form
The layout and content of a Reporting Template are defined by the data collection organisation. A
Reporting Template may define multiple collection forms in a single worksheet, where each
worksheet represents a collection for a specific Dataflow, for a specific Data Provider. In this way,
the worksheet itself will only contain cells that the Data Provider is expected to report data for.
The remainder of this user guide discusses how the Fusion Registry can be used to define a
Reporting Template form, how the Data Provider downloads a form to complete, and how the
Fusion Registry can then be used to provide data validation, and transformation on the reported
data.
1.2 About this Tutorial This tutorial describes each process required to create an Excel template, from an empty Fusion
Registry instance. Whilst this tutorial describes how to create some dependant structures, other
tutorials cover these structures in more detail.
This tutorial describes the manual steps for creating structures.

3
2 Required Fusion Registry Metadata To construct a Reporting Template, the Fusion Registry must first contain some required structural
metadata, which can be briefly summarised as:
• Agency – to own the structures, this would be the organisation responsible for the data collection
• Concepts – these are the underlying components on which a Data Structure Definition is based, example Concepts are Frequency, Reporting Country, Counterparty Country, Time
• Codelists – these provide an enumerated list of allowed values which can be reported against each Dimension in a Data Structure, for example a Country Codelist would contain a list of valid countries (UK=United Kingdom, FR=France)
• Data Structure Definition (DSD) – this is used to describe a dataset in terms of its dimensionality, for example an Exchange Rates DSD may have three dimensions, Reference Area, Currency, and Time
• Reporting Constraint (Dataflow) – A reporting template is only able to build a table of cells, if it knows what the reporting universe is. A Series or Cube Region Constraint attached to the Dataflow is used to define the allowed series/codes for the dataset.
• Reporting Constraint (Data Provider / Provision) (optional) – additional constraints can be defined for specific Data Providers or Provision Agreements. For example, a Data Provider UK should only provide data for Reference Area UK
• Provision Agreement – this provides a link between a Data Provider and a Dataflow they are expected to report data for. For example, a Provision Agreement could link Data Provider UK to the Exchange Rates Dataflow. This is a many to many association as a single Data Provider could be set up to provide data for multiple Dataflows
• Validation Scheme (optional) – this is used to define mathematical rules for reported data. These rules are used to both embed formula in the worksheet, to assist the user in pre-calculating cell values, and for server-side validation
• Data Provider – this is an organisation responsible for reporting data
• Reporting Template – this requires a Series Constraint, which in turn links to the relevant metadata (DSD, Concepts, Codelists) required to build a template
4
Figure 2 - Relationship between the metadata constructs required to drive a Data Collection application (via Excel Templates). All structures in the diagram are owned by an Agency, some of these relationships are shown by dotted lines, others have not been included to not overcomplicate the diagram.
With the exception of the Reporting Template itself and the authoring of a Series Keys Constraint,
this User Guide assumes that the reader is either familiar with the authoring of the remaining
structural metadata components shown in the diagram above, or that the relevant structural
metadata exists already.
2.1 Defining Reporting Universe
2.1.1 Series Constraint Series Constraints are used to define the allowed series for a Dataflow. In terms of Reporting
Templates there is a one-to-one mapping between a Series Constraint and an Excel worksheet. Each
Report Template may link to one or more Series Constraints. There can only be a single Series
Constraint against the same Dataflow, it is used to define the full universe of expected data for the
Dataflow. A Report Template worksheet links directly to a Series Constraint, as the worksheet needs
to know what the universe of data is, in order to build the table and table cells.
Note : Whilst a Series Constraint can describe a large universe of data (for example thousands of
series), additional Series or Cube Region constraints can be used to further restrict allowable series
at the Data Provider or Provision Agreement level. When a Report Template is created for a specific
Data Provider, all the relevant constraints are taken into account, to build a smaller universe of data,
relevant to the Data Provider for the specific Dataflow they are reporting data for.
Example Series Constraint
FREQ REPORTING_COUNTRY COUNTERPARTY_COUNTRY INDICATOR
A * * IND1
A * * IND2
A * * IND3
In the above example, there are three series defined, but the reporting and counterparty country
are both wildcarded, meaning any reporting country can report data for any counterparty. If there
are 180 countries in the country codelist, then this results in 180 * 180 * 3 series = 9,720 possible
series.
For a specific Data Provider (UK for example) and additional Cube Region constraint could be added,
to restrict the Reporting Country to UK, and the Counterparty Country could exclude UK. This
reduces the possible series for the UK Data Provider to 3 * 1 * 179 = 537. Where 3 is the number of
series in the series constraint, 1 is the number of possible reporting countries, and 179 is the number
of possible counterparty countries (180 – 1 as UK is excluded from Counterparty country).
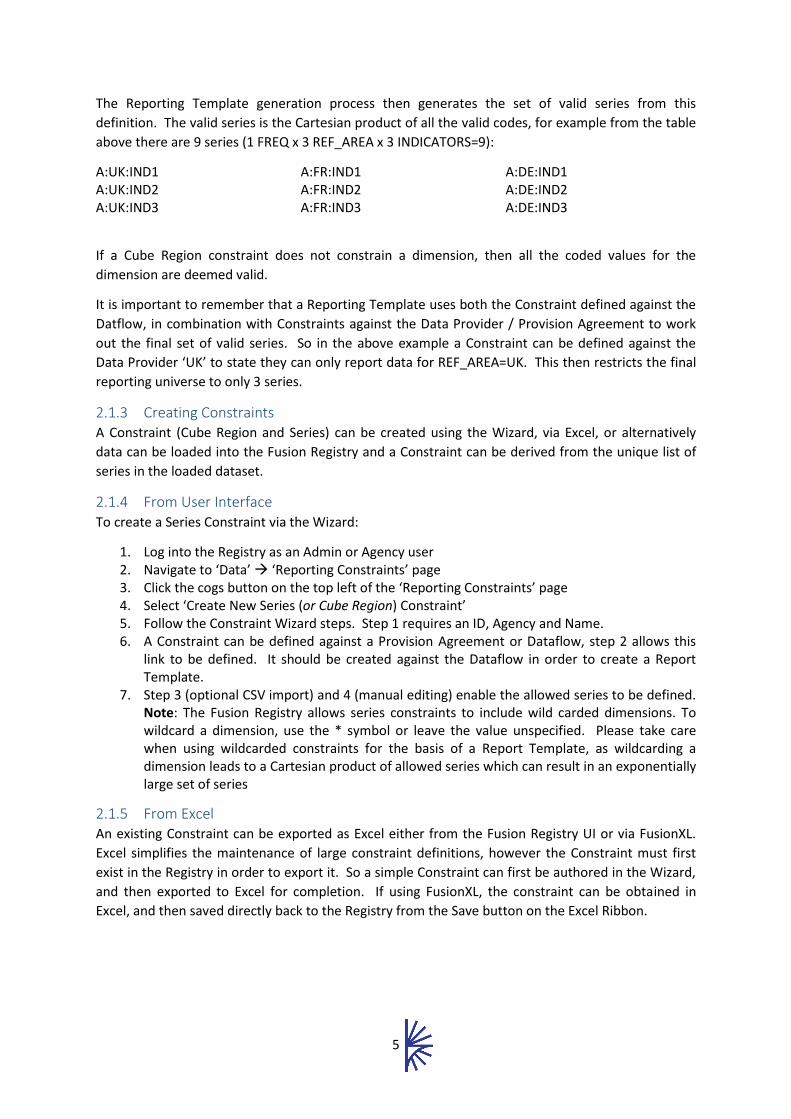
2.1.2 Cube Region Constraint A Cube Region constraint is another way of describing what data is valid, however unlike a series
constraint which defines each valid series key, a cube region defines which codes are valid for each
Dimension. For example
Dimension Valid Codes
FREQ A
REF_AREA UK,FR,DE
INDICATOR IND1,IND2,IND3
5
The Reporting Template generation process then generates the set of valid series from this
definition. The valid series is the Cartesian product of all the valid codes, for example from the table
above there are 9 series (1 FREQ x 3 REF_AREA x 3 INDICATORS=9):
A:UK:IND1 A:UK:IND2 A:UK:IND3
A:FR:IND1 A:FR:IND2 A:FR:IND3
A:DE:IND1 A:DE:IND2 A:DE:IND3
If a Cube Region constraint does not constrain a dimension, then all the coded values for the
dimension are deemed valid.
It is important to remember that a Reporting Template uses both the Constraint defined against the
Datflow, in combination with Constraints against the Data Provider / Provision Agreement to work
out the final set of valid series. So in the above example a Constraint can be defined against the
Data Provider ‘UK’ to state they can only report data for REF_AREA=UK. This then restricts the final
reporting universe to only 3 series.
2.1.3 Creating Constraints A Constraint (Cube Region and Series) can be created using the Wizard, via Excel, or alternatively
data can be loaded into the Fusion Registry and a Constraint can be derived from the unique list of
series in the loaded dataset.
2.1.4 From User Interface To create a Series Constraint via the Wizard:
1. Log into the Registry as an Admin or Agency user 2. Navigate to ‘Data’ → ‘Reporting Constraints’ page 3. Click the cogs button on the top left of the ‘Reporting Constraints’ page 4. Select ‘Create New Series (or Cube Region) Constraint’ 5. Follow the Constraint Wizard steps. Step 1 requires an ID, Agency and Name. 6. A Constraint can be defined against a Provision Agreement or Dataflow, step 2 allows this
link to be defined. It should be created against the Dataflow in order to create a Report Template.
7. Step 3 (optional CSV import) and 4 (manual editing) enable the allowed series to be defined. Note: The Fusion Registry allows series constraints to include wild carded dimensions. To wildcard a dimension, use the * symbol or leave the value unspecified. Please take care when using wildcarded constraints for the basis of a Report Template, as wildcarding a dimension leads to a Cartesian product of allowed series which can result in an exponentially large set of series
2.1.5 From Excel An existing Constraint can be exported as Excel either from the Fusion Registry UI or via FusionXL.
Excel simplifies the maintenance of large constraint definitions, however the Constraint must first
exist in the Registry in order to export it. So a simple Constraint can first be authored in the Wizard,
and then exported to Excel for completion. If using FusionXL, the constraint can be obtained in
Excel, and then saved directly back to the Registry from the Save button on the Excel Ribbon.

6
Figure 3 showing a series constraint definition in Excel
2.1.6 From a Dataset To create a Constraint from a Dataset:
1. Log into the Registry as an Admin or Agency user 2. Navigate to ‘Data’ → ‘Load Data’ page 3. Select either a data file, or URL to load, and click Load Data 4. On the Dataset Details page, ensure the dataset is linked to a Dataflow or Provision
Agreement 5. Click on ‘Generate Reporting Constraints’ 6. Choose the Constraint Type (Series or Cube Region), and click Generate
Figure 4 - Dataset Details page of a loaded dataset, from this page Series Constraints can be generated
Once a Series Constraint is generated it can be viewed from the Report Templates page
7
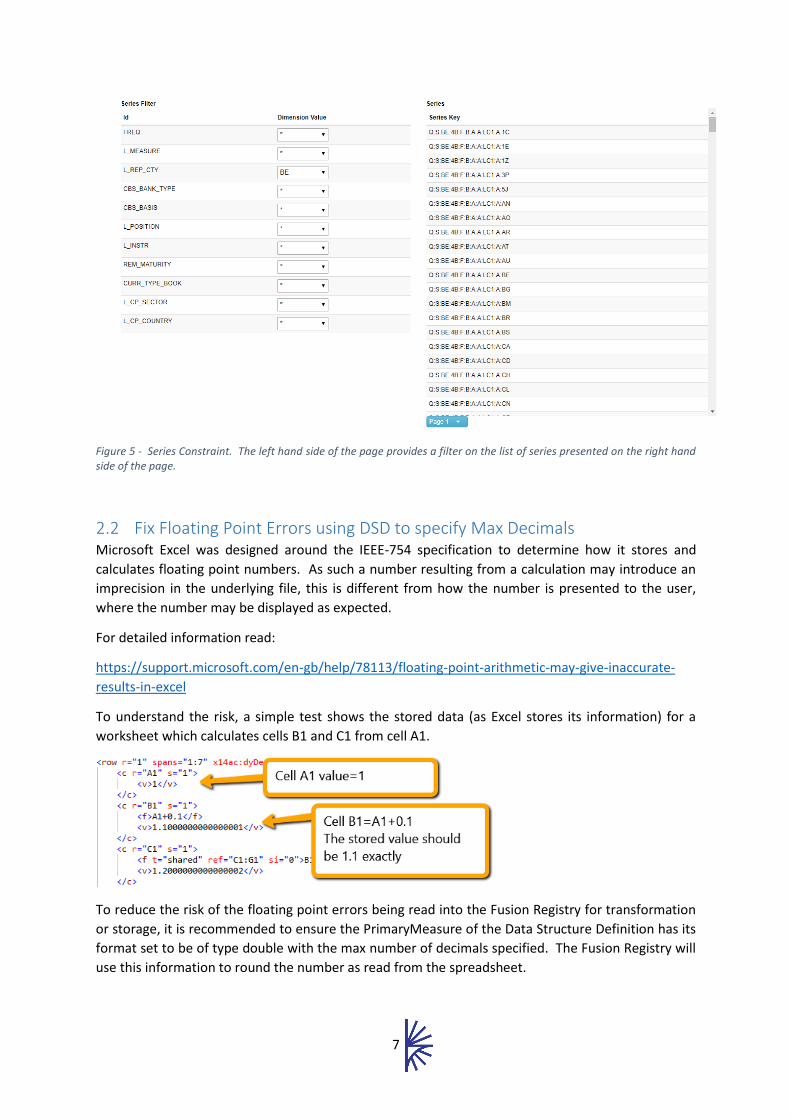
Figure 5 - Series Constraint. The left hand side of the page provides a filter on the list of series presented on the right hand side of the page.
2.2 Fix Floating Point Errors using DSD to specify Max Decimals Microsoft Excel was designed around the IEEE-754 specification to determine how it stores and
calculates floating point numbers. As such a number resulting from a calculation may introduce an
imprecision in the underlying file, this is different from how the number is presented to the user,
where the number may be displayed as expected.
For detailed information read:
https://support.microsoft.com/en-gb/help/78113/floating-point-arithmetic-may-give-inaccurate-
results-in-excel
To understand the risk, a simple test shows the stored data (as Excel stores its information) for a
worksheet which calculates cells B1 and C1 from cell A1.
To reduce the risk of the floating point errors being read into the Fusion Registry for transformation
or storage, it is recommended to ensure the PrimaryMeasure of the Data Structure Definition has its
format set to be of type double with the max number of decimals specified. The Fusion Registry will
use this information to round the number as read from the spreadsheet.

8
3 Creating a Basic Excel Reporting Template
3.1 Overview
3.1.1 Purpose The Collection Template is used to define an Excel Workbook which will be used to collect data. The
Fusion Registry generates a workbook on demand for a specific Data Provider, with a pre-built data
collection form according to the rules of what the Data Provider has been configured to provide data
for. The Excel template will contain a worksheet per series constraint that is used to define a
reporting universe of data.
This section describes how to create a basic Reporting Template.
3.1.2 Functionality General
A Report Template is built using the metadata in the Data Structure Definition (DSD) and the
metadata in the Series Keys Reporting Constraints.
Many reporting templates can be created using the same DSD. In this way there could be a different
template for each Data Reporter, each containing only the Dimension and Attribute values that the
Data Reporter is allowed report.
Multiple Worksheets can be authored for the same Spreadsheet
Dimensions
• A Dimension can be fixed to contain a single value, or can be excluded entirely from the Template
• Dimensions are specified to being represented in a Column or a Row in the Worksheet
• The order in which the Dimensions are shown in the Worksheet are specified explicitly, and need not be the same order that these are specified in the DSD
Any Dimension can use a Hierarchy in a Hierarchical Code List. Such a hierarchy can be used in the
following ways:
• to create automated totals of values – the details for this are specified in a separate user guide.
• In the representation in the Worksheet
Attributes
An Attribute can be:
• Excluded from the Template
• Included in the “data” Table in the Worksheet
• Included in a separate Worksheet from that containing the data
• Can be allocated a specific colour to highlight different values
• Can be specified with a fixed value
Validation
Mathematical expressions can be applied to Dimensions by defining a Validation Scheme. These
expressions will be included in the worksheet, enabling certain cells to be calculated automatically
using these expressions. Validation Schemes are is detailed in a separate guide.
9
3.2 Creating the Template from the User Interface
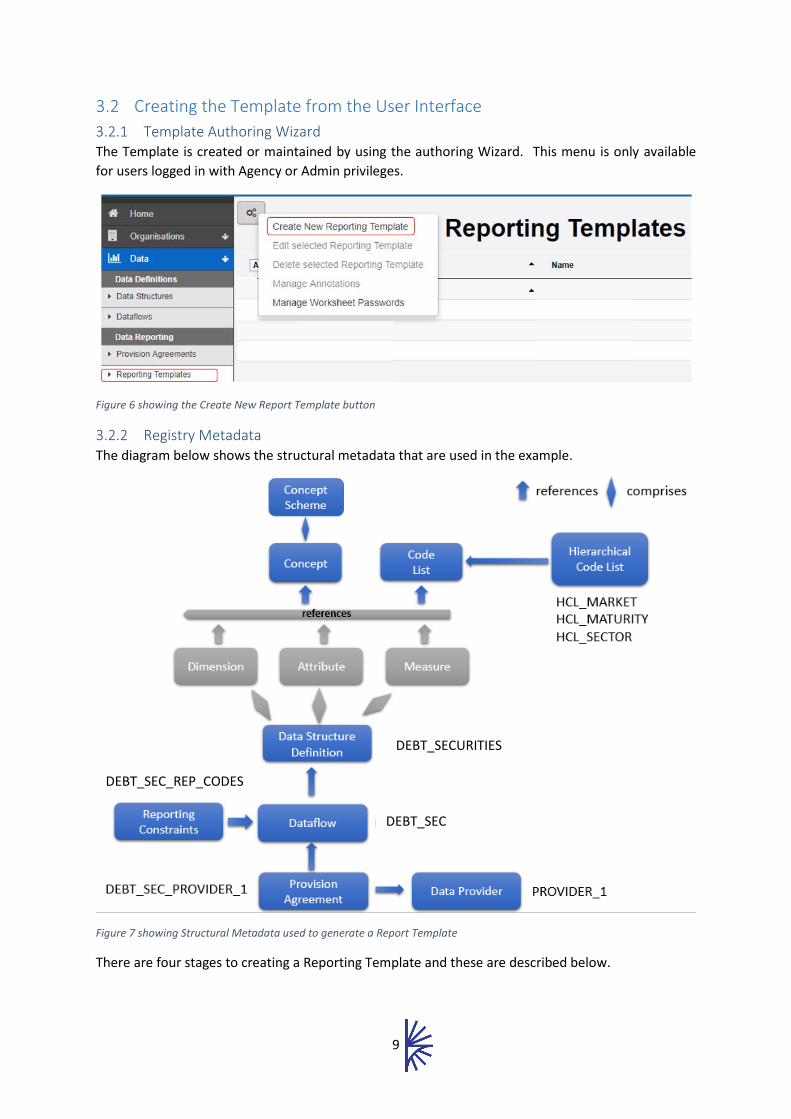
3.2.1 Template Authoring Wizard The Template is created or maintained by using the authoring Wizard. This menu is only available
for users logged in with Agency or Admin privileges.
Figure 6 showing the Create New Report Template button
3.2.2 Registry Metadata The diagram below shows the structural metadata that are used in the example.
Figure 7 showing Structural Metadata used to generate a Report Template
There are four stages to creating a Reporting Template and these are described below.
D DEBT_SECURITIES
DEBT_SEC
DEBT_SEC_REP_CODES
10
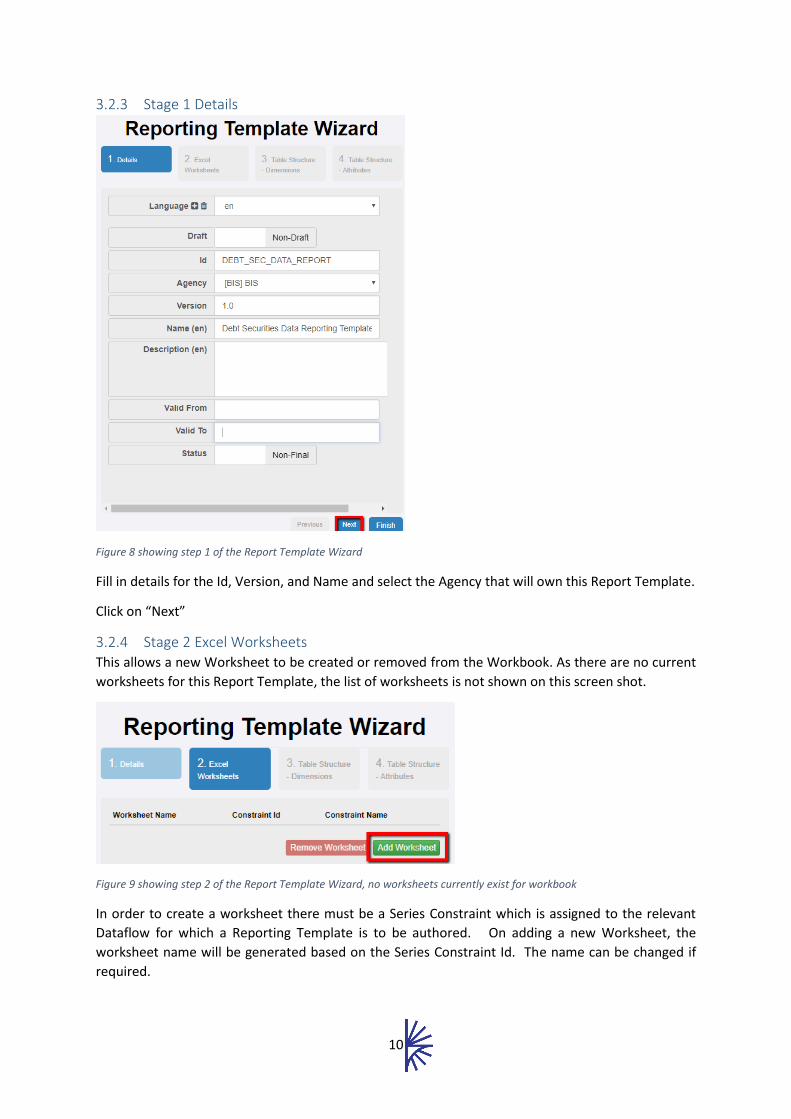
3.2.3 Stage 1 Details
Figure 8 showing step 1 of the Report Template Wizard
Fill in details for the Id, Version, and Name and select the Agency that will own this Report Template.
Click on “Next”
3.2.4 Stage 2 Excel Worksheets This allows a new Worksheet to be created or removed from the Workbook. As there are no current
worksheets for this Report Template, the list of worksheets is not shown on this screen shot.
Figure 9 showing step 2 of the Report Template Wizard, no worksheets currently exist for workbook
In order to create a worksheet there must be a Series Constraint which is assigned to the relevant
Dataflow for which a Reporting Template is to be authored. On adding a new Worksheet, the
worksheet name will be generated based on the Series Constraint Id. The name can be changed if
required.

11
Figure 10 showing the Step 2 create Worksheet modal.
Click on “Add Worksheet(s)”.
Figure 11 showing step 2 with a single worksheet added
Note: There may be many Series Constraints for the same Dataflow if there are different validity
dates.
Select the appropriate Series Constraint and click on “Next”.
3.2.5 Stage 3 Table Structure – Dimensions Fixed Dimensions
As the Template Wizard now knows the universe of data for a Worksheet (via the Series Constraint),
the wizard is able to inform the user which Dimensions contain the same value for all series. These
Dimensions are considered fixed, and will either be displayed in header section of the output
worksheet, or alternatively the Template can be told to exclude the Dimension from the worksheet.
When excluding a Dimension from the worksheet, the correct fixed value will be read in correctly,
but it will just not be displayed to the user.

12
Figure 12 showing fixed Dimensions, as derived from the Series Constraint. Some or all of these Dimensions can be eliminated from the generated Template by clicking on the appropriate “Exclude” box.
Rows and Columns
Next, the Wizard lists the rows and columns for the Dimensions.
Figure 13 showing Dimensions that make up the Table Rows, with controls to modify the order, and move a Row to a column
Initially, all remaining Dimensions are listed in the “Table Rows”.
Use the Move to Column those Dimensions that are to be placed in the columns of the Template.
Use the Move Up and Move Down buttons to change the order in which the Dimensions are shown
in the generated Report Template.
The Exc. Fixed checkbox, if checked, will not include the Dimension in the generated template IF
there is only one value for that Dimension. This can occur if the Data Provider generating the
template has additional Constraints, which results in the restriction of a Dimension to only one
value.
Hierarchy
13
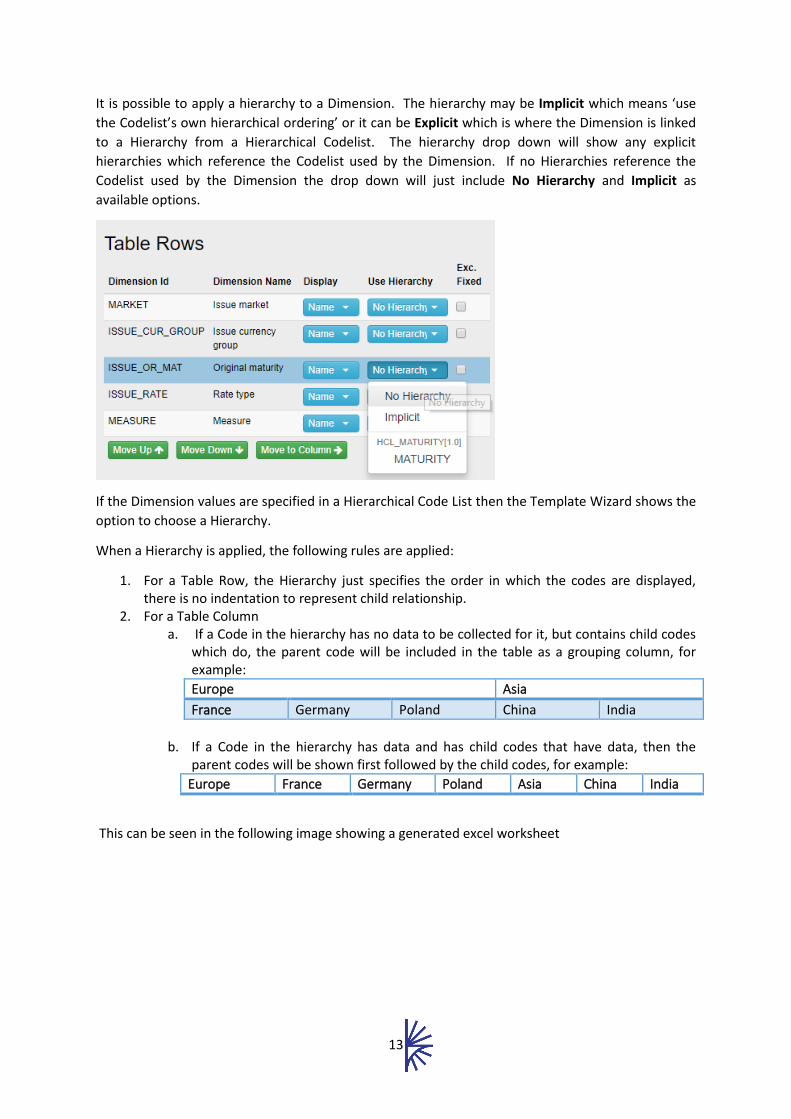
It is possible to apply a hierarchy to a Dimension. The hierarchy may be Implicit which means ‘use
the Codelist’s own hierarchical ordering’ or it can be Explicit which is where the Dimension is linked
to a Hierarchy from a Hierarchical Codelist. The hierarchy drop down will show any explicit
hierarchies which reference the Codelist used by the Dimension. If no Hierarchies reference the
Codelist used by the Dimension the drop down will just include No Hierarchy and Implicit as
available options.
If the Dimension values are specified in a Hierarchical Code List then the Template Wizard shows the
option to choose a Hierarchy.
When a Hierarchy is applied, the following rules are applied:
1. For a Table Row, the Hierarchy just specifies the order in which the codes are displayed, there is no indentation to represent child relationship.
2. For a Table Column a. If a Code in the hierarchy has no data to be collected for it, but contains child codes
which do, the parent code will be included in the table as a grouping column, for example:
Europe Asia
France Germany Poland China India
b. If a Code in the hierarchy has data and has child codes that have data, then the
parent codes will be shown first followed by the child codes, for example:
Europe France Germany Poland Asia China India
This can be seen in the following image showing a generated excel worksheet

14
Figure 14 showing a report template generated using hierarchies
3.2.6 Stage 4 Table Structure – Attributes The final step of the Wizard allows the user to define how observation attributes are handled. They
can either be:
• Exclude from the Template - do not collect this attribute
• Include in the Excel Table for data – This allows the user to report observation values and attribute values in the same table
• Place the separate table in the same worksheet – This allows the user to report the observation value and attribute value in the same worksheet, but there is a separate table for Observations and attributes
• Place the separate table in a separate worksheet – this creates a worksheet for reporting observation values, and a separate worksheet for reporting the attributes for the observations
• Use colour to represent value – this allows the user to give the cell a background colour, where each colour is linked to an attribute value. For example RED may link to Confidential, whereas Green links to Free.
• Fix the value of the Attribute – The Attribute is fixed to a pre-set value, defined in the Report Template Wizard.
• Attribute value is conditional on other reported data – This allows the agency to specify rules to derive an attribute based on other observation or attribute data reported. For example a rule could be applied to the Observation Status Attribute to say if the observation is missing then set the value to M.

15
Figure 15 showing the available Observation Attributes, each one providing controls for placement
Fixing an Attribute Value
Figure 16 showing attribute placements, with Observation Status taking the Fixed value of A
It is possible to fix the value of an Attribute, and also to assign a default value for an Attribute if a
value is not entered on the Worksheet by the Data Reporter. This is useful if the Attribute is
Mandatory in the Data Structure Definition, and has a value that is commonly used, such as “A” for
an Observation Status.
To change the fixed value, click Change Value which will open a drop down control from which an
alternative value can be selected, as shown in the following image.
Note: Only coded attributes (attributes which take their representation from a Codelist) can be
fixed.
Figure 17 changing the fixed value for Observation Status

16
Conditional Attributes
When specifying an attribute as conditional, a new table will be built on the page, allowing the user
to add new conditional attribute rules for the attribute, as shown in the image below.
Note: Only coded attributes (attributes which take their representation from a Codelist) can be set
to Conditional.
Figure 18 showing conditional attribute rules for OBS_STATUS attribute
To add a new rule, first make a choice in the Attribute Id column, this drop down will contain all the
attributes which have been set to be conditional. Then choose an attribute value, which will be the
output value that is derived when a rule is hit. The third column allows the specific rule to be set,
and in some cases additional rule details are required. The available rules are:
• Default Value – The Attribute Value will be applied if the following conditions are met o Either observation data or attribute data is reported for the observation cell o No other rules conditional rules apply
• Observation Present – The Attribute Value will be applied the following conditions are met: o The observation value is present o No other attribute specific rules (attribute present, attribute not-present, or
attribute value rules) are applied
• Observation Missing - The Attribute Value will be applied the following conditions are met: o The observation cell is left blank (no data reported) o No other attribute specific rules (attribute present, attribute not-present, or
attribute value rules) are applied
• Observation NaN - The Attribute Value will be applied the following conditions are met: o The observation cell is left blank (no data reported) o No other attribute specific rules (attribute present, attribute not-present, or
attribute value rules) are applied
• Observation Value – The Attribute Value will be applied if o The reported observation value matches an equality operation which is either
Equals, not Equals, Less Than, Less Than or Equal, Greater Than, Greater Than or Equal
o No other attribute specific rules (attribute present, attribute not-present, or attribute value rules) are applied
• Attribute Present – The Attribute Value will be applied if another Attribute, specified in the Rule Detail, has a reported value, regardless of what that value is
• Attribute Not Present – The Attribute Value will be applied if another Attribute, specified in the Rule Detail, has not got a reported value
17
• Attribute Value – The Attribute Value will be applied if another Attribute, specified in the Rule Detail, has a specific reported value. This rule can only be applied if the dependant attribute is Coded.
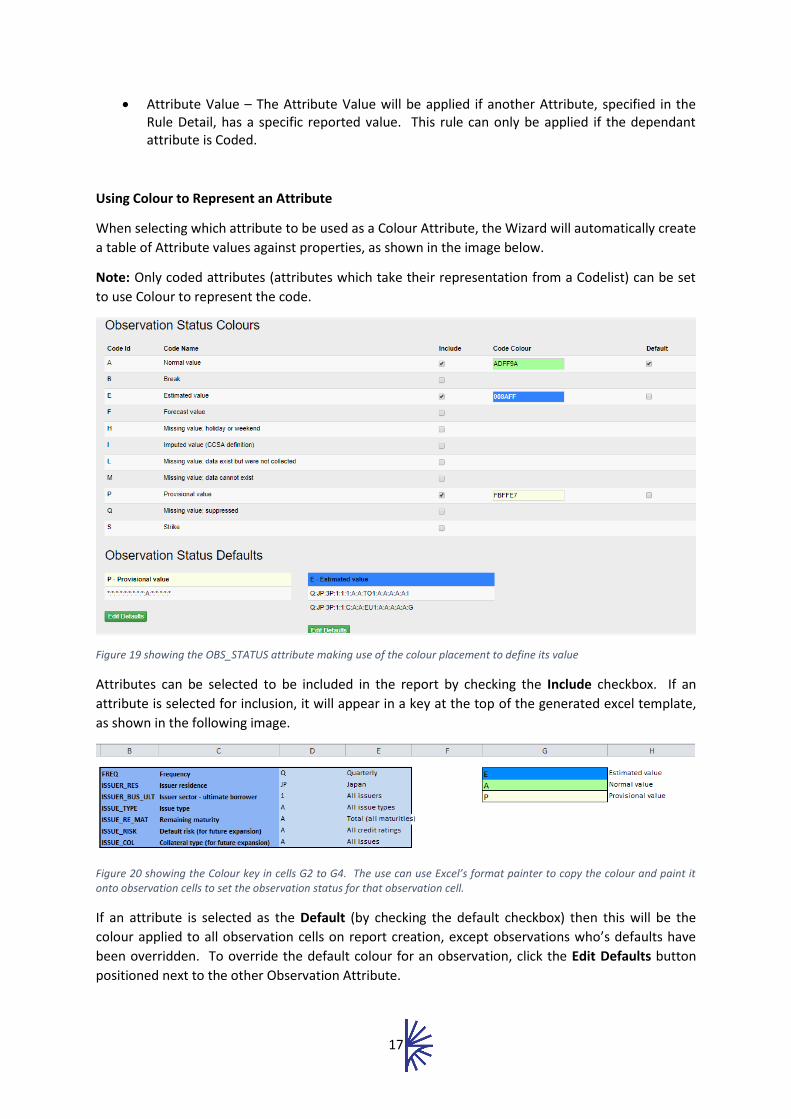
Using Colour to Represent an Attribute
When selecting which attribute to be used as a Colour Attribute, the Wizard will automatically create
a table of Attribute values against properties, as shown in the image below.
Note: Only coded attributes (attributes which take their representation from a Codelist) can be set
to use Colour to represent the code.
Figure 19 showing the OBS_STATUS attribute making use of the colour placement to define its value
Attributes can be selected to be included in the report by checking the Include checkbox. If an
attribute is selected for inclusion, it will appear in a key at the top of the generated excel template,
as shown in the following image.
Figure 20 showing the Colour key in cells G2 to G4. The use can use Excel’s format painter to copy the colour and paint it onto observation cells to set the observation status for that observation cell.
If an attribute is selected as the Default (by checking the default checkbox) then this will be the
colour applied to all observation cells on report creation, except observations who’s defaults have
been overridden. To override the default colour for an observation, click the Edit Defaults button
positioned next to the other Observation Attribute.
18
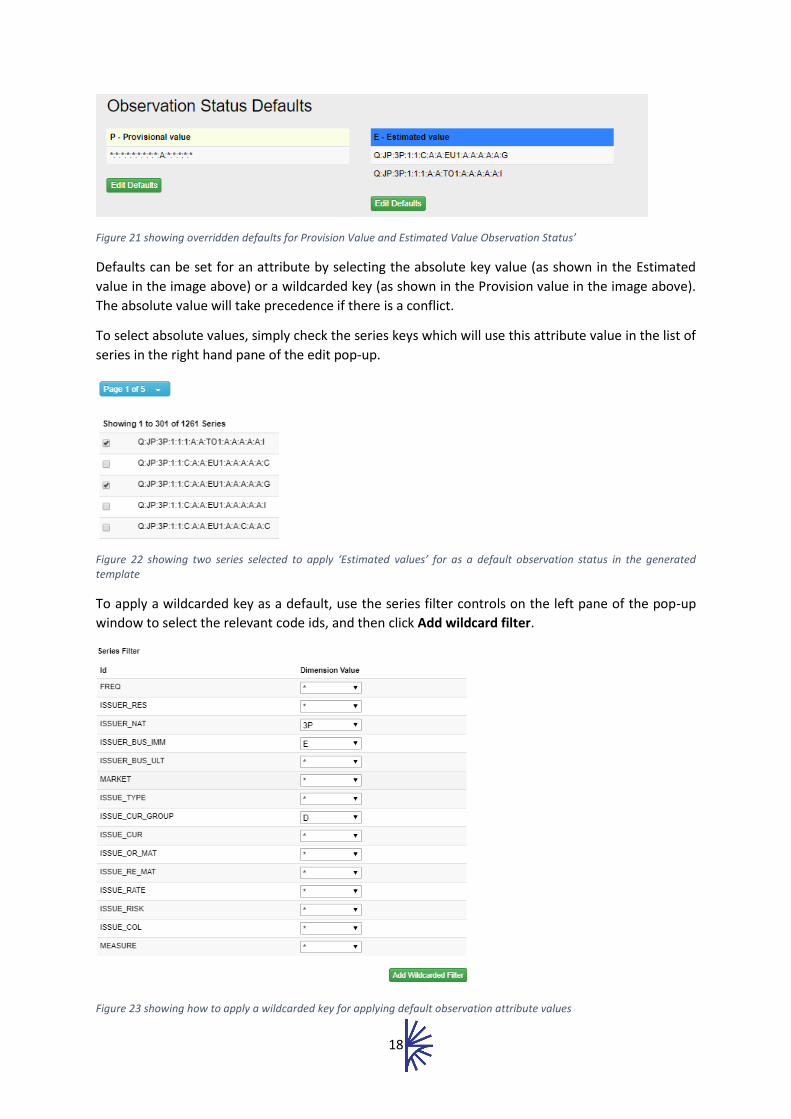
Figure 21 showing overridden defaults for Provision Value and Estimated Value Observation Status’
Defaults can be set for an attribute by selecting the absolute key value (as shown in the Estimated
value in the image above) or a wildcarded key (as shown in the Provision value in the image above).
The absolute value will take precedence if there is a conflict.
To select absolute values, simply check the series keys which will use this attribute value in the list of
series in the right hand pane of the edit pop-up.
Figure 22 showing two series selected to apply ‘Estimated values’ for as a default observation status in the generated template
To apply a wildcarded key as a default, use the series filter controls on the left pane of the pop-up
window to select the relevant code ids, and then click Add wildcard filter.
Figure 23 showing how to apply a wildcarded key for applying default observation attribute values
19
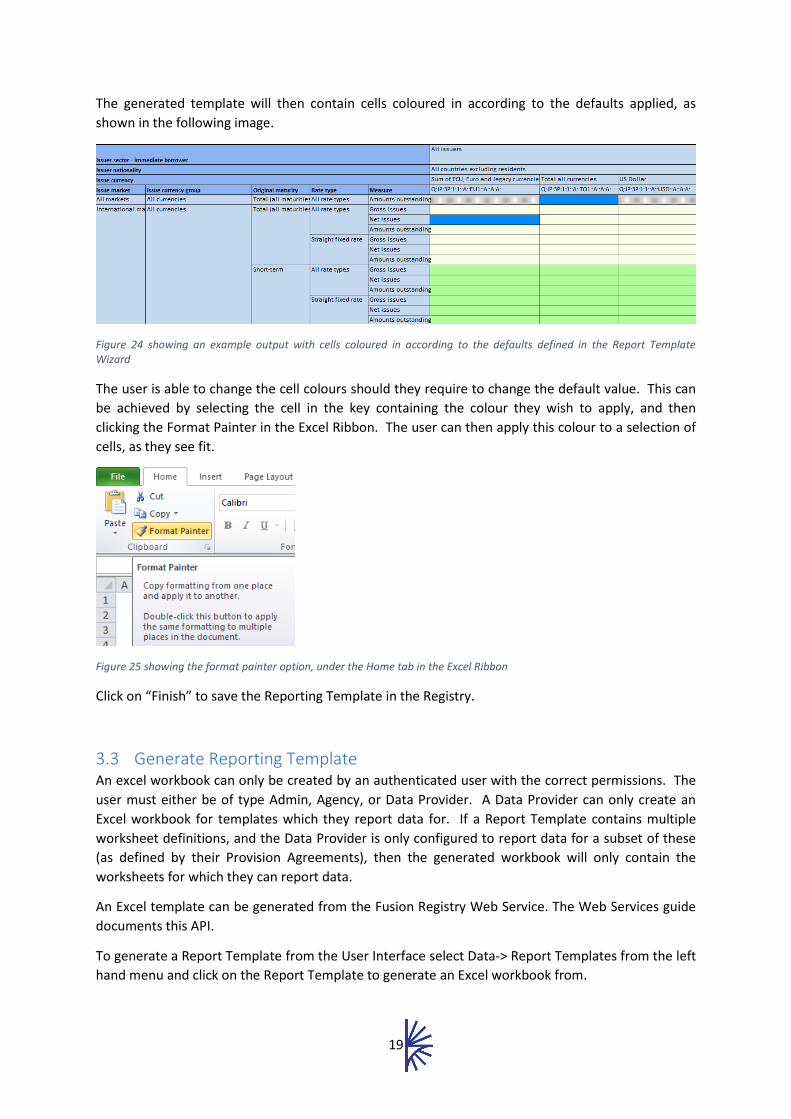
The generated template will then contain cells coloured in according to the defaults applied, as
shown in the following image.
Figure 24 showing an example output with cells coloured in according to the defaults defined in the Report Template Wizard
The user is able to change the cell colours should they require to change the default value. This can
be achieved by selecting the cell in the key containing the colour they wish to apply, and then
clicking the Format Painter in the Excel Ribbon. The user can then apply this colour to a selection of
cells, as they see fit.
Figure 25 showing the format painter option, under the Home tab in the Excel Ribbon
Click on “Finish” to save the Reporting Template in the Registry.
3.3 Generate Reporting Template An excel workbook can only be created by an authenticated user with the correct permissions. The
user must either be of type Admin, Agency, or Data Provider. A Data Provider can only create an
Excel workbook for templates which they report data for. If a Report Template contains multiple
worksheet definitions, and the Data Provider is only configured to report data for a subset of these
(as defined by their Provision Agreements), then the generated workbook will only contain the
worksheets for which they can report data.
An Excel template can be generated from the Fusion Registry Web Service. The Web Services guide
documents this API.
To generate a Report Template from the User Interface select Data-> Report Templates from the left
hand menu and click on the Report Template to generate an Excel workbook from.

20
Click on “Generate Template”
Select the Data Provider, enter the Report Period and click on “Generate”. Note that the Reporting
Period must use the valid syntax for dates in SDMX. Examples are:
21
4 Validation and Transformation Validation and Transformation for Excel workbooks is consistent with any other data format. The
Fusion Registry is able to transform an Excel Workbook into any of the supported output formats
(SDMX,EDI, CSV for example) using the Transformation web services, or via the Data Load function in
the User Interface. The same validation rules are used to check conformance as for all other data
formats (ensure the data is valid with regards to what is reported, ensure all attributes are present).
If a Validation Schemes have been created, then these additional mathematical expressions will also
be used in validation, which is consistent with any other data format.
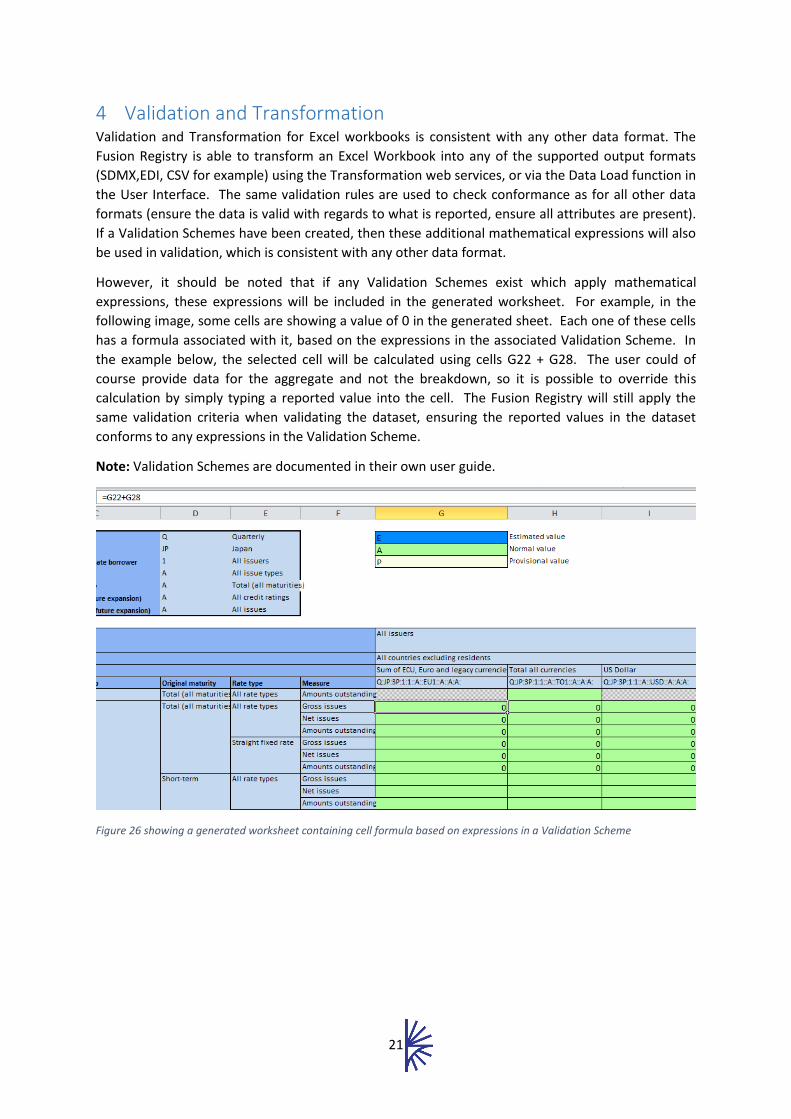
However, it should be noted that if any Validation Schemes exist which apply mathematical
expressions, these expressions will be included in the generated worksheet. For example, in the
following image, some cells are showing a value of 0 in the generated sheet. Each one of these cells
has a formula associated with it, based on the expressions in the associated Validation Scheme. In
the example below, the selected cell will be calculated using cells G22 + G28. The user could of
course provide data for the aggregate and not the breakdown, so it is possible to override this
calculation by simply typing a reported value into the cell. The Fusion Registry will still apply the
same validation criteria when validating the dataset, ensuring the reported values in the dataset
conforms to any expressions in the Validation Scheme.
Note: Validation Schemes are documented in their own user guide.
Figure 26 showing a generated worksheet containing cell formula based on expressions in a Validation Scheme