fusion financial reporting and analysis proof of concept
TRANSCRIPT

Proof of Concept 1 Financials: Fusion Financial Reporting
Financials: Fusion Financial Reporting


Proof of Concept 1 Financials: Fusion Financial Reporting
Fusion Financial Reporting
Highlighted Features
Immediate, integrated access to financial and management reports without the need for concurrent programs or batch jobs
Runtime prompts and expansions for instant access to current, relevant data at any level in your accounting hierarchy.
Drag and drop object-based report creation with advanced formatting and formulas for high-quality multi-dimensional reporting
Wide variety of report output formats: HTML, PDF, Excel-Query Ready (i.e. Smart View ready), Excel formatted. You can also readily export the report output as a Word document or Powerpoint presentation.
Drill to underlying transactions in General Ledger. Login details: For this activity, we will be using the Fusion Applications environment RUP2 ST2 CDRM development environment, which is accessed by the following link-
Home Page: http://fusionsystemtest-p-internal-fs.us.oracle.com/homePage/faces/AtkHomePageWelcome
Login: FINUSER15 to FINUSER30 (i.e. FINUSER15, FINUSER18, FINSUSER30 etc.) Password: Welcome1 (case sensitive) Please avoid FINUSER20 as this seems to be a corrupted signon in this system.
After logging in, check that your Data Access Set selection is set to Vision Foods – USA Ledger at the left corner of the screen.

Proof of Concept 2 Financials: Fusion Financial Reporting
Financial Reporting
Running Reports from the Financial Reporting Center The following script guides you through the process for using Fusion Financial Reporting to
deliver financial and management reports to GL users. This introductory flow will make use of an existing financial report that has previously been defined. You will be able to run the report, expand on summarized report amounts, drill on report amounts to the Account Inspector, review balances by parent and detail account values, pivot along different reporting dimensions, and drill down to the transactional detail of the reported balance. This exercise will highlight the features that differentiate Fusion Financial Reporting, including:
Immediate, integrated access to financial and management reports without the need for
concurrent programs or batch jobs
Runtime prompts and expansions for instant access to current, relevant data at any level in your accounting hierarchy.
1. Select Reporting Center from Navigator panel. Navigation- Navigator > Financial Reporting Center (Under General Accounting section)
2. In the Financial Reports Portlet, select each link as follows: ‘Shared Financials Financial ReportsDemo Reports’

Proof of Concept 3 Financials: Fusion Financial Reporting
This page presents the user with a list of all the Reports and Books that are available to them.
The first tab shows the ‘Live’ online reports – these are interactive reports with a Point of View that are run against real time data.
The second tab shows snapshot reports which have been published (from a previously scheduled Financial Report Batch) for a particular point in time and cannot be changed.
Reports and Books can be published directly in four different ways
HTML
Fully formatted in Excel

Proof of Concept 4 Financials: Fusion Financial Reporting
(a) Click on the ‘VF US–Income Statement’ report, selecting the link or the icon for View in HTML (the one with a globe). You can sort the list of reports by name by clicking the up/down arrows on the column header titled Report or Books. These arrows appear when you focus your cursor on the column header.
(b) When the report runs, you will be presented with a Prompt window where you choose the
Company segment value for running the report. Click on the Member Selection icon. (If you do not get the prompt window, please check that you have pop-up blocker disabled from Firefox Tools-> Options -> Content)
(c) Click to expand
Company >
[Company].[ALL VF COMPANIES-v1] >
[Company].[ALL VF COMPANIES-v1].[9999] >
[Company].[ALL VF COMPANIES-v1].[9999].[5000] >
[Company].[ALL VF COMPANIES-v1].[9999].[5000].[3000] >
[Company].[ALL VF COMPANIES-v1].[9999].[5000].[3000].[3100]
and then mark the checkbox to select the values 3111 and 3121.
Click the ‘Add to Selected’ icon to move the two new values over to the right hand side of the window.

Proof of Concept 5 Financials: Fusion Financial Reporting
You will see that members are identified by their unique member name, for example …[5000].[3000].[3100] rather than just 3100. This allows the Financial Reporting application to uniquely identify each member if they appear in more than one version of a hierarchy (e.g. tree-v1 and tree-v2), or if the same value is used in multiple dimensions (e.g. if 100 is used as a cost center value and also a product value).
Click OK to close this window. Your prompt for Company will have changed to 3000-Vision Foods USA, 3111-Vision Foods Marketing US, 3121- Vision Foods Sales US. Click OK to run the report.
(d) The report is displayed in your browser window. Remember you can collapse the Task Area pane to the left of the screen if you more space on screen for your working pane.
Across the top of the report pane, you will see a grey band. This is the User Point of View
(POV) for your report (which tracks last used value per user for each ‘dimension’). Before proceeding further with this exercise, please ensure that the User Point of View (POV) is properly set as follows:
AccountingPeriod = Sep-10 (must be set to view balances in the report. Sep-10 is under year 2009 and quarter Qtr4-09)

Proof of Concept 6 Financials: Fusion Financial Reporting
Cost Center = Cost Center
Program = Program
Location = Location
Division = Division
Product = Product
Intercompany = Intercompany
If you need to change a value for the User POV, select the tab along the grey band for that dimension (i.e. AccountingPeriod, Cost Center, etc). The member selector will pop up. Proceed to navigate the tree to find the appropriate value.
A user viewing the report can change the member value for any of the dimensions on the User POV, so they can customize the report data to fit their needs.

Proof of Concept 7 Financials: Fusion Financial Reporting
The User POV dimensions are links, and if you click on them you will pop open the Member Selection window so you can refine the data that appears on the report. Then, this User POV is tracked for each user and every dimension, and always shows the last selected value the next time you run any report (not just this current report) where that dimension is contained in the User POV. This provides efficiencies because for some users they will
always run reports for a particular Company parent or Cost Center parent.
At the top of the report itself is the Grid Point of View (POV). This works like the User POV, except that the Grid Point of View locks the initial value for that report every time you run the report (based on report definition). Grid Point of View allows you to update the value for the current report similar to User POV, but it will not update the last member selected in the User POV settings.
Note: In Financial Reporting terminology, dimensions are each of the segments of your chart of accounts plus other accounting elements such as ledger, currency, accounting period, balance type. Members are the values within each dimension.
NOTE: A dimension can only exist in one place on a report either row, column, page, User POV or Grid POV. Therefore, for a particular report, the User POV represents every dimension that is not in the row, column and page (and Grid POV). In the example
above, Accounting Period, and most of the chart of account dimensions are in the User POV, while Ledger is in the Grid POV. Please note that for other reports you may want to put Ledger User in the POV (or column), lock Cost Center in the Grid POV, and put Division on the column. These actions are all possible with the multi-dimensional reporting available in Financial Reporting.
Again, for Financial Report purposes, a dimension can only exist in one place on the report (row, column, page, User POV or Grid POV)
(One exception to this is that the row, column and page can reference the User POV-in the above example, column=Accounting Period is using the User POV, so that when User POV is updated from Sep-10 to Aug-10, the column is updated. See the example below).
(e) Click on the User POV for Accounting Period. Currently the Accounting Period for the report is Sep-10. The member selection window will pop up. Use it to change the User

Proof of Concept 8 Financials: Fusion Financial Reporting
POV to Aug-10 (it is in Qtr4-09) and click OK.
The report will be redisplayed on your screen using the new point of view. You will see that the report displays data both for Aug-10 and also for Aug-09. When you change the User POV, all report values that are based on that User POV will change accordingly.
Please be aware that when you pop open the Member Selection window for the
Point of View, you should click either OK or Cancel to close it (do not select the button for the window
(f) For this report, the Company dimension is defined at the ‘Page’ level. Therefore, you can move to each page by using the pulldown menu at the top of the report layout to see a new page for a new company segment.
Use the pulldown menu to view the Income Statement report for three companies: 3000, 3111 and 3121 (which were selected in the prompt).

Proof of Concept 9 Financials: Fusion Financial Reporting
You can also change the selection for other dimensions on the Grid Point of View (POV) by
clicking on the linked dimension. Go ahead and change the Currency Type to Total.
Proof of Concept 10 Financials: Fusion Financial Reporting
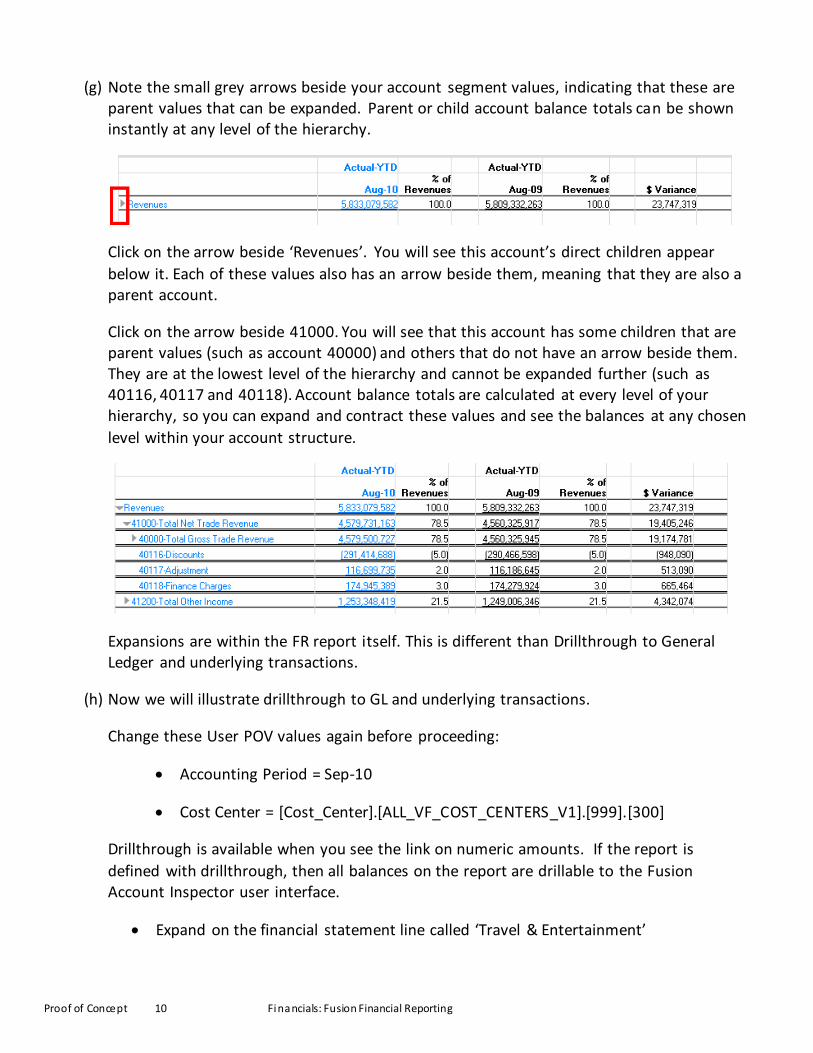
(g) Note the small grey arrows beside your account segment values, indicating that these are parent values that can be expanded. Parent or child account balance totals can be shown instantly at any level of the hierarchy.
Click on the arrow beside ‘Revenues’. You will see this account’s direct children appear
below it. Each of these values also has an arrow beside them, meaning that they are also a parent account.
Click on the arrow beside 41000. You will see that this account has some children that are parent values (such as account 40000) and others that do not have an arrow beside them. They are at the lowest level of the hierarchy and cannot be expanded further (such as 40116, 40117 and 40118). Account balance totals are calculated at every level of your hierarchy, so you can expand and contract these values and see the balances at any chosen
level within your account structure.
Expansions are within the FR report itself. This is different than Drillthrough to General Ledger and underlying transactions.
(h) Now we will illustrate drillthrough to GL and underlying transactions.
Change these User POV values again before proceeding:
Accounting Period = Sep-10
Cost Center = [Cost_Center].[ALL_VF_COST_CENTERS_V1].[999].[300]
Drillthrough is available when you see the link on numeric amounts. If the report is
defined with drillthrough, then all balances on the report are drillable to the Fusion Account Inspector user interface.
Expand on the financial statement line called ‘Travel & Entertainment’

Proof of Concept 11 Financials: Fusion Financial Reporting
Then Expand the parent line called ‘53450-Total Domestic and International
Travel’. Drillthrough on this parent line ’53450’ by clicking on the numeric amount link.
FR drillthrough opens the Account Inspector page (in a new tab or window). The
dimension locations are exactly the same as where they are on the FR report.
Account 53450 is on the row in the Account Inspector
Scenario=Actual is on the column
Accounting Period = Sep-10 is on the column
All other dimensions will be placed on the ‘Page Edge’ in the Account Inspector UI.

Proof of Concept 12 Financials: Fusion Financial Reporting
NOTE: One more example would be that: If Company were on the row in the FR report, and Product were on the column in the FR report, then they would be in the same place on the Account Inspector after drilling from an FR report.
The Account Inspector lets you further analyze the data as required by dragging/dropping dimensions and further expanding where required.
For example:
Drag the Cost Center dimension from the ‘Page Edge’ to the Column. (Put your cursor over the Cost Center dimension, hold the mouse button down, drag this over and drop along the area of the column header.)
Now, expand Cost Center = 300 by clicking the expansion arrow.

Proof of Concept 13 Financials: Fusion Financial Reporting
Further drill down to Detail Balances, journal lines and subledger transactions are available for cells when all dimension members are specified at the lowest level (Level 0) for the row, column and page. You can even drill down to journal lines, SLA accounting, and
subledger transactions from Detail Balances.
Select detail values for the remaining chart of accounts dimension members that are still at set with a parent value:
At the Page level:
Company = [Company].[All Company Values].[3111]
Program = 3611 [Program].[All VF Program Values].[3611]
Location = 1511 [Location].[All Location Values].[1511]
Division = 1121 [Division].[All Division Values].[1121]
Product = 1311 [Product].[All Product Values].[1311]
Intercompany = 0000 [Intercompany].[All Intercompany Values].[0000]

Proof of Concept 14 Financials: Fusion Financial Reporting
Cost Center (at the Column Level) = 312
Account (expand 53450 and its child 53430 at the Row level to select this child account value) = 53431
Click the Refresh button on the Page Level Dimensions window to apply the new dimension members selected.
For the amounts where the dimension members are set at the lowest level, these are highlighted and available for drillthrough.
The drillthrough will go to the Detail Balances page for account 3111-312-3611-1511-53431-1121-1311-0000, with the periodic Beginning Balance, Period Activity and Ending Balance information displayed for the account. The amounts on the Period Activity column are linked for further drillthrough. Click on the Sep-10 Period Activity amount and the drillthrough will go to the
journal details that make up that period’s activity.

Proof of Concept 15 Financials: Fusion Financial Reporting
Had the transaction originated from a subledger such as Payables or Receivables, the drillthrough can go even further to the subledger accounting journal entry and the
originating subledger transaction.
(i) Return to the Vision Foods US Income Statement report window. Before we move to the next report, we will change the User POV for a dimension. Change the Cost Center dimension member to [Cost_Center].[ALL_VF_COST_CENTERS_V1].[999].[500]. By doing this, we will see how User POV members will then default to the next report.

Proof of Concept 16 Financials: Fusion Financial Reporting
NOTE: The report has now been updated to Cost Center 500 (tree vers ion 1).
(j) Click Done on the report page to return to the Financial Reporting Center page. Now select the ‘VF US – Rolling 12 Month Income Statement’ and select the icon to view this report in HTML.
Leave the prompt as the default value 3000-Vision Foods USA
The User POV values default from the last setting on the previous report.
This report has been designed to report on periods for the 12 months up to the selected period, this period range has been defined using a Function in FR Studio. The range has

Proof of Concept 17 Financials: Fusion Financial Reporting
been defined relative to the report User POV, meaning it will change if the User POV for the report changes.
In the User POV, change the accounting period from Sep-10 to Aug-10. The range of months for the report will change.
(k) If you scroll to the bottom of this report, you will see that it also has an embedded graph showing the data trend across those 12 months. As you change the Point of View for the report, the graph will also change.
This time, change the Cost Center Point of View. This member is currently showing Cost Center 500. Change it so that the report is showing information for Cost Center 300.
If you take another look at the graph, you will see that it has been updated to reflect the
new values in the report.
The graph also changes to reflect expansions of your data in the report.
Click on expansion for ‘Material Costs’. You will see the child values open up in the report.
If you now scroll down to the graph, you will see that it has also been updated to include
these child values.

Proof of Concept 18 Financials: Fusion Financial Reporting
(l) Once you have had the chance to look at this report, click Done to return to the Financial Reporting Center page.
You are now going to run a report that compares the cost center structure from before and after an organizational restructuring. This is done by placing two grids on the same report so that the user can see two different tree versions on the same report.
Choose ‘VF US-Cost Center Expenses by Tree Version’ and run it in HTML
NOTE: You may have to change the User POV value back to Sep-10 and to the highest level for the chart of account dimensions (Company=Company, Program=Program, etc.)

Proof of Concept 19 Financials: Fusion Financial Reporting
Expanded:
This report allows you to compare different account balances for specified cost centers prior to the restructuring and afterwards. For example, the Corporate Office expenses appear to have decreased, but this report helps you to analyze this change and see that costs have not decreased. They have simply been moved. Cost Center 540 Distribution Operations moving out of the 500 Corporate Office hierarchy and into 600 Warehouse Operations has caused the change.
As shown in this example, you can have different versions of trees, which enables date-
effective hierarchies for reporting. You can report on past, present or future hierarchies for trend analysis and what-if reporting
Click Done to return to the Financial Reporting Center page.

Proof of Concept 20 Financials: Fusion Financial Reporting
Creating Reports in FR Studio
The following script guides you through the process of using FR Studio to define a financial report. This introductory flow will show you how quickly you can create a simple income statement and highlight the key features of the report designer, including drag and drop object-based report creation with advanced formatting and formulas for high-quality multi-dimensional reporting.
1. Launch FR Studio from the icon on your desktop and login into the system.
User ID: FINUSER15 to FINUSER30 (i.e. FINUSER15, FINUSER20, FINSUSER30 etc.)
Password: Welcome1 (case sensitive)
Server: https://fusionsystemtest-p-external-bi.us.oracle.com/
Log into the system when prompted.
Choose File > New > Report from the menu bar.
2. The Report Creation window opens up.
Proof of Concept 21 Financials: Fusion Financial Reporting
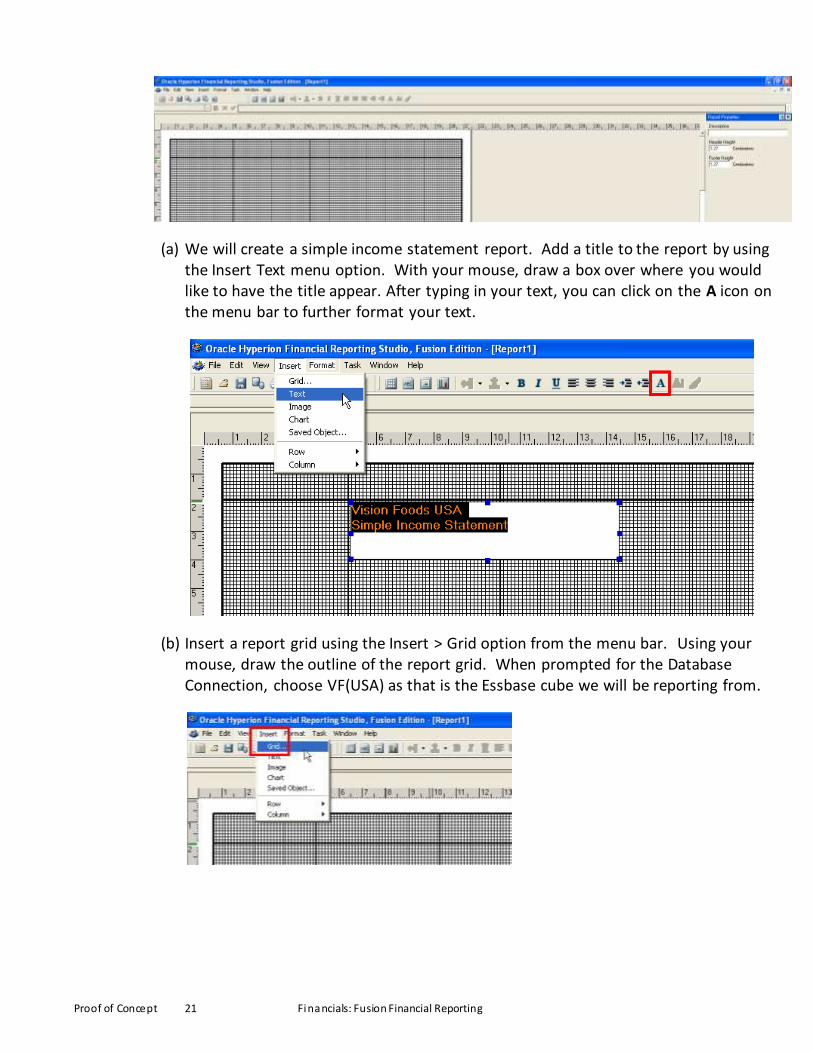
(a) We will create a simple income statement report. Add a title to the report by using the Insert Text menu option. With your mouse, draw a box over where you would like to have the title appear. After typing in your text, you can click on the A icon on the menu bar to further format your text.
(b) Insert a report grid using the Insert > Grid option from the menu bar. Using your mouse, draw the outline of the report grid. When prompted for the Database Connection, choose VF(USA) as that is the Essbase cube we will be reporting from.

Proof of Concept 22 Financials: Fusion Financial Reporting
(c) The Dimension Layout window will appear. This is where you set the general outline of the report by indicating what dimensions go into the Pages, Columns and Rows of the report.
From the Point of View selections, drag and drop the following dimensions accordingly using the little icon next to each of the dimension names, then click OK to close the window and apply the layout. Each dimension can only be placed once into the Page, Column or Row of the layout.
Pages: Company
Columns: Scenario, Accounting Period
Rows: Account
The remaining dimensions stay in the Point of View in the report layout.

Proof of Concept 23 Financials: Fusion Financial Reporting
(d) The report layout is created on the grid, with the dimensions displayed as selected.
We will add additional rows to the report to include one for Revenue, Expense and Net Income.
Row 1 already appears on the report layout. Let us use this for the Revenue line.
Position your cursor along the bottom of the table to add a row above this. Choose
Insert > Row > Text from the menu to add a visual break between each line of the income statement.
For the Expense line, choose Insert > Row > Data from the menu. We will be selecting Account dimension members for this row.
For the Net Income line, choose Insert > Row > Formula from the menu. We will be creating a formula for this row.

Proof of Concept 24 Financials: Fusion Financial Reporting
(e) Click on the topmost empty cell in the left corner on the grid to select it entirely.
The Grid Properties panel will appear on the right. Property settings made here will apply for the whole grid at the page, columns and rows levels wherever those same properties are also applicable. Let us set some of the General properties for the
grid.
Choose Alias: Default for the Headings to display the dimension members aliases or descriptive names.
Enable the Grid Point of View so that users can change the Page level dimension member selection when they run the report.
Enable Drill Through so that you can drill on amounts on the report output.

Proof of Concept 25 Financials: Fusion Financial Reporting
For the Suppression option, which is the next category of Grid Properties, choose the option ‘If Missing, Suppress’ under Basic Options section to keep your reports from becoming too long or confusing users with pages of missing values.
(f) Next, we will select what dimension members should be selected for each of the dimensions. We will also apply some formatting options.
At the Page level where we have set the Company dimension, click on the Pages label to bring up the member selector window. Expand the item Company- All VF Companies-V1 > 9999 > 5000 > 3000 > 3100. Select 3100, 3111 and 3121 and add
this to the right panel. Remove Company from the right panel. Click OK. We will limit this income statement to report on parent company value 3100, and its children, 3111 and 3121.
Proof of Concept 26 Financials: Fusion Financial Reporting
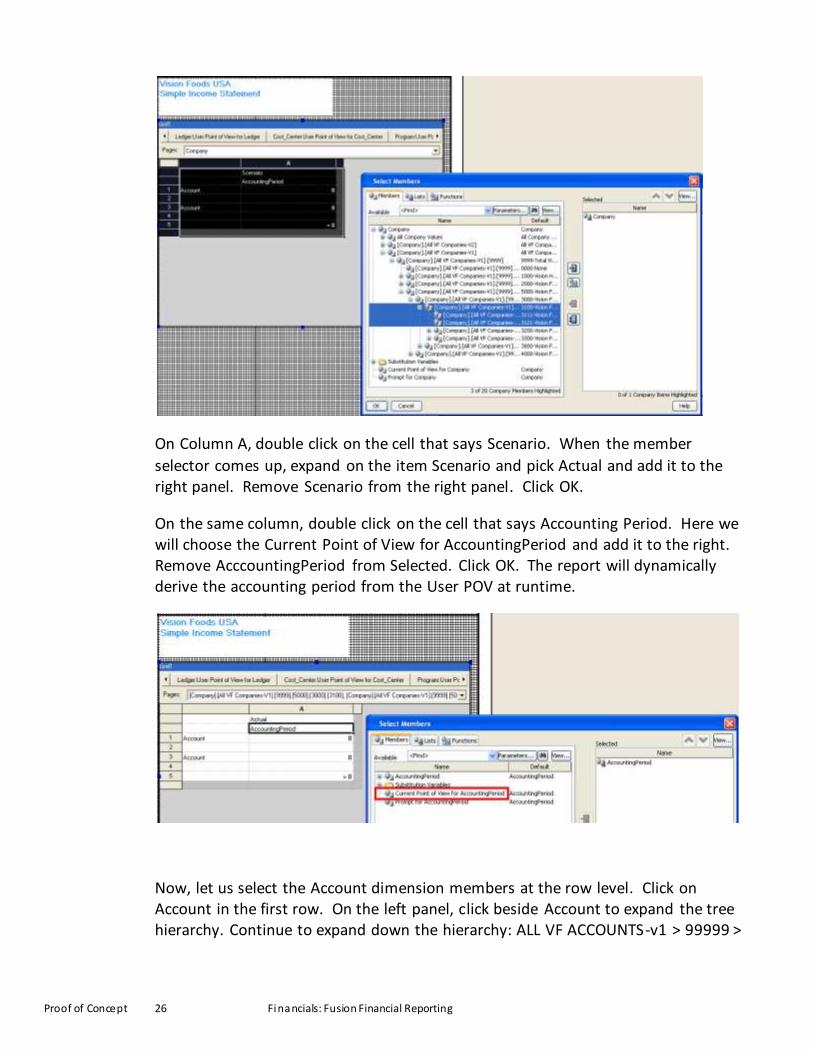
On Column A, double click on the cell that says Scenario. When the member
selector comes up, expand on the item Scenario and pick Actual and add it to the right panel. Remove Scenario from the right panel. Click OK.
On the same column, double click on the cell that says Accounting Period. Here we will choose the Current Point of View for AccountingPeriod and add it to the right. Remove AcccountingPeriod from Selected. Click OK. The report will dynamically derive the accounting period from the User POV at runtime.
Now, let us select the Account dimension members at the row level. Click on Account in the first row. On the left panel, click beside Account to expand the tree hierarchy. Continue to expand down the hierarchy: ALL VF ACCOUNTS-v1 > 99999 >

Proof of Concept 27 Financials: Fusion Financial Reporting
REV. Select REV and add it to the selection, and remove Account. The account REV is the top level of all the revenue accounts in the Account hierarchy.
In the Heading Row Properties at the right of the screen, enable Allow Expansion. This will allow users to expand on a parent account value on the report.
Next, click on the second row with Account to open up the member selector. On the left panel, click beside Account to expand the tree hierarchy. Continue to expand down the hierarchy: ALL VF ACCOUNTS-v1 > 99999 > EXP. Select EXP and add it to the selection, and remove Account. The account EXP is the top level of all
the expense accounts in the Account hierarchy. In the Heading Row Properties, enable Allow Expansion.
Revenue accounts generally have credit balances, and expense accounts debit balances. By default, credits are displayed as negative amounts and debits as positive amounts. To improve the readability of the report, formatting can be applied to switch the amount signs on this income statement report.
Highlight Column A on the report layout and do a right mouse click. Choose the Format option and a Format Cells window will appear. In the Number tab, under the Positive Number Symbols section, choose a Prefix of ‘[‘ and a Suffix of ‘].’ Under the Negative Number Symbols section, choose a Prefix and Suffix ‘None.’ This number formatting will be applied to the entire column.
(g) We need to include a formula for the last line to calculate Net Income. In the last
line of the report, click on the cell where the # sign appears. Type in ‘[1] + [3]’ (leave a space before and after the + sign to indicate that it is a mathematical operator) along the data entry field at the top of the page. The ‘Sum’ function is already defaulted. Click on the check mark icon to validate your formula entry.

Proof of Concept 28 Financials: Fusion Financial Reporting
You can also type in a label of ‘Net Income’ for this line by applying a Custom Heading in the Cell Properties panel.
(h) Save this FR report definition to your own folder by choosing the File > Save As option on the menu. Give your report a name and save it under the My Folders > FINUSERX folder in the folder directory. If you do not see a FINUSERX folder in the My Folders directory, go ahead and just create a new folder.
Note that there are two folders that come up in the file directory- Shared Folders and My Folders. The Shared Folders directory contents are available to all users
while the My Folders directory is a private one whose contents are available only to your specific signon.
(i) You can get a rough preview of your report by choosing the File > Print Preview option on the toolbar menu. However, you will not be able to expand or drill on your report from here. Instead, go back to Financial Reporting Center work area in
Fusion Applications and run your report from there as we have done in the earlier activity. Locate the folder where you have saved your report under My Folders and run your report.
Check the User POV settings are set as follows to get the proper data for your report:

Proof of Concept 29 Financials: Fusion Financial Reporting
AccountingPeriod = Sep-10
Ledger = Vision Foods – USA Ledger
Cost Center = Cost Center
Program = Program
Location = Location
Division = Division
Product = Product
Intercompany = Intercompany
Balance Amount = Balance Amount
Amount Type = Amount Type
Currency = USD
Currency Type = Total
The report will run for Sep-10, the accounting period that was set for this User POV dimension.
At the page level, you can switch from Company 3000 to 3111 or 3112 and view the
respective income statements of these companies.
You can expand on the top level accounts Total Revenue and Total Expenses to sequentially see a more detailed breakdown of these parent accounts. You can also drillthrough on the report amounts as you have done with the other report in the earlier exercise.

Proof of Concept 30 Financials: Fusion Financial Reporting

Proof of Concept 31 Financials: Fusion Financial Reporting
Additional Report Definition Examples
If you wish to further explore defining FR reports, the following are additional report definitions that you can review in more depth using FR Studio.
1. Open up the following report file and make a copy for yourself that you can edit by saving it to your own FINUSERX folder.
Shared Financials Financial ReportsDemo ReportsVF US – Income Statement
Immediately save a copy of this report definition for yourself under:
My Folders FINUSERX VF US – Income Statement FINUSERX
This is the definition of the first report viewed in the earlier exercise and this is a copy you can now edit.
2. The report definition comes up in the Report Creation window. The title of the report
has been placed at the top of the page. Beneath this is a grid that contains the data for the report.
(j) The page header and footer are separated by a line. Click into the page header and select Insert > Text from the menu. A text box will appear, and in the Text Properties on the right of the screen choose ‘Insert Function’. From the list of functions, choose ‘Page’ and click the Add icon to add it to the Selected Function list. This will add
page numbering to your report. You can also add either fixed text or text functions to your report.
(k) Click on the top left cell of the grid to select the entire grid. The window of the right -hand side of the screen will now display Grid Properties. This allows you to control the general layout of your report data.

Proof of Concept 32 Financials: Fusion Financial Reporting
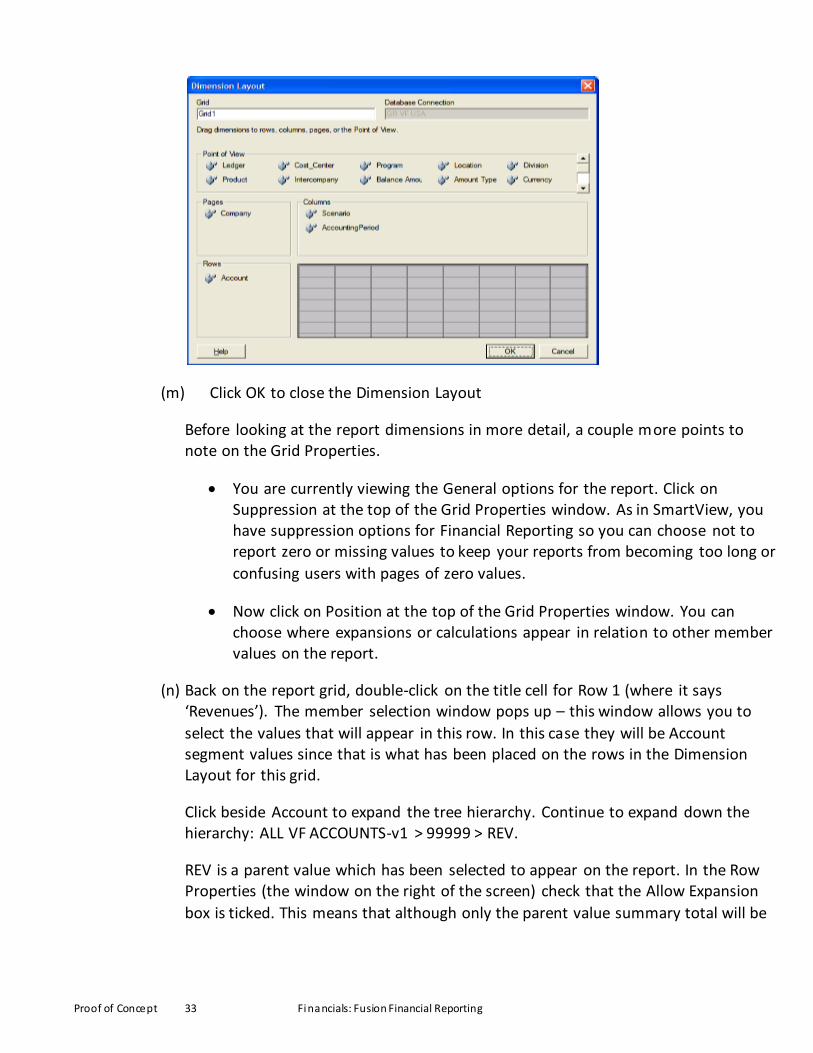
(l) First select Dimension Layout. When you create a new report from scratch, the Dimension Layout is the first design step. With it you control which dimensions of your accounting structure appear in which places in your report.
In this report:
The Account segment will be shown in the rows of the report
The Accounting Period will be shown in columns along the top of the report
The Company will be at the page level of the report
If you do not specify where to place the other dimensions, they remain at the User POV level of the report.
You can also perform multi-dimensional reporting by placing more than one dimension in the rows or columns of the report.
Proof of Concept 33 Financials: Fusion Financial Reporting
(m) Click OK to close the Dimension Layout
Before looking at the report dimensions in more detail, a couple more points to note on the Grid Properties.
You are currently viewing the General options for the report. Click on Suppression at the top of the Grid Properties window. As in SmartView, you have suppression options for Financial Reporting so you can choose not to report zero or missing values to keep your reports from becoming too long or
confusing users with pages of zero values.
Now click on Position at the top of the Grid Properties window. You can choose where expansions or calculations appear in relation to other member values on the report.
(n) Back on the report grid, double-click on the title cell for Row 1 (where it says ‘Revenues’). The member selection window pops up – this window allows you to
select the values that will appear in this row. In this case they will be Account segment values since that is what has been placed on the rows in the Dimension Layout for this grid.
Click beside Account to expand the tree hierarchy. Continue to expand down the hierarchy: ALL VF ACCOUNTS-v1 > 99999 > REV.
REV is a parent value which has been selected to appear on the report. In the Row Properties (the window on the right of the screen) check that the Allow Expansion
box is ticked. This means that although only the parent value summary total will be

Proof of Concept 34 Financials: Fusion Financial Reporting
displayed on the report, you will be able to expand on this value during report runtime (if you run the report as HTML) in order to see the child values.
Use the Add and Remove arrows to add 41000, 41100 and 41200 to the member selection, and remove REV. Click OK to close the member selection window.
When you select multiple members, the values all appear on one line of the grid, this is known as a “fat row”. However these will be printed as three separate rows
at report runtime.
Select File > Print Preview from the menu if you want to see this demonstrated.
Let’s say you wanted to apply different formatting to the Intercompany revenue accounts (account 41100 and its children) to identify them more easily in the Income Statement. This account value would need to appear on a different line in order to have different formatting applied.
Double-click on Row1 (where it says 41000, 41100, 41200) again. At the bottom right of the member selection window is a checkbox ‘Place selections into separate rows’. Check this box and click ok to close the window – see that the values are now on separate lines in the grid.

Proof of Concept 35 Financials: Fusion Financial Reporting
Now select the row for 41100 (Row2) and click on the A icon in the menu to pop up the Format Cells window. You can choose how to format numbers, font styles and colors, borders and shading etc.
Change the formatting so Intercompany revenue amounts in Account 41100 are displayed in grey italics.
(o) Lower down the grid, Row15 shows Total Operating Expenses. Instead of being a data row, this is a calculation row. Click on the cell in Row15, Column A. At the top of the screen you can see the definition of this calculation. In this case, it is a simple sum of the rows above, but take a look in the pull down list which currently says Sum() to see the different calculation types available: averages, counts, percentages, variances – a rich set of functions to choose from for your reporting.
Because we altered the REV row of the original report to now be three rows, we also need to alter any calculations that reference this (usually it would be better to wait and define your calculation rows / columns once you know you have all your data in place). Row-Income Before Income Taxes is calculated as Revenues Less Expenses. Click on Income Before Taxes and Column A to check the calculation used.
Update the calculation to be [1]+ [2]+ [3]+ [14]
Pay attention to the spaces in the formula. Leaving a space after a +/- sign indicates that it is an operator in the formula, rather than changing the sign of the member it precedes.
Once you have typed in the new formula, click the Check to validate the formula (if you do not validate it, it will not apply the calculation to that cell)
In the same way, change the formula for Column D.
(p) Now you’re going to take a look at the Accounting Period, displayed in the columns of the report.
Double click on the header cell for Column A (where it says Current Point of View for Accounting Period). The Member Selection window pops open, showing that the Accounting Period value in the report is based on the Current Point of View selected

Proof of Concept 36 Financials: Fusion Financial Reporting
by the user – that is, it is a variable that can be selected by the user when they open the report.
Column D is also variable based on the Current Point of View. Double click the header cell for Column D to see how it has been defined. In this case, column D is not a straightforward value, but is a function. Click on the Functions tab to review
the different types of functions available.
Functions allow you a wider choice of selecting data dynamically using parameters based on other members. For example, you can use functions to select the members at the bottom of a hierarchy, the top of a hierarchy, or on the same level.
For Accounting Period, we are using the Relative Member function which will select a value offset either forwards or backwards from the specified member.
Double click on the selected member name (called Relative to Current Point of View for Accounting Period). This displays the function definition as an offset of -13 from the Current Point of View for Accounting Period. As there are 13 periods in the Vision Foods US calendar, this column will contain the values for the year prior to the year selected. So if August-10 is chosen as the Point of View for this report, that will be the value shown in Column A. Column B will show values for August-09.
Click Cancel to close the window.
Functions were also used to define the Rolling 12 Month Income Statement you saw when running reports earlier in the exercises.
Make a copy for yourself by saving it to your own FINUSERX folder.
My Folders FINUSERX Rolling 12 Month Income Statement FINUSERX
A Relative to Current Point of View function was used as the Start Member and End Member of a Range function in order to select the current and 12 previous months
for the report, meaning that these 12 columns on the report output could all be defined within a single report column in the designer. The screenshots below illustrate how this was done.

Proof of Concept 37 Financials: Fusion Financial Reporting

Proof of Concept 38 Financials: Fusion Financial Reporting
3. Earlier this exercise, you saw that the Accounting Period for this report is determined using a function based on the Point of View.
(a) All the reporting dimensions that were not placed on a row, column or page level
when the Dimension Layout was originally defined (as you saw earlier in this exercise) remain within the Point of View for the report. These Point of View dimensions are displayed in a grey bar along the top of the report.
(b) You might want to specify a default Grid Point of View value to be used for a dimension, to make it faster for users running the report.

Proof of Concept 39 Financials: Fusion Financial Reporting
Click on the Point of View for AccountingPeriod. The Select Members window will pop up and you can drill through the Accounting Period hierarchy to choose a default value. Select Jul-10 as the default (it is in Qtr4-09).
There are defaults also set for dimensions such as Ledger and Currency. But you will notice that some others do not have a default, such as Cost Center. If no specific
value is selected as a default (in Grid POV), the current User POV setting is shown.
(c) Earlier in this session you will have seen how the Point of View appears in your report when it is distributed to end users. When a report is run in HTML the grey panel along the top shows the Point of View.
(d) The Dimension Layout contained four areas – you have now looked at the first three: rows, columns and Point of View. The fourth is the Page level. When this report was defined, the Company dimension was placed on the page level.
Company has been set up as a prompt, so each time a user runs the report they will be asked to choose a value for Company.
In the grid, click at the top where it says Pages: Prompt for Company.

Proof of Concept 40 Financials: Fusion Financial Reporting
The Select Members window pops up. You can see that the selected member is Prompt for Company. It is one of the values available to choose from the member list and does not require a function to create it.
Go ahead and change the selection from Prompt for Company to Current Point of
View for Company so that you can see the window discussed in the next paragraph. Click OK to close the Select Members window. Click on Page again to bring up the member selector back to Prompt for Company. Click OK to close the window.
Behind it is another window for Define Prompts. In this window you can enter the title for the prompt, its default value, and the choices list which users can pick from. For the Default Member, choose the following:
[Company].[ALL VF COMPANIES-v1].[9999].[5000].[3000]
For the Member Labels in Prompt Selection Dialog, select Alias.
1
2

Proof of Concept 41 Financials: Fusion Financial Reporting
Prompt vs User Point of View
You can define functions based upon the User Point of View for greater flexibility of reporting data.
The User Point of View can be changed from within the report and it will instantly re-run against live data, making reporting more up-to-date.
Users can run reports based on their preferred defaults (with User Point of View), making it easier to get relevant information quickly.
Prompts appear before the report, allowing you to run reports for multiple dimension members split across multiple pages whereas User Point Of View is for a single member at a time.
4. Now you have finished looking at the way a report is created in FR Studio, save your report in your own FINUSERX directory and return to the Fusion Financial Reporting
Center page to view your report in HTML mode, to see again how the Prompt, User Point of View, Relative to Point of View function, and Expansion will all appear at report runtime.
This concludes the exercises for Financial Reporting.