further development and application of the cmaq ozone and particle precursor tagging methodologies...
TRANSCRIPT

Further Development and Application of the CMAQ Ozone and Particle Precursor Tagging Methodologies (OPTM & PPTM)
7th Annual CMAS ConferenceChapel Hill, NC
6-8 October 2008
Presented by Sharon Douglas ICF International, San Rafael, CA

Co-Authors:
Tom Myers Yihua Wei Jay Haney Tom Braverman,
ICF
EPA OAQPS

Presentation Outline
Overview of CMAQ/OPTM & PPTM source attribution methods
Application of CMAQ/OPTM & CMAQ/PPTM to support ozone & PM2.5 designations (example for Milwaukee)
Application of CMAQ/PPTM to characterize CAAA-related reductions in PM2.5 for cost/benefit analysis
Next steps

OPTM & PPTM: General Concepts
Emissions (or IC/BC) species are tagged in the input files and continuously tracked throughout the simulation
Tags can be applied to source regions, source categories, individual sources, and/or IC/BCs
Tagged species have the same properties and are subjected to the same processes (e.g., advection, chemical transformation, deposition) as the actual species

OPTM & PPTM: General Concepts
OPTM species include ozone, NOx & VOC
PPTM species include PM-related S, N, SOA, POC, EC & other inorganic particulates*
Base simulation results not affected by tagging
OPTM & PPTM quantify the contribution of tagged sources to simulated species concentrations & deposition
*PPTM has also been implemented for mercury

Implementation of OPTM for CMAQ (Overview(1))
Total emissions of both NOx and VOC from the desired sources or source categories are tagged (e.g., NOx_t1, NOx_t2, VOC_t1, VOC_t2)
Oxidant tracers (OXN_t1, OXV_t1, OXN_t2, OXV_t2) correspond to the oxidant produced from NOx & VOC for each tagged category
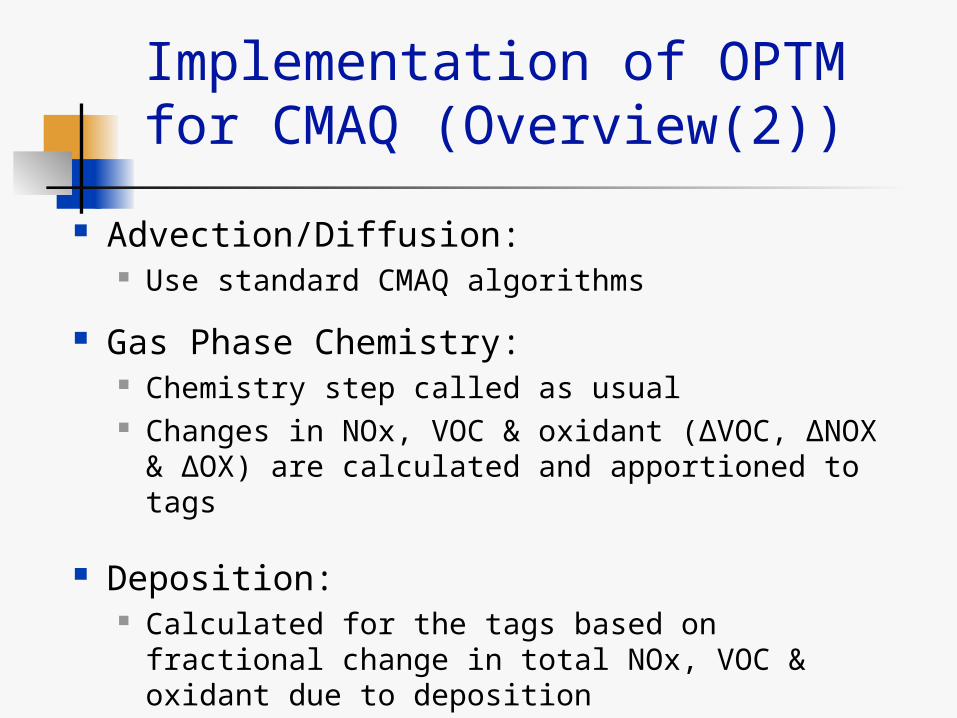
Implementation of OPTM for CMAQ (Overview(2))
Advection/Diffusion: Use standard CMAQ algorithms
Gas Phase Chemistry: Chemistry step called as usual Changes in NOx, VOC & oxidant (ΔVOC, ΔNOX
& ΔOX) are calculated and apportioned to tags
Deposition: Calculated for the tags based on fractional
change in total NOx, VOC & oxidant due to deposition

Implementation of PPTM for CMAQ (Overview)
Within CMAQ, tagging is accomplished by adding duplicate species (e.g., ANO3_t1, ANO3_t2)
More than 50 (gas & aerosol phase) species per tag required to track total PM2.5 (e.g., for nitrogen: ANH4I, ANH4J, ANO3I, ANO3J, NO, NO2, NO3, N2O5 …)
Key considerations/assumptions: Linear processes simulated directly Potentially non-linear processes calculated for total
species and apportioned to tags
PPTM can also be used to estimate contributions to N and other forms of deposition

Application of CMAQ/OPTM & PPTM for the Milwaukee Area
Objective: To identify the source regions that potentially contribute to high ozone and high PM2.5 concentrations in the Milwaukee, WI area
Specs: Regional-scale modeling domain 2002 base year; limited simulation periods (1
month for ozone; 4 months for PM2.5) 13 tagged source regions (county level)

Application of CMAQ/OPTM & PPTM for the Milwaukee Area:
Domain
12-km resolution
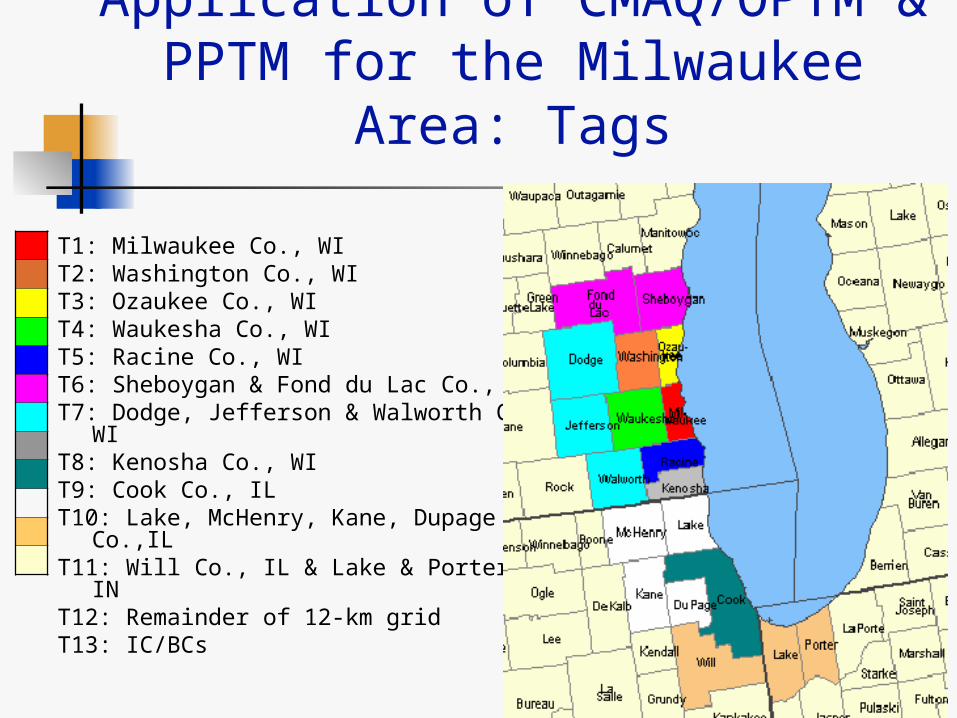
Application of CMAQ/OPTM & PPTM for the Milwaukee Area:
Tags
T1: Milwaukee Co., WIT2: Washington Co., WIT3: Ozaukee Co., WIT4: Waukesha Co., WIT5: Racine Co., WIT6: Sheboygan & Fond du Lac Co., WIT7: Dodge, Jefferson & Walworth Co., WIT8: Kenosha Co., WIT9: Cook Co., ILT10: Lake, McHenry, Kane, Dupage Co.,ILT11: Will Co., IL & Lake & Porter Co., INT12: Remainder of 12-km gridT13: IC/BCs

CMAQ/OPTM Results for the Milwaukee Area: NOx
Average Contribution to Maximum 8-Hour Ozone
Tag 1: Milwaukee Co. Tag 9: Cook Co. Tag 10: 4 Other IL Co.

CMAQ/OPTM Results for the Milwaukee Area: VOC
Average Contribution to Maximum 8-Hour Ozone
Tag 1: Milwaukee Co. Tag 9: Cook Co. Tag 10: 4 Other IL Co.

CMAQ/OPTM Results for a Monitoring Site: NOx & VOC
CMAQ/OPTM Contributions to 8-Hr Ozone for Milwaukee: NOx & VOC
0
20
40
60
80
100
T1 T2 T3 T4 T5 T6 T7 T8 T9 T10 T11 T12 T13 Total
pp
b
NOx VOC
Milwaukee Bayside
Milwaukee Co. 12-km grid
IC/BCs
Average Contribution to Maximum 8-Hour Ozone

Summary CMAQ/OPTM Results for All Monitoring Sites: NOx &
VOCSummary of CMAQ/OPTM NOx Contributions to 8-Hr Ozone for Milwaukee: High Ozone Days
0
10
20
30
40
50
KPP MCHC MDNR MUWM MBYS OGFT OHBP RAPC WSLG WCLV
pp
b
Milwaukee Co. Other Tagged WI Counties Tagged IL & IN Counties Remainder of 12-km Grid IC/BCsSummary of CMAQ/OPTM VOC Contributions to 8-Hr Ozone for Milwaukee: High Ozone Days
0
10
20
30
40
50
KPP MCHC MDNR MUWM MBYS OGFT OHBP RAPC WSLG WCLV
pp
b
Milwaukee Co. Other Tagged WI Counties Tagged IL & IN Counties Remainder of 12-km Grid IC/BCs

CMAQ/PPTM Source Region & Species Contributions to Avg PM2.5 for Milwaukee
0
2
4
6
8
T1 T2 T3 T4 T5 T6 T7 T8 T9 T10 T11 T12 T13
ug
/m3
SO4 NO3 NH4 POA PEC Other Primary PM2.5
CMAQ/PPTM Results for a Monitoring Site
Milwaukee Virginia Fire Station
Milwaukee Co.
12-km grid IC/BCs
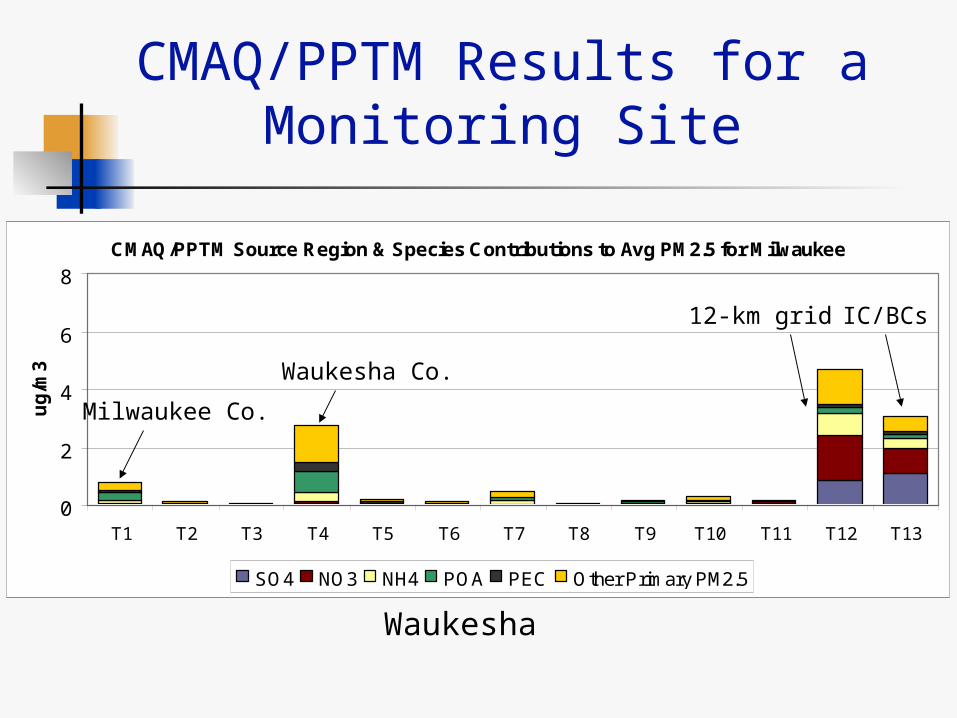
CMAQ/PPTM Source Region & Species Contributions to Avg PM2.5 for Milwaukee
0
2
4
6
8
T1 T2 T3 T4 T5 T6 T7 T8 T9 T10 T11 T12 T13
ug
/m3
SO4 NO3 NH4 POA PEC Other Primary PM2.5
CMAQ/PPTM Results for a Monitoring Site
Waukesha
Milwaukee Co.
12-km grid IC/BCs
Waukesha Co.

Summary CMAQ/PPTM Results for All Monitoring Sites
Summary of CMAQ/PPTM Source Region Contributions to Avg PM2.5 for Milwaukee
0
2
4
6
8
DNR FDH CHC FAA VFS OZK WKS
ug
/m3
Milwaukee Co. Other Tagged WI Counties Tagged IL & IN Counties Remainder of 12-km Grid IC/BCs

Summary for Milwaukee
OPTM & PPTM can be used to quantify the contribution of emissions (by species) from
specified source regions to CMAQ-derived concentrations
the potential for sources/source regions to contribute to nonattainment in a given area
Contributions vary by location and are different for the different species (NOx, VOC and PM species)
Ozone & PM2.5 nonattainment issues in the Milwaukee area are the combined result of local emissions as well as intra- & inter-state transport

§812 Cost/Benefit Analysis: PM2.5 Modeling Component
CMAQ-Ready 36-km Emission Inventories
(US Domain)1990
2000 without CAAA2000 with CAAA
2010 without CAAA2010 with CAAA
2020 without CAAA2020 with CAAA
2002 Meteorological Inputs
Geophysical & IC/BC Inputs
CMAQ Model (Version 4.6)
Annual PM2.5, Visibility & Deposition(US Domain)
19902000 without CAAA
2000 with CAAA2010 without CAAA
2010 with CAAA2020 without CAAA
2020 with CAAA
Health and Ecological Assessments
Annual Simulation Period

Application of CMAQ/PPTM to Support the §812 Cost/Benefit
Analysis
Objectives: Quality assurance To quantify and compare the source category
contributions to PM2.5 both with and without the Clean Air Act Amendments (CAAA)
Specs: National-scale modeling domain Annual simulation period; two scenarios (2010
without CAAA and 2010 with CAAA) 7 tagged source categories

Application of CMAQ/PPTM for the §812 Modeling Analysis:
Domains
36-km resolution for PM2.5
CONUS
EUS
WUS

Application of CMAQ/PPTM for the §812 Modeling Analysis:
Tags
T1: EGU sources (U.S.) T2: Non-EGU point sources (U.S.) T3: On-road mobile sources (U.S.) T4: Non-road mobile sources (U.S.) T5: Area (non-point, non-mobile) sources
(U.S.) T6: Initial and boundary conditions (IC/BCs)
T7: All other sources (natural emissions, offshore sources, and non-U.S. sources)

CMAQ/PPTM Results: Contribution from EGU Sources (Tag 1)
2010 without CAAA 2010 with CAAA
Annual Average PM2.5

CMAQ/PPTM Results: Contribution from Non-EGU Point Sources (Tag
2)
2010 without CAAA 2010 with CAAA
Annual Average PM2.5

CMAQ/PPTM Results: Contribution from On-Road Sources (Tag 3)
2010 without CAAA 2010 with CAAA
Annual Average PM2.5
0
10
20
30
40
50
EGU Non-EGU On-roadmobile
Non-roadmobile
Area IC/BCs Other Total
ug
/m3
NoCAAA CAAA
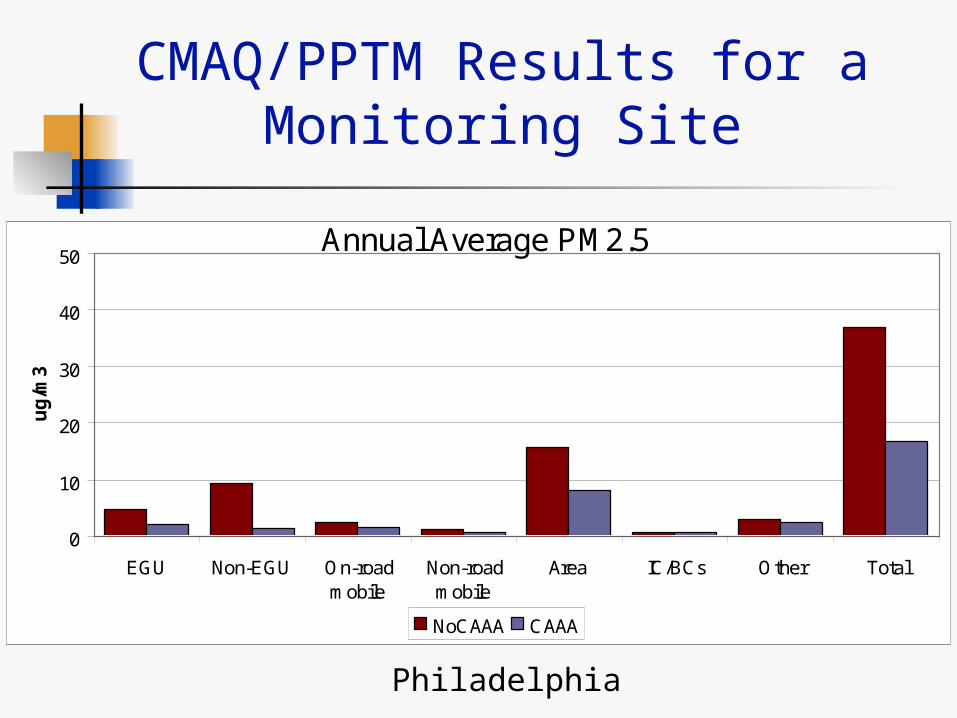
CMAQ/PPTM Results for a Monitoring Site
Philadelphia
Annual Average PM2.5
Summary of PPTM Results for the §812 Modeling Analysis
PPTM used as a probing tool to attribute the overall reductions in PM2.5 (due to the CAAA measures) to specific source categories
Total simulated PM2.5 concentration is lower under the CAAA scenario, primarily due to reductions in area- & point-source (EGU & non-EGU) emissions (relative importance varies by region and by location)
Health benefits can be similarly attributed to source categories, sources, or specific measures

Next Steps
Incorporate OPTM & PPTM (for ozone and PM2.5) into CMAQv4.7
Incorporate PPTM (for mercury and 10 additional toxic pollutants) into CMAQv4.7
Distribute OPTM & PPTM codes through CMAS