fungal and cyanobacterial gene expression in a lichen ... · eduardo rodriguez, ana, kalina,...
TRANSCRIPT

Fungal and cyanobacterial gene expression in a lichen symbiosis: Acclimatization and
adaptation to temperature and habitat
Sarah Sophie Steinhäuser
Faculty of Life and Environmental Sciences School of Engineering and Natural Sciences
University of Iceland 2015


Fungal and cyanobacterial gene expression in a lichen symbiosis: Acclimatization and
adaptation to temperature and habitat
Sarah Sophie Steinhäuser
90 ECTS thesis submitted in partial fulfillment of a Magister Scientiarum degree in Molecular Biology
Advisor(s) Prof. Dr. Ólafur S. Andrésson
Dr. Silke Werth Prof. Dr. Zophonías O. Jónsson
Examiner Kristinn P. Magnusson
Faculty of Life and Environmental Sciences School of Engineering and Natural Sciences
University of Iceland Reykjavik, September 2015

iiii
Fungal and cyanobacterial gene expression in a lichen symbiosis: Acclimatization and adaptation to temperature and habitat Temperature acclimatization in a lichen symbiosis 90 ECTS thesis submitted in partial fulfillment of a Magister Scientiarum degree in Molecular Biology Copyright © 2015 Sarah Sophie Steinhäuser All rights reserved Faculty of Life and Environmental Sciences School of Engineering and Natural Sciences University of Iceland Askja, Sturlugötu 7 101 Reykjavik Iceland Telephone: 525 4000 Bibliographic information: Sarah Sophie Steinhäuser, 2015, Fungal and cyanobacterial gene expression in a lichen symbiosis: Acclimatization and adaptation to temperature and habitat, Master’s thesis, Faculty of Life and Environmental Sciences, University of Iceland, pp. 77 Printing: Pixel prentþjónusta ehf. Reykjavik, Iceland, September 2015
iii
Abstract How do organisms react to a warming environment? How do such environmental changes affect species interactions? These are key questions in times of global warming. One strategy of coping with environmental changes is acclimatization. Therefore, species evolved complex molecular stress-response mechanisms including heat-shock systems (protein repair) and DNA repair pathways.
Here, we analyzed candidate gene expression in the lichen fungus Peltigera membranacea and its cyanobacterial Nostoc symbiont, a key player in carbon and nitrogen cycling in terrestrial ecosystems at northern latitudes. Do increasing temperatures cause a stress response reflected in expression levels of selected stress-response genes and do stress response patterns differ between coastal and inland habitats? As mutualistic symbioses, lichens offer the possibility of analyzing molecular stress responses in a particularly tight interspecific relationship.
Using real-time PCR quantification of 38 transcripts, differential expression was demonstrated for nine cyanobacterial and nine fungal stress response genes (plus the fungal symbiosis-related lec2 gene) at 15°C and 25°C vs. 5°C indicating temperature stress for both symbionts. Principle component analysis (PCA) revealed two gene groups differing in temperature response patterns. Whereas a set of cyanobacterial DNA repair genes and the fungal lec2 (PC1 group) showed a strongly correlated expression drop at 15°C vs. 5°C, most fungal candidates (PC2 group) showed increased expression at 25°C vs. 5°C. Furthermore, PC1 genes differed more strongly in temperature response along an elevation gradient than between habitat categories. The correlated downregulation of lec2 and cyanobacterial DNA repair genes suggests a possible interplay between the symbionts warranting further studies.

iviv

v
Útdráttur Hvernig bregðast lífverur við hlýnandi loftslagi? Hvernig hafa umhverfisbreytingar áhrif á samspil tegunda? Þetta eru lykilspurningar varðandi áhrif loftslagsbreytinga. Ein leið til að fást við breytingar í umhverfi er langtímaaðlögun. Vegna þessa hafa lífverur m.a. þróað flókin streituviðbrögð á sameindasviðinu, svo sem hitalosts viðbrögð (viðgerð á próteinum) og viðgerðir á erfðaefninu.
Í þessu verkefni hafa viðbrögð valinna gena í fléttusveppnum Peltigera membranacea og Nostoc blágrænbakteríusambýlungi hennar, sem gegnir mikilvægu hlutverki í hringrásum kolefnis og niturs á norðurslóðum. Veldur hitastigsaukning streituviðbragði sem kemur fram í tjáningu valinna gena sem tengjast streituviðbrögðum, og er munur á viðbrögðum flétta nærri sjó og langt inni í landi? Þar sem fléttur eru sambýlislífverur, þá gefst tækifæri til að skoða streituviðbrögð í sérstaklega nánu samfélagi tveggja ólíkra lífverugerða.
Tjáning 38 gena var mæld með rauntíma PCR aðferð, og fannst breytileg tjáning hjá níu genum blágrænbakteríunnar og níu streitutengdum sveppsins (auk samlífis tengda gensins lec2) við 15°C og 25°C miðað við 5°C, sem bendir til hitastreitu viðbragða í báðum sambýlungunum. Fjölbreytugreining (PCA) sýndi tvo hópa gena með ólíka svörun við hitaáreiti. Annars vegar sýndu DNA gen tengd DNA viðgerðum í blágrænbakteríunni og sveppgenið lec2 (PC1 hópur) svipað fall í tjáningu við 15°C miðað við 5°C, en hins vegar sýndu flest sveppgenin (PC2 hópur) aukna tjáningu við 25°C miðað við 5°C. Jafnframt sýndi tjáning PC1 genanna meiri samsvörun við hæð en milli megin vistgerða. Samsvörun í tjáningu lec2 og DNA viðgerðargena blágrænbakteríunnar gæti bent til samspils milli sambýlunganna sem vert er að skoða betur.

vii
Table of Contents List of Figures ............................................................................................................................. ix
List of Tables ................................................................................................................................ x
Abbreviations ............................................................................................................................. xi
Acknowledgements ............................................................................................................... xiii
1 Introduction .......................................................................................................................... 1
2 Materials and Methods ................................................................................................... 12 2.1 Sampling .................................................................................................................................... 13 2.2 Temperature experiment .................................................................................................... 16 2.3 RNA extraction and DNase digestion ............................................................................... 17 2.4 cDNA reverse transcription ................................................................................................ 19 2.5 Quantitative Real-‐Time PCR (RT-‐qPCR) ......................................................................... 19 2.5.1 Candidate and reference genes .................................................................................................. 19 2.5.1.1 P. membranacea ............................................................................................................................................. 19 2.5.1.2 Nostoc .................................................................................................................................................................. 20
2.5.2 RT-‐qPCR primer design & efficiency control ....................................................................... 22 2.5.3 Experimental procedure ............................................................................................................... 22 2.5.4 RT-‐qPCR data analysis ................................................................................................................... 23
2.6 Statistical analysis .................................................................................................................. 23
3 Results .................................................................................................................................. 25 3.1 Single gene expression responses (ANOVA) ................................................................. 25 3.1.1 P. membranacea ................................................................................................................................ 25 3.1.2 Nostoc .................................................................................................................................................... 29
3.2 Single gene correlations ....................................................................................................... 33 3.3 Principle component analysis (PCA) ............................................................................... 35 3.4 Summary ................................................................................................................................... 40
4 Discussion ........................................................................................................................... 41 4.1 Temperature responses ....................................................................................................... 41 4.1.1 P. membranacea ................................................................................................................................ 41 4.1.2 Nostoc .................................................................................................................................................... 44 4.1.3 Summary of temperature responses ....................................................................................... 46
4.2 Habitat differences ................................................................................................................ 47 4.2.1 Sites ........................................................................................................................................................ 47 4.2.2 Categories and gradients .............................................................................................................. 48 4.2.3 Temperature response .................................................................................................................. 48
5 Conclusion .......................................................................................................................... 51

viiiviii
References ................................................................................................................................. 53
Appendix A ................................................................................................................................. 61 Protocols .............................................................................................................................................. 61 RNA extraction .................................................................................................................................................. 61 DNase digestion ................................................................................................................................................ 62 cDNA synthesis ................................................................................................................................................. 63 Quantitative real-‐time PCR (RT-‐qPCR) ................................................................................................... 63
Temperature data ............................................................................................................................. 64 Statistical data ................................................................................................................................... 65 Raw data .............................................................................................................................................................. 65 Reference gene variation .............................................................................................................................. 65 ANOVA results ................................................................................................................................................... 65 Correlation analysis ........................................................................................................................................ 73 Principal component analysis (PCA) ....................................................................................................... 75
viii
ix
List of Figures Figure 1: Hsp protein family network required for maintenance of cellular protein
quality ................................................................................................................... 4 Figure 2: Interplay between RecA and transcription repressor LexA in the regulation
of the SOS DNA damage response. ...................................................................... 5 Figure 3: Lichen symbiosis ................................................................................................... 6 Figure 4: Worldwide distribution of the membranaceous dog lichen (Peltigera
membranacea) ....................................................................................................... 8 Figure 5: Map of South-West Iceland showing location of the chosen sampling sites ....... 13 Figure 6: Organisms and habitats. ....................................................................................... 15 Figure 7: Daily mean temperatures at the sampling sites RY7 and HF2 (sea-exposed),
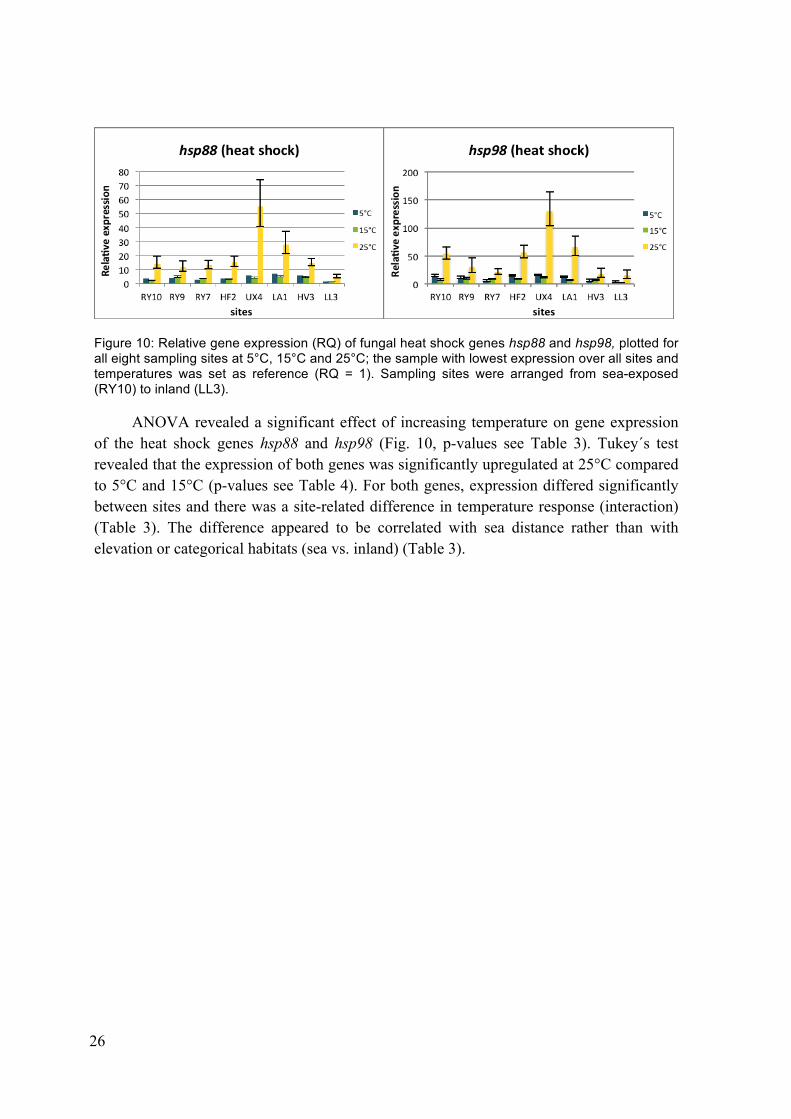
as well as at LA1, HV3, and LL3 (inland) in June 2013. ................................... 16 Figure 8: Setup of laboratory temperature experiment ........................................................ 17 Figure 9: Experimental setup of temperature experiment ................................................... 18 Figure 10: Relative gene expression (RQ) of fungal heat shock genes hsp88 and
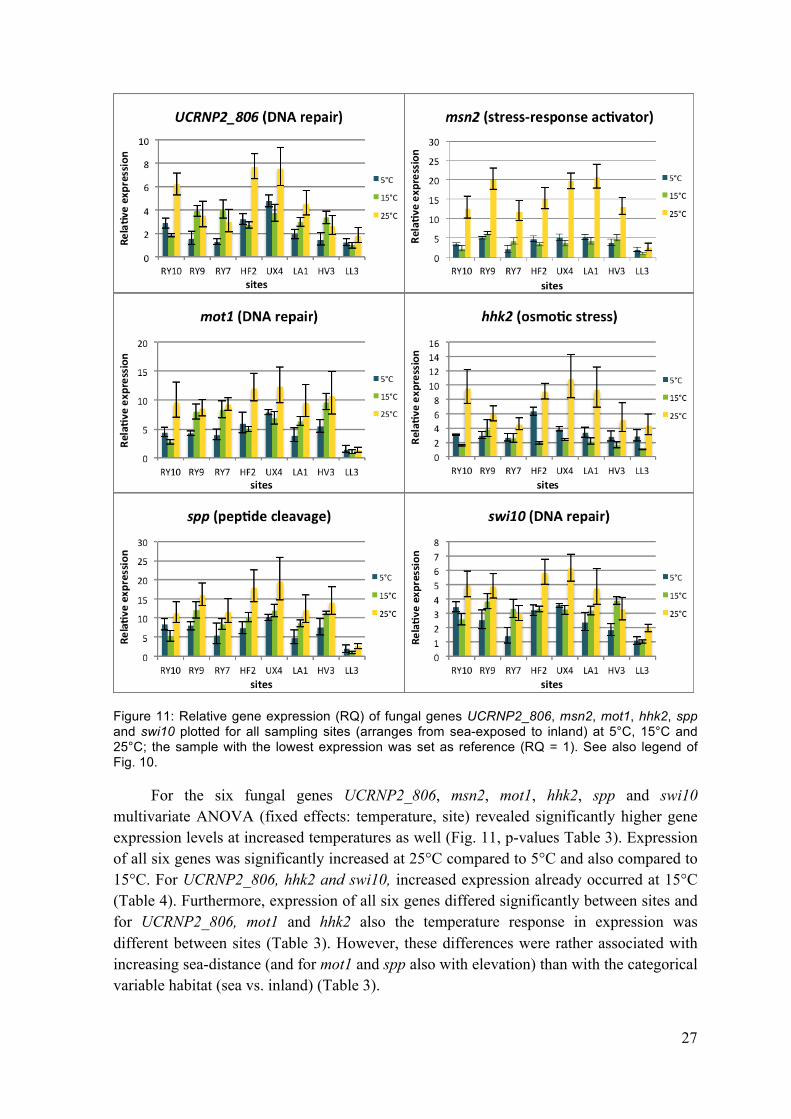
hsp98, plotted for all eight sampling sites at 5°C, 15°C and 25°C ................... 26 Figure 11: Relative gene expression (RQ) of fungal genes UCRNP2_806, msn2,
mot1, hhk2, spp and swi10 plotted for all sampling sites (arranges from sea-exposed to inland) at 5°C, 15°C and 25°C ................................................. 27
Figure 12: Relative expression (RQ) of galectin-like genes lec1 and lec2 for all sampling sites at 5°C, 15°C and 25°C .............................................................. 28
Figure 13: Relative gene expression (RQ) of cyanobacterial genes radA, recO, recN and recF for all sampling sites at 5°C, 15°C and 25°C .................................... 30
Figure 14: Relative gene expression (RQ) of five cyanobacterial candidate genes (groEL, dnaJ, hsp90, Npun_F4482 and hrcA) for all sampling sites at 5°C, 15°C and 25°C .......................................................................................... 29
Figure 15: Correlation analysis for fungal and cyanobacterial candidate genes ................. 34 Figure 16: Scree plot showing contribution of principle components PC1 to PC7 (x-
axis) to the overall data variation (eigenvector, y-axis). .................................. 35 Figure 17: Axis loadings of the first three axes, PC1-3. ..................................................... 36 Figure: 18: The effect of temperature (15°C and 25°C compared to 5°C) on gene
expression for the first three principle components PC1-3. ............................. 37 Figure 19: Differences in gene expression between the sampling sites and between
habitats (sea vs. inland) as well as along sea distance and elevation gradients. ........................................................................................................... 38
xx
List of Tables Table 1: Sampling site information. .................................................................................... 14 Table 3: Significance (p-values) of multivariate ANOVA for fungal genes. ..................... 28 Table 4: Significance (p-values) of Tukey´s honest significant difference test for the
effect of the three temperature treatments (5°C vs. 15°C, 5°C vs. 25°C and 15°C vs. 25°C) ........................................................................................... 29
Table 5: Significance (p-values) of multivariate ANOVA for cyanobacterial genes. ........ 32 Table 6: Significance (p-values) of Tukey´s honest significant difference test for the
effect of the three temperature treatments (5°C vs. 15°C, 5°C vs. 25°C and 15°C vs. 25°C) ........................................................................................... 32
Table 6: Significance (p-values) of multivariate ANOVA for PC1-3. ............................... 39 Table 7: Significance (p-values) of Tukey´s honest significant difference test for the
effect of the three temperature treatments (5°C vs. 15°C, 5°C vs. 25°C and 15°C vs. 25°C) ........................................................................................... 39
x

xi
Abbreviations ANOVA analysis of variance ATP adenosine triphosphate cAMP cyclic adenosine monophosphate cDNA complementary DNA CO2 carbon dioxide DNA desoxyribonucleic acid dNTP deoxyribonucleotide triphosphate ESR environmental stress response HPLC high performance liquid chromatography HSP heat-shock protein H2O water IAA indole-3-acetic acid kDa kilo-Dalton O2 oxygen PC principle component PCA principle component analysis PCR polymerase chain reaction ppm parts per million RNA ribonucleic acid RQ relative quantity (relative expression) RT-qPCR quantitative real-time PCR SNP single-nucleotide polymorphism STRE stress-responsive element TBP TATA-binding protein

xiixii

xiii
Acknowledgements For giving me the great opportunity to perform this project as part of my master studies in molecular biology at the University of Iceland, I want to thank my supervisors Prof. Dr. Ólafur S. Andrésson and Dr. Silke Werth. Thank you for guiding me through all the practical and theoretical work of the project! I truly enjoyed working in your research group and gained a lot of useful experience for my future. Furthermore, I want to thank my supervisor Dr. Arnar Palsson especially for his patient help throughout the statistical data analysis for the project and Prof. Dr. Zophonias O. Jónsson for his productive input during the planning and the conduction of the project.
Many thanks also go to Martin Mörsdorf as good friend and colleague, who helped me with the statistical analysis. I also want to thank my colleague Ehsan P. Ahi for all help and assistance and Dr. Valerie H. Maier for supporting me in professional and personal questions throughout my master studies.
I further want to thank all other people from the biology department of the University of Iceland as well as from the University of Graz for support and help during the project and in general. Thanks to Andrey Gagunashvili, Kristen M. Westfall and Hörður Guðmundsson for helping with the genomic data for the project. Many thanks also to Dr. Eduardo Rodriguez, Ana, Kalina, Rosan(it)a and Miriam for your support and great time in- and outside of Askja!
This project was financially supported by the Icelandic research foundation RANNÍS.
Last but not least, I want to thank my family and my friends in Germany and Iceland for supporting me throughout the whole time of my master studies. Thank you for always being there and having an open ear for everything!


1
1 Introduction In times of climate change and global warming it has become a key question throughout different research fields how changing environmental conditions could affect species within their habitats. A reduction in biodiversity can negatively impact ecosystems and therefore also the benefits and services they provide for human society (Schröter 2005, Burkle et al. 2013).
In the past decades there have been numerous reports on rapid climate changes on global scales (Diffenbaugh and Field 2013, Penuelas et al. 2013). Phenomena such as increasing temperatures and increasing CO2 concentration have an impact both on terrestrial and marine ecosystems (The Royal Society 2005, Diffenbaugh and Field 2013, Penuelas et al. 2013). Species have to cope with environmental changes occurring much more rapid than in the past centuries. During the short time period from the beginning of the industrial revolution the atmospheric CO2 level has risen from 280 ppm up to the current 394 ppm (Penuelas et al. 2013). In a variety of marine ecosystems increased CO2 partial pressures have a strong negative impact on calcifying organisms (The Royal Society 2005, Albright et al. 2010) as well as non-calcifying species by affecting growth, physiology, respiration and metabolism (Pörtner et al. 2004, Pörtner 2008).
Another aspect of climate change are increasing temperatures, causing major changes both in marine and terrestrial ecosystems by affecting species on many levels from metabolism and growth to general species interactions and ecosystem productivity (Penuelas et al. 2013). Studies on a variety of terrestrial species (e.g. butterflies, birds, higher plants) have shown that increased temperatures affect breeding, blooming (e.g. of the lilac Syringa vulgaris in the western USA) and the length of growth seasons (Parmesan 2006). Furthermore, temperature shifts can lead to asynchrony in species abundance and therefore influence predator-prey, insect-host and other interactions. Studies on butterflies have shown that asynchrony between butterflies and their host plants can result in population extinctions (Parmesan 2006). Moreover, phenomena such as the invasion of foreign species into new habitats are often associated with climatic shifts (Landschoff et al. 2013). Thus, species and their ecosystems can be affected in various ways by increasing temperatures, which can further lead to major range shifts affecting ecosystem goods and services (Penuelas et al. 2013). For that reason, research has focused on whether and in which ways species can adapt to environmental changes and thus avoid extinction (Parmesan 2006). However, environmental changes due to climate change might not have the same effect on species in all types of habitats. For marine habitats it has been suggested that both changing CO2 levels and temperatures might have different effects on species originating from naturally variable coastal habitats than deep-sea habitats with generally very stable temperature, CO2 and O2 conditions (Pörtner et al. 2004, Pörtner 2008, Melzner
22
et al. 2012). Terrestrial environments often differ in the magnitude of external factors such as temperature. Whereas open areas in the interior can show high variability in terms of temperatures, areas at the coast or in forests are characterized by less temperature fluctuation. Studies on lichens have shown that epiphytic floras are altered more rapidly in response to climate change in open rural areas compared to forested areas (Aptroot and van Herk 2007). Therefore, the effect of global warming on a species can be rather complex, since different populations of one species located in habitats with different temperature regimes might be affected differently by global warming.
Under environmental stress there are several options enhancing survival of species. One possibility is migration to more favorable habitats. In the Netherlands for example, lichen species associated with warmer temperatures have significantly increased in abundance whereas cold-temperature species have either decreased or disappeared (Aptroot and van Herk 2007). In contrast, acclimatization is a way of coping with environmental changes without necessarily leaving the habitat. Acclimatization to local conditions is a general phenomenon based on phenotypic plasticity, which describes the capacity of a single genotype to develop variable phenotypes in different environments manifesting as changes in biochemistry, physiology, morphology, behaviour and life history (Whitman and Agrawal 2009). Acclimatization can take place within minutes or hours but can last for weeks or months (Rachmilevitch et al. 2008, Odsbu and Skarstad 2014, O Leyva-Perez et al. 2015). However, in contrast to genetic adaptation acclimatization is more of a short-term process, which is usually reversible and the result of which is not necessarily passed to the next generation. Therefore, local adaptation is another survival strategy with an underlying genetic base, which is acting on larger time scales than acclimatization. If enough individuals of a species´ population are able to cope with environmental change, the population will have a chance to survive. Adaptation evolves by natural selection, since those individuals of a population that have a better ability to cope with a changing environment do better and have more offspring (Davis 2005, Aitken et al. 2008, Manel et al. 2010). At the genetic level, the occurrence of single-nucleotide polymorphisms (SNPs) in genes functionally involved in coping with specific environmental conditions can be an indication of adaptation due to selection pressure. In a variety of different organisms including fungi, adaptation to more demanding conditions has been investigated using SNPs in candidate genes taking part in environmental stress response (ESR) processes such as heat-shock or DNA repair (Gasch 2007). Another process important in adaptation is gene flow between populations, a key mechanism for the introduction of new genetic variants into populations (Kawecki and Ebert 2004). Beneficial gene mutations can spread rapidly within and between populations through high gene flow and increase fitness and survival in a changed environment (Dalziel et al. 2009).
Both acclimatization and adaptation are key mechanisms in coping with a changing climate. Physiological flexibility, driven by organisms´ acclimatization to local site conditions, plays an important role for species to successfully cope with environmental variability (Davis 2005, Aitken et al. 2008, Manel et al. 2010). The ability of species to

3
cope with various environmental stresses is of exceptional importance for the long-term persistence of their populations in a given environment. When enough individuals of a population have the ability to adjust their life processes to changed environmental conditions, populations are able to persist. One mechanism underlying phenotypic plasticity is the environmentally induced alteration of gene expression resulting in switches at the physiological level may enable species to tolerate changed environments by allowing them to survive stressful environmental conditions. At the molecular level, both prokaryotes and eukaryotes have developed complex environmental stress-response (ESR) mechanisms including a variety of pathways in order to react to external stress due to e.g. drought or heat (Apte et al. 1998, Plesofsky-Vig and Brambl 1998, Young 2001, Enjalbert et al. 2006, Gasch 2007, Zahrl et al. 2007, Sato et al. 2008, Che et al. 2013, Pasqua et al. 2013). As studies on plants and fungi have shown, drought can induce a number of cellular stresses including oxidative and osmotic stress, hyper-ionicity and protein misfolding. For coping with cellular stress, three main stress-response pathways play a major role including osmoregulation (modulation of intracellular ion concentration), antioxidation (scavenging reactive oxygen) as well as DNA and protein damage repair (Wang et al. 2015). It has been suggested that specific stress response programs can be combined to a global core stress response conserved throughout prokaryotes and eukaryotes, which is commonly activated in a variety of environmental stresses (Lopez-Maury et al. 2008). In fungi (Saccharomyces cerevisiae, Schizosaccharomyces pombe), a great number of candidate genes involved in environmental stress response have been identified (Gasch 2007). Under stress, common stress response signaling pathways including e.g. the cAMP signaling pathway, mitogen-activated protein kinases or the Hog1 pathway are activated, which mediate the transcriptional upregulation of ESR candidate genes (Wang et al. 2015). In the Hog1 pathway in S. cerevisiae, which developed orthologously to the Sty1 pathway in Sz. pombe (Gasch 2007), the occurrence of environmental stress (heat, osmotic or oxidative stress) leads to a repression of two-component regulatory histidine kinase Sln1. Sln1 is responsible for the repression of Ssk1 and therefore prevents Hog1 activation in non-stress conditions. The occurrence of environmental stress such as heat, osmotic or oxidative stress leads to a repression of Sln1 and therefore activates Hog1 through Ssk1 and further Ssk2 and Ssk22 (Gasch 2007). Additionally, phosphatases like Pyp1 and Pyp2 play a role in Hog1 repression under normal conditions. Hog1 further activates the expression of the transcriptions factors Msn2 and Msn4 (Rep et al. 2000, Gasch 2007, Liu et al. 2013), which are responsible for activating the gene expression of various stress response genes (heat shock genes, DNA repair genes) containing stress response elements (STREs)(Martínez-Pastor et al. 1996). As members of the heat shock gene family, Hsp genes have the ability to repair proteins denatured or misfolded due to external stress.

44
Figure 1: Hsp protein family network required for maintenance of cellular protein quality (http://pdslab.biochem.iisc.ernet.in/hspir/img/indexfigure.png, 28.05.2015)
External stress such as drought or heat can induce cellular damages at the protein level. There are many heat shock pathways (Fig. 1), highly conserved throughout both prokaryotes and eukaryotes (Langer et al. 1992, Wiech et al. 1992, Schüller et al. 1994, Hartl 1996, Mendoza et al. 1996, Goloubinoff et al. 1997, Plesofsky-Vig and Brambl 1998, Melkani et al. 2005, Enjalbert et al. 2006, Che et al. 2013, Pasqua et al. 2013, Rajaram et al. 2014). In the Hsp60 system, the 60 kDa chaperone GroEL forms a protein barrel structure with the GroES chaperone, in which denatured or misfolded protein substrates can be refolded in the correct way in an ATP-dependent process (Goloubinoff et al. 1997, Melkani et al. 2005, Zahrl et al. 2007, Pasqua et al. 2013, Rajaram et al. 2014). The Hsp40/Hsp70 complex in conjunction with the Hsp90 system contributes to protein damage repair of proteins at a later stage of folding (Fig. 1) (Wiech et al. 1992, Young 2001, Wang et al. 2007).

5
Figure 2: Interplay between RecA and transcription repressor LexA in the regulation of the SOS DNA damage response. In presence of single-strand DNA, expression of SOS genes is activated by RecA-mediated cleavage of LexA. (http://2012.igem.org/wiki/images/thumb/8/80/Sos_response. png/800px-Sos_response.png; 25.06.2015)
In addition to repair machineries that act on the protein level, general DNA damage repair pathways play an important role in repairing stress-related damages (Sargentini and Smith 1986, Voloshin et al. 2003, Nagashima et al. 2006, Cheng et al. 2012, Odsbu and Skarstad 2014). Organisms have developed a variety of different DNA repair pathways, which can be classified as single-strand repair, double-strand repair and others (e.g. base-excision repair, cross-links). In prokaryotes, the global SOS response system is characterized by the interplay of coprotease RecA and SOS response repressor LexA. Presence of single-strand DNA leads to activation of RecA and cleavage of the LexA protein derepressing transcription of SOS response genes as shown in Fig. 2 (Janion 2008). Studies on UV stress in E. coli have identified a large number of SOS box containing genes have been identified including recF, recO, recR, recN (Janion 2008) and further recB, recC, recJ and radA (Sargentini and Smith 1986). For acclimatization of species to stressful environmental conditions, both heat shock pathways for damaged protein repair and DNA repair pathways play an essential role.
To investigate the details of molecular stress responses in order to determine how species react to external stress due to environmental changes, it is important to also take the level of species interactions into account. In general, species live in interaction with other species, influencing each other on various levels. One of the most direct interactions between different species is symbiosis describing different forms of biological interactions such as mutualism, commensalism and parasitism. As one type of symbiosis, mutualism represents a beneficial association between species, which in some cases can be so close that the single mutualistic symbionts are not able to survive on their own anymore. Therefore, such a tight interaction as mutualism is particularly interesting to characterize molecular stress responses among interacting species. Mutualistic interactions are widespread in many groups of organisms in all kinds of habitats. Examples of well-studied mutualistic symbioses are coral-dinoflagellate symbioses in marine ecosystems and plant- or fungal-bacterial symbioses in terrestrial habitats (McCowen et al. 1986, Timmusk and

66
Wagner 1999, Yahr et al. 2004, Antonyuk and Evseeva 2006, Albright et al. 2010, Campo et al. 2013). It has been shown that both symbiosis partners can communicate and strongly influence each other at the molecular level (Timmusk and Wagner 1999, Antonyuk and Evseeva 2006). For the plant-bacterial symbiosis of wheat and the rhizobacterium Azospirillum brasilense it has been shown that increased gene expression of wheat lectin can upregulate metabolic processes in its bacterial symbiont (Antonyuk and Evseeva 2006). For Arabidopsis thaliana, the rhizobacterial symbiont Paenibacillus polymyxa has been shown to be responsible for increasing gene expression in the plant in reaction to drought stress (Timmusk and Wagner 1999).
Lichen symbioses are important components of a variety of terrestrial ecosystems. Lichenization is a successful nutritional strategy, which is characterized by the mutualistic association of a filamentous fungus (mycobiont) with one or several photosynthetically active organisms (photobiont), which can be green algae or cyanobacteria (Lutzoni and Miadlikowska 2009, Honegger 2012) (Fig. 3). About 20% of all fungi (17.000-20.000 species) are lichen-forming, nearly all within the phylum of Ascomycota. In contrast, only about 120 cyanobacterial and green algal species are known as photobionts in lichen symbioses (Honegger 2012). Therefore, many mycobionts share the same photobiont. Some of the most common photobionts in lichen-symbioses are green algae of the genera Trebouxia and Trentepohlia and the cyanobacterial genus Nostoc (Lutzoni and Miadlikowska 2009). Lichens are abundant in various ecosystems across the world reaching from arctic and antarctic tundra over alpine to steppe and desert ecosystems. More than 12% of all terrestrial ecosystems are lichen-dominated (Honegger 2012). Lichens can be very sensitive to changes in their environment such as air pollution (Hawksworth 1970, Nimis 2002). Using the bioclimatic envelope approach (statistical correlation of species distributions and environmental variables to define species tolerance), studies on British epiphytic lichens have predicted major future range shifts for lichen-forming fungi as response to climate change (Ellis et al. 2007a, Ellis et al. 2007b).
Figure 3: Lichen symbiosis. Left: schematic cross-section showing algal layer within fungal tissue. Right: false color electromicrograph of algal cell within fungal hyphae (Copyright © Pearson Education, Inc., publishing as Benjamin Cummings; http://biology4isc.weebly.com/4-kingdom-fungi.html (04.06.15))
10 µl
7
However, it basically remains unknown how lichen populations react to large-scale climatic changes such as global warming. Choosing or switching to a specific photobiont strain better able to tolerate extreme environmental conditions than another strain, can be one strategy of coping with a changing environment (Blaha et al. 2006, Fernandez-Mendoza et al. 2011, Printzen et al. 2012). Genetic diversity and photobiont transmission mode has been investigated in many lichen symbioses either containing green-algal photobionts (Yahr et al. 2004, Piercey-Normore 2006, Yahr et al. 2006, Werth and Sork 2010, Fernandez-Mendoza et al. 2011, Grande et al. 2012, Perez-Ortega et al. 2012, Werth 2012, Widmer et al. 2012, Campo et al. 2013) or cyanobacteria (Myllys et al. 2007, Lücking et al. 2009, Fedrowitz et al. 2012). Many studies have shown that mycobionts can be highly selective for specific Nostoc strains as photobionts (Myllys et al. 2007, Fedrowitz et al. 2012, O'Brien et al. 2013).
Another strategy through which lichens might be able to tolerate climatic changes is flexibility in gene expression allowing the organisms to cope with environmental extremes and stress. There have been several studies on gene expression under environmental stress conditions in non-lichenized fungi (Gasch 2007) but only few recent studies have investigated gene expression in lichen-forming fungi and their photobionts. One study found differential expression of heterocyst-specific and other genes in a Nostoc photobiont between marginal and central parts of lichen thalli, but this study did not explicitly aim to look at stress responses (Chua et al. 2012). Another study found differential gene expression of the fungal gene lec1 but did not consider stressful environmental conditions (Miao et al. 2012). Other studies determined differential gene expression in the context of symbiont recognition in early developmental stages of lichens (Joneson et al. 2011, Athukorala and Piercey-Normore 2015). In the desert lichen Endocarpon pusillum, expression of fungal genes involved in osmoregulation, metabolism and protein repair has been investigated in response to drought stress (Wang et al. 2015). However, no studies have yet been performed in order to identify and characterize gene expression of ESR genes in both lichen-forming fungi and their cyanobacterial symbionts under temperature stress.
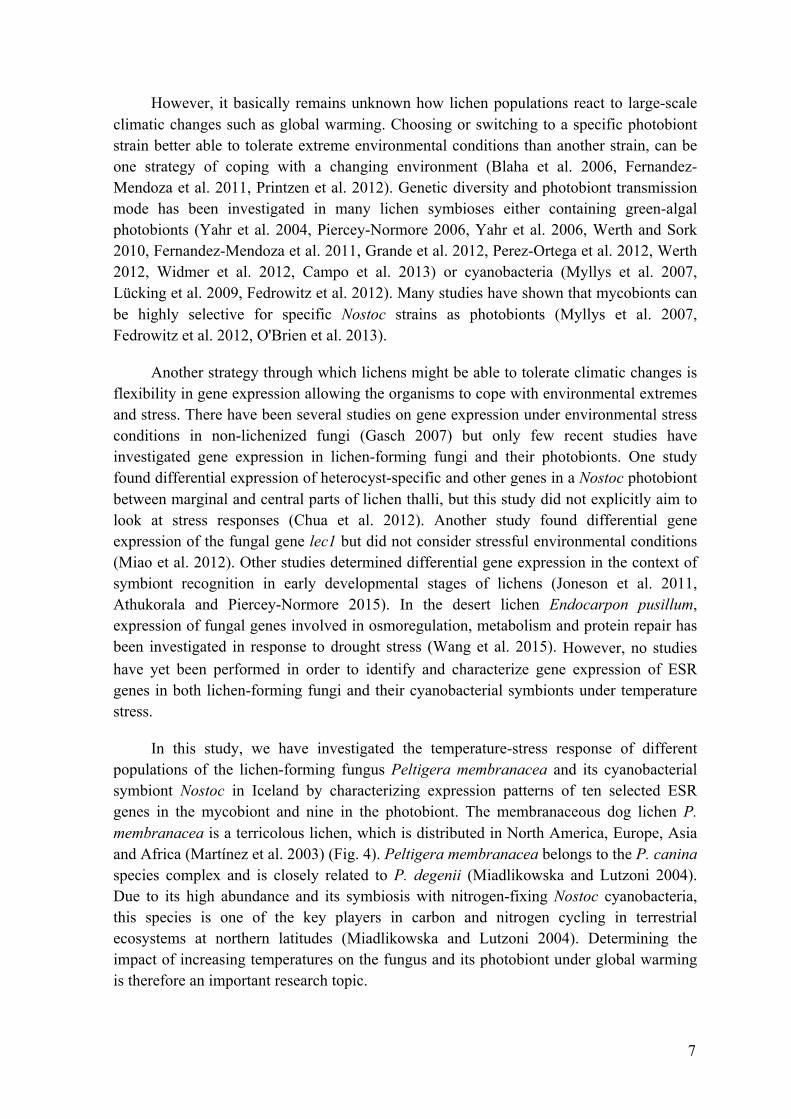
In this study, we have investigated the temperature-stress response of different populations of the lichen-forming fungus Peltigera membranacea and its cyanobacterial symbiont Nostoc in Iceland by characterizing expression patterns of ten selected ESR genes in the mycobiont and nine in the photobiont. The membranaceous dog lichen P. membranacea is a terricolous lichen, which is distributed in North America, Europe, Asia and Africa (Martínez et al. 2003) (Fig. 4). Peltigera membranacea belongs to the P. canina species complex and is closely related to P. degenii (Miadlikowska and Lutzoni 2004). Due to its high abundance and its symbiosis with nitrogen-fixing Nostoc cyanobacteria, this species is one of the key players in carbon and nitrogen cycling in terrestrial ecosystems at northern latitudes (Miadlikowska and Lutzoni 2004). Determining the impact of increasing temperatures on the fungus and its photobiont under global warming is therefore an important research topic.
88
Figure 4: Worldwide distribution of the membranaceous dog lichen (Peltigera membranacea), http://www.discoverlife.org/mp/20m?kind=Peltigera+membranacea&flags=glean: (08.06.2015)
Gene expression of two fungal lectin genes (lec1 and lec2), which are thought to play a role in the symbiosis, was also investigated in the experimental setting. The impact of fungal lectins on algal photobionts (e.g. through induction of photobiont chemotropism) has already been described for the lichens Endocarpon pusillum, Xanthoria parietina, Evernia prunastri and Peltigera canina (Molina and Vicente 2000, Legaz et al. 2004, Diaz et al. 2011, Wang et al. 2014). Expression of the lec1 and lec2 genes has recently been studied with regard to their role in the symbiosis between P. membranacea and its photobiont Nostoc sp. (Manoharan et al. 2012, Miao et al. 2012). Whereas lec2 was found to be a highly polymorphic gene in P. membranacea, lec1 showed differential expression between different tissues of the lichen (thallus part containing the photobiont vs. photobiont-free rhizines and ascocarps) dependent on the presence or absence of the photobiont. For wheat it has been suggested that differential expression of wheat lectin can affect cellular processes in its bacterial photobiont (Antonyuk and Evseeva 2006). Nitrogen fixation and transport of ammonium out of the cell were increased in higher lectin concentrations. Furthermore, higher lectin concentrations increased the bacterial production of the phytohormon IAA (indole-3-acetic acid), which stimulates plant growth (Antonyuk and Evseeva 2006). Therefore, the expression analysis of lec1 and lec2 in P. membranacea and genes of its photobiont Nostoc might provide information about the interaction of these species under increasing temperatures.
In addition to the investigation of the lichen heat-stress response in general, this study also addresses the question whether Icelandic lichens from different habitats are affected differently by increasing temperatures. As described earlier, populations of a species can differ in their response to environmental changes dependent on the natural variability of their habitat. Therefore, lichen populations from naturally more variable habitats such as in the inland of the country might have a better ability to cope with

9
changes in temperature than lichens from more stable habitats such as at the coast. Further, we want to determine if there is a categorical difference in temperature response or a gradual difference that is correlated with increasing distance from the sea or elevation above sea level. To answer this question, we also addressed the role of general variation between different locations within one habitat. In the Andrésson lab at the University of Iceland, unique genomic data and data on population genetics are available for P. membranacea and its Nostoc symbiont including transcriptome data, which provide a solid foundation for this study and further studies.


11
To address the issues described above, the following research questions have been developed:
• Does a moderate increase in temperature (5°C to 15°C to 25°C) cause a stress response reflected in the expression level of selected genes in both symbiosis partners (mycobiont and photobiont) of the lichen P. membranacea?
• Do lichens collected from the inland of Iceland show different temperature response patterns in these genes than lichens from coastal environments?

12
13
2 Materials and Methods
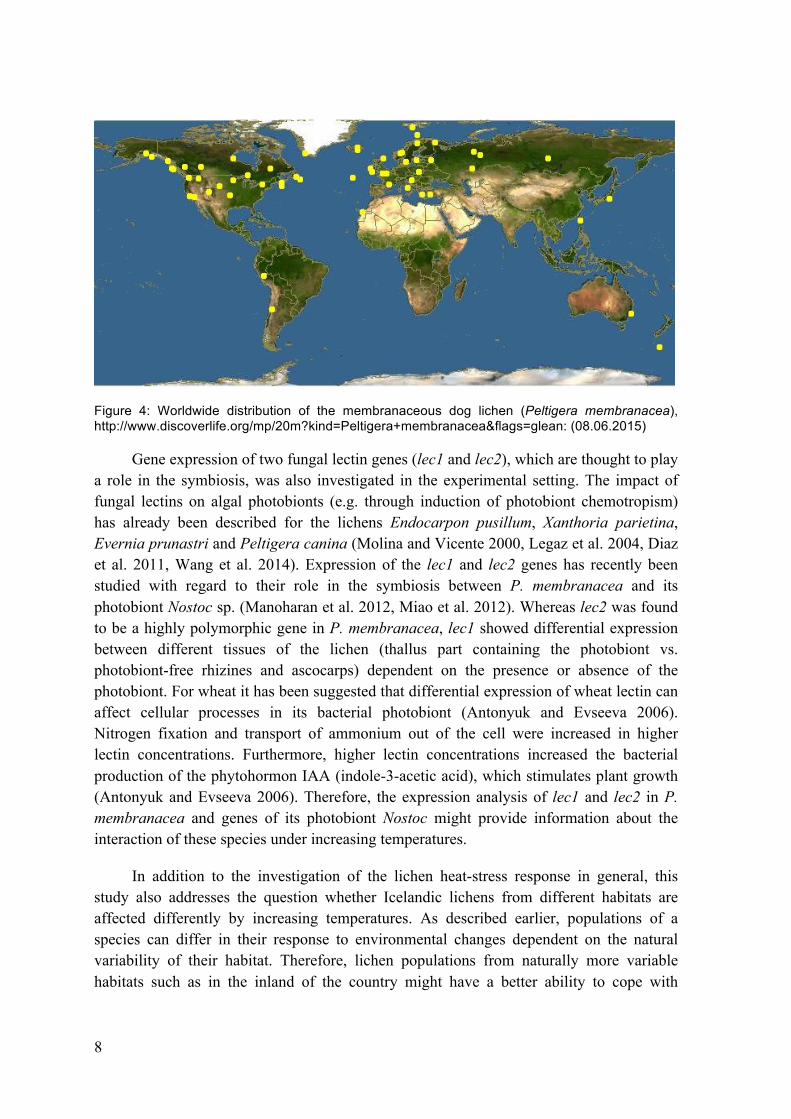
2.1 Sampling Sampling was performed in the beginning of June 2014. Four sea-exposed sites, RY10 (Strandakirkja), RY9 (Garður), RY7 (Grindavík) and HF2 (Kjalarnes), and four sites located further inland (UX4 (Uxahryggir), LA1 (Gjábakkaheiði), HV3 (Árnes) and LL3 (Hrauneyjar), were chosen for sampling. All eight sampling sites are located in the South-West of Iceland (Fig. 5) and they represented open vegetation without forest coverage.
Figure 5: Map of South-West Iceland showing location of the chosen sampling sites. Located close to the sea were RY10 (Strandakirkja), RY9 (Garður), RY7 (Grindavík), and HF2 (Kjalarnes). Inland sites were UX4 (Uxahryggir), LA1 (Gjabakkaheiði), HV3 (Árnes), and LL3 (Hrauneyjar).

14
Table 1: Sampling site information. Table includes the exact location name, habitat, distance to the sea [km], elevation above sea level [m] and coordinates (Northing, Easting; map datum WGS84).
Site Location name Habitat Sea distance [km]
Elevation [m]
Coordinates °N °E
RY10 Strandakirkja sea-exposed 0 10 63,835 -21,703 RY9 Garður sea-exposed 0 7 64,080 -22,691 RY7 Grindavík sea-exposed 0 30 63,819 -22,681 HF2 Kjalarnes sea-exposed 0,1 31 64,240 -21,868 UX4 Uxahryggir inland 20 415 64,438 -21,043 LA1 Gjábakkaheiði inland 30 184 64,212 -20,860 HV3 Árnes inland 40 68 64,036 -20,315 LL3 Hrauneyjar inland 70 285 64,121 -19,782
At the sites RY10, RY9 and RY7, the distance to the nearest ocean shore was around 20 m and at HF2 between 100 and 150 m (Table 1). The vegetation at the sea-exposed sites was mostly characterized by bryophytes and graminoids on sandy ground (Fig. 6C). Of the inland sites, UX4 and LA1 were closest to the sea (ca. 20-30 km) and were characterized by bryophyte vegetation on a rocky ground of volcanic origin. HV3 had a distance of around 40 km to the nearest ocean shore and its vegetation was characterized by dwarf shrubs in addition to bryophytes and graminoids on rocky ground (Fig. 6B). LL3 was the most extreme inland site sampled (distance to ocean around 70 km). It was characterized by sparse vegetation, mainly bryophytes and scattered dwarf shrubs, on rocky ground.
15
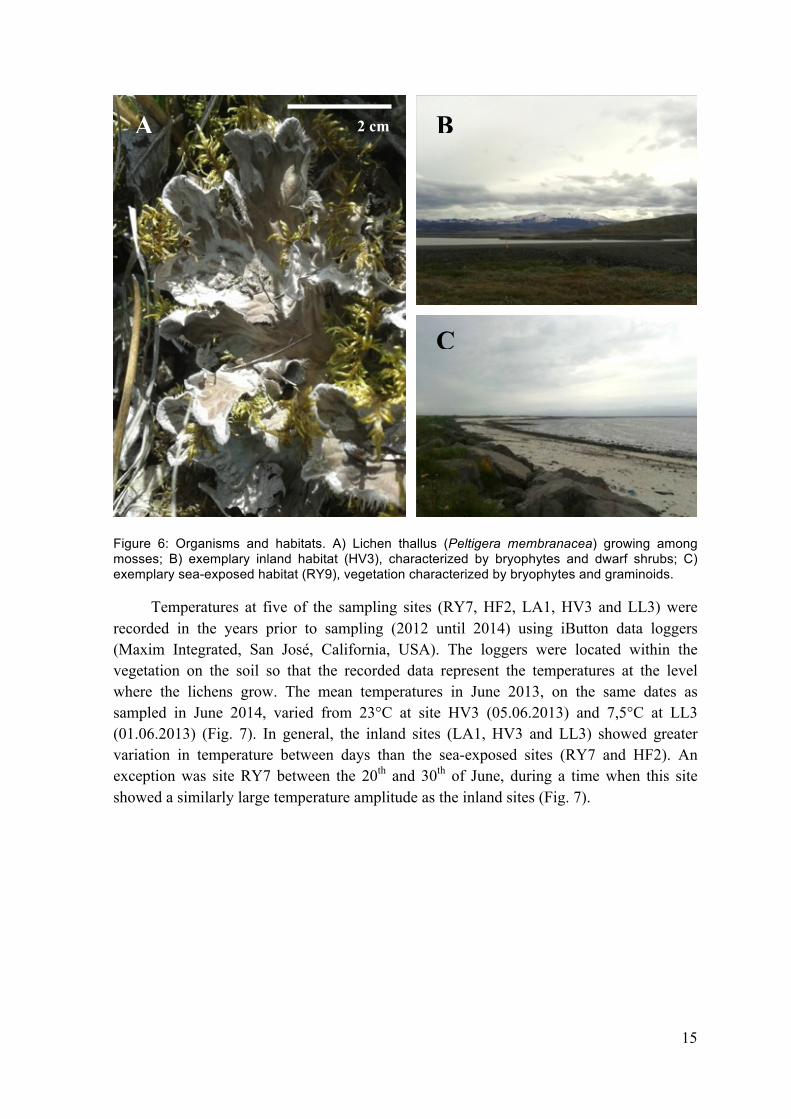
Figure 6: Organisms and habitats. A) Lichen thallus (Peltigera membranacea) growing among mosses; B) exemplary inland habitat (HV3), characterized by bryophytes and dwarf shrubs; C) exemplary sea-exposed habitat (RY9), vegetation characterized by bryophytes and graminoids.
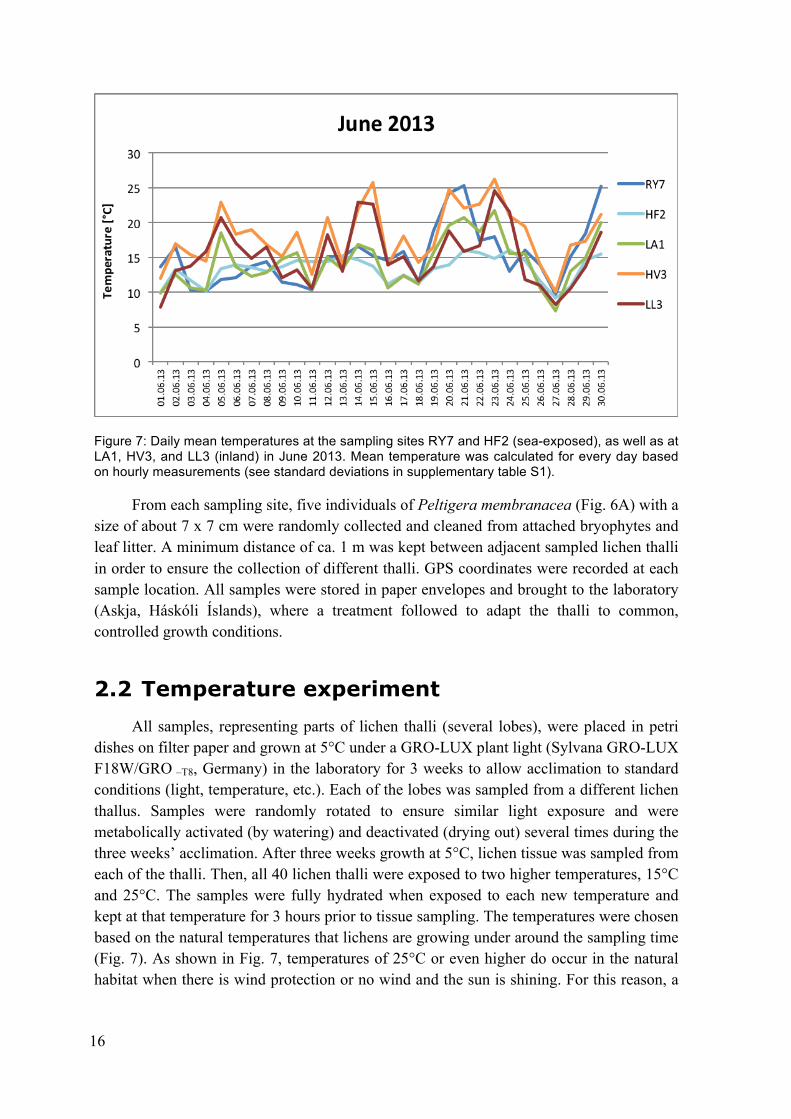
Temperatures at five of the sampling sites (RY7, HF2, LA1, HV3 and LL3) were recorded in the years prior to sampling (2012 until 2014) using iButton data loggers (Maxim Integrated, San José, California, USA). The loggers were located within the vegetation on the soil so that the recorded data represent the temperatures at the level where the lichens grow. The mean temperatures in June 2013, on the same dates as sampled in June 2014, varied from 23°C at site HV3 (05.06.2013) and 7,5°C at LL3 (01.06.2013) (Fig. 7). In general, the inland sites (LA1, HV3 and LL3) showed greater variation in temperature between days than the sea-exposed sites (RY7 and HF2). An exception was site RY7 between the 20th and 30th of June, during a time when this site showed a similarly large temperature amplitude as the inland sites (Fig. 7).
A BA
CBA
2 cm
16
Figure 7: Daily mean temperatures at the sampling sites RY7 and HF2 (sea-exposed), as well as at LA1, HV3, and LL3 (inland) in June 2013. Mean temperature was calculated for every day based on hourly measurements (see standard deviations in supplementary table S1).
From each sampling site, five individuals of Peltigera membranacea (Fig. 6A) with a size of about 7 x 7 cm were randomly collected and cleaned from attached bryophytes and leaf litter. A minimum distance of ca. 1 m was kept between adjacent sampled lichen thalli in order to ensure the collection of different thalli. GPS coordinates were recorded at each sample location. All samples were stored in paper envelopes and brought to the laboratory (Askja, Háskóli Íslands), where a treatment followed to adapt the thalli to common, controlled growth conditions.
2.2 Temperature experiment All samples, representing parts of lichen thalli (several lobes), were placed in petri dishes on filter paper and grown at 5°C under a GRO-LUX plant light (Sylvana GRO-LUX F18W/GRO –T8, Germany) in the laboratory for 3 weeks to allow acclimation to standard conditions (light, temperature, etc.). Each of the lobes was sampled from a different lichen thallus. Samples were randomly rotated to ensure similar light exposure and were metabolically activated (by watering) and deactivated (drying out) several times during the three weeks’ acclimation. After three weeks growth at 5°C, lichen tissue was sampled from each of the thalli. Then, all 40 lichen thalli were exposed to two higher temperatures, 15°C and 25°C. The samples were fully hydrated when exposed to each new temperature and kept at that temperature for 3 hours prior to tissue sampling. The temperatures were chosen based on the natural temperatures that lichens are growing under around the sampling time (Fig. 7). As shown in Fig. 7, temperatures of 25°C or even higher do occur in the natural habitat when there is wind protection or no wind and the sun is shining. For this reason, a

17
maximum temperature of 25°C is reasonable for investigating the effect of increased temperatures on gene expression. It represents a high temperature for a metabolically active (wet) lichen, but this temperature is regularly reached in a natural habitat. However, in the natural habitat, at 25°C, the lichens rapidly dry out and become metabolically inactive. In rainy conditions, lichens usually do not face such high temperatures in Iceland.
Figure 8: Setup of laboratory temperature experiment. A) Experimental setup for temperature experiment 1 (5°C treatment) in 5°C cold room, featuring controlled light conditions. Five fully hydrated lichen lobes from eight sampling sites each were set up randomly. B) Experimental setup for temperatures 2 and 3 (15°C and 25°C treatments) in controlled environment incubator, the same lichen individuals (fully hydrated, set up randomly and exposed to 15°C for 3h and 25°C for 3h under controlled light conditions prior to sampling).
The 5°C treatment was set up in a 5°C cold room (Fig. 8) whereas the 15°C and the 25°C treatments were performed in a growth chamber (Controlled Environment Incubator Shaker, New Brunswick Scientific Co.) that was set to the correct temperature beforehand and supplied with light from GRO-LUX lamps. The light intensity measured in the cold room (average 37,0 ± 4,6 Lux) was not significantly different from that measured in the growth chamber (average 28,2 ± 11,8 Lux) using an illuminance meter TES 1334A (Student´s t-test, p-value = 0,1132).
2.3 RNA extraction and DNase digestion For tissue sampling, a piece of tissue (ca. 5 x 5 mm) was cut from the margin of a given lichen thallus and collected into RNAlater (Life Technologies), a solution to preserve RNA. After the second and third temperature treatment, additional pieces of tissue
A B

18
were collected from the same individual, but a different lobe, resulting in three samples from each individual (5°C, 15°C and 25°C) for comparison of gene expression levels in later experiments (Fig. 9).
Figure 9: Experimental setup of temperature experiment. Every lichen thallus from each of the eight sampling sites was first exposed to 5°C for acclimation, then to 15°C for 3h and finally to 25°C for 3h; after every temperature treatment, pieces of marginal tissue (different lobes every time) were sampled into RNAlater for RNA extraction resulting in three temperature samples per individual.
RNA extraction was first tested using a TRI®-reagent (Sigma-Aldrich, St. Louis MO, USA) based RNA isolation protocol, but due to low and variable yields of RNA, the RNeasy Plant Mini Kit (Qiagen, Germantown MD, USA) was chosen for the extractions. RNA extractions were performed according to the manufacturer’s protocol.
After elution of extracted RNA in 40 µl RNase-free H2O and passing the eluate through the filter one more time to elute more RNA, RNA concentration and quality were checked using a NanoDrop® ND-1000 UV/Vis-Spectrophotometer (Thermo Scientific, Carlsbad CA, USA). The concentrations varied between 50 and 200 ng/µl.
In order to eliminate any remaining genomic DNA, all RNA samples were treated with DNase 1 (New England Biolabs, Ipswich MA, USA). Therefore, the extracted RNA was incubated with DNase 1 and a DNase 1 reaction buffer at 37°C for 10-15 minutes and at 75°C for 5-10 minutes in order to inactivate the enzyme (inactivation by adding EDTA was not necessary). The digested RNA samples were adjusted to a similar RNA concentration (ca. 50 ng/µl) for the following cDNA synthesis to ensure a similar RNA input in later reactions utilized for quantitative comparisons.
19
2.4 cDNA reverse transcription After adjusting all samples to similar RNA concentrations, cDNA synthesis was performed using the High Capacity cDNA Reverse Transcription Kit according to the manufacturer’s protocol (Life Technologies (Thermo Fisher Scientific), Carlsbad CA, USA). After the synthesis reaction, all cDNA samples were further diluted to a final concentration of 10 ng/µl using RNase-free H2O. Thus, an input volume of 1 µl of cDNA sample in one RT-qPCR reaction provided a cDNA mass of 10 ng (previously determined as optimal for an efficient RT-qPCR reaction).
2.5 Quantitative Real-Time PCR (RT-qPCR) In order to investigate whether increasing temperature had an effect on the expression levels of certain candidate genes and if this effect was dependent on the location of the sampling sites either close to the sea or inland, a gene expression study was performed using quantitative Real-Time PCR (RT-qPCR) as the main experimental approach.
2.5.1 Candidate and reference genes
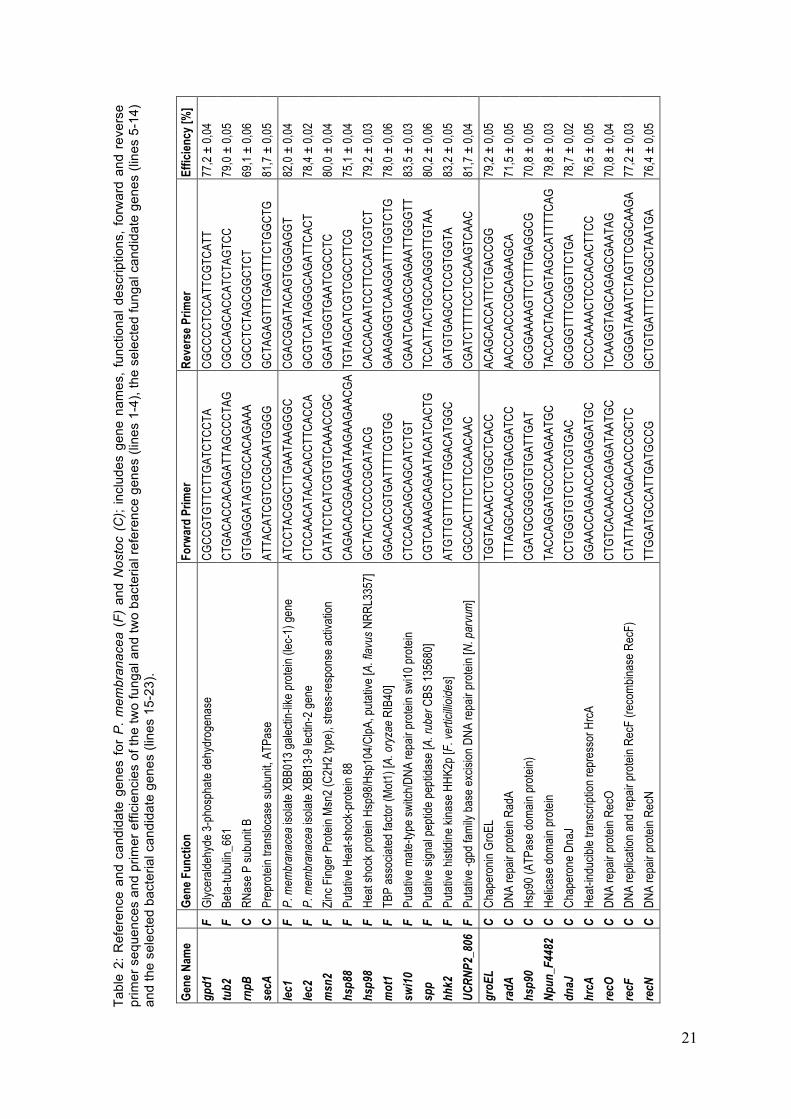
The effect of increasing temperature on gene expression of fungal genes was surveyed in a previously performed RNAseq-based transcriptome study performed on P. membranacea (Werth & Andrésson, unpublished). Based on this study, fungal candidate genes showing expression differences at different temperatures were chosen. Nostoc candidate genes were chosen based on sequences deposited in GenBank as well as literature reports with a focus on DNA repair genes, heat-shock genes and chaperones, all of which were suspected to be affected by high temperatures/temperature stress (Table 2). Initially, expression of a broad set of candidate genes (20 fungal and 18 Nostoc genes) was tested in only two lichen individuals from one sea-exposed and one inland site in order to determine genes showing expression differences between the temperature extremes (5°C and 25°C). After confirmation of initially observed expression differences by testing individuals from another two sea-exposed and two inland sites, ten differentially expressed fungal and nine cyanobacterial candidates were determined and tested in all remaining individuals, sites and all three temperatures. The final nineteen fungal and cyanobacterial candidates varied in function from heat-shock and DNA repair genes to transcriptional regulators and symbiosis-associated genes (Table 2).
2.5.1.1 P. membranacea Hhk2 and Msn2 are part of the Hog1 pathway, which is essential for inducing transcription of stress response element-containing genes under external stress (Schüller et al. 1994, Martínez-Pastor et al. 1996, Stock et al. 2000, Enjalbert et al. 2006, Gasch 2007, Schmoll 2008, Liu et al. 2013). Mot1 and Swi10 are members of the Swi/Snf2 family with Mot1 playing a role in transcriptional regulation of stress responsive TATA box-containing

20
genes under stress conditions and Swi10 in DNA repair (Yasuhira et al. 1999, Zanton and Pugh 2004, Dasgupta et al. 2007, Lopez-Maury et al. 2008, Sikorski and Buratowski 2009). The heat shock genes hsp88 and hsp98 are members of a broad heat shock response network playing an important role in preventing aggregation of denatured proteins and repair of misfolded protein due to heat stress (Vassilev et al. 1992, Plesofsky-Vig and Brambl 1998, Wang et al. 2007, Doyle and Wickner 2009). The single peptide peptidase Spp belongs to a network of membrane proteases and is thought to play a role in protein quality control by collecting damaged membrane protein aggregates for later disposal (Dalbey et al. 2012). UCRNP2_806 possibly contributes to base-excision based DNA repair. The lectin-like genes lec1 and lec2 were additionally chosen for expression analysis because of their believed importance in the symbiosis (Manoharan et al. 2012, Miao et al. 2012).
The P. membranacea glyceraldehyde-3-phosphate dehydrogenase 1 (gpd1) and tubulin 2 (tub2) genes were used as reference genes. These genes were chosen based on the literature (Manoharan et al. 2012, Miao et al. 2012) and on the previous RNAseq-based transcriptome study on P. membranacea (Werth & Andrésson, unpublished). Both reference genes were additionally tested for expression stability throughout the experiment, which could be confirmed (standard deviations of Ct values <10% (gpd1 = 7,6%; tub2 = 9,2%)). For both reference genes, Tukey´s t-test revealed no significant expression differences between temperatures and sites.
2.5.1.2 Nostoc The final Nostoc candidate genes hsp90 and dnaJ as well as heat shock chaperone groEL and the transcription repressor hrcA are involved in the cyanobacterial heat stress responses (Langer et al. 1992, Wiech et al. 1992, Hartl 1996, Mendoza et al. 1996, Goloubinoff et al. 1997, King-Chuen and Wai 1998, Young 2001, Hossain and Nakamoto 2003, Melkani et al. 2005, Rajaram and Apte 2010, Reddy et al. 2011, Wallenius et al. 2011). The Nostoc genes radA, recF, recN and recO are involved in the cyanobacterial SOS DNA damage repair (Sargentini and Smith 1986, Rostas et al. 1987, Odsbu and Skarstad 2014) and the candidate Npun_F4482 might play a role base-excision DNA repair.
For the cyanobacterial photobiont Nostoc, the RNase P subunit B (rnpB) and preprotein translocase subunit A (secA) were chosen as reference genes as they had been validated in a previous study of Nostoc sp. (Pinto et al. 2012). Expression stability could be confirmed for both reference genes (standard deviation: rnpB = 13,9%; secA = 8,7%). Expression of both cyanobacterial reference genes was not significantly different between temperatures and sites.
21
Tabl
e 2:
Ref
eren
ce a
nd c
andi
date
gen
es fo
r P
. m
embr
anac
ea (
F) a
nd N
osto
c (C
); in
clud
es g
ene
nam
es, f
unct
iona
l des
crip
tions
, for
war
d an
d re
vers
e pr
imer
seq
uenc
es a
nd p
rimer
effi
cien
cies
of t
he tw
o fu
ngal
and
two
bact
eria
l ref
eren
ce g
enes
(lin
es 1
-4),
the
sele
cted
fung
al c
andi
date
gen
es (l
ines
5-1
4)
and
the
sele
cted
bac
teria
l can
dida
te g
enes
(lin
es 1
5-23
).
Tabl
e 2:
Ref
eren
ce a
nd c
andi
date
gen
es f
or P
. m
embr
anac
ea (
F) a
nd N
osto
c (C
); in
clud
es g
ene
nam
es,
func
tiona
l de
scrip
tions
, fo
rwar
d an
d re
vers
e pr
imer
sequ
ence
s an
d pr
imer
effi
cien
cies
of
the
two
fung
al a
nd t
wo
bact
eria
l re
fere
nce
gene
s (li
nes
1-4)
, th
e se
lect
ed f
unga
l ca
ndid
ate
gene
s (li
nes
5-14
) an
d th
e
sele
cted
bac
teria
l can
dida
te g
enes
(lin
es 1
5-23
).
Gen
e Na
me
G
ene
Func
tion
Forw
ard
Prim
er
Reve
rse
Prim
er
Effic
ienc
y [%
]
gpd1
F
Gly
cera
ldeh
yde
3-ph
osph
ate
dehy
drog
enas
e
CG
CC
GTG
TTC
TTG
ATC
TCC
TA
CG
CC
CC
TCC
ATTC
GTC
ATT
77,2
± 0
,04
tub2
F
Beta
-tubu
lin_6
61
CTG
ACAC
CAC
AGAT
TAG
CC
CTA
G
CG
CC
AGC
ACC
ATC
TAG
TCC
79
,0 ±
0,0
5
rnpB
C
RN
ase
P su
buni
t B
GTG
AGG
ATAG
TGC
CAC
AGAA
A C
GC
CTC
TAG
CG
GC
TCT
69,1
± 0
,06
secA
C
Prep
rote
in tr
ansl
ocas
e su
buni
t, AT
Pase
AT
TAC
ATC
GTC
CG
CAA
TGG
GG
G
CTA
GAG
TTTG
AGTT
TCTG
GC
TG
81,7
± 0
,05
lec1
F
P. m
embr
anac
ea is
olat
e XB
B013
gal
ectin
-like
pro
tein
(lec
-1) g
ene
ATC
CTA
CG
GC
TTG
AATA
AGG
GC
C
GAC
GG
ATAC
AGTG
GG
AGG
T 82
,0 ±
0,0
4
lec2
F
P. m
embr
anac
ea is
olat
e XB
B13-
9 le
ctin
-2 g
ene
CTC
CAA
CAT
ACAC
ACC
TTC
ACC
A G
CG
TCAT
AGG
GC
AGAT
TCAC
T 78
,4 ±
0,0
2
msn
2 F
Zinc
Fin
ger P
rote
in M
sn2
(C2H
2 ty
pe),
stre
ss-re
spon
se a
ctiv
atio
n C
ATAT
CTC
ATC
GTG
TCAA
ACC
GC
G
GAT
GG
GTG
AATC
GC
CTC
80
,0 ±
0,0
4
hsp8
8 F
Puta
tive
Hea
t-sho
ck-p
rote
in 8
8 C
AGAC
ACG
GAA
GAT
AAG
AAG
AAC
GA
TGTA
GC
ATC
GTC
GC
CTT
CG
75
,1 ±
0,0
4
hsp9
8 F
Hea
t sho
ck p
rote
in H
sp98
/Hsp
104/
Clp
A, p
utat
ive
[A. f
lavu
s N
RR
L335
7]
GC
TAC
TCC
CC
CG
CAT
ACG
C
ACC
ACAA
TCC
TTC
CAT
CG
TCT
79,2
± 0
,03
mot
1 F
TBP
asso
ciat
ed fa
ctor
(Mot
1) [A
. ory
zae
RIB
40]
GG
ACAC
CG
TGAT
TTTC
GTG
G
GAA
GAG
GTC
AAG
GAT
TTG
GTC
TG
78,0
± 0
,06
swi1
0 F
Puta
tive
mat
e-ty
pe s
witc
h/D
NA
repa
ir pr
otei
n sw
i10
prot
ein
CTC
CAG
CAG
CAG
CAT
CTG
T C
GAA
TCAG
AGC
GAG
AATT
GG
GTT
83
,5 ±
0,0
3
spp
F Pu
tativ
e si
gnal
pep
tide
pept
idas
e [A
. rub
er C
BS 1
3568
0]
CG
TCAA
AGC
AGAA
TAC
ATC
ACTG
TC
CAT
TAC
TGC
CAG
GG
TTG
TAA
80,2
± 0
,06
hhk2
F
Puta
tive
hist
idin
e ki
nase
HH
K2p
[F. v
ertic
illioi
des]
AT
GTT
GTT
TCC
TTG
GAC
ATG
GC
G
ATG
TGAG
CC
TCC
GTG
GTA
83
,2 ±
0,0
5
UCRN
P2_8
06 F
Pu
tativ
e -g
pd fa
mily
bas
e ex
cisi
on D
NA
repa
ir pr
otei
n [N
. par
vum
] C
GC
CAC
TTTC
TTC
CAA
CAA
C
CG
ATC
TTTT
CC
TCC
AAG
TCAA
C
81,7
± 0
,04
groE
L C
Cha
pero
nin
Gro
EL
TGG
TAC
AAC
TCTG
GC
TCAC
C
ACAG
CAC
CAT
TCTG
ACC
GG
79
,2 ±
0,0
5
radA
C
DN
A re
pair
prot
ein
Rad
A TT
TAG
GC
AAC
CG
TGAC
GAT
CC
AA
CC
CAC
CC
GC
AGAA
GC
A 71
,5 ±
0,0
5
hsp9
0 C
Hsp
90 (A
TPas
e do
mai
n pr
otei
n)
CG
ATG
CG
GG
GTG
TGAT
TGAT
G
CG
GAA
AAG
TTC
TTTG
AGG
CG
70
,8 ±
0,0
5
Npun
_F44
82
C H
elic
ase
dom
ain
prot
ein
TAC
CAG
GAT
GC
CC
AAG
AATG
C
TAC
CAC
TAC
CAG
TAG
CC
ATTT
TCAG
79
,8 ±
0,0
3
dnaJ
C
Cha
pero
ne D
naJ
CC
TGG
GTG
TCTC
TCG
TGAC
G
CG
GG
TTTC
GG
GTT
CTG
A 78
,7 ±
0,0
2
hrcA
C
Hea
t-ind
ucib
le tr
ansc
riptio
n re
pres
sor H
rcA
GG
AAC
CAG
AAC
CAG
AGG
ATG
C
CC
CC
AAAA
CTC
CC
ACAC
TTC
C
76,5
± 0
,05
recO
C
DN
A re
pair
prot
ein
Rec
O
CTG
TCAC
AAC
CAG
AGAT
AATG
C
TCAA
GG
TAG
CAG
AGC
GAA
TAG
70
,8 ±
0,0
4
recF
C
DN
A re
plic
atio
n an
d re
pair
prot
ein
Rec
F (re
com
bina
se R
ecF)
C
TATT
AAC
CAG
ACAC
CC
GC
TC
CG
GG
ATAA
ATC
TAG
TTC
GG
CAA
GA
77,2
± 0
,03
recN
C
DN
A re
pair
prot
ein
Rec
N
TTG
GAT
GC
CAT
TGAT
GC
CG
G
CTG
TGAT
TTC
TCG
GC
TAAT
GA
76,4
± 0
,05

22
2.5.2 RT-qPCR primer design & efficiency control
RT-qPCR primers were designed for the fungal reference and candidate genes based on transcript sequences from the RNAseq study. RNAseq data for each candidate gene were aligned against the appropriate DNA sequence in order to determine exons and introns. The primers were designed to cross the boundary of two exons in order to be unable to amplify the genomic DNA, which still contains introns. This is an important feature to ensure that the received RT-qPCR signal originates from the binding of the primers to the RNA template and not from genomic DNA contamination in the sample. All primers were designed in conserved regions.
The RT-qPCR primers for the cyanobacterial reference and candidate genes were designed based on the DNA sequences of the Nostoc strains N6, N232, N210a and a Nostoc strain sequenced from Lobaria pulmonaria described previously (Gagunashvili et al. 2009). The protein sequences of the selected candidate genes were used as references to annotate the coding regions in the Nostoc DNA and the matching sequences of the different strains were aligned for primer design. Primers were designed in conserved regions in order to cover all different Nostoc strains, as we expected spatial variation in Nostoc strains of P. membranacea.
The selected primer sequences were checked for self-complementarity, melting temperature (~60°C), GC-content and self 3’ complementarity to the reverse primer according to the MIQE guidelines (Bustin et al. 2009). The amplicon lengths for all candidate genes varied between 90 and 220 base pairs. Primers were ordered from Microsynth, Balgach, Switzerland (HPLC purified and desalted). All primers were diluted to a working concentration of 5 µM (later 0.5 µl input in one 10 µl qPCR reaction) and first tested in normal PCR with a DNA template before using them for the qPCR. The primer efficiency of each primer pair was calculated based on a qPCR experiment using LinRegPCR version 11.0. Therefore, for each gene a linear regression analysis was performed with the raw data of a qPCR run (amplification data for each amplification cycle from 1 to 40) for all qPCR reaction wells containing one specific primer pair (all biological and technical replicates the gene was tested in). Using the slope of the resulting regression line the efficiency [%] was calculated for each gene (Bustin et al. 2009):
à Efficiency E = 10-(1/slope) -1 (equation 1)
The primer efficiencies for all genes were around +/- 80% (Table 1).
2.5.3 Experimental procedure
For the measurement of relative expression, RT-qPCR was performed using PowerSYBRgreen® PCR Master Mix as recommended in the manufacturer´s protocol (Life Technologies (Thermo Fisher Scientific), Carlsbad, CA, USA). The RT-qPCR was conducted on 96-well optical PCR plates (4titude, UK) using a total reaction volume of 10
23
µl on an ABI 7500 real-time PCR System (Life Technologies (Thermo Fisher Scientific), Carlsbad, CA, USA). The reactions were run in technical duplicates (for minimizing variation due to pipetting and intra-plate differences) and with non-template controls (NTC) in each run and for each gene. The RT-qPCR was started with 2 min hold at 50°C followed by a 10 min hot start at 95°C to heat-activate the hot start polymerase. Subsequently, amplification was performed with 40 cycles of 15 s denaturation at 95°C and one minute annealing/extension at 60°C. For each gene, a dissociation step was performed at the end of the amplification phase when it was used for the first time in RT-qPCR. Therefore, the temperature was increased to 60°C-95°C in order to identify the temperature were the gene specific primers dissociate from the template. This step was performed in order to identify a single specific melting temperature for each primer pair and to check the primer specificity in the different samples.
2.5.4 RT-qPCR data analysis
For comparison, the RT-qPCR raw data from all experiments were threshold and baseline adjusted. The analysis of the RT-qPCR data was performed according to the MIQE guidelines (Bustin et al. 2009). With the Ct-values of a selected candidate gene (mean values of the two technical duplicates) and the geometric mean of Ct-values of both reference genes (gpd1 and tub2 for P. membranacea and rnpB and secA for Nostoc), the ΔCt-values were calculated for each individual lichen sample in each sampling site for each temperature treatment (example: delta between “Ct of target gene for individual one in site one in temperature one” and the “geometric mean of the Cts of both reference genes in individual one in site one in temperature one”):
à ΔCt = mean Ct target gene – geomean Ct both ref. genes (equation 2)
Relative expressions (relative quantity = RQ) were then calculated based on the ΔΔCt-method. For this purpose, the sample with the lowest expression level was chosen as “reference sample” and set as a standard for all comparisons (reference sample = 1):
à ΔΔCt = ΔCt – ΔCt ref. sample (equation 3)
à Relative Expression (RQ) = 2 -ΔΔCt (equation 4)
Finally, the relative expression (RQ) values were plotted for the three different temperature treatments (5°C, 15°C and 25°C) in all eight sampling sites.
2.6 Statistical analysis The statistical analysis of the RT-qPCR data (ΔCt values) was performed using R 3.0.2 (R Development Core team, 2013). Due to the variability that was caused by random effects that are due to the five chosen lichen thalli per sampling site, a linear mixed-effects model was chosen for the statistical analysis (Bolker et al. 2009). Since the data were in
24
agreement with normal distribution, a linear model could be applied. To analyze the effect of the two (fixed) factors of interest (temperature and sampling site/habitat (sea-exposed vs. inland)) a multivariate ANOVA was performed using a linear mixed effects model (R package: “nlme”) where temperature and site were defined as fixed factors whereas the lichen individual was set as random factor. If the ANOVA revealed significant results for the factor temperature, a post-hoc test (Tukey´s honest significant difference test (Tukey 1949)) was performed to determine which temperature treatments were different from one another with respect to gene expression of the candidate genes. To determine differences between sea-exposed vs. inland habitats, a mixed model using temperature and habitat (sea vs. inland) as fixed factor and individual and sites within each habitat (4 sites each) as random factor was created and analyzed using ANOVA. To differentiate if there is rather a categorical or a gradual difference in temperature response, we also analyzed the factors “sea distance” and “elevation” in a linear model for each single gene using ANOVA. Expression correlation between fungal and cyanobacterial genes was further analyzed using correlation analysis (R package: “corrgram”) As alternative approach to the single gene analysis using ANOVA, we also performed a principle component analysis (PCA) (R package: “stats”). In the PCA, the expression data for all candidate genes were transformed into principle components according to how much of the data set variability they explain (PC1 = highest variability). Using this approach, one can account for temperature and habitat differences within the gene groups contributing to the principle components that explain most of the variance in the data set. Therefore, a PCA of the gene expression data was performed in addition to the gene-by-gene analysis using ANOVA in order to compare the outcome and the quality of both statistical analyses.

25
3 Results The research questions to be answered were:
(1) Does a moderate increase in temperature (5°C to 15°C to 25°C) cause a stress response reflected in the expression level of selected genes (Table 2) in both symbiosis partners (mycobiont and photobiont) of the lichen P. membranacea?
(2) Do lichens collected from the inland of Iceland show different temperature response patterns in these genes than lichens from coastal environments?
A multivariate ANOVA was performed using a linear mixed effects model with temperature and site as fixed factors and the lichen individual as a random factor (Table 2, Table 4). In cases when the ANOVA revealed significant results for the factor temperature, a Tukey´s honest significant difference test (Tukey´s Test) was performed to determine the effect of the three temperature treatments on the expression of the candidate genes (Table 3, Table 5). To further investigate research question 2 (habitat differences), a mixed model with temperature and habitat (sea vs. inland) as fixed factors and individuals and sites within each habitat (4 sites each) as random factors was used for ANOVA. To differentiate categorical from gradual differences in temperature response, the factors “gradually increasing distance from the sea (sea distance)” and “elevation above sea level (elevation)” were analyzed in addition to categorical habitats (sea-exposed vs. inland) using a linear model performed for each gene separately (ANOVA). Expression correlations among fungal and cyanobacterial genes were further examined using correlation analysis. As an alternative approach to the single gene analysis, we performed a principle components analysis (PCA) determining temperature responses and habitat differences of groups of genes based on their contribution to the total variation in gene expression.
3.1 Single gene expression responses (ANOVA)
3.1.1 P. membranacea
Out of 20 tested candidate genes for P. membranacea, the heat shock genes hsp88 and hsp98, the DNA repair gene UCRNP2_806, the zinc finger protein gene msn2, the TBP associated factor gene mot1, the histidine kinase gene hhk2, the signal peptide peptidase gene spp, the mating-type switching protein gene swi10 and lectin gene lec2 (nine genes in total; see Table 2) showed significant expression differences at increased temperatures relative to the reference genes gpd1 and tub2. The reference gene expression remained stable among temperatures and sites.
26
Figure 10: Relative gene expression (RQ) of fungal heat shock genes hsp88 and hsp98, plotted for all eight sampling sites at 5°C, 15°C and 25°C; the sample with lowest expression over all sites and temperatures was set as reference (RQ = 1). Sampling sites were arranged from sea-exposed (RY10) to inland (LL3).
ANOVA revealed a significant effect of increasing temperature on gene expression of the heat shock genes hsp88 and hsp98 (Fig. 10, p-values see Table 3). Tukey´s test revealed that the expression of both genes was significantly upregulated at 25°C compared to 5°C and 15°C (p-values see Table 4). For both genes, expression differed significantly between sites and there was a site-related difference in temperature response (interaction) (Table 3). The difference appeared to be correlated with sea distance rather than with elevation or categorical habitats (sea vs. inland) (Table 3).
27
Figure 11: Relative gene expression (RQ) of fungal genes UCRNP2_806, msn2, mot1, hhk2, spp and swi10 plotted for all sampling sites (arranges from sea-exposed to inland) at 5°C, 15°C and 25°C; the sample with the lowest expression was set as reference (RQ = 1). See also legend of Fig. 10.
For the six fungal genes UCRNP2_806, msn2, mot1, hhk2, spp and swi10 multivariate ANOVA (fixed effects: temperature, site) revealed significantly higher gene expression levels at increased temperatures as well (Fig. 11, p-values Table 3). Expression of all six genes was significantly increased at 25°C compared to 5°C and also compared to 15°C. For UCRNP2_806, hhk2 and swi10, increased expression already occurred at 15°C (Table 4). Furthermore, expression of all six genes differed significantly between sites and for UCRNP2_806, mot1 and hhk2 also the temperature response in expression was different between sites (Table 3). However, these differences were rather associated with increasing sea-distance (and for mot1 and spp also with elevation) than with the categorical variable habitat (sea vs. inland) (Table 3).

28
Figure 12: Relative expression (RQ) of galectin-like genes lec1 and lec2 for all sampling sites at 5°C, 15°C and 25°C; sample with lowest expression set as reference (RQ = 1). See also legend of Fig. 10.
Gene expression patterns of the two galectin-like genes lec1 and lec2, which are thought to be important in the lichen symbiosis (Manoharan et al. 2012, Miao et al. 2012), were quite different. While expression of lec1 was not significantly affected by temperature, lec2 expression was significantly downregulated at 15°C and 25°C compared to 5°C. Expression of both lectins differed among sites, which was not only dependent on sea distance and elevation but also on categorical habitats (sea vs. inland) (Table 3).
Table 3: Significance (p-values) of multivariate ANOVA for fungal genes. Column 2-4: ANOVA results of linear mixed-effects model using temperature and site as fixed and lichen individual as random factor. Column 5-6: ANOVA results of linear mixed-effects model with temperature and habitat as fixed and site and individual within site as random factors. Column 7: temperature and sea-distance as linear factor (linear model). Column 8: temperature and elevation as linear factor (linear model). Significant effects on gene expression (ΔCt values) are marked with grey shading.
1
Fungal gene
2
temperature
3
site
4 interaction temp x site
5
habitat
6 interaction
temp x habitat
7 sea
distance
8
elevation
hsp88 <0,0001 <0,0001 0,0069 0,7411 0,1085 0,0037 0,5120
hsp98 <0,0001 <0,0001 0,0290 0,5699 0,0796 <0,0001 0,9940
UCRNP2_806 <0,0001 <0,0001 0,0037 0,6022 0,5349 <0,0001 0,6880
msn2 <0,0001 <0,0001 0,0602 0,6704 0,2155 <0,0001 0,1091
mot1 <0,0001 <0,0001 0,0261 0,6044 0,3893 <0,0001 0,0369
hhk2 <0,0001 0,0002 0,0095 0,4847 0,3800 0,0121 0,9680
spp <0,0001 <0,0001 0,6052 0,4749 0,9782 <0,0001 0,0280
swi10 <0,0001 <0,0001 0,1218 0,4512 0,9640 <0,0001 0,1670
lec1 0,5903 <0,0001 0,9046 0,0353 0,1855 <0,0001 <0,0001
lec2 <0,0001 <0,0001 0,8560 0,0074 0,1991 <0,0001 <0,0001

29
Table 4: Significance (p-values) of Tukey´s honest significant difference test for the effect of the three temperature treatments (5°C vs. 15°C, 5°C vs. 25°C and 15°C vs. 25°C) on gene expression (ΔCt values) for fungal candidate genes (linear mixed-effects model: temperature and site = fixed factors, lichen individual = random factor). Significant values are marked with grey shading.
Fungal gene 5°C vs. 15°C 5°C vs. 25°C 15°C vs. 25°C
hsp88 0,1665 <0,0001 <0,0001 hsp98 0,0383 <0,0001 <0,0001
UCRNP2_806 0,0358 <0,0001 0,0011 msn2 0,6539 <0,0001 <0,0001 mot1 0,3001 <0,0001 0,0001 hhk2 <0,0001 <0,0001 <0,0001 spp 0,4230 <0,0001 0,0004
swi10 0,0263 <0,0001 0,0004 lec1 0,9559 0,7561 0,5789 lec2 <0,0001 <0,0001 0,9954
In short, expression of hsp88 and hsp98, UCRNP2_806, msn2, mot1, hhk2, spp and swi10 was significantly upregulated (Figs. 10 and 11) whereas lec2 expression was downregulated with increasing temperatures. Gene expression of these nine genes as well as of lec1 further differed significantly between sites and for hsp88, hsp98, UCRNP2_806, mot1 and hhk2 the temperature response in gene expression was also different between sites. For lec1 and lec2, a categorical difference in expression between habitats (sea vs. inland) was found (Fig. 12). The gradual distance to the sea and the elevation above sea level significantly influenced expression of many more genes than the categorical difference between sea-exposed vs. inland habitats. However, neither sea distance nor elevation correlated significantly with the temperature response in gene expression (i.e. no interaction effects). Generally, the effect of temperature on gene expression was far greater than the effect of sampling sites as indicated by the consistently larger F-values for temperature in the ANOVA test statistic (see supplementary Table S4).
3.1.2 Nostoc
Of all 18 investigated genes for the Nostoc photosymbiont, expression of the DNA repair genes radA, recF, recN and recO, the heat shock chaperone genes groEL and dnaJ, heat shock gene hsp90, helicase-domain containing gene Npun_F4482 and heat-inducible transcription repressor gene hrcA (9 genes in total; see Table 2) was significantly different at increased temperatures relative to the two reference genes rnpB and secA. Expression of rnpB and secA remained stable among temperatures and sites.
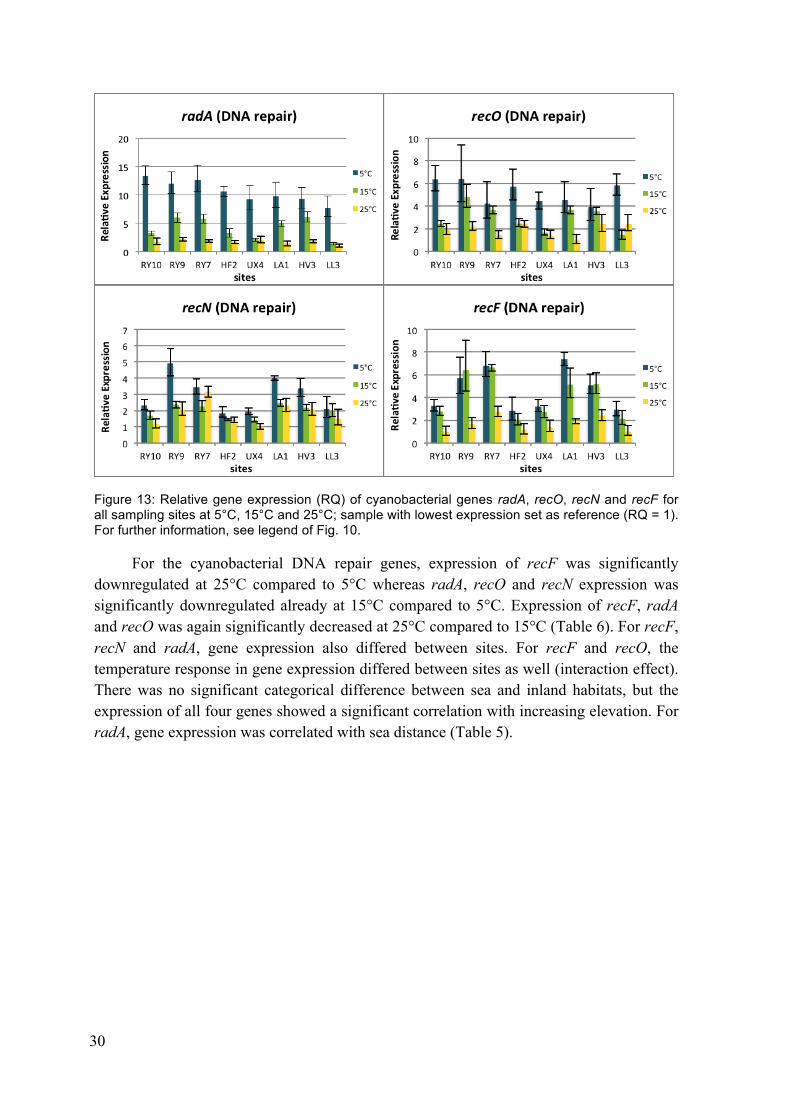
30
Figure 13: Relative gene expression (RQ) of cyanobacterial genes radA, recO, recN and recF for all sampling sites at 5°C, 15°C and 25°C; sample with lowest expression set as reference (RQ = 1). For further information, see legend of Fig. 10.
For the cyanobacterial DNA repair genes, expression of recF was significantly downregulated at 25°C compared to 5°C whereas radA, recO and recN expression was significantly downregulated already at 15°C compared to 5°C. Expression of recF, radA and recO was again significantly decreased at 25°C compared to 15°C (Table 6). For recF, recN and radA, gene expression also differed between sites. For recF and recO, the temperature response in gene expression differed between sites as well (interaction effect). There was no significant categorical difference between sea and inland habitats, but the expression of all four genes showed a significant correlation with increasing elevation. For radA, gene expression was correlated with sea distance (Table 5).

31
The expression of the chaperone gene groEL decreased significantly at 25°C compared to 5°C and also compared to 15°C (Table 6) and differed considerably between sampling sites. However, neither categorical habitat nor sea distance nor elevation showed significant correlation with gene expression (Table 5). The chaperone gene dnaJ was significantly upregulated in its expression at 25°C compared to 5°C and 15°C (Table 6). dnaJ expression also differed between sites, where sea distance showed only a marginally significant correlation (Table 5). Similar to the fungal heat shock genes hsp88 and hsp98, the heat shock gene hsp90 in Nostoc and the cyanobacterial helicase domain-containing gene Npun_F4482 showed significantly higher expression both at 15°C and 25°C compared to 5°C (Table 6). Expression of both photobiont genes differed significantly between sites and habitat; sea distance and elevation showed significant correlations with gene expression (Table 5). The transcription repressor gene hrcA showed a significant expression increase at 15°C vs. 5°C and at 25°C vs. 15°C (Table 6), in addition to
Figure 14: Relative gene expression (RQ) of five cyanobacterial candidate genes (groEL, dnaJ, hsp90, Npun_F4482 and hrcA) for all sampling sites at 5°C, 15°C and 25°C; the sample with lowest expression was set as reference sample (RQ = 1). For further information, see legend of Fig. 10.

32
expression differences between sites. Moreover, in this case there was a significant interaction between temperature response and site and a significant difference in gene expression according to elevation (Table 5).
Table 5: Significance (p-values) of multivariate ANOVA for cyanobacterial genes. Column 2-4: ANOVA results of linear mixed-effects model using temperature and site as fixed and individual as random factor. Column 5-6: ANOVA results of linear mixed-effects model with temperature and habitat as fixed and site and individual as random factors. Column 7: temperature and sea-distance (linear model). Column 8: temperature and elevation (linear model). Significant effects on gene expression (ΔCt values) are marked in grey shading.
1
Fungal gene
2
temperature
3
site
4 interaction temp x site
5
habitat
6 interaction
temp x habitat
7 sea
distance
8
elevation
radA <0,0001 <0,0001 0,0254 0,1662 0,7230 <0,0001 0,0001 recO <0,0001 0,1023 0,0380 0,1462 0,7478 0,2400 0,0074 recN <0,0001 <0,0001 0,4531 0,8699 0,5734 0,7980 0,0032 recF <0,0001 <0,0001 0,9828 0,9404 0,6719 0,2200 0,0356
groEL 0,0014 <0,0001 0,9073 0,4896 0,2738 0,4460 0,0738 dnaJ <0,0001 <0,0001 0,3926 0,8768 0,0645 0,0514 0,1100 hsp90 <0,0001 0,0001 0,8684 0,0339 0,7788 <0,0001 0,0019
Npun_F4428 <0,0001 <0,0001 0,7440 0,0060 0,4919 <0,0001 <0,0001 hrcA <0,0001 0,0001 0,0297 0,3894 0,3752 0,1075 0,0051
Table 6: Significance (p-values) of Tukey´s honest significant difference test for the effect of the three temperature treatments (5°C vs. 15°C, 5°C vs. 25°C and 15°C vs. 25°C) on gene expression (ΔCt values) for cyanobacterial candidate genes (linear mixed-effects model: temperature and site = fixed factors, individual = random factor). Significant values are marked with grey shading.
Nostoc gene 5°C vs. 15°C 5°C vs. 25°C 15°C vs. 25°C
radA <0,0001 <0,0001 <0,0001 recO <0,0001 <0,0001 0,0024 recN <0,0001 <0,0001 0,3365 recF 0,4232 <0,0001 <0,0001
groEL 0,3238 0,0010 0,0627 dnaJ 0,1905 <0,0001 <0,0001 hsp90 <0,0001 <0,0001 0,2062
Npun_F4428 <0,0001 <0,0001 0,4940 hrcA 0,0020 <0,0001 <0,0001
In short, for the DNA repair genes radA, recF, recN and recO and the chaperone gene groEL the increase in temperature was associated with a significant decrease in
33
expression. In contrast, for the chaperone gene dnaJ, the heat shock gene hsp90, the helicase domain-containing gene Npun-F4482 and the heat-inducible transcription-repressor gene hrcA, expression was significantly increased in higher temperatures (Fig. 13). Expression of all genes except recO differed between sites. For the genes radA, recO and hrcA, also the temperature response in expression differed significantly between sites (interaction). However, F-values indicated a stronger effect of temperature than site on gene expression (see supplement Table S4). For Npun_F4482 and hsp90, a difference in expression between habitat categories (sea vs. inland) was found. However, elevation above sea level and sea distance showed stronger correlations with expression differences for many more genes than the categorical difference between sea-exposed vs. inland habitats (Table 4).
3.2 Single gene correlations To investigate correlations among and between fungal and cyanobacterial candidate genes, a correlation analysis was performed with the RT-qPCR gene expression data (ΔCt values, normalized to reference gene expression) in order to determine which genes showed similar expression patterns with response to the factors temperature and sampling site. Since the same RNA isolates were used to test both fungal and cyanobacterial candidate genes, it was possible to determine correlations both among and between fungal and cyanobacterial genes.
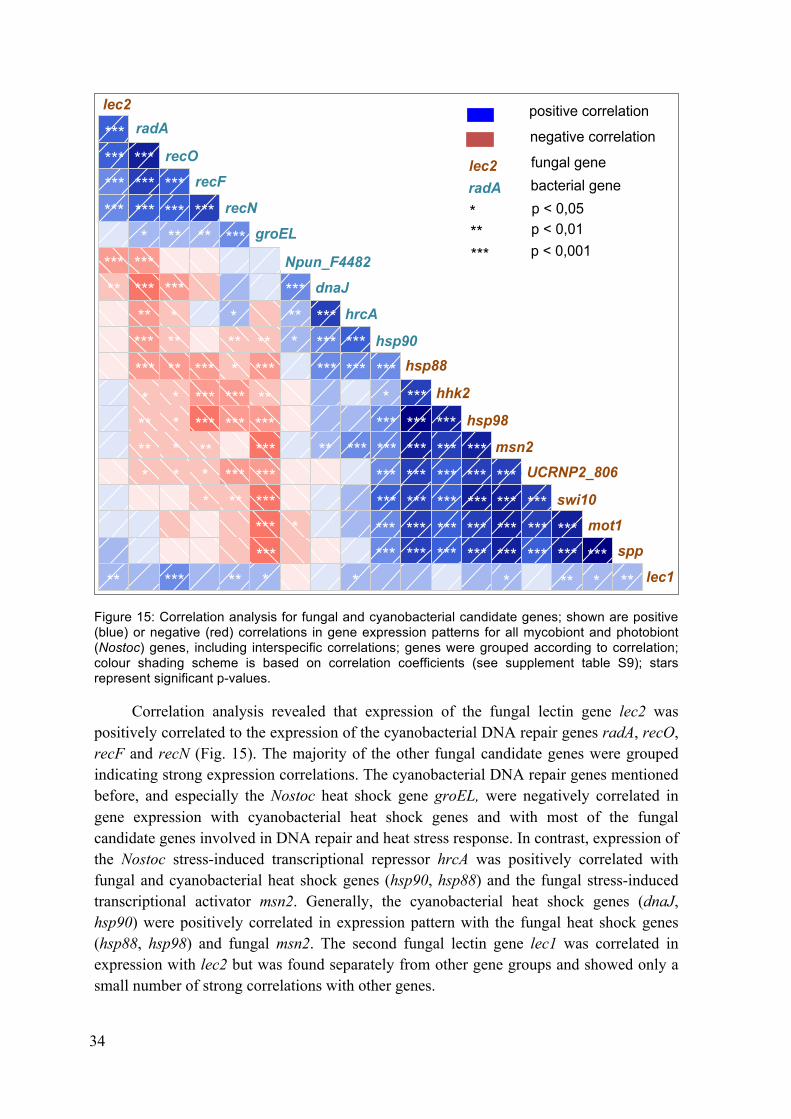
34
Lec2
RadA
RecO
RecF
RecN
GroEL
Npun_F4482
DnaJ
HrcA
Hsp90
Hsp88
HHK2p
Hsp98
Msn2
UCRNP2
Swi10
Mot1
SPP
Lec1**
*** ***
*** *** *** *** *** *** *** *** ***
*** *** *** *** ***
*** *** *** *** *** ***
*** *** *** *** *** ***
* * *** ** * ** ** *
*** *** *** *** *** ** *** *
*** *** *** *** * *** *** * ** *** *** *** * * * *** *** *** ** ** ** * *** *** *** *** ** * * ** *** *** * *
*** *** *** ** ** ** * *** ** ** * *
*** *** *** ** *** ***
*** ** ** * *** *** *** ***
*** *** *** *** ***
***
lec2 radA
recO
recF
recN
groEL
Npun_F4482
dnaJ
hrcA
hsp90 hsp88
hhk2
hsp98
msn2 UCRNP2_806
swi10
mot1
spp
lec1
lec2 radA
*** ** *
positive correlation
negative correlation
fungal gene bacterial gene p < 0,05 p < 0,01 p < 0,001
Figure 15: Correlation analysis for fungal and cyanobacterial candidate genes; shown are positive (blue) or negative (red) correlations in gene expression patterns for all mycobiont and photobiont (Nostoc) genes, including interspecific correlations; genes were grouped according to correlation; colour shading scheme is based on correlation coefficients (see supplement table S9); stars represent significant p-values.
Correlation analysis revealed that expression of the fungal lectin gene lec2 was positively correlated to the expression of the cyanobacterial DNA repair genes radA, recO, recF and recN (Fig. 15). The majority of the other fungal candidate genes were grouped indicating strong expression correlations. The cyanobacterial DNA repair genes mentioned before, and especially the Nostoc heat shock gene groEL, were negatively correlated in gene expression with cyanobacterial heat shock genes and with most of the fungal candidate genes involved in DNA repair and heat stress response. In contrast, expression of the Nostoc stress-induced transcriptional repressor hrcA was positively correlated with fungal and cyanobacterial heat shock genes (hsp90, hsp88) and the fungal stress-induced transcriptional activator msn2. Generally, the cyanobacterial heat shock genes (dnaJ, hsp90) were positively correlated in expression pattern with the fungal heat shock genes (hsp88, hsp98) and fungal msn2. The second fungal lectin gene lec1 was correlated in expression with lec2 but was found separately from other gene groups and showed only a small number of strong correlations with other genes.
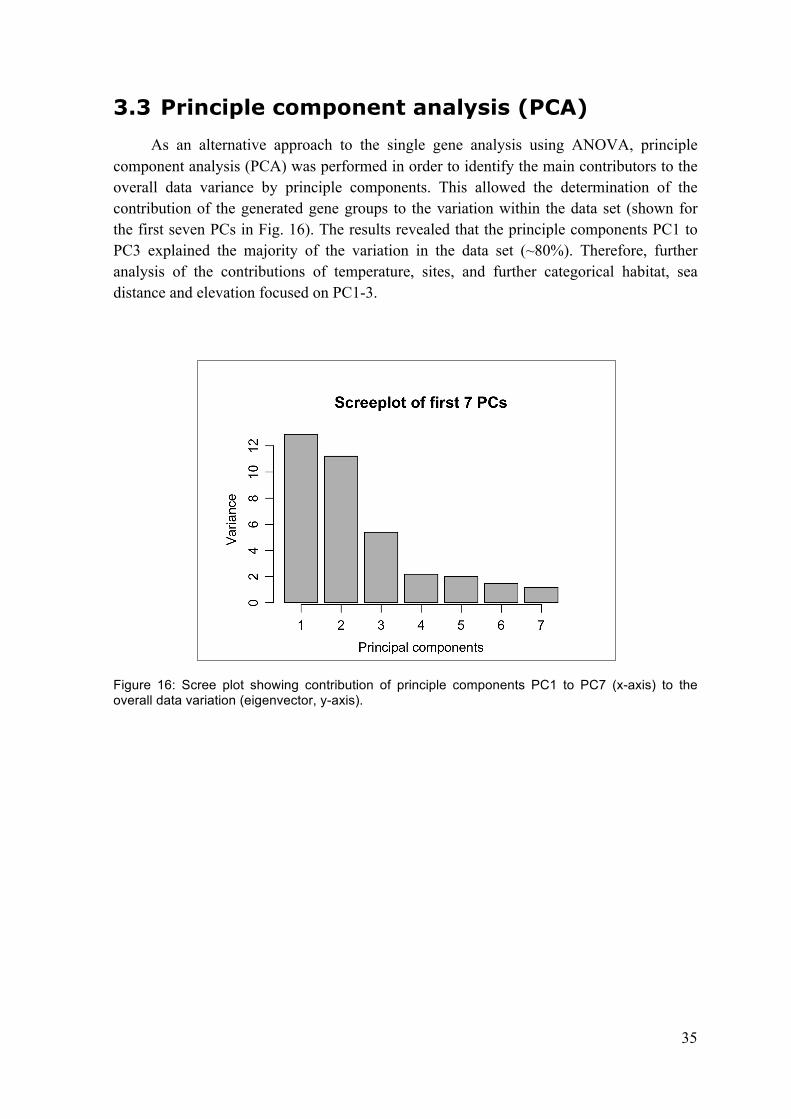
35
3.3 Principle component analysis (PCA) As an alternative approach to the single gene analysis using ANOVA, principle component analysis (PCA) was performed in order to identify the main contributors to the overall data variance by principle components. This allowed the determination of the contribution of the generated gene groups to the variation within the data set (shown for the first seven PCs in Fig. 16). The results revealed that the principle components PC1 to PC3 explained the majority of the variation in the data set (~80%). Therefore, further analysis of the contributions of temperature, sites, and further categorical habitat, sea distance and elevation focused on PC1-3.
Figure 16: Scree plot showing contribution of principle components PC1 to PC7 (x-axis) to the overall data variation (eigenvector, y-axis).

36
Figure 17: Axis loadings of the first three axes, PC1-3. The figure shows to what extent individual genes contribute to each principle component. Positive or negative loadings represent the direction of the contribution relative to the PC vector.
lec1
lec2
hsp9
0
Npu
n_F448
2
hsp8
8
hsp9
8
UCR
NP2
_806
msn2
mot1
hhk2
spp
swi10
dnaJ
groE
L
hrcA
radA
recF
recN
recO
lec1
lec2
hsp9
0
Npu
n_F448
2
hsp8
8
hsp9
8
UCR
NP2
_806
msn2
mot1
hhk2
spp
swi10
dnaJ
groE
L
hrcA
radA
recF
recN
recO
lec1
lec2
hsp9
0
Npu
n_F448
2
hsp8
8
hsp9
8
UCR
NP2
_806
msn2
mot1
hhk2
spp
swi10
dnaJ
groE
L
hrcA
radA
recF
recN
recO

37
The highest contribution to PC1 was by the fungal lectin gene lec2 (~85%) and further by lec1 (~30%) as well as the cyanobacterial DNA repair genes radA, recF, recN and recO (~10-30%) (Fig. 17). PC2 was mainly composed of the majority of the other fungal candidate genes with smaller contributions by the fungal gene lec1, cyanobacterial hsp90 and others. For PC3, the fungal gene lec1 was the major contributor, followed by smaller contributions of lec2 and groEL. However, the contribution of lec1 and lec2 were opposite in direction.
Figure: 18: The effect of temperature (15°C and 25°C compared to 5°C) on gene expression for the first three principle components PC1-3. (A) PC1, (B) PC2 and (C) PC3; x-axis: temperature, y-axis: axis scores created by the transformation of the gene expression data for PC1-3. Boxes enclose upper and lower quartile around the median (the line separating the upper and lower half of the data) and upper and lower whiskers represent 95% of data (outliers shown as dots).
There were significant differences between temperature treatments in PC1 and PC2 but not in PC3 (Table 6). In PC1, which was composed mainly of the genes lec2 and partly lec1, radA, recF, recN and recO, there was a significant decrease in expression between 5°C compared to 15°C and to 25°C (Table 7, Figs. 12, 13 and 18). In contrast, PC2 containing the major set of other fungal candidate genes (heat-stress response, DNA repair) was characterized by a significant increase in gene expression occurring at 25°C compared to 5°C and 15°C (Table 7). In PC3, mainly characterized by lec1 contribution, there was no significant difference in gene expression between the three temperatures (Table 7).
A B C
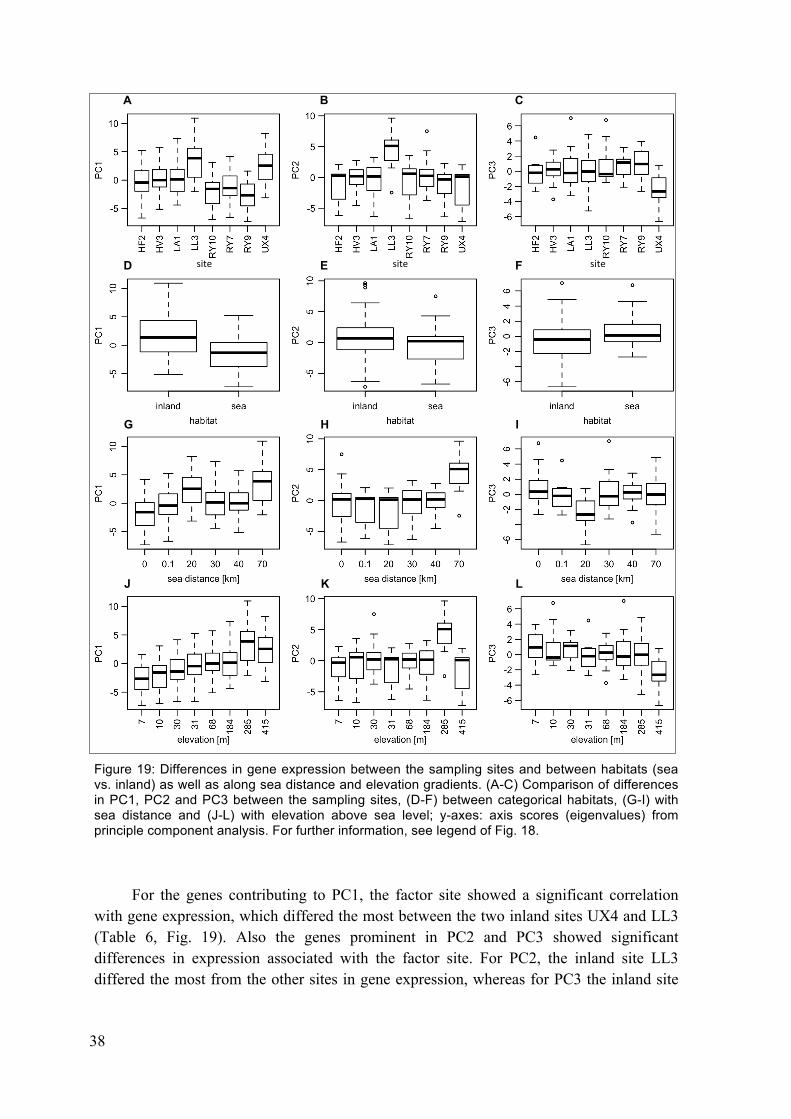
38
Figure 19: Differences in gene expression between the sampling sites and between habitats (sea vs. inland) as well as along sea distance and elevation gradients. (A-C) Comparison of differences in PC1, PC2 and PC3 between the sampling sites, (D-F) between categorical habitats, (G-I) with sea distance and (J-L) with elevation above sea level; y-axes: axis scores (eigenvalues) from principle component analysis. For further information, see legend of Fig. 18.
For the genes contributing to PC1, the factor site showed a significant correlation with gene expression, which differed the most between the two inland sites UX4 and LL3 (Table 6, Fig. 19). Also the genes prominent in PC2 and PC3 showed significant differences in expression associated with the factor site. For PC2, the inland site LL3 differed the most from the other sites in gene expression, whereas for PC3 the inland site
site site site
A B C
D E F
G H I
J K L

39
UX4 differed the most. The PCA also revealed a significant difference in temperature response for PC2 related genes (Table 6). Focusing on PC1, the analysis further revealed a categorical difference between sea-exposed and inland sites. However, for PC2 and PC3 there was no categorical difference between habitats. For sea distance and elevation, the PCA revealed that gene expression differed along both gradients in PC1 (Table 6) with a more significant effect of elevation than increasing sea distance on gene expression. This was confirmed by the ANOVA results in the first part, since the cyanobacterial DNA repair genes radA, recF, recN and recO (contributing to PC1) showed stronger correlations with the factor elevation than with sea distance. Furthermore, the PCA revealed a significant correlation of temperature response differences with changing elevation for the set of genes contributing to PC1, an effect, which was not evident in the ANOVA approach.
Table 6: Significance (p-values) of multivariate ANOVA for PC1-3. Column 2-4: ANOVA results of linear mixed-effects model using temperature and site as fixed and individual as random factor. Column 5-6: ANOVA results of linear mixed-effects model using temperature and habitat as fixed and site and individual within site as random factors. Column 7-8: temperature and sea-distance as fixed and site and individual as random factors. Column 9-10: temperature and elevation as fixed and site and individual as random factors. Significant effects and/or interactions are marked in grey shading.
1
PC
2
temp.
3
site
4
interaction temp x site
5
habitat
6 interaction
temp x habitat
7
sea distance
8 interaction
temp x distance
9
elevation
10 interaction
temp x elevation
1 <0,0001 <0,0001 0,5721 0,0141 0,0926 0,0139 0,0723 0,0007 0,0168
2 <0,0001 <0,0001 0,0162 0,4642 0,3666 0,1205 0,1106 0,4884 0,1078
3 0,0509 0,0006 0,9977 0,1687 0,6967 0,4848 0,6563 0,0188 0,7285
Table 7: Significance (p-values) of Tukey´s honest significant difference test for the effect of the three temperature treatments (5°C vs. 15°C, 5°C vs. 25°C and 15°C vs. 25°C) in PC1-3 (linear mixed-effects model: temperature and site = fixed factors, individual = random factor). Significant values are marked in grey shading.
PC 5°C vs. 15°C 5°C vs. 25°C 15°C vs. 25°C
1 <0,0001 <0,0001 0,4187
2 0,2522 <0,0001 <0,0001 3 0,0463 0,2100 0,7570
40
3.4 Summary In conclusion, the analysis using a multivariate ANOVA approach revealed significant expression differences of both fungal and cyanobacterial genes at increased temperatures and between sampling sites where the temperature effect exceeded that of site differences. The differences between sites showed better correlation to the gradually changing variables sea distance and elevation above sea level than to categorical habitats (sea-exposed vs. inland). A subset of fungal and cyanobacterial genes further showed significant differences in temperature response at different sites. However, there were no significant differences in temperature response in correlation with different habitats, sea distances or elevation levels. The correlation analysis and the alternative PCA approach further revealed that certain fungal and cyanobacterial genes were more similar in their expression responses patterns to the investigated factors than others. Whereas the genes contributing mostly to PC1 (fungal lec2, cyanobacterial radA, recO, recF and recN) showed a major response to the temperature increase from 5°C to 15°C, the majority of other fungal candidates (PC2) were most strongly affected by the increase from 15°C to 25°C, and there was no strongly significant temperature effect associated with PC3 (mainly lec1). Generally, the PCA axes of PC1 and PC2 were most strongly influenced by temperature. The PCA also revealed site differences (PC1: greatest in LL3 and UX4; PC2: greatest in LL3; PC3: greatest in UX4) and a difference in temperature response at different sites for the genes contributing to PC2. For PC1, significant habitat differences were found. However, sea distance and elevation again played a more significant role for PC1 and PC3 than for PC2. Generally, gene expression in PC1 was strongly affected by elevation and in PC3 by sea distance. For PC1, the PCA further revealed a significant difference in temperature response with increasing elevation indicating a differing temperature response with increasing elevation.
41
4 Discussion This study has shown that expression of certain candidate genes in the fungal and cyanobacterial symbiont of Peltigera membranacea lichens changed significantly even at moderately increased temperatures. Therefore, the first research question asking if increased temperatures cause a stress response reflected on the expression level of fungal and Nostoc candidate genes was confirmed. Furthermore, the study identified two gene groups, one showing a decrease in expression associated with a temperature shift from 5°C to 15°C and another one characterized by increased expression at 25°C. Expression of cyanobacterial DNA repair genes and the fungal lec2 gene was downregulated already at 15°C compared to 5°C whereas most fungal heat shock genes, DNA repair genes and genes involved in transcriptional regulation of stress responses were upregulated at 25°C. Gene expression also differed between sites. However the site effect was smaller than the temperature effect. For lec2 and the cyanobacterial DNA repair genes, the gene expression temperature response also differed significantly between sites. The differences in gene expression showed a greater correlation with increasing sea distance and elevation above sea level than with habitat categories (sea exposed vs. inland). This might be an indication that increasing temperatures might affect lichens from higher elevations in a different way than lichens from lower elevations. This finding contributed to answering the second research question asking if lichens from different habitats differ in temperature response.
4.1 Temperature responses This study revealed that expression of candidate genes involved in transcriptional regulation of fungal stress responses as well as of several fungal and cyanobacterial genes encoding heat-shock and DNA repair proteins was strongly affected by increasing temperature.
4.1.1 P. membranacea
Focusing on the mycobiont P. membranacea, three genes involved in the transcriptional regulation of stress-responsive genes (e.g. heat shock and DNA repair genes) showed increased expression at higher temperatures. The TATA-binding protein associated factor mot1 was significantly upregulated at 25°C. Mot1 is a member of the Swi/Snf2 family and belongs to the SAGA multi-protein complex involved in transcriptional regulation of TATA-box containing genes through repressing the binding of the TATA-binding protein (TBP) (Dasgupta et al. 2007, Lopez-Maury et al. 2008). Under stress conditions, Mot1 is recruited together with the active and assembled SAGA complex and is assumed to control the temporary induction of stress-induced genes, which often

42
contain the TATA-box element (Zanton and Pugh 2004, Lopez-Maury et al. 2008). Although Mot1 is a repressor of TBP, it has the ability to upregulate gene expression by displacing transcriptionally inactive forms of TBP from TBP-promoters (Sikorski and Buratowski 2009). Therefore, the observed expression patterns of mot1 might indicate the transcriptional induction of stress-responsive TATA-box containing genes involved in e.g. DNA and protein repair, suggesting that 25°C represent heat stress for P. membranacea requiring stress response activation. However, to get a clear and more specific picture the expression analysis of other members of this pathway such as snf2 and tbp would be highly valuable.
Exposure to increased temperatures also caused an upregulation of the fungal histidine kinase hhk2 gene and the zinc-finger transcription factor msn2 gene. As part of two-component regulatory systems, histidine kinases such as hhk2 can function as sensors of environmental stimuli that can trigger a molecular response to environmental stress (Stock et al. 2000, Gasch 2007, Schmoll 2008). In S. cerevisiae, a two-component system regulates the Hog1 pathway for transcriptional induction of stress responsive genes under external stress (Schüller et al. 1994, Enjalbert et al. 2006, Gasch 2007). The Hog1-induced transcription factor Msn2 is responsible for activating expression of various stress response genes (heat shock genes, DNA repair genes) containing stress response elements (STREs) (Martínez-Pastor et al. 1996, Rep et al. 2000, Gasch 2007, Liu et al. 2013). Therefore, the observed upregulation of hhk2 and msn2 indicates heat stress for the lichens at 25°C leading to the transcriptional upregulation of stress-responsive genes. Secondly, this study confirmed the existence of the conserved Hog1 stress response pathway in P. membranacea similar to S. cerevisiae and most other fungi, in contrast to the orthologous Sty1-mediated stress response pathway as in Sz. pombe, (Gasch 2007). However, for confirmation it should be investigated, whether the expression of hog1 and other genes contributing to the pathway (see introduction) is also upregulated and whether hog1 repressing elements are simultaneously downregulated.
In addition to showing increased expression of transcriptional regulators inducing transcription of stress response genes, the study also revealed increased expression of specific candidate genes involved in heat shock and DNA repair. Expression of heat-shock chaperone genes hsp88 and hsp98 as well as of the fungal signal peptide peptidase spp gene was significantly upregulated at 25°C. Hsp88 and Hsp98 have been described in Neurospora crassa (Ascomycota) as important and highly conserved elements of the heat-shock machinery showing marked increase in expression during heat-shock (Vassilev et al. 1992, Plesofsky-Vig and Brambl 1998). Whereas Hsp88 (Hsp110 family) in conjunction with Hsp30 prevents aggregation of denatured proteins during thermal stress, the hexameric Hsp98 (71% identity to S. cerevisiae Hsp104) is required for resolubilization/dissociation and refolding of damaged protein aggregates (Vassilev et al. 1992, Plesofsky-Vig and Brambl 1998, Wang et al. 2007, Doyle and Wickner 2009). Following dissociation by Hsp98, the denatured proteins can be refolded in the Hsp40/Hsp70 chaperone system (Doyle and Wickner 2009). Signal peptide peptidases
43
represent an important quality control for membrane proteins through their ability to remove damaged or misfolded membrane proteins in response to external stress such as heat (Dalbey et al. 2012). In line with these previous results this study indicates that the moderate temperature stress of 15°C to 25°C can represent heat-stress conditions for the lichen-forming fungus P. membranacea requiring increased protein repair including dissociation of damaged and aggregated membrane proteins.
The mating-type switching/DNA repair protein Swi10, which plays an important role in DNA repair under stress conditions, and the fungal DNA repair protein UCRNP2_806 also showed increased expression associated with temperature increase. The Swi/Snf2 family member Swi10 has been shown to be involved in nucleotide excision repair under UV-stress conditions (Yasuhira et al. 1999). The gpd-family base-excision DNA repair protein UCRNP2_806 is believed to contribute to base-excision DNA repair (http://www.uniprot.org/uniprot/R1GVL6; accessed 10.07.2015). Therefore, the upregulation of swi10 and UCRNP2_806 expression at higher temperatures indicate an increased level of DNA damage calling for repair. However, further studies need to be performed in order to develop a clearer picture of the role of UCRNP2_806, since little is known about its specific pathway or interaction partners.
In addition to genes involved in the fungal stress response, expression of the fungal lectin genes lec1 and lec2, which are thought to be involved in interactions with the Nostoc symbiont, was studied to gain information about potential interactions among symbionts at increased temperatures. Most interestingly, gene expression of the fungal lectin lec2 was strongly downregulated already at a temperature increase to 15°C whereas no significant temperature effect was found for lec1. A study on the effect of temperature stress on coral larvae of Acropora millepora before they establish the symbiosis with their algal partners showed that mannose-binding C-type lectin in the coral was downregulated at increased temperatures (Rodriguez-Lanetty et al. 2009). This goes hand in hand with our findings concerning lec2 expression. The carbohydrate binding properties of lectins are important for cell-cell recognition and are therefore though to play an important role in symbiont communication of plant-microbial and fungal-microbial symbioses (McCowen et al. 1986, Sharon and Lis 2004, Antonyuk and Evseeva 2006, Manoharan et al. 2012, Miao et al. 2012). Therefore, the observed drop in lec2 expression could indicate that increased temperatures might affect the symbiosis between P. membranacea and Nostoc. In a wheat symbiosis with Azospirillum brasilense, different wheat lectin concentrations were shown to affect a range of metabolic processes such as nitrogen fixation in the rhizobacterial symbionts (Antonyuk and Evseeva 2006). Interestingly, the correlation analysis revealed that a set of cyanobacterial DNA repair genes expected to be upregulated in response to heat stress as commonly observed in other bacterial species, showed strong correlation in expression with the fungal lec2 gene (downregulation in expression) (Fig. 15). This could indicate a relation between the cyanobacterial DNA damage response and the amount of fungal Lec2. The study on wheat lectin revealed that wheat plants that differed in lectin content also had differential stress responses towards nitrogen starvation, indicating a

44
further role of lectins in the stress response. However, to clarify this relationship and to determine whether a temperature increase could affect the lichen symbiosis itself through changing lec2 expression, further studies need to be performed. Regarding the fungal lectin gene lec1, no temperature-related gene expression differences were found in this study. Miao et al. (2012) showed that the symbiosis-related gene lec1 is differentially expressed in different lichen tissues (thalli, rhizines and apothecia), which differed by the presence or absence of the photobiont. Depending on the variation intensity it might be conceivable that this tissue-specific variation in expression might have obscured expression changes due to increased temperature even though all samples derived from marginal areas. However, further tissue-specific gene expression studies need to be performed in order to fully understand differential expression of lec1.
4.1.2 Nostoc
In the photobiont Nostoc, expression of the heat-shock chaperone genes hsp90 and dnaJ as well as the cyanobacterial gene Npun_F4482 was significantly upregulated at higher temperatures. Hsp90 prevents non-native proteins - mainly signal transduction proteins - from forming unproductive protein aggregates (Wiech et al. 1992, Hartl 1996) and contributes to general refolding of denatured proteins under heat stress (Hartl 1996, Young 2001). Similarly, as part of the Hsp70/Hsp40 cycle, the Hsp40 protein DnaJ contributes to refolding of denatured proteins due to heat and cold stress (Langer et al. 1992, King-Chuen and Wai 1998). Studies among fish, plants and cyanobacteria revealed increased gene expression of both hsp90 and dnaJ under heat and oxidative stress (Hossain and Nakamoto 2003, Reddy et al. 2011). Confirming these findings, the present study suggests that 25°C also induces heat stress in the Nostoc symbiont. Npun_F4482 is a helicase-domain-containing protein identified in Nostoc punctiforme, showing similarity to DNA-repair protein Rad25 in eukaryotes. Eukaryotic Rad25 has been shown to function in nucleotide-excision repair processes of damaged DNA under UV stress. Therefore, the observed increase in expression could indicate elevated DNA damage at higher temperatures calling for repair in Nostoc. However, further studies need to be performed in order to determine in which DNA repair pathway Npun_F4482 might be involved and why it behaves in a different manner than the other Nostoc DNA repair genes studied (see below).
In contrast to what was expected, expression of heat-shock gene groEL and the LexA-regulated SOS DNA repair genes radA, recO, recN and recF was not upregulated at increased temperatures. Together with GroES, GroEL is part of the Hsp60/Hsp10 complex for protein damage repair (Goloubinoff et al. 1997, Melkani et al. 2005). In E. coli and B. subtilis, the RecN protein is recruited for repair of DNA double strand breaks followed by the recruitment of RecF and RecO and further RadA (Sargentini and Smith 1986, Odsbu and Skarstad 2014). The groEL downregulation contrasts to studies showing an upregulation of groEL in response to heat shock in E. coli and Anabaena (Mendoza et al. 1996, Melkani et al. 2005, Rajaram and Apte 2010). Expression of groEL and groES is
45
regulated by the transcriptional repressor HrcA. When hrcA is downregulated, groEL and groES expression can be induced (Rajaram and Apte 2010, Wallenius et al. 2011). This negative expression correlation can be confirmed in this study, since hrcA expression shows a strongly significant increase already at 15°C. This result indicates that in contrast to the heat stress system involving Hsp90 and DnaJ, the GroEL/GroES heat stress response system is repressed in the Nostoc photobiont at increased temperatures. However, to further strengthen this finding, it would be necessary to also analyze expression of the groES and hrcA genes using lichen thalli and cultured Nostoc strains from lichens. Furthermore, genome analysis of symbiotic Nostoc in Icelandic lichens has revealed two copies of the groEL gene. Therefore, the temperature response of the second groEL copy also needs to be determined. The downregulation of the SOS DNA repair genes is in contrast to previous studies on these genes in other bacteria (Sargentini and Smith 1986, Rostas et al. 1987, Odsbu and Skarstad 2014) and to the expression results for the fungal DNA repair genes investigated (e.g. UCRNP2_806, swi10), which were found to be upregulated at increased temperatures. One possible explanation could be that the observed downregulation is due to a general downregulation of metabolism and physiology in Nostoc (Kosugi et al. 2014) in order to prepare for the usual drying out that occurs at increasing temperatures. However, this hypothesis is unlikely, since in that case expression downregulation of more genes involved in all other kinds of processes would have been expected, including the cyanobacterial reference genes rnpB and secA (which remained stable in expression). Another explanation could be that the observed expression results might be related to the temperature exposure time. Studies on UV stress in E. coli revealed that there are two phases after stress induction. In the first phase, which lasts about 10-20 minutes, the nucleoids are aggregated into compact structures in the cell and in the second phase, which lasts about one hour, the DNA is distributed in the whole cell. Expression of recN and recO and also expression of the recombination proteins recA and recR was found to be upregulated in the first phase after induction of the SOS response to DNA damage (Odsbu and Skarstad 2014). Since in this study expression was measured after three hours of exposure to the increased temperature, the expression might already have dropped after primary induction. This could explain the observed decrease in expression of DNA repair genes in Nostoc. In order to determine whether DNA repair gene expression in Nostoc increases transiently after stress induction, a time series needs to be performed where RNA sampling is performed at several timepoints within the first and the second phase of the DNA damage response. An alternative hypothesis explaining the expression downregulation of the DNA repair genes and perhaps also of the groEL gene involves a possible interaction between the symbionts. As mentioned before, the multiple regression analysis revealed a strong positive correlation in expression of the cyanobacterial DNA repair genes with fungal lec2 expression. This could be an indication that the observed downregulation of the DNA repair genes is related to the drop in lec2 expression. However, to further investigate this hypothesis, the relation between lec2 and the cyanobacterial SOS DNA repair system (including also other candidates involved in the SOS DNA repair such as recA/B/C/J, radB and repressor lexA) as well as possibly the GroEL/GroES heat shock system needs to be determined further. In addition, DNA repair
46
gene and groEL/groES expression should be determined in pure Nostoc cultures for comparison, since a difference between pure Nostoc and Nostoc living in symbiosis could support a possible symbiosis effect.
4.1.3 Summary of temperature responses
In summary, this study has revealed that a temperature increase from 5°C to 15°C and further to 25°C leads to transcriptional induction of diverse stress response pathways reflected in the upregulation of gene expression of many stress response genes in P. membranacea. A subset of the fungal candidate genes are known to play an important role in processes such as the heat stress response e.g. through upregulating the transcription of heat stress-responsive genes (mot1, hhk2, msn2) (Dasgupta et al. 2007, Gasch 2007, Lopez-Maury et al. 2008, Schmoll 2008, Liu et al. 2013) or through direct repair of heat stress-induced protein damage or misfolding (hsp88, hsp98) (Vassilev et al. 1992, Plesofsky-Vig and Brambl 1998) or DNA damage (UCRNP2_806, swi10). Expression of most of the fungal stress response genes was increased at 25°C compared to 5°C and 15°C. Hence, 25°C represents a heat-stress condition for Icelandic P. membranacea. However, to further strengthen the results, expression of other genes involved in the described heat-stress responses and DNA repair pathways need to be investigated. Candidate genes of interest would be: the fungal heat shock genes hsp30, hsp40 and hsp70, further members of the Swi/Snf2 pathway (e.g. snf2 and tbp) as well as further members of the Hog1 pathway (Hog1, Sln1, Ssk1, Ssk2, Ssk22, phosphatases Pyp1 and Pyp2 and the transcriptional regulator Msn4).
For the photobiont Nostoc, the results also showed an upregulation of candidate genes involved in cyanobacterial heat stress response processes (dnaJ, hsp90) and DNA repair (Npun_F4482). Hence, the tested temperatures (15°C and 25°C) also seem to cause heat stress in the photosymbiont. However, expression of cyanobacterial SOS DNA repair genes (radA, recF, recN and recO) and heat shock gene groEL was significantly downregulated at increased temperatures, which contrasts to other studies in bacteria. The drop in groEL expression makes sense in a biological context, since expression of the groEL repressor gene hrcA is upregulated at increased temperatures. However, expression of a second copy of the groEL gene present in Nostoc needs to be investigated to strengthen these findings. For the expression drop of the Nostoc SOS DNA repair genes an explanation might be that the gene expression quantification after three hours of exposure only captured the second stress response phase characterized by decreased expression after an initial increase. Sampling at several timepoints during the heat exposure could help to resolve this question. Taking the positive correlation of the drop of cyanobacterial DNA repair gene expression with the downregulation of fungal lectin lec2 into account, an alternative explanation could be a possible functional relation. However, the connection between the fungal lec2 and the bacterial genes needs to be investigated further (e.g. by a comparison with the expression in pure Nostoc cultures) in order to clarify the role of lec2 in establishing and maintaining or changing the symbiosis and to elucidate possible other
47
roles. Among additional Nostoc candidate genes involved in the described pathways are the cyanobacterial heat shock gene groES, the cyanobacterial DNA repair genes recA/B/C/J, radB and the repressor of the SOS DNA damage response, lexA.
A study on P. scabrosa (MacFarlane and Kershaw 1980) determined that 25°C represents a thermal stress condition for the lichen reflected in nitrogenase activity, photosynthesis and respiration rate. Generally, the photobiont showed a lower stress tolerance than the photobiont. The results of the present study go hand in hand with this previous findings since many photobiont genes showed a stress response already at lower temperatures (15°C) than most mycobiont genes (25°C).
4.2 Habitat differences
4.2.1 Sites
To enable short-term acclimation to a common environment, all samples were kept in the laboratory for three weeks at constant temperature, light and moisture conditions. This should minimize differences due to long-term acclimatization to naturally differing environmental conditions. This acclimation method seemed to have been successful since a short-term response in gene expression after increased temperatures was clearly detectable. However, in addition to the expression changes detected with increasing temperature, gene expression also differed significantly between sampling sites, especially the two inland sites located at Uxahryggir (UX4) and Hrauneyjar (LL3) as clearly revealed by the PCA. Since all samples had been acclimated to constant conditions, these observed differences could either be a long-term site acclimatization effect and/or local adaptation (genetic) of the sampled lichen populations to the different environments. Genetic variation between populations is a well-known phenomenon studied in many species (Iguchi et al. 2004, Pálsson et al. 2014) but has not yet found major attention in connection with lichens. One study on the lichen Tephromela atra in Europe found genetic differences between individuals from wood vs. rock substrates within sites (Muggia et al. 2008). Another study on Ramalina menziesii showed genetic variation in the photobiont according to phorophyte species (Werth and Sork 2010). However, to further determine the role of long-term acclimatization vs. genetic adaptation effects in this study, the genetic background of the lichen individuals has to be taken into account. RAD sequencing has been performed as part of another project, which will provide genotype data of samples included in this study that can be used to address this question. For an evaluation of expression differences due to site-specific acclimation or genetic differences, it would be interesting to repeat the experiment using lichen individuals from several sites, transplanting them to the same habitat for a whole-year acclimation cycle (common garden) and comparing gene expression results of this experiment with the present results.

48
4.2.2 Categories and gradients
In addition to differences between individual study sites, the PCA revealed a general difference in gene expression between categorical seashore versus inland habitats for the fungal lec2 gene and a subset of cyanobacterial DNA repair genes (radA, recF, recN and recO) (PC1). This indicates not only acclimation to or genetic differences between local habitats but also a categorical higher-level acclimatization dependent on shore proximity or inland location, although this effect was much weaker than the temperature response. However, in the above gene set, local expression changes were much more strongly correlated with increasing elevation above sea level than with categorical habitats (sea-exposed vs. inland). In addition, expression patterns of the genes mentioned above (PC1) and for the fungal lec1 gene also correlated significantly with gradually increasing distance from the sea. Hence, the relation between variation in gene expression and habitat cannot be explained just by the categorical sea proximity or inland location but might be more complex, depending on gradually changing variables such as sea distance, elevation or potentially other confounding climatic parameters. A relationship between genetic variation and a gradually changing physical parameter such as altitude has been found for many species. A 2008 study showed differential expression of nearly 200 transcripts between high-altitude and low-altitude populations of the rufous-collared sparrow (Zonotrichia capensis) (Cheviron et al. 2008). However, in our system, other abiotic and biotic factors such as soil properties, topology, nutrient availability, salt content, microclimatic effects such as irradiation (e.g. presence/absence of tree cover) or niche competition can also explain gene expression differences between local populations.
4.2.3 Temperature response
Focusing on the temperature response in gene expression, response differences between sites were found for the majority of fungal candidate genes (PC2). For the PC1 genes (Nostoc DNA repair genes and fungal lec2), there were response differences associated with increasing elevation above sea level. This could be an indication that long-term acclimatization or genetic adaptation of a lichen population to a specific location and along an elevation gradient affects the reaction of its individuals to increasing temperature conditions at the gene expression level. Differences in response to salt stress were found in coastal vs. inland populations of the monkey flower (Mimulus guttatus) and the Mediterranean shrub Atriplex halimus (Ben Hassine et al. 2008, Lowry et al. 2009). In the brown trout (Salmo trutta L.) expression differences of common heat-shock and osmoregulative genes were found between individuals from different populations correlated to local adaptation on a regional scale (Larsen et al. 2008). In 1989, a study on the epiphytic lichen Ramalina menziesii revealed distinct differences in photosynthetic and respirational responses at increasing temperatures between lichens from locations with different natural temperature variation (Larson 1989). In this study, individuals from locations with naturally higher temperature stress (greater temperature amplitude) also showed a higher stress resistance in the temperature treatments compared to individuals

49
from cool coastal rainforest areas. Similar to these studies, the findings of the current study on Icelandic P. membranacea lichens suggests that lichen populations from different locations along an elevation gradient differ slightly in their stress responses to moderately increased temperatures due to long-term acclimatization, or due to genetic differences.

50

51
5 Conclusion The aims of this study were to determine stress responses in Icelandic P. membranacea lichens to moderately increased temperatures and possible response differences due to differing habitats. Therefore, lichens from sea-exposed and inland locations were collected and expression of fungal and cyanobacterial candidate genes (involved in heat stress response and DNA repair) was investigated at 5°C, 15°C and 25°C. The results indicated that increased temperatures of 15°C and 25°C represent a heat stress condition for Icelandic populations of the lichen forming fungus P. membranacea and for their Nostoc photobionts. Higher temperatures led to increased expression of genes involved in transcriptional induction of diverse fungal stress response pathways and of genes directly involved in heat shock-induced protein and DNA damage repair in both symbionts. However, a set of photobiont SOS DNA repair genes (radA, recF, recN and recO), which was strongly correlated in expression with the fungal galectin-like gene lec2, was downregulated when brought from 5°C to 15°C. Since lec2 is thought to play an important role in the symbiosis, this finding is an interesting indication for a possible interplay between symbionts and should be investigated further. Generally, the PCA analysis added some information to the results, which would not have been pointed out clearly by the ANOVA approach and has therefore proven very useful in this context. The PCA revealed two gene groups with differing temperature response, the PC2 fungal genes affected at 25°C and the PC1 cyanobacterial DNA repair genes and lec2 showing decreased expression at 15°C. However, to support a possible symbiosis effect, it needs to be clarified further whether the photobiont cultured in isolation shows similar gene expression patterns at increased temperatures as in the symbiotic state. Furthermore, the study suggests a set of additional candidate genes involved in general stress response pathways of fungi and bacteria, which can be investigated in the future to strengthen the findings on heat stress presented here.
The conduction of a three-week acclimation phase has proven useful in minimizing individual differences due to site-specific acclimatization to temperature, light, moisture or other unknown factors potentially differing between habitats. Expression responses to increased temperatures in the laboratory were clearly detectable. However, the study also revealed site-specific expression differences that could be either due to local long-term acclimatization or genetic adaptation. For a larger number of fungal and cyanobacterial genes, these differences had a stronger correlation with gradually increasing sea distance and elevation than with general habitats categorized by either sea proximity or inland location showing the complexity of stress response variation. For the PC1 gene group (see above), the study further revealed differences in the temperature response associated with gradually increasing elevation. Hence, this study suggests that Icelandic lichen populations
52
might differ in their response to increased temperatures depending on the elevation of their habitat and might therefore be affected differently by globally increasing temperatures. However, further studies need to be performed including more individuals and sites along an elevation gradient to allow a more precise evaluation of the elevation effect. In addition to an elevation gradient there are also other factors (e.g. tree coverage, salt content) that might affect thermal stress responses in a species, which need to be investigated further in order to receive a more general picture of the flexibility of temperature stress responses in lichens.
As a next step, it would be interesting to also investigate long-term temperature responses in lichens since this study was mainly focused on short-term acclimation effects in gene expression in response to increased temperatures. An elevation of stress responsive candidate gene expression at various timepoints beyond three hours (e.g. up to three weeks) could provide information in a longer time frame. In other species different phases of temperature stress response have been observed, characterized by up- or downregulations of certain gene groups (O Leyva-Perez et al. 2015). Such information would be important for a more complete answer to the general question, if and how lichens are able to survive constant temperature stress and if there are consistent differences between the symbiosis partners in coping with long-term temperature stress. The further investigation of the relation of the fungal lectin lec2 and cyanobacterial genes that showed correlated expression could provide further information about how increased temperatures may affect the symbiotic interaction of P. membranacea and Nostoc. However, for a general picture of long-term temperature responses in lichens it is essential to differentiate between acclimatization and adaptation effects by making use of the genotyping data and by reverting acclimatizations through transplantation of thalli. Only if achieved stress adaptability can be inherited to the next generation, lichens may be able to avoid extinction in times of increasing stress levels due to changing climate.
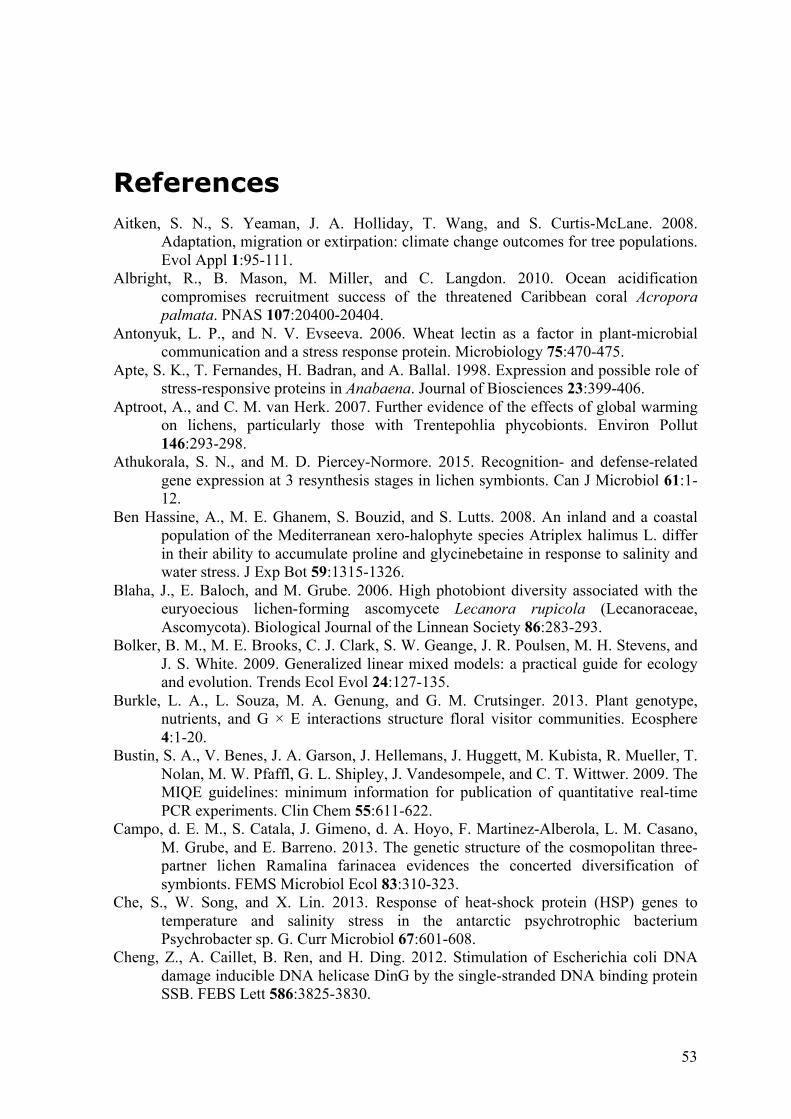
53
References Aitken, S. N., S. Yeaman, J. A. Holliday, T. Wang, and S. Curtis-McLane. 2008.
Adaptation, migration or extirpation: climate change outcomes for tree populations. Evol Appl 1:95-111.
Albright, R., B. Mason, M. Miller, and C. Langdon. 2010. Ocean acidification compromises recruitment success of the threatened Caribbean coral Acropora palmata. PNAS 107:20400-20404.
Antonyuk, L. P., and N. V. Evseeva. 2006. Wheat lectin as a factor in plant-microbial communication and a stress response protein. Microbiology 75:470-475.
Apte, S. K., T. Fernandes, H. Badran, and A. Ballal. 1998. Expression and possible role of stress-responsive proteins in Anabaena. Journal of Biosciences 23:399-406.
Aptroot, A., and C. M. van Herk. 2007. Further evidence of the effects of global warming on lichens, particularly those with Trentepohlia phycobionts. Environ Pollut 146:293-298.
Athukorala, S. N., and M. D. Piercey-Normore. 2015. Recognition- and defense-related gene expression at 3 resynthesis stages in lichen symbionts. Can J Microbiol 61:1-12.
Ben Hassine, A., M. E. Ghanem, S. Bouzid, and S. Lutts. 2008. An inland and a coastal population of the Mediterranean xero-halophyte species Atriplex halimus L. differ in their ability to accumulate proline and glycinebetaine in response to salinity and water stress. J Exp Bot 59:1315-1326.
Blaha, J., E. Baloch, and M. Grube. 2006. High photobiont diversity associated with the euryoecious lichen-forming ascomycete Lecanora rupicola (Lecanoraceae, Ascomycota). Biological Journal of the Linnean Society 86:283-293.
Bolker, B. M., M. E. Brooks, C. J. Clark, S. W. Geange, J. R. Poulsen, M. H. Stevens, and J. S. White. 2009. Generalized linear mixed models: a practical guide for ecology and evolution. Trends Ecol Evol 24:127-135.
Burkle, L. A., L. Souza, M. A. Genung, and G. M. Crutsinger. 2013. Plant genotype, nutrients, and G × E interactions structure floral visitor communities. Ecosphere 4:1-20.
Bustin, S. A., V. Benes, J. A. Garson, J. Hellemans, J. Huggett, M. Kubista, R. Mueller, T. Nolan, M. W. Pfaffl, G. L. Shipley, J. Vandesompele, and C. T. Wittwer. 2009. The MIQE guidelines: minimum information for publication of quantitative real-time PCR experiments. Clin Chem 55:611-622.
Campo, d. E. M., S. Catala, J. Gimeno, d. A. Hoyo, F. Martinez-Alberola, L. M. Casano, M. Grube, and E. Barreno. 2013. The genetic structure of the cosmopolitan three-partner lichen Ramalina farinacea evidences the concerted diversification of symbionts. FEMS Microbiol Ecol 83:310-323.
Che, S., W. Song, and X. Lin. 2013. Response of heat-shock protein (HSP) genes to temperature and salinity stress in the antarctic psychrotrophic bacterium Psychrobacter sp. G. Curr Microbiol 67:601-608.
Cheng, Z., A. Caillet, B. Ren, and H. Ding. 2012. Stimulation of Escherichia coli DNA damage inducible DNA helicase DinG by the single-stranded DNA binding protein SSB. FEBS Lett 586:3825-3830.
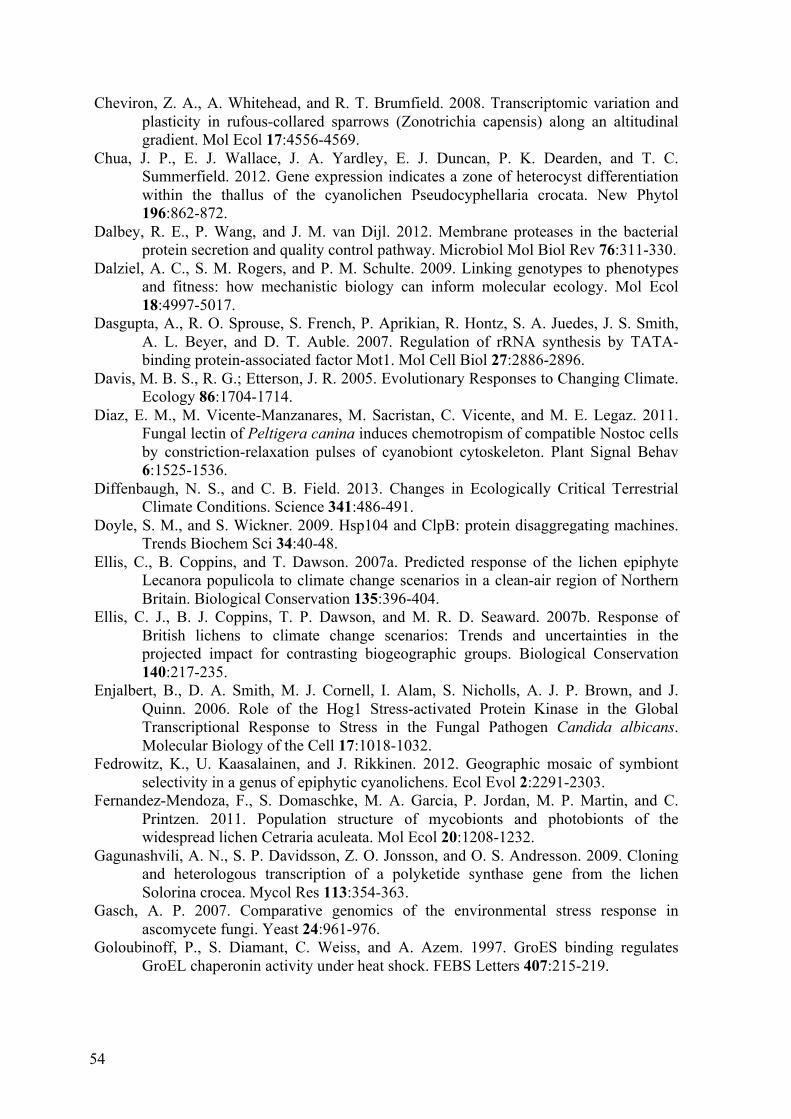
54
Cheviron, Z. A., A. Whitehead, and R. T. Brumfield. 2008. Transcriptomic variation and plasticity in rufous-collared sparrows (Zonotrichia capensis) along an altitudinal gradient. Mol Ecol 17:4556-4569.
Chua, J. P., E. J. Wallace, J. A. Yardley, E. J. Duncan, P. K. Dearden, and T. C. Summerfield. 2012. Gene expression indicates a zone of heterocyst differentiation within the thallus of the cyanolichen Pseudocyphellaria crocata. New Phytol 196:862-872.
Dalbey, R. E., P. Wang, and J. M. van Dijl. 2012. Membrane proteases in the bacterial protein secretion and quality control pathway. Microbiol Mol Biol Rev 76:311-330.
Dalziel, A. C., S. M. Rogers, and P. M. Schulte. 2009. Linking genotypes to phenotypes and fitness: how mechanistic biology can inform molecular ecology. Mol Ecol 18:4997-5017.
Dasgupta, A., R. O. Sprouse, S. French, P. Aprikian, R. Hontz, S. A. Juedes, J. S. Smith, A. L. Beyer, and D. T. Auble. 2007. Regulation of rRNA synthesis by TATA-binding protein-associated factor Mot1. Mol Cell Biol 27:2886-2896.
Davis, M. B. S., R. G.; Etterson, J. R. 2005. Evolutionary Responses to Changing Climate. Ecology 86:1704-1714.
Diaz, E. M., M. Vicente-Manzanares, M. Sacristan, C. Vicente, and M. E. Legaz. 2011. Fungal lectin of Peltigera canina induces chemotropism of compatible Nostoc cells by constriction-relaxation pulses of cyanobiont cytoskeleton. Plant Signal Behav 6:1525-1536.
Diffenbaugh, N. S., and C. B. Field. 2013. Changes in Ecologically Critical Terrestrial Climate Conditions. Science 341:486-491.
Doyle, S. M., and S. Wickner. 2009. Hsp104 and ClpB: protein disaggregating machines. Trends Biochem Sci 34:40-48.
Ellis, C., B. Coppins, and T. Dawson. 2007a. Predicted response of the lichen epiphyte Lecanora populicola to climate change scenarios in a clean-air region of Northern Britain. Biological Conservation 135:396-404.
Ellis, C. J., B. J. Coppins, T. P. Dawson, and M. R. D. Seaward. 2007b. Response of British lichens to climate change scenarios: Trends and uncertainties in the projected impact for contrasting biogeographic groups. Biological Conservation 140:217-235.
Enjalbert, B., D. A. Smith, M. J. Cornell, I. Alam, S. Nicholls, A. J. P. Brown, and J. Quinn. 2006. Role of the Hog1 Stress-activated Protein Kinase in the Global Transcriptional Response to Stress in the Fungal Pathogen Candida albicans. Molecular Biology of the Cell 17:1018-1032.
Fedrowitz, K., U. Kaasalainen, and J. Rikkinen. 2012. Geographic mosaic of symbiont selectivity in a genus of epiphytic cyanolichens. Ecol Evol 2:2291-2303.
Fernandez-Mendoza, F., S. Domaschke, M. A. Garcia, P. Jordan, M. P. Martin, and C. Printzen. 2011. Population structure of mycobionts and photobionts of the widespread lichen Cetraria aculeata. Mol Ecol 20:1208-1232.
Gagunashvili, A. N., S. P. Davidsson, Z. O. Jonsson, and O. S. Andresson. 2009. Cloning and heterologous transcription of a polyketide synthase gene from the lichen Solorina crocea. Mycol Res 113:354-363.
Gasch, A. P. 2007. Comparative genomics of the environmental stress response in ascomycete fungi. Yeast 24:961-976.
Goloubinoff, P., S. Diamant, C. Weiss, and A. Azem. 1997. GroES binding regulates GroEL chaperonin activity under heat shock. FEBS Letters 407:215-219.
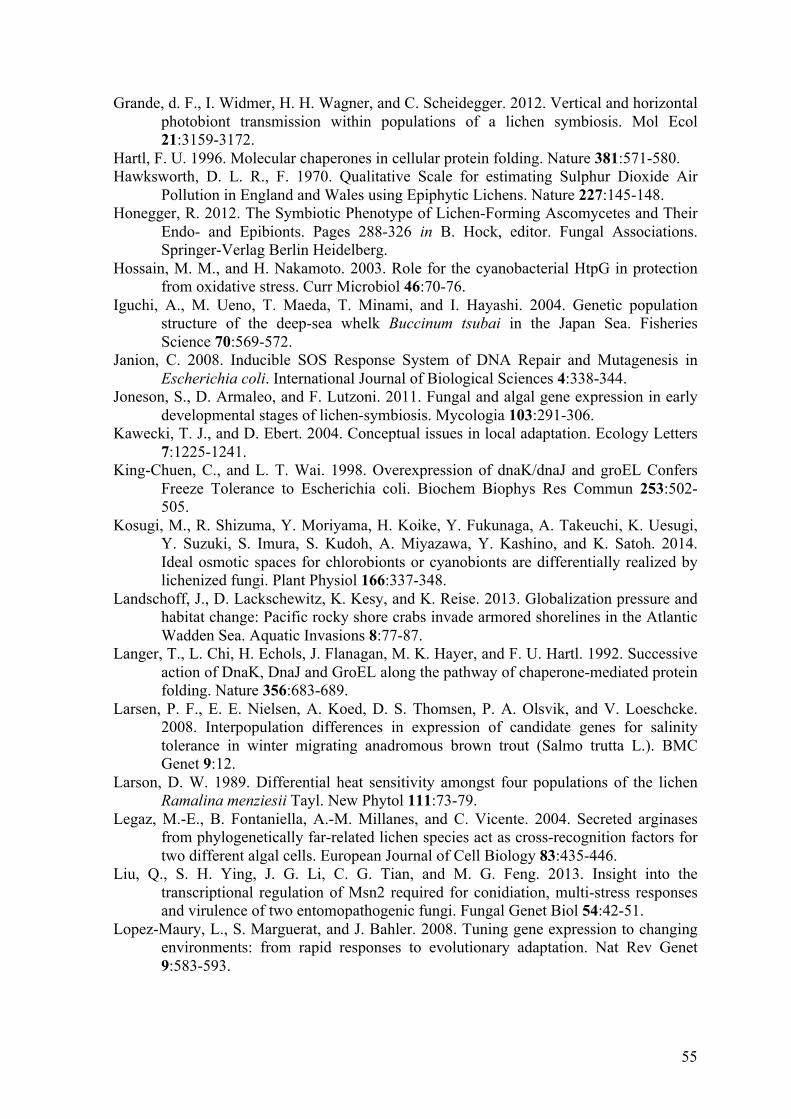
55
Grande, d. F., I. Widmer, H. H. Wagner, and C. Scheidegger. 2012. Vertical and horizontal photobiont transmission within populations of a lichen symbiosis. Mol Ecol 21:3159-3172.
Hartl, F. U. 1996. Molecular chaperones in cellular protein folding. Nature 381:571-580. Hawksworth, D. L. R., F. 1970. Qualitative Scale for estimating Sulphur Dioxide Air
Pollution in England and Wales using Epiphytic Lichens. Nature 227:145-148. Honegger, R. 2012. The Symbiotic Phenotype of Lichen-Forming Ascomycetes and Their
Endo- and Epibionts. Pages 288-326 in B. Hock, editor. Fungal Associations. Springer-Verlag Berlin Heidelberg.
Hossain, M. M., and H. Nakamoto. 2003. Role for the cyanobacterial HtpG in protection from oxidative stress. Curr Microbiol 46:70-76.
Iguchi, A., M. Ueno, T. Maeda, T. Minami, and I. Hayashi. 2004. Genetic population structure of the deep-sea whelk Buccinum tsubai in the Japan Sea. Fisheries Science 70:569-572.
Janion, C. 2008. Inducible SOS Response System of DNA Repair and Mutagenesis in Escherichia coli. International Journal of Biological Sciences 4:338-344.
Joneson, S., D. Armaleo, and F. Lutzoni. 2011. Fungal and algal gene expression in early developmental stages of lichen-symbiosis. Mycologia 103:291-306.
Kawecki, T. J., and D. Ebert. 2004. Conceptual issues in local adaptation. Ecology Letters 7:1225-1241.
King-Chuen, C., and L. T. Wai. 1998. Overexpression of dnaK/dnaJ and groEL Confers Freeze Tolerance to Escherichia coli. Biochem Biophys Res Commun 253:502-505.
Kosugi, M., R. Shizuma, Y. Moriyama, H. Koike, Y. Fukunaga, A. Takeuchi, K. Uesugi, Y. Suzuki, S. Imura, S. Kudoh, A. Miyazawa, Y. Kashino, and K. Satoh. 2014. Ideal osmotic spaces for chlorobionts or cyanobionts are differentially realized by lichenized fungi. Plant Physiol 166:337-348.
Landschoff, J., D. Lackschewitz, K. Kesy, and K. Reise. 2013. Globalization pressure and habitat change: Pacific rocky shore crabs invade armored shorelines in the Atlantic Wadden Sea. Aquatic Invasions 8:77-87.
Langer, T., L. Chi, H. Echols, J. Flanagan, M. K. Hayer, and F. U. Hartl. 1992. Successive action of DnaK, DnaJ and GroEL along the pathway of chaperone-mediated protein folding. Nature 356:683-689.
Larsen, P. F., E. E. Nielsen, A. Koed, D. S. Thomsen, P. A. Olsvik, and V. Loeschcke. 2008. Interpopulation differences in expression of candidate genes for salinity tolerance in winter migrating anadromous brown trout (Salmo trutta L.). BMC Genet 9:12.
Larson, D. W. 1989. Differential heat sensitivity amongst four populations of the lichen Ramalina menziesii Tayl. New Phytol 111:73-79.
Legaz, M.-E., B. Fontaniella, A.-M. Millanes, and C. Vicente. 2004. Secreted arginases from phylogenetically far-related lichen species act as cross-recognition factors for two different algal cells. European Journal of Cell Biology 83:435-446.
Liu, Q., S. H. Ying, J. G. Li, C. G. Tian, and M. G. Feng. 2013. Insight into the transcriptional regulation of Msn2 required for conidiation, multi-stress responses and virulence of two entomopathogenic fungi. Fungal Genet Biol 54:42-51.
Lopez-Maury, L., S. Marguerat, and J. Bahler. 2008. Tuning gene expression to changing environments: from rapid responses to evolutionary adaptation. Nat Rev Genet 9:583-593.
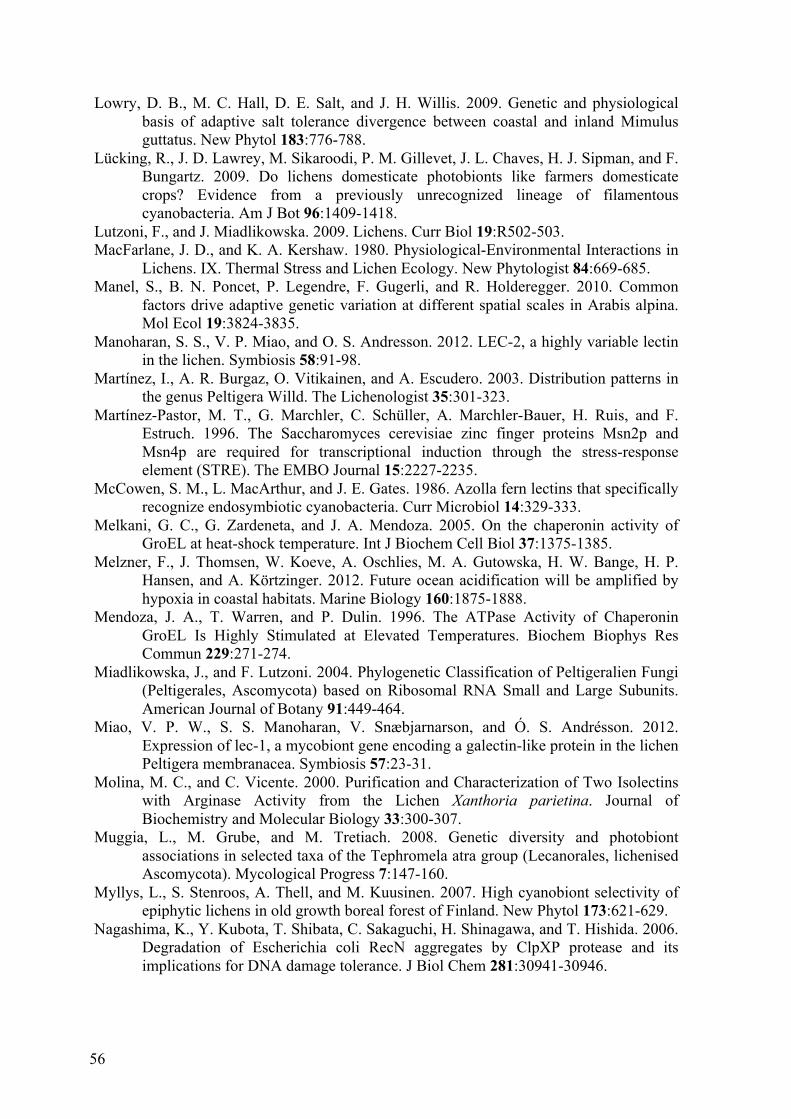
56
Lowry, D. B., M. C. Hall, D. E. Salt, and J. H. Willis. 2009. Genetic and physiological basis of adaptive salt tolerance divergence between coastal and inland Mimulus guttatus. New Phytol 183:776-788.
Lücking, R., J. D. Lawrey, M. Sikaroodi, P. M. Gillevet, J. L. Chaves, H. J. Sipman, and F. Bungartz. 2009. Do lichens domesticate photobionts like farmers domesticate crops? Evidence from a previously unrecognized lineage of filamentous cyanobacteria. Am J Bot 96:1409-1418.
Lutzoni, F., and J. Miadlikowska. 2009. Lichens. Curr Biol 19:R502-503. MacFarlane, J. D., and K. A. Kershaw. 1980. Physiological-Environmental Interactions in
Lichens. IX. Thermal Stress and Lichen Ecology. New Phytologist 84:669-685. Manel, S., B. N. Poncet, P. Legendre, F. Gugerli, and R. Holderegger. 2010. Common
factors drive adaptive genetic variation at different spatial scales in Arabis alpina. Mol Ecol 19:3824-3835.
Manoharan, S. S., V. P. Miao, and O. S. Andresson. 2012. LEC-2, a highly variable lectin in the lichen. Symbiosis 58:91-98.
Martínez, I., A. R. Burgaz, O. Vitikainen, and A. Escudero. 2003. Distribution patterns in the genus Peltigera Willd. The Lichenologist 35:301-323.
Martínez-Pastor, M. T., G. Marchler, C. Schüller, A. Marchler-Bauer, H. Ruis, and F. Estruch. 1996. The Saccharomyces cerevisiae zinc finger proteins Msn2p and Msn4p are required for transcriptional induction through the stress-response element (STRE). The EMBO Journal 15:2227-2235.
McCowen, S. M., L. MacArthur, and J. E. Gates. 1986. Azolla fern lectins that specifically recognize endosymbiotic cyanobacteria. Curr Microbiol 14:329-333.
Melkani, G. C., G. Zardeneta, and J. A. Mendoza. 2005. On the chaperonin activity of GroEL at heat-shock temperature. Int J Biochem Cell Biol 37:1375-1385.
Melzner, F., J. Thomsen, W. Koeve, A. Oschlies, M. A. Gutowska, H. W. Bange, H. P. Hansen, and A. Körtzinger. 2012. Future ocean acidification will be amplified by hypoxia in coastal habitats. Marine Biology 160:1875-1888.
Mendoza, J. A., T. Warren, and P. Dulin. 1996. The ATPase Activity of Chaperonin GroEL Is Highly Stimulated at Elevated Temperatures. Biochem Biophys Res Commun 229:271-274.
Miadlikowska, J., and F. Lutzoni. 2004. Phylogenetic Classification of Peltigeralien Fungi (Peltigerales, Ascomycota) based on Ribosomal RNA Small and Large Subunits. American Journal of Botany 91:449-464.
Miao, V. P. W., S. S. Manoharan, V. Snæbjarnarson, and Ó. S. Andrésson. 2012. Expression of lec-1, a mycobiont gene encoding a galectin-like protein in the lichen Peltigera membranacea. Symbiosis 57:23-31.
Molina, M. C., and C. Vicente. 2000. Purification and Characterization of Two Isolectins with Arginase Activity from the Lichen Xanthoria parietina. Journal of Biochemistry and Molecular Biology 33:300-307.
Muggia, L., M. Grube, and M. Tretiach. 2008. Genetic diversity and photobiont associations in selected taxa of the Tephromela atra group (Lecanorales, lichenised Ascomycota). Mycological Progress 7:147-160.
Myllys, L., S. Stenroos, A. Thell, and M. Kuusinen. 2007. High cyanobiont selectivity of epiphytic lichens in old growth boreal forest of Finland. New Phytol 173:621-629.
Nagashima, K., Y. Kubota, T. Shibata, C. Sakaguchi, H. Shinagawa, and T. Hishida. 2006. Degradation of Escherichia coli RecN aggregates by ClpXP protease and its implications for DNA damage tolerance. J Biol Chem 281:30941-30946.
57
Nimis, P. L. F., F.; Bizzotto, A.; Codogno, M.; Skert, N. 2002. Bryophytes as indicators of trace metals pollution in the River Brenta (NE Italy). The Science of the Total Environment 286.
O Leyva-Perez, d. l. M., A. Valverde-Corredor, R. Valderrama, J. Jimenez-Ruiz, A. Munoz-Merida, O. Trelles, J. B. Barroso, J. Mercado-Blanco, and F. Luque. 2015. Early and delayed long-term transcriptional changes and short-term transient responses during cold acclimation in olive leaves. DNA Res 22:1-11.
O'Brien, H. E., J. Miadlikowska, and F. Lutzoni. 2013. Assessing population structure and host specialization in lichenized cyanobacteria. New Phytol 198:557-566.
Odsbu, I., and K. Skarstad. 2014. DNA compaction in the early part of the SOS response is dependent on RecN and RecA. Microbiology 160:872-882.
Pálsson, S., H. Magnusdóttir, S. Reynisdóttir, Z. O. Jónsson, and E. B. Örnólfsdóttir. 2014. Divergence and molecular variation in common whelk Buccinum undatum (Gastropoda: Buccinidae) in Iceland: a trans-Atlantic comparison. Biological Journal of the Linnean Society 111:145-159.
Parmesan, C. 2006. Ecological and Evolutionary Responses to Recent Climate Change. Annual Review of Ecology, Evolution, and Systematics 37:637-669.
Pasqua, d. R., G. Mauriello, G. Mamone, and D. Ercolini. 2013. Expression of DnaK, HtpG, GroEL and Tf chaperones and the corresponding encoding genes during growth of Salmonella Thompson in presence of thymol alone or in combination with salt and cold stress. Food Research International 52:153-159.
Penuelas, J., J. Sardans, M. Estiarte, R. Ogaya, J. Carnicer, M. Coll, A. Barbeta, A. Rivas-Ubach, J. Llusia, M. Garbulsky, I. Filella, and A. S. Jump. 2013. Evidence of current impact of climate change on life: a walk from genes to the biosphere. Glob Chang Biol 19:2303-2338.
Perez-Ortega, S., R. Ortiz-Alvarez, T. G. Allan Green, and A. de Los Rios. 2012. Lichen myco- and photobiont diversity and their relationships at the edge of life (McMurdo Dry Valleys, Antarctica). FEMS Microbiol Ecol 82:429-448.
Piercey-Normore, M. D. 2006. The lichen-forming ascomycete Evernia mesomorpha associates with multiple genotypes of Trebouxia jamesii. New Phytol 169:331-344.
Pinto, F., C. C. Pacheco, D. Ferreira, P. Moradas-Ferreira, and P. Tamagnini. 2012. Selection of suitable reference genes for RT-qPCR analyses in cyanobacteria. PLoS One 7:e34983.
Plesofsky-Vig, N., and R. Brambl. 1998. Characterization of an 88-kDa Heat Shock Protein of Neurospora crassa That Interacts with Hsp30. THE JOURNAL OF BIOLOGICAL CHEMISTRY 273:11335–11341.
Pörtner, H. O. 2008. Ecosystem effects of ocean acidification in times of ocean warming: a physiologist’s view. Marine Ecology Progress Series 373:203-217.
Pörtner, H. O., M. Langenbuch, and A. Reipschläger. 2004. Biological Impact of Elevated Ocean CO2 Concentrations: Lessons from Animal Physiology and Earth History. Journal of Oceanography 60:705-718.
Printzen, C., F. Fernandez-Mendoza, L. Muggia, G. Berg, and M. Grube. 2012. Alphaproteobacterial communities in geographically distant populations of the lichen Cetraria aculeata. FEMS Microbiol Ecol 82:316-325.
Rachmilevitch, S., H. Lambers, and B. Huang. 2008. Short-term and long-term root respiratory acclimation to elevated temperatures associated with root thermotolerance for two Agrostis grass species. J Exp Bot 59:3803-3809.
Rajaram, H., and S. K. Apte. 2010. Differential regulation of groESL operon expression in response to heat and light in Anabaena. Arch Microbiol 192:729-738.
58
Rajaram, H., A. K. Chaurasia, and S. K. Apte. 2014. Cyanobacterial heat-shock response: role and regulation of molecular chaperones. Microbiology 160:647-658.
Reddy, P. S., V. Thirulogachandar, C. S. Vaishnavi, A. Aakrati, S. K. Sopory, and M. K. Reddy. 2011. Molecular characterization and expression of a gene encoding cytosolic Hsp90 from Pennisetum glaucum and its role in abiotic stress adaptation. Gene 474:29-38.
Rep, M., M. Krantz, J. M. Thevelein, and S. Hohmann. 2000. The Transcriptional Response of Saccharomyces cerevisiae to Osmotic Shock. THE JOURNAL OF BIOLOGICAL CHEMISTRY 275:8290-8300.
Rodriguez-Lanetty, M., S. Harii, and O. Hoegh-Guldberg. 2009. Early molecular responses of coral larvae to hyperthermal stress. Mol Ecol 18:5101-5114.
Rostas, K., S. J. Morton, S. M. Picksley, and R. G. Lloyd. 1987. Nucleotide sequence and LexA regulation of the Escherichia coli recN gene. Nucleic Acids Research 15:5041-5049.
Sargentini, N. J., and K. C. Smith. 1986. Quantitation of the Involvement of the recA, recB, recC, recF, recJ, recN, lexA, radA, radB, uvrD, and umuC Genes in the Repair of X-Ray-Induced DNA Double-Strand Breaks in Escherichia coli. Radiation Research 107:58-72.
Sato, S., M. Ikeuchi, and H. Nakamoto. 2008. Expression and function of a groEL paralog in the thermophilic cyanobacterium Thermosynechococcus elongatus under heat and cold stress. FEBS Lett 582:3389-3395.
Schmoll, M. 2008. The information highways of a biotechnological workhorse--signal transduction in Hypocrea jecorina. BMC Genomics 9:430.
Schröter, D. C., W.; Leemans, R.; Prentice, I. C., B. Araújo, M. B.; W. Arnell, N. W.; Bondeau, A.; Bugmann, H.; Carter, T. R.; Gracia, C. A.; de la Vega-Leinert, A. C.; Erhard, M.; Ewert, F.; Glendining, M.; House, J. I.; Kankaanpää, S.; Klein, R. J. T.; Lavorel, S.; Lindner, M.; Metzger, M. J.; Meyer, J.; Mitchell, T. D.; Reginster, I.; Rounsevell, M. 2005. Ecosystem Service Supply and Vulnerability to Global Change in Europe. Science 310:1333-1337.
Schüller, C., J. L. Brewster, M. R. Alexander, M. C. Gustin, and H. Ruis. 1994. The HOG pathway controls osmotic regulation of transcription via the stress response element (STRE) of the Saccharomyces cerevisiae CTT1 gene. The EMBO Journal 13:4382-4389.
Sharon, N., and H. Lis. 2004. History of lectins: from hemagglutinins to biological recognition molecules. Glycobiology 14:53R-62R.
Sikorski, T. W., and S. Buratowski. 2009. The basal initiation machinery: beyond the general transcription factors. Curr Opin Cell Biol 21:344-351.
Stock, A. M., V. L. Robinson, and P. N. Goudreau. 2000. Two-Component Signal Transduction. Annual Review of Biochemistry 69:183-215.
The Royal Society. 2005. Ocean acidification due to increasing atmospheric carbon dioxide.
Timmusk, S., and E. G. H. Wagner. 1999. The Plant-Growth-Promoting Rhizobacterium Paenibacillus polymyxa Induces Changes in Arabidopsis thaliana Gene Expression: A Possible Connection Between Biotic and Abiotic Stress Responses. MPMI 12:951-959.
Tukey, J. W. 1949. Comparing Individual Means in the Analysis of Variance. Biometrics 5:99-114.
59
Vassilev, A. O., N. Plesofsky-Vig, and R. Brambl. 1992. Isolation, partial amino acid sequence, and cellular distribution of heat-shock protein hsp98 from Neurospora crassa. Biochimica et BiophysicaActa 1156:1-6.
Voloshin, O. N., F. Vanevski, P. P. Khil, and R. D. Camerini-Otero. 2003. Characterization of the DNA damage-inducible helicase DinG from Escherichia coli. J Biol Chem 278:28284-28293.
Wallenius, J., T. Uuksulainen, K. Salonen, J. Rautio, and T. Eerikainen. 2011. The effect of temperature and pH gradients on Lactobacillus rhamnosus gene expression of stress-related genes. Bioprocess Biosyst Eng 34:1169-1176.
Wang, X.-Y., D. B. Easton, and J. R. Subjeck. 2007. Large Mammalian hsp70 Family Proteins, hsp110 and grp170, and Their Roles in Biology and Cancer Therapy. Protein Reviews 7:178-205.
Wang, Y.-Y., B. Liu, X.-Y. Zhang, Q.-M. Zhou, T. Zhang, H. Li, Y.-F. Yu, X.-L. Zhang, X.-Y. Hao, M. Wang, L. Wang, and J.-C. Wei. 2014. Genome characteristics reveal the impact of lichenization on lichen-forming fungus Endocarpon pusillum Hedwig (Verrucariales, Ascomycota). BMC Genomics 15.
Wang, Y.-Y., X.-Y. Zhang, Q.-M. Zhou, X.-L. Zhang, and J.-C. Wei. 2015. Comparative transcriptome analysis of the lichen-forming fungus Endocarpon pusillum elucidates its drought adaptation mechanisms. Sci China Life Sci 58:89-100.
Werth, S., and V. L. Sork. 2010. Identity and genetic structure of the photobiont of the epiphytic lichen Ramalina menziesii on three oak species in southern California. Am J Bot 97:821-830.
Werth, S. S., C. 2012. Congruent Genetic Structure in the Lichen-Forming Fungus Lobaria pulmonaria and its Green-Algal Photobiont. MPMI 25:220-230.
Whitman, D. W., and A. A. Agrawal. 2009. What is Phenotypic Plasticity and Why is it Important? Pages 1-63 in D. W. Whitman and T. N. Ananthakrishnan, editors. Phenotypic plasticity of insects: mechanisms and consequences. Science Publishers, Enfield, NH.
Widmer, I., F. Dal Grande, L. Excoffier, R. Holderegger, C. Keller, V. S. Mikryukov, and C. Scheidegger. 2012. European phylogeography of the epiphytic lichen fungus Lobaria pulmonaria and its green algal symbiont. Mol Ecol 21:5827-5844.
Wiech, H., J. Buchner, R. Zimmermann, and U. Jakob. 1992. Hsp90 chaperones protein folding in vitro. Nature 358:169-170.
Yahr, R., R. Vilgalys, and P. T. Depriest. 2004. Strong fungal specificity and selectivity for algal symbionts in Florida scrub Cladonia lichens. Mol Ecol 13:3367-3378.
Yahr, R., R. Vilgalys, and P. T. DePriest. 2006. Geographic variation in algal partners of Cladonia subtenuis (Cladoniaceae) highlights the dynamic nature of a lichen symbiosis. New Phytol 171:847-860.
Yasuhira, S., M. Morimyo, and A. Yasui. 1999. Transcription Dependence and the Roles of Two Excision Repair Pathways for UV Damage in Fission Yeast Schizosaccharomyces pombe. THE YOURNAL OF BIOLOGICAL CHEMISTRY 274:26822-26827.
Young, J. C. 2001. Hsp90: a specialized but essential protein-folding tool. The Journal of Cell Biology 154:267-274.
Zahrl, D., A. Wagner, M. Tscherner, and G. Koraimann. 2007. GroEL plays a central role in stress-induced negative regulation of bacterial conjugation by promoting proteolytic degradation of the activator protein TraJ. J Bacteriol 189:5885-5894.

60
Zanton, S. J., and B. F. Pugh. 2004. Changes in genomewide occupancy of core transcriptional regulators during heat stress. Proc Natl Acad Sci U S A 101:16843-16848.
61
Appendix A
Protocols
RNeasy® Plant Mini Kit (cat. no. 74904)
Notes before starting:
• Add 10 µl 1-mercaptoethanol (.-ME) to 1 ml Buffer RLT before use. Buffers .ME can be stored at room temperature for up to 1 month.
• Add 4 volumes of ethanol (96–100%) to Buffer RPE for a working solution.
Procedure:
1. Take a piece of marginal tissue (5 x 5 mm) from each sample stored in RNA later after each temperature treatment After three-hour temperature treatment into a new 2.0 ml tube with cap (Sarstedt, Ref. 72.694) and add 450 .l Buffer RLT and one metal beat.
2. Homogenize sample for 4 minutes in Mini-BeadBeater-16 (BioSpec Products, Cat. Nr. 706).
3. Transfer the lysate to a QIAshredder spin column (lilac) placed in a 2 ml collection tube. Centrifuge for 2 min at full speed. Transfer the supernatant of the flow-through to a new microcentrifuge tube (not supplied) without disturbing the cell-debris pellet.
4. Add 0.5 volume of ethanol (96–100%) to the cleared lysate, and mix immediately by pipetting. Do not centrifuge. Proceed immediately to step 5.
5. Transfer the sample (usually 650 .l), with any precipitate, to an RNeasy Mini spin column (pink) in a 2 ml collection tube (supplied). Close the lid, and centrifuge for 15 s at ≥8000 x g (≥10,000 rpm). Discard the flowthrough.
6. Add 700 .l Buffer RW1 to the RNeasy spin column. Close the lid, and centrifuge for 15 s at ≥8000 x g. Discard the flow-through.
7. Add 500 .l Buffer RPE to the RNeasy spin column. Close the lid, and centrifuge for 15 s at ≥8000 x g. Discard the flow-through.
62
8. Add 500 .l Buffer RPE to the RNeasy spin column. Close the lid, and centrifuge for 2 min at ≥8000 x g. Optional: Place the RNeasy spin column in a new 2 ml collection tube (supplied). Centrifuge at full speed for 1 min to dry the membrane.
9. Place the RNeasy spin column in a new 1.5 ml collection tube (supplied). Add 30–50 .l RNase-free water directly to the spin column membrane. Close the lid, and centrifuge for 1 min at ≥8000 x g to elute the RNA.
10. If the expected RNA yield is >30 .g, repeat step 9 using another 30–50 .l of RNase-free water. Alternatively, use the eluate from step 9 (if high RNA concentration is required). Reuse the collection tube from step 9. For up-to-date licensing information and productspecific disclaimers, see the respective QIAGEN kit handbook or user manual.
11. Store at -80°C
DNase 1 digestion (New England Biolabs)
1. Measure RNA concentration in each sample using NanoDrop® Spectrophotometer (Thermo Scientific, Waltham, USA)
2. Prepare the following reaction for each sample in a 1,5 ml microcentrifuge tube:
• 5 µl reaction buffer • 4 µl DNase 1 (1000 U/µl) • x µl RNA (for a final concentration of 50 ng/µl) • x µl RNase-free water (to fill up to 50 µl)
Total reaction volume = 50 µl
3. Mix gently
4. Incubate at 37°C for 15 min
5. Heat-inactivate DNase I by incubation at 75°C for 5-10 min
6. Cool on ice & continue with quality control (NanoDrop) to adjust final RNA concentration
7. Store at -80°C

63
cDNA synthesis (High Capacity cDNA Reverse Transcription Kit (Appl. Biosyst.))
1. Prepare mastermix for each reaction:
2 µl reaction buffer 2 µl Random Primers/Hexamers 0,8 µl dNTP mix (2.5 mM) 4,2 µl RNase free water
2. Add 9 µl of mastermix in each reaction tube and 10 µl of RNA sample (= 500 ng
RNA)
3. Add 1 µl Reverse Transcriptase (1 µl RNase free water for -RT controls)
à Total reaction volume 20 µl
4. Perform PCR reaction with the following steps:
Incubate mixture at 25°C for 10 min Incubate mixture at 37°C for 120 min Incubate mixture at 85°C for 5 min to stop the reaction
5. Dilute samples with RNase-free H2O to a final concentration of 10 ng/µl
6. Store product at -20°C
Quantitative real-time PCR (RT-qPCR, SYBR Green method, 7500 qPCR system (Appl. Biosyst.)
Reaction mix
SYBR Green® Mix 5,0 µl forward primer (5 µM) 0,5 µl
reverse primer (5 µM) 0,5 µl RNase-free water 3,0 µl
diluted cDNA template (10ng/µl) 1,0 µl
Temperature cycle Holding stage: 50°C 2 min.
95°C 10 min. Cycling Stage: 95°C 15 sec.
60°C 1 min. 40 cycles

64
Temperature data Table S1: Daily mean temperatures and standard deviations at the sampling sites RY7 and HF2 (sea-exposed), as well as at LA1, HV3, and LL3 (inland) in June 2013. Mean temperature was calculated for every day based on hourly measurements.
Date RY7 [°C] HF2 [°C] LA1 [°C] HV3 [°C] LL3 [°C]
Day Mean ± SD Day Mean ± SD Day Mean ± SD Day Mean ± SD Day Mean ± SD
01.06.13 13,55 ± 4,21 10,01 ± 2,62 9,87 ± 3,95 12,01 ± 4,60 7,83 ± 2,60 02.06.13 16,44 ± 8,26 13,26 ± 3,91 12,60 ± 3,44 16,92 ± 7,19 13,06 ± 5,12 03.06.13 10,24 ± 0,90 11,73 ± 1,49 10,59 ± 1,03 15,33 ± 5,38 13,69 ± 3,44 04.06.13 10,11 ± 1,15 10,20 ± 0,71 10,31 ± 1,43 14,45 ± 5,29 15,76 ± 6,93 05.06.13 11,72 ± 2,72 13,36 ± 1,84 18,49 ± 6,25 22,93 ± 8,00 20,61 ± 7,41 06.06.13 12,01 ± 2,00 13,89 ± 2,96 13,70 ± 3,14 18,27 ± 5,31 16,95 ± 6,57 07.06.13 13,65 ± 4,08 13,51 ± 3,04 12,29 ± 2,52 18,96 ± 7,64 14,82 ± 4,46 08.06.13 14,31 ± 3,21 13,01 ± 3,25 12,82 ± 2,08 16,83 ± 5,56 16,45 ± 6,45 09.06.13 11,41 ± 1,68 13,61 ± 3,41 14,76 ± 3,89 15,08 ± 4,60 12,03 ± 3,28 10.06.13 11,05 ± 1,12 14,61 ± 3,13 15,67 ± 4,06 18,55 ± 6,20 13,16 ± 2,33 11.06.13 10,31 ± 1,13 14,42 ± 3,03 10,47 ± 1,32 12,55 ± 2,87 10,46 ± 1,66 12.06.13 15,09 ± 3,77 14,39 ± 3,02 15,04 ± 4,20 20,71 ± 8,37 18,13 ± 9,53 13.06.13 15,05 ± 2,20 15,20 ± 3,12 13,32 ± 3,30 14,02 ± 4,19 12,94 ± 4,99 14.06.13 16,52 ± 3,27 14,67 ± 2,62 16,86 ± 5,89 21,93 ± 9,54 22,88 ± 11,36 15.06.13 15,12 ± 3,52 13,77 ± 3,04 16,07 ± 6,73 25,77 ± 10,39 22,60 ± 10,32 16.06.13 14,47 ± 3,63 11,17 ± 1,50 10,66 ± 1,48 13,92 ± 3,15 13,88 ± 5,18 17.06.13 15,78 ± 6,60 12,42 ± 2,56 12,41 ± 4,19 17,99 ± 7,66 15,01 ± 5,09 18.06.13 11,40 ± 2,87 11,39 ± 2,14 11,16 ± 2,76 14,27 ± 5,53 11,56 ± 3,49 19.06.13 18,68 ± 6,89 13,36 ± 3,58 15,67 ± 4,67 16,52 ± 7,75 13,59 ± 7,97 20.06.13 24,08 ± 10,94 13,89 ± 2,86 19,64 ± 7,66 24,74 ± 10,95 18,76 ± 8,46 21.06.13 25,26 ± 13,12 16,02 ± 3,60 20,70 ± 9,05 22,08 ± 9,74 15,76 ± 7,04 22.06.13 17,36 ± 5,42 15,71 ± 3,03 18,71 ± 5,39 22,65 ± 9,08 16,60 ± 6,35 23.06.13 17,84 ± 6,45 14,86 ± 3,02 21,77 ± 8,26 26,24 ± 10,93 24,54 ± 12,05 24.06.13 12,95 ± 2,54 16,08 ± 3,17 15,54 ± 5,92 20,96 ± 8,61 21,48 ± 10,49 25.06.13 15,97 ± 6,36 14,58 ± 4,75 15,57 ± 5,61 19,43 ± 8,39 11,75 ± 2,48 26.06.13 13,84 ± 6,77 11,64 ± 2,43 10,59 ± 2,62 14,04 ± 7,00 10,96 ± 4,35 27.06.13 9,65 ± 0,92 9,13 ± 0,66 7,31 ± 0,53 10,10 ± 1,64 8,21 ± 1,99 28.06.13 15,01 ± 3,29 10,80 ± 2,06 13,03 ± 5,01 16,75 ± 5,20 10,49 ± 3,28 29.06.13 18,34 ± 8,72 14,58 ± 1,62 14,90 ± 3,75 17,31 ± 4,12 13,63 ± 3,57 30.06.13 25,12 ± 10,55 15,44 ± 2,91 20,01 ± 7,41 21,18 ± 6,50 18,54 ± 6,83

65
Statistical data
Raw data
Table S2: RT-qPCR raw data. Ct values for all fungal and cyanobacterial reference and candidate genes for every habitat, site, sea distance [km], elevation [m], temperature and biological replicate
à attached as additional file
Reference gene variation
Table S3: Reference gene variation. Mean and SD (and variation in %) of all Ct values for fungal and cyanobacterial reference genes (see table S2).
Species Ref. gene Ct Mean SD Variation [%]
Pmem gpd1 20,09043 1,529958 7,62
tub2 20,55559 1,889016 9,19
Nostoc rnpB 15,99485 2,231824 13,95
secA 21,96816 1,901631 8,66
ANOVA results
Table S4: Detailed ANOVA output for linear mixed effects model with “site” and “temperature” as fixed and “individual” as random factor.
Species Gene factor numDF denDF F-value p-value Pmem lec2 (Intercept) 1 92 193,881 <0,0001 temp 2 92 25,936 <0,0001 site 7 92 6,181 <0,0001 temp:site 14 92 0,603 0,8560 Pmem lec1 (Intercept) 1 92 295,016 <0,0001 temp 2 92 0,530 0,5903 site 7 92 9,251 <0,0001 temp:site 14 92 0,537 0,9046 Pmem swi10 (Intercept) 1 92 6.142,159 <0,0001 temp 2 92 22,050 <0,0001 site 7 92 13,036 <0,0001 temp:site 14 92 1,513 0,1218 Pmem spp (Intercept) 1 92 1.523,477 <0,0001 temp 2 92 14,807 <0,0001 site 7 92 20,504 <0,0001 temp:site 14 92 0,858 0,6052 Pmem hhk2 (Intercept) 1 92 851,220 <0,0001 temp 2 92 77,218 <0,0001
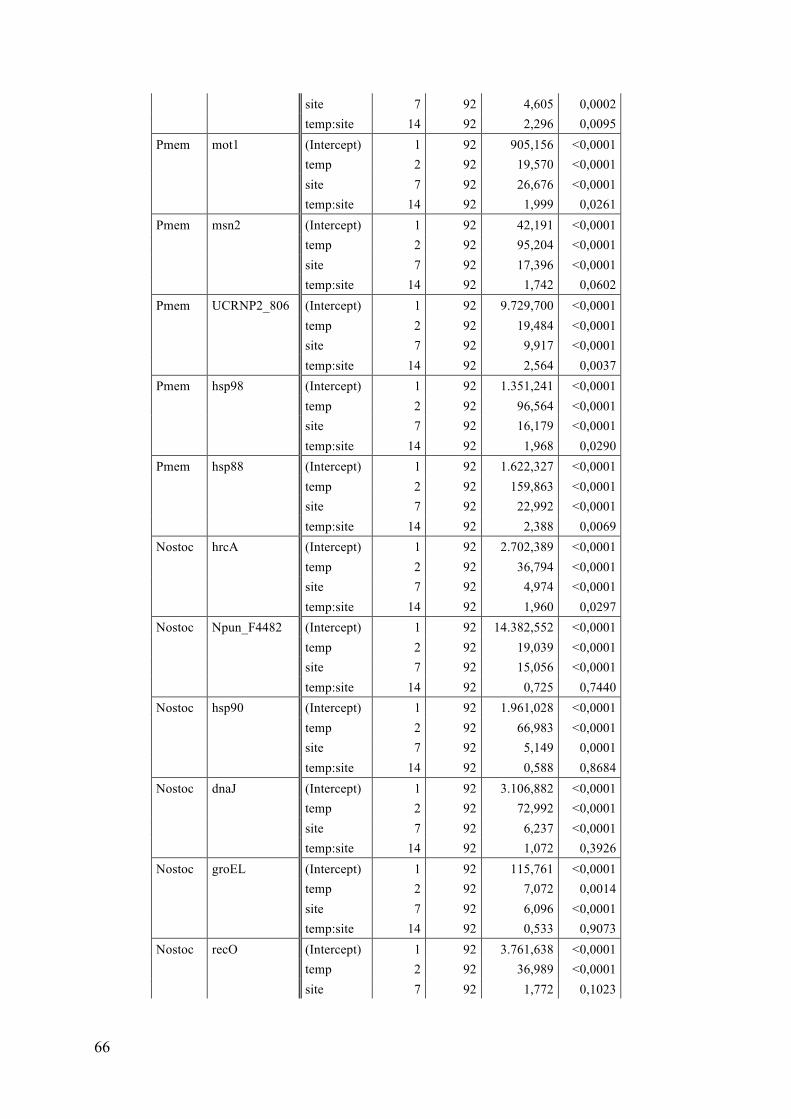
66
site 7 92 4,605 0,0002 temp:site 14 92 2,296 0,0095 Pmem mot1 (Intercept) 1 92 905,156 <0,0001 temp 2 92 19,570 <0,0001 site 7 92 26,676 <0,0001 temp:site 14 92 1,999 0,0261 Pmem msn2 (Intercept) 1 92 42,191 <0,0001 temp 2 92 95,204 <0,0001 site 7 92 17,396 <0,0001 temp:site 14 92 1,742 0,0602 Pmem UCRNP2_806 (Intercept) 1 92 9.729,700 <0,0001 temp 2 92 19,484 <0,0001 site 7 92 9,917 <0,0001 temp:site 14 92 2,564 0,0037 Pmem hsp98 (Intercept) 1 92 1.351,241 <0,0001 temp 2 92 96,564 <0,0001 site 7 92 16,179 <0,0001 temp:site 14 92 1,968 0,0290 Pmem hsp88 (Intercept) 1 92 1.622,327 <0,0001 temp 2 92 159,863 <0,0001 site 7 92 22,992 <0,0001 temp:site 14 92 2,388 0,0069 Nostoc hrcA (Intercept) 1 92 2.702,389 <0,0001 temp 2 92 36,794 <0,0001 site 7 92 4,974 <0,0001 temp:site 14 92 1,960 0,0297 Nostoc Npun_F4482 (Intercept) 1 92 14.382,552 <0,0001 temp 2 92 19,039 <0,0001 site 7 92 15,056 <0,0001 temp:site 14 92 0,725 0,7440 Nostoc hsp90 (Intercept) 1 92 1.961,028 <0,0001 temp 2 92 66,983 <0,0001 site 7 92 5,149 0,0001 temp:site 14 92 0,588 0,8684 Nostoc dnaJ (Intercept) 1 92 3.106,882 <0,0001 temp 2 92 72,992 <0,0001 site 7 92 6,237 <0,0001 temp:site 14 92 1,072 0,3926 Nostoc groEL (Intercept) 1 92 115,761 <0,0001 temp 2 92 7,072 0,0014 site 7 92 6,096 <0,0001 temp:site 14 92 0,533 0,9073 Nostoc recO (Intercept) 1 92 3.761,638 <0,0001 temp 2 92 36,989 <0,0001 site 7 92 1,772 0,1023
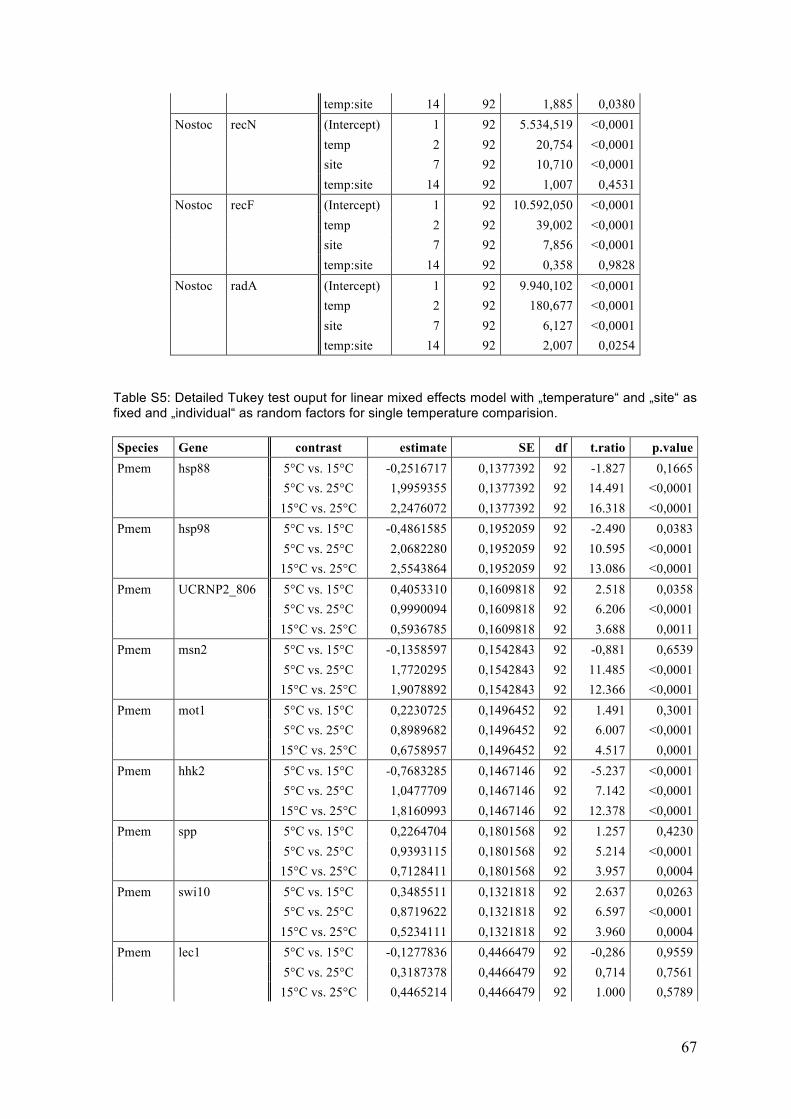
67
temp:site 14 92 1,885 0,0380 Nostoc recN (Intercept) 1 92 5.534,519 <0,0001 temp 2 92 20,754 <0,0001 site 7 92 10,710 <0,0001 temp:site 14 92 1,007 0,4531 Nostoc recF (Intercept) 1 92 10.592,050 <0,0001 temp 2 92 39,002 <0,0001 site 7 92 7,856 <0,0001 temp:site 14 92 0,358 0,9828 Nostoc radA (Intercept) 1 92 9.940,102 <0,0001 temp 2 92 180,677 <0,0001 site 7 92 6,127 <0,0001 temp:site 14 92 2,007 0,0254
Table S5: Detailed Tukey test ouput for linear mixed effects model with „temperature“ and „site“ as fixed and „individual“ as random factors for single temperature comparision.
Species Gene contrast estimate SE df t.ratio p.value Pmem hsp88 5°C vs. 15°C -0,2516717 0,1377392 92 -1.827 0,1665 5°C vs. 25°C 1,9959355 0,1377392 92 14.491 <0,0001 15°C vs. 25°C 2,2476072 0,1377392 92 16.318 <0,0001 Pmem hsp98 5°C vs. 15°C -0,4861585 0,1952059 92 -2.490 0,0383 5°C vs. 25°C 2,0682280 0,1952059 92 10.595 <0,0001 15°C vs. 25°C 2,5543864 0,1952059 92 13.086 <0,0001 Pmem UCRNP2_806 5°C vs. 15°C 0,4053310 0,1609818 92 2.518 0,0358
5°C vs. 25°C 0,9990094 0,1609818 92 6.206 <0,0001 15°C vs. 25°C 0,5936785 0,1609818 92 3.688 0,0011 Pmem msn2 5°C vs. 15°C -0,1358597 0,1542843 92 -0,881 0,6539 5°C vs. 25°C 1,7720295 0,1542843 92 11.485 <0,0001 15°C vs. 25°C 1,9078892 0,1542843 92 12.366 <0,0001 Pmem mot1 5°C vs. 15°C 0,2230725 0,1496452 92 1.491 0,3001 5°C vs. 25°C 0,8989682 0,1496452 92 6.007 <0,0001 15°C vs. 25°C 0,6758957 0,1496452 92 4.517 0,0001 Pmem hhk2 5°C vs. 15°C -0,7683285 0,1467146 92 -5.237 <0,0001 5°C vs. 25°C 1,0477709 0,1467146 92 7.142 <0,0001 15°C vs. 25°C 1,8160993 0,1467146 92 12.378 <0,0001 Pmem spp 5°C vs. 15°C 0,2264704 0,1801568 92 1.257 0,4230 5°C vs. 25°C 0,9393115 0,1801568 92 5.214 <0,0001 15°C vs. 25°C 0,7128411 0,1801568 92 3.957 0,0004 Pmem swi10 5°C vs. 15°C 0,3485511 0,1321818 92 2.637 0,0263 5°C vs. 25°C 0,8719622 0,1321818 92 6.597 <0,0001 15°C vs. 25°C 0,5234111 0,1321818 92 3.960 0,0004 Pmem lec1 5°C vs. 15°C -0,1277836 0,4466479 92 -0,286 0,9559 5°C vs. 25°C 0,3187378 0,4466479 92 0,714 0,7561 15°C vs. 25°C 0,4465214 0,4466479 92 1.000 0,5789
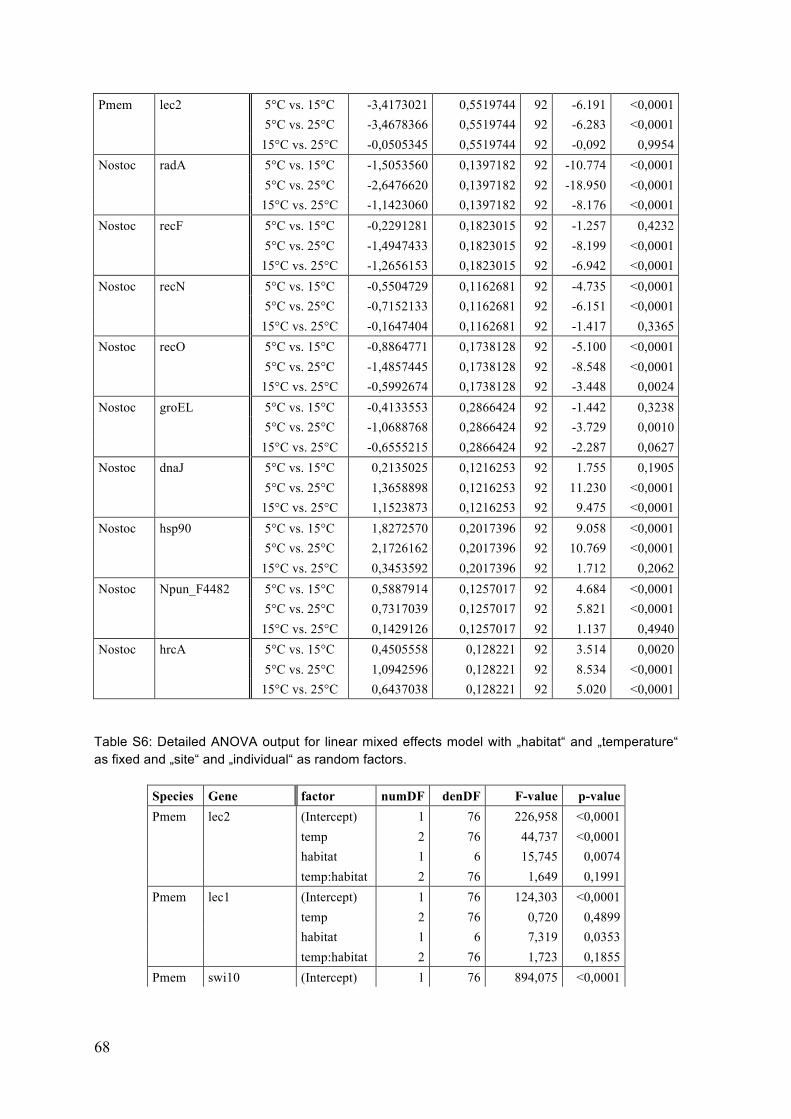
68
Pmem lec2 5°C vs. 15°C -3,4173021 0,5519744 92 -6.191 <0,0001 5°C vs. 25°C -3,4678366 0,5519744 92 -6.283 <0,0001 15°C vs. 25°C -0,0505345 0,5519744 92 -0,092 0,9954 Nostoc radA 5°C vs. 15°C -1,5053560 0,1397182 92 -10.774 <0,0001 5°C vs. 25°C -2,6476620 0,1397182 92 -18.950 <0,0001 15°C vs. 25°C -1,1423060 0,1397182 92 -8.176 <0,0001 Nostoc recF 5°C vs. 15°C -0,2291281 0,1823015 92 -1.257 0,4232 5°C vs. 25°C -1,4947433 0,1823015 92 -8.199 <0,0001 15°C vs. 25°C -1,2656153 0,1823015 92 -6.942 <0,0001 Nostoc recN 5°C vs. 15°C -0,5504729 0,1162681 92 -4.735 <0,0001 5°C vs. 25°C -0,7152133 0,1162681 92 -6.151 <0,0001 15°C vs. 25°C -0,1647404 0,1162681 92 -1.417 0,3365 Nostoc recO 5°C vs. 15°C -0,8864771 0,1738128 92 -5.100 <0,0001 5°C vs. 25°C -1,4857445 0,1738128 92 -8.548 <0,0001 15°C vs. 25°C -0,5992674 0,1738128 92 -3.448 0,0024 Nostoc groEL 5°C vs. 15°C -0,4133553 0,2866424 92 -1.442 0,3238 5°C vs. 25°C -1,0688768 0,2866424 92 -3.729 0,0010 15°C vs. 25°C -0,6555215 0,2866424 92 -2.287 0,0627 Nostoc dnaJ 5°C vs. 15°C 0,2135025 0,1216253 92 1.755 0,1905 5°C vs. 25°C 1,3658898 0,1216253 92 11.230 <0,0001 15°C vs. 25°C 1,1523873 0,1216253 92 9.475 <0,0001 Nostoc hsp90 5°C vs. 15°C 1,8272570 0,2017396 92 9.058 <0,0001 5°C vs. 25°C 2,1726162 0,2017396 92 10.769 <0,0001 15°C vs. 25°C 0,3453592 0,2017396 92 1.712 0,2062 Nostoc Npun_F4482 5°C vs. 15°C 0,5887914 0,1257017 92 4.684 <0,0001 5°C vs. 25°C 0,7317039 0,1257017 92 5.821 <0,0001 15°C vs. 25°C 0,1429126 0,1257017 92 1.137 0,4940 Nostoc hrcA 5°C vs. 15°C 0,4505558 0,128221 92 3.514 0,0020 5°C vs. 25°C 1,0942596 0,128221 92 8.534 <0,0001 15°C vs. 25°C 0,6437038 0,128221 92 5.020 <0,0001
Table S6: Detailed ANOVA output for linear mixed effects model with „habitat“ and „temperature“ as fixed and „site“ and „individual“ as random factors.
Species Gene factor numDF denDF F-value p-value Pmem lec2 (Intercept) 1 76 226,958 <0,0001 temp 2 76 44,737 <0,0001 habitat 1 6 15,745 0,0074 temp:habitat 2 76 1,649 0,1991 Pmem lec1 (Intercept) 1 76 124,303 <0,0001 temp 2 76 0,720 0,4899 habitat 1 6 7,319 0,0353 temp:habitat 2 76 1,723 0,1855 Pmem swi10 (Intercept) 1 76 894,075 <0,0001

69
temp 2 76 24,549 <0,0001 habitat 1 6 0,649 0,4512 temp:habitat 2 76 0,037 0,9640 Pmem spp (Intercept) 1 76 196,728 <0,0001 temp 2 76 19,404 <0,0001 habitat 1 6 0,581 0,4749 temp:habitat 2 76 0,022 0,9782 Pmem hhk2 (Intercept) 1 76 790,794 <0,0001 temp 2 76 70,899 <0,0001 habitat 1 6 0,554 0,4847 temp:habitat 2 76 0,980 0,3800 Pmem mot1 (Intercept) 1 76 5,044 0,0276 temp 2 76 103,617 <0,0001 habitat 1 6 0,200 0,6704 temp:habitat 2 76 1,566 0,2155 Pmem msn2 (Intercept) 1 76 202,094 <0,0001 temp 2 76 20,117 <0,0001 habitat 1 6 0,299 0,6044 temp:habitat 2 76 0,955 0,3893 Pmem UCRNP2_806 (Intercept) 1 76 883,319 <0,0001 temp 2 76 18,312 <0,0001 habitat 1 6 0,302 0,6022 temp:habitat 2 76 0,631 0,5349 Pmem hsp98 (Intercept) 1 76 61,686 <0,0001 temp 2 76 150,526 <0,0001 habitat 1 6 0,120 0,7411 temp:habitat 2 76 2,287 0,1085 Pmem hsp88 (Intercept) 1 76 150,685 <0,0001 temp 2 76 106,372 <0,0001 habitat 1 6 0,361 0,5699 temp:habitat 2 76 2,617 0,0796 Nostoc hrcA (Intercept) 1 76 1.642,662 <0,0001 temp 2 76 141,077 <0,0001 habitat 1 6 7,488 0,0339 temp:habitat 2 76 0,251 0,7788 Nostoc Npun_F4482 (Intercept) 1 76 3.177,738 <0,0001 temp 2 76 30,561 <0,0001 habitat 1 6 17,285 0,0060 temp:habitat 2 76 0,716 0,4919 Nostoc hsp90 (Intercept) 1 76 2.016,125 <0,0001 temp 2 76 34,713 <0,0001 habitat 1 6 0,861 0,3894 temp:habitat 2 76 0,993 0,3752 Nostoc dnaJ (Intercept) 1 76 622,427 <0,0001 temp 2 76 99,262 <0,0001
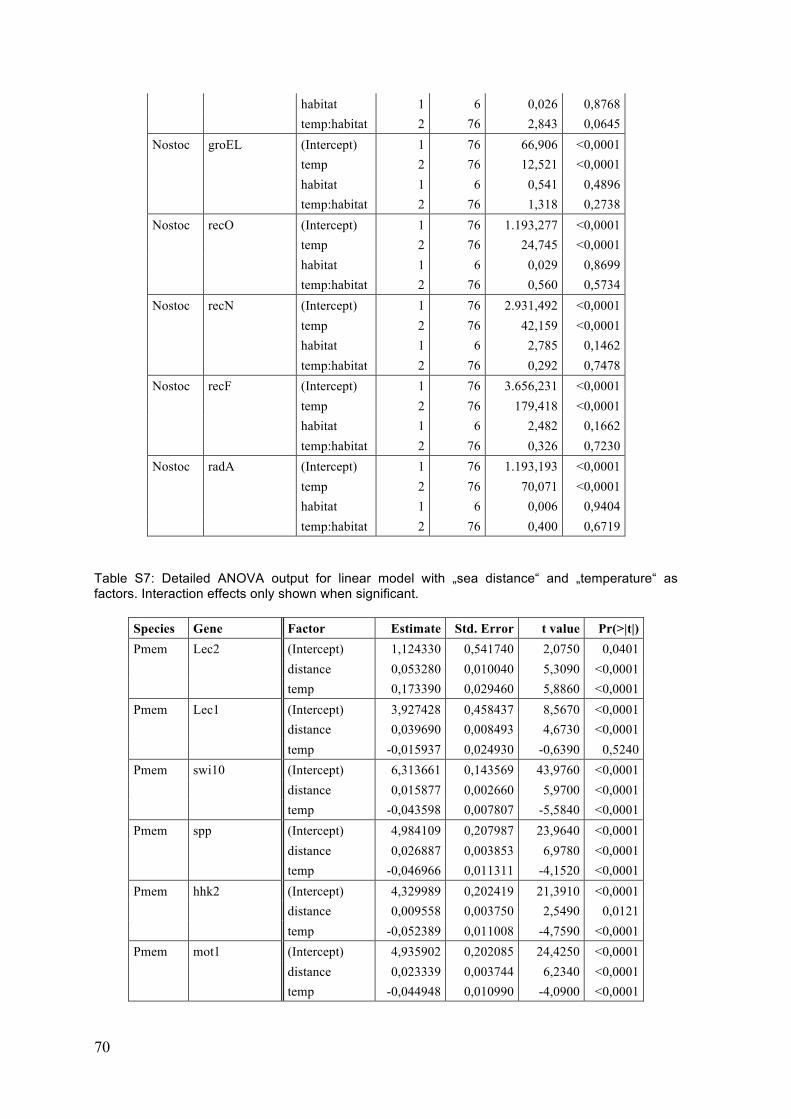
70
habitat 1 6 0,026 0,8768 temp:habitat 2 76 2,843 0,0645 Nostoc groEL (Intercept) 1 76 66,906 <0,0001 temp 2 76 12,521 <0,0001 habitat 1 6 0,541 0,4896 temp:habitat 2 76 1,318 0,2738 Nostoc recO (Intercept) 1 76 1.193,277 <0,0001 temp 2 76 24,745 <0,0001 habitat 1 6 0,029 0,8699 temp:habitat 2 76 0,560 0,5734 Nostoc recN (Intercept) 1 76 2.931,492 <0,0001 temp 2 76 42,159 <0,0001 habitat 1 6 2,785 0,1462 temp:habitat 2 76 0,292 0,7478 Nostoc recF (Intercept) 1 76 3.656,231 <0,0001 temp 2 76 179,418 <0,0001 habitat 1 6 2,482 0,1662 temp:habitat 2 76 0,326 0,7230 Nostoc radA (Intercept) 1 76 1.193,193 <0,0001 temp 2 76 70,071 <0,0001 habitat 1 6 0,006 0,9404 temp:habitat 2 76 0,400 0,6719
Table S7: Detailed ANOVA output for linear model with „sea distance“ and „temperature“ as factors. Interaction effects only shown when significant.
Species Gene Factor Estimate Std. Error t value Pr(>|t|) Pmem Lec2 (Intercept) 1,124330 0,541740 2,0750 0,0401 distance 0,053280 0,010040 5,3090 <0,0001 temp 0,173390 0,029460 5,8860 <0,0001 Pmem Lec1 (Intercept) 3,927428 0,458437 8,5670 <0,0001 distance 0,039690 0,008493 4,6730 <0,0001 temp -0,015937 0,024930 -0,6390 0,5240 Pmem swi10 (Intercept) 6,313661 0,143569 43,9760 <0,0001 distance 0,015877 0,002660 5,9700 <0,0001 temp -0,043598 0,007807 -5,5840 <0,0001 Pmem spp (Intercept) 4,984109 0,207987 23,9640 <0,0001 distance 0,026887 0,003853 6,9780 <0,0001 temp -0,046966 0,011311 -4,1520 <0,0001 Pmem hhk2 (Intercept) 4,329989 0,202419 21,3910 <0,0001 distance 0,009558 0,003750 2,5490 0,0121 temp -0,052389 0,011008 -4,7590 <0,0001 Pmem mot1 (Intercept) 4,935902 0,202085 24,4250 <0,0001 distance 0,023339 0,003744 6,2340 <0,0001 temp -0,044948 0,010990 -4,0900 <0,0001
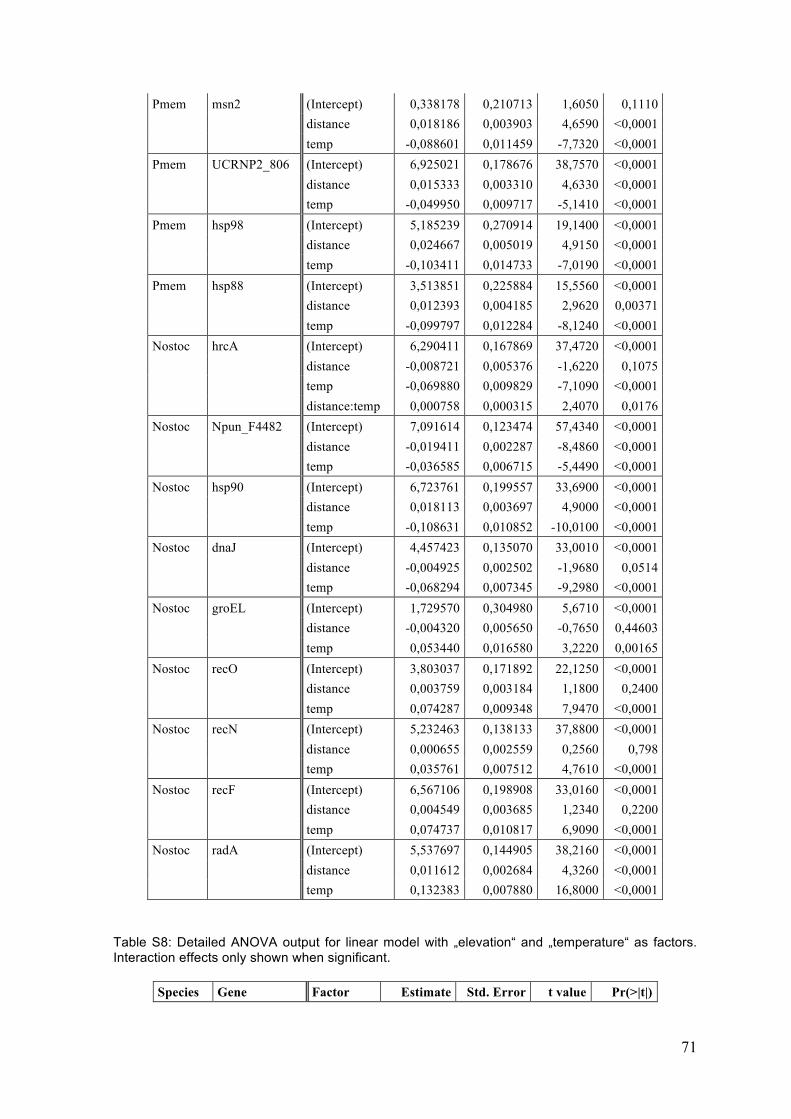
71
Pmem msn2 (Intercept) 0,338178 0,210713 1,6050 0,1110 distance 0,018186 0,003903 4,6590 <0,0001 temp -0,088601 0,011459 -7,7320 <0,0001 Pmem UCRNP2_806 (Intercept) 6,925021 0,178676 38,7570 <0,0001 distance 0,015333 0,003310 4,6330 <0,0001 temp -0,049950 0,009717 -5,1410 <0,0001 Pmem hsp98 (Intercept) 5,185239 0,270914 19,1400 <0,0001 distance 0,024667 0,005019 4,9150 <0,0001 temp -0,103411 0,014733 -7,0190 <0,0001 Pmem hsp88 (Intercept) 3,513851 0,225884 15,5560 <0,0001 distance 0,012393 0,004185 2,9620 0,00371 temp -0,099797 0,012284 -8,1240 <0,0001 Nostoc hrcA (Intercept) 6,290411 0,167869 37,4720 <0,0001 distance -0,008721 0,005376 -1,6220 0,1075 temp -0,069880 0,009829 -7,1090 <0,0001 distance:temp 0,000758 0,000315 2,4070 0,0176 Nostoc Npun_F4482 (Intercept) 7,091614 0,123474 57,4340 <0,0001 distance -0,019411 0,002287 -8,4860 <0,0001 temp -0,036585 0,006715 -5,4490 <0,0001 Nostoc hsp90 (Intercept) 6,723761 0,199557 33,6900 <0,0001 distance 0,018113 0,003697 4,9000 <0,0001 temp -0,108631 0,010852 -10,0100 <0,0001 Nostoc dnaJ (Intercept) 4,457423 0,135070 33,0010 <0,0001 distance -0,004925 0,002502 -1,9680 0,0514 temp -0,068294 0,007345 -9,2980 <0,0001 Nostoc groEL (Intercept) 1,729570 0,304980 5,6710 <0,0001 distance -0,004320 0,005650 -0,7650 0,44603 temp 0,053440 0,016580 3,2220 0,00165 Nostoc recO (Intercept) 3,803037 0,171892 22,1250 <0,0001 distance 0,003759 0,003184 1,1800 0,2400 temp 0,074287 0,009348 7,9470 <0,0001 Nostoc recN (Intercept) 5,232463 0,138133 37,8800 <0,0001 distance 0,000655 0,002559 0,2560 0,798 temp 0,035761 0,007512 4,7610 <0,0001 Nostoc recF (Intercept) 6,567106 0,198908 33,0160 <0,0001 distance 0,004549 0,003685 1,2340 0,2200 temp 0,074737 0,010817 6,9090 <0,0001 Nostoc radA (Intercept) 5,537697 0,144905 38,2160 <0,0001 distance 0,011612 0,002684 4,3260 <0,0001 temp 0,132383 0,007880 16,8000 <0,0001
Table S8: Detailed ANOVA output for linear model with „elevation“ and „temperature“ as factors. Interaction effects only shown when significant.
Species Gene Factor Estimate Std. Error t value Pr(>|t|)

72
Pmem Lec2 (Intercept) 1,056311 0,551027 1,9170 0,0577 elevation 0,008810 0,001702 5,1760 <0,0001 temp 0,173392 0,029603 5,8570 <0,0001 Pmem Lec1 (Intercept) 3,479040 0,414839 8,3860 <0,0001 elevation 0,009652 0,001281 7,5320 <0,0001 temp -0,015937 0,022287 -0,7150 0,4760 Pmem swi10 (Intercept) 6,540402 0,164635 39,7270 <0,0001 elevation 0,000707 0,000509 1,3900 0,1670 temp -0,043598 0,008845 -4,9290 <0,0001 Pmem spp (Intercept) 5,305027 0,245404 21,6180 <0,0001 elevation 0,001687 0,000758 2,2250 0,02800 temp -0,046966 0,013184 -3,5620 0,00053 Pmem hhk2 (Intercept) 4,518000 0,210500 21,4620 <0,0001 elevation 0,000026 0,000650 0,0400 0,9680 temp -0,052390 0,011310 -4,6320 <0,0001 Pmem mot1 (Intercept) 5,208469 0,231733 22,4760 <0,0001 elevation 0,001511 0,000716 2,1110 0,0369 temp -0,044948 0,012450 -3,6100 0,0005 Pmem msn2 (Intercept) 0,554617 0,229689 2,4150 0,0173 elevation 0,001146 0,000710 1,6150 0,1091 temp -0,088602 0,012340 -7,1800 <0,0001 Pmem UCRNP2_806 (Intercept) 7,263355 0,196615 36,9420 <0,0001 elevation -0,000244 0,000607 -0,4020 0,6880 temp -0,049951 0,010563 -4,7290 <0,0001 Pmem hsp98 (Intercept) 5678,000 301,2000 18,8500 <0,0001 elevation 0,007256 0,930400 0,0080 0,9940 temp -103,4000 16,18000 -6,3900 <0,0001 Pmem hsp88 (Intercept) 3,823772 0,236626 16,1600 <0,0001 elevation -0,000481 0,000731 -0,6580 0,5120 temp -0,099797 0,012713 -7,8500 <0,0001 Nostoc hrcA (Intercept) 5,957798 0,139145 42,8170 <0,0001 elevation 0,001228 0,000430 2,8570 0,0051 temp -0,054713 0,007475 -7,3190 <0,0001 Nostoc Npun_F4482 (Intercept) 7,010516 0,141884 49,4100 <0,0001 elevation -0,002387 0,000438 -5,4470 <0,0001 temp -0,036585 0,007623 -4,8000 <0,0001 Nostoc hsp90 (Intercept) 6,816681 0,212718 32,0460 <0,0001 elevation 0,002094 0,000657 3,1860 0,0019 temp -0,108631 0,011428 -9,5060 <0,0001 Nostoc dnaJ (Intercept) 4,270882 0,137455 31,0710 <0,0001 elevation 0,000683 0,000425 1,6090 0,1100 temp -0,068295 0,007385 -9,2480 <0,0001 Nostoc groEL (Intercept) 1,424126 0,305264 4,6650 <0,0001 elevation 0,001701 0,000943 1,8040 0,0738 temp 0,053444 0,016400 3,2590 0,0015
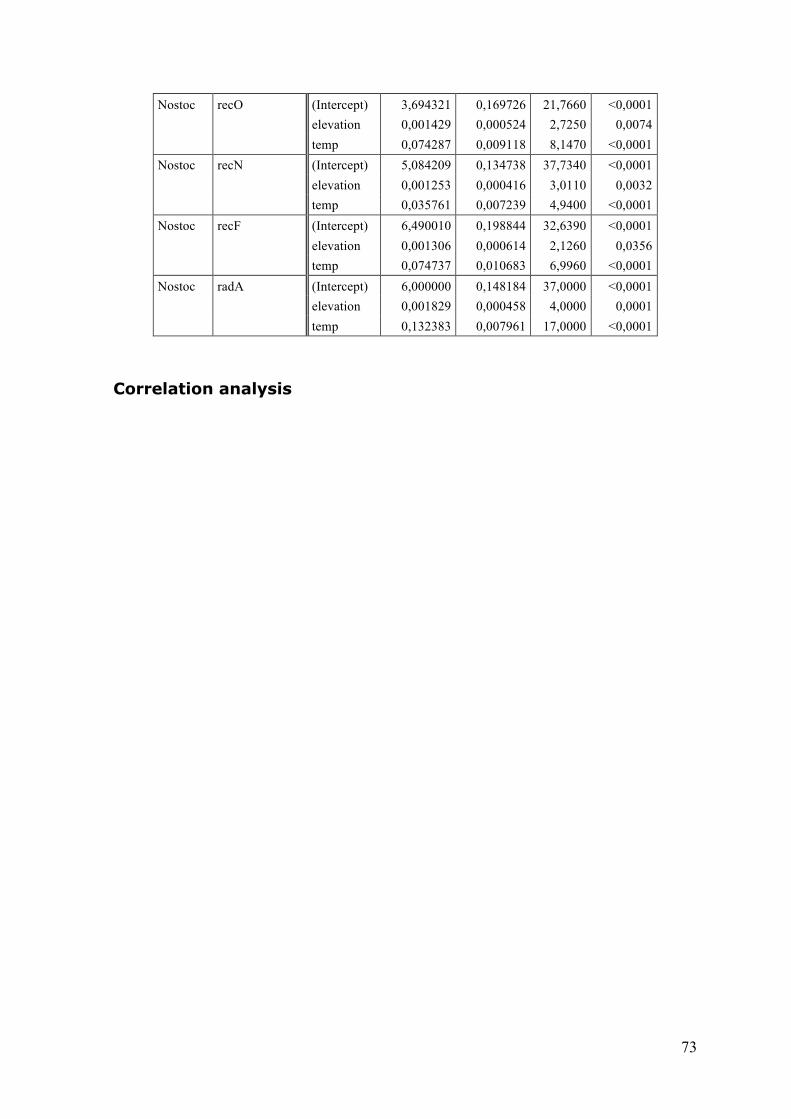
73
Nostoc recO (Intercept) 3,694321 0,169726 21,7660 <0,0001 elevation 0,001429 0,000524 2,7250 0,0074 temp 0,074287 0,009118 8,1470 <0,0001 Nostoc recN (Intercept) 5,084209 0,134738 37,7340 <0,0001 elevation 0,001253 0,000416 3,0110 0,0032 temp 0,035761 0,007239 4,9400 <0,0001 Nostoc recF (Intercept) 6,490010 0,198844 32,6390 <0,0001 elevation 0,001306 0,000614 2,1260 0,0356 temp 0,074737 0,010683 6,9960 <0,0001 Nostoc radA (Intercept) 6,000000 0,148184 37,0000 <0,0001 elevation 0,001829 0,000458 4,0000 0,0001 temp 0,132383 0,007961 17,0000 <0,0001
Correlation analysis

74
Tabl
e S
9: C
orre
latio
n co
effic
ient
s fo
r all
cand
idat
e ge
nes
from
cor
rela
tion
anal
ysis
lec1
lec2
hsp90Npun_F4482
hsp88
hsp98UCRNP2_806
msn2
mot1
hhk2
spp
swi10
dnaJ
groEL
hrcA
radA
recF
recN
recO
lec1
0,0056
0,0845
0,1467
0,0781
0,0604
0,1753
0,0114
0,0275
0,7233
0,0083
0,0060
0,4324
0,0147
0,0385
0,0590
0,0600
0,0064
0,0006
lec2
0,0056
0,1329
0,0002
0,3443
0,8401
0,9457
0,2819
0,2811
0,1472
0,0813
0,5288
0,0044
0,5672
0,1653
0,0000
0,0005
0,0002
0,0000
hsp90
0,0845
0,1329
0,0291
0,0002
0,0007
0,0000
0,0000
0,0000
0,0240
0,0000
0,0000
0,0000
0,0070
0,0000
0,0000
0,3454
0,0098
0,0091
Npun_F4482
0,1467
0,0002
0,0291
0,1372
0,6680
0,1519
0,4738
0,0233
0,7188
0,0502
0,8787
0,0001
0,9540
0,0025
0,0001
0,2761
0,6293
0,2805
hsp88
0,0781
0,3443
0,0002
0,1372
0,0000
0,0000
0,0000
0,0000
0,0000
0,0000
0,0000
0,0002
0,0000
0,0000
0,0002
0,0002
0,0252
0,0010
hsp98
0,0604
0,8401
0,0007
0,6680
0,0000
0,0000
0,0000
0,0000
0,0000
0,0000
0,0000
0,0777
0,0000
0,1043
0,0019
0,0000
0,0000
0,0217
UCRNP2_806
0,1753
0,9457
0,0000
0,1519
0,0000
0,0000
0,0000
0,0000
0,0000
0,0000
0,0000
0,9204
0,0000
0,1993
0,0156
0,0324
0,0000
0,0274
msn2
0,0114
0,2819
0,0000
0,4738
0,0000
0,0000
0,0000
0,0000
0,0000
0,0000
0,0000
0,0062
0,0000
0,0000
0,0067
0,0092
0,1794
0,0172
mot1
0,0275
0,2811
0,0000
0,0233
0,0000
0,0000
0,0000
0,0000
0,0000
0,0000
0,0000
0,9961
0,0000
0,1073
0,9995
0,9038
0,0655
0,1114
hhk2
0,7233
0,1472
0,0240
0,7188
0,0000
0,0000
0,0000
0,0000
0,0000
0,0000
0,0000
0,0602
0,0057
0,1849
0,0121
0,0000
0,0003
0,0224
spp
0,0083
0,0813
0,0000
0,0502
0,0000
0,0000
0,0000
0,0000
0,0000
0,0000
0,0000
0,6783
0,0000
0,3324
0,8471
0,3006
0,0620
0,7706
swi10
0,0060
0,5288
0,0000
0,8787
0,0000
0,0000
0,0000
0,0000
0,0000
0,0000
0,0000
0,7422
0,0000
0,0857
0,3212
0,0252
0,0037
0,7234
dnaJ
0,4324
0,0044
0,0000
0,0001
0,0002
0,0777
0,9204
0,0062
0,9961
0,0602
0,6783
0,7422
0,4018
0,0000
0,0000
0,1030
0,1167
0,0001
groEL
0,0147
0,5672
0,0070
0,9540
0,0000
0,0000
0,0000
0,0000
0,0000
0,0057
0,0000
0,0000
0,4018
0,0520
0,0151
0,0040
0,0001
0,0049
hrcA
0,0385
0,1653
0,0000
0,0025
0,0000
0,1043
0,1993
0,0000
0,1073
0,1849
0,3324
0,0857
0,0000
0,0520
0,0011
0,5294
0,0369
0,0384
radA
0,0590
0,0000
0,0000
0,0001
0,0002
0,0019
0,0156
0,0067
0,9995
0,0121
0,8471
0,3212
0,0000
0,0151
0,0011
0,0000
0,0000
0,0000
recF
0,0600
0,0005
0,3454
0,2761
0,0002
0,0000
0,0324
0,0092
0,9038
0,0000
0,3006
0,0252
0,1030
0,0040
0,5294
0,0000
0,0000
0,0000
recN
0,0064
0,0002
0,0098
0,6293
0,0252
0,0000
0,0000
0,1794
0,0655
0,0003
0,0620
0,0037
0,1167
0,0001
0,0369
0,0000
0,0000
0,0000
recO
0,0006
0,0000
0,0091
0,2805
0,0010
0,0217
0,0274
0,0172
0,1114
0,0224
0,7706
0,7234
0,0001
0,0049
0,0384
0,0000
0,0000
0,0000
lec1
lec2
hsp90Npun_F4482
hsp88
hsp98UCRNP2_806
msn2
mot1
hhk2
spp
swi10
dnaJ
groEL
hrcA
radA
recF
recN
recO
lec1
10,2514
0,1581
-0,13330,1614
0,1719
0,1245
0,2302
0,2013
0,0326
0,2400
0,2497
0,0723
0,2221
0,1891
0,1729
0,1722
0,2477
0,3101
lec2
0,2514
1-0,1380
-0,3349-0,08710,0186
-0,0063
0,0990
0,0992
0,1331
0,1598
0,0581
-0,2581
0,0527
-0,1275
0,5688
0,3139
0,3333
0,5293
hsp90
0,1581
-0,1380
10,1993
0,3298
0,3062
0,3629
0,4116
0,3981
0,2060
0,4217
0,5222
0,3964
-0,24500,4912
-0,3704-0,0869-0,2348-0,2373
Npun_F4482
-0,1333-0,3349
0,1993
10,1365
-0,0395
-0,1316
0,0660
-0,2070-0,0332-0,1792-0,01410,3454
0,0053
0,2731
-0,3439-0,10020,0445
-0,0993
hsp88
0,1614
-0,0871
0,3298
0,1365
10,8719
0,5740
0,8405
0,6657
0,7066
0,6345
0,6702
0,3377
-0,37310,3557
-0,3323-0,3333-0,2043-0,2956
hsp98
0,1719
0,0186
0,3062
-0,03950,8719
10,6371
0,7774
0,6355
0,7995
0,6802
0,7532
0,1617
-0,40050,1490
-0,2809-0,4494-0,3605-0,2095
UCRNP2_806
0,1245
-0,0063
0,3629
-0,13160,5740
0,6371
10,6182
0,7069
0,5184
0,5642
0,6817
-0,0092-0,3594
0,1180
-0,2204-0,1955-0,3534-0,2013
msn2
0,2302
0,0990
0,4116
0,0660
0,8405
0,7774
0,6182
10,7403
0,6691
0,7171
0,7220
0,2486
-0,50710,3986
-0,2462-0,2367-0,1234-0,2171
mot1
0,2013
0,0992
0,3981
-0,20700,6657
0,6355
0,7069
0,7403
10,5299
0,8695
0,7975
0,0004
-0,44810,1478
0,0001
-0,0111-0,1687-0,1461
hhk2
0,0326
0,1331
0,2060
-0,03320,7066
0,7995
0,5184
0,6691
0,5299
10,4760
0,5282
0,1721
-0,25090,1218
-0,2283-0,3920-0,3261-0,2084
spp
0,2400
0,1598
0,4217
-0,17920,6345
0,6802
0,5642
0,7171
0,8695
0,4760
10,8086
-0,0383-0,47840,0892
0,0178
-0,0953-0,1709-0,0269
swi10
0,2497
0,0581
0,5222
-0,01410,6702
0,7532
0,6817
0,7220
0,7975
0,5282
0,8086
10,0303
-0,44500,1575
-0,0913-0,2044-0,2627-0,0326
dnaJ
0,0723
-0,2581
0,3964
0,3454
0,3377
0,1617
-0,0092
0,2486
0,0004
0,1721
-0,03830,0303
10,0772
0,6400
-0,4351-0,14960,1440
-0,3417
groEL
0,2221
0,0527
-0,2450
0,0053
-0,3731-0,4005
-0,3594-0,5071-0,4481-0,2509-0,4784-0,44500,0772
1-0,1778
0,2215
0,2612
0,3416
0,2551
hrcA
0,1891
-0,1275
0,4912
0,2731
0,3557
0,1490
0,1180
0,3986
0,1478
0,1218
0,0892
0,1575
0,6400
-0,1778
1-0,29410,0580
0,1908
-0,1893
radA
0,1729
0,5688
-0,3704
-0,3439-0,3323-0,2809
-0,2204-0,24620,0001
-0,22830,0178
-0,0913-0,4351
0,2215
-0,2941
10,6542
0,5243
0,7417
recF
0,1722
0,3139
-0,0869
-0,1002-0,3333-0,4494
-0,1955-0,2367-0,0111-0,3920-0,0953-0,2044-0,1496
0,2612
0,0580
0,6542
10,6490
0,4437
recN
0,2477
0,3333
-0,2348
0,0445
-0,2043-0,3605
-0,3534-0,1234-0,1687-0,3261-0,1709-0,26270,1440
0,3416
0,1908
0,5243
0,6490
10,4615
recO
0,3101
0,5293
-0,2373
-0,0993-0,2956-0,2095
-0,2013-0,2171-0,1461-0,2084-0,0269-0,0326-0,3417
0,2551
-0,1893
0,7417
0,4437
0,4615
1
lec1
lec2
hsp90Npun_F4482
hsp88
hsp98UCRNP2_806
msn2
mot1
hhk2
spp
swi10
dnaJ
groEL
hrcA
radA
recF
recN
recO
lec1
0,0056
0,0845
0,1467
0,0781
0,0604
0,1753
0,0114
0,0275
0,7233
0,0083
0,0060
0,4324
0,0147
0,0385
0,0590
0,0600
0,0064
0,0006
lec2
0,0056
0,1329
0,0002
0,3443
0,8401
0,9457
0,2819
0,2811
0,1472
0,0813
0,5288
0,0044
0,5672
0,1653
0,0000
0,0005
0,0002
0,0000
hsp90
0,0845
0,1329
0,0291
0,0002
0,0007
0,0000
0,0000
0,0000
0,0240
0,0000
0,0000
0,0000
0,0070
0,0000
0,0000
0,3454
0,0098
0,0091
Npun_F4482
0,1467
0,0002
0,0291
0,1372
0,6680
0,1519
0,4738
0,0233
0,7188
0,0502
0,8787
0,0001
0,9540
0,0025
0,0001
0,2761
0,6293
0,2805
hsp88
0,0781
0,3443
0,0002
0,1372
0,0000
0,0000
0,0000
0,0000
0,0000
0,0000
0,0000
0,0002
0,0000
0,0000
0,0002
0,0002
0,0252
0,0010
hsp98
0,0604
0,8401
0,0007
0,6680
0,0000
0,0000
0,0000
0,0000
0,0000
0,0000
0,0000
0,0777
0,0000
0,1043
0,0019
0,0000
0,0000
0,0217
UCRNP2_806
0,1753
0,9457
0,0000
0,1519
0,0000
0,0000
0,0000
0,0000
0,0000
0,0000
0,0000
0,9204
0,0000
0,1993
0,0156
0,0324
0,0000
0,0274
msn2
0,0114
0,2819
0,0000
0,4738
0,0000
0,0000
0,0000
0,0000
0,0000
0,0000
0,0000
0,0062
0,0000
0,0000
0,0067
0,0092
0,1794
0,0172
mot1
0,0275
0,2811
0,0000
0,0233
0,0000
0,0000
0,0000
0,0000
0,0000
0,0000
0,0000
0,9961
0,0000
0,1073
0,9995
0,9038
0,0655
0,1114
hhk2
0,7233
0,1472
0,0240
0,7188
0,0000
0,0000
0,0000
0,0000
0,0000
0,0000
0,0000
0,0602
0,0057
0,1849
0,0121
0,0000
0,0003
0,0224
spp
0,0083
0,0813
0,0000
0,0502
0,0000
0,0000
0,0000
0,0000
0,0000
0,0000
0,0000
0,6783
0,0000
0,3324
0,8471
0,3006
0,0620
0,7706
swi10
0,0060
0,5288
0,0000
0,8787
0,0000
0,0000
0,0000
0,0000
0,0000
0,0000
0,0000
0,7422
0,0000
0,0857
0,3212
0,0252
0,0037
0,7234
dnaJ
0,4324
0,0044
0,0000
0,0001
0,0002
0,0777
0,9204
0,0062
0,9961
0,0602
0,6783
0,7422
0,4018
0,0000
0,0000
0,1030
0,1167
0,0001
groEL
0,0147
0,5672
0,0070
0,9540
0,0000
0,0000
0,0000
0,0000
0,0000
0,0057
0,0000
0,0000
0,4018
0,0520
0,0151
0,0040
0,0001
0,0049
hrcA
0,0385
0,1653
0,0000
0,0025
0,0000
0,1043
0,1993
0,0000
0,1073
0,1849
0,3324
0,0857
0,0000
0,0520
0,0011
0,5294
0,0369
0,0384
radA
0,0590
0,0000
0,0000
0,0001
0,0002
0,0019
0,0156
0,0067
0,9995
0,0121
0,8471
0,3212
0,0000
0,0151
0,0011
0,0000
0,0000
0,0000
recF
0,0600
0,0005
0,3454
0,2761
0,0002
0,0000
0,0324
0,0092
0,9038
0,0000
0,3006
0,0252
0,1030
0,0040
0,5294
0,0000
0,0000
0,0000
recN
0,0064
0,0002
0,0098
0,6293
0,0252
0,0000
0,0000
0,1794
0,0655
0,0003
0,0620
0,0037
0,1167
0,0001
0,0369
0,0000
0,0000
0,0000
recO
0,0006
0,0000
0,0091
0,2805
0,0010
0,0217
0,0274
0,0172
0,1114
0,0224
0,7706
0,7234
0,0001
0,0049
0,0384
0,0000
0,0000
0,0000
lec1
lec2
hsp90Npun_F4482
hsp88
hsp98UCRNP2_806
msn2
mot1
hhk2
spp
swi10
dnaJ
groEL
hrcA
radA
recF
recN
recO
lec1
10,2514
0,1581
-0,13330,1614
0,1719
0,1245
0,2302
0,2013
0,0326
0,2400
0,2497
0,0723
0,2221
0,1891
0,1729
0,1722
0,2477
0,3101
lec2
0,2514
1-0,1380
-0,3349-0,08710,0186
-0,0063
0,0990
0,0992
0,1331
0,1598
0,0581
-0,2581
0,0527
-0,1275
0,5688
0,3139
0,3333
0,5293
hsp90
0,1581
-0,1380
10,1993
0,3298
0,3062
0,3629
0,4116
0,3981
0,2060
0,4217
0,5222
0,3964
-0,24500,4912
-0,3704-0,0869-0,2348-0,2373
Npun_F4482
-0,1333-0,3349
0,1993
10,1365
-0,0395
-0,1316
0,0660
-0,2070-0,0332-0,1792-0,01410,3454
0,0053
0,2731
-0,3439-0,10020,0445
-0,0993
hsp88
0,1614
-0,0871
0,3298
0,1365
10,8719
0,5740
0,8405
0,6657
0,7066
0,6345
0,6702
0,3377
-0,37310,3557
-0,3323-0,3333-0,2043-0,2956
hsp98
0,1719
0,0186
0,3062
-0,03950,8719
10,6371
0,7774
0,6355
0,7995
0,6802
0,7532
0,1617
-0,40050,1490
-0,2809-0,4494-0,3605-0,2095
UCRNP2_806
0,1245
-0,0063
0,3629
-0,13160,5740
0,6371
10,6182
0,7069
0,5184
0,5642
0,6817
-0,0092-0,3594
0,1180
-0,2204-0,1955-0,3534-0,2013
msn2
0,2302
0,0990
0,4116
0,0660
0,8405
0,7774
0,6182
10,7403
0,6691
0,7171
0,7220
0,2486
-0,50710,3986
-0,2462-0,2367-0,1234-0,2171
mot1
0,2013
0,0992
0,3981
-0,20700,6657
0,6355
0,7069
0,7403
10,5299
0,8695
0,7975
0,0004
-0,44810,1478
0,0001
-0,0111-0,1687-0,1461
hhk2
0,0326
0,1331
0,2060
-0,03320,7066
0,7995
0,5184
0,6691
0,5299
10,4760
0,5282
0,1721
-0,25090,1218
-0,2283-0,3920-0,3261-0,2084
spp
0,2400
0,1598
0,4217
-0,17920,6345
0,6802
0,5642
0,7171
0,8695
0,4760
10,8086
-0,0383-0,47840,0892
0,0178
-0,0953-0,1709-0,0269
swi10
0,2497
0,0581
0,5222
-0,01410,6702
0,7532
0,6817
0,7220
0,7975
0,5282
0,8086
10,0303
-0,44500,1575
-0,0913-0,2044-0,2627-0,0326
dnaJ
0,0723
-0,2581
0,3964
0,3454
0,3377
0,1617
-0,0092
0,2486
0,0004
0,1721
-0,03830,0303
10,0772
0,6400
-0,4351-0,14960,1440
-0,3417
groEL
0,2221
0,0527
-0,2450
0,0053
-0,3731-0,4005
-0,3594-0,5071-0,4481-0,2509-0,4784-0,44500,0772
1-0,1778
0,2215
0,2612
0,3416
0,2551
hrcA
0,1891
-0,1275
0,4912
0,2731
0,3557
0,1490
0,1180
0,3986
0,1478
0,1218
0,0892
0,1575
0,6400
-0,1778
1-0,29410,0580
0,1908
-0,1893
radA
0,1729
0,5688
-0,3704
-0,3439-0,3323-0,2809
-0,2204-0,24620,0001
-0,22830,0178
-0,0913-0,4351
0,2215
-0,2941
10,6542
0,5243
0,7417
recF
0,1722
0,3139
-0,0869
-0,1002-0,3333-0,4494
-0,1955-0,2367-0,0111-0,3920-0,0953-0,2044-0,1496
0,2612
0,0580
0,6542
10,6490
0,4437
recN
0,2477
0,3333
-0,2348
0,0445
-0,2043-0,3605
-0,3534-0,1234-0,1687-0,3261-0,1709-0,26270,1440
0,3416
0,1908
0,5243
0,6490
10,4615
recO
0,3101
0,5293
-0,2373
-0,0993-0,2956-0,2095
-0,2013-0,2171-0,1461-0,2084-0,0269-0,0326-0,3417
0,2551
-0,1893
0,7417
0,4437
0,4615
1
Tabl
e S
10: P
-val
ues
for a
ll ca
ndid
ate
gene
s fro
m c
orre
latio
n an
alys
is

75
Principal component analysis (PCA)
Table S11: Gene loadings of principle components PC1-3.
PC1 PC2 PC3 lec1 0,30754 0,21275 -0,85287 lec2 0,86535 0,02149 0,33238 hsp90 -0,06286 0,21512 -0,09849 Npun_F4482 -0,08382 -0,00231 -0,03140 hsp88 -0,04576 0,36967 0,01605 hsp98 -0,01009 0,45124 0,07562 UCRNP2_806 -0,00775 0,22145 0,03730 msn2 0,02350 0,35931 0,03904 mot1 0,03775 0,28752 0,04157 hhk2 0,01561 0,23818 0,11343 spp 0,06100 0,30498 0,04330 swi10 0,01663 0,22002 0,00572 dnaJ -0,06987 0,05905 -0,09161 groEL 0,06887 -0,23938 -0,30449 hrcA -0,02988 0,08063 -0,08638 radA 0,25305 -0,12585 0,01247 recF 0,13929 -0,12027 -0,08676 recN 0,08926 -0,06906 -0,07774 recO 0,18763 -0,07994 -0,06131
Table S12: Detailed ANOVA output for PC1-3 for linear mixed effects model with „temperature“ and „site“ as fixed and „individual“ as random factor.
factor numDF denDF F-value p-value PC1 (Intercept) 1 92 0,0000 1,0000 temp 2 92 42,9750 <0,0001 site 7 92 11,7552 <0,0001 temp:site 14 92 0,8898 0,5721 PC2 (Intercept) 1 92 0,0000 1,0000 temp 2 92 147,1362 <0,0001 site 7 92 28,2533 <0,0001 temp:site 14 92 2,1405 0,0162 PC3 (Intercept) 1 92 0,0000 1,0000 temp 2 92 307,6892 0,0509 site 7 92 4,0572 0,0006 temp:site 14 92 0,2406 0,9977
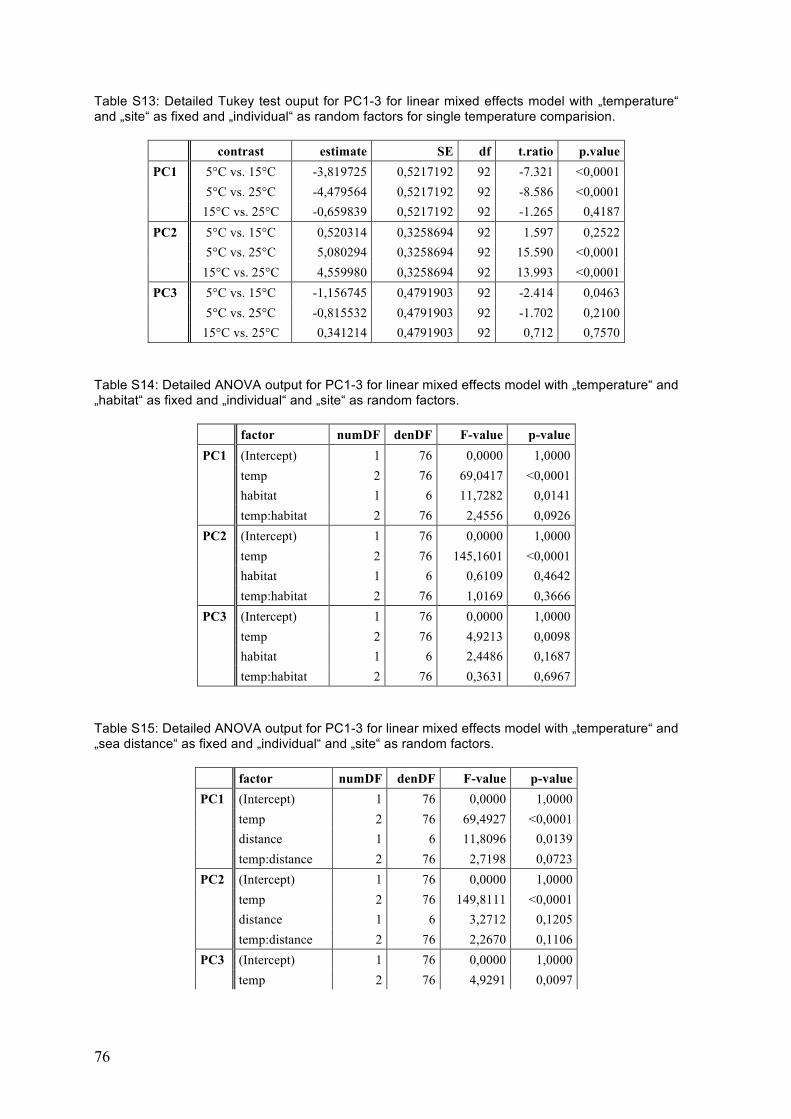
76
Table S13: Detailed Tukey test ouput for PC1-3 for linear mixed effects model with „temperature“ and „site“ as fixed and „individual“ as random factors for single temperature comparision.
contrast estimate SE df t.ratio p.value PC1 5°C vs. 15°C -3,819725 0,5217192 92 -7.321 <0,0001 5°C vs. 25°C -4,479564 0,5217192 92 -8.586 <0,0001 15°C vs. 25°C -0,659839 0,5217192 92 -1.265 0,4187 PC2 5°C vs. 15°C 0,520314 0,3258694 92 1.597 0,2522 5°C vs. 25°C 5,080294 0,3258694 92 15.590 <0,0001 15°C vs. 25°C 4,559980 0,3258694 92 13.993 <0,0001 PC3 5°C vs. 15°C -1,156745 0,4791903 92 -2.414 0,0463 5°C vs. 25°C -0,815532 0,4791903 92 -1.702 0,2100 15°C vs. 25°C 0,341214 0,4791903 92 0,712 0,7570
Table S14: Detailed ANOVA output for PC1-3 for linear mixed effects model with „temperature“ and „habitat“ as fixed and „individual“ and „site“ as random factors.
factor numDF denDF F-value p-value PC1 (Intercept) 1 76 0,0000 1,0000 temp 2 76 69,0417 <0,0001 habitat 1 6 11,7282 0,0141 temp:habitat 2 76 2,4556 0,0926 PC2 (Intercept) 1 76 0,0000 1,0000 temp 2 76 145,1601 <0,0001 habitat 1 6 0,6109 0,4642 temp:habitat 2 76 1,0169 0,3666 PC3 (Intercept) 1 76 0,0000 1,0000 temp 2 76 4,9213 0,0098 habitat 1 6 2,4486 0,1687 temp:habitat 2 76 0,3631 0,6967
Table S15: Detailed ANOVA output for PC1-3 for linear mixed effects model with „temperature“ and „sea distance“ as fixed and „individual“ and „site“ as random factors.
factor numDF denDF F-value p-value PC1 (Intercept) 1 76 0,0000 1,0000 temp 2 76 69,4927 <0,0001 distance 1 6 11,8096 0,0139 temp:distance 2 76 2,7198 0,0723 PC2 (Intercept) 1 76 0,0000 1,0000 temp 2 76 149,8111 <0,0001 distance 1 6 3,2712 0,1205 temp:distance 2 76 2,2670 0,1106 PC3 (Intercept) 1 76 0,0000 1,0000 temp 2 76 4,9291 0,0097

77
distance 1 6 0,5540 0,4848 temp:distance 2 76 0,4235 0,6563
Table S16: Detailed ANOVA output for PC1-3 for linear mixed effects model with „temperature“ and „elevation“ as fixed and „individual“ as random factor.
factor numDF denDF F-value p-value PC1 (Intercept) 1 76 0,0000 1,0000 temp 2 76 72,2156 <0,0001 elevation 1 6 39,7260 0,0007 temp:elevation 2 76 4,3153 0,0168 PC2 (Intercept) 1 76 0,0000 1,0000 temp 2 76 149,9104 <0,0001 elevation 1 6 0,5445 0,4884 temp:elevation 2 76 2,2941 0,1078 PC3 (Intercept) 1 76 0,0000 1,0000 temp 2 76 4,9156 0,0098 elevation 1 6 10,1785 0,0188 temp:elevation 2 76 0,3182 0,7285

78