funding strategy for the strategic initiatives from the funding strategy report... · funding...
TRANSCRIPT

Funding Strategy for the Strategic Init iat ives from the
2012-2013 Puget Sound Action Agenda Volume 2: Technical Report
ECONorthwest)'3231-'7�����*-2%2')�����40%22-2+
Final Report August 13, 2014
With corrections to shellfish funding information as of September 9, 2014
Prepared for:
Puget Sound Partnership Ecosystem Coordination Board Finance Subcommittee

Funding Strategy for the Strategic Initiatives from the 2012-2013 Puget Sound Action Agenda
Volume 2: Technical Report 3
Table of Contents
Acknowledgements ....................................................................................................... 4
1 Introduction ............................................................................................................. 6
1.1 Accuracy and Precision, Confidence and Uncertainty in this Analysis ................................................................................................................................. 7
1.2 Prioritization Methodology ...................................................................................... 8
2 Needs, Programs and Actions for the Strategic Initiatives ............................. 10
2.1 Habitat ....................................................................................................................... 10
2.2 Stormwater ............................................................................................................... 17
2.3 Shellfish ..................................................................................................................... 28
3 Costs of the Strategic Initiatives .......................................................................... 35
3.1 Habitat ....................................................................................................................... 35
3.2 Stormwater Costs ..................................................................................................... 43
3.3 Shellfish ..................................................................................................................... 58
4 Historical and Current Funding of the Strategic Initiatives ........................... 62
4.1 Habitat ....................................................................................................................... 62
4.2 Stormwater ............................................................................................................... 67
4.3 Shellfish ..................................................................................................................... 77
5 Long Term Funding Gaps of the Strategic Initiatives ...................................... 79
5.1 Habitat ....................................................................................................................... 80
5.2 Stormwater ............................................................................................................... 80
5.3 Shellfish ..................................................................................................................... 81
6 Overall Cost Estimates for the Strategic Initiatives Over Time ...................... 83
7 Future Funding Opportunities of the Strategic Initiatives .............................. 86
7.1 Habitat ....................................................................................................................... 90
7.2 Stormwater ............................................................................................................... 94
7.3 Shellfish ..................................................................................................................... 96
Appendix A -‐‑ Crediting and Banking Programs for Water and Habitat ........................................................................................................................... 98
7.4 Water Transactions ................................................................................................ 100
7.5 Biodiversity (Habitat) Transactions .................................................................... 106

Funding Strategy for the Strategic Initiatives from the 2012-2013 Puget Sound Action Agenda
Volume 2: Technical Report 4
Acknowledgements
ECONorthwest, Evergreen Funding Consultants, and Triangle Associates, Inc. (the consultant team) would like to acknowledge the Puget Sound Partnership’s Ecosystem Coordination Board Finance Subcommittee for its significant contributions to this report. Subcommittee members include:
• Fred Jarrett, Deputy County Executive, King County Executive’s Office; Finance Subcommittee Chair
• JT Austin, Policy Advisor on Natural Resources, Washington State Governor’s Legislative Affairs and Policy Office
• Cathy Baker, Senior Policy Representative, The Nature Conservancy • Brynn Brady, Ceiba Consulting • Marc Daily, Deputy Director, Puget Sound Partnership • Chris Davis, Puget Sound Director of Conservation, The Nature
Conservancy • Bill Dewey, Taylor Shellfish Farms • Robert Duff, Senior Policy Advisor, Natural Resources and Environment,
Washington State Governor’s Legislative Affairs and Policy Office • Diana Gale, Leadership Council Member, Puget Sound Partnership • Will Hall, Councilmember, City of Shoreline • Martha Kongsgaard, Leadership Council Chair, Puget Sound Partnership • Adam LeMieux, Deputy District Director, Congressman Rick Larsen • Doug Osterman, Green/Duwamish Watershed Coordinator, WRIA 9
Watershed Ecosystem Forum • Rebecca Pittman, Budget Policy Manager, Department of Ecology • Dennis Robertson, Tukwila City Council Member; Chair, Management
Committee, WRIA 9 Watershed Ecosystem Forum • Susan Saffery, Seattle Public Utilities Director’s Office, City of Seattle • Dave Somers, Snohomish County Councilman; Ecosystem Coordination
Board Chair • Linda Steinmann, Budget Assistant, Office of Financial Management • Representative Steve Tharinger, WA State Representative, 24th Legislative
District • Dave Williams, Director of Government Relations, Association of
Washington Cities • Dan Wrye, Water Quality and Watersheds Section Supervisor, Pierce
County
The consultant team would also like to acknowledge additional individuals who contributed significantly to the funding strategy development process and this

Funding Strategy for the Strategic Initiatives from the 2012-2013 Puget Sound Action Agenda
Volume 2: Technical Report 5
report, including: Brian Walsh, Planning Manager, Puget Sound Partnership; Megan Smith, Environmental Policy Advisor, King County Executive’s Office; Mo McBroom, The Nature Conservancy; and Joan Lee, Section Manager, Rural and Regional Services, King County Water and Land Resources Division.
A number of others contributed input to improve this report including Jim Simmonds, King County and WRIA 9; Dick Gersib, Washington State Department of Transportation; Ken Stone, Washington State Department of Transportation; Carol Macilroy; Bob Carey, The Nature Conservancy; Carl Schroeder, Association of Washington Cities; Dave Catterson, Association of Washington Cities; Bruce Wulkan, Puget Sound Partnership; David St. John, Puget Sound Partnership; Jim Cahill, Office of Financial Management; Stuart Glasoe, Department of Health; Melanie Roberts, Sterling Associates; and numerous staff.
Consultant Team: Mark Buckley, ECONorthwest; Dennis Canty, Evergreen Funding Consultants; Betsy Daniels, Triangle Associates, Inc.; Megan Johnston, Triangle Associates, Inc.; and Austin Rempel, ECONorthwest.
For more information about this report, please contact:
Mark Buckley
ECONorthwest 222 SW Columbia Street Portland, OR 97201 503-‐‑222-‐‑6060

Funding Strategy for the Strategic Initiatives from the 2012-2013 Puget Sound Action Agenda
Volume 2: Technical Report 6
1 Introduction
As part of the 2012-‐‑2013 Action Agenda, the Puget Sound Partnership (Partnership or PSP) prioritized the three Strategic Initiatives of:
• Protect and restore habitat; • Prevent pollution from urban stormwater runoff; and • Restore and re-‐‑open shellfish beds.
The Puget Sound Partnership’s Ecosystem Coordination Board (ECB), which represents the range of partner institutions to the recovery of Puget Sound, created a Finance Subcommittee to develop a strategy for long-‐‑term funding of the Strategic Initiatives. In order to develop this funding strategy, the Finance Subcommittee addressed a necessary series of questions:
1. What actions are necessary to achieve the Strategic Initiatives? 2. What are the costs of these actions? 3. What funding is currently available and likely available in the future for
these actions? 4. What is the funding gap, and how should it be addressed?
The ECB Finance Subcommittee (Subcommittee) worked with support staff combined with outreach to agency and topical experts to answer these questions from January to July, 2014. This report documents the data compiled in support of addressing these funding questions.
The Action Agenda and associated efforts to achieve Puget Sound recovery are constantly and simultaneously under implementation, improvement, and adaptation. Consequently this report is a snapshot in time, based on the best understanding of the short-‐‑term and long-‐‑term priorities and needs, and expectations about their trajectories. The Partnership released the 2014-‐‑2015 Action Agenda while this project was underway, and the Partnership is reviewing new salmon recovery plans. A number of other useful research projects are underway and incomplete but beginning to generate results, such as the WRIA 9 stormwater retrofit study, Department of Health (DOH) work on a shellfish habitat program, and a variety of work in support of the Floodplains by Design program. This report incorporates the best available information, but new and likely better information will increasingly be available.
This report covers a wide range of objectives and actions. The information herein identifies the primary actions, costs, funding sources, and funding opportunities. Other program and project-‐‑specific documentation, much of which is referenced in this report, hold more comprehensive detail. The objective of this presentation

Funding Strategy for the Strategic Initiatives from the 2012-2013 Puget Sound Action Agenda
Volume 2: Technical Report 7
is to provide sufficient information to understand the major actions and needs, and the largest existing and potential funding sources. Individual projects and programs will typically involve a larger or more nuanced set of objectives, and corresponding funding opportunities. The intention of the ECB Finance Subcommittee is to develop a set of large-‐‑scale funding strategies and resulting funding sources to meet major goals of the Strategic Initiatives across the Puget Sound Basin.
1.1 Accuracy and Precision, Confidence and Uncertainty in this Analysis
Answering the question, “what are the long-‐‑ term funding needs for the Strategic Initiatives?” requires assembly of several distinct analytical components, which currently bear varying levels of certainty. Scientific progress in Puget Sound has accomplished significant understanding of the current impaired and declining condition of Puget Sound and the major stressors driving this state. The resulting sophisticated understanding of this complex problem of recovery drives the Partnership’s Action Agenda.
In the short term, this scientific process identifies current projects and programs to move towards recovery success. But full recovery will not be accomplished in the near term. Long-‐‑term planning is necessary, and scientific understanding triangulated with currently-‐‑defined and successful projects and programs identifies the core components of the Strategic Initiatives over the long term, and the level of effort that will be necessary. Therefore current components of the Strategic Initiatives allow a high degree of accuracy and precision for the complete set. But the long-‐‑term needs are most accurate in the major components, while minor components are likely incompletely-‐‑defined and in many cases, necessary programs do not yet exist.
These realities drive the overall approach to this analysis and presentation of information and results. We provide the available information of relatively high confidence and certainty, which means winnowing the set of strategies and actions as we move to description of the long-‐‑term needs. We provide a high level of detail for the Near-‐‑Term Actions as defined in the Action Agenda, but in the long-‐‑term focus on the major actions with the bulk of the funding need. So the long-‐‑term components of this analysis do not include the individual, small-‐‑scale and short-‐‑term actions surely to arise comparably to the currently-‐‑defined Near-‐‑Term Actions. But these short-‐‑term actions are currently a small share of the need and cost, and similar ones in the future are likely to be as well.
When long-‐‑term costs are not already well-‐‑defined, we present the best available information. In some cases, this involves presenting information from multiple

Funding Strategy for the Strategic Initiatives from the 2012-2013 Puget Sound Action Agenda
Volume 2: Technical Report 8
sources with explicit and implicit synthesis and triangulation. In this sense, it is most accurate to consider long-‐‑term costs to be representative and intended to provide an estimate of the order of magnitude as precisely as appropriate.
We do know that actions to protect Puget Sound and prevent degradation are at least an order of magnitude less costly than ex post cleanup and restoration.1 So waiting for full program definition for major efforts is more expensive than acting now. Our prioritization process for areas of long-‐‑term analysis was based on the core strategies defined in the Action Agenda with the most confidence both in their need and likelihood for successful contribution to Puget Sound recovery.
1.2 Prioritization Methodology In order to develop funding strategy recommendations for implementation of the 2012-‐‑2013 Action Agenda, a significant amount of effort went into the process of defining the scope of actions to be included in the programs, costs, and gap analyses, which would serve as the foundation of the proposed investment and funding strategy.
In the initial stages of the funding strategy development process, it became evident that utilizing Near-‐‑Term Actions (NTAs) outlined in the 2012-‐‑2013 Action Agenda to identify the overall effort trajectory for each Strategic Initiative would not be sufficient for identifying the overall long-‐‑term needs for programs and costs of the Strategic Initiatives. Many of the NTAs are one-‐‑time, short-‐‑term actions, and focusing only on NTAs would exclude important and costly programs from the analysis (particularly those related to stormwater). The ECB Finance Subcommittee agreed that an NTA-‐‑focus would not be adequate to accurately characterize Strategic Initiative programs, costs, and funding gaps through Puget Sound recovery. In order to conduct a more comprehensive and accurate analysis of the Strategic Initiative programs and costs—and in the end a funding strategy for those programs—we (with guidance from the ECB Finance Subcommittee) expanded the analysis beyond the NTAs to the Strategic Initiative sub-‐‑strategy level. In particular we investigate the long-‐‑term stormwater needs, the culvert retrofit challenge for fish passage, the emerging strategies around multiple benefits within floodplains, and the septic retrofit loan program from the Department of Health.
1 This is based on prior work by the authors and others to conduct cost comparisons for the initial Action Agenda. For example, restoring habitat is much more costly than protection and prevention of damage to the same habitat.

Funding Strategy for the Strategic Initiatives from the 2012-2013 Puget Sound Action Agenda
Volume 2: Technical Report 9
In order to narrow and re-‐‑frame the scope of the analysis at the sub-‐‑strategy level, we developed an approach to prioritize sub-‐‑strategies and corresponding actions in the 2012-‐‑2013 Action Agenda by priority rankings, costs, and levels of current funding.2 Through this process, we identified 5-‐‑7 high-‐‑medium priority, high-‐‑cost, and under-‐‑funded sub-‐‑strategies and actions for each Strategic Initiative. With the support of the ECB Finance Subcommittee, those priority items remained the focus of the funding strategy analysis and development process (including programs, costs, and funding gaps analyses and funding strategy recommendations).
It’s important to note that at the sub-‐‑strategy level, the Action Agenda often does not define the long-‐‑term projects/programs to achieve the stated goal of the sub-‐‑strategy. In some cases it was necessary to extrapolate long-‐‑term projects/programs based on best available knowledge and consultation with the Puget Sound Partnership and stakeholders—while also respecting the Action Agenda. As a result, the consultants and ECB Finance Subcommittee spent significant time clarifying long-‐‑term sub-‐‑strategy programs (and well-‐‑supported assumptions) for the Strategic Initiatives to include the programs, costs, and gap analyses prior to developing funding strategy recommendations.
2 Sub-‐‑strategy/action priority rankings were based on rankings in Appendix G of the 2012-‐‑2013 Action Agenda, costs and gaps were based on previously completed estimates.

Funding Strategy for the Strategic Initiatives from the 2012-2013 Puget Sound Action Agenda
Volume 2: Technical Report 10
2 Needs, Programs and Actions for the Strategic Initiatives
This section provides highlights of the needs and identified actions for each Strategic Initiative. This information is primarily based on descriptions from the Action Agenda. Refer to the Action Agenda and associated documents on the Partnership’s website for greater detail.
2.1 Habitat The Habitat Strategic Initiative focuses on salmon recovery, but also contributes to progress toward the 2020 ecosystem recovery targets for floodplains, chinook salmon, freshwater water quality, summer stream flows, land development and land cover, shoreline armoring, shellfish beds, swimming beaches, eelgrass, estuaries, toxics in fish, pacific herring, orcas, and marine sediment quality (Table 1).
Table 1. Action Agenda Strategies and 2020 Ecosystem Targets Associated with the Habitat Strategic Initiative NTAs
Source: PSP 2012-2013 Action Agenda
2.1.1 Action Agenda Strategies for Habitat Protection and Restoration
The approach to protecting and restoring habitat to support salmon recovery is focused on the implementation of high priority restoration projects, removing barriers to restoration and protection, and addressing new threats. The Habitat
Number of NTAs Percent of NTAsStrategies
Strategy A. Protect and Restore Terrestrial and Freshwater Ecosystems 17 71%Strategy B. Protect and Restore Marine and Marine Nearshore Ecosystems 6 25%Strategy C. Reduce and Control the Sources of Pollution to Puget Sound 1 4%
Total 24 -Ecosystem Recovery Targets
Floodplains 12 50%Chinook Salmon 10 42%Freshwater Quality 8 33%Summer Stream Flows 5 21%Land Development and Cover 5 21%Shoreline Armoring 4 17%Shellfish Beds 3 13%Swimming Beaches 2 8%Eelgrass 2 8%Estuaries 1 4%Toxics in Fish 1 4%Pacific Herring 1 4%Orcas 1 4%Marine Sediment Quality 1 4%
Total 24 -

Funding Strategy for the Strategic Initiatives from the 2012-2013 Puget Sound Action Agenda
Volume 2: Technical Report 11
Strategic Initiative NTAs are summarized in the list below, and further described in Table 2. These NTAs capture a range of one-‐‑time and potentially ongoing efforts, as they cover a range of program design, education, restoration, monitoring and maintenance efforts.
The 2012-‐‑2013 Action Agenda identifies the following sub-‐‑strategies and actions under the Habitat Protection and Restoration Initiative:
Protect Through Regulations
• Sub-‐‑Strategy A 7.1: Update Puget Sound instream flow rules to encourage conservation
o A 7.1: All of sub-‐‑strategy A7.1 is a priority for the habitat protection and restoration strategic initiative.
• Sub-‐‑Strategy A 5.1: Improve data and information to accelerate floodplain protection, restoration, and flood hazard management.
o A 5.1 NTA 1: Floodplain Protection and Policy Team Actions
• Sub-‐‑Strategy A 5.3: Protect and maintain intact and functional floodplains. o A 5.3 NTA 4: Levee Vegetation.
• Sub-‐‑Strategy B 1.3: Improve, strengthen, and streamline implementation and enforcement of laws, regulations, and permits that protect the marine and nearshore ecosystems and estuaries.
o B 1.3 NTA 2: Hydraulic Code Rules Revision.
• Sub-‐‑Strategy A 1.3: Improve, strengthen, and streamline implementation and enforcement of laws, plans, regulations, and permits consistent with protection and recovery targets.
o A 1.3 NTA 1: ECB Address Regulatory Exemptions.
• Sub-‐‑Strategy A 1.2: Support local governments to adopt and implement plans, regulations, and policies consistent with protection and recovery targets, and incorporate climate change forecasts.
o A 1.2 NTA 1: Land Use Planning Barriers, BMPs and Example Polices.
• Sub-‐‑Strategy B 1.2: Support local governments to adopt and implement plans, regulations, and policies that protect the marine nearshore and estuaries, and incorporate climate change forecasts.
o B 1.2 NTA 1: Update Local Shoreline Master Programs.
• Sub-‐‑Strategy C 8.1: Prevent and reduce the risk of oil spills. o C 8.1 NTA 2: Evaluate Risk Assessments for Update Needs.
Protect Through Incentives
• Sub-‐‑Strategy B 2.1: Permanently protect priority nearshore physical and ecological processes and habitat, including shorelines, migratory corridors, and vegetation particularly in sensitive areas such as eelgrass beds and bluff backed beaches.

Funding Strategy for the Strategic Initiatives from the 2012-2013 Puget Sound Action Agenda
Volume 2: Technical Report 12
o B 2.1 NTA 1: Protect 10% of Bluff-‐‑Backed Beaches.
• Sub-‐‑Strategy B 2.3: Remove armoring, and use soft armoring replacement or landward setbacks when armoring fails, needs repair, is non protective, and during redevelopment.
o B 2.3 NTA 1: Homeowner Incentives for Landward Setbacks.
• Sub-‐‑Strategy A 4.2: Provide infrastructure and incentives to accommodate new and re-‐‑ development within urban growth areas.
o A 4.2: All of sub-‐‑strategy A4.2 is a priority for the habitat protection and restoration strategic initiative.
Remove Barriers to Restoration
• Sub-‐‑Strategy A 6.1: Implement high priority projects identified in each salmon recovery watershed’s three-‐‑ year work plan.
o A 6.1: All of sub-‐‑strategy A6.1 is a priority for the habitat protection and restoration strategic initiative.
• Sub-‐‑Strategy B 2.2: Implement prioritized nearshore and estuary restoration projects and accelerate projects on public lands.
o B 2.2 NTA 1: Implementation of Projects Identified by PSNERP.
• Sub-‐‑Strategy B 5.3: Prevent and rapidly respond to the introduction and spread of terrestrial and aquatic invasive species.
o B 5.3 NTA 2: Invasive Species Early Detection and Monitoring.
Table 2. Habitat Strategic Initiative Near-Term Action Summary
Source: PSP 2012-2013 Action Agenda. See Action Agenda for more detail on actions.
Near Term Action(s) Description
Implement Salmon Recovery 3-year Workplans
This was identified by the ECB Subcommittee as the most important action in the Habitat Strategic Initiative. Full implementation of the Puget Sound Chinook Salmon Recovery Plan, including support of the highest priority protection and restoration projects as identified by salmon recovery lead entities, addressing barriers to faster permitting of salmon recovery restoration projects and, developing cooperative agreements with project partners.
Implementation of Projects identified by PSNERP Implementation of projects identified by Puget Sound Nearshore Ecosystem Restoration Project (PSNERP).
Protect 10% of Bluff-Backed Beaches Promote acquisitions, easements, or other protective covenants to permanently protect at least 10% of bluff-backed beaches other priority nearshore habitats facing potential shoreline development pressure.
Protect and Restore Stream FlowsEstablish and enforce in-stream flow rules in the Puget Sound Basin. This will involve setting flows in the remaining priority Puget Sound watersheds, developing and implementing the comprehensive basin flow protection and enhancement programs called for in the Salmon Recovery plans, and establishing a local compliance presences.
Invasive Species Early Detection and Monitoring Develop and implement an early detection and monitoring program plan for priority invasive species in Puget Sound.
Evaluate [Oil Spill] Risk Assessments for Update Needs Evaluate existing Puget Sound marine transportation oil spill risk assessments, identify any gaps in marine safety and work with experts to develop and apply appropriate risk reduction measures.
Homeowner Incentives for Landward SetbacksConvene a process to develop and recommend incentives that help homeowners permanently remove armoring and encourage setback of houses. Incentives could include, but would not be limited to financial, regulatory, low interest loans or grants.
Provide for growth Provide infrastructure and incentives to accommodate new and redevelopment within urban growth areas.
Land Use Planning Barriers, BMPs and Example Policies
Identify the primary barriers to incorporating policies consistent with implementation of the Action Agenda into local land use planning and decisions, and identify best practices and assistance needed to overcome these barriers. This will address implementation of protection strategies, encouraging compact growth patterns, increased density, water quality standards, redevelopment, and rural lands protection.
Floodplain protection and policy team actions Advance floodplain protection and restoration by facilitating actions, policy changes, and program changes.Levee vegetation Craft a regional variance to the U.S. Army Corps of Engineer’s vegetation on levees policy. Update Local Shoreline Master Programs Provide funding and technical assistance to local jurisdictions to update local shoreline master programs.
Hydraulic Code Rules Revision Revise Hydraulic Code Rules and clarify conditions under which hydraulic projects must be conducted to prevent or mitigate the impacts to fish life and habitat.
ECB address regulatory exemptions Address regulatory exemptions to provide effective oversight and mitigation sequencing for activities that impact the ecosystem.

Funding Strategy for the Strategic Initiatives from the 2012-2013 Puget Sound Action Agenda
Volume 2: Technical Report 13
Table 2 provides summary information for the NTAs defined for the 2012-‐‑2013 Action Agenda. It is important to emphasize that these are not the only actions that will be needed to protect and restore habitat and, as such, they represent only the initial, priority efforts required to achieving the corresponding 2020 Recovery Goals. There are potentially many additional elements of program implementation that have not been identified or described, and the additional costs and sources presented later in this report reflect this broader scope of assessment.
Salmon Recovery
Puget Sound Chinook salmon are roughly one-‐‑third as abundant as they were in the early 1900s, and in 1999 they were listed as “threatened” under the federal Endangered Species Act.
The 2020 Target for Wild Chinook Salmon is: Stop the overall decline and start seeing improvements in wild Chinook abundance in two to four populations in each biogeographic region. While Chinook populations in Puget Sound naturally exhibit large annual and long term fluctuations, wild spawner abundance numbers have shown little progress toward this target, and have actually declined since the early 2000s. Chinook are found in all counties of Puget Sound (Figure 1).
Figure 1. Chinook Bearing Streams and Levees in Puget Sound Basin
The Puget Sound Salmon Recovery Plan is the primary, all encompassing plan to achieve the 2020 Chinook target. The plan includes fourteen watershed-‐‑specific
Thurston
Pierce
Island
San Juan
Whatcom
Skagit
King
Clallam
Kitsap
Mason
Jefferson
Snohomish
Chinook Bearing
Streams
Levees
Source: NOAA and
WA Dept. of Ecology

Funding Strategy for the Strategic Initiatives from the 2012-2013 Puget Sound Action Agenda
Volume 2: Technical Report 14
plans which, together, identify hundreds of different actions to protect and restore salmon populations, including habitat restoration and acquisition projects, as well as protecting habitat through a combination of regulations, incentives and education. Sub-‐‑Strategy A 6.1 of the Action Agenda is the implementation of the high priority projects identified in each of these plans, and was identified by the ECB as one of most important actions in the Habitat Strategic Initiative.
Floodplains
Advances in understanding of the key drivers and limiting factors to Puget Sound recovery increasingly highlight the importance of functional, well-‐‑connected floodplains. Floodplains facilitate floodwater storage, groundwater recharge, water filtration, sediment and nutrient retention, and also supply important habitat for fish and wildlife. These functions and services have been lost in large areas of Puget Sound through a combination of levees, shoreline armoring and residential, commercial, industrial, and agricultural development.
The concentration of urban development within floodplains has also led to heightened exposure to risks and damage from floods and landslides. Floodplain management therefore involves tradeoffs between these areas’ ecological value, their high value to humans in terms of development, and also in term of potential loss from natural disasters. Protection and enhancement of riparian and floodplain habitat are key parts of virtually every recovery plan for salmon (Figure 2). Consequently, it was identified as one of the highest priorities in the Habitat Strategic Initiative. Initially, a 2020 target was defined for floodplains: by 2020, 15% of degraded floodplain areas are restored, or floodplain projects to achieve that outcome are underway across Puget Sound, and there is no additional loss of floodplain function in any Puget Sound watershed relative to a 2011 baseline. This target is based on modeling that suggests restoring 15 percent of floodplain function would have a real benefit for landscape-‐‑scale ecological processes important to Puget Sound recovery.
Floodplain Sub-Strategies and NTAs from the Action Agenda Sub-Strategy A 5.1 Improve data and information to accelerate floodplain protection, restoration and flood hazard management
NTA 5.1.1: Floodplain Protection and Policy Team Actions
Sub-Strategy A 5.3 Protect and maintain intact and functional floodplains. NTA 5.3.1: FEMA Annual Reporting for NFIP BiOp NTA 5.3.2: CAO Updates on Frequently Flooded Areas NTA 5.3.3: BiOp Compliance and Floodplain Target NTA 5.3.4: Levee Vegetation Sub-Strategy A 5.4 Implement and maintain priority floodplain restoration projects NTA 5.4.1: Prioritization of State Highways with Floodplain Impacts NTA 5.4.2: Ag Land Ecosystem Services Markets
NTA 5.4.3: Candidate Areas for Land Swaps

Funding Strategy for the Strategic Initiatives from the 2012-2013 Puget Sound Action Agenda
Volume 2: Technical Report 15
Much of floodplain area in Puget Sound is currently in agricultural production. These farming uses play a number of socially and economically important roles in regional communities, contribute an array of conservation investment opportunities, and can contribute habitat functions particularly in comparison to more developed land uses.
Figure 2. 100-year Floodplains in Puget Sound Basin
Culverts
Culverts are structures, typically made from a pipe or concrete, that allow water to flow under a road, railroad, or trail. Many culverts in Puget Sound were installed or have become impassable for fish and other aquatic organisms to scale, thus preventing them from reaching upstream habitat. Additionally, culverts can lead to excess water velocities that make navigation difficult or impossible, and can increase erosion and sediment loads. In these ways and others, even small, individual culverts can result in direct loss of instream and riparian habitat.
Culverts not only prevent fish passage and ecological connectivity, but also prevent downstream flows of gravel needed for spawning redds and woody debris important for habitat and channel processes, and can create an entry point for road-‐‑runoff pollutants. These negative impacts and risks can be minimized by removal of the culvert, replacement with full-‐‑span bridges, or simulation of a natural channel through the structure.
Thurston
Pierce
Island
San Juan
Whatcom
Skagit
King
Clallam
Kitsap
Mason
Jefferson
Snohomish
100-yr Floodplain ExtentSource: FEMA

Funding Strategy for the Strategic Initiatives from the 2012-2013 Puget Sound Action Agenda
Volume 2: Technical Report 16
• Culverts in Puget Sound are owned and managed by a variety of entities. Responsibility for fish blocking culverts on fish bearing streams is shown in Figure 3 and
• Table 3. At the state level, most culverts are owned by the Washington State Department of Transportation (WSDOT) and associated with state highways.3 A federal court injunction issued in March 2013 requires the state to remove approximately 800 state-‐‑owned culverts that block habitat for salmon and steelhead by 2030.4
Figure 3. Culverts Blocking Fish Passage in Puget Sound Basin
To address these ‘problem culverts’, WSDOT has established a Fish Passage Barrier Removal Program to identify and remove barriers to fish passage caused by culverts under state highways since 1991. This is a cooperative effort with the Washington Department of Fish and Wildlife (WDFW). WSDOT’s approach to culvert mitigation includes the following actions:
• “Fish barriers are corrected through highway projects, whenever a hydraulic permit is required
3 WDFW, personal comm., 06/14 4 WSDOT. 2014. Fish Passage Facts. http://www.wsdot.wa.gov/Environment/Biology/FP/fishpassagefacts.htm
Thurston Pierce
Island
San Juan
Whatcom
Skagit
King
Clallam
KitsapMason
Jefferson
Snohomish
Federal
State
Tribal
County
City
Port
Special District
Culvert Location
and Ownership
Source: WA Dept. of
Fish and Wildlife
Private
Other
Unknown

Funding Strategy for the Strategic Initiatives from the 2012-2013 Puget Sound Action Agenda
Volume 2: Technical Report 17
• Stand-‐‑alone projects fix high priority barriers on highways that will not be addressed by a highway construction project anytime soon
• Some barriers are corrected through our Maintenance program, which replaces a failing culvert with a fish passable structure”
Table 3. Identified Fish Blocking Culverts in Puget Sound Basin
Source: WDFW Fish Passage Barrier Inventory
Table 3 shows the identified set of fish-‐‑blocking culverts in the Puget Sound Basin. Reason and deduction among experts suggests this is not the complete set of such culverts, but represents the vast majority. There is speculation that the Department of Natural Resources (DNR) and private land likely hold more culverts, but discussions with culvert experts at the Recreation and Conservation Office (RCO) and WDFW suggest the number is likely to be very small. A conservative estimate might be a doubling of the unknown culverts, which would increase the total identified, 7,753, by less than 2 percent.
2.2 Stormwater The quality of surface water in Puget Sound is in decline, and monitoring data and analysis demonstrate that stormwater runoff is the primary driver for this decline in water quality.5 Similarly, biological research is increasingly revealing the negative effects of water quality on aquatic fish and wildlife populations.6 These are among the reasons that stormwater pollution has been a primary focus of the Puget Sound Partnership and the Action Agenda since their inception.
Stormwater runoff from urban areas, in particular, is a primary agent of chemical, physical and biological degradation in Puget Sound. Impervious surfaces – such as pavement and compacted ground -‐‑ prevent infiltration, which
5 Action Agenda, State of the Sound, Science Update 6 Action Agenda, State of the Sound, Science Update
Private 3,207----------------------- 41%County 2,036----------------------- 26%State 1,221----------------------- 16%City 908-------------------------- 12%Federal 181-------------------------- 2%Unknown 147-------------------------- 2%Tribal 27---------------------------- 0.3%Other 12---------------------------- 0.2%Port 10---------------------------- 0.1%Special-District 4------------------------------ 0.1%
Owner Number of culverts Share of culverts

Funding Strategy for the Strategic Initiatives from the 2012-2013 Puget Sound Action Agenda
Volume 2: Technical Report 18
means that most precipitation in urban areas is transported as surface runoff. This runoff accumulates various pollutants as it flows through the urban environment, including heavy metals, petroleum products, pesticides, fertilizers and bacteria.7 Additionally, the high, flashy flow regimes associated with excess stormwater runoff lead to flooding and property damage, as well as damage to fish habitat by eroding stream banks and widening stream channels, depositing excess sediment, and otherwise altering natural streams and wetlands. Impervious coverage concentration, similar to population and pollution-‐‑generating activities, is highest in urban areas of the Puget Sound Basin (Figure 4 and Figure 5)
Figure 4. Impervious Cover in Puget Sound Basin
7 Unlike wastewater, stormwater runoff is not sent to treatment plants before being discharged to Puget Sound. Prior to 1990, stormwater management focused solely on conveyance (i.e. draining stormwater runoff efficiently to prevent flooding). Most of the development in Puget Sound -‐‑ approximately 70% of the development within King County, for example – occurred before 1990, so stormwater runoff from these areas is discharged into local water bodies without treatment.

Funding Strategy for the Strategic Initiatives from the 2012-2013 Puget Sound Action Agenda
Volume 2: Technical Report 19
Figure 5. Population Density in Puget Sound Basin
2.2.1 Action Agenda Strategies for Addressing Stormwater Pollution
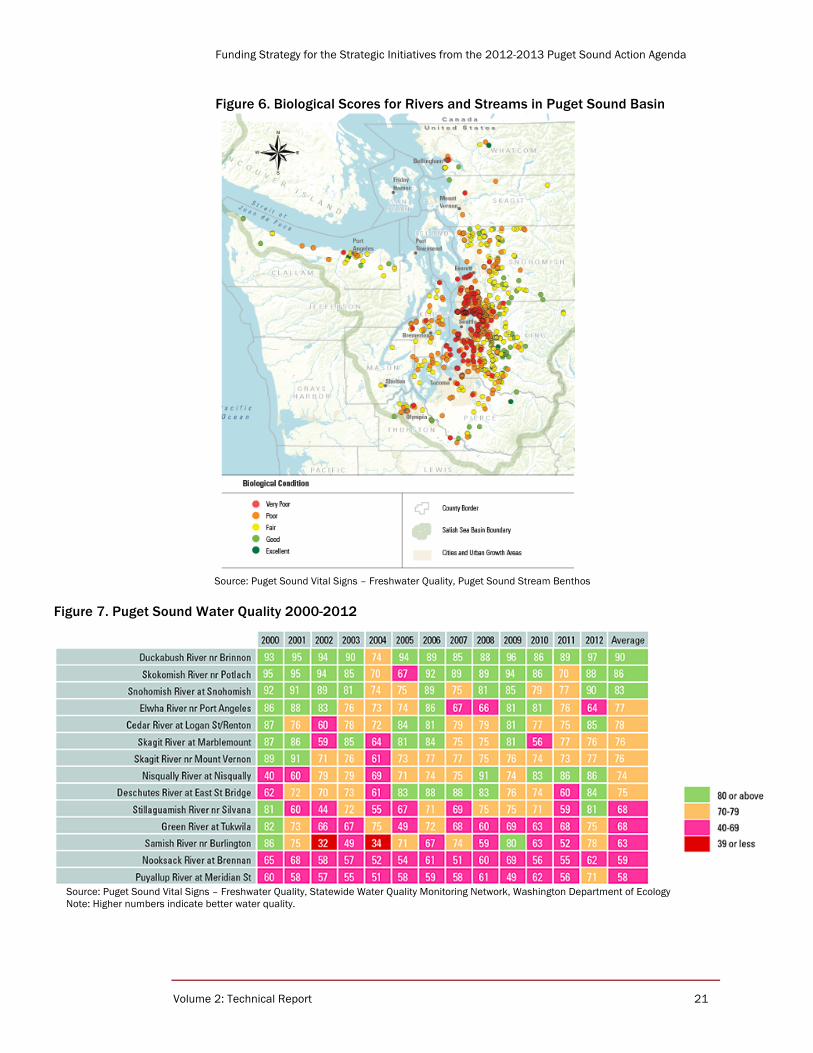
The Stormwater Strategic Initiative primarily contributes to progress toward the 2020 Ecosystem Recovery Targets for freshwater water quality toxics in fish, marine water quality, marine sediment quality, chinook salmon, summer stream flows, land development and cover, shellfish beds, swimming beaches, shoreline armoring, and orcas (Table 4). It is important to note that none of these targets are exclusively influenced by stormwater pollution control. Stormwater is one of multiple factors for the conditions of Puget Sound it affects. This makes progress on stormwater difficult to measure, and the total amount of stormwater pollution control necessary for recovery difficult to specify. But it also demonstrates the important synergies for stormwater pollution control projects. Still, biological conditions in surface freshwater is generally worst near urban areas (Figure 6 and Figure 7).

Funding Strategy for the Strategic Initiatives from the 2012-2013 Puget Sound Action Agenda
Volume 2: Technical Report 20
Table 4. Action Agenda Strategies and 2020 Ecosystem Targets Associated with the Stormwater Strategic Initiative NTAs
Source: PSP 2012-2013 Action Agenda
With these challenges for identifying the complete strategy to address stormwater problems, the Action Agenda’s strategy for managing urban stormwater runoff in Puget Sound is focused on fixing existing problems and preventing new ones, controlling pollution sources, and outreach and education. The Stormwater Strategic Initiative, as envisioned in the 2012-‐‑2013 Action Agenda, is summarized in the list below and further described in Table 5.
Number of NTAs Percent of NTAsStrategies
Strategy C. Reduce and Control the Sources of Pollution to Puget Sound 8 89%Strategy D. Implementation, Collaboration, Behavior Change and Stewardship and Monitoring 1 11%
Total 9 -Ecosystem Recovery Targets
Freshwater Quality 9 100%Toxics in Fish 9 100%Marine Water Quality 8 89%Marine Sediment Quality 8 89%Chinook Salmon 4 44%Summer Stream Flows 3 33%Land Development and Cover 2 22%Shellfish Beds 2 22%Swimming Beaches 1 11%Shoreline Armoring 1 11%Orcas 1 11%
Total 9 -
Funding Strategy for the Strategic Initiatives from the 2012-2013 Puget Sound Action Agenda
Volume 2: Technical Report 21
Figure 6. Biological Scores for Rivers and Streams in Puget Sound Basin
Source: Puget Sound Vital Signs – Freshwater Quality, Puget Sound Stream Benthos
Figure 7. Puget Sound Water Quality 2000-2012
Source: Puget Sound Vital Signs – Freshwater Quality, Statewide Water Quality Monitoring Network, Washington Department of Ecology Note: Higher numbers indicate better water quality.

Funding Strategy for the Strategic Initiatives from the 2012-2013 Puget Sound Action Agenda
Volume 2: Technical Report 22
Watershed Approach:
• Sub-‐‑Strategy C 2.1: Manage urban runoff at the basin and watershed scale o C 2.1 NTA 1: Watershed Based Stormwater Management.
Prevent New Problems
• Sub-‐‑Strategy C 2.2: Prevent problems from new development at the site and subdivision scale
o C 2.2 NTA 1: NPDES Municipal Permits. o C 2.2 NTA 3: Stormwater Management Outside Permitted Areas.
Fix Existing Problems
• Sub-‐‑Strategy C 2.3: Fix problems caused by existing development (structural upgrades; regular and enhanced maintenance)
o C 2.3 NTA 1: Stormwater Retrofit Projects.
Control Sources of Pollution
• Sub-‐‑Strategy C 1.1: Implement and strengthen authorities and programs to prevent toxic chemicals from entering the Puget Sound environment
o C 1.1 NTA 3: Fish Consumption Rates. • Sub-‐‑Strategy C 2.4: Control sources of pollutants
o C 2.4 NTA 1: Compliance Assurance Program.
Education
• Sub-‐‑Strategy C 2.5: Provide focused stormwater-‐‑related education and training
o C 2.5 NTA 1: LID Training and Certification. o C 2.5 NTA 2: Education for the Next Generation of Stormwater
Professionals. • Sub-‐‑Strategy D 6.1: Implement a long-‐‑term, highly visible, coordinated
public-‐‑ awareness effort using the Puget Sound Starts Here brand. o D 6.1 NTA 1: Phase 2 of Puget Sound Starts Here

Funding Strategy for the Strategic Initiatives from the 2012-2013 Puget Sound Action Agenda
Volume 2: Technical Report 23
Table 5. Stormwater Strategic Initiative NTA Summary
Source: PSP 2012-2013 Action Agenda. See Action Agenda for more detail on actions.
It is important to emphasize that these are not the only actions that will be needed to manage urban stormwater runoff and, as such, they represent only the initial, priority efforts required to achieving the corresponding 2020 Recovery Goals. There are potentially many additional elements of program implementation which have yet to be fully described.
Appropriate stormwater control strategies are context-‐‑specific, and Puget Sound sees the full range of treatment strategies, from combined systems with sewers for wastewater treatment, separated systems with varying levels of treatment, and emerging strategies employing natural systems and infiltration via green stormwater infrastructure.
Stormwater is primarily managed under the National Pollutant Discharge Elimination System (NPDES) permitting program and development codes. Some areas of existing development are gradually becoming covered under NPDES permit terms, or via stormwater code-‐‑compliance with new development and re-‐‑development. Consequently the overall costs of NPDES and code compliance are increasing. However, there are major sources of stormwater pollution due to existing development that pre-‐‑dated stormwater codes and are unlikely to be addressed in the foreseeable future. These areas of existing development are targets for retrofitting stormwater control and treatment. Given the high and increasing costs of NPDES compliance, it is unreliable to plan on a business-‐‑as-‐‑usual approach to address these areas.
Near Term Action(s) Description
NPDES Municipal Permits.
Ecology will issue municipal permits for western Washington and provide financial assistance to permittees for implementation, particularly for code changes, stormwater system mapping, operations and maintenance, inspections and enforcement. This will require additional resources to Ecology for permit oversight, technical assistance, and enforcement. Ecology will provide incentives to NPDES permittees who, by interlocal agreement, lead or carry out regional or watershed scale NPDES implementation.
Stormwater Retrofit Projects. Lead a process to identify high priority retrofit projects and complete conceptual design to a stage sufficient to seek project implementation funding.
Watershed Based Stormwater Management. Commission an evaluation of the feasibility, cost, and effectiveness of transitioning the existing municipal stormwater permit approach to watershed- based municipal stormwater management.
Stormwater Management Outside Permitted Areas. Identify two high priority shellfish growing areas degraded by urban stormwater discharges and work with local governments and other key parties to reduce these impacts to the areas.
Fish Consumption Rates and Sediment Management Standards. Establish accurate default fish consumption rates and complete the rulemaking processes for Sediment Management Standards.
Compliance Assurance Program. Increase inspection, technical assistance, and enforcement programs for high-priority businesses and at construction sites.
Phase 2 of Puget Sound Starts Here. Implement Phase 2 of the Puget Sound Starts Here campaign.
LID Training and Certification.
Provide focused training for local government staff on LID project review, and inspections and approvals, as well as to local government staff and private sector on maintenance. Develop new professional certification for stormwater maintenance specialists and provide business staff and contractors with training on source control, spill recognition, spill response, and erosion control.
Education for the next Generation of Stormwater Professionals. Develop a near-term plan to provide a sustainable water resource management academic curriculum in all Puget Sound counties for future stormwater professionals.
NPDES overlap with Stormwater Strategic Initiative Primary sub-strategies:
• Watershed-based stormwater management • Prevent problems from new development • Fix existing problems • Control sources of pollution • Education and training

Funding Strategy for the Strategic Initiatives from the 2012-2013 Puget Sound Action Agenda
Volume 2: Technical Report 24
NPDES Permit Compliance
Stormwater runoff is regulated by local, state, and federal statutes. The most important among these is the federal Clean Water Act (CWA, 1972). One of the primary mechanisms for achieving the goals of the CWA is the National Pollutant Discharge Elimination System (NPDES) permitting program. The NPDES stormwater permitting program regulates three types of activities: (1) Industrial activities; (2) Municipal Separate Storm Sewer Systems (‘MS4s’); and (3) Construction activities. In Washington State, the Department of Ecology (Ecology) has been delegated authority from the U.S Environmental Protection Agency (EPA) to administer the NPDES permit program. Municipal stormwater permits are the most important tool to reduce the volume of stormwater-‐‑borne pollutants entering Puget Sound.
Figure 8. NPDES Permit Coverage in Puget Sound Basin
NPDES permitting requirements were phased on over time. Phase I (implemented in 1990) included medium and large municipalities (both incorporated cities and unincorporated counties); municipalities with populations of 250,000 or more are defined as "ʺlarge"ʺ while those with populations between 100,000 and 250,000 are defined as "ʺmedium"ʺ municipalities. Phase I municipal permittees in the Puget Sound basin are King, Pierce, and Snohomish Counties, as well as the Cities of Tacoma and Seattle. Other public entities that own and operate stormwater systems located within these municipalities, such as the Washington State Department of Transportation
Thurston
Pierce
Island
San Juan
Whatcom
Skagit
King
Clallam
Kitsap
Mason
Jefferson
Snohomish
NPDES Permit Coverage
Phase 1 Permit
Phase 2 Permit
Source: WA State Dept. of Ecology

Funding Strategy for the Strategic Initiatives from the 2012-2013 Puget Sound Action Agenda
Volume 2: Technical Report 25
and the Ports of Seattle and Tacoma, are also required to be covered under the permit.8
Phase II stormwater regulations, implemented by Ecology in 2007, extended coverage of the NPDES program to certain “small” municipal separate stormwater sewer systems (MS4s).9 These include urbanized areas and their adjacent urban fringe areas that together have a population of at least 50,000 and a population density of at least 1,000 people per square mile. Small MS4s covered by a Phase II Permit can also include areas outside an urbanized area if the MS4 discharges cause, or have the potential to cause, adverse effects on water quality. These areas must also have a population of at least 10,000, and a population density of at least 1,000 people per square mile. There are 76 Phase II cities and counties in the Puget Sound basin.10
NPDES permits require municipalities to provide and fund programs and actions to ensure that all practical efforts are being made to protect water quality. The required programs are:
• Public Education & Outreach. • Public Involvement and Participation • Illicit Discharge Detection & Elimination. • Pollution Prevention, Good Housekeeping. • Municipal Operations and Maintenance. • Control Runoff from
New Development, Redevelopment and Construction Sites.
• Monitoring and Assessment. • Structural Stormwater Controls (Phase I only).
8 Phase I Municipal Stormwater Permit, 2013. 9 Phase I regulations are more comprehensive than Phase II regulations. The most recent permit has brought the Phase II permits closer to the Phase I requirements. For example, the requirements that apply to development and redevelopment are now identical in both permits, and both now require Low Impact Development (LID) wherever feasible. Phase II requirements are still lower in categories like source control, structural retrofits, inspection requirements, watershed scale planning, and education/outreach.
10 Western Washington Phase II Municipal Stormwater Permit, 2013
Community # Outfalls
Bellingham 2
Bremerton 15
Everett 13 King County- West Point
Treatment Service Area 34
LOTT (Olympia) 1
Mount Vernon 2
Port Angeles 4 Seattle Public Utilities –
City of Seattle 92
Snohomish 2 Source: WA Ecology. Combined Sewer Overflows. http://www.ecy.wa.gov/programs/wq/permits/cso.html
CSO Outfalls in Puget Sound

Funding Strategy for the Strategic Initiatives from the 2012-2013 Puget Sound Action Agenda
Volume 2: Technical Report 26
• Source Control Program for Existing Development (Phase I only). The comprehensive scope of these activities overlaps considerably with the most important aspects of the Stormwater Strategic Initiative (see list). The municipal stormwater control costs can be associated with costs to address combined sewer overflows for communities in Puget Sound with combined systems and CSO outfalls.
Under the Clean Water Act {section 303(d)}, surface waters are identified (typically by states) as impaired if they do not meet water quality standards. These impaired waters systematically by priority receive designation of Total Maximum Daily Load (TMDL) for acceptable levels of pollutants to achieve the water quality standards. As TMDLs are defined, the restrictions can be incorporated into NPDES permits, contributing to increasing stormwater quality improvements and control costs over time. Ecology currently identifies 501 rivers and streams, 129 lakes, as well as various areas of Puget Sound in need of TMDLs.11 Updated fish consumption rates will likely contribute to more strict water quality standards, which carries into more strict TMDLs.
Connection to other Strategic Initiatives
Declines in water quality caused by stormwater runoff have far reaching consequences for the health of the Puget Sound ecosystem. Stormwater pollution contributes to degradation that affects salmon population health and similar ecological conditions.12 Shellfish harvest restrictions are typically associated with stormwater runoff events. Stormwater effects Puget Sound conditions and recovery efforts both downstream and upstream when considering spawning effects.
Stormwater Retrofits
While the Clean Water Act requires municipalities to take steps to manage and mitigate runoff from urban areas, current regulations do not necessarily or sufficiently address runoff
11 Puget Sound Partnership. 2014/2015 Action Agenda. 12 Booth, D.B., Karr, J.R., Schauman, S., Konrad, C.P., Morley, S.A., Larson, M.G., Burges, S.J., 2004. Reviving urban streams: land use, hydrology, biology, and human behavior. Journal of the American Water Resources Association 40 (5), 1351–1364.
Retrofits and the Stormwater Strategic Initiative Primary sub-strategies:
• Watershed-based stormwater management • Prevent problems from new development • Fix existing problems • Control sources of pollution • Education and training

Funding Strategy for the Strategic Initiatives from the 2012-2013 Puget Sound Action Agenda
Volume 2: Technical Report 27
from previously developed areas. Accordingly, this task has been identified as being one of the key problems under the Stormwater Strategic Initiative.
Due to the nature of the regulations that were in place during the mid to late 20th century (prior to Ecology’s 1992 Stormwater Management Manual for Western Washington), when the majority of development occurred in the Puget Sound Basin, much of the existing stormwater infrastructure is inadequate and undersized relative to current standards.13
Options for managing runoff from existing areas usually involve a suite of techniques that expand beyond the more traditional, structural “gray-‐‑infrastructure” solutions of augmenting existing cement and pipe systems that capture, concentrate, and convey rainwater away from where it falls. The best management practices (BMPs) for retrofits are inserted in an urban landscape where little or no prior stormwater controls exist. These techniques include green infrastructure and low impact development practices that manage stormwater onsite through installation of ponds, bio-‐‑swales, green roofs, parks, roadside plantings, and other mechanisms that mimic natural hydrologic processes, such as absorption and infiltration into soil. It can also include street sweeping. The flexibility and multiple-‐‑benefit characteristics of green infrastructure approaches make them particularly attractive in Puget Sound, and are a core component of stormwater management for the major stormwater managers in Puget Sound.
In some cases existing stormwater infrastructure does exist, but it is inadequate or improperly maintained. In such cases removal of legacy pollutant loads that have built up within the system, or even improved operation and maintenance techniques, can be the most appropriate efforts to address stormwater problems.
NPDES Permits and Retrofit Overlap
NPDES permits do address retrofit requirements, but there is little action explicitly required. Phase I permittees are required to have a retrofit plan, but the plan details vary across permits, and permittees can propose specific compliance terms. Phase II permittees do not generally have retrofit requirements as part of the permit.
New development and redevelopment must abide by stormwater codes in Ecology’s Stormwater Management Manual for Western Washington (2012 latest
13 Washington State Department of Ecology 2005, Stormwater Management Manual for Western Washington Ecology.

Funding Strategy for the Strategic Initiatives from the 2012-2013 Puget Sound Action Agenda
Volume 2: Technical Report 28
edition).14 By these means, areas without stormwater management come under coverage. Rates of redevelopment in the basin are typically on average 1 to 2 percent per year, although some areas are higher and redevelop relatively frequently, while others are unlikely to redevelop in the foreseeable future. Small public and private projects might not pass thresholds of total area of new impervious surface necessary to trigger code requirements.15
So public and private restoration, reconstruction, and redevelopment might address a share of existing retrofit needs, but it is unlikely to address all. Redevelopment targets are not chosen for water quality needs, so it is uncertain that the most important targets for retrofit will tend to be addressed.
Also, there are categories of actions that can have real benefits for stormwater pollution control, but might not be completely addressed to an efficient level by permit requirements. For example, street sweeping and removal of sediment build up (legacy loads) from conveyance systems can have real benefits per dollar spent in comparison to new treatment facility construction, but levels of permit requirements vary.
Under optimal conditions, stormwater control dollars would always be spent on the next most (marginally) efficient target, meaning where each dollar removes the most pollutant among all still available. NPDES permits and stormwater codes generally target these objectives, but within regulatory and practical constraints. Efforts to increase flexibility for regulatory compliance are typically motivated by this objective.
2.3 Shellfish The focus of the Shellfish Recovery Strategic Initiative is to restore the ability to harvest shellfish from beds that are currently closed due to pollution. The 2012-‐‑2013 Action Agenda identifies a 2020 goal to increase harvestable shellfish beds by 10,800 acres, with 7,000 acres from areas currently closed to harvest. Pollution of shellfish beds is a fairly widespread problem, affecting around 20% of all shellfish beds in the Puget Sound basin. The anthropogenic contribution of pollution of shellfish beds is primarily related to land use in upstream watersheds, and particularly the design and operation of septic systems and livestock management practices.
14 WA Ecology. 2012. Stormwater Management Manual for Western Washington. http://www.ecy.wa.gov/programs/wq/stormwater/manual.html
15 Bissonette and Parametrix. 2010. Urban Stormwater Runoff Preliminary Needs Assessment Technical Memorandum.

Funding Strategy for the Strategic Initiatives from the 2012-2013 Puget Sound Action Agenda
Volume 2: Technical Report 29
Figure 9. Classified Shellfish Harvest Areas
Source: PSP and Washington Department of Health, Office of Shellfish and Water Protection
Puget Sound has long been one of the nation'ʹs leading areas for the production of commercial oysters, clams, and mussels, and the commercial shellfish industry has been a mainstay of local economies around the Sound since the late 1800s. Several Puget Sound counties rank in the top ten nationally for the value of commercial shellfish harvest.
Shellfish beds are also actively used by Puget Sound tribes to support commercial and subsistence fisheries. Shellfish have historically been an important food source for Puget Sound tribes and the tribes are guaranteed

Funding Strategy for the Strategic Initiatives from the 2012-2013 Puget Sound Action Agenda
Volume 2: Technical Report 30
access to commercial and private shellfish beds by treaty. Shellfish beds in the Puget Sound also support recreational fisheries.
Shellfish are filter feeders, drawing water through their digestive systems to collect nutrients and organisms. This trait makes them particularly vulnerable to pollution, as any contaminants in their water source will concentrate in their digestive systems. When contaminated shellfish are eaten by humans, pollutants can be passed on to the consumer. Because of this hazard, state and local departments of health regulate shellfish harvest to prevent contaminated shellfish from entering the food stream. Commercial shellfish beds are frequently monitored to ensure that they are safe to harvest for human consumption. In recent years, closures of shellfish harvests due to contamination have been fairly common around Puget Sound (Figure 9).
Across Puget Sound, there are an estimated 190,000 acres of classified commercial and recreational shellfish beds. According to the DOH, about 36,000 acres – approximately 19 percent – are closed due to pollution sources. Table 6, adapted from the 2013 Pathogen Grant Work Plan identifies restoration potential of 26 growing areas around Puget Sound and indicates that there are three principal reasons that shellfish beds are restricted from harvest: 16
• Nonpoint pollution, including stormwater and pathogenic pollutants from on-‐‑site sewer systems (OSS), livestock wastes, or a combination of the two;
• Wastewater treatment plants that are discharging partially treated sewage that contains pathogens; and
• Marinas that discharge pathogens from shore-‐‑side restrooms and illicit sewage discharges from boats.
It is not uncommon for more than one of these factors to be present in a shellfish area.
16 Conversations with DOH staff indicate that this table is the basis for the 10,800-‐‑acre objective, although the restoration potential in the DOH table sums to 8,139 acres.

Funding Strategy for the Strategic Initiatives from the 2012-2013 Puget Sound Action Agenda
Volume 2: Technical Report 31
Table 6. 2020 Restoration Potential and Current Status for Puget Sound Shellfish Growing Areas
Source: Washington State Department of Health
The DOH periodically reviews classifications and can upgrade or downgrade areas based on changed circumstances. In 2011, the DOH upgraded the classification of 697 acres in five commercial shellfish areas. Over the same time period, 4,960 acres were downgraded in two areas. Poor water quality in the Samish Bay and Pacific Coast growing areas resulted in significant classification downgrades.
Over the past 30 years, DOH has downgraded the classification of about 56,000 acres and upgraded the classification of about 46,000 acres. Most of the downgrades took place between 1981 and 1995, when 45,000 acres were downgraded and 7,000 acres were upgraded. Since 1995, Health has downgraded 11,000 acres while upgrading 40,000 acres.
Table 6 is a selected list of sites in Puget Sound with restoration potential rather than a comprehensive list of growing areas with pollution-‐‑related restrictions, which would be far more extensive. This analysis was used to identify restoration targets in the 2012-‐‑13 Action Agenda.
County Growing AreaConditionally
Approved Restricted Prohibited Nonpoint WWTP Marina
Clallam Dungeness Bay 100 XClallam East Straits 21 XIsland Port Susan 150 X XIsland SW Whidbey Island 300 X XIsland Holmes Harbor 100 XKing East Passage 217 XKing Quartermaster Hbr 417 X X
Kitsap Kingston 180 XKitsap Port Gamble 87 XKitsap Port Madison 57 X XKitsap Port Madison 272 X XKitsap Port Orchard Passage 125 X X XKitsap Liberty Bay/Lemolo 400 X XMason North Bay 50 XMason Oakland Bay 190 XPierce Henderson Bay 24 XPierce Ketron Island 150 XPierce Ketron Island 208 XSkagit Samish Bay 2,150 XSkagit Samish Bay 1,887 XSkagit Padilla Bay 151 X
Snohomish Possession Sound 300 XThurston Nisqually Reach 75 X XWhatcom Birch Bay 128 X X XWhatcom Drayton Harbor 150 X X XWhatcom Drayton Harbor 250 X X X
4,628 24 3,487 18 of 26 14 of 26 9 of 26
2020 Restoration Potential (acres) Reasons for Restriction
Totals

Funding Strategy for the Strategic Initiatives from the 2012-2013 Puget Sound Action Agenda
Volume 2: Technical Report 32
Figure 10. Area of Shellfish Beaches Closed for Harvesting in Puget Sound Since 1989
Source: U.S. EPA
DOH also lists shellfish beds that are threatened with downgrade each year. In 2011 seven areas in Puget Sound were threatened with a downgrade in classification: Burley Lagoon, Dyes Inlet, Filucy Bay, Padilla Bay, Pickering Passage, Port Townsend Bay, and South Skagit Bay.
2.3.1 Action Agenda Strategies for Achieving Restoration of Shellfish Beds
Even with significant downgrades in 2011, in recent years efforts of state and local government, tribes, private landowners, and shellfish growers have resulted in a net increase of about 1,400 acres of shellfish areas reopened for harvest due to pollution control. Strategies and actions in the 2012-‐‑2013 Action Agenda are focused on capitalizing on the lessons learned from these experiences and increasing this trend. 17
The solutions that have traditionally been adopted to reopen shellfish beds include:
17 Summarizing the overall trend in closures as ‘neutral’, the U.S. EPA stated: “Since our last report in 2005, over 3,800 acres of previously closed shellfish beds in Puget Sound have been upgraded or re-‐‑opened due to improvements in water quality. However, there'ʹs been an overall increase in the number of acres of shellfish beds that are prohibited or restricted from harvesting. This increasing trend may be due partly to increased water quality monitoring.” http://www2.epa.gov/salish-‐‑sea/shellfish-‐‑harvesting
25,000
27,000
29,000
31,000
33,000
35,000
37,000
39,000
1989 1991 1993 1995 1997 1999 2001 2003 2005 2007 2009 2011
Shel
lfish
Clo
sure
Are
a (a
cres
)

Funding Strategy for the Strategic Initiatives from the 2012-2013 Puget Sound Action Agenda
Volume 2: Technical Report 33
1. Intensive studies of potential pollution sources in affected watersheds (via Pollution Identification and Correction, or ‘PIC’, programs);
2. Promotion and funding of subsidized loan programs for septic system improvements;
3. Promotion and funding of livestock best management practices (BMPs), when livestock are a pollution source;
4. Education related to septic system and livestock management; and 5. Intensive monitoring to ensure that the measures are effective and shellfish
beds are restored to a harvestable condition.
The PIC studies, loan program for septic systems (also known as on-‐‑site sewage or OSS systems), and monitoring programs are traditionally provided by county health districts with partial funding provided by state and federal grants. The agricultural BMPs are generally offered through local conservation districts.
The 2012-‐‑2013 Action Agenda proposes a similar program for the near-‐‑term, with proposed actions to:
Prevent Pollution through Incentives
• Sub-‐‑Strategy C 5.3: Improve and expand funding for on-‐‑site sewage systems and local OSS programs.
o C 5.3 NTA 1: Regional OSS Homeowner Loan Program o C 5.3 NTA 2: Regional OSS Program Funding Source
Prevent Pollution through Existing Regulations and Programs
• Sub-‐‑Strategy B 3.1: Protect intact marine ecosystems particularly in sensitive areas and for sensitive species.
o B 3.1 NTA 2: Outfall Strategy on State-‐‑Owned Aquatic Lands
• Sub-‐‑Strategy C 1.5: Control wastewater and other sources of pollution such as oil and toxics from boats and vessels.
o C 1.5 NTA 1: No Discharge Zone Evaluation and Petition
• Sub-‐‑Strategy C 1.6: Implement and strengthen authorities and programs to prevent toxic chemicals from entering the Puget Sound environment.
o C 1.6 NTA 3: Water Quality Enforcement
• Sub-‐‑Strategy C 3.2: Ensure compliance with regulatory programs designed to reduce, control, or eliminate pollution from working farms.
o C 3.2 NTA 1: Priority Areas for Voluntary Incentive and Regulatory Programs
• Sub-‐‑Strategy C 7.1: Improve water quality to prevent downgrade and achieve upgrades of important current tribal, commercial and recreational shellfish harvesting areas.
o C 7.1 NTA 3: Pollution Control Action Team

Funding Strategy for the Strategic Initiatives from the 2012-2013 Puget Sound Action Agenda
Volume 2: Technical Report 34
• Sub-‐‑Strategy C 9.4: Develop and implement local and tribal pollution identification and correction programs.
o C 9.4 NTA 1: Pollution Identification and Correction Programs
Encourage Beneficial Use
• Sub-‐‑Strategy C 7.3: Ensure environmentally responsible shellfish aquaculture based on sound science.
o C 7.3 NTA 3: Shellfish Model Permitting Program
Part of the local contribution to these efforts is the state-‐‑mandated identification of Marine Recovery Areas.18 The long-‐‑term actions to achieve the 2020 goal are assumed to flow from these near-‐‑term actions, but are not fully described.
18 WA Department of Health. 2006. Marine Recovery Area Guidance: Supplemental to the On-‐‑Site Sewage System Management Plan Guidance for the Twelve Puget Sound Counties. http://www.doh.wa.gov/Portals/1/Documents/Pubs/337-‐‑085.pdf

Funding Strategy for the Strategic Initiatives from the 2012-2013 Puget Sound Action Agenda
Volume 2: Technical Report 35
3 Costs of the Strategic Initiatives In this section we summarize the best available information on costs for the Strategic Initiatives. We provide the costs for identified NTAs from the 2012-‐‑2013 Action Agenda to provide the current snapshot of project diversity, but focus on the complete set of long term costs necessary to achieve success for each Initiative. This includes both public and private costs. The core priority program areas for each Initiative define the costs for the funding strategy and funding gaps summarized later in Section 5. The core priority areas have consensus concerning their importance, and a level of effort that generally demands increased funding and implementation over decades. Cost data for the NTAs are relatively well-‐‑defined and bring high confidence. But moving out into the long-‐‑term set of needs and their costs brings challenges with major data gaps. In this report, we triangulate using the NTAs, the strategies and sub-‐‑strategies associated with each Strategic Initiative, and the available studies, to build a picture of the needs and costs over time. Hopefully ongoing and future efforts will continue to improve these need and cost details over the long term.
3.1 Habitat
3.1.1 Near Term Action Costs Cost estimates for NTAs are included in Appendix A of State of the Sound 2013. Financial estimates of the costs and existing funding for each Action were provided by NTA owners (i.e. the entities primarily responsible for implementing the Actions). The $405 million in habitat-‐‑related NTAs generally include costs that are or would be incurred by partner entities. It is important to note that the estimate does not report ongoing costs and, in some cases, owners were unable to estimate total costs for particular actions due to the difficulty of projecting future costs. The update process for the Action Agenda continues to identify additional local projects for inclusion in the habitat-‐‑related NTAs.
As Table 7 indicates, the largest cost component of the NTAs for the Habitat Strategic Initiative is for implementation of the three-‐‑year recovery plans, at more than $360 million for the three-‐‑year 2013-‐‑2015 period (per Appendix A of the 2013 State of the Sound report).

Funding Strategy for the Strategic Initiatives from the 2012-2013 Puget Sound Action Agenda
Volume 2: Technical Report 36
Table 7. Three Year (2013-2015) Costs of NTAs Associated with the Habitat Strategic Initiative
Source: Puget Sound Partnership, State of the Sound 2013
3.1.2 Long Term Action Costs
Salmon Recovery Plans
The Puget Sound Recovery Plan (2005) calculated the costs of the habitat actions identified in 10 of the 14 watersheds in the region (for the ten-‐‑year period between 2006 to 2015) as being roughly $1.1 billion, or $120 million per year for the first ten years of implementation. The NOAA Fisheries Puget Sound Chinook Salmon Recovery Plan 2011 Implementation Status Assessment Final Report (2011), discussing the same information, reported that the majority of these costs
Action Number Description Total Cost
A1.2.1 Land Use Planning Barriers, BMPs and Example Policies
$30,000
A1.3.1 Address Regulatory Exemptions $30,000
A4.2 Provide for growth (All NTAs) $-
A5.1.1 Floodplain Protection and Policy Team Actions $877,000
A5.3.4 Levee Vegetation $2,708,000
A6.1 Implement Salmon Recovery 3-year Workplans (All NTAs)
$384,524,000
A6.1.1 Secure Annual Chinook Investment $360,364,000
A6.1.2 Restoration Permit Barriers $50,000
A6.1.3 BNSF Railroad Cooperative Agreement $265,000
A6.1.HC6 Hood Canal Salmon Recovery $664,000
A6.1.SJI9 San Juan County Lead Entity $2,116,000
A6.1.STRT1 Elwha River Ecosystem Recovery $2,687,000
A6.1.STRT2 Straits Salmon Recovery Plans $18,378,000
A6.1.WS9 West Sound SR3 Chico Creek Culvert Replacement
$-
A7.1 Protect and Restore Stream Flows (All NTAs) $4,895,000
A7.1.1 Set Instream Flows in Priority Watersheds $1,500,000
A7.1.2 PEP Development and Implementation $-
A7.1.3 Water Code Compliance and Enforcement $1,395,000
A7.1.STRT6 Strait Instream Flow Rules $2,000,000
B1.2.1 Update Local Shoreline Master Program $9,272,000
B1.3.2 Hydraulic Code Rules Revision $225,000
B2.1.1 Protect 10% of Bluff-Backed Beaches $15,000
B2.2.1 Implementation of Projects Identified by PSNERP
$1,565,000
B2.3.1 Homeowner Incentives for Landward Setbacks
$48,000
B5.3.2 Invasive Species Early Detection and Monitoring
$21,000
C8.1.2 Evaluate Risk Assessments for Update Needs $495,000
Total $404,705,000

Funding Strategy for the Strategic Initiatives from the 2012-2013 Puget Sound Action Agenda
Volume 2: Technical Report 37
(roughly $1.04 billion) were capital costs, corresponding to roughly 715 projects. Non-‐‑capital costs made up the difference (~ $78 million), with 423 programs proposed for implementation in the 2010-‐‑13 recovery plan three-‐‑year work plans. Experts suggest that salmon recovery will require an ongoing effort at these levels or greater, so the roughly $120 million per year cost is best considered an annual cost for the foreseeable future, rather than a set timeframe that will sunset at a certain date.
Funding for Salmon Recovery in Washington State (Evergreen Funding Consultants, 2011) compiled and analyzed costs of the habitat-‐‑related elements of salmon recovery at the regional level for the period 2010-‐‑2019. The cost estimates are based primarily on the regional recovery plans, and the report provides estimates of the costs associated with habitat restoration and protection, as well as the aligned, non-‐‑capital actions that are undertaken by the regional recovery organizations, watershed leaders, tribes, participating agencies and organizations, and landowners to fulfill commitments outlined in the regional recovery plans.19 The diverse range of watershed-‐‑specific actions in the regional plans are categorized into: capital costs (marine and estuary restoration, floodplain restoration, channel reconstruction, tributary restoration, fencing and riparian planting, land and easement acquisition, fish passage barrier retrofits, instream flow enhancements, and water quality improvements) and non-‐‑capital costs (program operations; monitoring, studies, and assessments; outreach and education; and development and enforcement of regulations). Estimated costs (in 2010 dollars) for salmon recovery efforts (over the ten year planning horizon) in Puget Sound include $1,695 million in capital costs ($1,136 million for restoration, $218 million for land and easement acquisition, $161 million for passage barrier retrofits, $50 million for instream flow enhancements, and $129 million for water quality improvements) and $266 million in non-‐‑capital costs ($45 million for program operations; $134 million for monitoring, studies, and assessments; $43 million for outreach and education; and $45 million for development of regulations).20 These costs, when averaged over the ten year period, equate to $196 million in annual costs. This is currently considered to be the most reliable ongoing annual cost estimate for the salmon recovery plans, but the set of identified project needs and their costs continue to increase. The latest set of submissions for salmon habitat project needs by local organizations in Puget Sound totals $784 million, but this estimate is still in review and does not
19 Due to lack of data availability, costs related to hatchery and harvest improvements were not included in these cost estimates.
20 This estimate includes Hood Canal, which was considered separately in the ECF 2011 report.

Funding Strategy for the Strategic Initiatives from the 2012-2013 Puget Sound Action Agenda
Volume 2: Technical Report 38
correspond to a specific timeframe.21 It is best to consider the $196 million in annual cost estimate representative and indicative of the appropriate order of magnitude for costs moving forward.
Floodplains
Costs associated with floodplains protection primarily include the capital costs associated with acquisition and easements, and the cost of labor and materials required for restoration actions, such as such as levee removal and breaching. Other major costs include those to support program operations, annual property maintenance, and the planning and design studies that precede restoration and protection actions.
No previous studies have examined the costs of protecting floodplains at a basin wide scale in Puget Sound. The closest estimation is provided in Funding for Salmon Recovery in Washington State (Evergreen Funding Consultants, 2011), which compiled and analyzed costs of the habitat-‐‑related elements of the regional salmon recovery plans. The report estimates the costs associated with habitat restoration and protection, as well as the aligned, non-‐‑capital actions that are undertaken by the regional recovery organizations, watershed leaders, tribes, participating agencies and organizations, and landowners to fulfill commitments outlined in the regional recovery plans. The study categorized the capital costs of habitat restoration by habitat type/activity (marine and estuary restoration, floodplain restoration, channel reconstruction, tributary restoration, fencing and riparian planting, land and easement acquisition, fish passage barrier retrofits, instream flow enhancements, and water quality improvements) and non-‐‑capital costs (program operations; monitoring, studies, and assessments; outreach and education; and development and enforcement of regulations).
The floodplain specific estimate (~$472 million, in 2010 dollars) was the largest single cost component in the habitat restoration category, making up about 40% of all ten-‐‑year restoration costs. This figure (which only includes restoration costs) equates to $142 million over a three-‐‑year timeframe, $283 million over six years (by 2020), and $47 million as an annual average, ongoing estimate. While floodplain-‐‑specific cost breakdowns were not reported categories, applying the same percentage from similar projects to these categories may provide a rough estimate:
Land and Easement Acquisition: ~$90 million total (3-‐‑year: $27 million, six-‐‑year: $54 million, $9 million average annual/ongoing)
21 Macilroy, C. 2014. Personal communication concerning analysis of cost data provided by Puget Sound Partnership.

Funding Strategy for the Strategic Initiatives from the 2012-2013 Puget Sound Action Agenda
Volume 2: Technical Report 39
Non-‐‑Capital Costs (program operations; monitoring, studies, and assessments; outreach and education; and development and enforcement of regulations): ~$111 million total (3-‐‑year: $33 million, six-‐‑year: $66 million, $11 million average annual/ongoing)
Estimating Long Term Floodplain Restoration Costs
In this section, we attempt to provide a rough estimate of the long-‐‑term floodplain restoration total costs. Individual project-‐‑level costs can vary based on several factors, particularly concerning the current intensity of use which affects both land acquisition (or opportunity) costs as well as restoration costs. A study detailing the costs of Puget Sound salmon habitat projects, Primer on Habitat Restoration Costs22, identified floodplain restoration costs as ranging from $10,000 to $300,000 per acre. Opportunistic efforts timed with other floodplain investments might lower the marginal costs considerably in developed areas. Results of a King County levee setback study along the lower Green River between Kent and Tukwila found marginal restoration costs in the $10s to $100s of thousands per acre, even with acquisition and conversion costs for commercial land, if levee reconstruction would already be occurring.23
‘Coordinated Investment for Puget Sound Floodplains’ is a floodplain protection initiative by Department of Ecology that identifies high priority floodplain restoration projects and attempts to align the multiple entities and funding sources working for floodplain restoration in Puget Sound. The initiatives’ most recent capital request (2013-‐‑2015) amounted to $33 million for 9 projects.
The 2013-‐‑initiated ‘Floodplains by Design’ program, a collaboration between Department of Ecology, the Puget Sound Partnership, the Nature Conservancy and other agencies and organizations, aims to implement floodplain projects that generate multiple-‐‑benefits, including habitat, across Washington State. Of identified and funded projects for the initial round of funding, $33 million was allocated for Puget Sound projects.24 This state contribution is matched by other funding sources in all cases, indicative of the overall multi-‐‑benefit approach at the core of the program. It is unclear as to the share of matching contributions that contribute to habitat function, but it is arguable that the habitat benefits
22 Evergreen Funding Consultants, 2003. 23 Currently unpublished study but soon to be released for the stretch of the Green River from 180th to 200th Streets near Briscoe Park. King County with permission to cite.
24 Department of Ecology. 2014. http://www.ecy.wa.gov/programs/sea/floods/floodplainsByDesign.html

Funding Strategy for the Strategic Initiatives from the 2012-2013 Puget Sound Action Agenda
Volume 2: Technical Report 40
would not be achievable without the generation of other necessary benefit types, like structural flood protection and flow control.
In the absence of any existing analysis to estimate the total long-‐‑term floodplain restoration needs for Puget Sound, we used the information in Table 8 from the Puget Sound Vital Signs on Floodplains to develop a rough estimate of the potential cost associated with comprehensive floodplain restoration. It identifies, based on spatial analyses, the share of disconnected floodplain that could potentially be restored, based on hydrologic conditions.
Table 8. Floodplain Restoration Needs in Puget Sound
Source: Based on data from PSP Floodplains Vital Signs
Based on previous analyses of land cover and zoning in Puget Sound floodplains (in Whatcom County and the Stillaguamish watershed), floodplains are primarily zoned as agricultural land (60-‐‑75%). Urbanized portions comprise roughly 10-‐‑20%, and the remainder is composed of timber/forestry lands and regional open space. The percentage urban area aligns with the Puget Sound-‐‑wide estimate reported in the vital signs report. Based on the non-‐‑urban land use estimates provided for the watersheds, we can assume that roughly 67.5% is in agricultural use, and the remaining 18.9% in open space (within the 86% non-‐‑urban, disconnected floodplain area).
Acreage of floodplain to be restored is potentially a misleading metric, as it may not relate linearly to total cost. The amount of levee removal and active channel modification appears to drive project costs. Typically, restoration projects target a small portion of a river or bank, which through modification, then reconnects a certain acreage of floodplain.
Based on analysis of PSAR floodplain projects, projects identified by the ‘Coordinated Investment for Puget Sound Floodplains’ initiative, and projects summarized in the “Primer on Habitat Restoration Costs” (Evergreen Funding Consultants, 2003), we identified a range of floodplain restoration costs per acre
Floodplain Area Sq Km AcresPercent of Total Floodplain Area
Percent of Disconnected Floodplain Area
Total 1,500 370,658 100% /Currently6Connected 950 234,750 63% /Disconnected 550 135,907 37% 100%Urban 75 18,532 5% 14%Non/urban 475 117,375 32% 86%

Funding Strategy for the Strategic Initiatives from the 2012-2013 Puget Sound Action Agenda
Volume 2: Technical Report 41
that correspond to general land use categories.25 To produce a coarse, conceptual estimate of the costs of restoring the 135,907 acres of disconnected floodplain identified above, we apply a distribution to this acreage across a spectrum of low to high development, based on the broad land use percentages reported above. To account for the highest costs for levee setback projects in heavily urbanized areas, we use a $200,000-‐‑300,000/acre high-‐‑cost (based on the cost estimates described earlier), and the known urban acreage (18,532 acres).
Cost estimates based on this breakdown are likely not realistic in for 100 percent of the floodplain, as complete floodplain restoration would likely be infeasible due to existing uses, or costs would dramatically increase as approaching full restoration. They do provide a ballpark estimate for order of magnitude and considering a portion of the whole, likely in the billions to tens of billions of dollars for the basin as a whole (Table 9).
Table 9. Estimates of Potential Floodplain Restoration Costs (Millions)
Sources: WA RCO Prism Database; Evergreen Funding Consultants. 2003. A Primer on Habitat Project Costs. Puget Sound Shared
Strategy. King County levee setback studies.
The 2020 target of 15% restoration of degraded floodplains corresponds to 20,386 acres restored over the next six years. If we apply this acreage equally across the set of costs in Table 9, this would cost roughly $2.4 billion dollars. While unrelated directly, the total set of floodplain capital improvement projects identified by floodplain managers in Puget Sound as part of the Floodplains by Design for flood risk reduction totals $2.2 billion. While these flood risk reduction investments do not directly correspond to habitat investments in floodplains, they do represent an opportunity for multi-‐‑purposing dollars spent in floodplains.
These long term costs are generally consistent with the level of annual funding targeted by the Floodplains by Design program. Annual funding needs are
25 These costs mainly reflect direct restoration costs, but it may also include acquisition-‐‑related costs as there is a reasonable likelihood they'ʹve been lumped together in some project cost estimates. It is also unclear how much administration and planning cost is included.
Development Context ! !
Cost/Acre $1,304 $15,953 $41,840 $67,726 $126,921 $186,116 $200,000 $300,000Acreage Allocation -12,819- --12,819- --22,934- --22,934- ----22,934- ----22,934- ---------------9,266- 9,266Cost (Millions) $17 $205 $960 $1,553 $2,911 $4,268 $1,853 $2,780
Total Acreage Restored
135,907-
Total Cost $14,546
Agricultural Land/Low Density
Residential
Least Urbanized (open space) Most Urbanized

Funding Strategy for the Strategic Initiatives from the 2012-2013 Puget Sound Action Agenda
Volume 2: Technical Report 42
dictated largely by identifiable and implementable projects, and include local and other forms of match. $50 to 70 million annually provides a generally-‐‑consistent target, although the share of this cost most appropriately owned by the state is unclear.
Culverts Table 10. Puget Sound Basin Culvert Retrofit Costs (Total in Millions)
Sources: WA RCO PRISM Database; WSDOT, 2014. Accelerating Fish Barrier Correction: New Requirements for WSDOT Culverts; Evergreen Funding Consultants. 2003. A Primer on Habitat Project Costs. Puget Sound Shared Strategy.
WSDOT has identified $2.4 billion in costs for their culverts requiring retrofit, which, in order to meet an objective of completion by 2030, would equate to $310 million per biennium. Applying a number of cost sources based on culvert type, we estimate the overall costs for all culverts identified in the RCO PRISM database at $5.3 billion (Table 10). Costs are primarily based on actual project cost estimates from the PRISM database, which identifies culvert owner and project cost for implemented and designed retrofits. While the count of culverts requiring attention is a majority non-‐‑state ownership, the most expensive and difficult to finance culverts are generally state-‐‑owned. Combined with court mandate, this information suggests prioritization of increased funding effort for WSDOT state-‐‑owned culverts. While the database is incomplete, interviews with experts at multiple agencies suggest the share of undocumented culverts is low. So it is unlikely that costs would be substantially greater than this estimate. Federal per-‐‑culvert costs are low because these are primarily forest roads with minor structural requirements for retrofit. These cost estimates are preliminary, and agencies including WDFW are in the process of developing more accurate cost estimates.
OwnerNumber of
culvertsAverage cost
per culvert Total Cost
Private 3,207 $80,000 $257County 2,036 $295,000 $601State 1,221 $3,000,000 $3,663City 908 $800,000 $726Federal 181 $15,000 $3Unknown 147 $288,000 $42Tribal 27 $500,000 $14Other 12 $288,000 $3Port 10 $288,000 $3Special District 4 $288,000 $1Total 7,753 $5,313

Funding Strategy for the Strategic Initiatives from the 2012-2013 Puget Sound Action Agenda
Volume 2: Technical Report 43
3.2 Stormwater Costs
3.2.1 Stormwater Near Term Action Costs Table 11 below shows the costs of the stormwater NTAs, per Appendix A of the 2013 State of the Sound report.
Table 11. Three Year Costs of NTAs Associated with the Stormwater Strategic Initiative
Source: PSP, State of the Sound 2013
While a $27 million program over three years is not insignificant, it is a small fraction of what is widely assumed to be a multi-‐‑billion dollar cost in the long run.
3.2.2 Stormwater Long Term Cost Estimates
Current Public Costs
The most identifiable and well-‐‑documented costs of preventing urban stormwater runoff are associated with efforts by WSDOT, Ecology, and local municipalities, as presented in Table 12. Cost estimates are presented as three-‐‑year costs, six-‐‑year costs (inclusive of the initial three-‐‑year costs), and an average annual cost for years seven and onward. In general, these cost estimates are based on the sources identified in the table, with costs beyond the initial three years including all potentially ongoing cost categories. The costs for municipalities cannot be fully decomposed into all of their program elements. The smaller Phase II communities face particular challenges in sufficiently funding these regulatory compliance mandates.
NPDES Compliance Costs
NPDES compliance costs span the gamut of stormwater pollution control costs, including planning and implementation. The suite and distribution of these costs
Action Number Description Total Cost
C1.1.3 Fish Consumption Rates $1,110,000
C2.1.1 Watershed Based Stormwater Management
$46,000
C2.2.1 NPDES Municipal Permits $1,974,000
C2.2.3 Stormwater Management Outside Permitted Areas
$224,000
C2.3.1 Stormwater Retrofit Projects $14,828,000
C2.4.1 Compliance Assurance Program $391,000
C2.5.1 LID Training and Certification $1,938,000
C2.5.2 Education for the Next Generation of Stormwater Professionals
$5,700,000
D6.1.1 Phase 2 of Puget Sound Starts Here $1,280,000
Total $27,491,000

Funding Strategy for the Strategic Initiatives from the 2012-2013 Puget Sound Action Agenda
Volume 2: Technical Report 44
vary by permit holder and are driven by permit requirements as defined by Department of Ecology. The costs associated with the stormwater management activities required by the NPDES municipal permits generally fall into three main conceptual categories:
• Non-‐‑capital, one time costs, such as those associated with studies, planning and pre-‐‑implementation assessments.
• Capital costs are those associated with structural solutions such as the installation of stormwater treatment facilities (which can include land acquisition). Capital can require periodic replacement.
• Non-‐‑Capital, ongoing costs which are the costs of ongoing program operations and maintenance as well as repair.
Given that stormwater systems are owned and operated by public entities, the vast majority of costs within each of these categories accrue to public entities. These include:
• Local governments (cities and counties, as well as secondary permittees, like ports)
• Washington Department of Transportation (also a secondary permittee) • Washington Department of Ecology • Private entities (costs associated with development)
Information regarding the costs of NPDES permit compliance (Table 12) includes the following sources:
Bissonette 2010
A 2010 report titled Urban Stormwater Runoff Preliminary Needs Assessment Technical Memorandum, prepared by Bissonnette Environmental Solutions and Parametrix represents the most complete assessment of the financial investment required to reduce stormwater pollutant degradation of Puget Sound that has been completed to date. The report develops rough estimates of the costs of compliance with NPDES permits incurred by Puget Sound permittees for the five-‐‑year period 2012-‐‑16. In addition to estimates of total compliance costs, the report estimates the portion of the costs that go towards annual maintenance and operations, as well as the additional costs of implementing a comprehensive monitoring and compliance program. While total cost estimates are available, the Bissonnette report did not provide specific estimates for several cost categories mandated by the NPDES permits.
Bissonette also provides estimates of the annual, ongoing costs to the Washington State Department of Ecology associated with the implementation and oversight of the NPDES permit program (the agency provides guidance, issues permits for municipalities, industries and construction sites and highway

Funding Strategy for the Strategic Initiatives from the 2012-2013 Puget Sound Action Agenda
Volume 2: Technical Report 45
runoff, and provides technical and financial assistance), and we have updated and adapted these estimates for use in the present analysis.
Table 12. NPDES Permit Compliance Costs (Public) Puget Sound
Sources: 1 = WSDOT NPDES Municipal Stormwater Permit Annual Reports for Fiscal Years 2010-2011, and 2012- 2013 2 = Bissonnette Environmental Solutions and Parametrix. 2010. Final Review Draft- Task 1: Urban Stormwater Runoff
Preliminary Needs Assessment Technical Memorandum. 3 = SAIC. 2012. Cost of Compliance Analysis for the 2013 - 2018 NPDES Municipal Stormwater Permit. Prepared for
Pierce County, WA. 4 = Washington State Auditor’s Office, Local Government Financial Report System; trends over time. Notes: All values reported in 2014 dollars.
Pierce County 2013 - 2018 NPDES Municipal Stormwater Permit Compliance Cost Report
Ecology has introduced a new round of NPDES permits since the Bissonnette report was produced, and compliance costs for all permittees have increased under the requirements of the new permits. To estimate the increase in costs, we reviewed the 2012 Study Cost of Compliance Analysis for the 2013 -‐‑ 2018 NPDES Municipal Stormwater Permit, prepared by SAIC for Pierce County. This is the only existing source of information regarding the magnitude of the cost increases experienced by permittees under the new permit. Based on the categorical and percentage cost increases experienced by Pierce County, we updated the region-‐‑wide compliance figures presented in the Bissonnette Report.
Near-Term (Three-Year) 2020 (Six-Year) Average
Annual
Washington Department of Transportation $46 $93 $15 1
Permit Coordination $0 $0 $0 1
Stormwater Program Management and Oversight $0 $1 $0 1
Total Maximum Daily Load Management $0 $1 $0 1Construction Site Pollution Prevention Management
$0 $1 $0 1
Stormwater Features Inventory $2 $4 $1 1
Illicit Discharge Detection and Elimination $0 $1 $0 1
Monitoring and Research $3 $5 $1 1
Annual Reporting $0 $1 $0 1
Washington State Ferries $0 $0 $0 1
Highway and Facility Maintenance $38 $75 $13 1
Stand-alone Stormwater Retrofit $2 $3 $1 1
Highway Runoff Program $0 $1 $0 1
Washington State Department of Ecology $29 $58 $10 2
NPDES Permit Program Implementation $10 $19 $3 2
Stormwater Construction Permit Programs $12 $25 $4 2
Industrial Stormwater Permit Programs $7 $14 $2 2Local Municipalities (Cities and Counties) - NPDES Program Compliance
$785 $1,570 $300 2, 3, 4
Stormwater System Maintenance and Operations $315 $630 $105 2
Total $860 $1,720 $325
Cost Owner/Activity
Current Expenditures (Millions)Source of
Cost Information

Funding Strategy for the Strategic Initiatives from the 2012-2013 Puget Sound Action Agenda
Volume 2: Technical Report 46
WSDOT NPDES Municipal Stormwater Permit Annual Reports (2010-2013)
WSDOT must address stormwater discharges from facilities it owns or operates in areas covered by the Phase I and II permits. Statewide, WSDOT must meet compliance requirements discharges originating from about 1,600 miles of highways, 31 maintenance facilities, 11 ferry terminals, 11 rest areas, and 11 park and ride lots. We used cost information provided in WSDOT’s NPDES Municipal Stormwater Permit Annual Reports for Fiscal Years 2010-‐‑2011, and 2012-‐‑ 2013 to estimate the costs incurred.
NPDES permitting and compliance costs are dominated by local municipal compliance costs. It is difficult to separate out NPDES-‐‑specific surface water costs, but when considering the past studies described above as well as sampling individual jurisdiction budgets and the complete set of stormwater utility revenue within the basin as detailed in the Local Government Financial Report System, costs appear to be roughly $300 million per year or greater moving forward. To the extent that the increasing costs are associated with reductions in stormwater pollution from existing problems, the costs can be deducted from retrofit need estimates in the next section.
Current WDOT and Ecology stormwater budgets specific to NPDES are an order of magnitude lower, although both organizations are increasingly identifying and targeting retrofit and maintenance needs, that might be considered permit or non-‐‑regulatory efforts.
Private Costs
Based on rates of new and redevelopment and costs for code compliance, private costs (beyond stormwater fee payments) are likely roughly $100 million annually, although the actual range could be $50 to $150 million.26 These estimates are based primarily on the WRIA 9 Retrofit Study described in
26 For these purposes, private refers to direct spending on stormwater compliance by developers and owners. It might include some public spending for compliance of public development in a private context. See the WRIA 9 Retrofit Study for more explanation.
Table 13. Kitsap County Stormwater Cost Shares
Source: Kitsap County.1

Funding Strategy for the Strategic Initiatives from the 2012-2013 Puget Sound Action Agenda
Volume 2: Technical Report 47
the next section of this report (retrofits), as well as consultation with stormwater utility staff. Depending on the framing of these costs, they can also be considered to contribute to retrofit costs as they address problems from existing areas as part of the redevelopment process. And it is problematic to isolate the contribution of development costs to stormwater, as various design elements can be multi-‐‑purpose, and areas of frequent redevelopment might see new stormwater investments that are simply replacing functional existing systems.
Costs increasing over time
The NPDES compliance costs for permit holders are increasing over time. The Pierce County study found an increase in 20% annually over costs of the previous permit. The City of Shoreline has seen its most recent NPDES permit fee more than double its costs relative to the prior permit, from $30,000 to $67,000 in support of expanded regional monitoring, and has planned annual stormwater fee increases of 3-‐‑5 percent.27 Surveys by the Association of Washington Cities have reported a substantial share of their communities experiencing funding challenges for current needs. In a survey of cities statewide, half reported delays in infrastructure capital investments in order to balance budgets, and nearly two-‐‑thirds reported anticipating such delays for budget balancing is forcing deferment of planned capital upgrades for stormwater.28
There are efforts underway to improve the quality and cost-‐‑effectiveness of permit requirements. Ecology has undertaken efforts to coordinate monitoring at the regional level for the smaller Phase II communities.
27 City of Shoreline. 2014 Proposed Budget. http://shorelinewa.gov/home/showdocument?id=14787.
28 Association of Washington Cities. 2013. State of the Cities.
Table 14. City of Bothell NPDES Compliance Cost Shares
Source: City of Bothell.1

Funding Strategy for the Strategic Initiatives from the 2012-2013 Puget Sound Action Agenda
Volume 2: Technical Report 48
Cost Components
The allocation of permit compliance costs varies across categories, as the scale of operation and state of development of programs varies, as well as permit requirements. Bissonette estimated that, on average, 35 percent of permittee costs are attributable to operations and maintenance. Capital investments for stormwater can be accounted various ways, and might not be annualized or recurrent. Estimates of surface water program expenditures broken out by activities that align with NPDES compliance requirements are scarce. Anecdotal examples show high degree of variation (e.g. Table 13 and Table 14). While community size, rate and timing of development, land use, and natural conditions likely contribute to this variation, it suggests that a one-‐‑size-‐‑fits-‐‑all approach to cost management would not likely be successful.
All major costs are not necessarily capital projects. Bothell’s experience suggests potentially high operation and maintenance costs, as increasingly reported by NPDES permit holders. New investment areas like green stormwater infrastructure potentially introduce some new areas of uncertainty concerning long term O&M costs.
Pierce County’s cost study identified the marginal (new) costs associated with new permit requirements, coming to roughly $4 million annually. Most expenditure categories are increasing under the new permit requirements (Table 15); in particular, capital projects/retrofits and inspection, compliance and enforcement (IDDE) costs.
Table 15. Pierce County NPDES Cost Estimates 2013-2017
Source: Pierce County Cost of Compliance Report
With increasing costs of compliance, it is difficult to specify a narrow NPDES permit cost estimate for the basin. Bissonette estimated $160-‐‑170 million for 2009, but this did not include flow control, which can be managed and budgeted
2013 2014 2015 2016 2017 2013 2014 2015 2016 2017 Average1. NPDES Permit Management $114,100 $114,350 $103,000 $103,000 $103,000 3% 3% 3% 3% 3% 3%2. Planning, Reporting, Mapping $162,500 $167,050 $155,700 $155,700 $155,700 4% 4% 5% 4% 4% 4%3. Control Runoff New Development $546,950 $908,250 $112,550 $114,650 $59,850 14% 20% 3% 3% 2% 8%4. Public Education and Outreach $61,750 $104,050 $60,950 $61,700 $61,700 2% 2% 2% 2% 2% 2%5. Structural Stormwater Control $1,110,750 $1,111,500 $1,112,250 $1,113,000 $1,113,000 28% 25% 32% 32% 32% 30%6. Source Control $71,000 $47,700 $46,300 $46,300 $93,900 2% 1% 1% 1% 3% 2%7. IDDE Program $1,427,400 $1,522,900 $1,391,400 $1,421,800 $1,421,800 36% 34% 40% 41% 41% 38%8. TMDL $271,700 $271,700 $271,700 $271,700 $271,700 7% 6% 8% 8% 8% 7%9. Monitoring $108,000 $170,900 $170,900 $170,900 $170,900 3% 4% 5% 5% 5% 4%10. Operations & Maintenance $25,600 $25,600 $2,200 $2,200 $2,200 0.7% 0.6% 0.1% 0.1% 0.1% 0%11.Training $28,450 $30,600 $32,750 $34,850 $34,850 1% 1% 1% 1% 1% 1%
Total $3,928,200 $4,474,600 $3,459,700 $3,495,800 $3,488,600 100% 100% 100% 100% 100% 100%
New Compliance Costs % of Total Additional Cost

Funding Strategy for the Strategic Initiatives from the 2012-2013 Puget Sound Action Agenda
Volume 2: Technical Report 49
jointly with stormwater as part of surface water, towards common objectives.29 Bissonette estimated that NPDEs compliance costs comprise 50 to 80 percent of total stormwater expenditures, which would equate to a total ranging from $200 to $340 million. Bissonette acknowledged that costs were steadily increasing in 2009, as Phase II permittees ramped up their programs. As already described, costs are increasing across permit types for a variety of reasons.
Increasing permit compliance costs over time relate to the retrofit need for existing development. Redevelopment and increasing permit requirements as well as expansion of low impact development and green stormwater infrastructure approaches are making progress on problem areas. The retrofit cost section describes cost estimates for addressing problems from existing development. The line between permit/code compliance costs and retrofits is shifting and likely best thought of as a continuum to be considered holistically rather than a binary set of disparate efforts.
Long Term Stormwater Retrofit Costs
Retrofit strategies are context-‐‑dependent, and the appropriate mix of structural and non-‐‑structural actions depends on the stormwater pollution sources and opportunities for management or mitigation. Understanding the full magnitude of the need for treatment of existing development is challenging, but three studies have previously examined the costs of stormwater retrofits in Puget Sound:
Bissonette 2010
This report includes an assessment of the financial investment required to retrofit the entirety Puget Sound’s existing stormwater infrastructure system. Potential stormwater retrofit costs were calculated based on the percentage of impervious area in Puget Sound, and information about the cost of implementing best management practices (BMPs) for reducing amount of suspended solids flowing from this area. The resulting retrofit cost estimates range from $3.3 billion to $15.6 billion for capital investment, and $111 million to $561 million for the corresponding annual maintenance investment (2010 dollars). The estimates vary based on the percentage of the impervious area in Puget Sound being addressed; upper end estimates correspond to the costs associated with retrofitting 100% of the existing impervious area in the Sound.
29 Oftentimes stormwater management objectives are most effectively aimed at flow control, meaning management of water volume, particularly peak flows. Treatment systems have flow capacity, and flow control can reduce overflows. It also allows natural treatment to occur, and reduces the sediment and pollutant transport increases that occur with high flows.

Funding Strategy for the Strategic Initiatives from the 2012-2013 Puget Sound Action Agenda
Volume 2: Technical Report 50
However, this estimate focused primarily on the costs of solids removal, and did not include those associated with increased flow control (i.e. directly managing the quantity of stormwater runoff, rather than quality alone) and land purchase costs, and thus the figures obtained are likely underestimates.
Stormwater Retrofit Analysis and Recommendations for Juanita Creek Basin in the Lake Washington Watershed, King County (2012)
King County modeled the stormwater facilities that would be required to improve stream flow and water quality in Juanita Creek sufficiently to meet flow and water quality standards (primarily for salmonids). King County used a variety of metrics to evaluate the effectiveness of each mitigation scenario, including a biological indicator (Benthic Index of Biotic Integrity–BIBI; see Figure 1) estimated from regression relationships with hydrologic metrics, frequency of gravel disturbance, water-‐‑quality exceedances relative to Washington State standards (e.g., dissolved copper) and reductions in pollutant loads for water quality parameters with no regulatory thresholds (e.g., total suspended solids). They considered non-‐‑traditional retrofit strategies including green stormwater infrastructure.
They estimated that $1.4B of new investment would be need in the roughly 7-‐‑square mile basin. It is important to note that the basin is almost entirely developed, so this area likely falls on the upper end of the cost spectrum. This estimate is inclusive of land acquisition, construction, and operation and maintenance costs.
Stormwater Retrofit Implementation Strategies for Water Resources Inventory Area, WRIA 9, King County (2014)
This recently published report represents the most comprehensive and precise estimation of retrofits costs for any area in the Puget Sound that has been accomplished to date. The study area covers the 278 square miles of the Green/Duwamish watershed and portions of the Central Puget Sound watershed that comprise WRIA 9. Using local stream flow and water quality information, King County modeled the stormwater facilities required to restore stream flow and water quality to pre-‐‑development conditions using a tool recently developed by the U.S EPA (the SUSTAIN model -‐‑ System for Urban Stormwater Treatment and Analysis INtegration). They considered non-‐‑traditional retrofit strategies including green stormwater infrastructure. Additional analyses account for the impacts of population growth and future development/redevelopment activity on stormwater facility construction, the distribution of costs between public and private entities, the uncertainty associated with climate change impacts on stormwater facility sizing, and the stock of existing facilities.

Funding Strategy for the Strategic Initiatives from the 2012-2013 Puget Sound Action Agenda
Volume 2: Technical Report 51
The WRIA 9 study cost estimates for 100 percent retrofit of the 278 square mile region (not including Seattle) is $11 billion (Table 16). These costs represent 100 percent retrofit, a likely unrealistic and possibly unnecessary extreme level of retrofit, but worthwhile for considering cost categories and less-‐‑than-‐‑100 percent scenarios.
Table 16. WRIA 9 Retrofit Study costs (100 Percent Retrofit Scenario)
Source: WRIA 9 Retrofit Study. Costs indicate total costs over full timeframe necessary for total retrofit, roughly 100
years. Future costs are not discounted.
Total Retrofit Cost Estimation
According to the Juanita Creek study, estimated costs (in 2011 dollars) to achieve several stormwater retrofit scenarios ranged from $200 million to $1.4 billion dollars, equating to a range of $30 to $200 million per square mile. When combined with the Puget Sound-‐‑wide impervious surface area estimates presented in Bissonette, the costs break down as follows:
Table 17. Retrofit Costs for Puget Sound (Millions)
Source: Bissonnete (2010) and King County (2012) * ‘Low’ = $30 million per square mile = $0.047 million per acre * ‘High’ = $200 million per square mile = $0.313 million per acre
The low-‐‑end retrofit costs for 100 percent replacement (associated with the least effective treatment scenario, ~$14-‐‑15 billion) identified in the Juanita creek study correspond closely to those developed in the Bissonnette study. The high-‐‑end retrofit costs (associated with the most effective treatment scenarios that lead to salmon-‐‑bearing streams, ~$99 billion) identified, however, are roughly six times higher than the Bissonnette estimates. Note that the comparisons in Table 17 are based on the Puget Sound wide impervious area estimates provided in Bissonnette.
Cost Category Cost (millions)
Public Capital Costs for New and Redevelopment $3,800Public Operation & Maintenance Costs $770Public Inspection & Enforcement $3,600All Private Costs $3,000
Total Costs $11,170
Range of Imperviousness Addressed/Treatment Scenario 80-100% 50-100% 20-100% 0-100% Acres with Impervious Area (2006) Addressed in Treatment Scenario 60,206 162,201 282,663 319,409Potential Total Capital Investment $3,010 $8,110 $14,133 $15,645Potential Total Annual Maintenance Investment $111 $300 $523 $561Retrofit Cost/Acre (Millions) $0.050 $0.050 $0.050 $0.049Ongoing Annual Retrofit Maintenance Cost/Acre (Millions) $0.002 $0.002 $0.002 $0.002Low* Juanita Creek Retrofit Cost Estimate (Millions) $2,822 $7,603 $13,250 $14,972High* Juanita Creek Retrofit Cost Estimate (Millions) $18,814 $50,688 $88,332 $99,815
Bissonette
Juanita Creek

Funding Strategy for the Strategic Initiatives from the 2012-2013 Puget Sound Action Agenda
Volume 2: Technical Report 52
Consultation with WRIA 9 retrofit study project leadership suggests that preliminary estimates for these extrapolations of Bissonette and Juanita Creek data are close to the costs the WRIA 9 work is finding for the basin as a whole as well. The WRIA 9 work does include inspection and enforcement costs that push the total costs higher than these shown. The WRIA 9 work is particularly useful for considering cost breakdowns between categories
These costs as identified by the Juanita Creek and WRIA 9 studies are particularly large, but represent 100 percent retrofitting of untreated impervious areas. 100 percent retrofit of all existing development with unmanaged stormwater in the basin is not practically feasible, and likely highly inefficient. The variety of needs and types of controls, as well as local spatial and technical constraints, combined with the range of resulting benefit on receiving surface waters suggest increasing costs and decreasing benefits as approaching the 100 percent retrofit level.
Considering an estimate based on 50 percent retrofit over a 20 year timeframe, annual costs would range from $380 million to $2.5 billion, shown in Table 18. These costs are not discounted to present value, and consequently allow straightforward interpolations to less ambitious goals. For example, if the retrofits are spread over 100 years rather than 20 years, would be $76 to $500 million annually. Consideration of the full costs of implementation do push these costs towards the upper end of this range.
Table 18. Costs Associated With a 50% Retrofit Scenario (Millions)
Source: ECONorthwest with data from Bissonnette (2010) and King County (2012)
Cost Effective Priority Actions for Existing Stormwater Problems
In light of the high costs for retrofits to existing development, interviews with stormwater experts and utility staff, as well as review of cost and effectiveness data suggest certain targets for particularly near-‐‑term benefits at relatively low cost. The two most often cited are increased street sweeping and removal of legacy sediment loads from stormwater conveyance systems.
Legacy Loads
Legacy loads represent material that has built up within stormwater conveyance and treatment infrastructure. While this is a new area of research and effort, initial findings suggest that it can be a particularly cost-‐‑effective opportunity. Tacoma cleaned 80,000 feet (15 miles) of pipelines for $300,000, removing 220
Near-Term (Three Year) 2020 (Six Year) 2034 (20 Year) Average
Annual
Low Estimate $1,140 $2,281 $7,603 $380High Estimate $7,603 $15,206 $50,688 $2,534
Finite task ; costs reported here assume completion over a 20 year time period
Cost TermCost Estimate (Millions)

Funding Strategy for the Strategic Initiatives from the 2012-2013 Puget Sound Action Agenda
Volume 2: Technical Report 53
cubic yards of sediment, and finding substantial reductions in levels of pollutants of concern downstream.30 This equates to 208 tons of sediment removed, at a cost of $0.72 per pound. Scaling by population of Tacoma relative to the total Puget Sound Basin, an equivalent proportional level of effort to remove legacy loads could cost $6.2 million.31
The legacy load removal project for Tacoma addressed less than 5 percent of total conveyance pipes, although it is unknown as to the full potential for such removal for the remainder of the system, and elsewhere in Puget Sound. Other general maintenance requirements can be necessary or associated with legacy load removal as well. Bissonette did report that permittees identified $60 to $120 million annually over five years of opportunity to address legacy loads in stormwater systems across Puget Sound, particularly with respect to a need in transportation (road) stormwater systems.
Street Sweeping
Street sweeping to capture pollutants before entering stormwater is another economical management strategy. Kitsap County recently invested in high efficiency street sweepers at a cost of $209,000 each. Kitsap developed a street sweeping plan so as to target sweeping effort on those streets with the highest traffic.
Seattle Public Utilities (SPU) reports that it currently sweeps 10,000 curb miles within the city, removing 100 tons of pollutants per year. Under a just released Integrated Plan proposal, SPU would double the annual curb miles of sweeping to 20,000 miles with an estimated additional 40 tons of pollutant removed.32 After accounting
30 Puget Sound Partnership. Highlights of the 2012/2013 Action Agenda for Puget Sound. 31 Based on 70 pounds per cubic foot of sediment. 32 Seattle Public Utilities. 2014. Street Sweeping. Integrated Plan. March 25. http://www.seattle.gov/utIl/groups/public/@spu/@diroff/documents/webcontent/01_029656.pdf. Proposed street sweeping expansion would become a regulatory compliance requirement if approved by Ecology.
Figure 11. Portion of total annual pollutant load removed by treatment type, City of Seattle, 2013
Source: Seattle Public Utilities 2014

Funding Strategy for the Strategic Initiatives from the 2012-2013 Puget Sound Action Agenda
Volume 2: Technical Report 54
for the cost of a new sweeper in the first year and operation and maintenance over time, the average annual cost would be $860,000 for this expansion. This equates to $7 per pound of pollutant removed. Scaling the annual cost by population across Puget Sound relative to the city of Seattle would provide an estimate of $5.5 million per year for a per capita proportional increase in street sweeping.
Costs of retrofitting existing impervious areas will, as with other Stormwater management categories, fall primarily on local governments, WSDOT, and private property owners. While detailed estimates are unavailable using current sources, previous estimates have established that public roads can account for roughly 30-‐‑50 percent of total impervious area and, furthermore, comprise the majority of public impervious lands. Based on these estimates, the proportion of public to private lands requiring retrofits could be roughly estimated at about 50 percent.
State Highways
WSDOT reports that most of its highways were built before stormwater regulations, and is incrementally addressing this problem through retrofit of the areas in most need.33 Since it began tracking in 2010, WSDOT has retrofitted approximately 16 acres of impervious surface.34 The state road system in the Puget Sound basin comprises 1,965 centerline miles, much of which were constructed before the mid-‐‑1990s when current stormwater standards were established. In preparation for a major stormwater retrofit initiative, WSDOT has completed an extensive stormwater retrofit prioritization effort on state highways within the Puget Sound basin. The three step prioritization process was developed collaboratively with the Department of Ecology, US Fish and Wildlife Service, and NOAA Fisheries staff. As high priority highway segments are identified, WSDOT region staff are scoping these stormwater retrofit projects. WSDOT estimates this scoping process will identify $40-‐‑50 million in projects which would retrofit the highest-‐‑priority highway segments in Puget Sound. These are likely particularly efficient early effort targets. The extent of retrofit need suggests allowing any actions to proceed that will reduce the problem, such as public and private redevelopment or related efforts to achieve improved benefits per dollar spent. While redevelopment of state highways does occur, extensive areas in need of retrofit are identifiable that are
33 WSDOT. 2013. 2013 Stormwater Report. October. 34 Ibid.

Funding Strategy for the Strategic Initiatives from the 2012-2013 Puget Sound Action Agenda
Volume 2: Technical Report 55
unlikely to be addressed solely through redevelopment. Highways are particularly problematic for stormwater because of the extent of impervious surface, types of pollutants, and loads of pollutants for heavily trafficked routes. The WRIA 9 retrofit study identified the costs and extent of roads requiring retrofit in the Puget Sound Basin.
Figure 12. WSDOT Highways in Puget Sound Basin
Preliminary cost estimates for 100 percent retrofit of all roads and highways in the Puget Sound Basin, based on the WRIA 9 retrofit study, suggest $300 million annual capital costs under a 30-‐‑year program, or $90 million under a 100 year program (Table 19). Operation and maintenance, as well as inspection and enforcement costs accrue after construction. Of these areas, approximately 1/3rd are state-‐‑owned and 2/3rd locally-‐‑owned measured by surface area, or 1/10th state-‐‑owned and 9/10th locally-‐‑owned by length. Stormwater costs for roads are primarily a function of surface area, so by such measures, $100 million would be the annual capital cost for a 30-‐‑year program, which is also approximately 1/3rd of all three cost categories under a 100-‐‑year program. Similar to discussion of the retrofit analyses above, it is unlikely efficient to attempt to retrofit 100 percent of the area, so a 50 year retrofit program of $100 million would likely provide a substantial effect for problems caused by state-‐‑owned highways.
3.2.3 Public vs. Private Retrofit Costs
Private Retrofit Costs
The 319,409 acres of total impervious area that may require retrofitting includes both public and private lands. Control of urban stormwater runoff from existing

Funding Strategy for the Strategic Initiatives from the 2012-2013 Puget Sound Action Agenda
Volume 2: Technical Report 56
impervious will be partially achieved though the future construction of stormwater facilities required for new and redevelopment. Stormwater Retrofit Implementation Strategies for Water Resources Inventory Area (WRIA) 9 (referred to as ‘WRIA 9 Retrofit Study’ hereafter) suggests that roughly 50 percent of the WRIA 9 study area will have new stormwater facilities built as part of new or redevelopment. Assuming a new and redevelopment rate of 1.6% per year, King County estimates that facilities would be built over most of the area, except road and highways (which are primarily in public ownership), within about 60 to 80 years. Seattle Public Utilities recently provided an estimate of a 1% annual rate of redevelopment as a rough approximation.
Applying this 50% redevelopment assumption to the total acreage of impervious land requiring retrofits, we can assume that 159,705 of the total 319,409 acres will be addressed by new and redevelopment. Furthermore, it is reasonable to assume and that most of this cost will accrue to private entities:
• The new NPDES permits require that LID be used, wherever feasible, for stormwater management during new development and redevelopment (2013-‐‑2018 Phase I and II Municipal Stormwater Permits, 2013). This places more responsibility for stormwater treatment and flow control from impervious surfaces on private entities, instead of the current system in which stormwater runoff is often routed to regional stormwater control facilities maintained by local governments.
• Many public redevelopment activities, such as road resurfacing and bridge and culvert replacements, do not create sufficient new impervious surface to meet the threshold for a retrofit (Bissonnette 2010)
Even though private entities will bear most of the up-‐‑front, capital retrofit costs, new and redevelopment will also entail increasing public expenditures associated with inspection and enforcement (I&E) of these additional facilities (WRIA 9 Retrofit Study). As for private operations and maintenance costs, public costs associated with I&E programs would be anticipated to increase annually as these facilities are constructed.
Table 19. Full Puget Sound Basin Road Retrofit Costs (Millions)
Source: WRIA 9 Retrofit Study 2014. Future costs are not discounted. All calculations by WRIA 9 Retrofit Study but not yet published.

Funding Strategy for the Strategic Initiatives from the 2012-2013 Puget Sound Action Agenda
Volume 2: Technical Report 57
To further support this rough approximation of total cost ownership, Bissonnette estimates (based on limited examples) that the proportion of impervious area in public and private ownership at roughly 50 percent each.
The actual degree of accomplishment via private redevelopment is sensitive to codes, compliance, enforcement, and exemptions. Some proposals such as in-‐‑lieu fee programs are designed to address these cost and improvement issues. Depending on future program conditions, the costs and level of benefit from private activity might vary considerably.
Public-Private Retrofit Relationships
Relying solely on new and redevelopment, will not accomplish all of the retrofitting that will be required to meet Puget Sound water quality goals.35 Additional targeted actions will be necessary. Some of these costs might be relatively inexpensive such as street sweeping and legacy loads, but public roads retrofits will have substantial costs. Public roads comprise the majority of public impervious lands36, and therefore represent a reasonable target for a public program to address the remaining portion of retrofits not addressed by new and redevelopment.
There is some discussion about potential efficiencies for public vs. private ownership and responsibility for stormwater facilities. Fee-‐‑based programs, such as King County’s in-‐‑lieu fee program for wetlands, can ease private compliance and fund public projects. Public ownership, given sufficient permit or code flexibility, might offer opportunities to target the most cost-‐‑effective control opportunities. Such banking or concentrated investments might be done privately. Philadelphia and Washington D.C. support such programs that encourage private investment in cost-‐‑effective retrofit or mitigation strategies.37
A major cost category in the WRIA 9 retrofit study is public costs for inspection and enforcement. These costs would likely be reduced with fewer facilities,
35 Booth, D., C. Crawford, B. Derry, C. Hinman, R. Horner, C. May, B. Moore, J. Richey, P. Roni, B. Wulkan. 2007. Stormwater Runoff and Puget Sound – Problems, Issues and Analyses Needed. Puget Sound Partnership. http://faculty.washington.edu/rturner1/BIS293/Stormwater.doc.
36 Bissonette 2010. 37 Valderrama, A. and L. Levine. 2012. Financing Stormwater Retrofits in Philadelphia and Beyond. Natural Resource Defense Council. http://www.nrdc.org/water/files/StormwaterFinancing-‐‑report.pdf; Garrison, N., and K. Hobbs. 2011 Rooftops to Rivers II: Green Strategies for Controlling Stormwater and Combined Sewer Overflows. National Resources Defense Council. http://www.nrdc.org/water/pollution/rooftopsii/

Funding Strategy for the Strategic Initiatives from the 2012-2013 Puget Sound Action Agenda
Volume 2: Technical Report 58
whether compliance is pooled privately or publicly. Public ownership can also reduce these costs, though there would likely be direct tradeoffs with increased administration costs.
3.3 Shellfish
3.3.1 Near Term Shellfish Costs In the absence of a long-‐‑term program plan for shellfish restoration, actions and costs of actions were extrapolated from the three-‐‑year costs estimated for shellfish near-‐‑term actions and the costs described in DOH’s 2013 work plan for and EPA pathogen grant. Both sources include a mix of one-‐‑time and continuing costs, with neither intended to define a comprehensive long-‐‑term shellfish program. However, they are the best available sources for program activities and cost estimates. In time, these estimates should be upgraded through a more systematic approach to identifying a shellfish restoration program.
The 2012/2013 Action Agenda includes nine actions to describe the NTAs of the Shellfish Initiative. These cost estimates are summarized in Table 20.
Table 20. Three Year Costs of NTAs associated with the Shellfish Strategic Initiative
Source: PSP, State of the Sound 2013
Information on recurrent costs is also available through the description of program activities in the DOH’s 2013 Pathogen Grant Work Plan, which presents the current and proposed work on shellfish restoration being undertaken using an EPA National Estuary Program grant. The DOH plan is a more detailed and accurate description of the shellfish restoration program that is currently being implemented than the Action Agenda description.
Action Number Description Total Cost
B3.1.2 Outfall strategy on state-owned lands $411,000
C1.5.1 No discharge zone evaluation/petition $241,000
C1.6.3 Water quality enforcement $850,000
C3.2.1 Priority areas for incentives $60,000
C5.3.1 OSS homeowner loan program $217,000
C5.3.2 OSS program funding source $195,000
C7.1.3 Pollution control action team $1,299,000
C7.3.3 Shellfish model permitting program $279,000
C9.4.1 Pollution ID & correction programs $4,924,000
Total $8,476,000

Funding Strategy for the Strategic Initiatives from the 2012-2013 Puget Sound Action Agenda
Volume 2: Technical Report 59
3.3.1 Long Term Shellfish Action Costs
On-Site Sewage Systems
Nonpoint pollution sources are the most frequent cause of harvest restrictions, being implicated in 18 of the 26 restricted areas. The costs of addressing nonpoint sources is likely to be a factor of the number of pollution sources, the costs of individual repair or replacement actions, and the frequency of the actions. On-‐‑site sewage systems (OSS) or septic systems are generally held to be one of the primary pollutant sources of concern for shellfish bed recovery.
DOH is currently evaluating funding sources for septic system repair and replacement (as specified in action C5.3.1) and has identified the annual costs for fully capitalizing a sustainable septic loan program.38 A loan, rather than a grant, program is the focus because of the private ownership and therefore responsibility associated with the septic systems of concern. DOH estimated the cost per OSS repair or replacement loan to range from $5,000 to $12,000 with $9,000 as the most likely average. Based on the identified needs for Puget Sound, the DOH study estimates an annual cost of $2 to $3 million declining over time until a 10-‐‑year total cost of $22 to $29 million, but gradually recovering loan repayments for a declining net cost after 10 years.
DOH is also evaluating long-‐‑term funding strategies for local septic management programs at the county level (as specified in action C5.3.2). The current estimate is that the current funding need of $14 million will need to ramp up to $20-‐‑24 million per year to sustain these programs.
Pollution Identification and Correction
Pollution Identification and Correction (PIC) programs are locally-‐‑targeted efforts to identify pollution sources affecting shellfish beds. These involve intensive local studies. The 2012/2013 Action Agenda identified three-‐‑year costs of $4.9 million for PIC studies, which equates to $1.6 million per year. DOH staff indicate that this is a very low estimate for a sustained program, and have suggested that total costs could be closer to $10 to $20 million per year39. Due to the potential for new pollution sources to arise, it seems appropriate to assume this cost would continue over the long term.
38 WA Department of Health. 2014. Puget Sound Septic Financing Assessment. June 4. 39 Personal communication with Stuart Glasoe, September 2014.

Funding Strategy for the Strategic Initiatives from the 2012-2013 Puget Sound Action Agenda
Volume 2: Technical Report 60
Wastewater Treatment Plants
Wastewater treatment plants (WWTPs) are thought to be responsible for the majority of the Sound’s prohibited shellfish growing areas. They are implicated in 14 of the 26 restricted basins, although they are the sole cause cited in only 7 cases. In cases that WWTPs are discharging effluent that is insufficiently treated to eliminate pathogens, it is either because they were designed and built to obsolete standards or because they are failing to perform to design and permit standards due to age or other circumstances.
A cursory analysis of WWTPs in restricted basins using the Department of Ecology’s Water Quality Permitting and Reporting Information System (PARIS) indicates that the facilities vary greatly in size, from the plant handling all of Olympia’s wastewater to plants for small industrial plants. The costs of repairs or retrofits for such a mixed group of facilities cannot be generalized but will need to be calculated individually.
While WWTPs are subject to periodic re-‐‑permitting under the NPDES, costs of compliance for WWTP upgrades can be daunting. These costs can be some o the greatest for communities in terms of improvements to Puget Sound. But these WWTP upgrades are not primarily targeted at achieving shellfish bed recovery and while extremely relevant to the overall Action Agenda, are not core to the particular actions under focus in this Strategic Initiative. This prioritization may however change over time.
Marinas
Marinas have been implicated in 9 of 26 restricted basins, but never as the sole reason for the restrictions.
The author’s presumption is that the principal issues with marinas and shellfish are the discharge of untreated and undertreated waste from shore-‐‑based restroom facilities and the discharge of untreated or insufficiently treated sewage from boats.
Discharge of untreated sewage from boats is illegal in Puget Sound, but the regulation is difficult to enforce. Some boats predate the regulation and may not have approved marine sanitation devices (MSDs) installed. Even on boats with MSDs, users may not understand the systems and may inadvertently discharge untreated waste.
Direct discharge of effluent from certain MSDs is currently allowed under state law, but measures are currently being taken to establish a no-‐‑discharge zone for the Sound that would prevent these discharges, which have been demonstrated to result in nutrient and pathogen pollution.

Funding Strategy for the Strategic Initiatives from the 2012-2013 Puget Sound Action Agenda
Volume 2: Technical Report 61
The 2020 actions for marinas are presumed to include the one-‐‑time costs associated with the no-‐‑discharge zone proposal plus the ongoing costs to install and repair pump-‐‑out stations.
Interestingly, a 2012 report by Herrera for the Washington Department of Ecology40 concluded that the number of current pump-‐‑out stations far exceeded the estimated demand for such facilities for recreational boaters. No findings for commercial users were possible given constraints in the study design.
Agriculture BMPs
The DOH 2013 Pathogen Grant Work Plan cited earlier estimates a cost of $250,000 per year for agriculture BMPs. Given the abundance of agricultural land upstream of shellfish beds and the costs of BMPs, this appears to be a very low estimate. A more detailed assessment of the program and costs is beyond the scope of this project, but a very preliminary estimate of $2 million per year has been used in this assessment. These costs of BMPs and conservation on farmland do contribute to shellfish recovery and protection, but the primary benefits address more general habitat and water quality objectives.
Summary of Estimated Long Term Shellfish Initiative Costs
The well-‐‑defined components of the Shellfish Initiative suggest a long-‐‑term public annual cost that includes:
• $3 million for the OSS loan program (for at least 10 years); • $24 million for local septic management programs (indefinitely); • $10 to $20 million for pollution identification and correction (PIC)
programs (indefinitely).
In addition, long-‐‑term costs will include funding needs associated with several actions that have not been fully described or estimated, including improvements in wastewater treatment facilities, upgrades in marinas, and agricultural best management practices. These could result in a very substantial increase in the estimated cost of the shellfish program as a whole.
40 Herrera Environmental Consultants, 2012; Puget Sound No Discharge Zone for Vessel Sewage

Funding Strategy for the Strategic Initiatives from the 2012-2013 Puget Sound Action Agenda
Volume 2: Technical Report 62
4 Historical and Current Funding of the Strategic Initiatives
4.1 Habitat Table 21. Costs and current funding for Three-Year NTAs Associated with the Habitat Strategic Initiative (2013-2015)
Source: PSP, State of the Sound 2013
Action Number Description Total Cost Funded or
Budgeted Gap
A1.2.1 Land Use Planning Barriers, BMPs and Example Policies
$30,000 $0 $30,000A1.3.1 Address Regulatory Exemptions $30,000 $29,000 $1,000A4.2 Provide for growth (All NTAs) $- $0 N/A
A5.1.1 Floodplain Protection and Policy Team Actions $877,000 $981,000 $0A5.3.4 Levee Vegetation $2,708,000 $2,708,000 $0
A6.1 Implement Salmon Recovery 3-year Workplans (All NTAs)
$384,524,000 $123,223,000 $261,301,000A6.1.1 Secure Annual Chinook Investment $360,364,000 $113,114,000 $247,250,000A6.1.2 Restoration Permit Barriers $50,000 $50,000 $0A6.1.3 BNSF Railroad Cooperative Agreement $265,000 $38,000 $227,000A6.1.HC6 Hood Canal Salmon Recovery $664,000 $0 $664,000A6.1.SJI9 San Juan County Lead Entity $2,116,000 $2,116,000 $0A6.1.STRT1 Elwha River Ecosystem Recovery $2,687,000 $100,000 $2,587,000A6.1.STRT2 Straits Salmon Recovery Plans $18,378,000 $7,805,000 $10,573,000
A6.1.WS9 West Sound SR3 Chico Creek Culvert Replacement
$- $0 N/AA7.1 Protect and Restore Stream Flows (All NTAs) $4,895,000 $3,080,000 $1,815,000
A7.1.1 Set Instream Flows in Priority Watersheds $1,500,000 $900,000 $600,000A7.1.2 PEP Development and Implementation $- $0 N/AA7.1.3 Water Code Compliance and Enforcement $1,395,000 $1,280,000 $115,000A7.1.STRT6 Strait Instream Flow Rules $2,000,000 $900,000 $1,100,000
B1.2.1 Update Local Shoreline Master Program $9,272,000 $9,020,000 $252,000B1.3.2 Hydraulic Code Rules Revision $225,000 $77,000 $148,000B2.1.1 Protect 10% of Bluff-Backed Beaches $15,000 $15,000 $0
B2.2.1 Implementation of Projects Identified by PSNERP
$1,565,000 $1,565,000 $0
B2.3.1 Homeowner Incentives for Landward Setbacks
$48,000 $48,000 $0
B5.3.2 Invasive Species Early Detection and Monitoring
$21,000 $21,000 $0C8.1.2 Evaluate Risk Assessments for Update Needs $495,000 $225,000 $270,000
Total $404,705,000 $140,992,000 $263,817,000

Funding Strategy for the Strategic Initiatives from the 2012-2013 Puget Sound Action Agenda
Volume 2: Technical Report 63
4.1.1 Near Term Funding The 2013 State of the Sound report attempted to identify the available and budgeted funding for the 2013-‐‑15 fiscal years and the funding gap. This information is summarized in Table 21.
4.1.2 Core Habitat Funding Trends
Funding for Salmon recovery in Puget Sound comes from a wide variety of sources. Federal funding programs are administered by a variety of agencies, have varying requirements for state and local matching funds, and are focused on many objectives. Some of the programs, such as the Pacific Coastal Salmon Recovery Fund, focus specifically on salmon recovery goals, while others are focused on only certain types of habitat (e.g., instream flows or nearshore). Others have broader mandates, such as maintenance of parks and/or recreation areas, in addition to fish and wildlife habitat.
In a trend that began with the first salmon recovery funding in fiscal year 2000, a great deal of funding for salmon habitat restoration in Washington State has come from direct federal appropriations to the salmon recovery plan via the NOAA Pacific Coastal Salmon Recovery Fund program. This source dates back to the FY 2000 budget and was championed by Senator Slade Gorton and Congressman Norm Dicks, both very senior members of key appropriations committees who have since left Congress. After receiving $110 million at its peak in fiscal year 2002, the five-‐‑state program has been hovering between $65 and $80 million in recent years. Washington state has received $18 to $30 million each year and coastal tribes have received an additional $5 to $11 million.
At the federal level, major programs and funding sources include: • The EPA’s National Estuary Program • NOAA’s Coastal and Estuarine Lands Conservation Program • National Parks Service Land & Water Conservation Grants • Pacific Coast Salmon Recovery Fund • NOAA Species Recovery Grants • Partners for Fish and Wildlife Program • Puget Sound Nearshore Ecosystem Restoration Project (PSNERP)
The state lagged in early funding of the salmon recovery effort but has stepped up funding levels since 2007. At the state level, over 20 different funding programs administered by seven agencies support projects related to salmon habitat protection and restoration. Major state programs and funding sources include:
• DNR Land Acquisition Grants

Funding Strategy for the Strategic Initiatives from the 2012-2013 Puget Sound Action Agenda
Volume 2: Technical Report 64
• Forest Riparian Easement Program • Puget Sound Estuary and Salmon Restoration Program (ESRP) • Puget Sound Acquisition and Restoration Program (PSAR)
• Salmon Recovery Funding Board Programs • Road Maintenance and Abandonment Plan • Community Partnership Restoration Grants • Conservation Reserve Enhancement Program • Family Forest Fish Passage Program • Watershed Plan Implementation and Flow Achievement Program
• Water Irrigation Efficiencies Program • Washington Wildlife & Recreation Program Grants
• Aquatic Lands Enhancement Grants Local governments and community organizations have provided a considerable amount of local match through a combination of local utility sources, general funds, and philanthropic programs such as the National Fish and Wildlife Foundation’s Community Salmon Fund, which distributed more than $25 million in small grants for salmon recovery in Washington.
An estimate of total funding administered by the Salmon Recovery Funding Board, by level of government (note that these estimates only include the required 15 percent match, which tends to under-‐‑report matching funds from both federal and local sources), through fiscal year 2012 is shown in Figure 13.41
According to the Puget Sound Recovery Plan (2005), average annual funding for salmon recovery in Puget Sound at the time amounted to $60 million. Annual funding from sources that are expressly for salmon projects and programs — such as the Salmon Recovery Funding Board (SRFB)— generally amounts to $20-‐‑25 million. Sources that are not salmon-‐‑focused but have been used extensively for salmon projects in recent years (including funding from local surface water management programs, U.S. Army Corps of Engineers restoration programs, and a wide variety of local, state, and federal environmental grant programs) contribute at least $40 million per year.
41 This includes funds administered by the Salmon Recovery Funding Board through the Pacific Coastal Salmon Recovery Fund, salmon recovery fund (state match), Puget Sound Acquisition and Restoration fund, Family Forest and Fish Passage Program, Estuary and Salmon Restoration Program, federal Puget Sound Chinook critical stock program, and hatchery reform. Thus, it is does not reflect all funding for habitat restoration, and includes some funding – such as hatchery funding -‐‑ that isn’t directed at habitat restoration.

Funding Strategy for the Strategic Initiatives from the 2012-2013 Puget Sound Action Agenda
Volume 2: Technical Report 65
Figure 13. Public funding levels for salmon recovery in Puget Sound, 1999-2012
Source: Washington State Recreation and Conservation Office, State of the Salmon in Watersheds Report 2012
The NOAA Fisheries Puget Sound Chinook Salmon Recovery Plan 2011 Implementation Status Assessment Final Report (2011), meanwhile estimated three-‐‑year funding available for planned capital projects at $326 million (31% of the amount needed to accomplish the work). For non-‐‑capital programs, the funding available was estimated to be only $18 million, or 20% percent of the need. Funding for Salmon Recovery in Washington State (Evergreen Funding Consultants, 2011) consulted Puget Sound regional staff who indicated that annual funding of roughly $48 million is available for capital needs, and $5 million per year for non-‐‑capital needs. In line with the NOAA Fisheries estimate, these results suggest that that existing funding levels would support less than one-‐‑third of the projected recovery plan costs. The most important sources of funding identified by regional staff are shown in Figure 2.
$20
$36
$44
$25
$8
$28 $29
$18
$61
$37
$61
$33 $34
$12
$0
$10
$20
$30
$40
$50
$60
$70
1999 2000 2001 2002 2003 2004 2005 2006 2007 2008 2009 2010 2011 2012
Annu
al F
undi
ng ($
Mill
ions
)
State Federal Local Match Total

Funding Strategy for the Strategic Initiatives from the 2012-2013 Puget Sound Action Agenda
Volume 2: Technical Report 66
Figure 14. Funding Sources for Salmon Recovery in Puget Sound, 2010
Source: EFC 2011
A certain portion of ongoing program costs for interested entities, such as WDFW and Ecology, may contribute to salmon habitat recovery. This funding, has been fairly stable over the last couple of years, especially given general economic conditions.
Floodplains
In 2013 the Department of Ecology was successful in securing legislative funding through the Floodplain by Design (their partnership with TNC, PSP, etc., etc.) effort. Ecology was given $38.7 million to advance integrated floodplain projects in Puget Sound (the nine, ‘Coordinated Investment for Puget Sound Floodplains’ project described in the ‘costs’ section) and an additional $11.25 million for a statewide Floodplains by Design competitive grant program. The total Puget Sound apportionment of these funds for 2013-‐‑2015, including operations/administration within Ecology, is $47.73 million. A certain portion of the PSP, WDFW, and DNR’s operating budgets are unaccounted for, but estimates from OFM have placed the floodplain portions of these agencies’ operating budgets at about $2-‐‑5 million dollars each. During the 2015-‐‑2017 legislative budget process, Ecology will request additional funding for a package of restoration projects. This represents a new stream of funding that was not previously allocated to floodplains.
Given that floodplain protection and restoration projects are also conducted as part of the regional salmon recovery plans, we can assume that a portion of the annual $60 million spent goes towards floodplains. If the roughly 40% of this sum (capital, and non-‐‑capital), in accordance with the percentages reported in ECF 2011 (see cost section), were spent on floodplains, this might equate to $24 million annually.
Funding Source Percent of Funding
PSAR 30%Local Government 27%SFRB 14%Other State 12%Other Federal 9%Special Districts 8%Other State Sources 29%PSAR 27%Local Government 20%SFRB 16%Special Districts 7%Other Federal Sources 1%
Non
-Cap
ital
Activ
ities
Capi
tal
Activ
ities

Funding Strategy for the Strategic Initiatives from the 2012-2013 Puget Sound Action Agenda
Volume 2: Technical Report 67
Of the projects funded by the Salmon Recovery Funding Board (available through RCO’s PRISM database) through the Pacific Coastal Salmon Recovery Fund, salmon recovery fund (state match), Aquatic Lands Enhancement account, Puget Sound Acquisition and Restoration fund, Washington Fish and Wildlife program and the Estuary and Salmon Restoration Program, those that include reference to floodplain functions add up to approximately $95 million for the years 2000 through 2013. This equates to roughly $7 million, annually, with higher, more consistent funding allocations since 2007. While this database is by no means complete, it does provide a lower bound estimate.
Over the last ten years, funding for floodplain protection and restoration has been between $7 to $25 million on an annual basis. Assuming the continuation of the heightened state allocation gained during 2013-‐‑2015 budget cycle and planned for the 2015-‐‑2017 cycle, it is reasonable to expect roughly $25 million a year for floodplain protection and management in Puget Sound, going forward.
Culverts
Funding for the WSDOT and WDFW culvert retrofit programs in recent funding cycles has amounted to $36-‐‑50 million biennially (or $18-‐‑25 million a year).42 There is currently no established funding plan for WSDOT to addressing the total court-‐‑ordered retrofit responsibilities. It is anticipated that culverts operated by the state Departments of Fish and Wildlife and Natural Resources, along with State Parks, will be corrected with traditional state funding sources.
4.2 Stormwater
4.2.1 Near Term Funding The 2013 State of the Sound report identifies the available and budgeted funding for the 2013-‐‑2015 fiscal years and the funding gap. This information is summarized in Table 22.
42 WDFW and WSDOT. http://wdfw.wa.gov/publications/00049/wdfw00049.pdf and http://www.wsdot.wa.gov/NR/rdonlyres/11D6A32A-‐‑E036-‐‑4FF1-‐‑9501-‐‑8535DFFEA769/0/Folio_FishPassage.pdf

Funding Strategy for the Strategic Initiatives from the 2012-2013 Puget Sound Action Agenda
Volume 2: Technical Report 68
Table 22. Costs and Current Funding for NTAs Associated with the Stormwater Strategic Initiative
4.2.2 Core Stormwater Funding Trends
NPDES Permit Funding
Local Jurisdictions
Stormwater utility fees collected and used by local NPDES permit holders provide roughly 90 percent of the funding for stormwater activities in Puget Sound associated with NPDES permit compliance. The fees fund local programs that directly and indirectly address stormwater pollution and water quality management goals as a whole. By some definitions, 50 to 80 percent of stormwater utility revenue in Puget Sound is directly spent on NPDES permit compliance, with the remainder addressing related education, watershed, and surface water issues.43 Permit requirements vary among jurisdictions, particularly between Phase I and Phase II communities. Consequently fee revenue funds capital investments, operation and maintenance, inspection and enforcement, monitoring, education, watershed projects, and other community-‐‑
43 Bissonette 2010.
Action Number Description Total Cost Funded or
Budgeted Gap
C1.1.3 Fish Consumption Rates $1,110,000 $1,110,000 $0
C2.1.1 Watershed Based Stormwater Management
$46,000 $10,000 $36,000C2.2.1 NPDES Municipal Permits $1,974,000 $1,974,000 $0
C2.2.3 Stormwater Management Outside Permitted Areas
$224,000 $0 $224,000C2.3.1 Stormwater Retrofit Projects $14,828,000 $14,828,000 $0C2.4.1 Compliance Assurance Program $391,000 $0 $391,000C2.5.1 LID Training and Certification $1,938,000 $1,938,000 $0
C2.5.2 Education for the Next Generation of Stormwater Professionals
$5,700,000 $0 $5,700,000D6.1.1 Phase 2 of Puget Sound Starts Here $1,280,000 $1,280,000 $0
Total $27,491,000 $21,140,000 $6,351,000
Stormwater Utilities “A stormwater utility is essentially a special assessment district set up to generate funding specifically for stormwater management. Users within the district pay a stormwater fee, and the revenue thus generated directly supports maintenance and upgrade of existing storm drain systems; development of drainage plans, flood control measures, and water-quality programs; administrative costs; and sometimes construction of major capital improvements. Unlike a stormwater program that draws on the general tax fund or uses property taxes for revenue, the people who benefit are the only ones who pay.” Source: J. Kaspersen, Editor. 2000. The Stormwater Utility: Will It Work in Your Community? Stormwater Journal. Nov-Dec.

Funding Strategy for the Strategic Initiatives from the 2012-2013 Puget Sound Action Agenda
Volume 2: Technical Report 69
based objectives for water quality and watersheds. In this way, spending that might be difficult to categorize as narrowly focused on stormwater pollution is likely generating multiple benefits that are compatible with other objectives of the Action Agenda for watershed scale improvement and habitat quality.44
Figure 15. Annual Stormwater Fees per Household
Local stormwater utility fees are set to meet cost requirements. NPDES permit requirements drive revenue needs and therefore rate structures. While rate structures capture some variation with respect to amount of impervious surface and possibly intensity of use (e.g. residential vs. commercial), they do not necessarily capture the full cost of each property. They generally represent per-‐‑household division of jurisdiction-‐‑level stormwater and related surface water management costs. These cost drivers result in highest total stormwater revenue per-‐‑household and overall by jurisdiction in Phase I communities (Figure 15, Table 23). Stormwater management can have relatively high fixed (as opposed to variable) costs particularly for capital but also monitoring and other categories. In this way some small Phase II communities can face high or rapidly increasing per-‐‑household stormwater costs.
44 E.g, habitat projects funded by King County fees: King County Surface Water Fee Facts. http://your.kingcounty.gov/dnrp/library/water-‐‑and-‐‑land/rate-‐‑study/swm-‐‑fee-‐‑fact-‐‑sheet-‐‑2013.pdf.
Thurston
Pierce
Island
San Juan
Whatcom
Skagit
King
Clallam
Kitsap
Mason
Jefferson
Snohomish
Annual Stormwater Fee
for a Single Family Home ($)
Sources: Association of Washington Cities Tax
and User Fee Survey 2012, and Western
Kentucky University Stormwater Utility Survey 2013
18 - 52
53 - 98
99 - 138
139 - 175
176 - 214

Funding Strategy for the Strategic Initiatives from the 2012-2013 Puget Sound Action Agenda
Volume 2: Technical Report 70
Table 23. Stormwater/Surface Water Fees and Fee Revenue by Permit Holder, Puget Sound Basin
Name NPDES Permit6
Annual Fee for a Single Family Home
Sources1-5 Total Stormwater Utility Revenue in 20127
Algona Phase II $66 1,2 $233,557 Anacortes Phase II $60 1,2 $782,548 Arlington Phase II $83 1,2 $726,851 Auburn Phase II $170 1,2 $7,357,501 Bainbridge Island Phase II $156 1,2 $1,940,468 Bellevue Phase II $116 1,2 $16,374,529 Bellingham Phase II $168 1,2 $4,903,909 Black Diamond Phase II $156 2 $284,647 Blaine N/A $52 1,2 $290,031 Bonney Lake Phase II $168 1,2 $1,600,221 Bothell Phase II $127 2 $3,403,610 Bremerton Phase II $104 1,2 $2,203,738 Brier Phase II $69 1,2 $167,477 Buckley Phase II $212 2 $392,327 Burien Phase II $117 2 $2,543,590 Burlington Phase II $76 2 $1,022,908 Clallam County N/A $36 5 No Data Clyde Hill Phase II Unknown No Fee Data Available No Data Covington Phase II $175 2 $1,731,685 Des Moines Phase II $151 2 $2,484,970 DuPont Phase II $128 2 $776,087 Duvall Phase II $210 1,2 $618,821 Eatonville N/A Unknown No Fee Data Available $111,151 Edgewood Phase II $40 1,2 $647,109 Edmonds Phase II $126 2 No Data Enumclaw Phase II Unknown No Fee Data Available No Data Everett Phase II $146 1,2 No Data Federal Way Phase II $85 1,2 $3,570,113 Ferndale Phase II $132 1,2 $26,974 Fife Phase II $24 1,2 $706,283 Fircrest Phase II $108 1,2 $374,485 Friday Harbor N/A $152 2 $459,499 Gig Harbor Phase II $155 1,2 $748,159 Gold Bar N/A Unknown No Fee Data Available $31,908 Granite Falls Phase II $108 1,2 $129,541 Island County N/A $39 3 $422 Issaquah Phase II $169 1,2 $4,169,473 Kenmore Phase II $167 2 $1,640,281

Funding Strategy for the Strategic Initiatives from the 2012-2013 Puget Sound Action Agenda
Volume 2: Technical Report 71
Kent Phase II $121 1,2 $16,507,757 King County Phase I $172 1,2 $18,330,799 Kirkland Phase II $170 1,2 $8,397,890 Kitsap County Phase II $70 1,2 $7,148,113 La Conner N/A $158 2 $164,119 Lacey Phase II $86 1,2 No Data Lake Forest Park Phase II $188 2 $847,680 Lake Stevens Phase II $104 2 $1,374,429 Lakewood Phase II Unknown No Fee Data Available $2,732,964 Langley N/A Unknown No Fee Data Available $201,199 Lynden Phase II $76 2 $486,571 Lynnwood Phase II $86 1,2 $2,381,254 Maple Valley Phase II $115 2 $1,169,444 Marysville Phase II $122 1,2 $4,095,084 Medina Phase II Unknown No Fee Data Available No Data Mercer Island Phase II $180 2 $1,682,829 Mill Creek Phase II $78 2 $696,972 Milton Phase II $186 1,2 $716,331 Monroe Phase II $108 1,2 $1,517,432 Mount Vernon Phase II $73 2 No Data Mountlake Terrace Phase II $97 1,2 $1,431,462 Mukilteo Phase II $94 1,2 $1,262,267 Newcastle Phase II $180 2 $843,036 Normandy Park Phase II $192 2 $558,624 North Bend N/A $148 1,2 $768,034 Oak Harbor Phase II $92 1,2 $1,380,231 Olympia Phase II $127 1,2 $4,170,444 Orting Phase II $108 1,2 $702,481 Pacific Phase II $129 1,2 No Data Pierce County Phase I $144 1,2 $18,332,307 Port Angeles Phase II $144 1,2 $735,531 Port Orchard Phase II $84 1,2 $688,856 Port Townsend N/A Unknown No Fee Data Available $520,016 Poulsbo Phase II $98 2 $783,275 Puyallup Phase II $125 2 $3,836,559 Redmond Phase II $199 1,2 $10,802,777 Renton Phase II $138 2 $7,742,090 Ruston N/A Unknown No Fee Data Available $30,713 Sammamish Phase II $150 2 $2,498,951 San Juan County N/A $46 1,2 $407,855 SeaTac Phase II $83 2 $1,783,281 Seattle Phase I $206 2 $77,133,415

Funding Strategy for the Strategic Initiatives from the 2012-2013 Puget Sound Action Agenda
Volume 2: Technical Report 72
Sedro-Woolley Phase II Unknown No Fee Data Available $20,319 Shelton N/A $137 2 $717,277 Shoreline Phase II $142 1,2 $3,211,007 Skagit County Phase II $37 1,2 $97,035 Snohomish Phase II $122 1,2 No Data Snohomish County Phase I $90 4 No Data Snoqualmie Phase II $135 2 $798,891 Stanwood N/A Unknown No Fee Data Available $450,196 Steilacoom Phase II $165 1,2 $498,730 Sultan N/A $96 2 No Data Sumas N/A $18 1,2 $15,137 Sumner Phase II $120 1,2 No Data Tacoma Phase I $214 1,2 $23,903,432 Thurston County Phase II $54 1,2 No Data Tukwila Phase II $102 2 $3,675,605 Tumwater Phase II $92 2 $1,343,244 University Place Phase II $72 1,2 $2,699,026 Whatcom County Phase II $48 5 No Data Woodinville Phase II $85 1,2 $1,111,215 Woodway N/A $150 1,2 $83,180
Yelm N/A $30 1,2 $83,616
Average Annual Fee: $118 Total: $306,025,855 Sources: 1 = Western Kentucky University Stormwater Utility Survey 2013
(http://www.awcnet.org/ResourcesResearch/Research/TaxandUserFeeSurvey.aspx) 2 = Association of Washington Cities Tax and User Fee Survey 2012
(http://www.wku.edu/engineering/civil/fpm/swusurvey/) 3 = Island County Public Works
(https://www.islandcounty.net/publicworks/clean_water_utility/docs/CWU%20Brochure%20-%20Final.pdf) 4 = Snohomish County (http://www.snohomishcountywa.gov/DocumentCenter/View/5727) 5 = San Juan County Public Works (http://sanjuanco.com/cdp/Stormwater/SW_Docs_Forms/SWAC_Docs/09-6-Pres-
Fin-analysis-final%20(2).pdf) 6 = Washington State Department of Ecology
(http://www.ecy.wa.gov/programs/wq/stormwater/municipal/MuniStrmWtrPermList.html) 7 = Unaudited data from the Washington State Auditor’s Office, Local Government Financial Report System
(http://portal.sao.wa.gov/LGCS/Reports/). Collected by summing all stormwater utility revenue for cities, towns and counties in Puget Sound (System Selection: Charges for Goods and Services, Physical Environment Related Fees, Other Utility Fees, Storm Drainage). Note that not all cities report revenue data, and that data is often missing between years; ‘No Data' indicates that no stormwater fee revenue was reported for 2012 in LGFRS.
Stormwater control activities can locally be spread across a variety of departments because stormwater can indirectly be associated with a wide range of public activities, including general public works and transportation. In this way, program or project elements might be designed for stormwater or flow control functions, or watershed functions in general, and might or might not be captured directly in identified stormwater budgets.

Funding Strategy for the Strategic Initiatives from the 2012-2013 Puget Sound Action Agenda
Volume 2: Technical Report 73
Ecology
The Washington State Department of Ecology (Ecology) issues municipal, industrial, and construction permits as the primary method of regulating stormwater. The Department of Ecology’s main stormwater activities are part of its Water Quality program. The average annual stormwater budget for Ecology has been increasing steadily, from $5.8 million in 2007 to $8 million in 2014 (Table 24). Stormwater represents 16 to 18 percent of Ecology’s overall water quality budget. Bissonette reported that approximately 80 percent of Ecology’s budget for administering the NPDES permit program (a subset of total stormwater budget) is expended in the Puget Sound basin.
Table 24. Ecology Stormwater and Water Quality Budgets
Source: WA Ecology. Budget and Program Overview. 2013-2015. December 2013.
Ecology receives revenue to fund water quality programs including stormwater from permit fees (as well as from other sources). For the 2011-‐‑2013 Biennium, Ecology received roughly $3 million apiece (statewide) from the three categories of industrial stormwater permits, construction stormwater permits, and municipal stormwater permits.45 Fees are structured to cover the costs of program administration. Overall state appropriations to Ecology for 2011-‐‑2013 for water quality permits was $37 million. Following the above proportions of water quality budget for stormwater, and stormwater budget within Puget Sound approximates to $5 million of the Ecology state appropriations for stormwater in Puget Sound.
WSDOT
WSDOT reports stormwater funding in its annual NPDES permit reports. For the 2011-‐‑2013 Biennium, it received $10 million in state appropriations to support its NPDES permit program, although it requested $15 million. WSDOT does receive
45 WA Ecology. 2013. Wastewater and Stormwater Discharge Permit Fee Program -‐‑ Report to the Legislature State: Fiscal Years 2012-‐‑2013. December.
2007$2009 2009$2011 2011$2013 2013$2015Stormwater Budget $11,684,727 $12,868,981 $13,043,084 $16,105,602
Change from Previous Funding Period $ $1,184,254 $174,103 $3,062,518Percent Change from Previous Funding Period 10% 1% 23%
Total ECY Water Quality Budget $72,920,624 $70,643,706 $73,693,880 $91,817,881Change from Previous Funding Period $ $$2,276,918 $3,050,174 $18,124,001
Percent Change from Previous Funding Period $3% 4% 25%Stormwater as Percentage of Total Water
Quality Budget 16% 18% 18% 18%
Funding Period
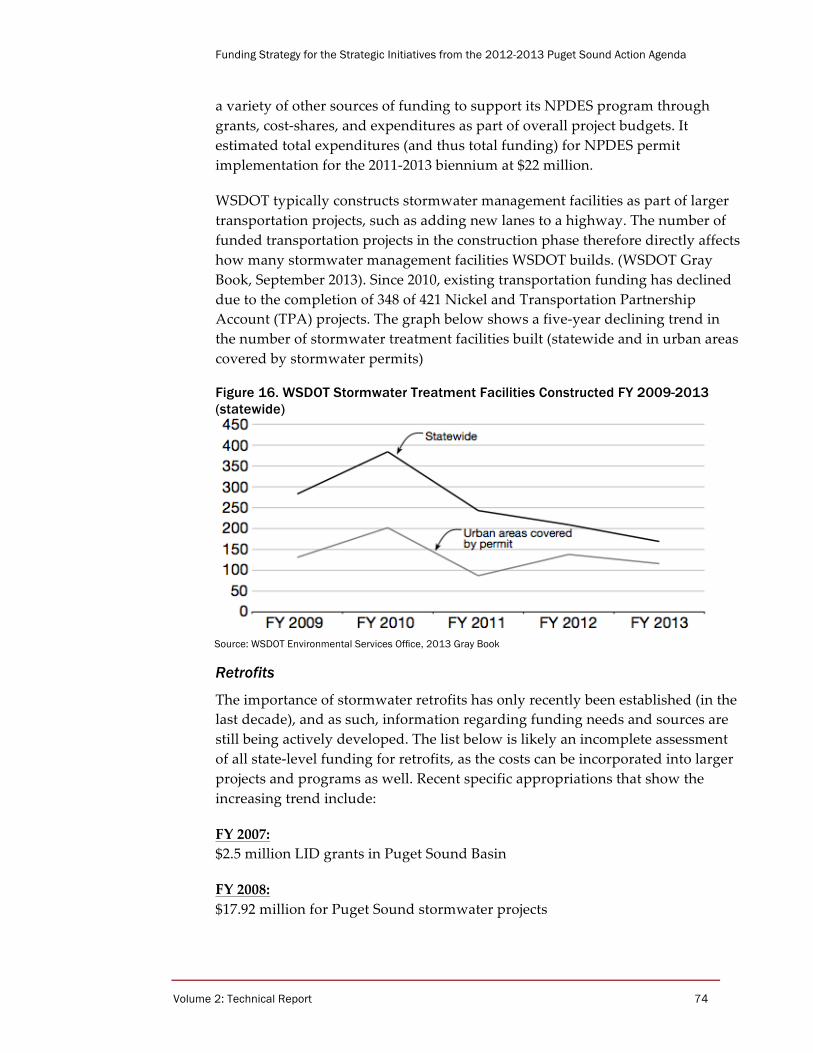
Funding Strategy for the Strategic Initiatives from the 2012-2013 Puget Sound Action Agenda
Volume 2: Technical Report 74
a variety of other sources of funding to support its NPDES program through grants, cost-‐‑shares, and expenditures as part of overall project budgets. It estimated total expenditures (and thus total funding) for NPDES permit implementation for the 2011-‐‑2013 biennium at $22 million.
WSDOT typically constructs stormwater management facilities as part of larger transportation projects, such as adding new lanes to a highway. The number of funded transportation projects in the construction phase therefore directly affects how many stormwater management facilities WSDOT builds. (WSDOT Gray Book, September 2013). Since 2010, existing transportation funding has declined due to the completion of 348 of 421 Nickel and Transportation Partnership Account (TPA) projects. The graph below shows a five-‐‑year declining trend in the number of stormwater treatment facilities built (statewide and in urban areas covered by stormwater permits)
Figure 16. WSDOT Stormwater Treatment Facilities Constructed FY 2009-2013 (statewide)
Source: WSDOT Environmental Services Office, 2013 Gray Book
Retrofits
The importance of stormwater retrofits has only recently been established (in the last decade), and as such, information regarding funding needs and sources are still being actively developed. The list below is likely an incomplete assessment of all state-‐‑level funding for retrofits, as the costs can be incorporated into larger projects and programs as well. Recent specific appropriations that show the increasing trend include:
FY 2007: $2.5 million LID grants in Puget Sound Basin
FY 2008: $17.92 million for Puget Sound stormwater projects

Funding Strategy for the Strategic Initiatives from the 2012-2013 Puget Sound Action Agenda
Volume 2: Technical Report 75
FY 2010: Centennial Clean Water Funds Stormwater projects: $1 million Puget Sound stormwater retrofits and LID construction projects: $3.4 million
FY2011: A total of $23.4 million through the FY 2011 Stormwater Retrofit and LID (SWRLID) Competitive Program, to local governments covered by the National Pollutant Discharge Elimination System (NPDES) Phase I and II Municipal Stormwater permits. This portion of the appropriation provides funds for permit holders to plan, design, and construct stormwater retrofit or low-‐‑impact development (LID) projects. Roughly 90% of this funding went to Puget Sound grantees.
FY2012: The 2012 State Legislature provided $67 million through appropriation provisions statewide via the Supplemental Statewide Stormwater Grant Program.46 It is assumed that 90% of this funding went to Puget Sound grantees.
FY2013: The 2013 Legislature provided up to $15 million dollars for cities and counties covered by one of the Phase I and II NPDES municipal stormwater permits to complete project-‐‑specific planning and design (pre-‐‑construction) activities. Eligible cities and counties are receiving funding offers up to $120,000 per community to develop pre-‐‑construction activities for stormwater retrofit/LID projects. [Max $10,800,000 for Puget Sound]
The 2013 Legislature provided $85 million ($95 million in competitive grants to local governments) and development of an ongoing comprehensive, statewide stormwater retrofit financial assistance program to be implemented in 2015. Additionally, $1.98M has been appropriated to Ecology for a Low Impact Development Training program.
Additionally, the 2013-‐‑2015 National Estuary Program Watershed Grant -‐‑ a federal funding source administered by Ecology -‐‑ includes $1,038,933 in competitive grant funding to support local governments, tribes, special purpose districts with stormwater retrofit planning & pre-‐‑design.
The past few years and funding cycles have seen increased state funding for
46 Dept. of Ecology. Supplemental Statewide Stormwater Grant Program. http://www.ecy.wa.gov/programs/wq/funding/fundingprograms/otherfundingprograms/stwa12a/fy12astwa.html.

Funding Strategy for the Strategic Initiatives from the 2012-2013 Puget Sound Action Agenda
Volume 2: Technical Report 76
retrofit specific activities, and much of that funding has gone to prioritization and pre-‐‑design activities. We assume that these state grants represent the majority of current funding for retrofits. It is not possible to determine what local governments spend on retrofits alone in a comprehensive way and, given the many demands on local stormwater funds, retrofits – or, active expansion of the stormwater treatment system -‐‑ are likely to be a lower priority than existing obligations.
WSDOT sometimes conducts retrofits as a part of highway improvement projects. These opportunistic retrofit activities are not comprehensively tracked, and therefore it is difficult to account for all the areas that may have been retrofitted to date (WSDOT'ʹs 2010 Stormwater Report). The agency invests limited funds on stand-‐‑alone retrofits for existing highways (Figure 5).
Figure 17. WSDOT Investment in Stand-alone Stormwater Retrofits FY 2001-2013
Source: Data from WSDOT annual stormwater reports.
In the absence of sufficient funding, WSDOT is currently focused on completing existing stormwater retrofit projects and scoping new projects so they will be ready when funding becomes available. The agency has recently begun scoping approximately $32M in standalone stormwater retrofit projects in Puget Sound, and hopes to have roughly $40-‐‑$50M in stormwater retrofit projects scoped by the end of this year to implement if funding were to become available in the upcoming transportation package (Dick Gersib, pers. comm.).
$0
$200
$400
$600
$800
$1,000
$1,200
$1,400
Fund
ing
(thou
sand
s)
Fiscal Year

Funding Strategy for the Strategic Initiatives from the 2012-2013 Puget Sound Action Agenda
Volume 2: Technical Report 77
4.3 Shellfish
4.3.1 Near Term Funding The actions that were specifically identified in the 2012-‐‑13 Action Agenda are largely funded, with a gap of $1.8 million on a total funding need of $8.5 million (per Appendix A of the 2013 State of the Sound report). The principal funding sources are special state appropriations, state general fund appropriations, and a portion of EPA National Estuary Program funding that is passed through the state for work on Pollution Identification and Correction or PIC programs.
Table 25. Costs and Current Funding for NTAs Associated With the Shellfish Strategic Initiative
4.3.2 Other Funding for Shellfish Recovery Spending levels are difficult to estimate for the Shellfish Initiative, largely because most spending is by private landowners and not by governments. This Initiative is heavily focused on actions on private land, including repair and replacement of under-‐‑performing septic systems and control of nonpoint source pollution from farms in the region. The very substantial private sector costs and funding commitments have not been calculated. Governmental responsibilities include detection of water quality issues through the PIC programs, administration of county health programs, enforcement of regulations, and cost-‐‑sharing of private actions either through below-‐‑market loans (the tool of choice for septic systems), or cost-‐‑share grants and contracts with farmers for agricultural sources. Current spending includes:
• $4.5 million in EPA funding allocated through the Departments of Health and Ecology for PIC program implementation, septic management plans, and improvements in manure management;
• $1.9 million per biennium for shellfish food safety;
Action Number Description Total Cost Funded or
Budgeted Gap
B3.1.2 Outfall strategy on state-owned lands $411,000 $411,000 $0
C1.5.1 No discharge zone evaluation/petition $241,000 $241,000 $0
C1.6.3 Water quality enforcement $850,000 $689,000 $161,000
C3.2.1 Priority areas for incentives $60,000 $45,000 $15,000
C5.3.1 OSS homeowner loan program $217,000 $146,000 $71,000
C5.3.2 OSS program funding source $195,000 $136,000 $59,000
C7.1.3 Pollution control action team $1,299,000 $625,000 $674,000
C7.3.3 Shellfish model permitting program $279,000 $277,000 $2,000
C9.4.1 Pollution ID & correction programs $4,924,000 $4,115,000 $809,000
Total $8,476,000 $6,685,000 $1,791,000

Funding Strategy for the Strategic Initiatives from the 2012-2013 Puget Sound Action Agenda
Volume 2: Technical Report 78
• $1.4 million per biennium in the Department of Natural Resource’s shellfish program; and
• $6.5 million annually in county spending on management of shellfish-‐‑related public health programs.
In addition, DOE has provided grants from the Centennial Clean Water Program to defray administrative costs and lending risks for county loan programs. As of 2012, the state had allocated approximately $10 million in loans, $3.5 million in grants, and $3.8 million in special funding to support these programs. The majority of this funding has been provided since the 2006 supplemental budget when $6.5 million was provided in grant and loan funding for OSS purposes. Local government shellfish protection districts (see RCW 90.72.040) are authorized by the state to levy fees, rates, and charges on property owners within district boundaries. Monitoring, inspection, and repair of OSS systems are authorized purposes of the shellfish protection districts. As of 2005, there were 12 designated shellfish protection districts in the Puget Sound basin. Shellfish protection districts are required if a shellfish harvest area is closed or downgraded by the DOH as a result of water pollution. A detailed analysis of revenues of the existing districts has not been conducted and it is unclear whether this funding is currently serving as a substantial source for county OSS management programs in the areas that have districts.
Funding for agricultural BMPs is currently provided through federal Farm Bill incentive programs (Conservation Reserve Enhancement Program, Environmental Quality Incentive Program, etc.) and allocated as contracts with individual farmers and ranchers. The total funding level has not been estimated47.
Total current funding for shellfish recovery from all federal, state, and local sources is likely in the neighborhood of $15-‐‑20 million per year48. Note again that this disregards the very significant costs of septic system maintenance and repair and source control actions taken by the private sector.
47 Total funding under conservation programs associated with the Farm Bill has increased from $3.6 billion in FY 2005 to $6 billion in FY 2012. Congressional Research Service. 2013. Agricultural Conservation: a Guide to Programs. R40763.
48 Assuming $6.5 M in county support for local septic management programs, $2 M in additional spending by shellfish districts, $1.7 M for DNR and DOH shellfish safety, $2.2 M per year in EPA funding, $2 M in DOE grants, and $2 M in ag BMP’s.

Funding Strategy for the Strategic Initiatives from the 2012-2013 Puget Sound Action Agenda
Volume 2: Technical Report 79
5 Long Term Funding Gaps of the Strategic Initiatives
This section summarizes the preceding sections by identifying the highest priority targets for improved funding over the long term. These targets are based on the most outstanding needs for increased funding in terms of both their potential effectiveness towards Puget Sound recovery, and the shortfall in existing funding. Assumptions concerning long term existing funding are particularly speculative and are based on current understanding and trajectory. While there is a large and growing set of NTAs under each Strategic Initiative, this gap analysis focuses on the highest priority actions over the long term and identifying:
• Costs for level of funding to see real recovery benefits • Current and expected funding under business-‐‑as-‐‑usual • Annual expected funding gap moving forward based on current funding
levels and assumptions
The preceding sections demonstrate the overall complexity of the set of costs and existing expenditures associated with the Strategic Initiatives. The gaps presented here are points on continua and are presented to provide a basis for considering the scale of new funding necessary to achieve the Strategic Initiatives. In this way these long term estimates are most appropriately interpreted as representative of orders of magnitude. This section provides relatively wide ranges for some categories of costs and current funding. Later in the next section, as well as references in Volume 1 tend towards more central ranges for reporting.
These gaps are based on the forward-‐‑looking and long term needs for each Strategic Initiative. Short term needs will likely continue, although current program design and research investments could decline over time as programs come on line.

Funding Strategy for the Strategic Initiatives from the 2012-2013 Puget Sound Action Agenda
Volume 2: Technical Report 80
5.1 Habitat Table 26. Habitat Strategic Initiative Major Long Term Funding Gaps
Salmon recovery plans are the largest current cost category for the Habitat Strategic Initiative, and annual costs are likely to remain in the neighborhood of $150 million to $200 million annually for the foreseeable future (Table 26). The other two primary cost categories, floodplain restoration and culvert retrofit, are more recent areas of emphasis, and consequently long term costs and funding can be more difficult to predict. Communication with Floodplains by Design leadership suggest that $50 million annually, potentially up to $70 million, could address the identifiable and appropriate projects. Culvert retrofit could hold a particularly high state-‐‑level costs over $150 million annually, although this will decline as the major WSDOT requirements are met.
While current funding for implementation of the salmon recovery plans and floodplain restoration is considerable, there are potentially substantial gaps moving forward as the Strategic Initiatives requires more complete funding of projects identified in the three-‐‑Year salmon recovery work plans, and funding for Floodplains by Design moves toward reliable annual state-‐‑level funding. Culvert funding provides the greatest uncertainty and potential gap, as the pace of retrofit implementation, and scale of retrofit need in terms of local, private and potentially other state-‐‑owned culverts are identified and possibly addressed.
5.2 Stormwater Table 27. Stormwater Strategic Initiative Major Long Term Funding Gaps
Stormwater costs are particularly high in Puget Sound, but so is current funding (Table 27). While the majority of this funding comes from private and local
Action Annual CostCurrent Annual
FundingAnnual
Funding GapSalmon Recovery Work Plans $120-196 $38-44 $76-$158Floodplains $50-70 $30-50 $0-$70Culverts $100-$175 $0-18 $92-$175Total $270-441 $68-112 $168-403
($ Millions)
Action Annual CostCurrent Annual
FundingAnnual
Funding GapNPDES Permits and Codes $440-$490 $375-$425 $50-100Retrofits and non-Permit/Code $50-200 $50-150 $50-$150Total $490-690 $425-575 $100-$250
($ Millions)

Funding Strategy for the Strategic Initiatives from the 2012-2013 Puget Sound Action Agenda
Volume 2: Technical Report 81
sources currently, the increasing costs are likely particularly challenging for some jurisdictions.
Defining the gap for permit and code compliance must consider the increasing difficulty or unsustainability for some permit holders of both maintaining current funding levels, and addressing delayed capital upgrades and maintenance needs. Private funding contributions in terms of costs of compliance are difficult to quantify, but there is significant overlap in potential responsibility for costs moving forward between public and private sources.
Retrofit needs for existing development influence the growing permit and code costs via multiple pathways, including direct costs associated with new development, expanded efforts for LID and green infrastructure, watershed scale efforts, and public costs associated with ongoing maintenance of facilities established under codes. The scale of total potential retrofit need is great enough that 100 percent retrofit over practical planning horizons is likely infeasible, but the current suite of efforts on new and existing problems does leave room for investment in certain particularly cost-‐‑effective options, such as street sweeping and sediment legacy loads. And state highways provide a useful focal point of escalated effort for several scientific and practical reasons.
Retrofit funding has been increasing, but given the magnitude of the costs, the gap is still going to be substantial. Additionally, the division between permit/code compliance and retrofit needs will increasingly become ambiguous and likely less important. Other considerations for the gap, particularly with respect to outstanding needs for existing development:
5.3 Shellfish Table 28. Shellfish Strategic Initiative Major Long Term Funding Gaps
These costs do not include the relevant, but otherwise targeted efforts to address WWTP upgrades and outfall problems. Such WWTP costs would significantly dwarf these shellfish-‐‑specific programs and strategies. Additions to the program in the areas of agricultural BMPs, WWTP actions, and/or increased public
Action Annual CostCurrent Annual
FundingAnnual Funding
GapSeptic'Upgrades $3 $1 $2Septic'Mgmt'Programs $24 $7 $17PIC'Programs $10;20 $2 $8;18Ag'BMPs est'$2 est'$2 TBDPlanning,'Science,'Admin $2;4 $1;2 $1;3Total $41$53 $13$14 $28$39
($ Millions)

Funding Strategy for the Strategic Initiatives from the 2012-2013 Puget Sound Action Agenda
Volume 2: Technical Report 82
contribution to accelerate and target OSS upgrades could significantly increase the cost range.

Funding Strategy for the Strategic Initiatives from the 2012-2013 Puget Sound Action Agenda
Volume 2: Technical Report 83
6 Overall Cost Estimates for the Strategic Initiatives Over Time
Table 29. Summary Long Term Costs and Funding Gaps for the Strategic Initiatives
Figure 18. Strategic Initiative Timeframes (Estimated)
Strategic)Initiative/Action Annual)CostCurrent)Annual)
FundingCurrent)Annual)Funding)Gap Timeframe)(Years)
Habitat $270%440 $70%110 $200%400 100Salmon)Recovery)Work)Plans $1206196 $38644 $766$158 100Floodplains $50670 $30650 $06$70 50Culverts $1006$175 $0620 $806$170 100!!!WSDOT $155! $0+20 $135+155 30!!!Other!public $60! $0+5 $55+60 50!!!Private $5+10 $0+5 $5+10 100Stormwater $540%690 $430%570 $110%$250 100NPDES)Permits)and)Codes $4406$490 $3756$425 $506100 100!!!Street!Sweeping $5+15 $5+10 $5+10 100!!!Legacy!Loads $6+16 $0+5 $5+15 50Retrofits)and)non6Permit/Code $1006200 $506150 $506$150 100!!!Highway!Retrofits $100! $3! $100! 100Shellfish $41%53 $13%14 $28%39 100Septic)Upgrades 3 $1) 2 30Septic)Mgmt)Programs 24 $7) 17 30PIC)Programs $10620 $2) $8618 100Ag)BMPs est)$2 est)$2 TBD 100Planning,)Science,)Admin $264 $162 $163 100Total $850F1150 $500F700 $350F450 30,)then)declining
($ Millions)
2015 2035 2055 2075 2095 2115 2135 2155
Fully%fund%3*year%salmon%recovery%workplans%
Fund%state%contribu9on%to%Floodplains%by%Design%
Address%WSDOT%culverts%
Address%other%public%culverts%
Address%other%private%culverts%
Support%long*term%investments%*%NPDES%and%retrofit%
Increase%street%sweeping%(opera9ons)%
Increase%system%maintenance%(legacy%loads)%
Retrofit%state%highways%
Sep9c%Upgrades%
Sep9c%Mgmt%Programs%
PIC%Programs%
Ag%BMPs%
Planning,%Science,%Admin%
Water%infrastructure%package%
State%legisla9ve%inita9ves%
Regional%funding%mechanism%
HABITAT
STORMWATER
SHELLFISH
OTHER

Funding Strategy for the Strategic Initiatives from the 2012-2013 Puget Sound Action Agenda
Volume 2: Technical Report 84
In total when considering the full set of long term priorities for the Strategic Initiatives, the annual funding gap is likely in the range of $350 million to $450 million annually, declining over time (Table 29). These overall estimates are based on some staggering of implementation, synergies and efficiencies over time and not a simple addition. Habitat costs are the greatest, although culvert costs and possibly floodplain projects are likely to decline over time, particularly if early success continues. Stormwater costs will likely remain high for the 100 year timeframe, although major capital upgrades and system maintenance costs should decline after early efforts. Shellfish costs are low in comparison, and the primary problem of OSS upgrades should be generally addressed over the next 10 to 30 years. In general though, it is likely that most core strategies of the Strategic Initiatives will continue over the next 100 years (Figure 18). These timeframe estimates are approximate and likely to evolve. Figure 19. Projected Households and Income for Puget Sound
Sources:
Income Data: • Office of Financial Management’s Median Household Income Estimates by County: 1989 to 2012 and
Projection for 2013 (http://www.ofm.wa.gov/economy/hhinc/medinc.pdf). Projections based on OFM forecasts for growth in personal income, and the ratio of median household income to per capita income: OFM’s Long-Term Forecast of Washington Personal Income (http://ofm.wa.gov/economy/longterm/2014/lt2014ch4.pdf) and OFM’s Historical Per Capita Personal Income (http://www.ofm.wa.gov/trends/economy/fig101.asp)
• Total Puget Sound income estimated as a product of per capita income and total Puget Sound population. Populations and Household Data: • Linear extrapolations based on Office of Financial Management’s County Growth Management Population
Projections by Age and Sex: 2010-2040 (Final Projections of the Total Resident Population for the Growth Management Act Medium Series: 2010 to 2040: http://www.ofm.wa.gov/pop/gma/projections12/GMA_2012_county_pop_projections.pdf).
• Estimates of the number of households beyond 2010 and between decennial census estimates (U.S. Census Bureau, Table QT-P11 Households and Families - 2010 Census Summary File 1, Table P015 Households - 2000 Census Summary File 1, and Table D-1 General Population and Housing Characteristics - 1990 Census of Population and Housing Summary Tape File 1) were based on the calculated rate of change in the ratio of households to total population between 1990 and 2010, and the assumption that these ratios continue in the future.
$44,120 $80,629 $135,800
1,559,878
$99,019
2,264,109
2,854,178
3,686,621
$168,634
$393,906
$609,598
$1,0179,065
$0
$200,000
$400,000
$600,000
$800,000
$1,000,000
$1,200,000
$1,400,000
$1,600,000
0
500,000
1,000,000
1,500,000
2,000,000
2,500,000
3,000,000
3,500,000
4,000,000
4,500,000
2000# 2010# 2020# 2030# 2040# 2050# 2060# 2070# 2080# 2090# 2100# 2110#
Tota
l Pug
et S
ound
Inco
me
Puge
t Sou
nd H
ouse
hold
s
Median Household Income (WA) Number of Puget Sound Households Total Puget Sound Income
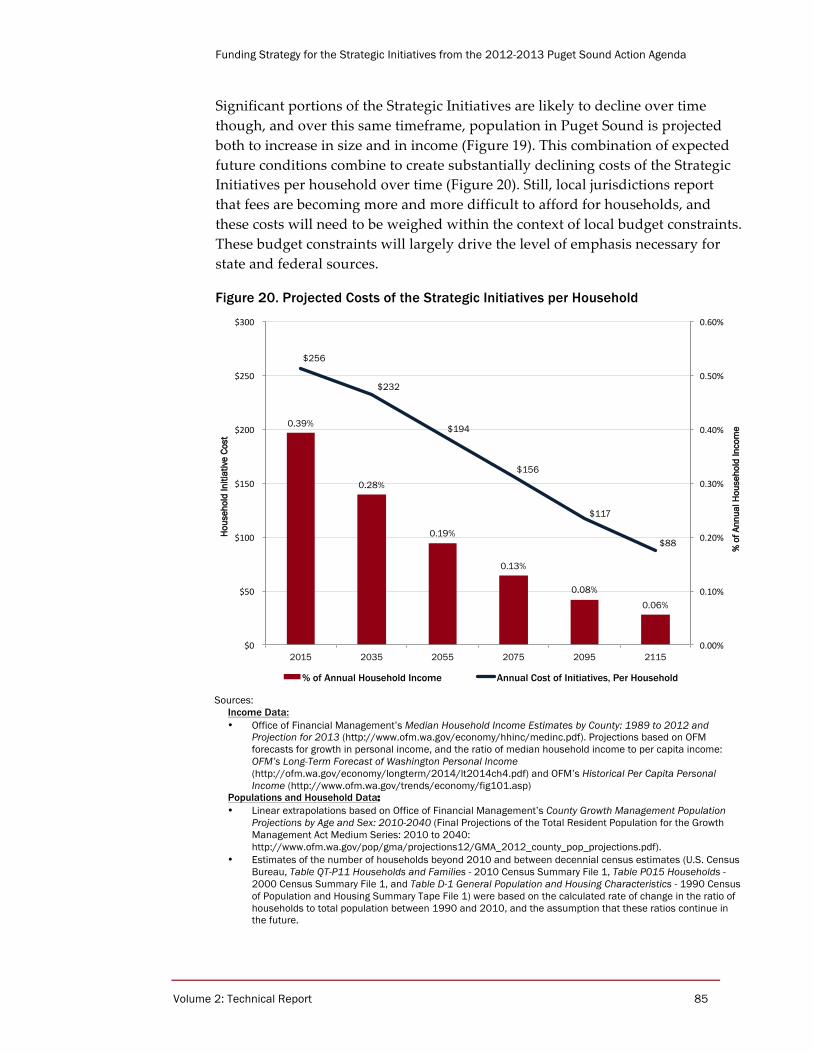
Funding Strategy for the Strategic Initiatives from the 2012-2013 Puget Sound Action Agenda
Volume 2: Technical Report 85
Significant portions of the Strategic Initiatives are likely to decline over time though, and over this same timeframe, population in Puget Sound is projected both to increase in size and in income (Figure 19). This combination of expected future conditions combine to create substantially declining costs of the Strategic Initiatives per household over time (Figure 20). Still, local jurisdictions report that fees are becoming more and more difficult to afford for households, and these costs will need to be weighed within the context of local budget constraints. These budget constraints will largely drive the level of emphasis necessary for state and federal sources.
Figure 20. Projected Costs of the Strategic Initiatives per Household
Sources:
Income Data: • Office of Financial Management’s Median Household Income Estimates by County: 1989 to 2012 and
Projection for 2013 (http://www.ofm.wa.gov/economy/hhinc/medinc.pdf). Projections based on OFM forecasts for growth in personal income, and the ratio of median household income to per capita income: OFM’s Long-Term Forecast of Washington Personal Income (http://ofm.wa.gov/economy/longterm/2014/lt2014ch4.pdf) and OFM’s Historical Per Capita Personal Income (http://www.ofm.wa.gov/trends/economy/fig101.asp)
Populations and Household Data: • Linear extrapolations based on Office of Financial Management’s County Growth Management Population
Projections by Age and Sex: 2010-2040 (Final Projections of the Total Resident Population for the Growth Management Act Medium Series: 2010 to 2040: http://www.ofm.wa.gov/pop/gma/projections12/GMA_2012_county_pop_projections.pdf).
• Estimates of the number of households beyond 2010 and between decennial census estimates (U.S. Census Bureau, Table QT-P11 Households and Families - 2010 Census Summary File 1, Table P015 Households - 2000 Census Summary File 1, and Table D-1 General Population and Housing Characteristics - 1990 Census of Population and Housing Summary Tape File 1) were based on the calculated rate of change in the ratio of households to total population between 1990 and 2010, and the assumption that these ratios continue in the future.
0.39%
0.28%
0.19%
0.13%
0.08%
0.06%
$256
$232
$194
$156
$117
$88
0.00%$
0.10%$
0.20%$
0.30%$
0.40%$
0.50%$
0.60%$
$0$$
$50$$
$100$$
$150$$
$200$$
$250$$
$300$$
2015 2035 2055 2075 2095 2115
% o
f Ann
ual H
ouse
hold
Inco
me
Hous
ehol
d In
itiat
ive
Cost
% of Annual Household Income Annual Cost of Initiatives, Per Household

Funding Strategy for the Strategic Initiatives from the 2012-2013 Puget Sound Action Agenda
Volume 2: Technical Report 86
7 Future Funding Opportunities of the Strategic Initiatives
Starting Principles for Improved Funding
The fundamental premise behind the Strategic Initiatives is that improving these natural characteristics of Puget Sound is a worthwhile endeavor. The benefits of improved and increased salmon habitat and shellfish beds, and reduced stormwater pollution, justify the necessary costs. From an economic perspective, this under-‐‑provision is a market failure, and can be attributed to the public good and common property resource characteristics of the Strategic Initiatives. This market failure can be attributed to a number of countervailing forces, including imperfect information (e.g. scientific unknowns of the importance until recently), diffusion of benefits (including across generations), free-‐‑riding, and lack of coordination and implementation mechanisms.
Even though markets might fail for these public objectives, there are important principles from public choice theory and public finance that can help guide public funding and financing to avoid government failure as well. It is a complex problem to understand which resources should be applied to which problems. Many of the same forces that drive efficient markets can be used as guidance for efficient public funding. These include:
• Those who benefit the most pay the most49 • For options of equal effectiveness, the lowest cost is chosen • Benefits are better sooner than later (time preference) • Transaction costs matter, and should be minimized50 • Budget constraints must be respected
To these principles can be added social objectives for fairness and equity, as well as consideration of existing rights akin to property rights such as rights to clean water and a functional natural environment.
From these principles we can take some characteristics of funding strategies that are likely to contribute to success:
• Funding sources must have a clear nexus to funded actions
49 Benefit in the case of stormwater might also be interpreted as “consume” in the sense that those creating and using impervious area are beneficiaries, and should bear the costs associated.
50 Transaction costs are costs necessary to implement an exchange. From a programmatic sense, administration costs would be included.

Funding Strategy for the Strategic Initiatives from the 2012-2013 Puget Sound Action Agenda
Volume 2: Technical Report 87
• Funding needs to be at a scale sufficient to capture all or at least the primary set of beneficiaries
• Funding should be flexible enough to target the most cost-‐‑effective solutions
• Funding programs should rely on proven and existing approaches to minimize transaction costs and unintended consequences (to the extent possible)
• Beneficiaries should not be called upon to fund beyond their means, or to a point that other priorities suffer
Ability to pay, and levels of payment already in place need to be taken into account to satisfy several of these objectives. Similarly, innovative approaches offer a variety of efficiency gains, but typically must be tested and implemented incrementally to avoid high transaction costs or unintended consequences. Approaches like reverse auctions sound exotic, but they in principle simply allow market-‐‑like behavior to identify the most cost-‐‑effective options. In-‐‑lieu fee and banking programs help reduce information and transaction costs to similarly achieve the most cost-‐‑effective outcomes at their most efficient scale and geography of implementation. Borrowing tools and methodologies from elsewhere, or from different problems or scales, can significantly reduce transaction (and administration) costs.
Funding can also utilize mechanisms that relate to behaviors that are best encouraged or discouraged, from a social efficiency perspective (Figure 21). For example, using fees or prices to internalize externalities (third-‐‑party costs) can generate funds and reduce problems by bringing use levels into alignment with full costs. And recognizing the level of private benefit to an undesirable behavior is important to determine if a cost imposed is just an added fee, or a real fine that is sufficient penalty to discourage the action.
When these fees are used to incorporate public costs into activities where public funding is already strained, such as services provided to new development, it is crucial to capture all costs. If the WRIA 9 retrofit study results hold, it will be important to find ways to either ensure that new and redevelopment cover their full costs for inspection and enforcement, as well as long-‐‑term operation and maintenance needs. Similar to impact fees, local jurisdictions are further challenged when NPDES permit compliance responsibilities associated with development arise. It is important to have mechanisms for development to pay for its own costs. And if these requirements are imposed sporadically, there can be inequitable economic development disadvantages from one community to another. Inequitable stormwater fees can have similar distortionary effects.

Funding Strategy for the Strategic Initiatives from the 2012-2013 Puget Sound Action Agenda
Volume 2: Technical Report 88
Much success has been found in Puget Sound through the multiple-‐‑benefit approach to program design.51 These recognize that opportunities to coordinate a wide array of benefits create more benefit and more possible funding. These strategies work for multiple benefits not just among the Strategic Initiatives or Action Agenda, but other public goals such as flood protection, healthy food supplies, and even recreation and amenity opportunities.
Similarly, it is important to recognize that existing programs often must satisfy objectives other than solely those of the Strategic Initiatives. Regulatory tools as well as statutory constraints might limit the ability of funds to target the most efficient objectives. Any new public funding should attempt to target those actions with the most cost-‐‑effectiveness yet neglected by existing programs. Legacy loads in stormwater systems are likely such an example.
Figure 21. Policy and Funding Tool Tradeoffs
Source: ECONorthwest
Given the variety and importance of constraints on regulatory compliance, a useful precautionary approach can involve incremental implementation of flexibility in funding and implementation options. Early steps can help to
51 See for example Fisher Slough in the Skagit Delta, the Floodplains by Design program, green stormwater infrastructure efforts, etc.
Direct outcome Control
Potential Cost Savings
Public Revenue Generation
Con$nuum'of'Environmental'Policy'Tools'Direct'Regulatory'
Command:and:Control'
Penal$es'and'Fines'
Taxes'and''Fees'
Dependence on Regulation
Incen$ve'Payments'
Credit'Trading'Programs'
Voluntary'Uncompensated'Ac$on'
Outcome/Behavior Uncertainty

Funding Strategy for the Strategic Initiatives from the 2012-2013 Puget Sound Action Agenda
Volume 2: Technical Report 89
establish consistent performance measures across jurisdictions and geographies, and establish benchmarks and locally-‐‑specific objectives. Figure 22 shows one set of example approaches to increasing information with an eye both to better identification of prioritization of funding targets, as well as possibly improving efficiency of current spending, if data and analysis from early stages suggest. For example, standardized stormwater pollution measurements across Puget Sound could help establish more specific vital signs, management objectives, and recognition of where stormwater pollution control efforts are making progress, and where more progress is needed. Later, this information might inform regional efforts and identify watershed-‐‑level or regional approaches to funding and implementing the most cost-‐‑effective strategies.
Figure 22. Incremental Uses for Crediting and Trading Programs
Source: ECONorthwest Income and wealth constraints matter both at the scale of households and communities. Income varies greatly within the Puget Sound Basin, yet stormwater fees are very insensitive to this variation (Figure 23). The lack of an income tax in Washington makes respect for varied income constraints difficult, but other means can be available to account for varied ability to pay. There are also realities that more income and wealth provides more opportunity to benefit from a healthy Puget Sound. And businesses in the region particularly are able to benefit, even by way of the quality of life benefits that attract highly-‐‑skilled labor and provide compensation.52
52 This is sometimes called a “second paycheck”.
Applica'ons+of+Credi'ng+and+Trading+Tools+
Credi'ng+
Tool/technique-for-project-benefit-es5ma5on-
Metric-for-project-priori5za5on-
Performance-tracking-and-accoun5ng-
Tool,-metric-for-alloca5on-of-funding-
Trading+
On@site-compliance-flexibility-
Intra@en5ty-compliance-flexibility-
Inter@en5ty-compliance-flexibility-
Inter@basin/region-compliance-flexibility-
Fully-transferable-currency-for-compliance-

Funding Strategy for the Strategic Initiatives from the 2012-2013 Puget Sound Action Agenda
Volume 2: Technical Report 90
Figure 23. Average Per Capita Income by County
7.1 Habitat Based on the appropriations from state and federal sources, efforts in Washington D.C. and Olympia are fairly successful (e.g. $80 million request for PSAR generated $70 million; there were threats to cut the Pacific Coast Salmon Fund to $50 million, but it was maintained at $65 million). The diversity of funding sources may actually contribute to redundancy and stability in funding. There are likely additional opportunities to achieve salmon habitat benefits secondarily via realignment of other conservation and restoration expenditures, such as mitigation activities, the Farm Bill, and private grant programs.
Realignment
Sources with high potential realignment are those with few constraints. These include general funds and programs, accounts with broad mandates, and grants whose authorities do not give them significant constraints. Medium potential realignment sources are restricted by fund source to a given emphasis but which may be reallocated among projects in the area of emphasis. For example, spending on Remedial Action Grants and grants from the RCO could be realigned to focus on public works projects that benefit Puget Sound. State agencies with natural resource responsibilities generally have medium potential with the assumption that their funds are more easily redirected than others. Sources with low potential, such as the Army Corps of Engineers and local military bases, will be difficult to realign due to substantial restrictions in the fund source. As currently structured, mitigation spending has a low potential for

Funding Strategy for the Strategic Initiatives from the 2012-2013 Puget Sound Action Agenda
Volume 2: Technical Report 91
realignment because it must directly address the harm caused by specific projects.
Change the scope or pace of recovery plan implementation
The 2005 Salmon Recovery Plan points out that only about a third of the financing sources in use can be used across the region. The geographically flexible sources are the SRFB state and federal sources as well as certain grants. Spending is typically constrained to the jurisdiction where it is sourced, and mitigation spending is particularly site-‐‑specific. In response, the flexible sources are used for the very highest priorities across Puget Sound. The Skagit River watershed receives additional funds for this reason.
Potential habitat funding sources
There is no simple way to raise the funds needed for a fully dependable, long-‐‑term funding strategy for the habitat program. The most likely sources are:
• Continued but diversified federal appropriations; • Continued but diversified state appropriations; • New state dedicated revenues; • A new regional habitat/water quality district with dedicated revenue; • Dedicated local tax and fee revenues; • A combination of the items above.
Federal appropriations: It is important to continue active efforts to support the Pacific Coastal Salmon Recovery Fund program. The effort that began several years ago to diversify funding sources for the recovery effort has borne some fruit. EPA has become a major player in the funding of Puget Sound recovery, although their focus is likely to remain on Clean Water Act compliance. There are indications that they may become more involved in riparian restoration, which should be encouraged. EPA receives funding through a different federal budget bill than NOAA, which may allow opportunities for multiple political leaders to step up to lead parts of the strategy.
The development of an Army Corps of Engineers funding stream is still largely unproven. The creation of the PSNERP restoration authority under the Water Resources Development Act of 2000 was intended to provide a new, sound-‐‑wide approach to cost-‐‑sharing larger scale restoration projects, and fourteen years later, PSNERP continues to actively work through the Corps process to secure federal ecosystem restoration funding. At one time, the region was very successful at earmarking Corps authorities for major restoration projects, but earmarks are no longer possible and local projects need to go through conventional processes to be funded.

Funding Strategy for the Strategic Initiatives from the 2012-2013 Puget Sound Action Agenda
Volume 2: Technical Report 92
With regards to goals, continuation of current federal funding levels should be considered a success given the national political climate and the halting recovery of the economy.
State appropriations: State appropriations still have growth potential for Puget Sound recovery. Efforts to diversify state funding should continue to reach out to new partners. The Washington State Conservation Commission would be the lead in the regional conservation partnership program proposal that is being advanced by a variety of local interests. Those agencies already engaged are sure to have a broader group of funding sources that could be brought to bear on this Strategic Initiative, such as the funding provided by Ecology in 2013-‐‑2015 for floodplain initiatives.
State dedicated revenues: Prior funding strategies have investigated a variety of dedicated revenue sources for salmon recovery, including hotel and motel taxes, utility taxes, cigarette and alcohol taxes, and lottery proceeds. A thorough look at these options is beyond the scope of this project, but it would be useful to dust off these ideas and give them another look. Their advantage is that small but broadly based taxes can raise a significant amount of funding year in and year out.
New regional habitat/water quality district: This idea has floated around since it was originally proposed by King County in the mid-‐‑90s, although its origins could also be dated back to the creation of Metro and the cleanup of Lake Washington in the 1950s and 60s. The concept then was to form a multi-‐‑jurisdictional regional agency to undertake a mission – the cleanup of the massively polluted lake – that was beyond the jurisdictions and capabilities of any of the individual local governments.
The process today for developing a new regional habitat/water quality district would be much like that used in the creation of Metro: secure new authority in the state legislature, and then use the authority to create a new regional district to raise and spend money to undertake the restoration program. Of course, care would need to be taken in creating a governance structure that would withstand the court challenges that resulted in the disbanding of Metro in 1994.
The Puget Sound authority concept was advanced most recently in 2008, when a delegation led by Bill Ruckelshaus and the Puget Sound Partnership worked to champion a bill to create the authority for a regional habitat/water district. The Governor ultimately declined to introduce the bill and the initiative faded.
The idea is most compelling at the full twelve-‐‑county scale. A nexus is necessary between payments and benefits, in that the system must be broad enough to capture the area of both those who benefit and the sites for actions to restore

Funding Strategy for the Strategic Initiatives from the 2012-2013 Puget Sound Action Agenda
Volume 2: Technical Report 93
habitat. As many commentators have noted, some of the most pressing funding needs in the Puget Sound basin are in areas that do not have strong local tax bases. The entire region would benefit substantially from a cleaner and healthier Puget Sound and it would be fitting if the entire region paid for it. Many of the dedicated state revenues discussed previously, or regional fees and taxes (discussed below) might be suitable candidates for a regional district.
Dedicated local fees and taxes: Salmon habitat projects provide local benefits, both directly through opportunities to use restored areas and enjoy salmon populations, and indirectly through support of the overall Puget Sound ecosystem. Local residents consequently, out of both fairness and efficiency, need to play a role in funding salmon recovery projects. One potential opportunity for mutual benefit is to address the need for dedicated sources of long-‐‑term operating and maintenance budget; money that would pay for local jobs and stimulate local economies.
Flood protection: Beyond current funding sources, there is considerable interest in the potential for spending on flood protection in floodplains to be multi-‐‑purposed to also provide habitat benefits. Moving structures out of floodplains can also lead to significant flood damage cost savings (Table 30). Total flood damages estimates in Puget Sound over the past two decades reach $860 million.53 As described earlier, the Floodplains by Design program has identified $784 million in needed and intended flood protection investments in Puget Sound. Mitigation mechanisms: A variety of approaches are in operation or design for the purpose of improving the overall habitat benefit provided by available funding and spending for habitat improvement. Mitigation banks and in-‐‑lieu fee programs already exist within Puget Sound for wetlands and habitat. See Appendix A for more discussion on some of the existing programs. Other opportunities likely exist as well. Oregon Department of Transportation is
53 PSP. 2010. Floodplain Management: A Synthesis of Issues Affecting Recovery of Puget Sound.
Table 30. Flood Insurance Claim Payments Due to Flooding Since 1978 (Millions)
Source: BureauNet 2006

Funding Strategy for the Strategic Initiatives from the 2012-2013 Puget Sound Action Agenda
Volume 2: Technical Report 94
designing and soon piloting a fish passage banking program so that culvert retrofit spending is pooled and targeted at the most efficient and important opportunities first.
7.2 Stormwater Cost-‐‑effective strategies for stormwater pollution management will be context-‐‑specific, and involve a portfolio approach of multiple techniques as the problems of greatest need are not uniform across communities. Opportunistic synergies will be important to identify and act upon (e.g. when redevelopment occurs that doesn’t trigger regulatory requirements, or other construction activities). Prioritization across the basin (process already underway) is necessary, and has already revealed opportunities with 1) roads and highways and 2) runoff from parcels in high priority areas that are unlikely to be redeveloped in the near future.
Stormwater pollution sources and funding capacity are diverse, and can vary across jurisdictions. It is unclear whether local surface water management fees can be increased sufficiently to fund the operation and maintenance of new facilities. Stormwater fees do vary dramatically across Puget Sound. Opportunities to manage permit compliance investments for redevelopment or reconstruction at the watershed scale might expand the share of pollutant load that can be addressed for the money spent. This recognition that redevelopment sites are not always the location and scale most efficient for addressing problems motivates regional proposals such as in-‐‑lieu fee programs. Efficiencies will necessarily be a key to improvements, given the level of funding already underway and concern over budget constraints.
Potential Stormwater Funding Sources
To summarize the future funding needs for the Urban Stormwater Strategic Initiative, the studies and short-‐‑term processes identified in the Action Agenda, appear to be adequately funded, indicating that the Action Agenda is having its desired effect at driving state budget allocations. The long-‐‑term needs are for two costly but essential elements – stormwater retrofits and NPDES compliance – both of which are largely unfunded. These programs have traditionally been the responsibility of local governments and the private sector, but this discussion assumes that there may be some interest in cost-‐‑sharing the most pressing needs with new funding sources.
The Washington State Legislature is currently reviewing options for funding water infrastructure projects, including stormwater improvements, at a more generous level. This discussion is occurring in the House Capital Budget

Funding Strategy for the Strategic Initiatives from the 2012-2013 Puget Sound Action Agenda
Volume 2: Technical Report 95
Committee under the leadership of Representatives Dunshee and DeBolt, and Senator Honeyford.
The options under consideration in this effort focus on developing additional state capital funding capacity for water infrastructure, including stormwater management, flood management, water quality improvement, and water supply. The options include bonding or cash appropriations that would rely on such revenue sources as:
• Establishment of a statewide stormwater fee;
• Establishment of a real estate excise tax on all real estate transactions;
• Reestablishment of the sales tax on bottled water;
• Redirection of existing public utility tax revenues; and
• Added utility fees on natural gas or electric utilities.
Statewide stormwater fee: It appears this would use existing state authority to levy a fee on real property much as has been done with local stormwater utilities. Three options for rate structure are under consideration: levying based on impervious area, on a per-‐‑parcel basis, or on a per-‐‑acre basis. All could raise upwards of $250 million per year based on the rate assumptions used in the legislative analysis.
Real estate fee: This option would presumably use the state’s current REET authority to apply a per-‐‑transaction fee of $975 on all real estate transactions in the state. The legislative projection is that this would raise at least $250 million per year.
Bottled water: The reapplication of sales taxes to bottled water, a tax previously repealed by public initiative, would raise $22-‐‑24 million per year.
Utility taxes: The redirection of 9.7% of existing public utility tax revenues would provide $42-‐‑49 million per year. The other fee options would impose a monthly or per-‐‑kilowatt fee to utility customers and would raise between $158 and $213 million per year.
Markets: Market-‐‑based approaches offer efficiencies via numerous pathways. Beyond simply crediting, banking, and fee programs (see Appendix), there are also creative financing approaches under development., For example, communities like Philadelphia are helping to create markets for private investment in stormwater retrofit through regulatory compliance flexibility and incentives. Energy efficiency markets have seen success with such an approach.

Funding Strategy for the Strategic Initiatives from the 2012-2013 Puget Sound Action Agenda
Volume 2: Technical Report 96
In-Lieu Fees: In-‐‑lieu fee programs involve payment for stormwater compliance rather than on-‐‑site compliance. They can be designed to incorporate market forces or not. In a basic sense, they can provide opportunity to pool funding and use it to target the most efficient opportunities. Such stormwater programs are increasingly in use across the country (See Appendix A for examples). These efficient opportunities can be identified by public agencies, or more broadly via market forces such as through reverse auctions, whereby the lowest bidder for a given level of stormwater management wins the funding.
Road pricing: Funding roads and transportation systems is moving towards more efficient approaches as well, and stormwater cost shares can be a part of such approaches. Road pricing is the movement towards creating funding sources for roads that are based on level of use. Gas taxes are a crude form, but miles-‐‑travelled are better aligned, and already under experimentation in Puget Sound, and pilot in Oregon and elsewhere. For example, at roughly 35-‐‑40 billion vehicle miles travelled (VMT) annually in Puget Sound, a $0.001 per VMT would raise $35-‐‑40 million annually.
7.3 Shellfish The most significant gap in funding the shellfish program is related to the repair and replacement of septic systems.54 The cost of the DOH program to subsidize homeowner loans is relatively small compared to other elements of the Strategic Initiatives, particularly in the long term following repayment. At the moment, there is no defined solution for funding these costs. The DOH is in the midst of a study to assess funding strategies and in general the ECB Finance Subcommittee defers to that process to specify the program and funding strategy.
There is likely room within the DOH strategy to bring additional funding or policy to bear to accelerate OSS repair and replacement, or ensure particularly problematic areas are adequately addressed.
The other program components of the Shellfish Initiative, such as concerning marinas and the PIC studies, similarly have relatively minor costs, and it is important that they receive reliable funding sources. This suggests continued pursuit of federal grants, but complemented with state funding when necessary.
While not addressed in this report, continued efforts for WWTP upgrades and outfalls will be crucial to the long term success of shellfish bed recovery efforts.
54 This is based on omission of WWTP upgrades from the focus of the Shellfish Initiative.

Funding Strategy for the Strategic Initiatives from the 2012-2013 Puget Sound Action Agenda
Volume 2: Technical Report 97
Shellfish will continue to contribute an important and valuable realization of the benefits of improving water quality in Puget Sound.

Funding Strategy for the Strategic Initiatives from the 2012-2013 Puget Sound Action Agenda
Volume 2: Technical Report 98
Appendix A - Crediting and Banking Programs for Water and Habitat
The magnitudes of costs and funding gaps identified in this report emphasize the importance of using available funds as efficiently as possible. Crediting, banking and trading programs provide both tested and emerging approaches to more efficient use of funds, as well as leveraging existing funds to attract other funding and investment sources. There are programs in Washington and elsewhere that have found success for objectives similar to the Strategic Initiatives, but there are serious constraints on their potential, and numerous requirements necessary to see well-‐‑functioning programs. This appendix provides an overview of select relevant programs and mechanisms.
The federal government is paying increased attention to ecosystem services and market-‐‑based approaches to their development. In 2008, the Secretary of Agriculture formed the Office of Ecosystem Services and Markets, recently renamed the Office of Environmental Markets. The Secretary established this office in order to build “technical guidelines that outline science-‐‑based methods to measure the environmental services benefits from conservation and land management activities in order to facilitate the participation of farmers, ranchers, and forest landowners in emerging environmental services markets.”55 State and local government agencies in Washington are involved in associated efforts as well.
Similar mechanisms are experiencing success in Puget Sound. King County’s Mitigation Reserves Program provides a successful in-‐‑lieu fee example that is using mitigation responsibilities to fund major projects that can experience higher benefits and long-‐‑term success than typical one-‐‑off compliance projects.
Some agencies are developing mechanisms to address risk and uncertainty associated with market-‐‑based approaches to natural resource management. In some cases, government entities have acted as brokers to address information and transaction costs, as well as managing a share of the liability. To protect themselves from future liability, buyers can draw additional credits from banks when credit projects fail, for example when a restoration project does not perform as expected. Additionally, buyers can use trading ratios greater than one-‐‑to-‐‑one to address uncertainty for unknown project failures. For example, a
55 Schafer, E. 2008. Secretary’s Memorandum 1056-‐‑001. U.S. Department of Agriculture. http://www.ocio.usda.gov/directives/doc/SM1056-‐‑001.htm.

Funding Strategy for the Strategic Initiatives from the 2012-2013 Puget Sound Action Agenda
Volume 2: Technical Report 99
two-‐‑to-‐‑one trading ratio would require the transaction to generate two acres of benefit for each acre of lost benefit offset.
Existing Transaction Programs and Applications Despite the challenges, market-‐‑based approaches to provisioning ecosystem services are in place and under development worldwide. Voluntary markets, such as much of the U.S. carbon sequestration market, rely on a mix of private and public motivations. These voluntary markets, while beneficial, do not typically provide a reliable and sufficient level of service. Achieving socially-‐‑identified levels of ecosystem service-‐‑provision typically requires a regulatory mandate for provision of the service or a constraint on the degradation of the service. Once a mandate or constraint is in place, regulators can achieve efficiencies with market-‐‑based goods in the form of credits, conditional on monitoring and enforcement of the credit and regulation terms. In some cases, activities described as markets are actually payments for ecosystem services (PES), facilitated between private individuals, corporations, organizations, and/or governments as one-‐‑time solutions to regulatory requirements.56
In general, farm operators participating in ecosystem service markets restore or manage their land beyond current regulatory requirements. These changes in management may generate payments or credits that farmers can sell to businesses, cities, utilities, or other entities seeking to offset environmental degradation. These markets provide a means by which entities that cannot avoid environmental degradation in conducting their business can offset their negative impact in a cost-‐‑effective manner. Non-‐‑regulated entities may choose to voluntarily purchase ecosystem services credits for marketing purposes or to comply with their internal environmental management goals.
Site-‐‑specific demands tend to determine the viability of these transactions. A local example is the City of Portland, which wanted to avoid the costs associated with investing in a filtration system to treat its drinking water. Instead of spending $200 million on a new filtration system, the City of Portland protected 102 square miles of its watershed from activities that might introduce pollution and other impurities into its drinking water. This equates to an avoided-‐‑cost benefit of $3,000 per acre for water filtration services.57 Similarly, Clean Water Services, a water-‐‑resource management utility in northwestern Oregon avoided
56 Ecosystem services refer to valuable services provided by natural systems. 57 ECONorthwest, with data from the Portland Water Bureau, http://www.portlandonline.com/ water/index.cfm?c=29784; and Krieger, D. 2001. Economic Value of Forest Ecosystem Services: A Review. The Wilderness Society.
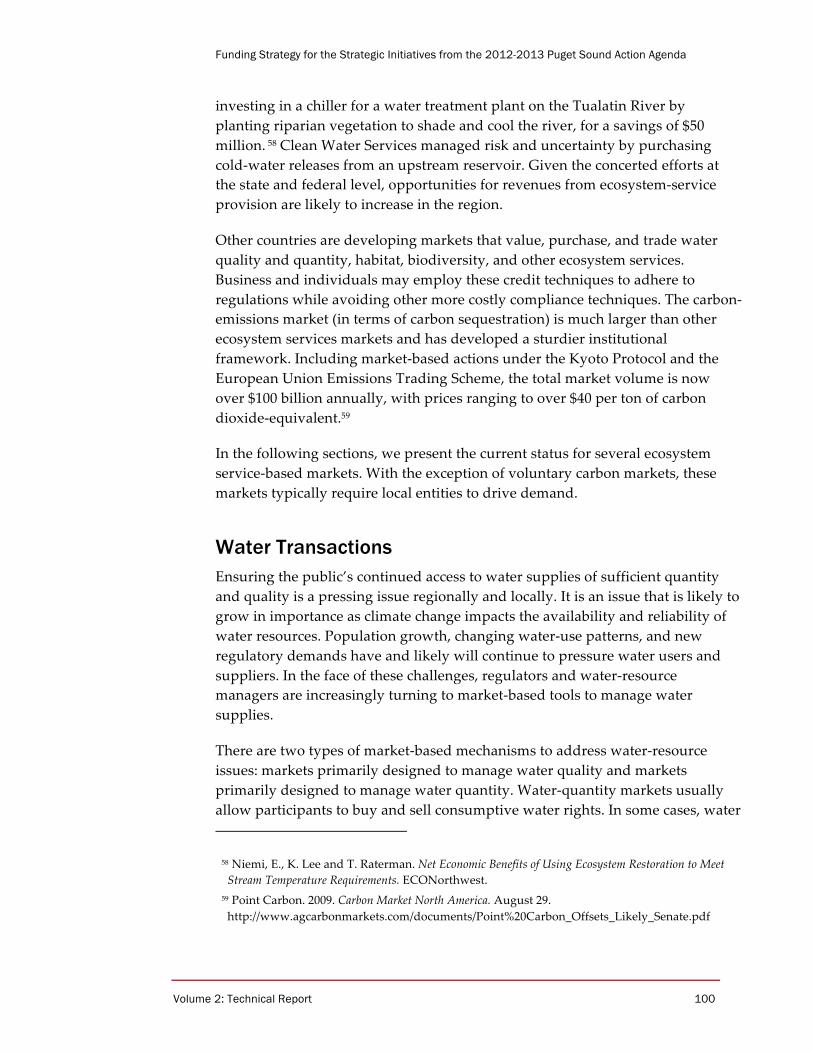
Funding Strategy for the Strategic Initiatives from the 2012-2013 Puget Sound Action Agenda
Volume 2: Technical Report 100
investing in a chiller for a water treatment plant on the Tualatin River by planting riparian vegetation to shade and cool the river, for a savings of $50 million. 58 Clean Water Services managed risk and uncertainty by purchasing cold-‐‑water releases from an upstream reservoir. Given the concerted efforts at the state and federal level, opportunities for revenues from ecosystem-‐‑service provision are likely to increase in the region.
Other countries are developing markets that value, purchase, and trade water quality and quantity, habitat, biodiversity, and other ecosystem services. Business and individuals may employ these credit techniques to adhere to regulations while avoiding other more costly compliance techniques. The carbon-‐‑emissions market (in terms of carbon sequestration) is much larger than other ecosystem services markets and has developed a sturdier institutional framework. Including market-‐‑based actions under the Kyoto Protocol and the European Union Emissions Trading Scheme, the total market volume is now over $100 billion annually, with prices ranging to over $40 per ton of carbon dioxide-‐‑equivalent.59
In the following sections, we present the current status for several ecosystem service-‐‑based markets. With the exception of voluntary carbon markets, these markets typically require local entities to drive demand.
Water Transactions Ensuring the public’s continued access to water supplies of sufficient quantity and quality is a pressing issue regionally and locally. It is an issue that is likely to grow in importance as climate change impacts the availability and reliability of water resources. Population growth, changing water-‐‑use patterns, and new regulatory demands have and likely will continue to pressure water users and suppliers. In the face of these challenges, regulators and water-‐‑resource managers are increasingly turning to market-‐‑based tools to manage water supplies.
There are two types of market-‐‑based mechanisms to address water-‐‑resource issues: markets primarily designed to manage water quality and markets primarily designed to manage water quantity. Water-‐‑quantity markets usually allow participants to buy and sell consumptive water rights. In some cases, water
58 Niemi, E., K. Lee and T. Raterman. Net Economic Benefits of Using Ecosystem Restoration to Meet Stream Temperature Requirements. ECONorthwest.
59 Point Carbon. 2009. Carbon Market North America. August 29. http://www.agcarbonmarkets.com/documents/Point%20Carbon_Offsets_Likely_Senate.pdf

Funding Strategy for the Strategic Initiatives from the 2012-2013 Puget Sound Action Agenda
Volume 2: Technical Report 101
quantity markets can improve river and stream flows by allowing public or private entities to lease or buy the water rights of a third party, who then leaves the water instream, increasing stream flows. Water-‐‑quality markets employ a similar approach to reduce water pollution by developing credits for regulated pollutants. Water-‐‑quality trading offers the possibility of meeting a watershed’s water quality goals with its most cost-‐‑effective opportunities and creates incentives for water quality improvement.
Water Quantity and Quality Transactions and Agriculture Instream flow leasing is an example of water quantity trading that allows agricultural producers to participate. In these models, public and private entities pay the owners of water rights to leave a portion of their water right instream or to put water back into the stream channel. For example, the Washington Water Trust partnered with John Crosetto, the General Manager of Teanaway Valley Family Farm, located on the North Fork of the Teanaway River in Washington. According to this lease, Washington Water Trust reimburses the Teanaway Valley Farm for a lease of 102 acre-‐‑feet until 2023. With this project and seven others like it, the Washington Water Trust has increased flows by up to 5.5 cubic feet per second in the North Fork of the Teanaway River.60
In addition to water-‐‑quantity trading, water-‐‑quality trading is a tool that industrial and municipal facilities may use to lower their costs of meeting water-‐‑quality standards. Regulated facilities might compensate agricultural producers for a less costly, but equivalent, pollutant or temperature reduction. To achieve this end, trading partners enter into a contractual agreement, which financially benefits both parties and improves water quality with a lower financial investment. A water-‐‑quality trading market exists only when these parties have different costs to reduce their respective pollutant contributions, which creates an efficient market for less-‐‑expensive approaches to improving water quality. These markets have also employed Agricultural Best Management Practices (BMPs) in the Chesapeake Bay and the Ohio River drainage.
Some farmers in the Pacific Northwest already augment their incomes by providing water quality improvements. Producers in Washington County, Oregon who are enrolled in the Conservation Reserve Enhancement Program (CREP) earn additional revenue through the Tualatin Soil and Water Conservation District. These producers receive the standard $265 per acre per
60 Colombia Basin Water Transactions Program. No date. Stories from the Field: Salmon Return as Long-‐‑Term Leases Restore Water to the Teanaway. http://www.cbwtp.org/jsp/cbwtp/stories/stories.jsp?year=2006.

Funding Strategy for the Strategic Initiatives from the 2012-2013 Puget Sound Action Agenda
Volume 2: Technical Report 102
year for tree plantings to cool the Tualatin River through the CREP, but can also net an additional $128 per acre per year for improving water quality.61 Clean Water Services, a wastewater and stormwater public utility that must reduce the amount of heated water entering the Tualatin River from its facilities, provides these additional funds.
Water-Quantity Transactions in Washington State The Colombia Basin Water Transactions Program. In 2002 the National Fish and Wildlife Foundation (the Foundation) created the Columbia Basin Water Transactions Program (CBWTP) to address regional water supply challenges. The Foundation noticed that as a result of legal water withdrawals during the peak growing season, stretches of many streams and rivers would run low—and sometimes dry—with significant consequences for imperiled salmon, steelhead, and trout.62 To mitigate this problem, the CBWTP uses permanent acquisitions, leases, investments in efficiency, and other incentive-‐‑based approaches, along with program partners in Oregon, Washington, Idaho and Montana, to fund landowners to restore flows to existing habitat. The Foundation and the Bonneville Power Administration (BPA) jointly manage the CBWTP. The BPA, along with the Northwest Power and Conservation Council, also provides the majority of the funding for the program.
Washington Water Trust. Established in 1998, the Washington Water Trust (WWT) is another independent, non-‐‑profit that works to increase stream flows using a market-‐‑based approach. Like the CBWTP, the WWT purchases or leases ecologically significant water rights from voluntary public or private sellers, and then dedicates the acquired water to instream use to increase tributary flows. The Washington State Trust Water Program, along with a variety of private partners, provides funding for the Washington Water Trust.
Dungeness Water Exchange
A collaboration among Department of Ecology and local agencies and tribes in the Dungeness River watershed along with Washington Water Trust have created a water bank to ensure sufficient instream flows while providing a
61 Conservation Technology Information Center. 2006. Getting Paid for Stewardship: An Agricultural Community Water Quality Trading Guide. July.
62 Colombia Basin Water Transactions Program. No date. http://www.cbwtp.org/jsp/cbwtp/program.jsp.

Funding Strategy for the Strategic Initiatives from the 2012-2013 Puget Sound Action Agenda
Volume 2: Technical Report 103
mechanism for acquisition of water supply through the exchange. Mitigation opportunities allow generation of credits through water conservation efforts.63
Washington Water Acquisition Program. Washington State launched the Washington Water Acquisition Program in 2003 with the goal of increasing stream flows in 16 watersheds. This program uses funds from the state and federal governments, along with program sponsors, to buy or lease water rights from farmers, ranchers and other water-‐‑rights holders. The program then returns the water it obtains to the creeks, streams, and rivers where it was originally withdrawn.
Participants in the Washington Water Acquisition Program have the option of selling all or part of their water rights or leasing all or part of their water rights. If a participant chooses to sell his or her water right, program sponsors will work to negotiate a sale price that is based on a fair market value. At the conclusion of the sale, the state will hold the water in trust permanently. If a participant wishes to lease his or her water right, a fair market value is again assessed, and there is no risk of relinquishing the water, though long-‐‑term leases have a higher priority.64
Yakima Basin Integrated Water Resource Management Plan. As part of the joint effort by Washington State (primarily Department of Ecology) and Bureau of Reclamation, the Yakima basin plan under design and evaluation would address water supply scarcity in large part through increase transfer opportunities among irrigation districts for agricultural use. In this way, net farm earnings can be nearly maintained under drought conditions by means of greater flexibility in geographical use of available water.65
Water-Quality Transactions Background and Developments. While there are no active water quality trading markets in Washington State, there are several regional and national examples which might provide reference points for Washington landowners interested in future opportunities in these markets.
63 Washington Water Trust. 2014. Dungeness Water Exchange. http://www.washingtonwatertrust.org/water-‐‑exchange
64 Department of Ecology, State of Washington. No date. Water Acquisition: Increasing Stream Flows in Critical River Basins. http://www.ecy.wa.gov/programs/wr/market/wacq.html.
65 Department of Ecology. 2014. Yakima IWRMP. http://www.ecy.wa.gov/programs/wr/cwp/ybip.html.

Funding Strategy for the Strategic Initiatives from the 2012-2013 Puget Sound Action Agenda
Volume 2: Technical Report 104
Sources of water quality pollutants and impairment are generally divided into two categories: point sources and non-‐‑point sources. Point sources, like factories and sewage treatment plants, are those entities that discharge pollutants from a single point or a concentrated body of points. A non-‐‑point source, like a farm or urban runoff, by contrast, is typically diffuse. Non-‐‑point sources often do not have a precise original source of pollution and so are typically unregulated.
To address growing concerns over water quality, some U.S. local and state government agencies have implemented nutrient caps or limits on discharge of pollutants into waterways. In some cases, regulated entities can use water-‐‑quality trading to reduce the costs associated with the caps and still offset the water quality degradation. In these instances, trading allows sources with relatively higher abatement costs to purchase pollution reductions from sources that have lower abatement costs. Water quality trading can occur from point-‐‑to-‐‑non-‐‑point sources, point-‐‑to-‐‑point sources or non-‐‑point-‐‑to-‐‑non-‐‑point sources.
Table III-‐‑3 illustrates four broad market structures in water quality trading: bilateral trades, sole source offsets, clearinghouses, and exchange markets. Some trading programs combine elements of two or more of these structures.66 To reduce concerns over risk and uncertainty, some programs require greater than a one-‐‑to-‐‑one trading ratio, which is the ratio of the purchased reduction to the regulated pollutant. For example, a two-‐‑to-‐‑one ratio means that an entity would purchase two pounds of pollutant reductions for every one pound they discharge above their regulatory limit.
66 Selman, M., S. Greenhalgh, E. Branosky, C. Jones, and J. Guiling. 2009. Water Quality Trading Programs: An International Overview. WRI Issue Brief: Water Quality Trading, No. 1. March.

Funding Strategy for the Strategic Initiatives from the 2012-2013 Puget Sound Action Agenda
Volume 2: Technical Report 105
Table A-1: Description of Water Quality Transaction Structures
Type of Market Structure
Description Example
Bilateral Trades One-to-one negotiations where traders arrive at a price through a process of bargaining.
The Tualatin River Program in Oregon, in which Clean Water Services bought temperature credits from 25 different farmers who implemented riparian buffers on their properties.
Sole-source offsets Regulated entities can increase nutrient discharge at one point if they reduce their nutrient discharge at another location, either on- or off-site.
The Chatfield Reservoir Trading Program, which decommissioned septic systems in exchange for building a sewage treatment plant.
Clearinghouses or “in-lieu-fees”
A single intermediary links buyers and sellers of credits, which are uniform commodities.
The Virginia Quality Trading Program, which sells credits to regulated facilities and then purchases credits from the regulated community or non-point sources outside the community.
Exchange markets Buyers and sellers meet in a public forum where all commodities are equivalent and all prices are transparent.
The Pennsylvania Water Quality Trading Program
Source: Adapted by ECONorthwest from Selman, M., S. Greenhalgh, E. Branosky, C. Jones, and J. Guiling. 2009. Water Quality Trading Programs: An International Overview. WRI Issue Brief: Water Quality Trading, No. 1. March.
In one of the more advanced national water quality developments, the U.S. Environmental Protection Agency developed and maintains the Chesapeake Bay Watershed Model in support of a watershed partnership that incorporates water quality trading programs in four states—Pennsylvania, Virginia, Maryland, and West Virginia—and the District of Columbia. Together these districts contain the 300 subwatersheds that feed into the mouth of the Chesapeake Bay. All of these programs operate in conjunction with newly adopted water quality standards, which employ point-‐‑source nutrient discharge limits.67
When agricultural producers participate in water-‐‑quality trades, a regulator often must establish the farms’ baseline nutrient discharges before the producers can generate and trade any nutrient reduction credits. In Virginia, for example, there is a performance-‐‑based baseline for agriculture. Participating farmers must implement riparian buffers, streambank fencing, cover crops, and no-‐‑till agriculture before they gain eligibility for Virginia’s trading program and can generate credits.68
67. Chesapeake Bay Program. No date. History of the Chesapeake Bay Program. http://www.chesapeakebay.net/historyofcbp.aspx?menuitem=14904.
68 Selman, M., S. Greenhalgh, E. Branosky, C. Jones, and J. Guiling. 2009. Water Quality Trading Programs: An International Overview. WRI Issue Brief: Water Quality Trading, No. 1. March.

Funding Strategy for the Strategic Initiatives from the 2012-2013 Puget Sound Action Agenda
Volume 2: Technical Report 106
Biodiversity (Habitat) Transactions The explicit goal of a biodiversity market is to protect wildlife through the provision of habitat. For this reason, biodiversity payment schemes must include some characteristics of habitat enhancement and management. Payments for biodiversity services, therefore, include any payment for the protection, restoration, or management of habitat. Examples include biodiversity offsets, conservation easements, payments for biodiversity management, transfers of development rights, and habitat credit markets.
Biodiversity Markets and Agriculture Agriculture occupies a significant portion of land in Washington, forming the most predominant land use type in many eastern basins and the second most common land use in western Washington. Agriculture in Washington is frequently located along streams and in the lower portions of watersheds, where historically, the most productive salmon habitat occurred. About 37 percent of salmon streams in Washington pass through private land used for agriculture.69
Agricultural land may also play an increasingly critical role in preserving ecosystems as developers convert rural land in surrounding areas into urban and industrial land uses. In Washington State, between 1982 and 1997, about 20 percent of the farmland in the Puget Sound region was lost to other uses, especially in King and Snohomish Counties where urban growth has been high.70 As a result of these dynamics, agriculture likely will play an important role in maintaining healthy ecosystems and biodiversity in the coming years in Washington State.
Some organizations and local governments have implanted pilot programs for improving biodiversity and habitat in Washington. Farmers in Skagit County, for example, have joined a pilot program with The Nature Conservancy to earn additional income for innovative integration of active agriculture and environmental services. In this program, the farmers flood one third of the 210 acres of dedicated land to produce critical habitat for migratory birds. Of the other two-‐‑thirds, the farmers mow one and use the other for grazing livestock or
69 Smith, C. 2006. Evaluation of CREP Riparian Buffers in Washington State. Washington State Conservation Commission. April.
70Smith, C. 2006. Evaluation of CREP Riparian Buffers in Washington State. Washington State Conservation Commission. April.

Funding Strategy for the Strategic Initiatives from the 2012-2013 Puget Sound Action Agenda
Volume 2: Technical Report 107
planting row crops. In exchange for their labor, expense, and the use of their land, the farmers have earned $350,000 over the first three years of the program.71
Biodiversity Transactions in Washington State Conservation Reserve Enhancement Program. The Conservation Reserve Enhancement Program (CREP) is a voluntary federal incentive program for farmers, which aims to improve water quality and biodiversity along streams nationwide. This program aims to improve riparian habitat while lessening farmers’ financial burden for restoration and conservation. The U.S. Department of Agriculture’s Farm Service Agency administers CREP, in partnership with state, tribal, and private agencies.
In Washington State, the federal CREP program has partnered with the Washington State Conservation Commission and the Farm Service Agency (FSA). These agencies have cooperatively administered Washington CREP since its inception in 1999. This program provides incentives to restore and improve salmon and steelhead habitat on private land.72 It is voluntary and offers financial incentives for farmers to restore native vegetation to buffers along salmon streams and to preclude agricultural activities in those areas during the contract duration, which is 10 to 15 years.73
There are number of eligibility requirements for participation in CREP, which include requirements for the land, stream, and participant. Basic eligibility requirements oblige the potential land to: (1) have the required cropping history, (2) support the required vegetation, and (3) be parallel and adjacent to an eligible stream.74 For the CREP forested riparian buffer, there are 10,000 miles of streams designated as eligible. Only landowners are eligible to participate in the contract. The landowner furthermore must have owned or operated the property for at least 12 months prior to offering it for CREP. 75
71 American Farmland Trust. No date. Washington: Partnering for Farms and Salmon. http://www.farmland.org/resources/reports/default.asp.
72 Washington State Conservation Commission. 2010. Fact Sheet: Conservation Reserve Enhancement Program (CREP) Washington State. April.
73 Smith, C. 2006. Evaluation of CREP Riparian Buffers in Washington State. Washington State Conservation Commission. April.
74 Washington State Conservation Commission. 2010. Fact Sheet: Conservation Reserve Enhancement Program (CREP) Washington State. April.
75 Washington State Conservation Commission. 2010. Fact Sheet: Conservation Reserve Enhancement Program (CREP) Washington State. April.

Funding Strategy for the Strategic Initiatives from the 2012-2013 Puget Sound Action Agenda
Volume 2: Technical Report 108
Table A-2: Financial Reimbursement within the CREP Washington State Program
Type of Reimbursement Amount of Reimbursement Details
Annual Rental Payments CREP rental rate incentives are based on the average “soil rental rates” (SRR) for the site times at the following rental rates:1
Forested Riparian Buffers 200% Must be planted to native trees and shrubs suitable to the site. Grasses will also be included if necessary. The minimum buffer width is 35’ and the maximum is 180’.
Hedgerow Buffers 175% Hedgerows are a 15’ buffer planted to woody vegetation. The species planted must be native. These are limited to salmonid-bearing streams 15’ wide or less.
Grass Filter Strips 150% Can range from 20’ to 120’. Enrollment is limited to non-salmonid bearing water courses within the watershed containing a designated stream.
Signing Incentive Payments (SIP) $100 per enrolled acre Issued shortly after the contract is approved. Cost share reimbursement for establishment
50% from FSA 10% from Washington State
Issued in two components. The components are limited to normal, eligible installation costs approved by the FSA and all are issued after installation of the practice.
Practice Incentive Payment (PIP) 40% May not be issued until the entire practice is installed. See Practice Installation Loans.
Maintenance Payments 100% of eligible costs After CREP is installed, Washington State will pay costs of maintaining the cover to specifications for up to 5 years.
Practice Installation Loans PIP cannot be issued until installation is complete. To limit the financial burden, conservation districts can proved 0% interest loans for the PIP portion of reimbursement.
1Average SRRs for enrolled land can vary from $50 to $215, times the associated rental rate percentages. SRRs are based on dryland agricultural rents in the county, adjusted for the enrolled soils’ inherent productivity.
Source: Adapted by ECONorthwest from Washington State Conservation Commission. 2010. Fact Sheet: Conservation Reserve Enhancement Program (CREP) Washington State. April.
Program participants are eligible for financial reimbursements outlined in Table A-‐‑2. FSA annual rental payments, including the incentives, SIPs and PIPs, are subject to a $50,000 per-‐‑year payment limitation that applies to all other CRP payments the participants may earn.76 There is no limitation on cost share payments or the State maintenance payments other than eligible cost caps.
Since the program began in Washington State, participants have signed 576 contracts and planted 9,565 acres of riparian buffer at an average width of 150 feet and spanning a length of 553 miles.77 The U.S. Department of Agriculture
76 Washington State Conservation Commission. 2010. Fact Sheet: Conservation Reserve Enhancement Program (CREP) Washington State. April.
77 Becker, D. Conservation Commission, quoted in Smith, C. 2006. Evaluation of Riparian Buffers in Washington State.

Funding Strategy for the Strategic Initiatives from the 2012-2013 Puget Sound Action Agenda
Volume 2: Technical Report 109
(USDA) has paid an average of $1,008,045 each year to Washington landowners in rental payments for these protected buffers.78
Mitigation Banking. In addition to conservation banking, mitigation banking is a market-‐‑based approach to preserving wetlands. Public or private entities, called mitigation bankers or bank sponsors, can restore and preserve wetlands, streams, and other aquatic resources in exchange for credits. Mitigation bankers can sell these credits to regulated parties who must provide wetland or buffer mitigation for a permitted project. The Mitigation Bank Review Team (MBRT), a group of regulatory agencies on the local, state, and federal level, regulates mitigation banks nationwide. The MBRT is also responsible for issuing credits and approving the sale of those credits. King County’s Mitigation Reserves Program is a local successful example.
Clean Water Act. Section 404 of the Clean Water Act (CWA §404) establishes a federal program to regulate the discharge of material into federally jurisdictional wetlands, streams, and other waters. As part of the CWA §404, regulated entities must compensate for unavoidable impacts to waters by purchasing offset credits. A regulatory guidance document directs mitigation banks, which can generate wetland and stream credits. The guidance document describes the physical and legal characteristics of the bank, the proposed litigation design, the net ecological benefit that will result from implementation of the proposal, the total number of mitigation credits generated at the bank, and the schedule for releasing those credits.79
There are a number of criteria used to evaluate a site’s potential for developing a successful mitigation bank. These criteria include the market and land-‐‑use considerations outlined in Table A-‐‑3.
78 Smith, C. 2006. Evaluation of CREP Riparian Buffers in Washington State. Washington State Conservation Commission. April.
79 Normanly, B. 2007. A Primer on Mitigation Banking: Process and Potential Revenue. Forest Landowner. November/December.

Funding Strategy for the Strategic Initiatives from the 2012-2013 Puget Sound Action Agenda
Volume 2: Technical Report 110
Table A-3: Clean Water Act Site Selection Criteria
Banking Market Criteria Land-Use Criteria
The potential bank site is located in a high-growth watershed that is not saturated with existing mitigation banks.
Mitigation banking is consistent with adjacent land uses and will not create complications arising from neighboring properties or infrastructure (e.g., existing roads, utility lines, impoundments, etc.).
The potential bank is located within an area in which credits are required for large local, state, and federal projects, e.g., state department of transportation road projects, military base expansion, reservoirs, landfills, etc.
The potential bank site contains ditches, constructed waterways, tile drainage, levees, and other manmade structures that have altered the site’s natural hydrologic regime.
The potential bank is located within a watershed listed, or is otherwise considered by the regulatory agencies as high priority.
The potential bank site contains impounded, channelized, or straightened streams in which natural channel form can be restored.
The potential bank site contains wetland or stream buffers in which vegetation consisting of planted pine monoculture, pasture grasses, or agricultural crops can be replaced with native species.
Source: Normanly, B. 2007. A Primer on Mitigation Banking: Process and Potential Revenue. Forest Landowner. November/December.
Habitat Bank: Mitigation Banking in Washington State. Habitat Bank is a private organization that develops and operates mitigation banks in Washington State. This program has six current mitigation bank projects, which Table A-‐‑4 outlines below. Washington State’s Department of Ecology has approved the Habitat Bank through its pilot banking program.
Table A-4: Available Mitigation Banks in Washington
Mitigation Bank Details
Snohomish Basin Mitigation Bank This bank serves the Snohomish, Skykomish and Snoqualmie drainage basins. It has credits available for sale for critical area impacts within its service area.
King County Mitigation Reserves Program Program increases success and efficient targeting of mitigation spending for riparian buffers, wetlands, rivers and streams.
Colombia River Mitigation Basin In conjunction with the Port of Vancouver, this bank serves 162 acres of the Colombia River floodplain in Clark, Cowlitz, and Skamania Counties. Credits will be available in 2010.
Lake Washington-Sammamish Watershed Bank This bank will serve King and Snohomish Counties, WRIA 8 and the Lake Washington and Sammamish watershed. The proposal is currently under evaluation by the MBRT.
East Fork Lewis Mitigation Bank This bank will restore approximately 100 acres of wetland habitat and provide mitigation credits for the East Fork Lewis Watershed. This bank will serve portions of the cities of Battleground, Ridgefield and La Center and drainages such as Gee, Allen and the upper end of Mill Creek. Credits will be available in 2010.
Battle Ground Mitigation Project Located in the City of Battle Ground, this project will restore approximately 60 acres of wetland habitat and provide credits for projects within in the city.
Source: Adapted by ECONorthwest from Habitat Bank and Mitigation Banking. http://www.habitatbank.com/home.html and King County. 2014. Mitigation Reserves Program. http://www.kingcounty.gov/environment/waterandland/wetlands/mitigation-credit-program.aspx#basics

Funding Strategy for the Strategic Initiatives from the 2012-2013 Puget Sound Action Agenda
Volume 2: Technical Report 111
Forterra: Transfer of Development Rights. Forterra [formerly Cascade Land Conservancy (CLC)] works with landowners, local governments, and developers to identify and conserve priority natural areas. The Conservancy compensates farm and forest owners using traditional approaches such as land purchases, conservation easements and donations of land, as well as innovative tools such as mitigation banking, transfer of development rights, and conservation development.
In 2007 CLC cooperated with Pierce County, Washington to create a voluntary transfer of development rights (TDR) program that partners farm owners and developers.80 In these initiatives, agricultural landowners sell the development rights to their properties to developers who want to build in greater density areas. The program’s first two transactions protected 89 acres of family-‐‑owned forested land in June, 2009.81 CLC has developed or is developing similar TDR programs with Kittitas County, the City of Tacoma, the City of Sammamish, and the City of Snohomish. King County has developed its own, similar TDR program as well.
80 Forterra/Cascade Land Conservancy. 2008. Transfer of Development Rights (TDR) in Washington State: Overview, Benefits, and Challenges. Jeff Aken, Jeremy Eckert, Nancy Fox, and Skip Swenson. http://www.forterra.org/files/resources/TDR_in_WA_State_1.pdf.
81 Tacoma Daily Index. 2009. Cascade Land Conservancy: TDR program saves 90 acres of Pierce County Forest. July 19.