funding federal civil rights enforcement: 2005 · office of federal contract compliance programs,...
TRANSCRIPT

U.S. Commission on Civil Rights
September 2004
FUNDING FEDERAL CIVIL RIGHTS ENFORCEMENT: 2005

U .S. Commission on Civil Rights The U.S. Commission on Civil Rights is an independent, bipartisan agency established by Congress in 1957. It is directed to: Investigate complaints alleging that citizens are being deprived of their right to vote by
reason of their race, color, religion, sex, age, disability, or national origin, or by reason of fraudulent practices.
Study and collect information relating to discrimination or a denial of equal protection of the
laws under the Constitution because of race, color, religion, sex, age, disability, or national origin, or in the administration of justice.
Appraise federal laws and policies with respect to discrimination or denial of equal protection
of the laws because of race, color, religion, sex, age, disability, or national origin, or in the administration of justice.
Serve as a national clearinghouse for information in respect to discrimination or denial of
equal protection of the laws because of race, color, religion, sex, age, disability, or national origin.
Submit reports, findings, and recommendations to the President and Congress.
Issue public service announcements to discourage discrimination or denial of equal protection
of the laws.
embers of the Commission M Mary Frances Berry, Chairperson Cruz Reynoso, Vice Chairperson Jennifer C. Braceras Christopher Edley, Jr. Peter N. Kirsanow Elsie M. Meeks Russell G. Redenbaugh Abigail Thernstrom Les Jin, Staff Director U.S. Commission on Civil Rights 624 Ninth Street, NW Washington, DC 20425 (202) 376-8128 voice (202) 376-8116 TTY www.usccr.gov

FUNDING FEDERAL CIVIL RIGHTS ENFORCEMENT: 2005

Acknowledgments This report was produced under the direction of Terri A. Dickerson, assistant staff director for civil rights evaluation. The report was prepared by Margaret Butler, civil rights analyst. Teresa Brooks provided assistance. Dawn Sweet,* editor, helped prepare the report for publica-tion, and Dorothy Pearson-Canty provided duplicating services. * No longer with the Commission.
ii

Contents
Introduction ...........................................................................................................................1
Scope and Methodology ........................................................................................................2 Analysis .................................................................................................................................3
1. Office for Civil Rights, U.S. Department of Education ...................................................6
Budget Analysis.....................................................................................................................6 Staffing and Workload Analysis............................................................................................7 Strategic and Output Measures..............................................................................................9
2. U.S. Equal Employment Opportunity Commission ......................................................11
Budget Analysis...................................................................................................................11 Staffing and Workload Analysis..........................................................................................12 Strategic and Output Measures............................................................................................15
3. Office of Federal Contract Compliance Programs, U.S. Department of Labor ..........17
Budget Analysis...................................................................................................................17 Staffing and Workload Analysis..........................................................................................18 Strategic and Output Measures............................................................................................21
4. Civil Rights Division, U.S. Department of Justice........................................................23
Budget Analysis...................................................................................................................23 Staffing and Workload Analysis..........................................................................................24
Disability Rights Enforcement ........................................................................................25 Coordination and Review................................................................................................26 Voting Rights Enforcement.............................................................................................27 Civil Rights Prosecution..................................................................................................27 Fair Housing Enforcement ..............................................................................................28
Strategic and Output Measures............................................................................................29 5. Office for Civil Rights, U.S. Department of Health and Human Services ...................31
Budget Analysis...................................................................................................................31 Staffing and Workload Analysis..........................................................................................33 Strategic and Output Measures............................................................................................35
6. U.S. Department of Housing and Urban Development—Office of Fair Housing and
Equal Opportunity (FHEO), Fair Housing Assistance Program (FHAP), and Fair Housing Initiatives Program (FHIP)...............................................................................38 FHEO...................................................................................................................................38 Budget Analysis ..............................................................................................................39 Staffing and Workload Analysis .....................................................................................40FHAP...................................................................................................................................44 Budget Analysis ..............................................................................................................44FHIP ....................................................................................................................................45 Budget Analysis ..............................................................................................................45Strategic and Output Measures............................................................................................47
iii

Introduction The year 2004 marks 40 years since Congress passed the Civil Rights Act of 1964, and 50 years since the two historic Brown v. Board of Education cases,1 which ordered Southern schools to integrate “with all deliberate speed.” In recognition of the anniversaries, Ameri-cans are gathering to take stock of how much has been accomplished, and how much yet must be done to ensure equality for all. The Commission’s recent studies have demonstrated, for example, that many Native Americans continue to live in substandard conditions and suf-fer higher rates of poverty, lower levels of educational attainment, and higher rates of health care problems;2 impediments to enforcing voting rights still exist;3 and federal agencies given the authority and responsibility to enforce the laws to protect the civil rights of individuals often fail at their civil rights obligations.4 It is thus imperative that agencies charged with en-forcing the laws that protect civil rights posses sufficient funding to do so. The Commission’s Office of Civil Rights Evaluation (OCRE), over a period of years, has reviewed data relevant to civil rights enforcement funding, staffing, and workload levels. This year, OCRE analyzed data representing fiscal years5 1994 to 2005 for:
U.S. Department of Education (DOEd), Office for Civil Rights (OCR) U.S. Department of Justice (DOJ), Civil Rights Division (CRD) U.S. Department of Health and Human Services (HHS), Office for Civil Rights (OCR) U.S. Equal Employment Opportunity Commission (EEOC) U.S. Department of Labor, Office of Federal Contract Compliance Programs (OFCCP) U.S. Department of Housing and Urban Development (HUD), Office of Fair Housing
and Equal Opportunity (FHEO), which includes the Fair Housing Assistance Program (FHAP) and the Fair Housing Initiatives Program (FHIP)
OCRE also analyzed each agency’s civil rights goals and output evaluation factors for 2003 and 2004.
1 Brown v. Board of Education, 347 U.S. 483 (1954); Brown v. Board of Education, 39 U.S. 294 (1955). The 1954 case is referred to as Brown I and the 1955 case is often referred to as Brown II. Brown II was necessary because the courts could not agree on a remedy as it related to Brown I. See Harrell R. Rodgers, Jr., and Charles S. Bullock, III, “Law and Social Change: Civil Rights Laws and Their Consequences,” 1972, p. 70. 2 U.S. Commission on Civil Rights, A Quiet Crisis: Federal Funding and Unmet Needs in Indian Country, July 2003. 3 U.S. Commission on Civil Rights, Election Reform: An Analysis of Proposals and the Commission’s Recom-mendations for Improving America’s Election Systems, November 2001. 4 U.S. Commission on Civil Rights, Ten-Year Check-Up: Have Federal Agencies Responded to Civil Rights Rec-ommendations—Volume II: An Evaluation of the Departments of Justice, Labor, and Transportation, September 2002; Ten-Year Check-Up: Have Federal Agencies Responded to Civil Rights Recommendations—Volume III: An Evaluation of the Departments of Agriculture and the Interior, the Environmental Protection Agency, and the Small Business Administration, September 2003. 5 Throughout this report, all referenced years are expressed in the federal government accounting period that begins October 1 and ends September 30.
1

Since 1957, Congress and the President have greatly expanded the federal civil rights effort through the creation of additional substantive rights and enforcement agencies. Today, the major statutes and executive orders affecting civil rights enforcement are:
Equal Pay Act of 1963 Civil Rights Act of 1964 Voting Rights Act of 1965 President Johnson’s Executive Order 11246 of 1965 Age Discrimination in Employment Act of 1967 Title VIII of the Civil Rights Act of 1968 Title IX of the Education Amendments of 1972 Equal Employment Opportunity Act of 1972 Rehabilitation Act of 1973 Voting Rights Act Amendments of 1975 Age Discrimination Act of 1975 President Carter’s Reorganization Plan No. 1 Executive orders relating to equal opportunity in 1978–1979 Voting Rights Amendments of 1982 Civil Rights for Institutionalized Persons Act of 1986 Housing and Community Development Act of 1987 Civil Rights Restoration Act of 1987 Civil Liberties Act of 1988 Fair Housing Amendments Act of 1988 Americans with Disabilities Act of 1990 Civil Rights Act of 1991 Voting Rights Language Assistance Act of 1992 Boy Scouts of America Equal Access Act
Scope and Methodology The Commission tracked and analyzed the budget requests of the William J. Clinton and George W. Bush administrations from 1994 to 2005, as well as the funding levels appropri-ated by Congress in response to the Presidents’ requests. The Office of Civil Rights Evalua-tion documented the changes in workload and staffing levels of the six civil rights agencies. To do so, it requested from each agency budget and workload data as well as information on outputs and goals. The information in this report is based on documents and data that the agencies provided in response to interrogatories and requests. Staff also secured public documents from the Internet. In some instances, agencies have made corrections to budget data submitted in previous years because of rescissions or transfers added after funding ap-propriations were made.
All references to real funding are expressed in constant 1994 dollars. Expression in constant dollars accounts for inflationary trends and more accurately reflects the actual purchasing power of the funds. In previous Commission reports, as well as this one, adjusted values have been referred to as “real funding” or “real spending power.” The deflators used are the same as those used by OMB in the U.S. Office of Management and Budget, Budget of the United States: Historical Tables, Fiscal Year 2005, Table 1.3. The deflators have been used in other analyses performed by the Commission, including its 1995 Funding Federal Civil Rights En-forcement report, its 2001 Funding Federal Civil Rights Enforcement: 2000 and Beyond re-
2

port, its 2002 Funding Federal Civil Rights Enforcement: 2000–2003 report, and its 2003 Funding Federal Civil Rights Enforcement: 2004 report.
Analysis Funding is an important part of presidential policy-making and also an indicator of govern-ment commitment to civil rights.6 While the President may make his priorities known in his requests, Congress ultimately determines how much will be appropriated. With adequate funding and resources, civil rights agencies can execute and strengthen their enforcement programs by (1) efficiently and expeditiously processing complaints; (2) providing necessary education and outreach and technical assistance; (3) updating and issuing policy guidance as needed; (4) conducting more compliance reviews; and (5) providing staff training. Agencies are hindered from enforcing laws against discrimination when they do not have adequate re-sources.
To improve the internal working of the federal government, GOP legislators with bipartisan support, initiated the Government Performance and Results Act (GPRA) in 1993 and now require agencies to submit plans along with budget requests. Among other things, agency plans must include: (1) which performance goals they will pursue and (2) how they will measure progress. Agencies must also prepare performance reports on progress made during the previous year, including explanations for unmet goals. Since GPRA requires a direct linkage between performance reports and an agency’s budget request, Congress can ulti-mately use GPRA as a tool to determine an agency’s appropriation.
Since 1995, the Commission has issued numerous reports describing and analyzing the budget requests and congressional appropriations for civil rights enforcement agencies and programs. In each of its reports, the Commission concluded that inadequate funding has hin-dered most of these agencies from sufficiently exercising their civil rights authority.7
For 2005, after accounting for inflation, the President’s request amounts to increases for three civil rights enforcement agencies, which includes one of HUD’s programs.8 Of the six agen-cies, the President requested the largest increase for EEOC, 3 percent, followed by HUD/FHIP for which the President requested a 2 percent increase. The President’s largest request for de-creased funding is a 10.6 percent reduction for HUD/FHAP (see Summary Table 1).
6 Steven A. Schull, American Civil Rights Policy from Truman to Clinton—The Role of Presidential Leadership, 1999, p. 104. 7 U.S. Commission on Civil Rights, Funding Federal Civil Rights Enforcement, June 1995; Funding Federal Civil Rights Enforcement: 2000 and Beyond, February 2001; Funding Federal Civil Rights Enforcement: 2000–2003, April 2002; Funding Federal Civil Rights Enforcement: 2004, June 2003. 8 HUD’s FHAP and FHIP programs are evaluated separately in this study.
3

Summary Table 1—Civil Rights Enforcement Funding, FY 2003–2005 (1994 inflation-adjusted dollars) Civil rights enforcement agency
President’s request
Congressional appropriation
FY 2003–2004 change DOEd ↓ 0.1% ↑ 1.3% EEOC ↑ 4.4% ↑ 2.2% OFCCP ↑ 1.2% 0.0% DOJ/CRD ↑ 2.4% ↑ 2.3% HHS ↑ 0.7% ↑ 1.1% HUD/FHEO ↑ 2.6% ↓ 28.3% HUD/FHAP ↑ 6.0% ↑ 13.9% HUD/FHIP ↓ 0.6% ↓ 9.7% FY 2004–2005 change DOEd ↓ 0.1% EEOC ↑ 3.0% OFCCP ↑ 0.9% DOJ/CRD ↓ 2.1% HHS ↑ 1.4% HUD/FHEO ↓ 8.1% HUD/FHAP ↓ 10.6% HUD/FHIP ↑ 2.0%
For 2004, President Bush requested budget increases for six civil rights enforcement of-fices, which includes HUD’s FHEO program, but not DOEd and HUD’s FHIP (see Sum-mary Table 1).
Furthermore:
Since 1994, DOEd/OCR’s budget, in actual dollars, has increased 56.1 percent. But after adjusting for inflation, the agency realized a 28 percent increase during that pe-riod. For each fiscal year between 1994 and 2004, had Congress appropriated the President’s request, DOEd/OCR’s budget would have increased 61.3 percent, 32.7 percent after adjusting for inflation. Between 1994 and 2003, OCR’s full-time-equivalent staff (FTE) level decreased 20.3 percent and the number of initiated com-pliance reviews decreased 48.6 percent. The number of backlogged complaints is now lower than the 1994 level.
Between 1994 and 2004, congressional appropriations for EEOC increased 42.8 per-cent. After adjusting for inflation, EEOC’s budget has increased only 17.5 percent in the past nine years. If Congress meets the President’s request for 2005, EEOC’s budget would have increased 52.5 percent in actual dollars, and 23.3 percent in real spending power between 1994 and 2005. After decreasing to a low of 2,544 in 1998, the number of FTEs now stands at 2,617, which is nearly 8 percent less than the 1994 level. EEOC’s private sector pending inventory decreased 66.1 percent, from 86,547 in 1994 to 29,368 in 2003. Pending inventory for federal sector enforcement after in-
4
creasing from 1994 through 1999, has continuously declined. The majority of EEOC’s total resolutions continue to fall under the no cause decision category.
Since 1994, OFCCP’s budget has increased 40.7 percent. But once inflation is taken into account, this increase amounts to 16 percent. Had the President’s requests been met between 1994 and 2004, OFCCP would have received an increase of 44.4 per-cent, which would have represented an 18.8 percent increase after adjusting for infla-tion. Between 1994 and 1997, the number of FTEs declined, as did the number of resolved complaints and compliance reviews.
Of the federal agencies reviewed in this report, DOJ/CRD received the largest per-centage budget increase over the past 11 years. Between 1994 and 2004, the division’s budget grew 81.5 percent, 49.2 percent after adjusting for inflation. Between 1994 and 2004, if Congress had approved funding based on the President’s request, DOJ/CRD’s budget would have grown 86 percent in actual dollars and 52.9 percent in real dollars. Between 1994 and 2003, CRD’s FTE level increased 32 percent, with all its sections, except for the Coordination and Review Section, receiving additional staff.
Between 1994 and 2004, congressional appropriations for HHS/OCR increased 52.8 percent in actual dollars, 25.7 percent after adjusting for inflation. Had the President’s requests been met between 1994 and 2004, HHS/OCR’s budget would have increased 54.4 percent in actual dollars and 27 percent in real dollars. In 2003, OCR had fewer staff (244 FTEs) than in 1994 (284 FTEs). After decreasing between 2000 and 2002, pending inventory of post-grant reviews and investigations increased 10 percent be-tween 2002 and 2003.
For 11 consecutive years, Congress has appropriated less than the President requested for HUD/FHEO. Between 1994 and 2004, congressional appropriations for FHEO decreased 2.8 percent. After adjusting for inflation, FHEO realized a huge 20 percent decrease in its budget. Even if Congress had granted the President’s request between 1994 and 2004, FHEO would still have received decreased funding. The President’s request would have amounted to a decrease in funding of 0.2 percent, and after ad-justing for inflation FHEO’s spending power would have been reduced 17.8 percent. The number of FTEs dedicated solely to complaint processing continuously increased between 2000 and 2003. The total number of program compliance complaints that FHEO reviewed and processed, as well as reviews it conducted, increased between 1994 and 2003.
Of the two HUD programs, FHAP has received the larger increase in funding in the past 10 years. Between 1994 and 2004, FHAP’s budget increased 514.1 percent. As for real spending, the budget has grown 406.7 percent.
Unlike FHAP, between 1994 and 2004, FHIP’s budget decreased 1.1 percent in ac-tual dollars and 18.5 percent in real dollars. FHIP’s spending power is now less than it was in 1994. Had Congress granted the President’s requests between 1994 and 2004, FHIP’s budget would have increased 19.8 percent in actual dollars, but de-creased 1.2 percent in real spending power.
5
Chapter 1 Office for Civil Rights, U.S. Department of Education The Department of Education’s (DOEd) Office for Civil Rights (OCR) is responsible for en-forcing the following antidiscrimination statutes:
Title VI of the Civil Rights Act of 1964 Title IX of the Education Amendments of 1972 Section 504 of the Rehabilitation Act of 1973 Age Discrimination Act of 1975 Title II of the Americans with Disabilities Act of 1990 Boy Scouts of America Equal Access Act
These laws apply throughout the nation and coverage extends to nearly 15,000 school dis-tricts; more than 4,000 colleges and universities; about 5,000 proprietary organizations, such as training schools for truck drivers and cosmetologists; and thousands of libraries, museums, vocational rehabilitation agencies, and correctional facilities.
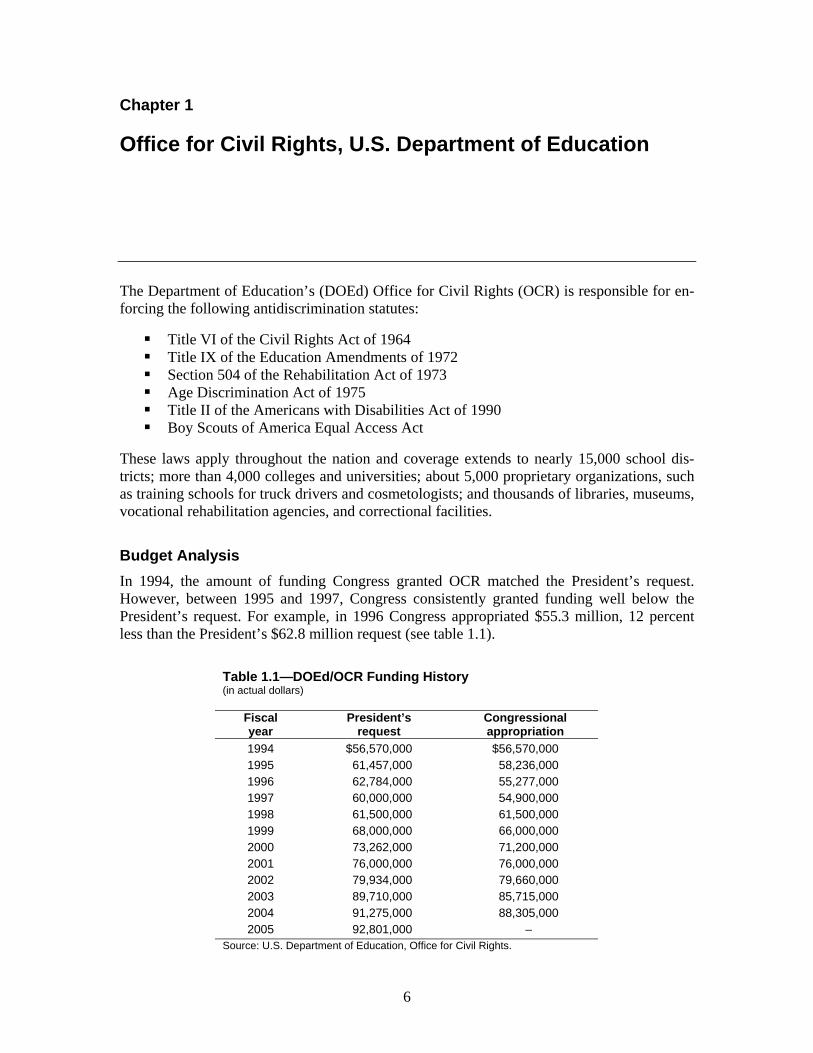
Budget Analysis In 1994, the amount of funding Congress granted OCR matched the President’s request. However, between 1995 and 1997, Congress consistently granted funding well below the President’s request. For example, in 1996 Congress appropriated $55.3 million, 12 percent less than the President’s $62.8 million request (see table 1.1).
Table 1.1—DOEd/OCR Funding History (in actual dollars)
Fiscal year
President’s request
Congressional appropriation
1994 $56,570,000 $56,570,000 1995 $61,457,000 $58,236,000 1996 $62,784,000 $55,277,000 1997 $60,000,000 $54,900,000 1998 $61,500,000 $61,500,000 1999 $68,000,000 $66,000,000 2000 $73,262,000 $71,200,000 2001 $76,000,000 $76,000,000 2002 $79,934,000 $79,660,000 2003 $89,710,000 $85,715,000 2004 $91,275,000 $88,305,000 2005 $92,801,000 $–
Source: U.S. Department of Education, Office for Civil Rights.
6

Beginning in 1998, congressional appropriations began to increase steadily, as did the amount of funding requested by the President. Although OCR’s funding increased, the amounts were not sufficient to keep pace with inflation. For example, in 2003 OCR received funding of $85.7 million, but after adjusting for inflation the amount was worth $71.8 million (see table 1.1 and figure 1.1).
Figure 1.1—DOEd/OCR Funding History (in constant 1994 dollars)
72.768.156.6
66.163.456.8 52.8 51.4 57.0 60.3 71.8
75.0
56.660.0 59.9
56.2 57.062.1
65.2 66.1 68.475.2 75.1
0.0
10.0
20.0
30.0
40.0
50.0
60.0
70.0
80.0
1994 1995 1996 1997 1998 1999 2000 2001 2002 2003 2004 2005
Fiscal year
Mill
ions
of d
olla
rs
Congressional appropriation President's request
Source: Calculated from table 1.1.
Between 2003 and 2004, OCR’s budget increased 3 percent, from $85.7 million to $88.3 mil-lion. After adjusting for inflation, the $88.3 million was worth $72.7 million. For 2005, the President is requesting $92.8 million, which is only 1.7 percent more than the level requested in 2004 (see table 1.1). If Congress grants the President’s request, after adjusting for inflation OCR will receive $75 million. Based on the amounts of funding Presidents have requested between 1994 and 2005, and if honored, OCR’s budget would have increased $36.2 million, $18.4 million after adjusting for inflation.
Staffing and Workload Analysis Approximately 80 percent of OCR’s annual budget is allocated for staffing. As OCR’s fund-ing level decreased, so did its full-time staff. The number of FTEs declined from 821 in 1994 to 681 in 1997. The largest annual decrease in the number of FTEs occurred between 1996 and 1997, from 744 to 681 (see table 1.2). Between 1998 and 1999, OCR’s staff grew nearly 8 percent but began decreasing again the following fiscal year. The 2003 level was 654 FTEs, 90 percent of whom were responsible for complaint processing, conducting compliance re-views, providing technical assistance, monitoring resolution agreements, developing policy guidance, providing technical assistance, responding to customer inquiries, and other en-
7

forcement activities. At no time during the past 11 years has the number of full-time employ-ees returned to the 1994 level. When asked what effect staff decreases had on OCR’s ability to fulfill its mission, agency officials said none but could not elaborate as to how the office carried out its duties given the 6 percent staff reduction between 2002 and 2003.1
Table 1.2—DOEd/OCR Staffing History
Fiscal year FTE level 1994 821 1995 788 1996 744 1997 681 1998 685 1999 737 2000 712 2001 696 2002 698 2003 654
Source: U.S. Department of Education, Office for Civil Rights.
As the number of staff declined, OCR’s workload increased. Decreasing staff during the 1990s may have hindered OCR from resolving all its complaints within the fiscal year in which they were received. During the early 1990s, OCR focused on investigating rather than resolving complaints, which could also have accounted for its inability to resolve complaints in a timely manner.2 In 1997, when OCR’s budget did not increase from the previous year and its staff had been cut by 8.5 percent, it resolved 4,981 of the 5,296 complaints it received. In 2003, OCR received 5,128 complaints of which 5,225 were resolved (see table 1.3).
1 U.S. Commission on Civil Rights, Ten-Year Check-Up: Have Federal Agencies Responded to Civil Rights Rec-ommendations? Volume IV: An Evaluation of the Departments of Education, Health and Human Services and Housing and Urban Development, and the Equal Employment Opportunity Commission (forthcoming), Septem-ber 2004 (hereafter cited as USCCR, Ten-Year Check-Up, Vol. IV). 2 U.S. General Accounting Office, “Department of Education: Resolving Discrimination Complaints Has Im-proved with New Processing System,” Mar. 23, 1999.
8

Table 1.3—DOEd/OCR Workload History
Fiscal year
Complaints received
Complaints resolved
1994 5,302* 5,751 1995 4,981* 5,559 1996 4,828* 4,886 1997 5,296* 4,981 1998 4,827* 4,753 1999 6,628* 5,369 2000 4,897* 6,364 2001 4,571* 4,777 2002 5,019* 4,842 2003 5,128* 5,225
*1,614 of these complaints were filed by a single complainant. Source: U.S. Department of Education, Office for Civil Rights.
As OCR’s backlog of complaints was increasing in 1999 and 2000, the number of compliance reviews it initiated was decreasing. Between 1997 and 2002, the number of compliance reviews initiated fell 93 percent, from 152 to 11, respectively. OCR initiated fewer compliance reviews between 1998 and 2002 due to an increased monitoring workload.3 With the number of com-plaints rising, OCR cut back the number of compliance reviews initiated; however, the number is again rising. In 2003, OCR initiated 74 compliance reviews (see table 1.4).
Table 1.4—DOEd/OCR Compliance Workload
Fiscal year
Compliance reviews initiated
1994 144 1995 196 1996 146 1997 152 1998 102 1999 176 2000 147 2001 121 2002 111 2003 174
Source: U.S. Department of Education, Office for Civil Rights.
Strategic and Output Measures While the number of complaints resolved and compliance reviews initiated are indicators of OCR’s workload, they do not comprehensively measure program effectiveness or mission accomplishment. OCR has developed performance indictors in response to Government Per-formance and Results Act (GPRA) requirements. OCR uses these GPRA performance indica-tors in its strategic self-evaluation and also in the annual budget request to OMB. OMB and Congress measure OCR’s effectiveness by reviewing its ability to reach certain targets. OCR’s goal is to ensure equal access to education and promote educational excellence 3 USCCR, Ten-Year Check-Up, Vol. IV.
9
throughout the nation through the vigorous enforcement of civil rights. To meet that goal, OCR pursues two objectives: (1) to eliminate discriminatory educational practices within schools and (2) to obtain results through efficient management of civil rights compliance ac-tivities. OCR will use the same GPRA measures in FY 2004 that it used in FY 2003.4
To evaluate its goal to eliminate discriminatory educational practices within schools, OCR measures (1) the percentage of technical assistance it provides to recipients5 and (2) the per-centage of technical assistance it provides to parents. For 2003, OCR established a perform-ance target that 50 percent of its technical assistance materials would help recipients identify and fulfill federal civil rights obligations. OCR’s actual performance of 76 percent exceeded its target. OCR also set a performance target that 20 percent of its materials would assist par-ents in understanding recipients’ federal civil rights obligations; OCR’s actual performance was 40 percent.6
OCR also sets goals for obtaining results through efficient management of civil rights com-pliance activities. OCR measures the percentage of complaints resolved within 180 days of receipt. In each year between 2001 and 2003, OCR exceeded its performance target of resolv-ing 80 percent of its complaints within 180 days. According to OCR, in 2003, 91 percent of complaints were resolved within 180 days of receipt.7
4 U.S. Department of Education, Office for Civil Rights’ Response to the U.S. Commission on Civil Rights’ In-terrogatory for Funding, Feb. 20, 2004, pp. 1–2 (hereafter cited as DOEd Funding Interrogatory). 5 A recipient is a state or its political subdivision, instrumentally of a state or its subdivision, trust territory, pub-lic or private agency, institution, organization, or other entity, or person to which federal assistance is extended. 6 DOEd Funding Interrogatory, p. 1. 7 Ibid., p. 21.
10

Chapter 2 U.S. Equal Employment Opportunity Commission The Equal Employment Opportunity Commission (EEOC), established by Title VII of the Civil Rights Act of 1964, enforces the following federal statutes:
Equal Pay Act of 1963 Title VII of the Civil Rights Act of 1964, as amended Age Discrimination in Employment Act of 1967 Section 501 and 505 of the Rehabilitation Act of 1973, as amended Title I and Title V of the Americans with Disabilities Act of 1990 Civil Rights Act of 1991
Throughout its existence, EEOC has focused on the elimination of illegal discrimination from the workplace. With its headquarters in Washington, D.C., and through the operations of 50 field offices nationwide, EEOC interprets federal employment discrimination laws, monitors programs that protect federal workers from employment discrimination, provides funding and support to state and local fair employment practices agencies and tribal employment rights organizations, and conducts outreach and technical assistance programs. EEOC’s responsi-bilities have continued to grow, but its budget has not always increased to accommodate its workload.
Budget Analysis Only twice between 1994 and 2004 did Congress match or exceed the President’s request for funding, in 1999 and 2002. During the other years, the congressional appropriation was less than the level requested by the President by as much as 13 percent. In 2002, the President’s request was $310.0 million and Congress appropriated $310.4 million. The congressional ap-propriation was not enough to keep pace with inflation and, as a result, was worth $265.5 million (see table 2.1).
Although the congressional appropriation was often less than the President’s request between 1994 and 2002, EEOC received increased funding each year, except for 1996 when it was flat funded. In 2003, EEOC received $308.8 million, a 5.0 percent decrease from its 2002 appro-priation of $310.4 million. The 2003 appropriation was worth $258.8 million after adjusting for inflation (see figure 2.1). In 2004, EEOC’s congressional appropriation increased from $308.8 million to $328.4 million or by 6.3 percent. The President is requesting $350.7 mil-lion in funding for 2005. If Congress grants the President’s request, after adjusting for infla-tion EEOC’s budget will be worth $283.6 million (see table 2.1 and figure 2.1).
11

Table 2.1—EEOC Funding History (in actual dollars)
Fiscal year
President’s request
Congressional appropriation
1994 $234,845,000 $230,000,000 1995 $245,720,000 $233,000,000 1996 $268,000,000 $233,000,000 1997 $268,000,000 $239,740,000 1998 $246,000,000 $242,000,000 1999 $279,000,000 $279,000,000 2000 $312,000,000 $280,900,000 2001 $322,000,000 $304,000,000 2002 $310,000,000 $310,406,000 2003 $323,516,000 $308,822,000 2004 $335,000,000 $328,400,000 2005 $350,754,000 $–
Source: U.S. Equal Employment Opportunity Commission.
Figure 2.1—EEOC Funding History (in constant 1994 dollars)
254.8224.3224.5222.4227.4250.1 264.4
230.0 265.5 258.8 270.2
271.1265.1280.1277.7
254.8
228.0250.9255.8
239.8234.8
275.6 283.6
0.0
50.0
100.0
150.0
200.0
250.0
300.0
1994 1995 1996 1997 1998 1999 2000 2001 2002 2003 2004 2005
Fiscal year
Mill
ions
of d
olla
rs
Congressional appropriation President's request
Source: Calculated from table 2.1.
Staffing and Workload Analysis During the last half of the 1990s, EEOC’s actual FTE level had decreased and reached its lowest in 1998. Between 1994 and 1998, EEOC’s FTEs declined 10.2 percent. At no time within the past 10 years has EEOC been given the number of FTEs that it has requested. For
12

example, during 1996 EEOC requested 3,219 FTEs, but the actual number of FTEs for that year was 2,676, which resulted in a 17 percent gap between requested and actual staff. The gap was not as great in other years. In 2000, EEOC requested 2,946 FTE but received 2,852, resulting in a 3.2 percent difference between requested and actual staff (see table 2.2).
Table 2.2—EEOC Staffing History
Fiscal year Requested Actual 1994 3,000 2,832 1995 3,020 2,813 1996 3,219 2,676 1997 3,022 2,586 1998 2,680 2,544 1999 2,748 2,593 2000 2,946 2,852 2001 3,055 2,704 2002 3,055 2,783 2003 2,720 2,617
Source: U.S. Equal Employment Opportunity Commission.
By 2000, EEOC’s staff had once again returned to its 1994 level. However, staffing has fluc-tuated in the past three years. In 2003, EEOC’s actual staffing level of 2,617 was nearly 4 percent less than the requested 2,720, and the actual level had decreased 6 percent from the previous year (see table 2.2).
Table 2.3—EEOC Private Sector Enforcement
Fiscal year
Complaints received
Complaints resolved
Pending inventory
1994 91,189 171,563 86,547 1995 87,529 191,774 88,263 1996 77,990 103,467 69,142 1997 80,680 106,312 64,850 1998 79,591 101,470 51,561 1999 77,444 197,846 38,478 2000 79,896 193,672 34,297 2001 80,840 190,106 32,481 2002 84,442 195,222 30,245 2003 81,293 187,755 29,368
Source: U.S. Equal Employment Opportunity Commission.
As a result of implementing the Priority Charge Handling Procedures (PCHP), EEOC has continued to complete more complaints thus reducing its backlog.1 Under the PCHP system, incoming charges are prioritized into three categories based on the likelihood that discrimina-tion occurred. Between 1994 and 1996, EEOC received 15 percent fewer private sector com-plaints, resolved 45 percent more complaints, and reduced its backlog 20 percent. In 1997,
1 U.S. Commission on Civil Rights, Overcoming the Past, Focusing on the Future: An Assessment of the U.S. Equal Employment Opportunity Commission’s Enforcement Efforts, September 2000, pp. 118–19.
13

EEOC resolved 106,312 complaints, the most since 1994. Of the total complaints resolved in 1997, 61 percent were no cause decisions, 28 percent administrative closures, and 11 percent merit resolutions. Between 1994 and 2003, EEOC reduced its backlog 66 percent (see table 2.3).
Between 1994 and 1996, the number of merit resolutions decreased from 11,100 in 1994 to 9,430 in 1996. Merit resolutions began increasing in 1997 and peaked at 19,938 in 2000. Be-tween 2000 and 2003, as the total number of resolutions fluctuated, the numbers of merit resolutions and no cause decisions continued to decrease. In 2003, EEOC resolved 87,755 cases of which 19.5 percent were merit resolutions, 63.1 percent were no cause decisions, and 17.4 percent were administrative closures (see table 2.4).
Table 2.4—EEOC Resolutions
Fiscal year
Total resolutions
Merit resolutions
No cause decisions
Administrative closures
1994 71,563 11,100 (15.5%)
34,451 (48.1%)
26,012 (36.3%)
1995 91,744 10,921 (11.9%)
46,700 (50.9%)
34,153 (37.2%)
1996 103,467 9,430 (9.1%)
63,216 (61.1%)
30,821 (29.8%)
1997 106,312 11,668 (11.0%)
64,567 (60.7%)
30,077 (28.3%)
1998 101,470 12,558 (12.4%)
61,794 (60.9%)
27,118 (26.7%)
1999 97,846 16,102 (16.5%)
58,174 (59.5%)
23,570 (24.1%)
2000 93,672 19,938 (21.3%)
54,578 (58.3%)
19,156 (20.5%)
2001 90,106 19,908 (21.1%)
51,562 (57.2%)
18,636 (20.7%)
2002 95,222 19,075 (20.0%)
56,514 (59.3%)
19,633 (20.6%)
2003 87,755 17,134 (19.5%)
55,359 (63.1%)
15,262 (17.4%)
Source: U.S. Equal Employment Opportunity Commission.
Workload demands continued to rise in the federal sector between 1994 and 2000. The num-ber of hearing receipts increased 30 percent and appeal receipts increased 26 percent. Be-tween 1994 and 1999, pending inventory increased dramatically each year reaching a six-year high of 24,356 in 1999, an increase of 155 percent. Between 2000 and 2002, hearing receipts decreased and appeal receipts fluctuated, but pending inventory continued to decline. In 2003, both the number of hearing and appeal receipts increased 3.1 and 4.6 percent, respectively. Pending inventory decreased from 14,881 to 12,298, or 17.4 percent (see table 2.5).
14

Table 2.5—EEOC Federal Sector Enforcement
Fiscal year
Hearing receipts
Appeal receipts
Total pending inventory
1994 10,712 7,141 19,540 1995 10,515 8,152 12,865 1996 10,677 8,001 16,651 1997 11,198 8,453 20,155 1998 12,218 8,480 23,193 1999 12,637 8,690 24,356 2000 13,942 8,986 21,128 2001 11,812 9,634 19,195 2002 19,617 6,725 14,881 2003 19,918 7,035 12,298
Source: U.S. Equal Employment Opportunity Commission.
Strategic and Output Measures
According to EEOC, it uses 32 performance measures to evaluate the agency’s civil rights program.2 In addition, the agency uses information collected from the number of complaints resolved, number of resolutions, number of administrative closures, and number of hearing and appeal receipts to help managers assess workload inputs and outputs, and the timeliness of a process to manage its program. This information also enables management to make deci-sions about resources throughout the year. Table 2.6 highlights only those measures for which EEOC provided performance targets and actual performance data. EEOC met, sub-stantially met, or substantially exceeded all but three of its 2003 performance measures.3
EEOC did not meet the following measures:
During 2003, EEOC was required to resolve all hearings cases filed with the agency before September 30, 2001. As a result of the agency balancing workloads among field offices, time frames had to be extended.
EEOC was required to issue all investigative reports on internal EEO (equal em-ployment opportunity) complaints within 180 days. Several of the older cases could not meet this target.
EEOC was to implement a plan to reposition the agency. At the end of the fiscal year, these plans had not been completed.4
2 U.S. Equal Employment Opportunity Commission’s Response to the U.S. Commission on Civil Rights’ Inter-rogatory for Funding, Mar. 11, 2004, p. 2. 3 Ibid. 4 Ibid.
15

Table 2.6—EEOC Performance Measures, 2003 and 2004
Goals/measures Performance target
Actual performance
Measures of proficient resolution By 2009, ensure that at least 75 percent of private sector charges will be resolved within 180 days
2003 2004
60.0 65.0
68.9 –
By 2009, ensure that at least 50 percent of federal sector hearings will be resolved within 180 days
2003 2004
30.5 35.0
20.0 –
By 2009, ensure that at least 70 percent of federal sector appeals will be resolved within 180 days
2003 2004
320.0* 3145.0**
44.8 –
*29 percent of cases received in 2003. **45 percent of cases received in 2004. Source: U.S. Equal Employment Opportunity Commission, “Fiscal Year 2004 Budget Request and GPRA Annual Performance Plan,” February 2003.
All 2003 measures listed in table 2.6 will be used to ensure the efficient use of resources and effectiveness of evaluation in 2004. The three measures for which EEOC did not meet its tar-get will not be used to evaluate the agency’s effectiveness in 2004. EEOC has adopted a new strategic plan with goals that are more outcome oriented. These new goals will enable the agency to better measure its effectiveness. Some of the new measures established for 2004 include:
By 2009, reviews of investigative files indicate that the percentage of files meeting established criteria for quality is set at a certain percentage or higher. Criteria need to be defined to evaluate quality and develop a system to collect information.
By 2009, the general public rates its confidence in EEOC’s enforcement of federal equal employment laws at a certain percentage or higher. EEOC needs to design sur-vey methodology, conduct a survey, and establish a baseline of confidence.
Assess the contributions of EEOC’s private sector mediation/alternative dispute reso-lution (ADR) program toward improved workplaces.
By 2006, increase by 20 percent the number of private sector employers that agree to participate in mediation from the 2003 baseline.
By 2009, increase the percentage of federal employees who participate in ADR dur-ing the pre-complaint stage of the EEO process to 50 percent or higher.5
5 U.S. Equal Employment Opportunity Commission, “Fiscal Year 2004 Budget Request and GPRA Annual Per-formance Plan,” February 2003.
16

Chapter 3 Office of Federal Contract Compliance Programs, U.S. Department of Labor The Office of Federal Contract Compliance Programs (OFCCP) was formed in 1965 as the Office of Federal Contract Compliance. In 1971 the word “Programs” was added to the title. In the late 1970s the entire federal contract compliance program was consolidated into the Department of Labor (DOL) under OFCCP. OFCCP is responsible for ensuring that employ-ers doing business with the federal government comply with the equal employment opportu-nity (EEO) and affirmative action provisions of their contracts. The enforcement authority and responsibilities of OFCCP are encompassed in the following:
Executive Order 11246, as amended Vietnam Era Veterans’ Readjustment Assistance Act of 1974 Section 503 of the Rehabilitation Act of 1973, as amended Immigration Reform and Control Act of 1986 Title I of the Americans with Disabilities Act of 1990
OFCCP asserts its authority through the following enforcement activities: (1) conducting compliance reviews and investigating complaints; (2) negotiating conciliation agreements and letters of commitment from contractors and subcontractors who are in violation of regu-latory requirements; (3) monitoring contractor compliance and compliance reports; (4) form-ing links between contractors and DOL job-training programs; (5) providing technical assistance to aid contractor understanding of and compliance with federal nondiscrimination requirements; and (6) recommending enforcement actions to the DOL Solicitor, the depart-ment’s chief legal officer.1 OFCCP’s jurisdiction covers approximately 26 million workers, or nearly 22 percent of the total civilian workforce.2 OFCCP monitors contractors and sub-contractors with a federal contract of $50,000 or more, and 50 or more employees.
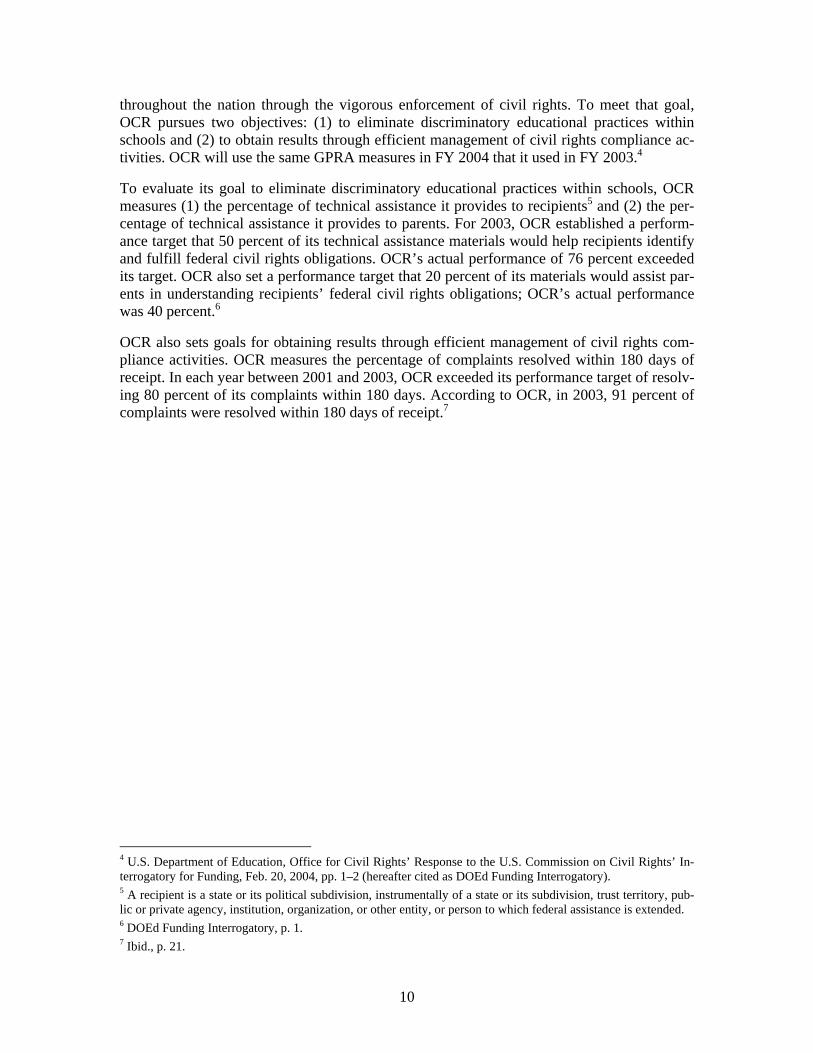
Budget Analysis Over the past 10 years, in most instances Congress did not grant OFCCP the amount of fund-ing the President requested. Only during 1994, 2002, and 2003 did Congress fund OFCCP above the level requested by the President (see table 3.1). These increases did not keep pace with inflation. After adjusting for inflation, the 2002 appropriation of $77.7 million was worth $66.2 million and the 2003 appropriation of $78.0 million was worth $65.4 million (see table 3.1 and figure 3.1).
1 U.S. Commission on Civil Rights, Funding Federal Civil Rights Enforcement: 2000 and Beyond, February 2001. 2 U.S. Department of Labor, Office of Federal Contract Compliance Programs, “What We Do,” <http://www.dol. gov.esa.ofccp/ofwedo.htm> (last assessed May 10, 2004).
17
Table 3.1—OFCCP Funding History (in actual dollars)
Fiscal year
President’s request
Congressional appropriation
1994 $55,398,000 $56,443,000 1995 $59,902,000 $58,928,000 1996 $63,831,000 $56,851,000 1997 $65,460,000 $59,058,000 1998 $68,728,000 $62,271,000 1999 $67,836,000 $65,461,000 2000 $76,417,000 $73,250,000 2001 $76,308,000 $76,000,000 2002 $76,000,000 $77,701,000 2003 $77,500,000 $78,000,033 2004 $80,000,000 $79,441,513 2005 $82,078,000 $–
Source: U.S. Department of Labor, OFCCP.
Figure 3.1—OFCCP Funding History (in constant 1994 dollars)
66.256.4 66.165.257.5 54.3 55.3 57.7 59.8 65.4 65.4
55.458.5 60.9 61.3 63.7 61.9
68.0 66.4 65.0 65.0 65.8 66.4
0.0
10.0
20.0
30.0
40.0
50.0
60.0
70.0
80.0
1994 1995 1996 1997 1998 1999 2000 2001 2002 2003 2004 2005
Fiscal year
Mill
ions
of d
olla
rs
Congressional appropriation President's request
Source: Calculated from table 3.1.
OFCCP has received increased funding each successive year since 2000, although the in-creases have become smaller each year. Between 1999 and 2000, OFCCP’s funding in-creased 11.9 percent; between 2002 and 2003, OFCCP’s funding increased only 0.4 percent.
18

For 2004, Congress appropriated OFCCP $79.4 million. After adjusting for inflation, OFCCP’s 2004 budget was worth $65.8 million (see table 3.1 and figure 3.1). Between 2003 and 2004, OFCCP’s budget increased 1.8 percent. The President is requesting $82.1 million in funding for 2005. If Congress grants the President’s request, after adjusting for inflation OFCCP’s budget will be worth $66.4 million (see table 3.1 and figure 3.1), a 0.9 percent in-crease over last year’s appropriation.
Staffing and Workload Analysis Between 1994 and 1997, OFCCP’s FTE level continuously declined from 785 to 712 staff members. The number of FTEs peaked at 811 in 2000. Since then, OFCCP’s staffing level has decreased each successive year. In 2003, OFCCP’s FTE level stood at 707, its lowest level in 10 years. The number of staff for 2003 is 10 percent below the FTE level in 1994 (see table 3.2).
Table 3.2—OFCCP Staffing History
Fiscal year FTE level 1994 785 1995 775 1996 727 1997 712 1998 743 1999 727 2000 811 2001 776 2002 718 2003 707
Source: U.S. Department of Labor, OFCCP.
As OFCCP’s staffing level declined between 1994 and 1997, so did its work output. Between 1994 and 1997, the number of complaints resolved decreased from 802 to 372. During the same period, pending complaint inventory also decreased and the number of compliance re-views performed dropped 10 percent (see table 3.3).
Between 1998 and 2002, the number of complaints that OFCCP resolved fluctuated between 279 and 313, but decreased to 279 in 2003. Between 1998 and 2003, pending inventory de-clined 28.6 percent, from 350 to 250. Also during this period, OFCCP demonstrated high output with respect to its compliance program. Compliance reviews rose 35 percent, from 5,707 to 7,709 (see table 3.3). The number of reviews completed in 2003 covered more than 2.5 million workers, representing the most reviews and covered workers since 1991.3
3 U.S. Department of Labor, Employment Standards Administration, Office of Federal Contract Compliance Programs, “Office of Federal Contract Compliance Programs Continues Strong Enforcement in Fiscal Year 2003,” p. 1 (hereafter cited as OFCCP, “Enforcement in Fiscal Year 2003”).
19

Table 3.3—OFCCP Workload History
Fiscal year
Complaints resolved
Pending inventory
Compliance reviews
1994 802 – 4,179 1995 566 368 3,991 1996 473 282 3,476 1997 372 265 3,750 1998 294 350 5,707 1999 313 284 5,875 2000 306 268 6,672 2001 279 207 7,175 2002 297 178 6,494 2003 279 250 7,709
Source: U.S. Department of Labor, OFCCP.
According to OFCCP, since the Americans with Disabilities Act became effective in 1992, it has been receiving fewer complaints filed under Section 503 of the Rehabilitation Act. In ad-dition, there has been a significant decrease in the number of complaints filed under Execu-tive Order 11246. Both of these decreases have resulted in an overall decline in the number of complaints received. Between 1990 and 2000, the number of complaints filed under Ex-ecutive Order 11246 decreased from 920 to 472. The decline in complaints filed under the order may be a result of the Civil Rights Act of 1991, which approved compensatory and pu-nitive damages as remedies for unlawful employment discrimination under Title VII. Indi-viduals being discriminated against may be opting to file with the EEOC to obtain such remedies.4
With the decline in the number of complaints, OFCCP began focusing its compliance reviews on systemic discrimination.5 So doing allows OFCCP to:
Prioritize its enforcement resources for those individuals who allow discrimination to be their standard operating procedure or allow employment standards that are not le-gitimate to adversely affect a significant number of women or minority workers or job applicants.
Encourage employers to engage in self-audits of their employment practices, by in-creasing the consequences of not self-auditing.
Maximize its resources to protect the greatest number of workers from discrimination.
Complement its compliance assistance strategy by assisting contractors who comply voluntarily.6
Over the past 10 years, the number of persons receiving back pay and the amount of mone-tary benefits those persons received have fluctuated (see table 3.4). Nearly 60 percent of
4 U.S. Commission on Civil Rights, Funding Federal Civil Rights Enforcement: 2004, attachment, Office of Federal Contract Compliance Programs’ Comments on “Funding Federal Civil Rights Enforcement: 2004,” June 2003, p. 50. 5 Systemic refers to discrimination that affects a large number of workers. 6 OFCCP, “Enforcement in Fiscal Year 2003,” p. 1.
20

OFCCP financial remedies come from hiring discrimination cases, which fluctuate depending on economic circumstances. When the economy is in a downturn, employers cut back on hir-ing and hiring discrimination decreases. The decrease or increase in monetary benefits in a given year could be a result of a compliance review that was started several years ago.
Table 3.4—OFCCP Financial Agreements
Fiscal year
Persons receiving back pay
Back pay monetary benefits
1994 10,986 $14,400,000 1995 16,704 $12,284,953 1996 14,203 $$8,216,187 1997 14,435 $10,791,520 1998 16,306 $10,524,000 1999 18,493 $13,935,000 2000 17,639 $15,568,000 2001 16,925 $$9,036,000 2002 18,878 $$9,048,515 2003 Unavailable Unavailable
Source: U.S. Department of Labor, OFCCP.
In 2002, OFCCP obtained nearly $24.0 million in financial remedies for 8,969 workers. In 2003, the amount of financial remedies OFCCP obtained increased 8 percent to $26.2 mil-lion, and the number of minority and female workers who received these remedies increased 36 percent to a record 14,361.7
Corporate management reviews, or glass ceiling audits, ensure that women have equal oppor-tunity to rise to management and executive positions. In 2003, OFCCP performed 52 such reviews recovering nearly $12 million in financial remedies for 7,118 women. In 2002, OFCCP performed 42 corporate management reviews. Since the mid-1970s, the Office of the Solicitor has filed two litigation suits against Wyeth and Wyeth Pharamaceuticals and First Union Corporation, alleging systemic compensation discrimination.8
Strategic and Output Measures When determining the effectiveness of its program activities, and in conformance with the Government Performance and Results Act of 1993 (GPRA), OFCCP evaluates two outcome goals: (1) reducing the occurrence of discrimination among federal contractors and (2) in-creasing compliance among federal contractors in all other respects of equal opportunity workplace standards.9
Internally, OFCCP also measures its effectiveness and efficiency by tracking: (1) the number of systemic discrimination cases resolved through settlement or referral to the Office of the Solicitor; (2) the number of systemic discrimination cases substantially developed; (3) the
7 Ibid. 8 Ibid., p. 2. 9 U.S. Department of Labor, Office of Federal Contract Compliance Programs’ Response to the U.S. Commis-sion on Civil Rights’ Interrogatory for Funding, Apr. 23, 2004, p. 2.
21

number of potential systemic discrimination cases identified; (4) the number of workers pro-tected through financial settlements; (5) the number of corporate management reviews; and (6) the number of compliance assistance events.10 OFCCP establishes goals for each region and ties each to regional directors’ personal performance plans.
OFCCP established and met the forgoing output goals for 2003. For example, OFCCP ex-pressed a goal to resolve 46 systemic discrimination cases through settlement or referral to the Office of the Solicitor. OFCCP actually resolved 52 such cases. Another goal was to pro-tect 5,677 workers by obtaining financial settlements. OFCCP protected 14,361 workers, ex-ceeding its goal by 153 percent. OFCCP nearly doubled the number of planned compliance assistance events (see table 3.5).
Table 3.5—OFCCP Performance Objectives, 2003
Objective Performance target
Actual performance
Systemic cases resolved 5,646 52 Workers protected by systemic relief 5,677 14,361 Systemic cases to resolve next year 57 72 Systemic cases identified 94 147 Compliance assistance events 535 964 Corporate management reviews 47 52 Source: U.S. Department of Labor, Office of Federal Contract Compliance Programs’ Response to the U.S. Commission on Civil Rights’ Interrogatory for Funding, Apr. 23, 2004, p. 2.
For 2004, OFCCP will use the same performance goals to measure its effectiveness and effi-ciency that it used for 2003.
10 Ibid., p. 1.
22

Chapter 4 Civil Rights Division, U.S. Department of Justice The Civil Rights Division’s (CRD) original responsibility was enforcing voting and criminal statutes. But with the passage of the Civil Rights Act of 1964 and more recent laws and ex-ecutive orders, the authority of CRD has greatly expanded. CRD has 10 subject-matter sec-tions: the Appellate Section, the Coordination and Review Section, the Civil Rights Prosecution Section, the Educational Opportunities Section, the Employment Litigation Sec-tion, the Housing and Civil Enforcement Section, the Special Litigation Section, the Disabil-ity Rights Section, the Voting Rights Section, and the Office of Special Counsel.
Budget Analysis Between 1994 and 2004, Congress has most often funded CRD below the level requested by the President. However, in 1994 and 1999, CRD received more funding than the President requested. In 1999, the President requested $71.6 million and Congress appropriated $77.3 million, giving CRD 8 percent more than the President requested (see table 4.1). After adjust-ing for inflation, CRD’s 1999 funding level was worth $70.6 million (see figure 4.1). CRD received its largest increase in funding, 19 percent, between 1998 and 1999.
Table 4.1—DOJ/CRD Funding History (in actual dollars)
Fiscal year
President’s request
Congressional appropriation
1994 $59,000,000 $59,956,000 1995 $71,895,000 $62,602,000 1996 $65,304,000 $64,546,000 1997 $69,648,000 $62,419,000 1998 $67,477,000 $64,689,000 1999 $71,594,000 $77,267,000 2000 $82,200,000 $82,150,000 2001 $97,922,000 $92,000,000 2002 100,872,000 100,547,000 2003 105,099,000 104,416,000 2004 109,690,000 108,842,000 2005 109,141,000 –
Source: U.S. Department of Justice, Civil Rights Division.
Between 2003 and 2004, CRD’s budget increased 4 percent, but after adjusting for inflation the 2004 appropriation of $108.8 million is worth $89.5 million (see table 4.1 and figure 4.1). For 2005, the President is requesting $109.1 million for 2005. If Congress grants the Presi-
23
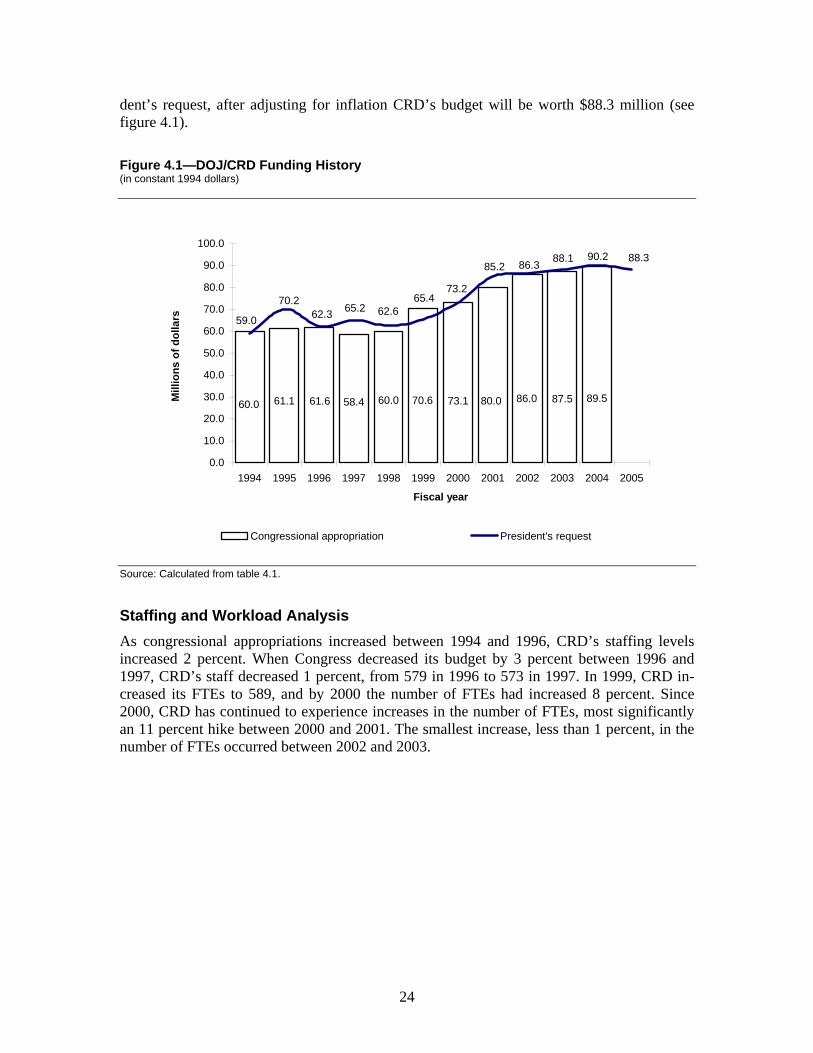
dent’s request, after adjusting for inflation CRD’s budget will be worth $88.3 million (see figure 4.1).
Figure 4.1—DOJ/CRD Funding History (in constant 1994 dollars)
86.060.0 80.073.161.1 61.6 58.4 60.0 70.6 87.5 89.5
59.0
70.262.3 65.2 62.6
65.473.2
85.2 86.3 88.1 90.2 88.3
0.0
10.0
20.0
30.0
40.0
50.0
60.0
70.0
80.0
90.0
100.0
1994 1995 1996 1997 1998 1999 2000 2001 2002 2003 2004 2005
Fiscal year
Mill
ions
of d
olla
rs
Congressional appropriation President's request
Source: Calculated from table 4.1.
Staffing and Workload Analysis As congressional appropriations increased between 1994 and 1996, CRD’s staffing levels increased 2 percent. When Congress decreased its budget by 3 percent between 1996 and 1997, CRD’s staff decreased 1 percent, from 579 in 1996 to 573 in 1997. In 1999, CRD in-creased its FTEs to 589, and by 2000 the number of FTEs had increased 8 percent. Since 2000, CRD has continued to experience increases in the number of FTEs, most significantly an 11 percent hike between 2000 and 2001. The smallest increase, less than 1 percent, in the number of FTEs occurred between 2002 and 2003.
24

Table 4.2—CRD Staffing History
Fiscal year FTE level 1994 568 1995 579 1996 579 1997 573 1998 573 1999 589 2000 639 2001 713 2002 744 2003 750
Source: U.S. Department of Justice, Civil Rights Division.
Disability Rights Enforcement The Disability Rights Section (DRS) has enforcement responsibilities for Titles I and II of the Americans with Disabilities Act, which prohibit discrimination based on disability in state and local government employment, public accommodations, commercial facilities, and the programs and services of state and local governments. The section also has the responsibility to coordinate federal enforcement of statutes that prohibit discrimination on the basis of dis-ability in programs that receive federal financial assistance. In 1995, when all disability-related coordination and enforcement responsibilities were transferred from the Coordination and Review Section, 66 FTEs handled the disability workload (see table 4.3). During that year, the Disability Rights Section initiated 2,444 investigations, which is the most since the creation of DRS. Only 863 investigations were pending, the fewest in the past 10 years (see table 4.4).
Table 4.3—Disability Rights Staffing History
Fiscal year FTE level 1994 48 1995 66 1996 69 1997 69 1998 69 1999 73 2000 81 2001 92 2002 97 2003 97
Source: U.S. Department of Justice, Civil Rights Division.
DRS’ FTE level grew from 69 in 1996 to 97 in 2002, a 40.6 percent increase. During the same period, the numbers of cases filed, cases pending, investigations initiated, and investi-gations pending fluctuated. Between 2002 and 2003, DRS’ FTE level remained stagnant at 97, the number of cases filed decreased 56.7 percent, the number of cases pending decreased 18.8 percent, the number of investigations initiated declined 32.5 percent, and the number of investigations pending dropped 4.6 percent (see tables 4.3 and 4.4).
25

Table 4.4—Disability Rights Section Workload History
Fiscal year
Cases filed
Cases pending
Investigations initiated*
Investigations pending*
1994 – – 1,692 1,892 1995 12 112 2,444 1,863 1996 29 112 1,999 2,888 1997 28 122 1,805 3,017 1998 28 150 1,922 2,707 1999 38 192 1,793 2,537 2000 38 103 1,461 2,391 2001 31 101 1,487 1,970 2002 30 196 1,461 1,878 2003 13 178 1,311 1,791
*Revised to reflect only those investigations that are pending in the Disability Rights Section from 1999 through 2003. There are substantial additional investigations that are referred to other designated agencies. Source: U.S. Department of Justice, Civil Rights Division.
Coordination and Review The Coordination and Review Section (CORS) coordinates the civil rights enforcement ac-tivities of other federal agencies. Among its many duties, the section develops and assists other agencies in developing guidelines and regulations for civil rights enforcement. Throughout the 1990s, FTE levels declined from 32 to 19 (see table 4.5). In 1996, the Com-mission concluded that CORS was “without the staff necessary to conduct an effective and comprehensive Title VI coordination and enforcement program.”1 In 2003, CORS had 21 FTEs who were responsible for enforcing Title VI and Title IX of the Education Amend-ments of 1972. This FTE level has remained stagnant since 2001. Between 1994 and 2003, CORS’ FTE level declined 34 percent.
Table 4.5—Coordination and Review Section Staffing History
Fiscal year FTE level 1994 32 1995 21 1996 22 1997 21 1998 19 1999 19 2000 20 2001 21 2002 21 2003 21
Source: U.S. Department of Justice, Civil Rights Division.
1 U.S. Commission on Civil Rights, Federal Title VI Enforcement to Ensure Nondiscrimination in Federally Assisted Programs, June 1996, p. 139.
26

Voting Rights Enforcement The Voting Rights Section is responsible for bringing lawsuits to remedy discrimination in elections conducted in all jurisdictions and also has the authority to commence civil action against any state or political subdivision that has imposed or applied a discriminatory device or procedure. Between 1994 and 1999, the Voting Rights Section’s FTE levels fluctuated, albeit minimally. Between 2000 and 2002, the FTE levels increased from 92 to 109. The 2003 FTE level remained unchanged from the 2002 level. Since 1994, the number of FTEs has increased 24 percent (see table 4.6).
Table 4.6—Voting Rights Section Staffing History
Fiscal year FTE level 1994 188 1995 186 1996 186 1997 186 1998 185 1999 186 2000 192 2001 104 2002 109 2003 109
Source: U.S. Department of Justice, Civil Rights Division.
Civil Rights Prosecution The objective of the Civil Rights Prosecution Section is to reduce police and other official criminal misconduct and to eliminate or reduce violent activity by private citizens (including organized hate groups) against others because of their race, religion, national origin, or sex. To accomplish its objectives, the section prosecutes cases of national significance involving the deprivation of personal liberties, which either cannot be, or are not, sufficiently addressed by state or local authorities. Its jurisdiction includes acts of racial violence, misconduct by local, state, or federal law enforcement officials, violations of the peonage and involuntary servitude statutes that protect migrant workers and others held in bondage, and violations of the Freedom of Access to Clinic Entrances Act. The section ensures that complaints are re-viewed on a timely basis for investigation and potential prosecution.
In 1994, 49 FTEs were assigned to the Civil Rights Prosecution Section. The number of FTEs decreased to 47 in 1995 and remained at that level through 1997. Since 1998, the num-ber of FTEs has continuously increased, and as of 2003 101 employees are assigned to the section. Since 1994, the Civil Rights Prosecution Section’s FTE level has increased 106 per-cent (see table 4.7).
27

Table 4.7—Civil Rights Prosecution Section Staffing History
Fiscal year FTE level 1994 149 1995 147 1996 147 1997 147 1998 154 1999 161 2000 171 2001 185 2002 195 2003 101
Source: U.S. Department of Justice, Civil Rights Division.
As the number of FTEs was either decreasing or remaining stable, the number of complaints received fluctuated. Between 1994 and 1996, complaints increased 41 percent, from 8,342 to 11,721. During the same period, the number of matters investigated decreased and then in-creased, as did the number of pending matters (see table 4.8)
Beginning in 1998, when the number of FTEs increased, the number of complaints increased as the number of matters investigated decreased and the pending inventory increased and then fluctuated. Between 2002 and 2003, the number of complaints received increased, as did the number of matters investigated. In 2003, the section received 9,661 complaints, investi-gated 1,721 matters, and had a pending inventory of 2,229. In 2003, if each FTE was respon-sible for handling complaints, the section received approximately 96 complaints per FTE (see tables 4.7 and 4.8).
Table 4.8—Civil Rights Prosecution Section Workload History
Fiscal year Complaints received
Matters investigated
Pending matters
1994 18,342 2,633 1,936 1995 18,864 2,370 1,806 1996 11,721 2,619 2,227 1997 10,891 2,753 2,613 1998 12,188 2,955 2,617 1999 12,132 2,547 2,680 2000 12,404 2,320 2,719 2001 12,438 2,261 2,269 2002 19,161 1,659 2,291 2003 19,661 1,721 2,229
Source: U.S. Department of Justice, Civil Rights Division.
Fair Housing Enforcement The Fair Housing Section enforces federal fair housing laws that proscribe discrimination in housing, the provision of credit, and in places of public accommodation. The section investi-gates complaints and litigates cases under Title VIII of the Civil Rights Act of 1968, Title II of the Civil Rights Act of 1964, and the Equal Credit Opportunity Act. In 1994, the Fair
28

Housing Section had 89 FTEs dedicated to fighting housing discrimination. In 1995, the number of FTEs increased to 96, but the next year the number started decreasing, and by 1998 the section had 86 FTEs (see table 4.9).
Table 4.9—Civil Rights Housing Section Staffing History
Fiscal year FTE level 1994 89 1995 96 1996 95 1997 93 1998 86 1999 91 2000 91 2001 95 2002 95 2003 95
Source: U.S. Department of Justice, Civil Rights Division.
Between 1998 and 1999, the Fair Housing Section’s staff increased 6 percent, from 86 to 91. The number of FTEs remained stagnant in 2000 and increased again in 2001. Since 2001, the FTE level has remained at 95 (see table 4.9).
Strategic and Output Measures CRD’s strategic goal is to uphold the civil and constitutional rights of all Americans, and to protect vulnerable members of society. To implement this goal, the agency has established objectives under the criminal and civil programmatic areas. To assess its effectiveness within the criminal enforcement area, CRD measures the percentage of criminal cases favorably re-solved. When evaluating its effectiveness within the civil enforcement area, CRD measures the percentage of pattern or practices cases favorably resolved.
Although CRD measures the number of investigations initiated and completed in the Disabil-ity Rights Section and the number of matters investigated by the Civil Rights Prosecution Section, these figures alone do not comprehensively gauge effectiveness. Furthermore, these workload numbers are limited in that CRD does not report them in any of the department plans, only in the division’s case management system for distribution to senior division man-agement quarterly.2
For 2003, CRD’s performance goal was to favorably resolve 87 percent of its criminal cases. CRD surpassed its goal by favorably resolving 95 percent of its criminal cases. CRD’s other performance goal was to favorably resolve 80 percent of its civil (pattern or practice) cases.
2 U.S. Department of Justice Labor, Civil Rights Division’s Response to the U.S. Commission on Civil Rights’ Interrogatory for Funding, Apr. 2, 2004, p. 2.
29

CRD exceeded its performance target and favorably resolved 95 percent of its civil cases (see table 4.10). CRD indicated that these goals remain the same for FY 2004.3
Table 4.10—DOJ/CRD Performance Measures, 2003 and 2004
Performance measures Performance target
Actual performance
Criminal programmatic area Percentage of criminal cases favorably resolved
2003 87 95 2004 80 –
Civil programmatic area
Percentage of civil cases favorably resolved 2003 80 95 2004 80 –
Source: U.S. Department of Justice, Civil Rights Division’s Response to the U.S. Commission on Civil Rights’ Interrogatory for Funding, Apr. 2, 2004, pp. 1–2, table attachment.
3 Ibid., p. 1, attachment.
30

Chapter 5 Office for Civil Rights, U.S. Department of Health and Human Services The Office for Civil Rights (OCR) at the Department of Health and Human Services (HHS) is responsible for improving the health and well-being of all people affected by its many pro-grams. OCR enforces several statutes, including:
Title VI of the Civil Rights Act of 1964 Section 504 of the Rehabilitation Act of 1973 Age Discrimination Act of 1975 Title II of the Americans with Disabilities Act of 1990 Community service requirements of Titles VI and XVI of the Public Health Service Act Provisions of the Omnibus Budget Reconciliation Act of 1981 relating to nondiscrimi-
nation in block grant programs Health Insurance Portability and Accountability Act
Approximately 230,000 group and institutional providers, including state agencies, are sub-ject to the nondiscrimination laws that OCR enforces.
Budget Analysis After decreasing between 1994 and 1996, OCR’s funding returned to its 1994 level in 2000. However, in 2000, OCR’s congressional appropriation was 1.7 percent more than the $22.2 million the President requested (see table 5.1). Although OCR received its largest increase in funding, 24.3 percent, between 2000 and 2001, the amount was not sufficient to keep up with inflation. After adjusting for inflation, the 2001 appropriation of $28.0 million was worth $24.4 million (see table 5.1 and figure 5.1).
Since 2001, OCR’s funding has continued to increase, although the congressional appropria-tion for 2004 was only 2.6 percent more than the 2003 funding level (see table 5.1). For 2004, OCR’s budget of $33.9 million is worth $27.9 million after adjusting for inflation. Be-tween 1994 and 2004, OCR’s budget increased 52.8 percent. For 2005, if Congress grants the President’s request of $35.4 million, after adjusting for inflation OCR will have buying power of $28.6 million (see table 5.1 and figure 5.1).
31

Table 5.1—HHS/OCR Funding History (in actual dollars)
Fiscal year
President’s request
Congressional appropriation
1994 $22,182,000 $22,181,000 1995 $22,390,000 $21,891,000 1996 $21,160,000 $19,710,000 1997 $21,790,000 $19,965,000 1998 $20,530,000 $19,659,000 1999 $20,659,000 $20,618,000 2000 $22,159,000 $22,533,000 2001 $27,456,000 $28,005,000 2002 $32,005,000 $31,430,000 2003 $33,257,000 $33,038,000 2004 $34,250,000 $33,902,000 2005 $35,357,000 –
Source: U.S. Department of Health and Human Services, Office for Civil Rights.
Figure 5.1—HHS/OCR Funding History (in constant 1994 dollars)
18.818.218.718.821.4 20.1 24.422.2 26.9 27.7 27.9
27.927.423.9
19.718.919.020.420.221.922.2
28.2 28.6
0.0
5.0
10.0
15.0
20.0
25.0
30.0
35.0
1994 1995 1996 1997 1998 1999 2000 2001 2002 2003 2004 2005
Fiscal year
Mill
ions
of d
olla
rs
Congressional appropriation President's request
Source: Calculated from table 5.1.
32

Staffing and Workload Analysis In the past 10 years, OCR has never received the level of staffing it has requested from Con-gress. In addition, OCR’s staff decreased from 284 in 1994 to a low of 210 in 1999. As a re-sult, 26 percent fewer employees performed its activities, including complaint investigations, post-grant reviews and investigations, pre-grant reviews, monitoring and voluntary compli-ance reviews, and outreach. By 2000, OCR’s staff returned to its 1998 level and continued to increase. Between 2001 and 2002, OCR’s staff increased 10 percent, possibly in anticipation of an increased workload as a result of Congress passing the Health Insurance Portability and Accountability Act (HIPAA).1 For 2003, OCR requested a staffing level of 267, but its actual level is 244 (see table 5.2).
Table 5.2—HHS/OCR Staffing History
Fiscal year
Requested staffing level
Actual staffing level
1994 297 284 1995 297 259 1996 276 242 1997 274 232 1998 242 216 1999 232 210 2000 225 215 2001 259 223 2002 273 246 2003 267 244
Source: U.S. Department of Health and Human Services, Office for Civil Rights.
As staffing levels fell between 1994 and 1999 OCR’s pending inventory climbed, increasing from 46 cases in 1994 to 181 in 1999. In 2000, OCR’s staffing level increased by five, but was still not enough to handle increased post-grant review and investigation inventory. Be-tween 1999 and 2000, OCR’s pending inventory escalated to 276, a 52.5 percent increase (see tables 5.2 and 5.3).
Between 2000 and 2002, OCR’s pending inventory decreased 8 percent. However, its inven-tory has begun to increase again and has now surpassed the 2000 level. Pending inventory as a percentage of the total workload has increased from 18 percent in 1994 to 92 percent in 2003.
1 The Health Insurance Portability and Accountability Act (HIPAA) establishes for the first time a foundation of federal protections for the privacy of protected health information. HIPAA sets national standards to protect in-dividuals’ medical records and other personal health information. The act gives patients more control over their health information; sets boundaries on the use and release of health records; establishes appropriate safeguards that health care providers and others must achieve to protect the privacy of health information; and holds viola-tors accountable, with civil and criminal penalties that can be imposed if they violate patients’ privacy rights.
33

Table 5.3—HHS/OCR Post-Grant Review and Investigation Workload History
Fiscal year
New starts
Total workload
Pending inventory
1994 203 256 146 1995 122 168 136 1996 181 217 160 1997 328 388 190 1998 301 391 164 1999 287 451 181 2000 317 498 276 2001 137 413 250 2002 140 390 254 2003 141 305 280
Source: U.S. Department of Health and Human Services, Office for Civil Rights.
Between 1994 and 1998, OCR reduced the number of staff dedicated to complaint processing by 47.5 percent. In 1994, the complaint processing staff totaled 141 and by 1998 that number had dwindled to 74 (see table 5.4). The decrease in the complaint processing staffing level reflects the decrease in OCR’s complaint workload. OCR’s complaint receipts decreased from 2,222 in 1994 to 1,548 in 1998. The decrease in complaint receipts enabled OCR to al-leviate its backlog of complaints. The number of open or backlogged complaints decreased from 1,112 in 1994 to 599 in 1998. Between 1999 and 2002, the number of complaint re-ceipts fluctuated as did staff assigned to specifically handle complaint processing (see tables 5.5 and 5.4). Also during this period, the number of backlogged complaints continuously in-creased and peaked at 1,143 in 2002.
As a result of health care providers and businesses being required to comply with HIPAA by April 2003, OCR’s complaint workload has dramatically increased. In 2003, OCR’s staffing level increased to 94, and this did not include the 28 FTEs dedicated to processing complaints alleging violations of HIPAA (see table 5.4). OCR’s complaint workload also increased. In 2003, OCR received 2,221 complaints, but this increase does not reflect the 2,267 complaints received after the April 2003 HIPAA compliance date (see table 5.5). In 2003, OCR closed fewer complaints than in the preceding year, which more than likely will result in the highest number of backlogged complaints since 1994.
34

Table 5.4—HHS/OCR Complaint Processing Staffing History
Fiscal year FTE level 1994 141 1995 145 1996 129 1997 184 1998 174 1999 179 2000 174 2001 183 2002 190 2003 1194*
*Excludes 28 FTEs dedicated to processing complaints alleging violations of the Health Insurance Portability and Accountability Act (HIPAA) Privacy Rule. Source: U.S. Department of Health and Human Services, Office for Civil Rights.
Table 5.5—HHS/OCR Complaint Workload History
Fiscal year
Complaints received
Complaints open
Complaints closed
1994 2,222 1,112 2,231 1995 2,094 1,102 2,358 1996 1,827 1,839 1,996 1997 1,741 1,664 1,806 1998 1,548 1,599 1,644 1999 1,950 1,503 1,758 2000 2,185 1,695 1,749 2001 2,148 1,131 2,138 2002 1,948 1,143 2,015 2003 12,221* 1,076 1,801
*Excludes 2,267 complaints alleging violations of the HIPAA Privacy Rule received on or after the compliance effective date of April 14, 2003. Source: U.S. Department of Health and Human Services, Office for Civil Rights.
Strategic and Output Measures For 2003, one of OCR’s strategic goals is to increase nondiscriminatory access and participa-tion in HHS programs and protect the privacy of health information. In fulfilling this goal, OCR established three program performance objectives: (1) to increase access to and receipt of nondiscriminatory quality health care and to protect the privacy of personally identifiable health information while protecting the integrity of HHS federal financial assistance; (2) to increase access to and receipt of nondiscriminatory social services, while protecting the in-tegrity of HHS federal financial assistance; and (3) to increase access to and receipt of com-munity-based services and nondiscriminatory treatment for persons with disabilities, while protecting the integrity of HHS federal financial assistance.2 Although OCR establishes stra- 2 U.S. Department of Health and Human Services, Office for Civil Rights’ Response to the U.S. Commission on Civil Rights’ Interrogatory for Funding, Feb. 10, 2004, p. 1.
35

tegic evaluation criteria, its performance measures are process and not mission oriented. In evaluating progress toward these objectives, OCR measures the number of corrective actions, no violation findings, reviews, consultations, and outreach, technical assistance, and collabo-rative activities. For 2003, OCR met its output goals for each of the program performance objectives.
In its effort to evaluate program effectiveness, OCR also uses information about the number of initiated and completed post-grant reviews and complaint investigations. OCR measures “decreased average age of all case closures” to assess how efficiently staff are processing cases and the extent to which staff are able to resolve issues raised in these cases. In 2003, OCR’s goal was to close all cases within 380 days, including pre-grant reviews, post-grant reviews, and investigations.3 OCR actually closes cases in 257 days on the average, exceed-ing its goal by 123 days. OCR committed and will continue to expend considerable energy to streamline case processing, and develop guidance for and training of investigators.4
For 2004, OCR’s goals are the same as those identified for 2003. With respect to its objective to increase access to and receipt of nondiscriminatory quality health care, OCR’s output goal is 1,470 corrective actions, no violation findings, reviews, consultations, and outreach, tech-nical assistance, and collaborative activities. In 2003, OCR’s actual performance was 783. In an effort to increase access to and receipt of nondiscriminatory social services, OCR’s output goal is 295 corrective actions, no violation findings, reviews, consultations, and outreach, technical assistance, and collaborative activities. In 2003, OCR’s actual performance was 617 corrective actions. To meet its objective to increase access to and receipt of community-based services and nondiscriminatory treatment for persons with disabilities, OCR’s output goal is 1,265 corrective actions, no violation findings, reviews, consultations, and outreach, technical assistance, and collaborative activities. In 2003, OCR’s actual performance was 491 (see ta-ble 5.6).5
3 Ibid. 4 Ibid. 5 Ibid., pp. 2–3.
36

Table 5.6—HHS/OCR Performance Measures, 2003 and 2004
Objectives/measures Performance target
Actual performance
Increase access to and receipt of nondiscriminatory quality health care Corrective actions, no violation findings, reviews, consultations, and outreach, technical assistance, and collaborative activities
2003 2004
1770 1,470
783 –
Increase access to and receipt of nondiscriminatory social services Corrective actions, no violation findings, reviews, consultations, and outreach, technical assistance, and collaborative activities
2003 2004
614 295
617 –
Increase access to and receipt of community-based services and nondiscriminatory treatment for persons with disabilities
Corrective actions, no violation findings, reviews, consultations, and outreach, technical assistance, and collaborative activities
2003 2004
1258 1,265
491 –
Source: Compiled from U.S. Department of Health and Human Services, Office for Civil Rights’ Response to the U.S. Commission on Civil Rights’ Interrogatory for Funding, Feb. 10, 2004, pp. 2–3.
37

Chapter 6 U.S. Department of Housing and Urban Development—Office of Fair Housing and Equal Opportunity (FHEO), Fair Housing Assistance Program (FHAP), and Fair Housing Initiatives Program (FHIP) FHEO Under the direction of the Assistant Secretary for Equal Opportunity, the Office of Fair Housing and Equal Opportunity (FHEO) administers federal laws and establishes national policies designed to ensure that all Americans have equal access to housing of their choice. The following laws and executive orders extend fair housing enforcement powers to FHEO:
President Kennedy’s Executive Order 11063 relating to equal opportunity in federally financed housing
Title VI of the Civil Rights Act of 1964 Title VIII of the Civil Rights Act of 19681 Section 3 of the Housing and Urban Development Act of 19682 Section 504 of the Rehabilitation Act of 1973 Section 109 of Title I of the Housing and Community Development Act of 19743 Age Discrimination Act of 1975 Housing and Community Development Act of 19874 Fair Housing Amendments Act of 19885 Title II of the Americans with Disabilities Act of 1990 President Clinton’s Executive Order 128926
1 Title VIII of the Civil Rights Act of 1968 prohibits discrimination in the sale, rental, and financing of dwellings based on race, color, religion, sex, or national origin. 2 Section 3 of the Housing and Urban Development Act of 1968 requires housing and community development recipients to direct jobs, training, and contracting opportunities to businesses owned by or employing low- and very low-income residents residing in targeted geographical areas in which HUD assistance takes place. 3 Section 109 of Title I of the Housing and Community Development Act of 1974 prohibits discrimination in Community Development Block Grant Programs on the basis of race, color, national origin, religion, or sex. 4 The Housing and Community Development Act of 1987 authorized the Public Housing Comprehensive Transi-tion Demonstration, a program intended to move residents out of public housing and into their own homes. 5 Title VIII was amended in 1988 to expand the coverage of the Fair Housing Act to prohibit discrimination based on disability or on familial status. 6 Executive Order 12892 requires HUD to coordinate certain fair housing efforts with executive departments and agencies.
38

Budget Analysis In FHEO’s debut issue of its quarterly newsletter Fair Housing News, Assistant Secretary Carolyn Peoples pledged her commitment to achieve its 2003 goals by conducting timely in-vestigations, reducing impediments to housing choice, and supporting new initiatives to build public awareness and understanding of federal fair housing laws.7 Peoples said that these ef-forts will be enhanced by developing close working partnerships with faith-based and grass-roots organizations, local governments, and other agencies to ensure effective program compliance, and by developing performance-based measures to ensure quality.8 To follow through on these commitments, HUD needs appropriate funding, which has not always been adequate to fulfill its goals. At no time during the past 11 years has FHEO’s congressional appropriation matched the President’s request. For example, in 1994 the President requested $51.1 million, but Congress appropriated $49.4 million. In fact, the congressional appropria-tion has been lower than the President’s request by as much as 34 percent. One demonstration of this is evident in 2003, when the President requested $70.0 million in funding, but Con-gress granted only $46.0 million (see table 6.1).
Table 6.1—HUD/FHEO Funding History (in actual dollars)
Fiscal year
President’s request
Congressional appropriation
1994 $51,080,000 $49,380,000 1995 $52,228,000 $50,081,000 1996 $48,790,000 $45,500,000 1997 $49,496,000 $46,258,000 1998 $48,695,000 $45,510,000 1999 $49,887,000 $47,555,000 2000 $50,776,000 $47,455,000 2001 $54,986,000 $51,389,000 2002 $60,081,000 $57,771,000 2003 $69,968,000 $46,000,000 2004 $51,000,000 $48,000,000 2005 $47,700,000 –
Source: U.S. Department of Housing and Urban Development, Budget and Administrative Support Division.
Between 2000 and 2003, the President consistently requested increased funding for FHEO. Except for 2003, congressional appropriations increased each year. However, these increases were not enough to keep pace with inflation. In 2003, when Congress appropriated 20 percent less funding than in the previous year, after adjusting for inflation the $46.0 million was worth $38.5 million. After adjusting for inflation, FHEO’s 2003 funding level was well be-low the level of any previous year (see table 6.1 and figure 6.1).
For 2004, the President requested $51.0 million, but Congress appropriated $48.0 million. After adjusting for inflation, the 2004 appropriation is worth $39.5 million. For 2005 the President is requesting $47.7 million in funding, which is 6.6 percent less than the amount 7 U.S. Department of Housing and Urban Development, Office of Fair Housing and Equal Opportunity, Fair Housing News, vol. 1, issue 1, Winter 2003, p. 1. 8 Ibid.
39

requested in 1994. If Congress grants the President’s request, after adjusting for inflation FHEO’s funding will be worth $38.6 million (see table 6.1 and figure 6.1).
Figure 6.1—HUD/FHEO Funding History (in constant 1994 dollars)
49.4 48.9 43.4 43.3 42.2 43.4 42.2 44.7 49.4 38.5 39.5
51.1 51.046.6 46.3 45.1 45.6 45.2
47.851.4
58.6
42.038.6
0.0
10.0
20.0
30.0
40.0
50.0
60.0
1994 1995 1996 1997 1998 1999 2000 2001 2002 2003 2004 2005
Fiscal year
Mill
ions
of d
olla
rs
Congressional appropriation President's request
Source: Calculated from table 6.1.
Staffing and Workload Analysis From 1994 to 2000, the number of FTEs decreased 22 percent. By 2001, the number of FTEs began increasing, and for 2003 the FTE level stood at 744, resulting in a 22 percent increase between 2001 and 2003. However, the number of FTEs in 2003 still does not return FHEO to its 1994 level (see table 6.2).
Table 6.2—HUD/FHEO Staffing History
Fiscal year FTE level 1994 750 1995 727 1996 664 1997 643 1998 591 1999 592 2000 587 2001 608 2002 653 2003 744
Source: U.S. Department of Housing and Urban Development, Budget and Administrative Support Division.
40

As the number of staff decreased from 1994 to 2000, the number of Title VIII complaints that FHEO received climbed. By 2000, FHEO reached its lowest FTE level, which corresponded to its largest number of complaints received (see table 6.2 and 6.3). Most housing discrimination complaints are based on race or disability and most often allege discrimination in the terms and conditions of a housing transaction, refusal to rent, the refusal to make a reasonable accommo-dation, and interference, coercion or intimidation due to filling a complaint.9 Since 2000, the number of complaints has been decreasing. FHEO received 27 percent fewer complaints in 2003 than in 2002. FHEO had previously estimated it would receive 10,000 Title VIII com-plaints for 2003, but actually received only 5,532 (see table 6.3).10
Table 6.3—HUD/FHEO Title VIII Complaint History
Fiscal year Complaints received 1994 19,524 1995 18,187 1996 10,945 1997 10,227 1998 10,266 1999 10,836 2000 11,218 2001 18,252 2002 17,557 2003 15,532
Source: U.S. Department of Housing and Urban Development, Budget and Administrative Support Division.
Between 1994 and 1998, the total number of program compliance complaints fluctuated for Title VI, Section 109, Section 504, and ADA. In 1999, Title VI, Section 504, and ADA com-plaints began rising, and consequently so did the total number of program complaints. Be-tween 1999 and 2000, the total number of program compliance complaints increased 93 percent overall as a result of a 93 percent increase in Title VI complaints and a 92 percent increase in Section 504 complaints. At the same time, Section 109 and ADA complaints in-creased comparably. In 2003, FHEO received 1,236 program compliance complaints of which 34.1 percent were Title VI, 2.9 percent were Section 109, 50.0 percent were Section 504, and 12.9 percent were ADA (see table 6.4).
9 Ibid., p. 3. 10 U.S. Commission on Civil Rights, Funding Federal Civil Rights Enforcement: 2004, June 2003.
41
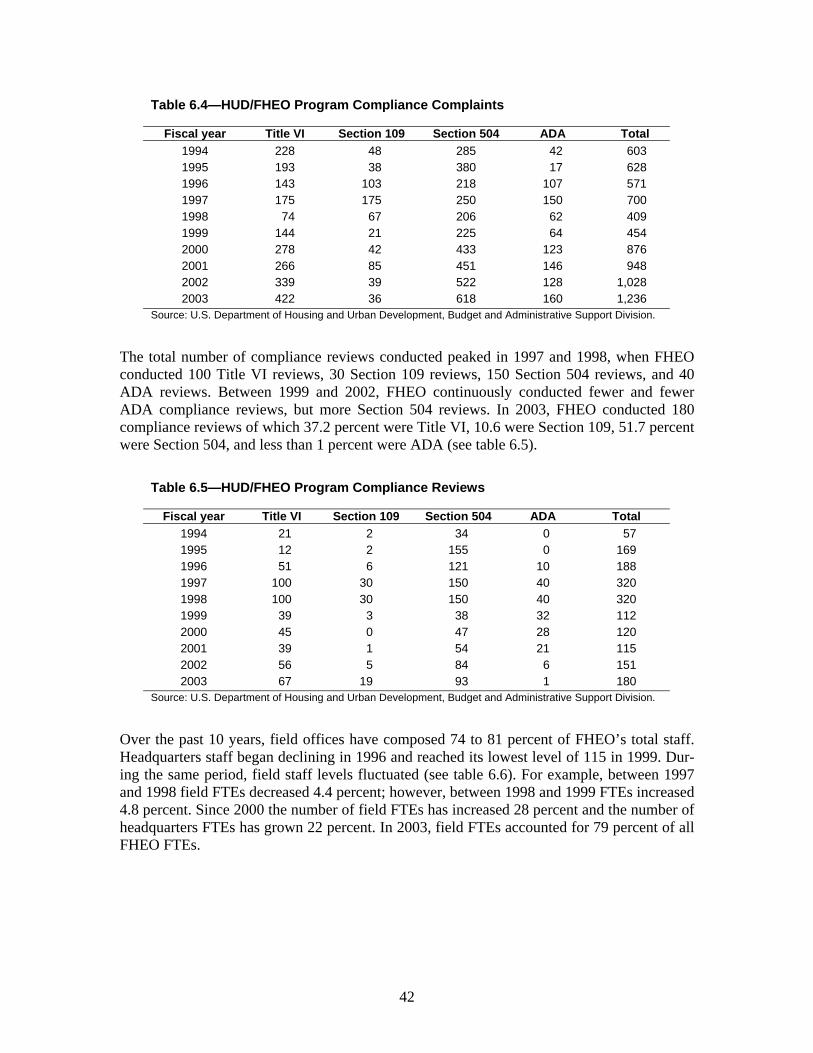
Table 6.4—HUD/FHEO Program Compliance Complaints
Fiscal year Title VI Section 109 Section 504 ADA Total 1994 228 148 285 142 1,603 1995 193 138 380 117 1,628 1996 143 103 218 107 1,571 1997 175 175 250 150 1,700 1998 174 167 206 162 1,409 1999 144 121 225 164 1,454 2000 278 142 433 123 1,876 2001 266 185 451 146 1,948 2002 339 139 522 128 1,028 2003 422 136 618 160 1,236
Source: U.S. Department of Housing and Urban Development, Budget and Administrative Support Division.
The total number of compliance reviews conducted peaked in 1997 and 1998, when FHEO conducted 100 Title VI reviews, 30 Section 109 reviews, 150 Section 504 reviews, and 40 ADA reviews. Between 1999 and 2002, FHEO continuously conducted fewer and fewer ADA compliance reviews, but more Section 504 reviews. In 2003, FHEO conducted 180 compliance reviews of which 37.2 percent were Title VI, 10.6 were Section 109, 51.7 percent were Section 504, and less than 1 percent were ADA (see table 6.5).
Table 6.5—HUD/FHEO Program Compliance Reviews
Fiscal year Title VI Section 109 Section 504 ADA Total 1994 121 12 134 10 157 1995 112 12 155 10 169 1996 151 16 121 10 188 1997 100 30 150 40 320 1998 100 30 150 40 320 1999 139 13 138 32 112 2000 145 10 147 28 120 2001 139 11 154 21 115 2002 156 15 184 16 151 2003 167 19 193 11 180
Source: U.S. Department of Housing and Urban Development, Budget and Administrative Support Division.
Over the past 10 years, field offices have composed 74 to 81 percent of FHEO’s total staff. Headquarters staff began declining in 1996 and reached its lowest level of 115 in 1999. Dur-ing the same period, field staff levels fluctuated (see table 6.6). For example, between 1997 and 1998 field FTEs decreased 4.4 percent; however, between 1998 and 1999 FTEs increased 4.8 percent. Since 2000 the number of field FTEs has increased 28 percent and the number of headquarters FTEs has grown 22 percent. In 2003, field FTEs accounted for 79 percent of all FHEO FTEs.
42

Table 6.6—HUD/FHEO Staffing History
Fiscal year Field FTE Headquarters FTE 1994 603 147 1995 555 172 1996 497 167 1997 476 167 1998 455 136 1999 477 115 2000 461 126 2001 480 128 2002 492 161 2003 590 154
Source: U.S. Department of Housing and Urban Development, Budget and Administrative Support Division.
Except in 1994, 1996, and 2003, the ratio of enforcement to compliance staff has hovered around five to one. In 1996, for every program compliance FTE there were three fair housing enforcement FTEs. Between 1994 and 2001, program compliance staff continuously declined while fair housing enforcement staff fluctuated. Between 2002 and 2003, fair housing en-forcement increased 74 percent, from 339 FTEs in 2002 to 590 in 2003. During the same pe-riod program compliance staff more than doubled, from 67 FTEs in 2002 to 154 in 2003 (see table 6.7).
Table 6.7—HUD/FHEO Field FTE Staffing History
Fiscal year
Fair housing enforcement
Program compliance
1994 406 100 1995 356 178 1996 255 177 1997 351 174 1998 356 170 1999 328 166 2000 319 161 2001 333 163 2002 339 167 2003 590 154
Source: U.S. Department of Housing and Urban Development, Budget and Administrative Support Division.
FHAP and FHIP In addition to its enforcement responsibilities, FHEO administers two funding assistance pro-grams: the Fair Housing Assistance Program (FHAP) and the Fair Housing Initiatives Pro-gram (FHIP). FHAP provides financial assistance to supplement the enforcement activities for state and local enforcement agencies that have been certified as providing rights, reme-dies, procedures, and the availability of judicial review that are substantially equivalent to that provided in the Fair Housing Act. Although organizationally part of FHEO, these pro-grams have separate funding.
43

FHAP Budget Analysis Between 1994 and 1997, congressional appropriations for FHAP continuously increased from the previous year, but not enough to keep pace with inflation. For example, between 1994 and 1997 congressional appropriations increased from $4.5 million to $15 million, or 231.9 percent (see table 6.8). After adjusting for inflation, FHAP’s budget increased 211 per-cent. FHAP’s budget leveled off between 1997 and 1998 then decreased 13.3 percent be-tween 1998 and 1999, although the President requested funding that would have resulted in an increase of 53.3 percent.
In 2003, the congressional appropriation of $25.6 million exactly matched the President’s request (see table 6.8). After adjusting for inflation, the 2003 appropriation was worth $21.5 million (see figure 6.2). For 2005, the President is requesting decreased funding for FHAP. If Congress grants the President’s 2005 request of $27.1 million, after adjusting for inflation FHAP will receive $21.9 million (see table 6.8 and figure 6.2).
Table 6.8—HUD/FHAP Funding History (in actual dollars)
Fiscal year
President’s request
Congressional appropriation
1994 $4,519,000 $4,519,000 1995 $7,400,000 $7,375,000 1996 15,000,000 13,000,000 1997 15,000,000 15,000,000 1998 15,000,000 15,000,000 1999 23,000,000 13,000,000 2000 20,000,000 20,000,000 2001 21,000,000 22,000,000 2002 22,950,000 25,600,000 2003 25,649,000 25,649,000 2004 29,750,000 27,750,000 2005 27,050,000 –
Source: U.S. Department of Housing and Urban Development, Budget and Administrative Support Division.
44

Figure 6.2—HUD/FHAP Funding History (in constant 1994 dollars)
22.821.521.919.117.811.913.914.012.47.24.5
21.924.5
21.519.6
18.317.8
21.0
13.914.014.3
7.2
4.5
0.0
5.0
10.0
15.0
20.0
25.0
1994 1995 1996 1997 1998 1999 2000 2001 2002 2003 2004 2005
Fiscal year
Mill
ions
of d
olla
rs
Congressional appropriation President's request
Source: Calculated from table 6.8.
FHIP FHIP provides funding to grantees so they can help individuals who believe they have been victims of housing discrimination. FHIP grantees assist individuals in identifying government agencies that can help, and conduct preliminary investigation of claims, including sending “testers” to properties suspected of practicing housing discrimination. FHIP also contains four programs that promote fair housing laws and equal housing opportunity awareness.
Budget Analysis At no point between 1995 and 2003 did Congress meet the President’s request. As a matter of fact, the President’s request and the congressional appropriation were erratic during this time. For example, in 1995 the President requested $23.0 million and Congress appropriated $26.0 million. In 1996, the President requested $30.0 million, but Congress reduced the amount 43 percent and provided FHIP $17.0 million. After adjusting for inflation, the $17.0 million was worth $16.2 million (see tables 6.9 and figure 6.3).
45

Table 6.9—HUD/FHIP Funding History (in actual dollars)
Fiscal year
President’s request
Congressional appropriation
1994 $16,900,000 $20,481,000 1995 $23,000,000 $26,000,000 1996 $30,000,000 $17,000,000 1997 $17,000,000 $15,000,000 1998 $24,000,000 $15,000,000 1999 $29,000,000 $22,000,000 2000 $27,000,000 $24,000,000 2001 $29,000,000 $24,000,000 2002 $22,949,000 $20,300,000 2003 $22,050,000 $20,050,000 2004 $20,250,000 $20,250,000 2005 $20,650,000
Source: U.S. Department of Housing and Urban Development, Budget and Administrative Support Division.
For 2004, the congressional appropriation of $20.3 million matched the President’s request. For 2005, the President is requesting $20.7 million for FHIP. Although this is slightly more than the 2004 presidential request, after adjusting for inflation FHIP’s budget will be worth $16.7 million (see table 6.9 and figure 6.3).
Figure 6.3—HUD/FHIP Funding History (in constant 1994 dollars)
20.5 25.4 16.2 14.0 13.921.5 21.4 20.9 17.4 16.8 16.7
16.9
22.5
28.6
15.9
22.2
26.524.0
25.2
19.6
18.516.7 16.7
0.0
5.0
10.0
15.0
20.0
25.0
30.0
1994 1995 1996 1997 1998 1999 2000 2001 2002 2003 2004 2005
Fiscal year
Mill
ions
of d
olla
rs
Congressional appropriation President's request
Source: Calculated from table 6.9.
46

Strategic and Output Measures To evaluate its civil rights program’s effectiveness and efficiency, FHEO identified four goals: (1) to effectively address the challenge of homelessness; (2) to embrace high standards of ethics and management accountability; (3) to ensure equal opportunity and access to hous-ing; and (4) to support community and economic development efforts.11 To fulfill these goals, FHEO identified nine measurable outputs for 2003:
Complete at least 1,000 fair housing conciliation/settlement agreements.
Fund at least two new fair housing groups through collaborative efforts between fair housing and community or faith-based organizations.
Increase the number of enforcement agencies rated as substantially equivalent to 98.
Increase the number of processed fair housing conciliation/settlement agreements by 25 percent.
Using the 2002 level of HUD inventory, decrease by 10 percentage points the per-centage of fair housing complaints more than 100 days old.
Using the 2002 level of inventory of substantially equivalent agencies, decrease by 10 percentage points the percentage of fair housing complaints more than 100 days old.
Conduct 50 Title VI compliance reviews of HUD recipients.
Conduct 90 Section 504 disability compliance reviews of HUD recipients.
Conduct monitoring and compliance reviews or provide technical assistance under Section 3 to 30 housing authorities.12
In addition, FHEO measures the number of complaints resolved, the number of compliance complaints resolved, and the number of compliance reviews conducted to evaluate its pro-gram’s effectiveness. FHEO also measures program effectiveness by increasing the number of accessible housing units to persons with disabilities and decreasing the average age of dis-ability cases. FHEO met all its goals for 2003.13
FHEO identified 11 measurable outputs for 2004:
To increase by 5 percent the number of Title VI and/or Section 109 compliance re-views conducted of HUD recipients.
Under Section 3, conduct monitoring and compliance reviews or provide technical assistance to 35 housing authorities.
By the end of the fiscal year no more than 25 percent of Section 3 complaints will be aged.
11 U.S. Department of Housing and Urban Development, Office of Fair Housing and Equal Opportunity’s Re-sponse to the U.S. Commission on Civil Rights’ Interrogatory for Funding, Feb. 10, 2004, p. 1. 12 Ibid. 13 Ibid., p. 2.
47

Ensure FHIP and FHAP grantees are 100 percent in compliance.
Using the 2003 level of HUD inventory, decrease by 2 percentage points the percent-age of fair housing complaints more than 100 days old.
Using the 2003 level of substantially equivalent agencies, decrease by 2 percentage points the percentage of fair housing complaints more than 100 days old.
Increase the number of enforcement agencies rated as substantially equivalent to 99.
Provide FHAP grantees increased access to sale and rental housing by completing at least 2,150 fair housing conciliation/settlement agreements.
Under the Fair Housing Act, provide protected classes with increased access to sale and rental housing by completing 1,200 fair housing conciliation/settlement agree-ments.
Provide FHIP funding for at least two new fair housing groups through collaborative efforts between fair housing and community or faith-based organizations.14
Promoting the fair housing rights of persons with disabilities is a departmental priority. Be-cause it is an important initiative within FHIP, one of FHEO’s measurable outputs for 2004 is to conduct 100 Section 504 disability compliance reviews of HUD recipients. This is 10 more reviews than FHIP conducted in 2003.15
14 Ibid., pp. 2–3. 15 Ibid., p. 3.
48

Conclusion This report updates and presents the President’s requests and congressional appropriations of six principal civil rights agencies since 1994. It also presents each agency’s civil rights goals and output factors. Funding is an important indicator of government commitment to civil rights. The President may make known his civil rights priorities in how much he requests for enforcement. However, Congress ultimately determines whether or not to grant an agency the amount of funding the President requests. Funding, or the lack of it, affects how agencies carry out their civil rights responsibilities. After adjusting for inflation, most agencies re-ceived increased funding between 2003 and 2004. If Congress meets the President’s request for 2005, after adjusting for inflation OFCCP, EEOC, HHS, and HUD’s FHIP will receive increased funding. The Fair Housing Assistance Program within HUD will receive the largest reduction, 10.6 percent.
Often, salaries absorb the bulk of agency budgets. Inadequate funding results in stagnant or decreasing staffing levels, restricts the types and amounts of compliance activities an agency can perform, and hinders an agency from sufficiently exercising its enforcement authority. Without adequate measures, agencies cannot assess progress toward established goals or en-sure efficient resource utilization.
GPRA was designed as a tool to reform the government’s resource utilization. However, agencies show great variation in how they apply GPRA to civil rights enforcement. While all of the agencies establish GPRA goals, they vary widely in the number and specificity of civil rights references. For example, although agencies express goals to process a certain number of complaints, they nonetheless maintain perennial unresolved inventories. Agencies need to determine if they are using GPRA measures that isolate the source of recurrent and persistent aged cases and backlogs. Once agencies identify the sources of any gaps between targeted and actual performance, they will know better where to apply resources to resolving such problems. Furthermore, some of the agencies express process goals while others’ are mis-sion-oriented.
49